Article

Design and Experimental Analysis of Micropolarization Array Based on a Long-Wave Infrared Optical System

1
National and Local Joint Engineering Research Center of Space Optoelectronics Technology, Changchun University of Science and Technology, Changchun 130022, China
2
College of Opto-Electronic Engineering, Changchun University of Science and Technology, Changchun 130022, China
3
Electronic Information Engineering, Changchun University of Science and Technology, Changchun 130022, China
*
Author to whom correspondence should be addressed.
Appl. Sci. 2022, 12(19), 9802; https://doi.org/10.3390/app12199802
Submission received: 1 September 2022 / Revised: 25 September 2022 / Accepted: 27 September 2022 / Published: 29 September 2022

Abstract

:
Aiming at the shortcomings of the traditional infrared polarization imaging device, such as large volume, complex structure, difficult registration, and inability to recognize moving targets, this paper proposes an infrared polarization imaging method based on a micropolarizer. The long refractive wave infrared polarization optical system is designed to achieve the imaging detection of a 0.25 m target at 1 km; for this, a design of a micropolarizer array suitable for the long-wave infrared band is proposed. In the simulation analysis, the effects of the grating substrate and line grating material, grating period, duty cycle, and grating slot depth on the polarization performance of grating are discussed, respectively. Through infrared polarization imaging experiments on typical targets, the unique advantages of infrared polarization technology in distinguishing metal and non-metal, natural and artificial objects, and high-temperature object recognition are verified, which provides practical support for physical evidence searches and camouflage target recognition.

1. Introduction

Traditional infrared imaging technology only obtains information on the infrared radiation intensity of targets. However, the polarization characteristics of infrared radiation are one of the important characteristics of the interaction between electromagnetic radiation and matter and can show different infrared polarization characteristics for different targets’ reflected radiation or their radiation, which can improve the image contrast and determine the working state and material of the target. In 2006, Polarissensor, Inc. experimented with evaluating the effectiveness of maritime search and rescue using IR polarization imaging. The results showed that compared with IR intensity imaging, IR polarization imaging could significantly improve the contrast between people, floating objects, and the sea surface background [1]. In 2011, AFRL conducted long-wave IR polarization imaging experiments on small, remotely piloted model aircraft in different backgrounds. The results showed that long-wave IR polarization imaging in cluttered backgrounds could improve the signal-to-noise ratio, enhance detection performance, and reduce the false alarm rate [2]. In 2007, Wang Zhen et al. of Anhui Institute of Optical Precision Machinery, Chinese Academy of Sciences, conducted polarization imaging experiments on metal target plates in the ground using a thermal infrared polarization imager [3]. In 2010, Chen Weili and others from the Beijing University of Technology built a medium-wave infrared polarization imaging experimental platform and conducted polarization imaging, image fusion, and reconstruction experiments on typical scenes and targets [4]. In 2016, Wang Xia and others from the Beijing University of Technology carried out polarization imaging research on typical targets such as aircraft in the sky, ships in the sea, and vehicles on the grassland using the independently developed long-wave infrared polarization imaging system [5]. In 2018, Wang Qi of Changchun Institute of optics, precision machinery, and physics, Chinese Academy of Sciences, designed a sub-aperture infrared polarization optical system with a focal length of 200 mm [6]. In 2021, the polarization performance simulation model of the medium-wave infrared integrated polarization HgCdTe detector was established, and the influence of different grating parameters on the polarization performance of the detector was simulated and analyzed [7].
However, the imaging devices employed in the above studies have disadvantages such as large size, complex structure, difficult alignment, and inability to identify moving targets. This paper proposes a micropolarizer-based infrared polarization imaging method for typical targets. We also designed a long-wave infrared polarization optical system to meet the imaging requirements, realized the all-time detection and imaging of typical natural backgrounds and targets, and designed a micropolarizer array suitable for the long-wave infrared band. Through the target infrared polarization imaging experiment, the unique advantages of infrared polarization technology in distinguishing metal from non-metal, natural objects from artificial objects, and high-temperature objects are verified.

2. Basic Principle of Polarization Imaging

Polarization is a common natural phenomenon, and unlike traditional infrared imaging based on radiance representation, polarization imaging systems use the Stokes vector S = [ I , Q , U , V ] T to represent polarized light [8], where I is the total intensity of the light wave; Q is the intensity difference between linearly polarized light in parallel and perpendicular directions; U is the intensity difference of linearly polarized light in the direction + π 4 and π 4 ; and V is the difference between the right-hand circular polarization component and the left-hand circular polarization component. In general, most of the polarization phenomena in nature are linearly polarized, and the V component is negligible. The first three Stokes parameters can be derived using the different polarization directions of 0°, 60°, and 120°:
{ I = 2 3 ( I ( 0 ) + I ( 60 ) + I ( 120 ) ) Q = 2 3 ( 2 I ( 0 ) I ( 60 ) I ( 120 ) ) U = 2 3 ( I ( 60 ) I ( 120 ) )
The degree of polarization can be represented by the Stokes vector as:
P = Q 2 + U 2 I 2
That is, it is the ratio of polarized light intensity to total light intensity. The polarization angle is denoted as:
A = 1 2 arctan ( U Q )
Reflection and radiation play an important role in polarization. This phenomenon can be described by Fresnel’s formula [9,10]:
R P = | E P r | 2 | E P i | 2 = | n 2 cos θ 1 n 1 cos θ 2 n 2 cos θ 1 + n 1 cos θ 2 | 2
R S = | E S r | 2 | E S i | 2 = | n 1 cos θ 1 n 2 cos θ 2 n 1 cos θ 1 + n 2 cos θ 2 | 2
Rp and Rs represent the reflectance of parallel and vertical components, respectively. E P i and E s i are the electric field intensity of incident light in a parallel direction and vertical direction, respectively. Furthermore, E P r are E s r the electric field intensity of the reflected light in parallel and vertical directions, respectively. n1 is the refractive index of the incident medium, and n2 is the refractive index of the transmitted medium. In addition, θ1 is the angle of incidence, and θ2 is the angle of refraction. The degree of reflection polarization is defined as:
P R = | R P R S R P + R S |
According to the law of conservation of energy and Kirchhoff’s law, when the transmittance is negligible, the sum of the reflectance R and the emission rate ε equals 1 [11,12]:
{ ε S = 1 R S ε P = 1 R P
ε p and ε s are represented as the parallel and vertical emission rates, respectively. The polarization degree PE generated by the emission is defined as:
P E = | ε P ε S ε P + ε S | = | R P R S 2 R P R S |

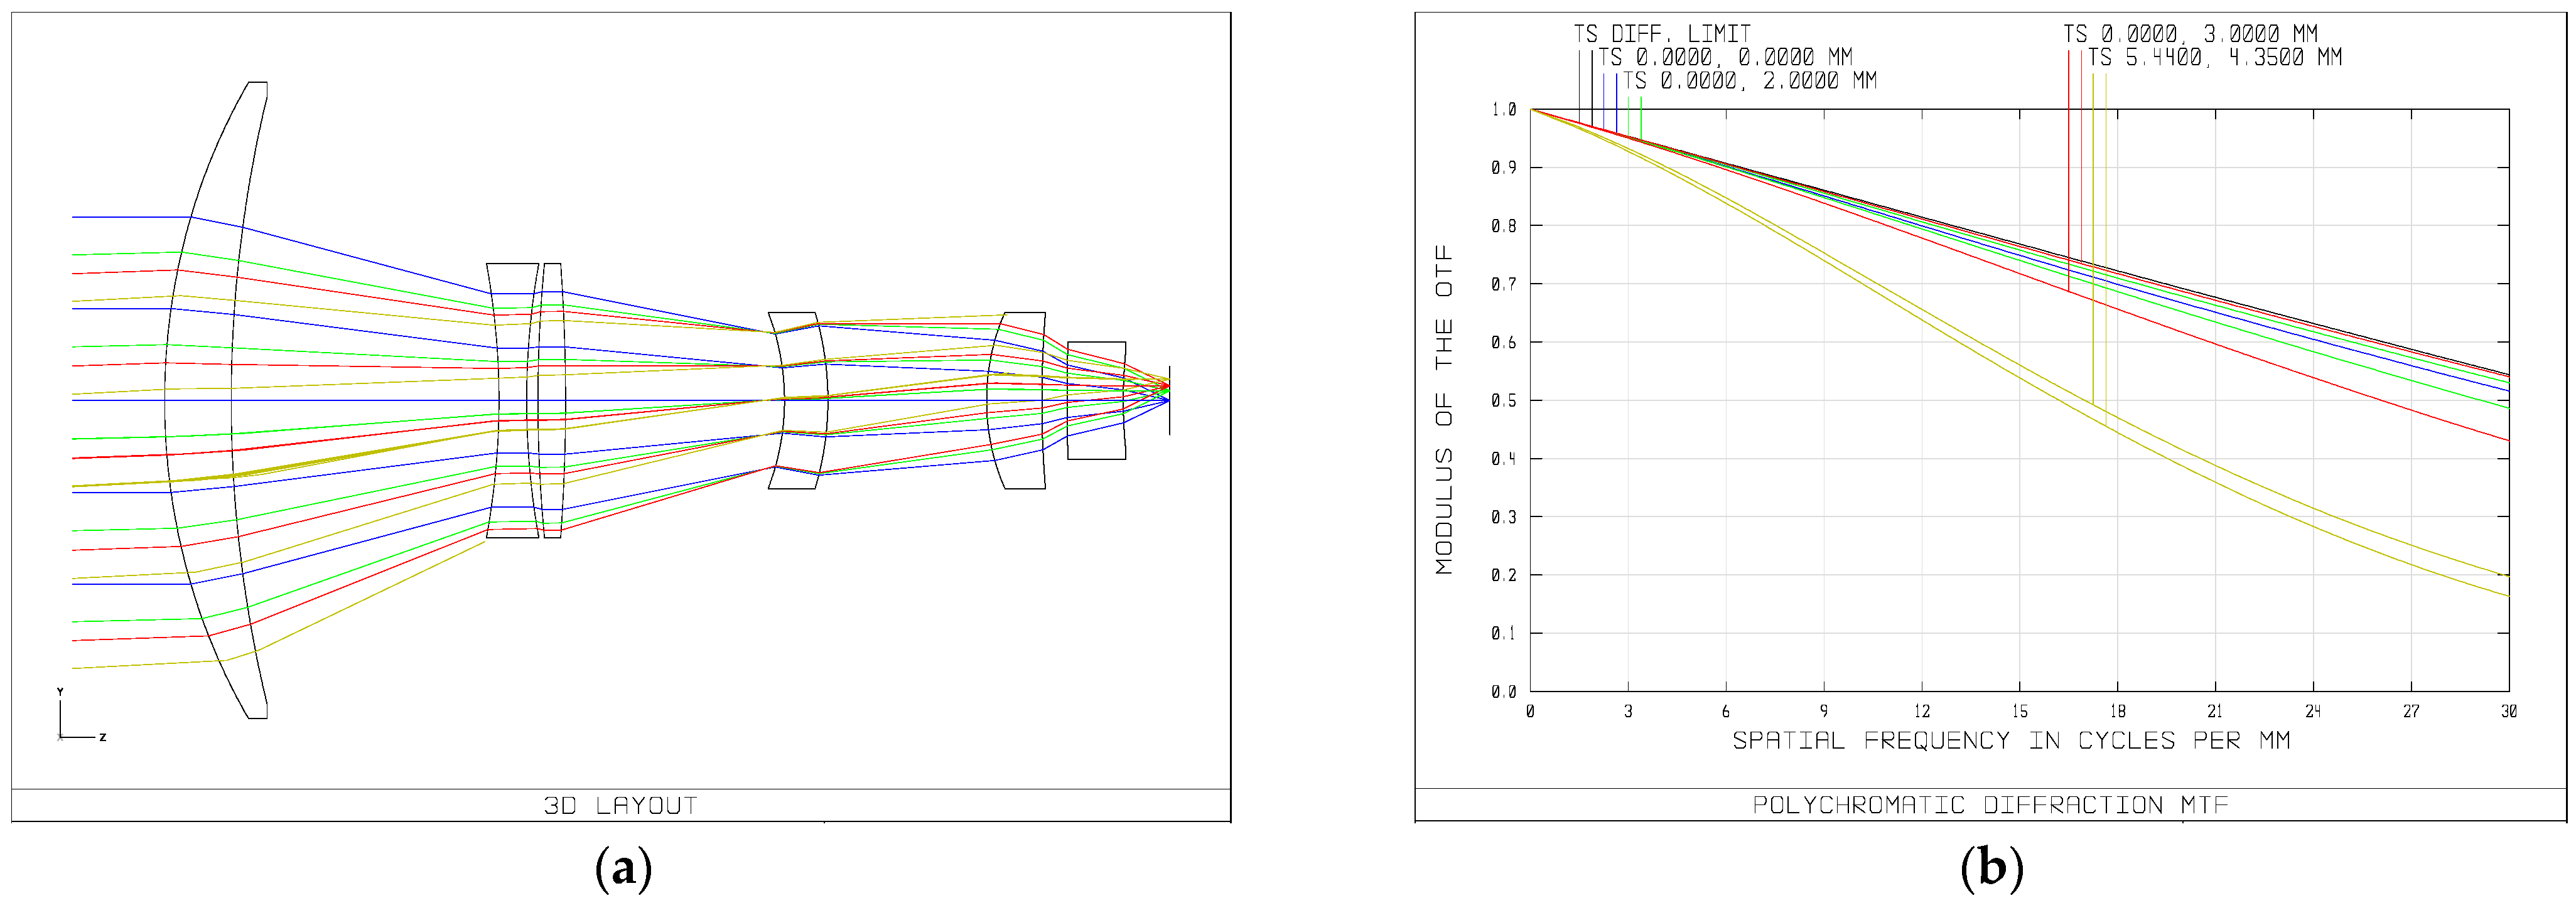
3. Long-Wave Infrared Optical System Design

In order to meet the requirements of real-time dynamic imaging recognition of natural objects and artifacts, metal and non-metal targets in physical evidence searches, and battlefield camouflage target recognition, this paper designed a long-wave infrared imaging optical system based on micropolarization, and the imaging resolution was determined as 0.25m @ 1 km.
The uncooled long-wave infrared focal plane detector from China Yantai Airray Optoelectronics Co., Ltd. (Yantai, China) was selected. The specific parameters are shown in Table 1.
Aiming at the imaging requirement of 0.25 m target size at 1 km of infrared imaging, according to Johnson criteria, the target should occupy at least 2 × 2 pixels on the target surface of the detector, then:
2 d f = Δ L
Object size is Δ = 0.25   m , the imaging distance is L = 1 km, and the detector image size is d = 12   μ m . Substituting it into Formula (9), the system’s focal length f = 96 mm.
To ensure good imaging quality, the F-number is set to 1.2. According to Formula (10), the aperture of the optical system is 80 mm.
D = f F
x is the diagonal length of the target surface of the detector, and f is the system’s focal length. According to Formula (11), the field angle of the optical system is 9.17°.
θ = 2 arctan ( x / 2 f )
The optical system indicators obtained by calculation are shown in Table 2.
The optical transmission structure is adopted according to the imaging requirements. The two-dimensional structure of the optical system is shown in Figure 1a. As shown in Figure 1b, the MTF (Modular Transfer Function) curve of the system indicates that even at 30 line pairs (corresponding to a pixel size of 12 μm), the image quality of each zoom position is close. The MTF value of each position is more significant than 0.1, and the central field of view is about 0.5–0.6, which proves that the system has excellent image quality and an image with high resolution.

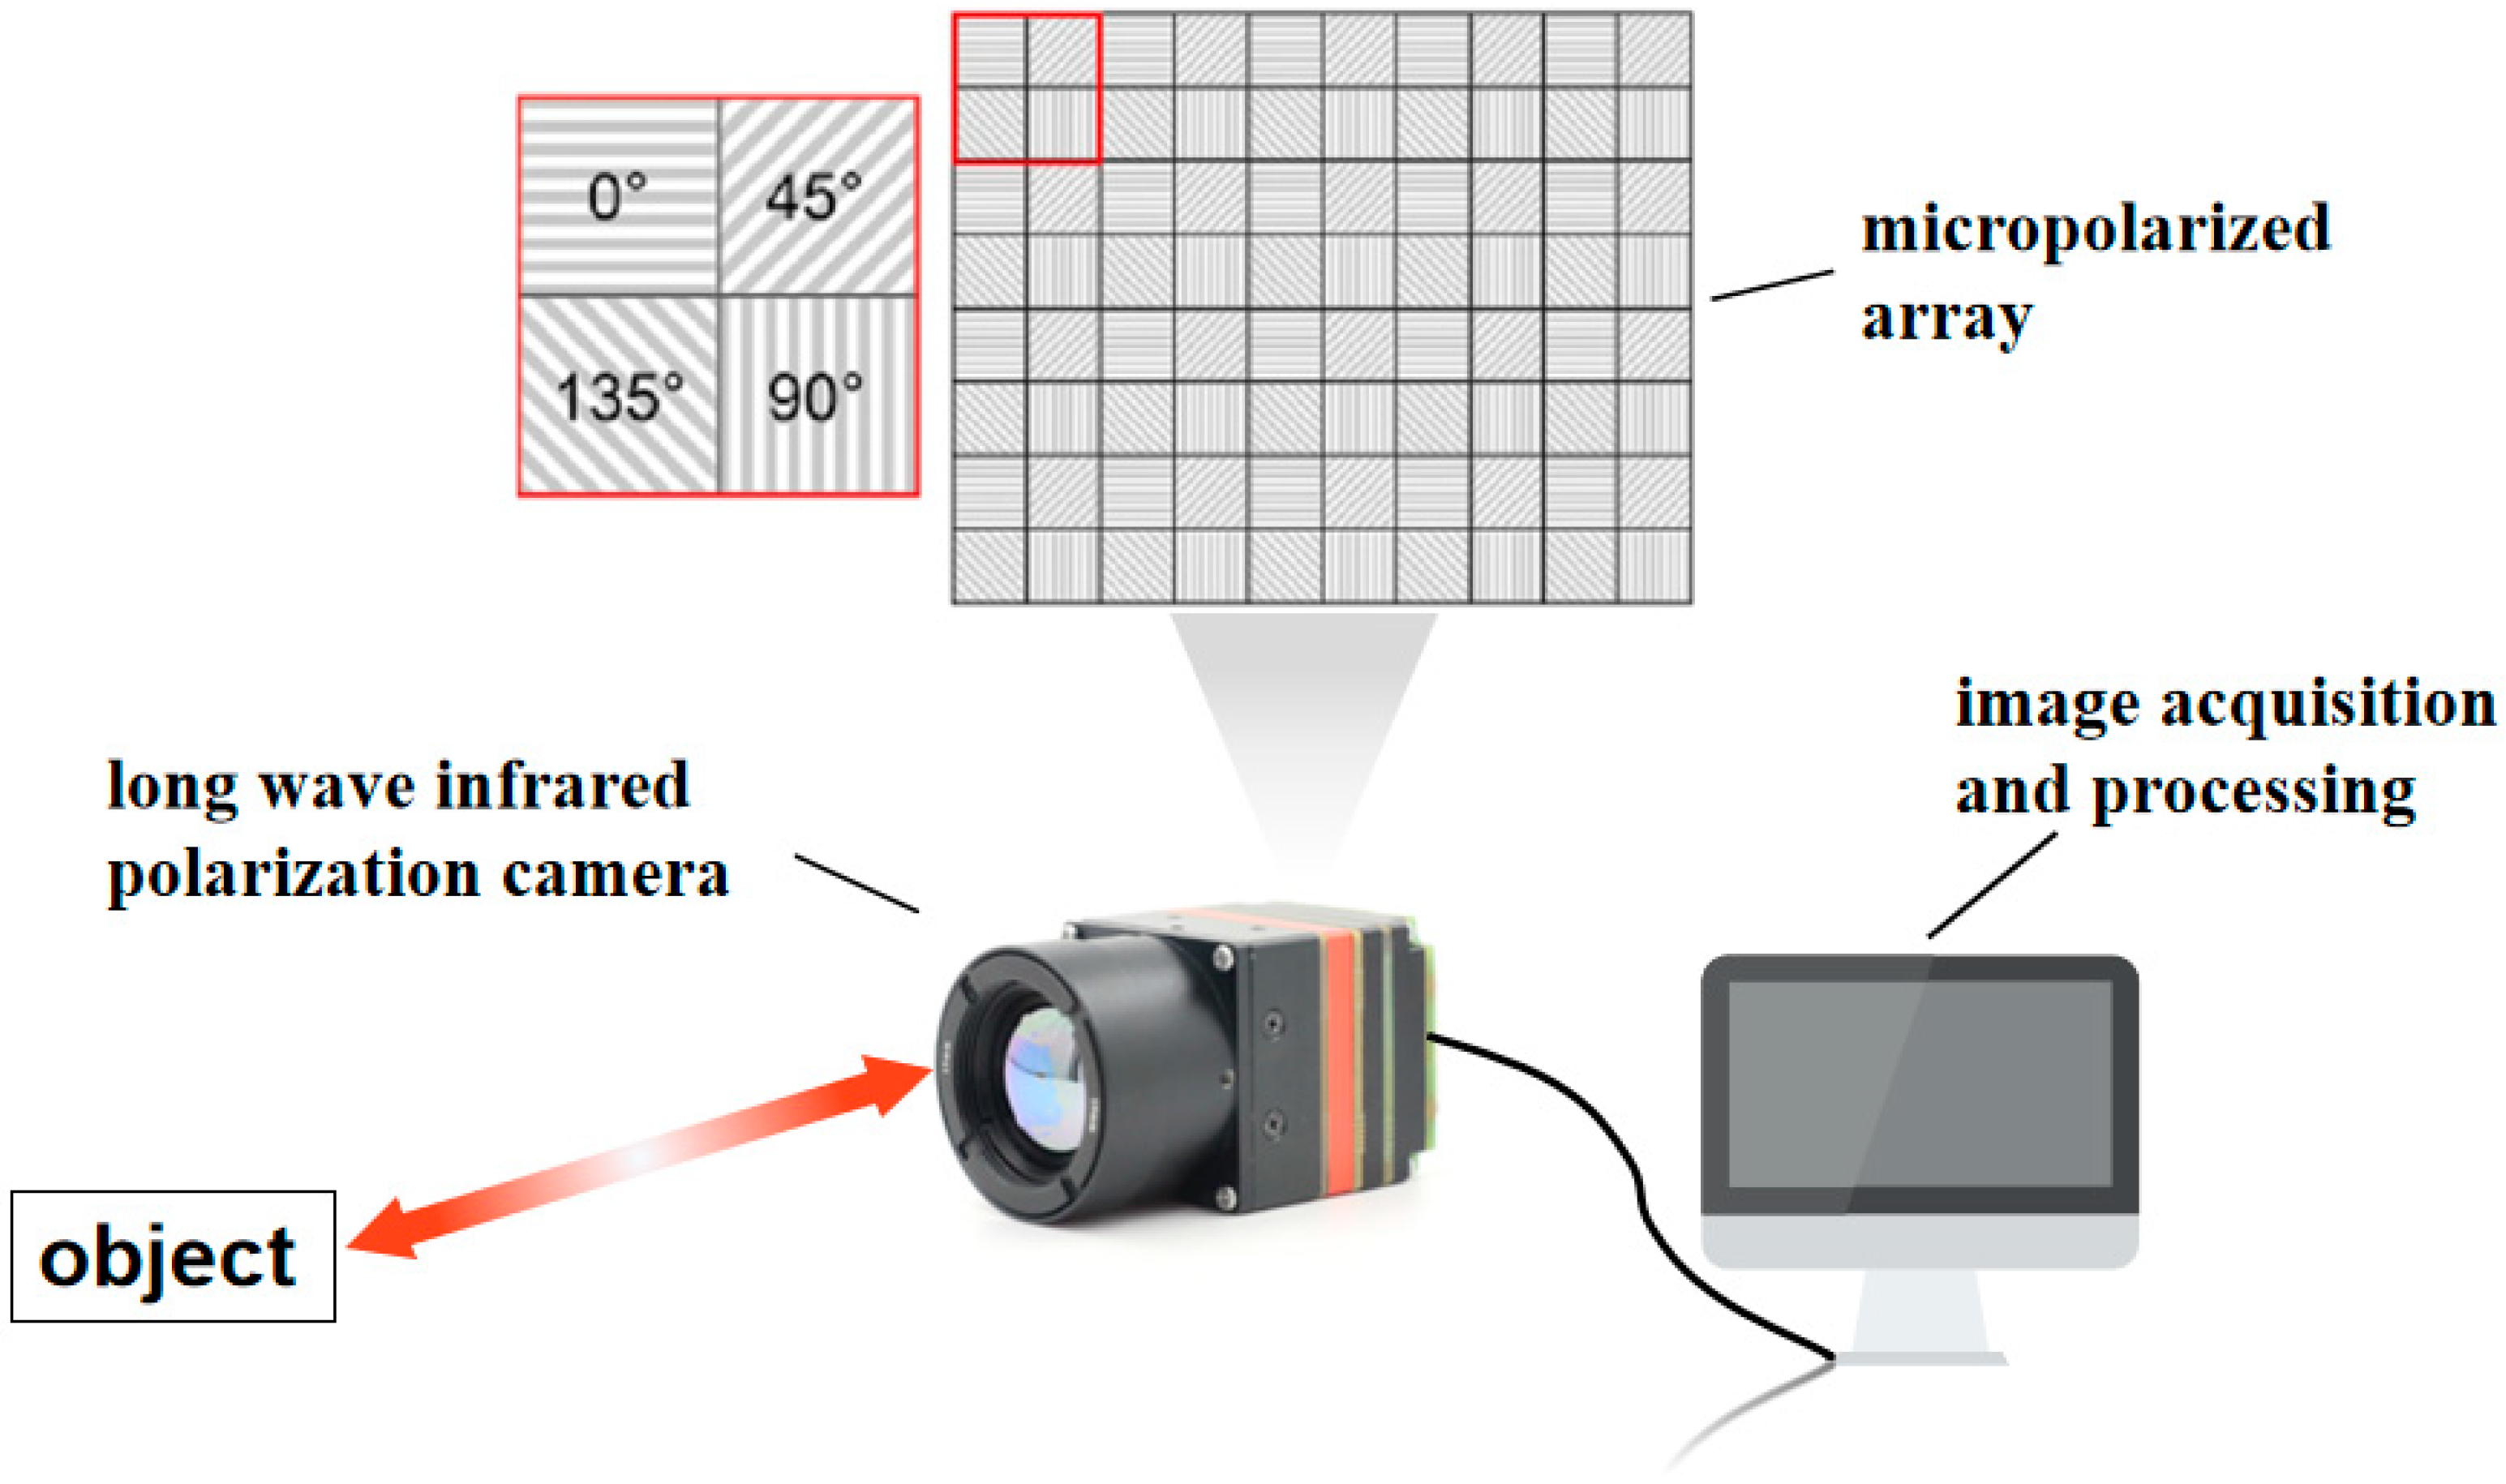
4. Micropolarizer Array Design

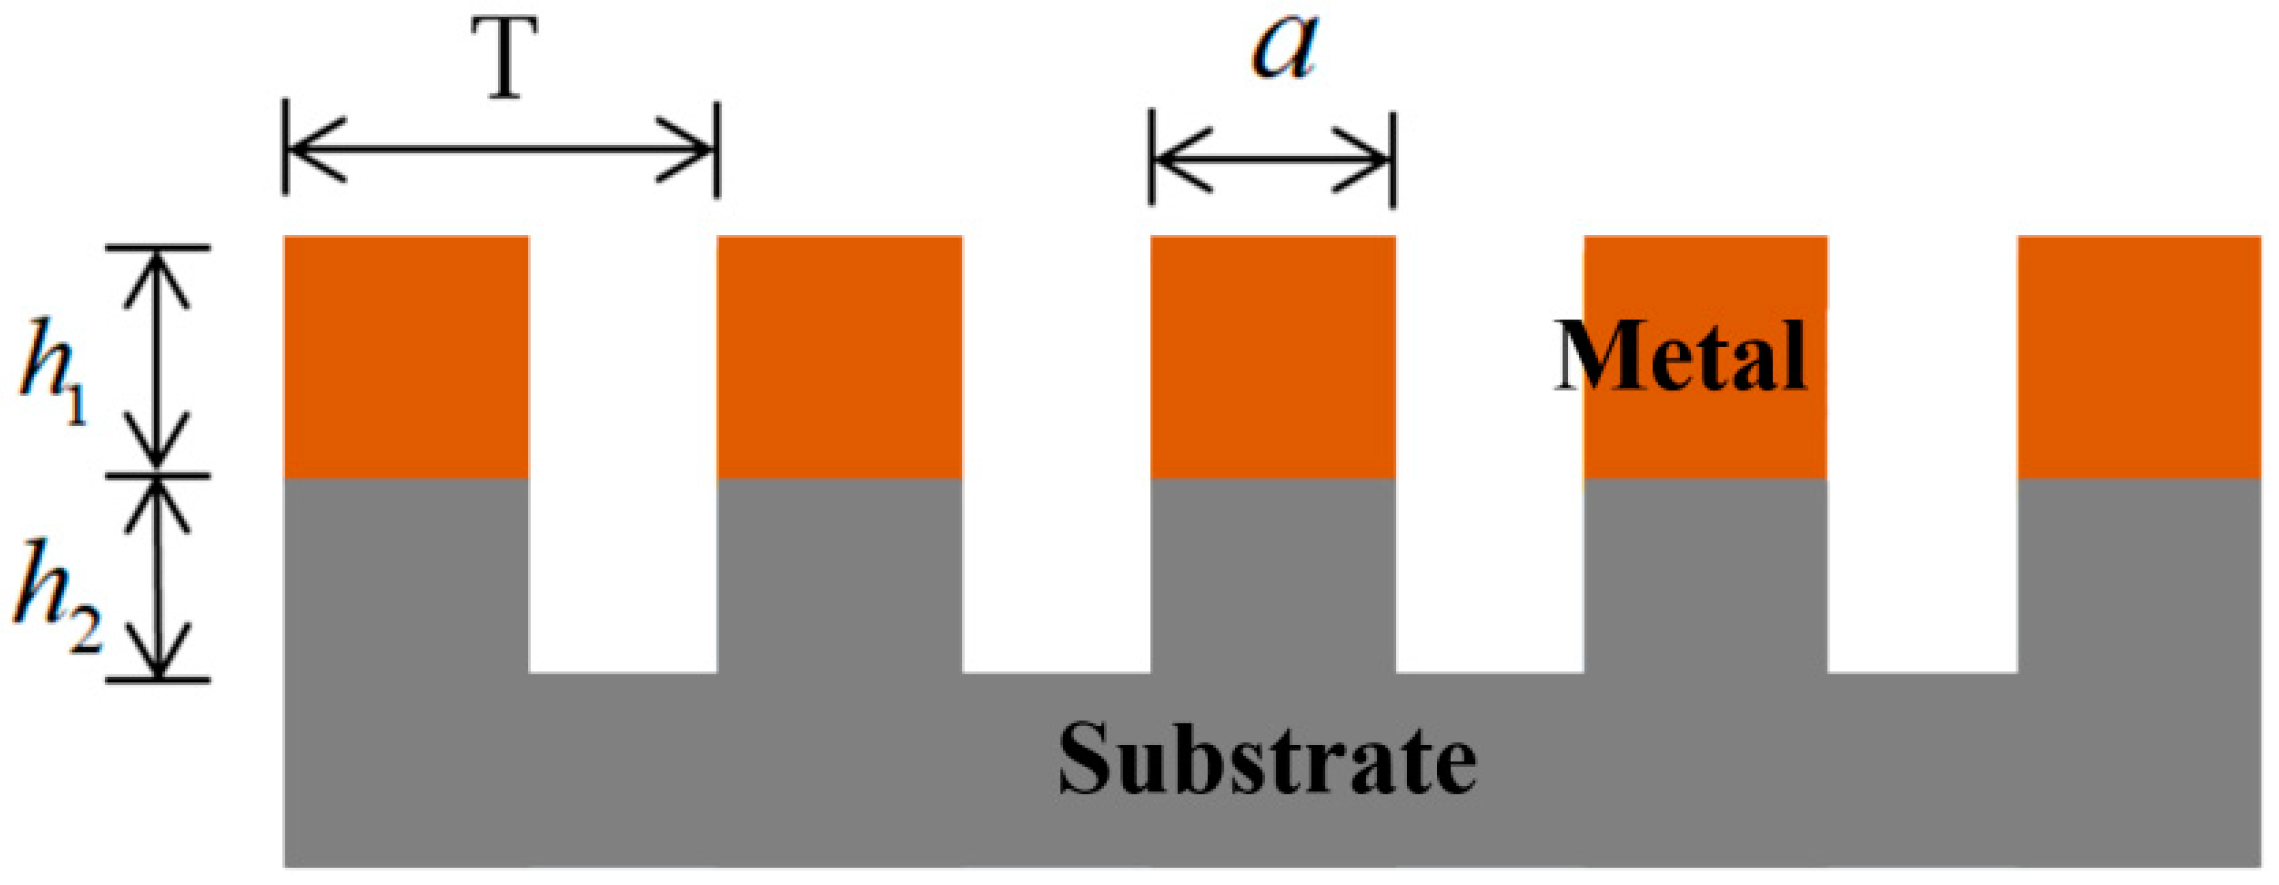
4.1. Grating Model Establishment

The micropolarizer array is composed of several polarizers with different polarization directions. The fabrication method based on metal micro/nano grating is selected to design the micropolarizer array, and the design parameters that will affect the performance of the micropolarizer array are considered [13,14].
Figure 2 is a schematic diagram of the principle of rectangular subwavelength metal grating. The light wave incident on the grating can be decomposed into transverse magnetic wave (TM wave) and transverse electric wave (TE wave), which are perpendicular to each other. TM wave is the component whose vibration direction is perpendicular to the grating direction. The TE wave is the component whose vibration direction is parallel to the grating direction. The main transmittance is the transmittance of the TM wave.
The simulation software Lumechanical FDTD is used for simulation, and the wavelength range of incident light is 8~12 μm. Figure 3 shows the simulation structure of a periodic polarization grating. When the incident light is the normal incidence, the boundary conditions are set as periodic boundary conditions.
According to the equivalent medium theory [15], when the grating period is far less than the incident wavelength, the grating with periodic structure can be regarded as a layer of uniform medium. For TE and TM polarized light, the equivalent refractive index of the grating is as follows:
n T E = D C ( n 1 + i k 1 ) 2 + ( 1 D C ) ( n 1 + i k 1 ) 2
n T M = ( n 1 + i k 1 ) 2 + ( n 2 + i k 2 ) 2 D C ( n 2 + i k 2 ) 2 + ( 1 D C ) ( n 1 + i k 1 ) 2
where DC is the duty ratio of the grating (the ratio of the grating width to the period); n, k are, respectively, the refractive index and extinction coefficient of the material, and also the real part and imaginary part of the refractive index. Subscripts 1 and 2, respectively, represent the grating material and the material in the grating gap. When the grating gap material is air, k2 = 0. At the same time, in order to simplify the calculation, the metal is regarded as a perfect conductor, i.e., k1 tends to infinity. The equivalent refractive index of TE and TM polarized light is simplified as follows:
n T E = i k 1 D C
n T M = n 2 ( 1 D C ) 1 2
The refractive index of the simplified metal grating has only an imaginary part for TE polarized light, which is equivalent to a metal film. Most of the TE polarized light is reflected and absorbed, but only a small amount of light is transmitted; for TM polarized light, only the real part can be regarded as the medium layer. The grating has weak absorption for TM light, and most TM polarized light is transmitted.
The extinction ratio is expressed as:
E R = 10 × log 10 ( n T M n T E )

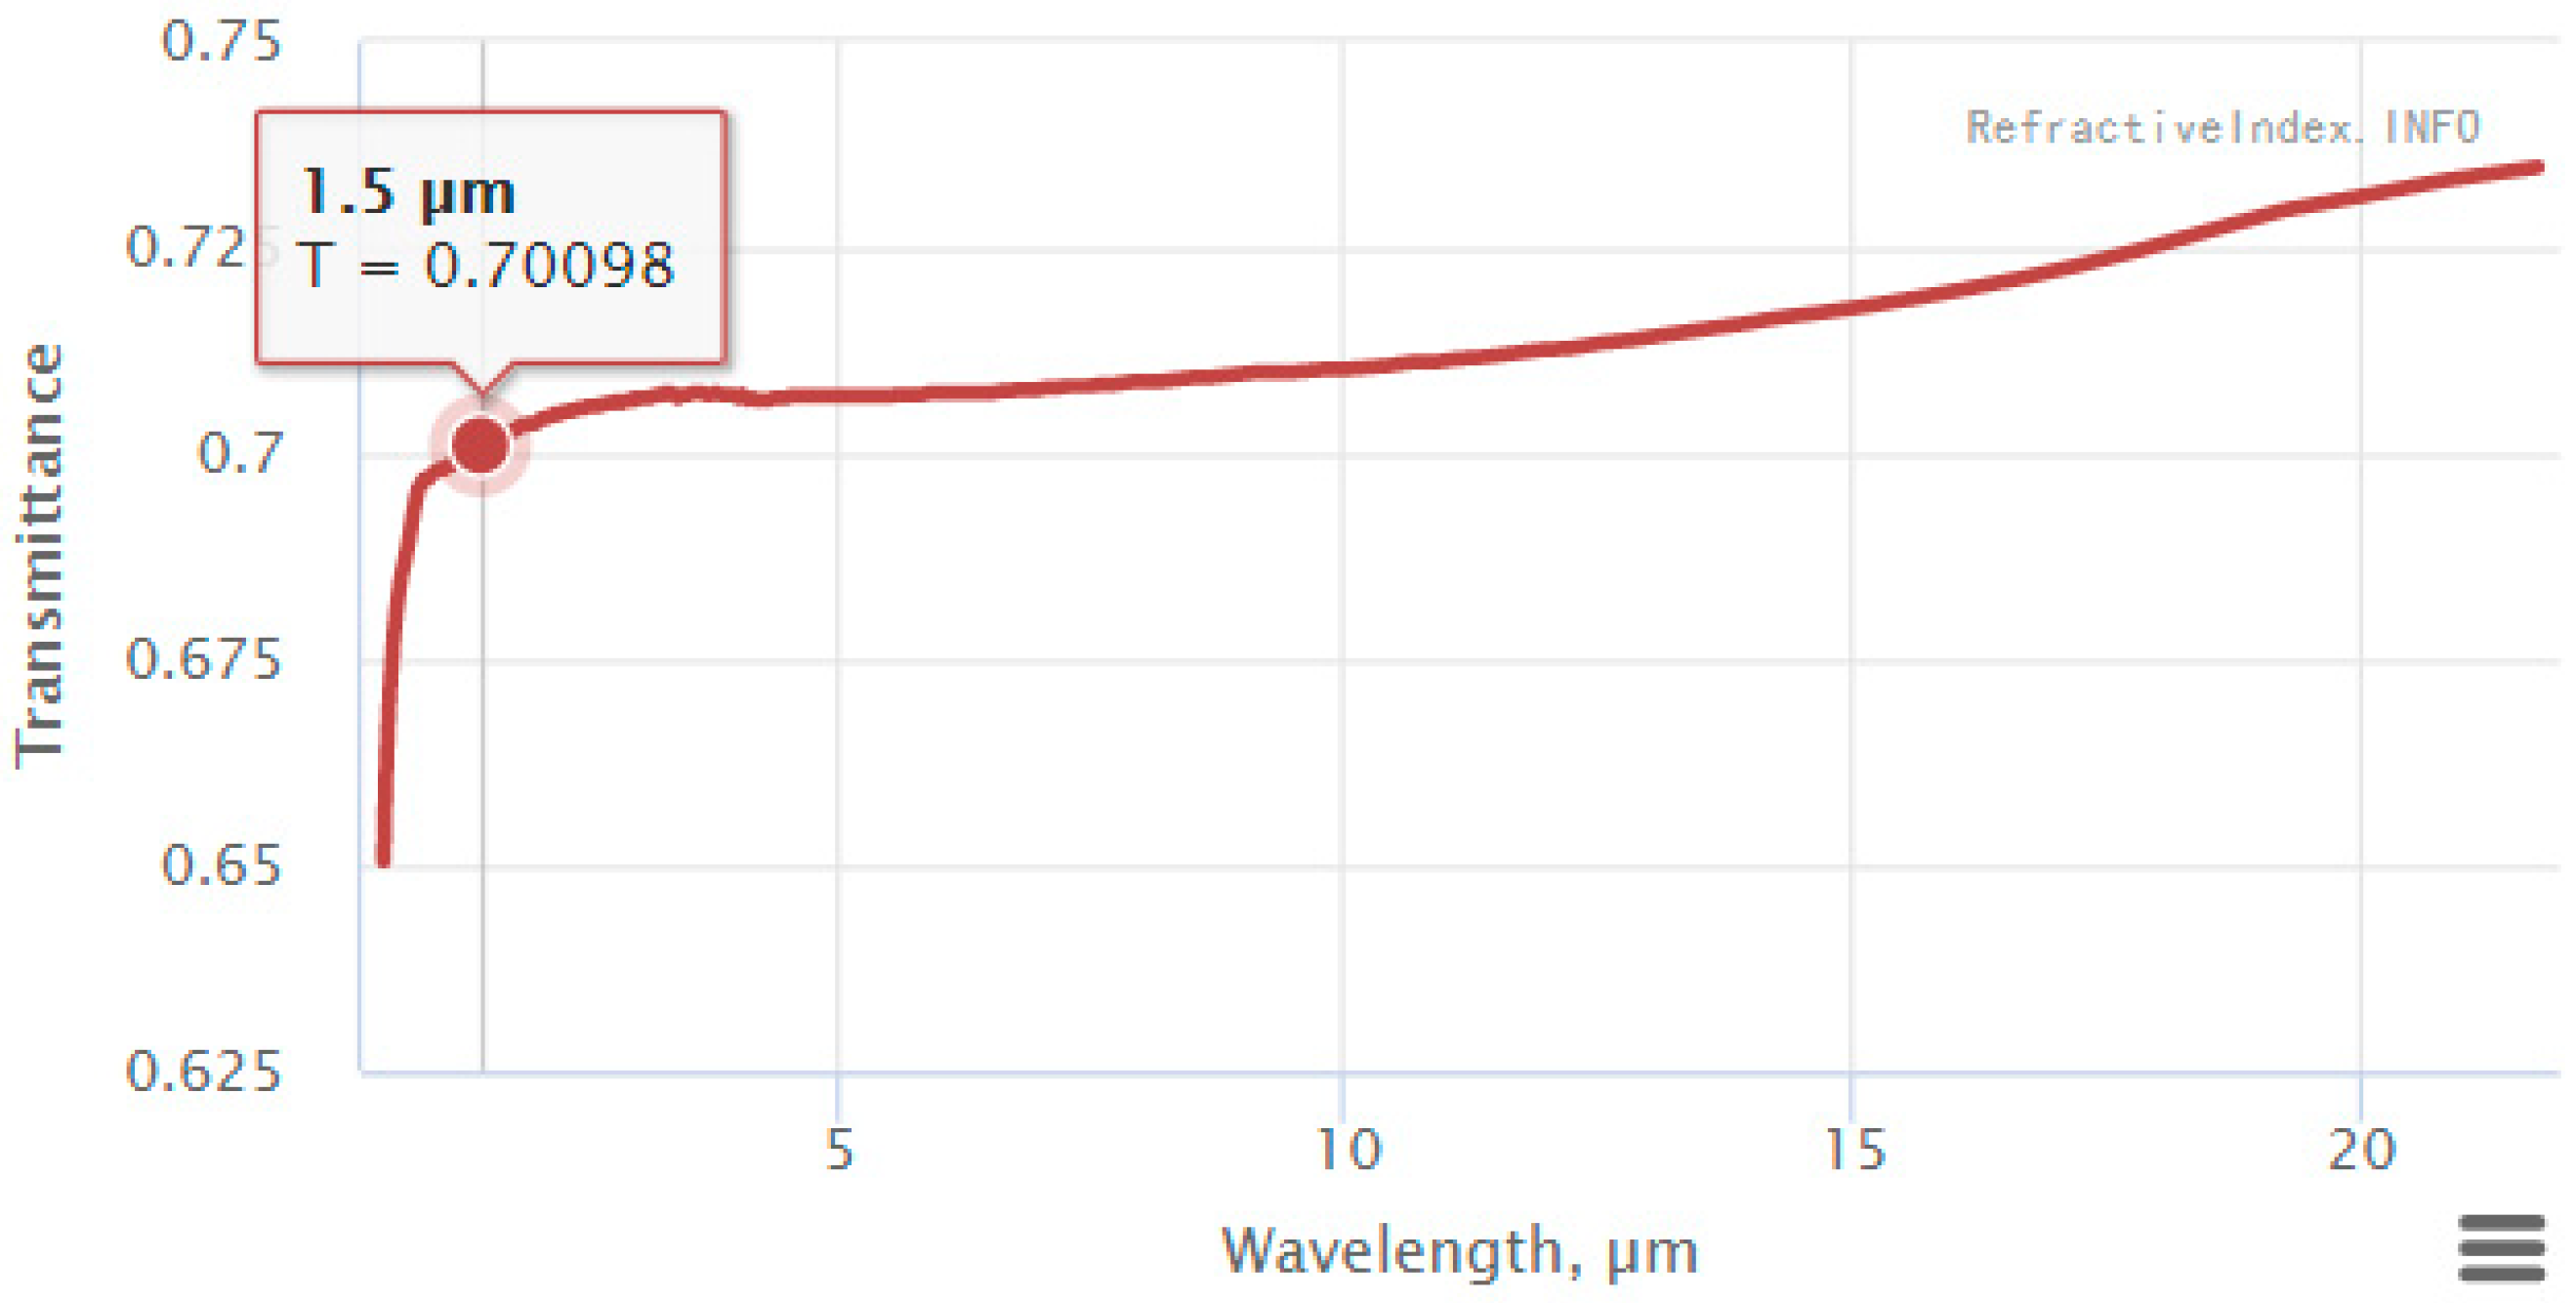
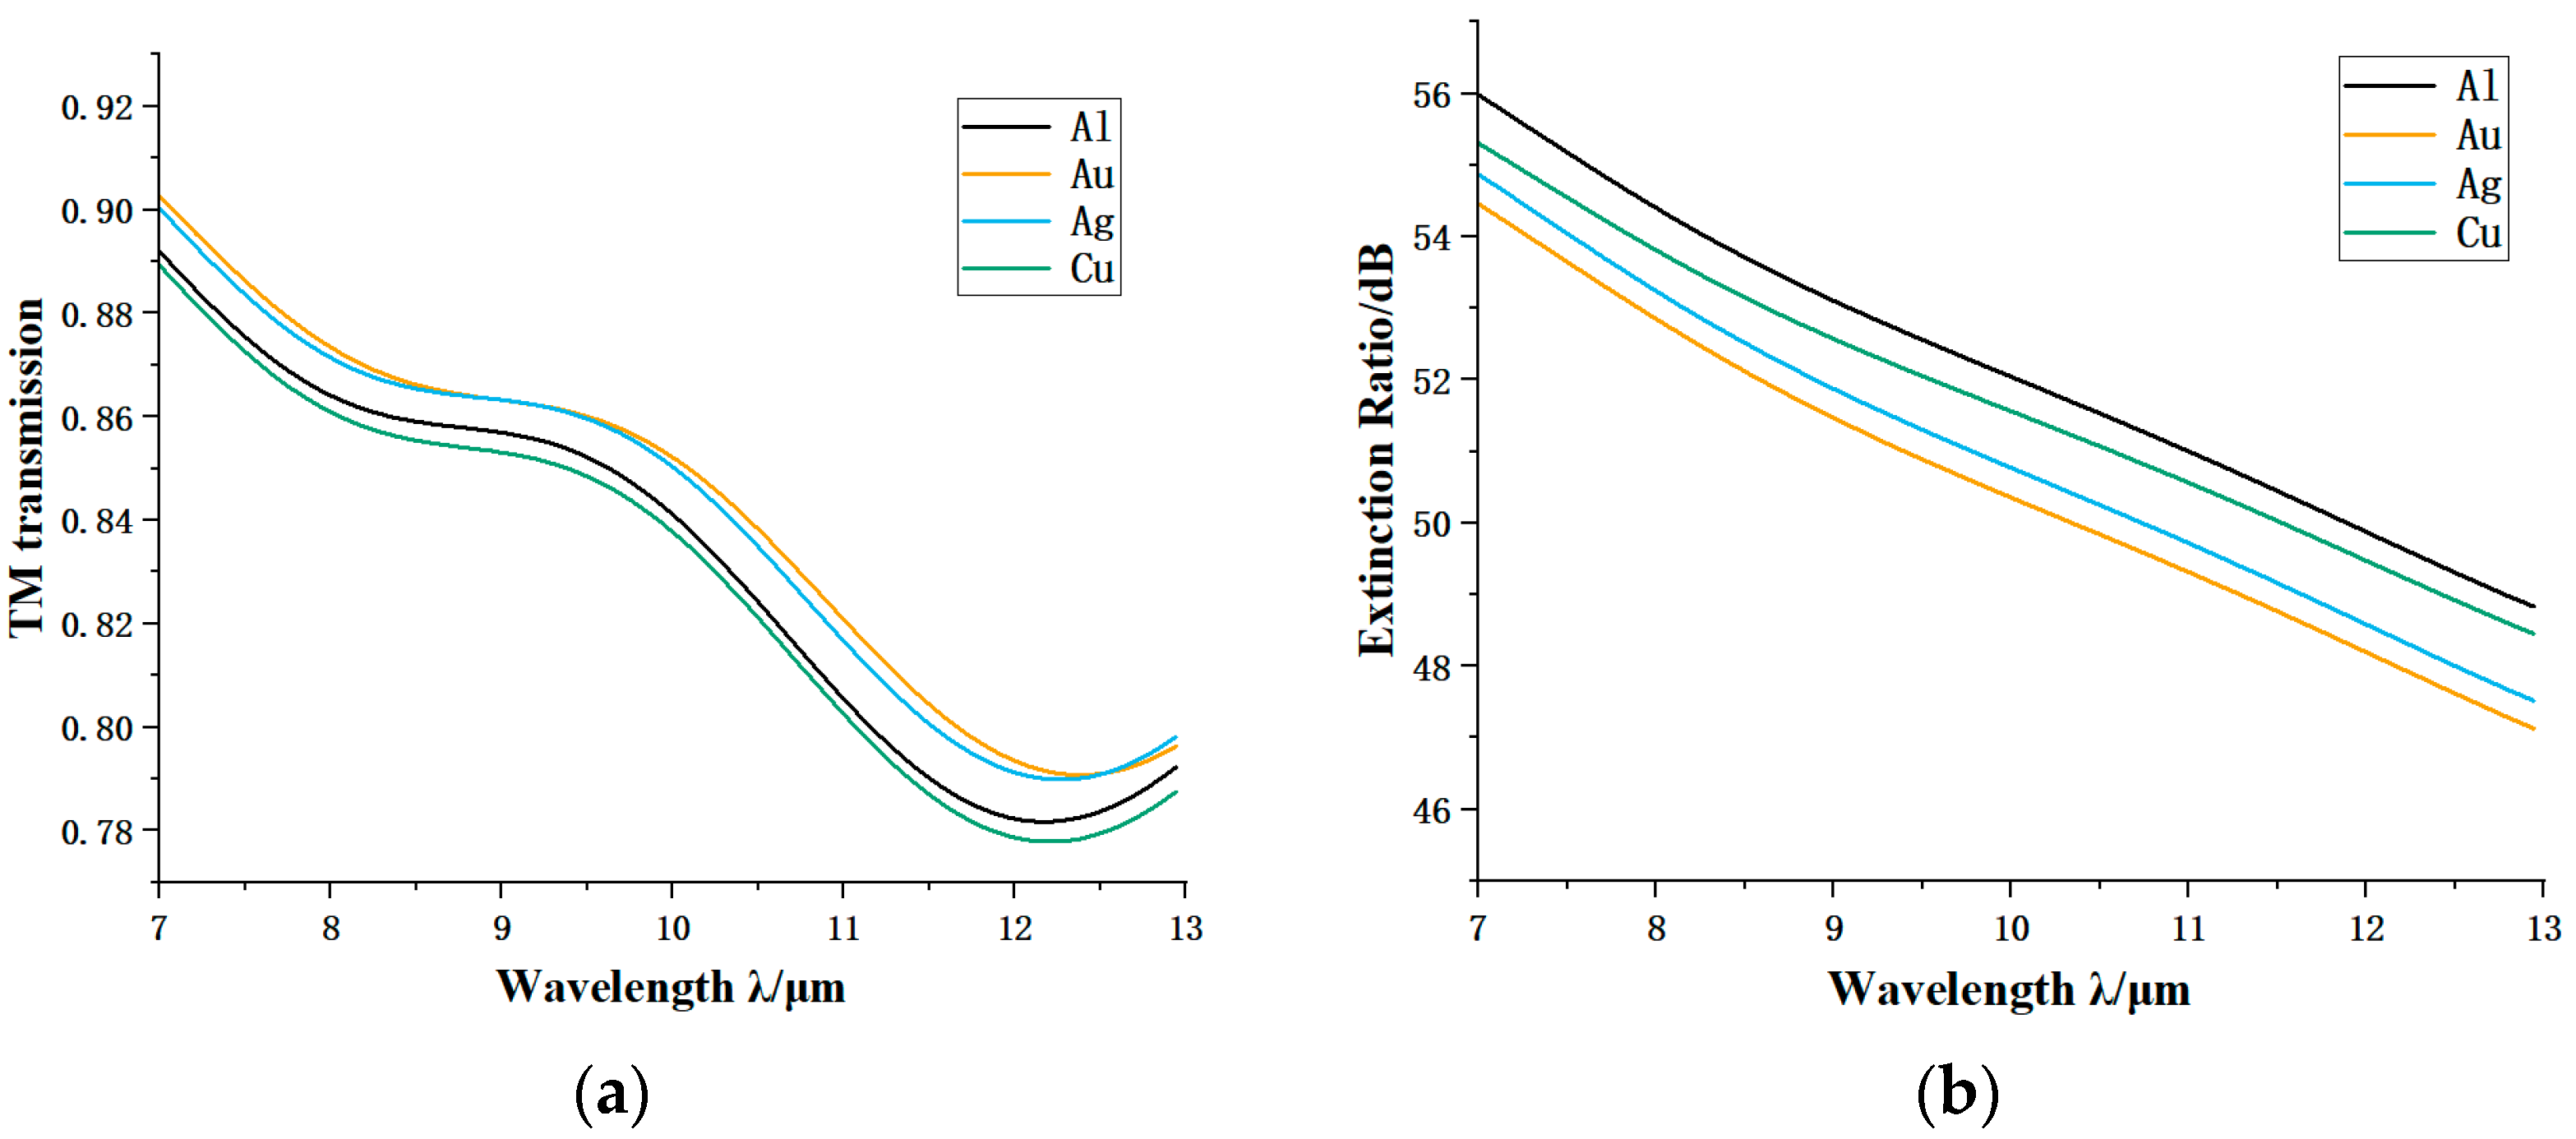
4.2. Substrate Material and Grating Material

Figure 4 shows the section diagram of the designed double-layer metal grating structure; that is, the substrate is also etched to a certain depth. In the diagram, T is the grating period, and a is the grating width, h1 and h2 are the wire grid depth and zinc selenide depth, respectively.
According to the analysis of equivalent medium theory, in the range of 8 ~ 12   μ m wave band, the TM wave transmittance and extinction ratio of the base material with a low refractive index are better than those of the base material with a high refractive index [16]. Compared with germanium, magnesium fluoride, calcium fluoride, and other infrared optical materials, zinc selenide has the advantages of high-temperature resistance, deliquescence resistance, and relatively low price. Therefore, zinc selenide is used as the base material in this paper. As shown in Figure 5, the spectral transmission line of zinc selenide with a thickness of 10 μm is shown. In the wave band above 1.5 μm, its transmissivity reaches more than 70%.
Figure 5. Transmission spectrum of zinc selenide with a thickness of 10 μm [17].
Applsci 12 09802 g005
The selection of grating wire materials will also affect the polarization performance of grating. This paper compares the effects of aluminium, gold, silver, and copper as wire grating materials on the transmittance and extinction ratio of TM waves in the incident band of 7~13 μm. According to the comparison and analysis in Figure 6, the TM wave transmittance of the four materials is close. When gold is used as the wire gate material, TM wave transmittance is slightly higher than that of the other three metals, but the extinction ratio is low. In contrast, when aluminium is used as the wire gate material, the extinction ratio is significantly higher than that of the other three materials. Therefore, in overall consideration, the selection of aluminium as the wire grid material is more appropriate.

4.3. Grating Period and Duty Cycle

When the grating period is much shorter than the wavelength of the incident light, the grating has only zero-order diffraction waves, and the grating can be used as an excellent polarizing device. If the grating has polarization performance, it means it only has zero-order diffraction. The conditions for the grating to meet zero-order diffraction are as follows [18]:
λ = Λ ( n 0 sin θ + n ) k
where λ is the incident wavelength, Λ is the grating period, n0 is the refractive index of the incident medium (air), n is the substrate’s refractive index (zinc selenide), θ is the angle of incidence, and k is the diffraction order. As there is only zero-order diffraction, when k = 1 and the wavelength are fixed, the period is the critical period. At a wavelength of 7 μm, completely polarized light is the normal incidence, the refractive index of zinc selenide is n = 2.41, and the calculated critical period wavelength for generating first-order diffraction is 2.9 μm.
In the critical period, six wavelength grating periods are selected for simulation. Figure 7 shows TM wave transmissivity and extinction ratio under different grating periods. When the grating period increases, the TM wave transmissivity and extinction ratio decrease significantly, so the grating period should be selected as small as possible. Considering the current process level, the grating period is determined as 1 μm.
The duty cycle of the grating is defined as the ratio of grating width to the grating period. The polarization performance of the grating was analyzed by normal incident light with a centre wavelength of 10 μm and a duty cycle ranging from 0.1 to 0.8. Figure 8 shows the trend of grating polarization performance with the duty cycle. It can be seen that the transmittance of TM decreases gradually with the increase of the duty cycle. When the duty cycle is more significant than 0.6, TTM (the transmittance of TM) decreases faster, while the extinction ratio increases rapidly with the addition of the duty cycle. Therefore, to ensure that the transmittance of TM wave and extinction ratio of the grating reach a high level, the duty cycle is set as f = 0.5.

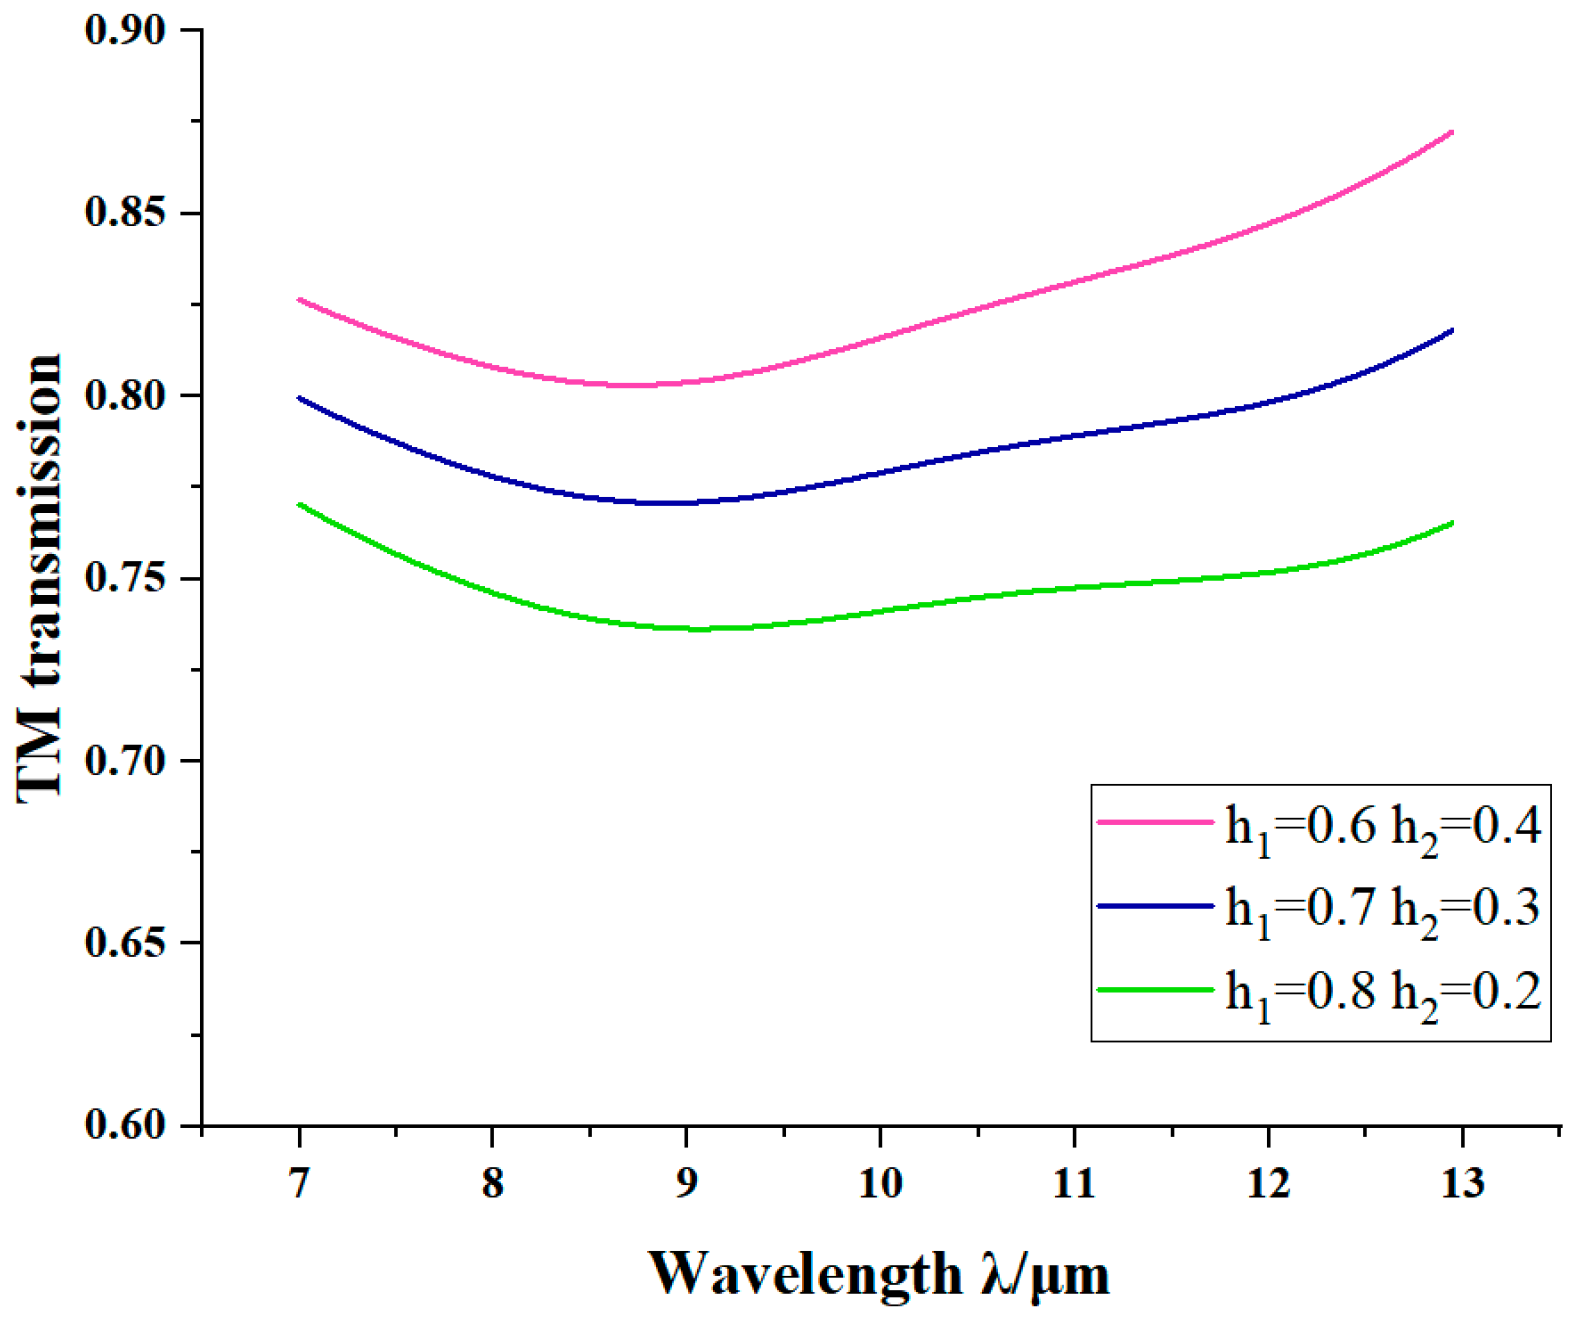
4.4. Grid Groove Depth

The groove depth is also an important parameter affecting the polarization performance of grating. The groove depth ratio is the groove depth ratio to the grating line width. As it is relatively difficult to maintain the morphology integrity of micro/nano structures with a sizeable depth–width proportion, and multiple etching or imprinting may easily damage the transfer pattern, researchers at home and abroad usually control the depth–width ratio to below 2:1 in the design and preparation of online grids. Therefore, this design should control the sum of the aluminium layer depth h1 and zinc selenide layer depth h2 to within 1 μm.
As shown in Figure 9, h1 is 0.2 μm to 0.8 μm, and TTM and the extinction ratio change with h2. It can be seen that no matter how much h1 is taken, TTM increases with h2, while the extinction ratio hardly changes with h2. The change of h1 has little influence on TTM. The TTM levels at the four times are similar, but the influence on the extinction ratio is very obvious. The larger the value of h1 is, the greater the extinction ratio is. When h1 is 0.8, the extinction ratio is significantly higher than the other three times. In conclusion, in order to meet the requirements of a large extinction ratio and obtain high transmittance, the value of h1 should be between 0.6 and 0.8, and h2 should be as large as possible in line with the process level.
As shown in Figure 10, the linear chart of TM wave transmissivity under three groups of values is shown. When h1 = 0.6 and h2 = 0.4, the transmittance can reach more than 80%, and the extinction ratio can reach about 45. Finally, the values of each parameter of the designed grating are placed in Table 3.

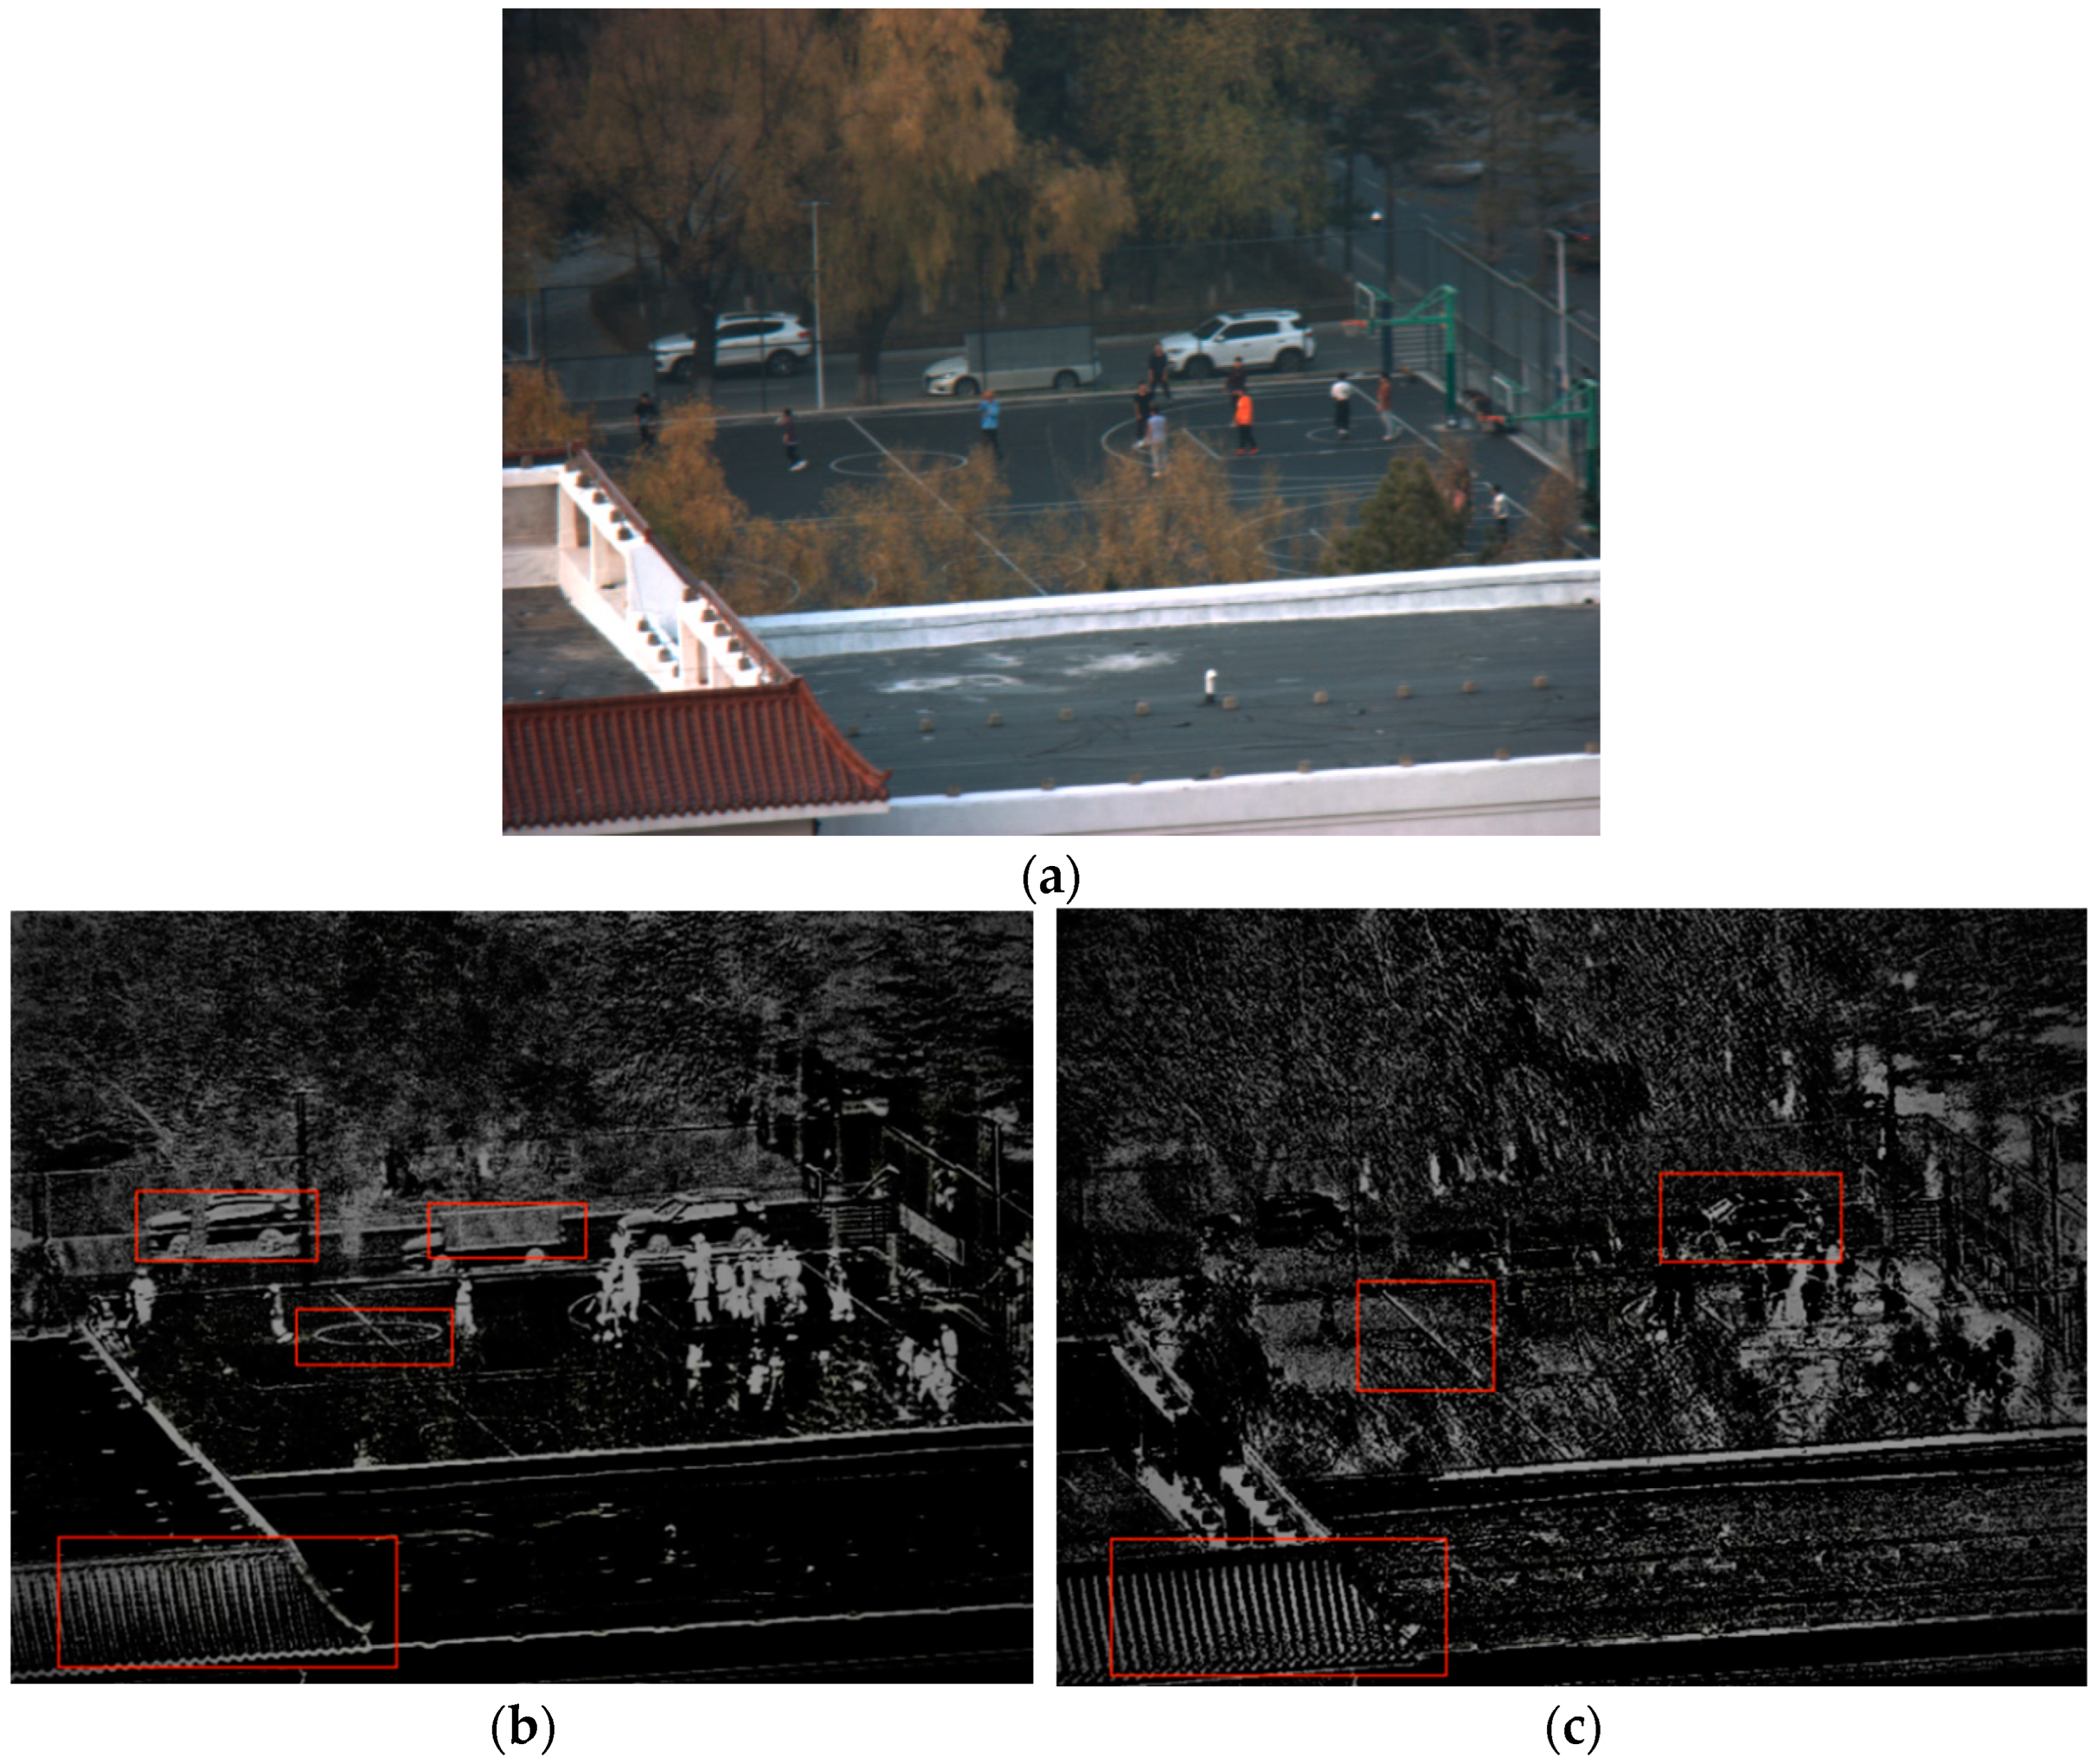
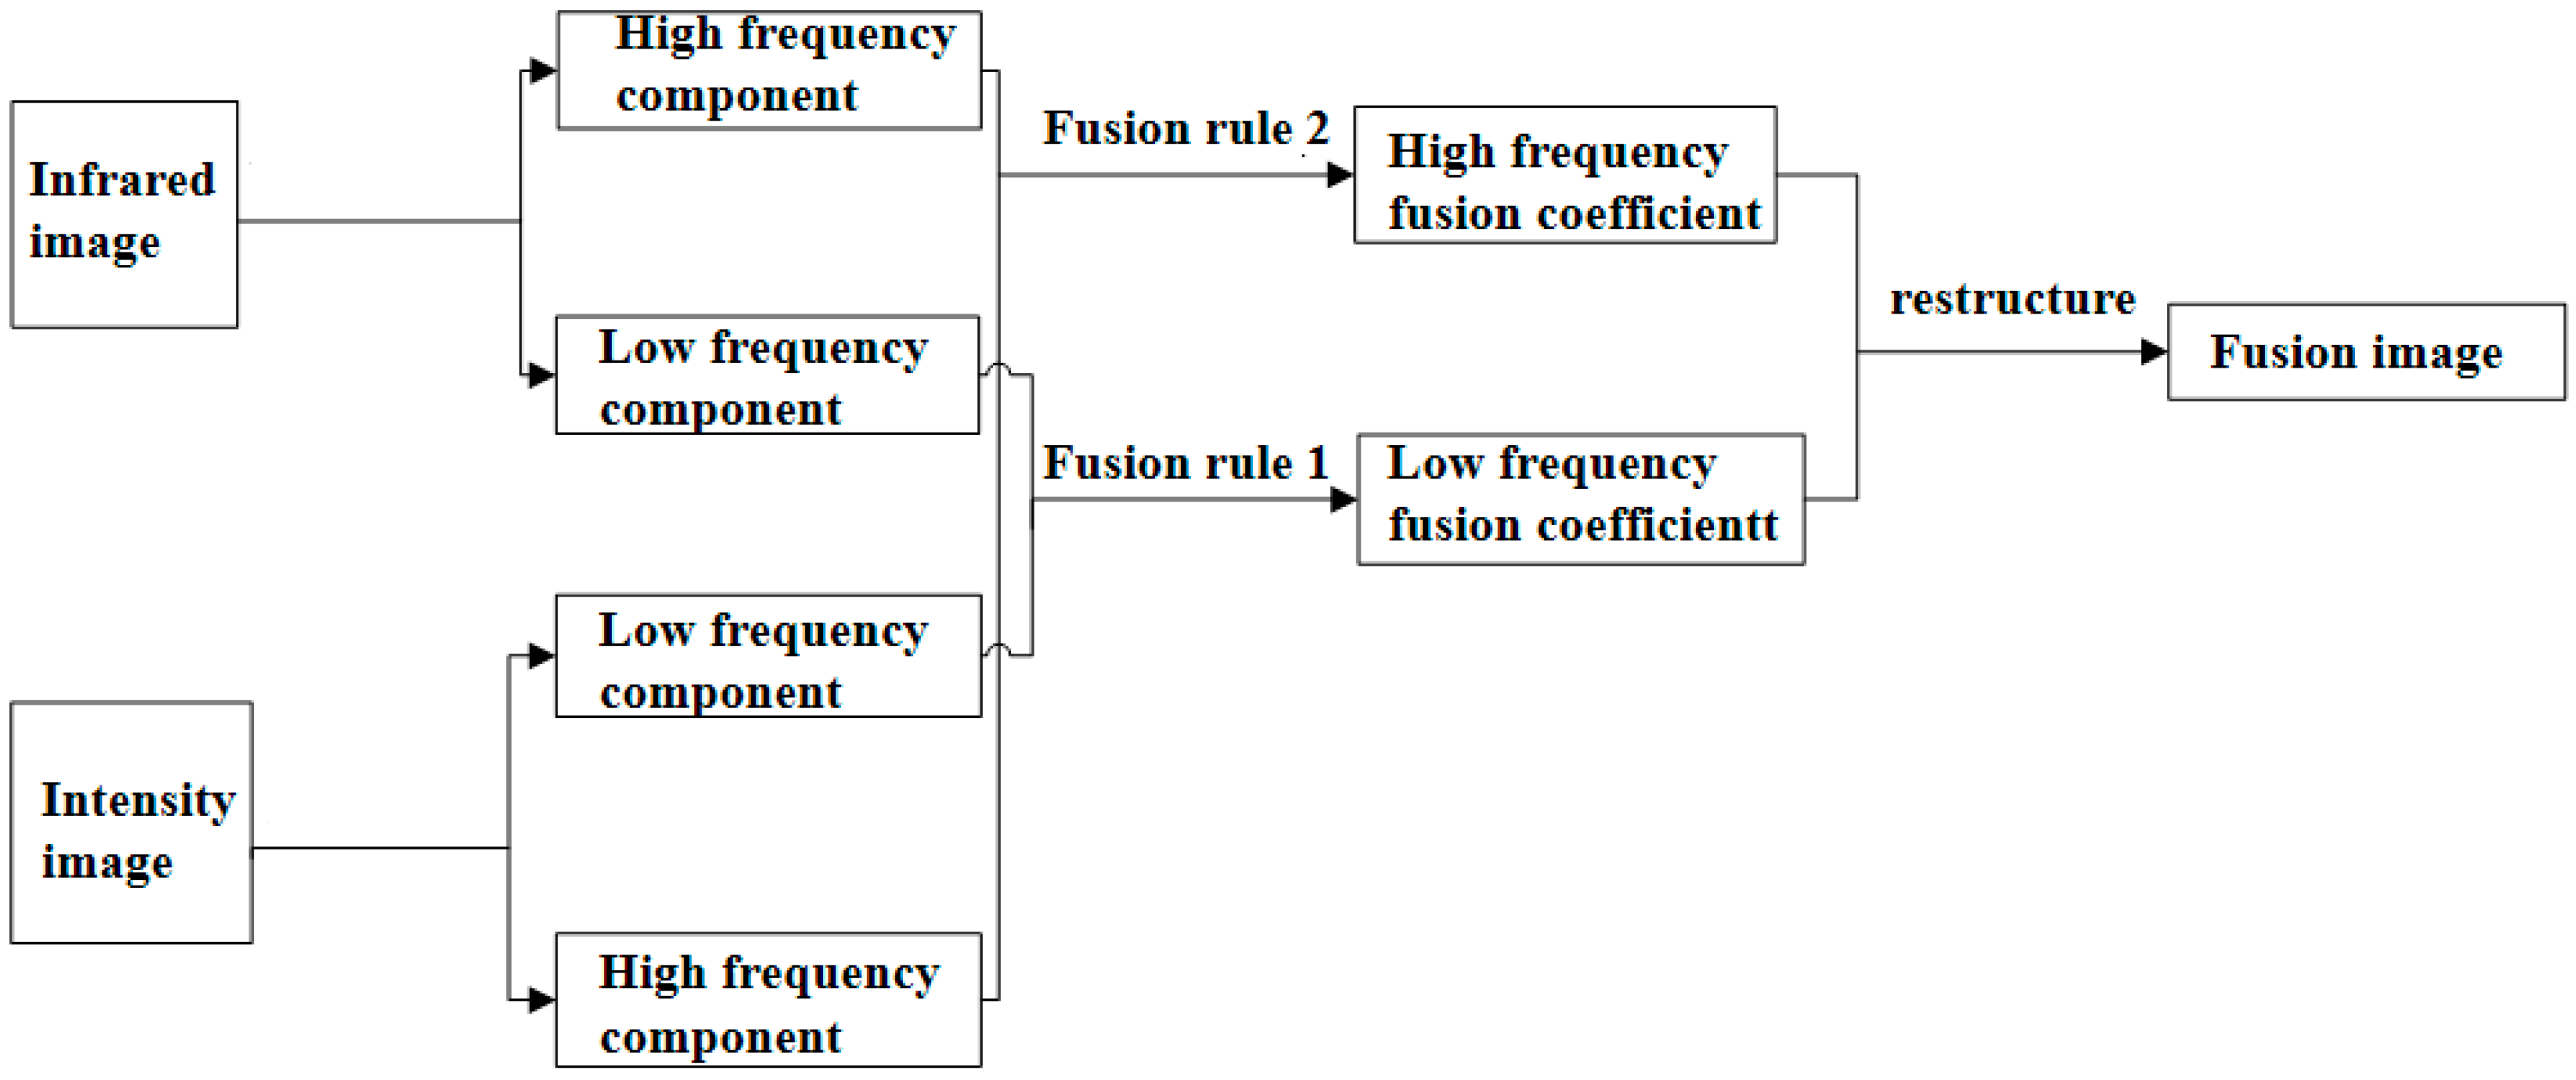
5. Target Polarization Imaging Experiment

The experiment uses the long-wave infrared polarization detector to obtain the polarization image of the target in real-time. This experiment aims to test the effectiveness of infrared polarization technology in distinguishing natural objects from artificial objects, metal, and botany and provide effective support for target identification and material evidence searches. Figure 11 is a schematic diagram of a long-wave infrared polarization imaging device.
Figure 12 is a traditional visible light image and a long-wave infrared polarization image of a scene about 500 m away. It can be seen from the polarization degree image in Figure 12b that the contrast between people in action and the background is very high due to their radiation. The sidelines of the sports field ground can also be clearly seen. The metal plates on the fence are very obvious, and the polarization effects of car windows and car bodies parked outside the fence are apparent. From the polarization angle image in Figure 12c, it can be observed that the detailed contour information of the target is highlighted. With the reduction of the imaging distance, the detailed information of the target is more abundant, especially the eaves carving lines near are clear. The experimental results show that long-wave infrared polarization imaging can detect and identify targets at the same time and improve the contrast of targets. The infrared polarization imaging technology combining polarization information and infrared radiation information can improve the operating range of the imaging system.
Based on the advantages of infrared polarization imaging detection technology, this paper uses three methods to combine long-wave infrared and visible near-infrared. The fusion image flow is shown in Figure 13. The preliminary fusion of infrared and intensity images is achieved using wavelet transform [19]. The purpose of fusion rule 1 is to complete the fusion of low-frequency information of two source images, and fusion rule 2 is to achieve the fusion of high-frequency components of two source images. Then use the colour migration algorithm to enhance the pseudo colour of the image to make the target scene more prominent [20].
Figure 14 shows the fused image. The fusion image results show that the imaging method combining visible near-infrared and long-wave infrared can not only image clearly under low illumination at night but also restore the original colour of the scene to a certain extent for easy observation and significantly improve the contrast of the target.

6. Conclusions

Given the real-time dynamic imaging and identification requirements of natural and artificial objects, metal and non-metal objects in material evidence searches, and camouflage target identification, the infrared polarization imaging method of objects based on micropolarizers is proposed. A polarization optical system for long-wave infrared imaging and a micropolarizer array for the long-wave infrared band is designed; it achieves all-weather detection and imaging of typical targets with a resolution of 0.25 m @ 1 km. The structural parameters of the metal polarization grating determined in the simulation analysis provide theoretical guidance for the preparation of the long-wave infrared integrated polarization detector, which can reduce the number of process verification and structure optimization, improve the efficiency of process verification, and reduce the research and development cost. However, the conditions of simulation analysis are ideal, and the effect of process errors should be considered in the actual preparation and testing. It can be concluded from the long-wave infrared polarization imaging experiment that long-wave infrared polarization images can weaken the background, highlight the target’s details, make the target outline more prominent, and be more easily detected and recognized in the complex background. Long-wave infrared polarization imaging can also make high-temperature targets easier to be detected and recognized in complex backgrounds. The results show that infrared polarization is significantly advantageous in material evidence searches and camouflage target recognition.

Author Contributions

Conceptualization, Q.F., Y.L. (Yi Liu) and J.Z.; Data curation, H.S. and J.Z.; Methodology, Y.L. (Yi Liu), S.Z. and Y.L. (Yingchao Li); Project administration, Q.F. and Y.L. (Yingchao Li); Resources, H.S.; Supervision, H.J.; Validation, S.Z. and H.J.; Writing – original draft, Y.Z.; Writing – review & editing, Q.F. and Y.Z. All authors have read and agreed to the published version of the manuscript.

Funding

This research was funded by Changchun University of Science and Technology, China. Huilin Jiang, National Natural Science Foundation of China, grant number: 61890960, 61890963, JJKH20220744KJ, 62127813.

Institutional Review Board Statement

Not applicable.

Informed Consent Statement

Not applicable.

Data Availability Statement

The study did not report any data.

Conflicts of Interest

The authors declare no conflict of interest.

References

  1. Arad, E.; Roit, P. Method for increased detectionrange in IR warning systems. In Electro-Optical and Infrared Systems: Technology and Applications XI, Proceedings of the SPIE SECURITY + DEFENCE, Amsterdam, The Netherlands, 22–25 September 2014; SPIE: Bellingham, WA, USA, 2014; Volume 9249, p. 924902. [Google Scholar]
  2. Duan, J.; Fu, Q.; Mo, C.; Zhu, Y.; Liu, D. Review of polarization imaging for international military application. In International Symposium on Photoelectronic Detection and Imaging 2013: Imaging Sensors and Applications, Proceedings of the ISPDI 2013—Fifth International Symposium on Photoelectronic Detection and Imaging, Beijing, China, 25–27 June 2013; SPIE: Bellingham, WA, USA, 2013; p. 890813. [Google Scholar]
  3. Wang, Z.; Qiao, Y.; Hong, J.; Zhang, G. Study on directional characteristics of thermal infrared polarization of metal plate. Optoelectron. Eng. 2007, 34, 4. [Google Scholar]
  4. Chen, W.; Wang, X.; Jin, W.; Li, F.; Cao, Y. Target detection experiment using medium wave infrared polarization imaging. Infrared Laser Eng. 2011, 40, 7–11. [Google Scholar]
  5. Wang, X.; Yao, J.; Xia, R.; Jin, W. Design of non coaxial long wave infrared polarization imaging system. Infrared Technol. 2017, 39, 6. [Google Scholar]
  6. Wang, Q.; Liang, J.; Liang, Z.; Lv, J.; Wang, W.; Qin, Y.; Wang, H. Design of optical system of split aperture infrared polarization imager. China Opt. 2018, 11, 8. [Google Scholar]
  7. Wang, W.; Yu, J.; Hu, X.; Zhao, S. Simulation and analysis of the influence of structural parameters of integrated polarization gratings on polarization performance. Infrared Laser Eng. 2021, 50, 20210132. [Google Scholar]
  8. Sun, Q.; Wang, P.; Huang, W. Application of infrared polarization imaging in camouflage target recognition. Infrared 2016, 37, 5. [Google Scholar]
  9. Aron, Y.; Gronau, Y. Polarization in the LWIR: A method to improve target aquisition. Proc. SPIE 2005, 5783, 653–661. [Google Scholar]
  10. Fougnie, B.; Frouin, R.J.; Deschamps, P.-Y.; Chami, M.; Poteau, A.; Hagolle, O. Measurements and computations of the polarized marine reflectance. Proc. SPIE 2000, 4133, 191–201. [Google Scholar]
  11. Resnick, A.; Persons, C.; Lindquist, G. Polarized emissivity and Kirchhoff’s law. Appl. Opt. 1999, 38, 1384–1387. [Google Scholar] [CrossRef] [PubMed]
  12. Gartley, M.G. Polarimetric Modeling of Remotely Sensed Scenes in the Thermal Infrared. Ph.D. Thesis, Rochester Institute of Technology, Rochester, NY, USA, 2007. [Google Scholar]
  13. Jing, X.; Jin, Y. Transmittance analysis of differaction phase grating. Appl. Opt. 2011, 50, C11–C18. [Google Scholar] [CrossRef] [PubMed]
  14. Kulkarni, M.; Gruev, V. A division-of-focal-plane spectral-polarization imaging sensor. Proc. SPIE 2012, 8364, 169–179. [Google Scholar]
  15. Jin, G.; Yan, Y.; Wu, M. Binary Optics; National Defense Industry Press: Beijing, China, 1998. [Google Scholar]
  16. Zhao, Y.; Zhang, Y.; Liu, W.; Zhang, Y.; Li, L.; Pan, Q. Research on polarization imaging technology based on micro polarizer array. Infrared Laser Eng. 2015, 44, 3117–3123. [Google Scholar]
  17. Querry, M.R. Optical Constants of Minerals and Other Materials from the Millimeter to the Ultraviolet; Missouri University of Science and Technology: Rolla, MO, USA, 1987. [Google Scholar]
  18. Zhou, C.H.; Wang, L.; Nie, Y.; Wang, Z.H. The rigorous coupled-wave analysis of guided-mode resonance in dielectric gratings. J. Phys. 2002, 51, 68–73. [Google Scholar]
  19. Gao, Y.; Wang, A.M.; Wang, F.H. Application of improved wavelet transform algorithm in image fusion. Laser Technol. 2013, 37, 690–695. [Google Scholar]
  20. Jin, S.; Zhang, T.; Wu, J.; Liu, J.; Wang, Y.; Zheng, Q. Improved algorithm of local color migration based on Reinhard algorithm. Sci. Technol. Innov. Appl. 2020, 3, 33–35. [Google Scholar]
Figure 1. Design of long-wave infrared polarization optical system. (a) Optical system structure diagram, (b) MTF curve.
Applsci 12 09802 g001
Figure 2. Schematic diagram of rectangular subwavelength metal grating principle.
Applsci 12 09802 g002
Figure 3. Raster simulation model: (a) thumbnail, (b) detailed.
Applsci 12 09802 g003
Figure 4. Section of the grating structure.
Applsci 12 09802 g004
Figure 6. Influence of four wire grid materials on polarization performance of the grating. (a) Influence on TM wave transmittance, (b) influence on extinction ratio.
Applsci 12 09802 g006
Figure 7. Effect of period on polarization performance of the grating. (a) Influence on TM wave transmittance, (b) influence on extinction ratio.
Applsci 12 09802 g007
Figure 8. Effect of duty ratio on polarization performance of grating.
Applsci 12 09802 g008
Figure 9. Influence of different groove depths on polarization performance of the grating.
Applsci 12 09802 g009
Figure 10. TM linear plot for three sets of values.
Applsci 12 09802 g010
Figure 11. Schematic of long-wave infrared polarization imaging.
Applsci 12 09802 g011
Figure 12. Distant scenery image. (a) Visible light image, (b) long-wave infrared polarization image, (c) long-wave infrared polarization angle image.
Applsci 12 09802 g012
Figure 13. Framework flow chart of the fused image.
Applsci 12 09802 g013
Figure 14. Contrast of visible light imaging and fusion effect. (a) Ordinary intensity imaging. (b) Fusion effect picture 1. (c) Fusion effect picture 2. (d) Fusion effect picture 3.
Applsci 12 09802 g014
Table 1. Specific parameters of the detector.
ParameterNumerical Value
resolution ratio1024 × 768
pixel size12 μm × 12 μm
spectral response range8~14 μm
heat sensitivity<50 mk
operating temperature range−40~85 °C
Table 2. Design index of the optical system.
Operating WavelengthCaliberFocal LengthField AngleResolution Ratio
8~12 μm80 mm96 mm9.17°0.25 m @ 1 km
Table 3. Design index of the grating.
Substrate MaterialZnSe
Grid materialAl
Grating period (Λ/μm)1 μm
Duty cycle (f)0.5
Groove depth (h1,h2/μm)0.6; 0.4
Publisher’s Note: MDPI stays neutral with regard to jurisdictional claims in published maps and institutional affiliations.

