
Effects of Corner Modification on the Wind-Induced Responses of High-Rise Buildings


Abstract
:1. Introduction
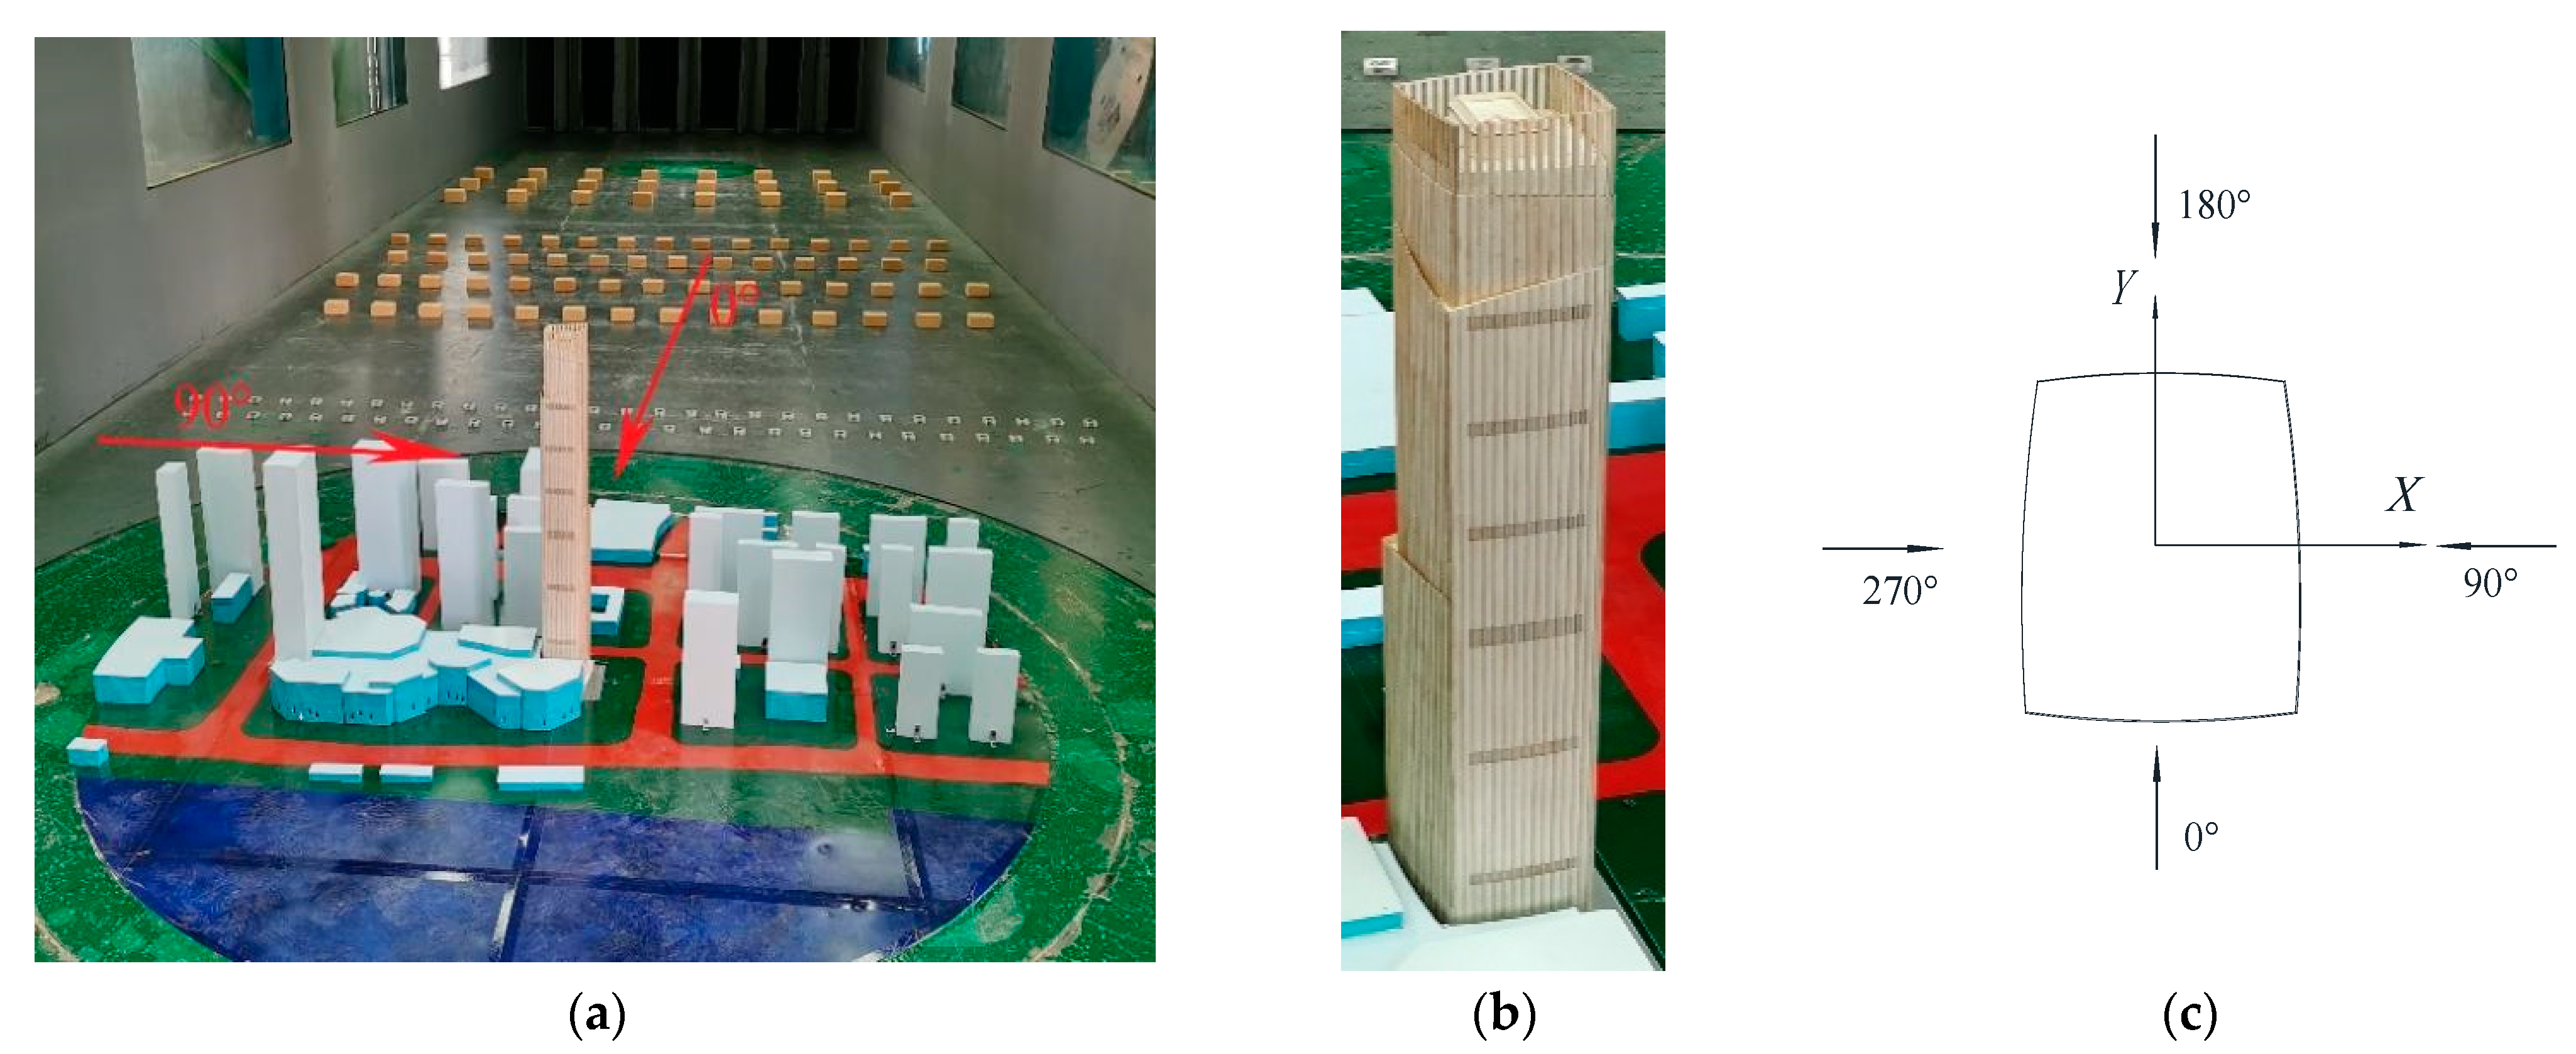
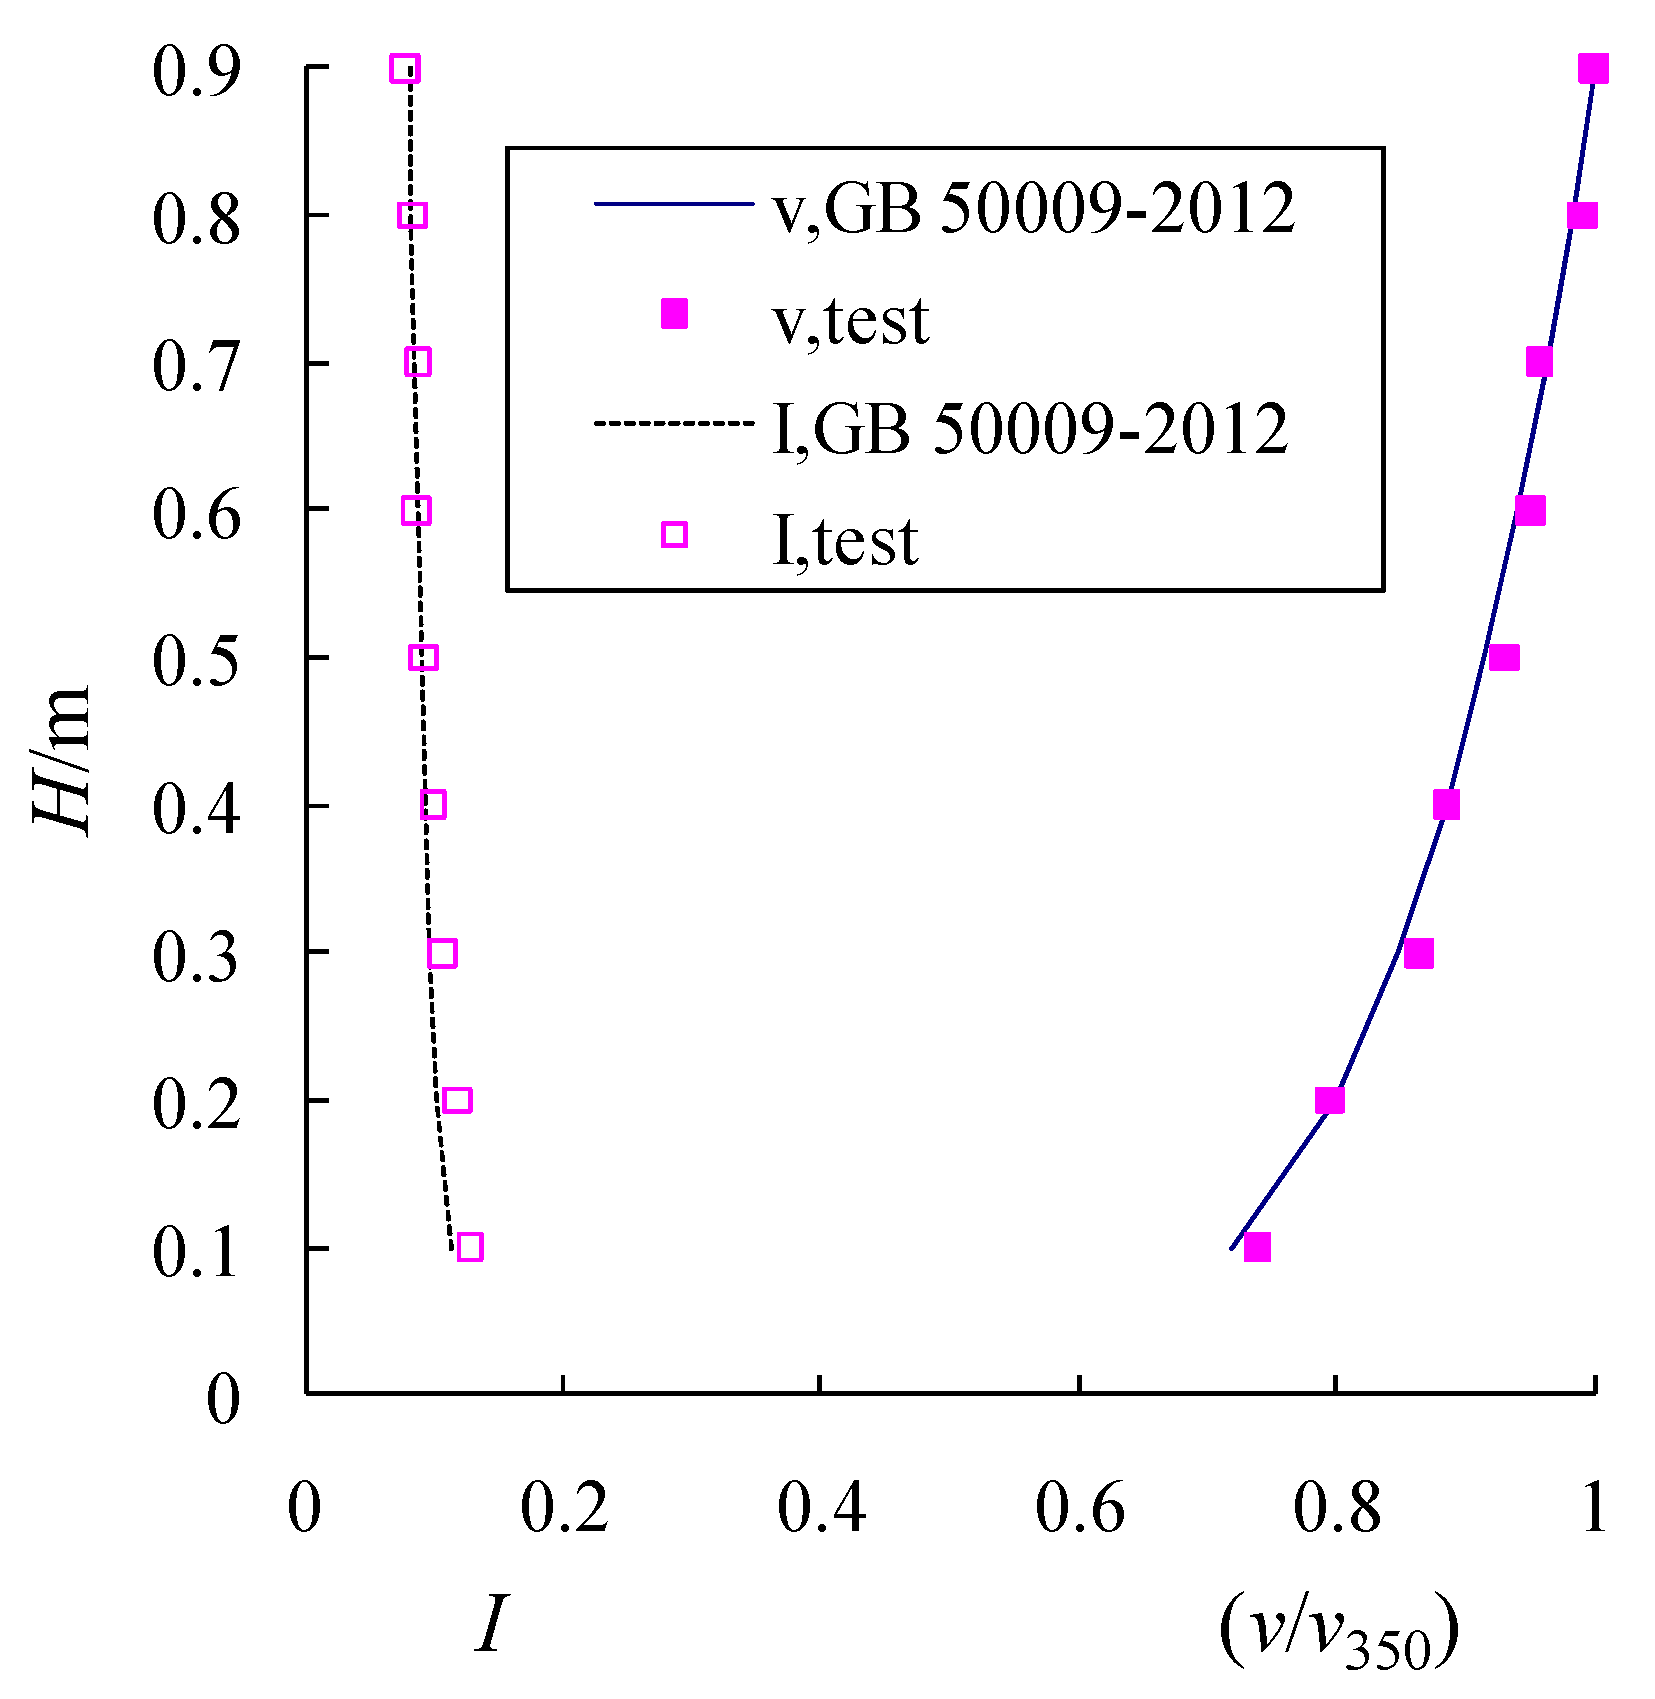
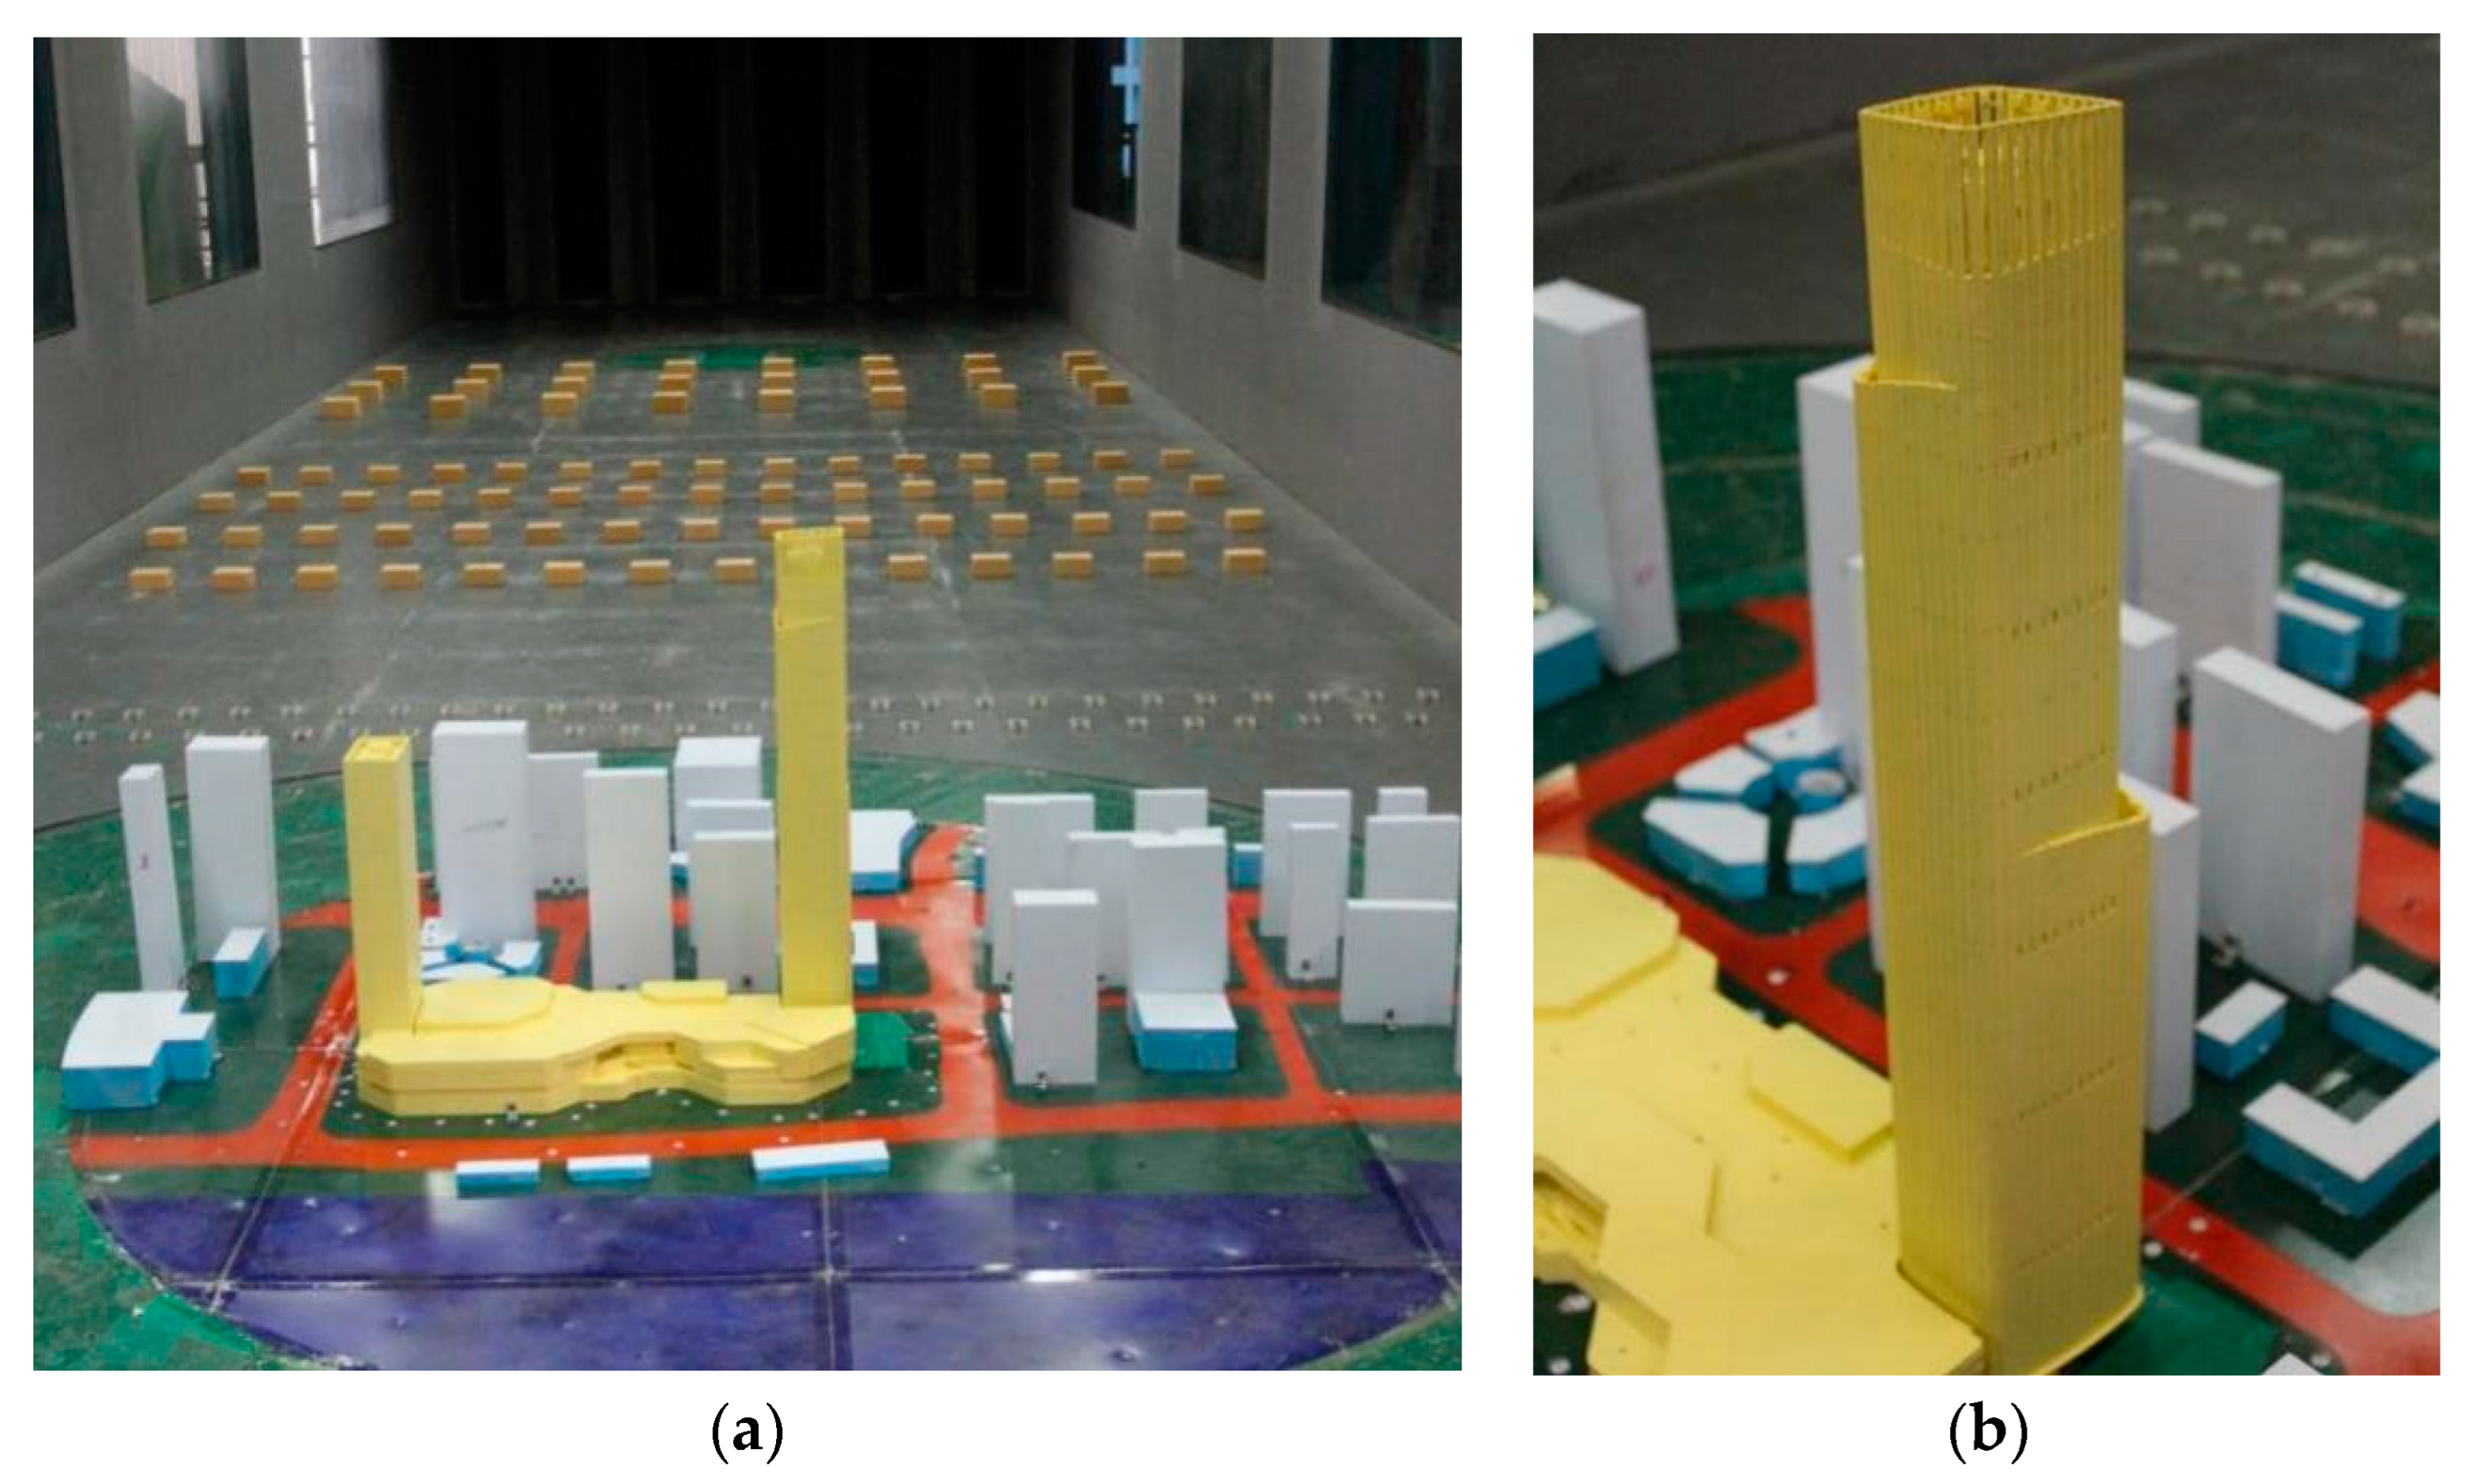
2. Experiment Setup
3. Aerodynamic Forces on the Building
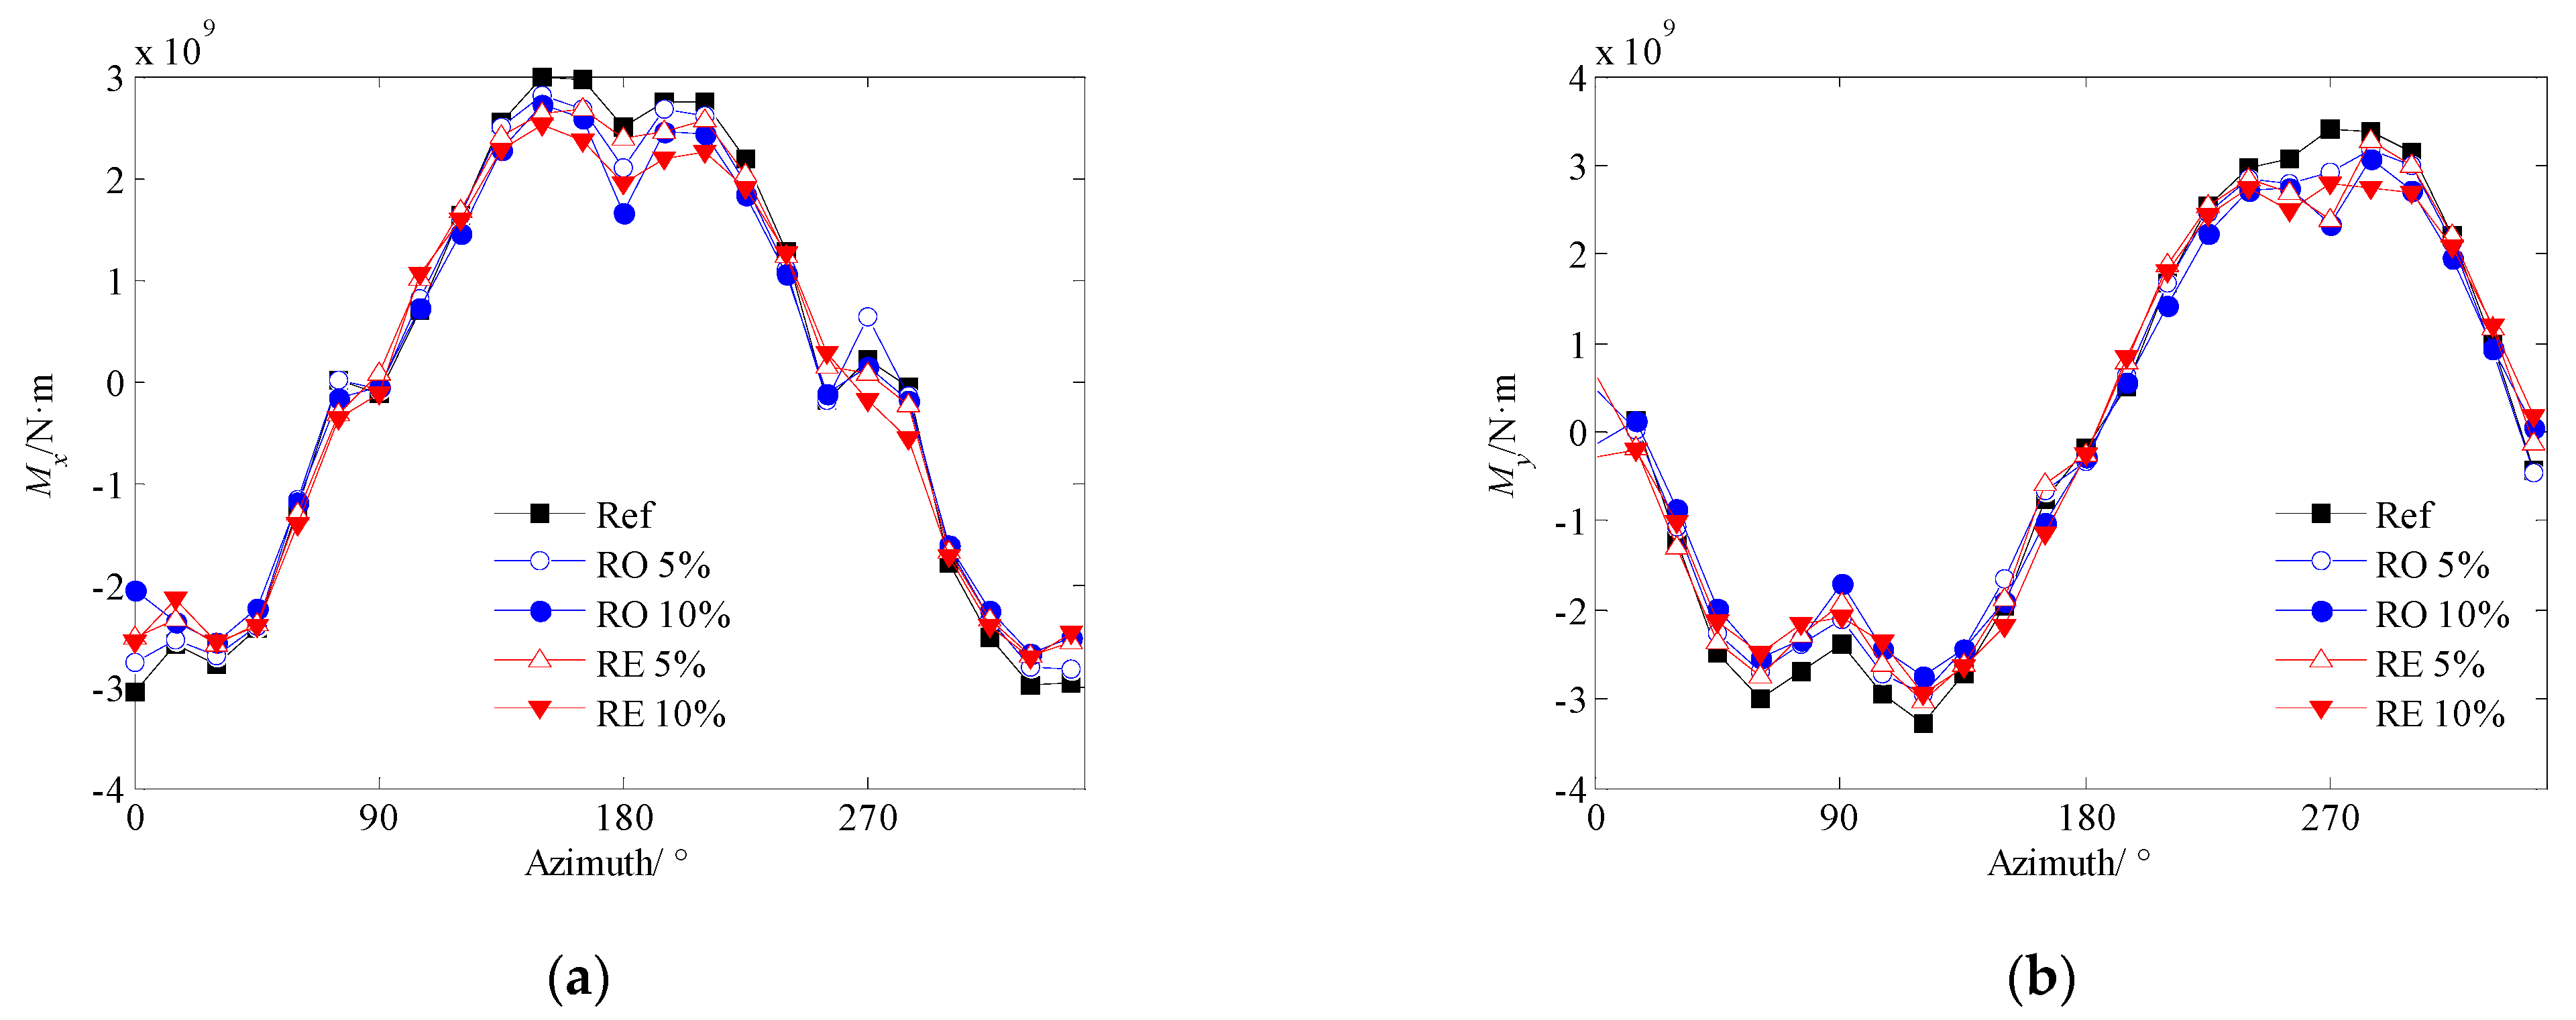
3.1. Mean Base Overturning Moment
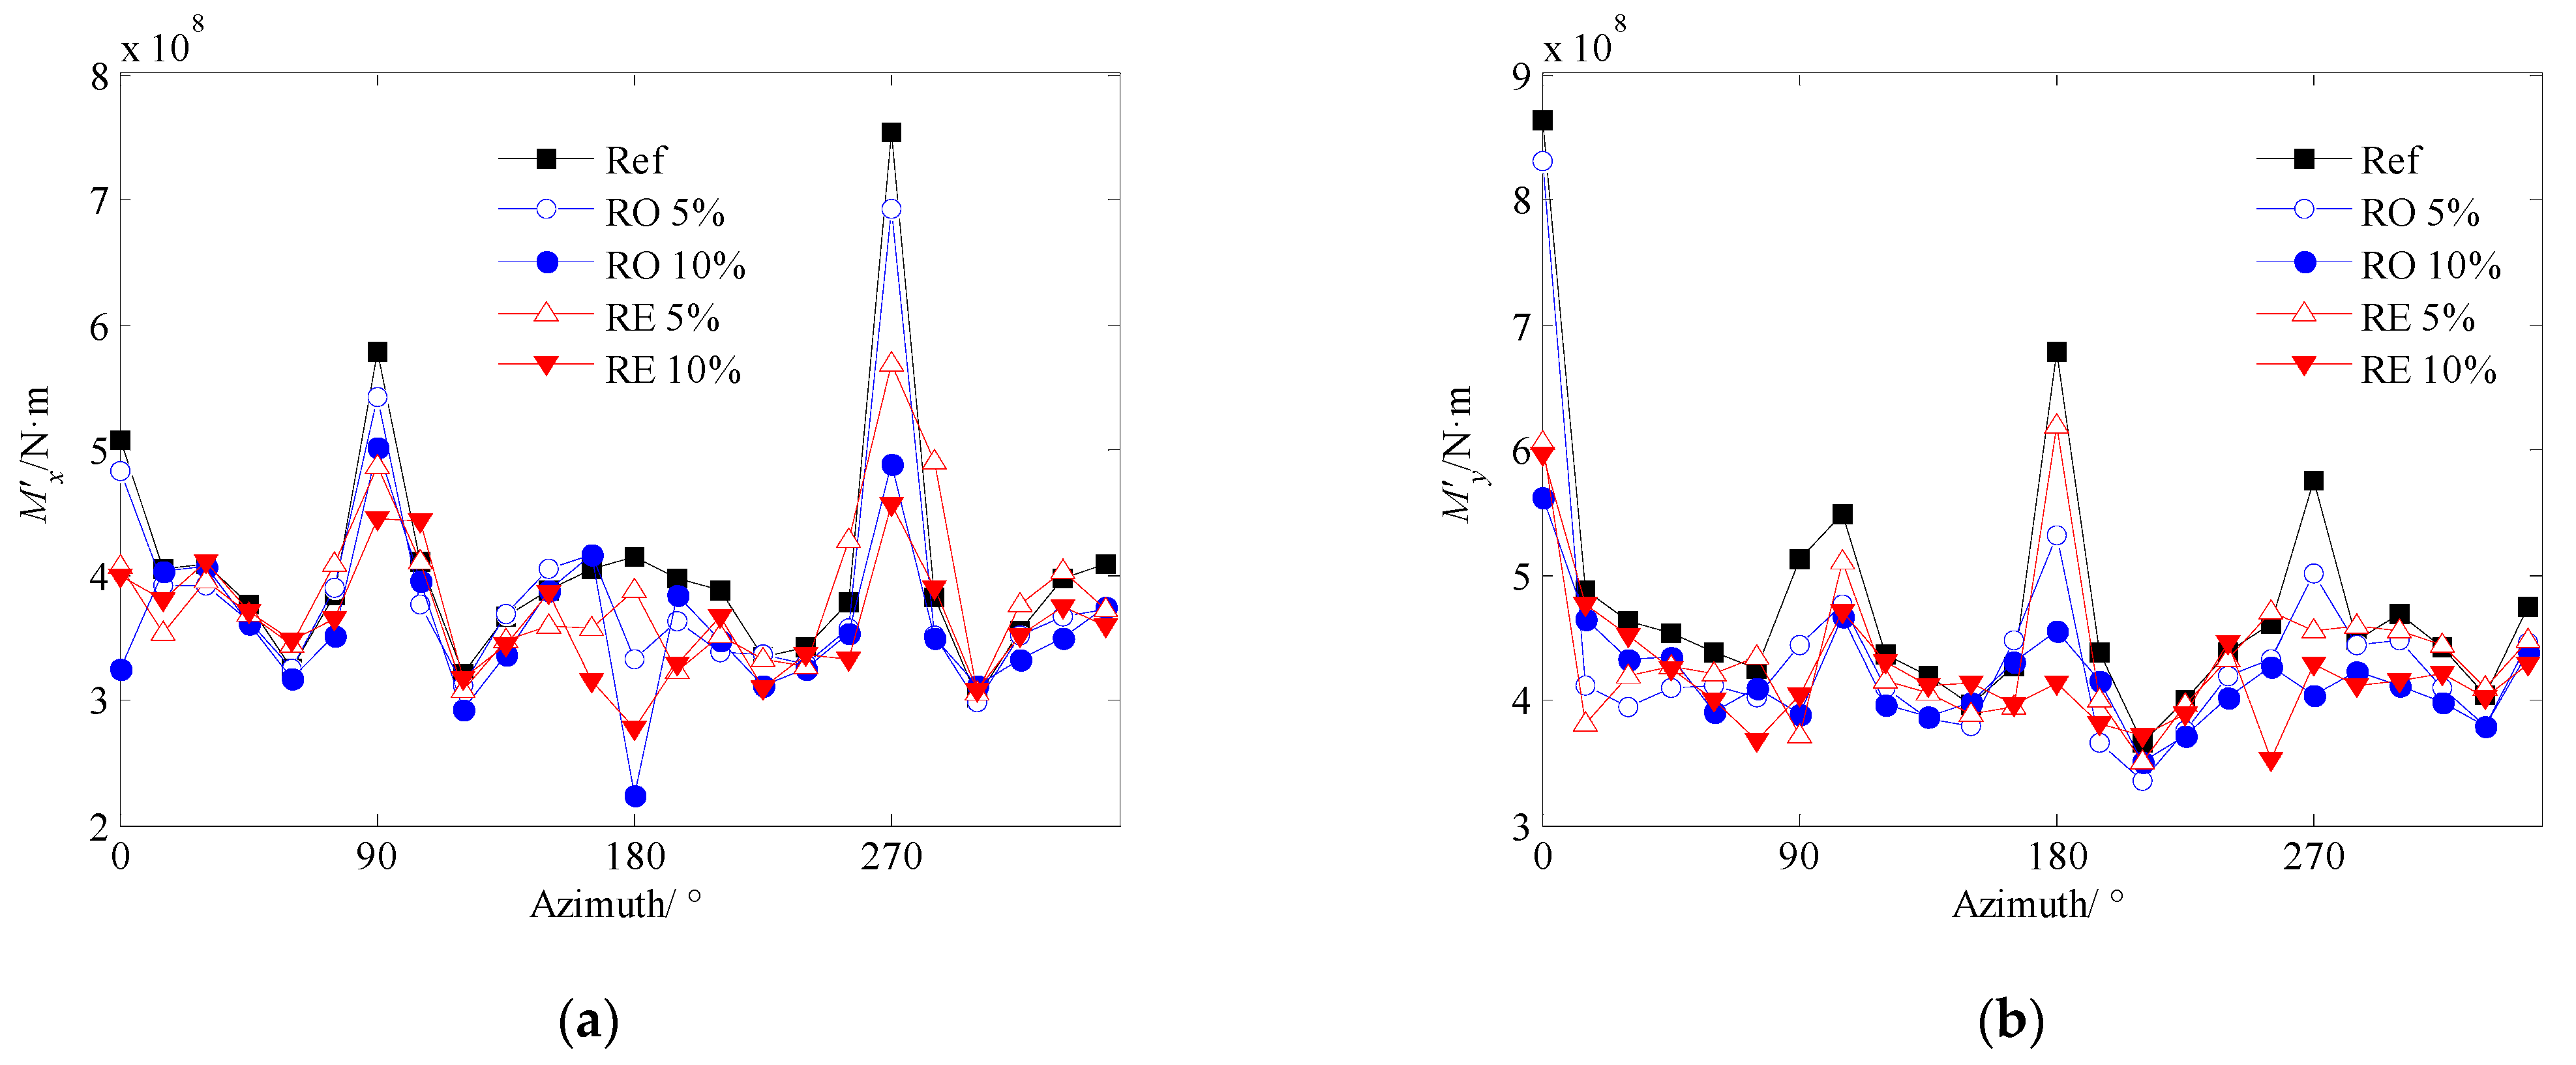
3.2. Standard Deviation of Fluctuating Base-Overturning Moment
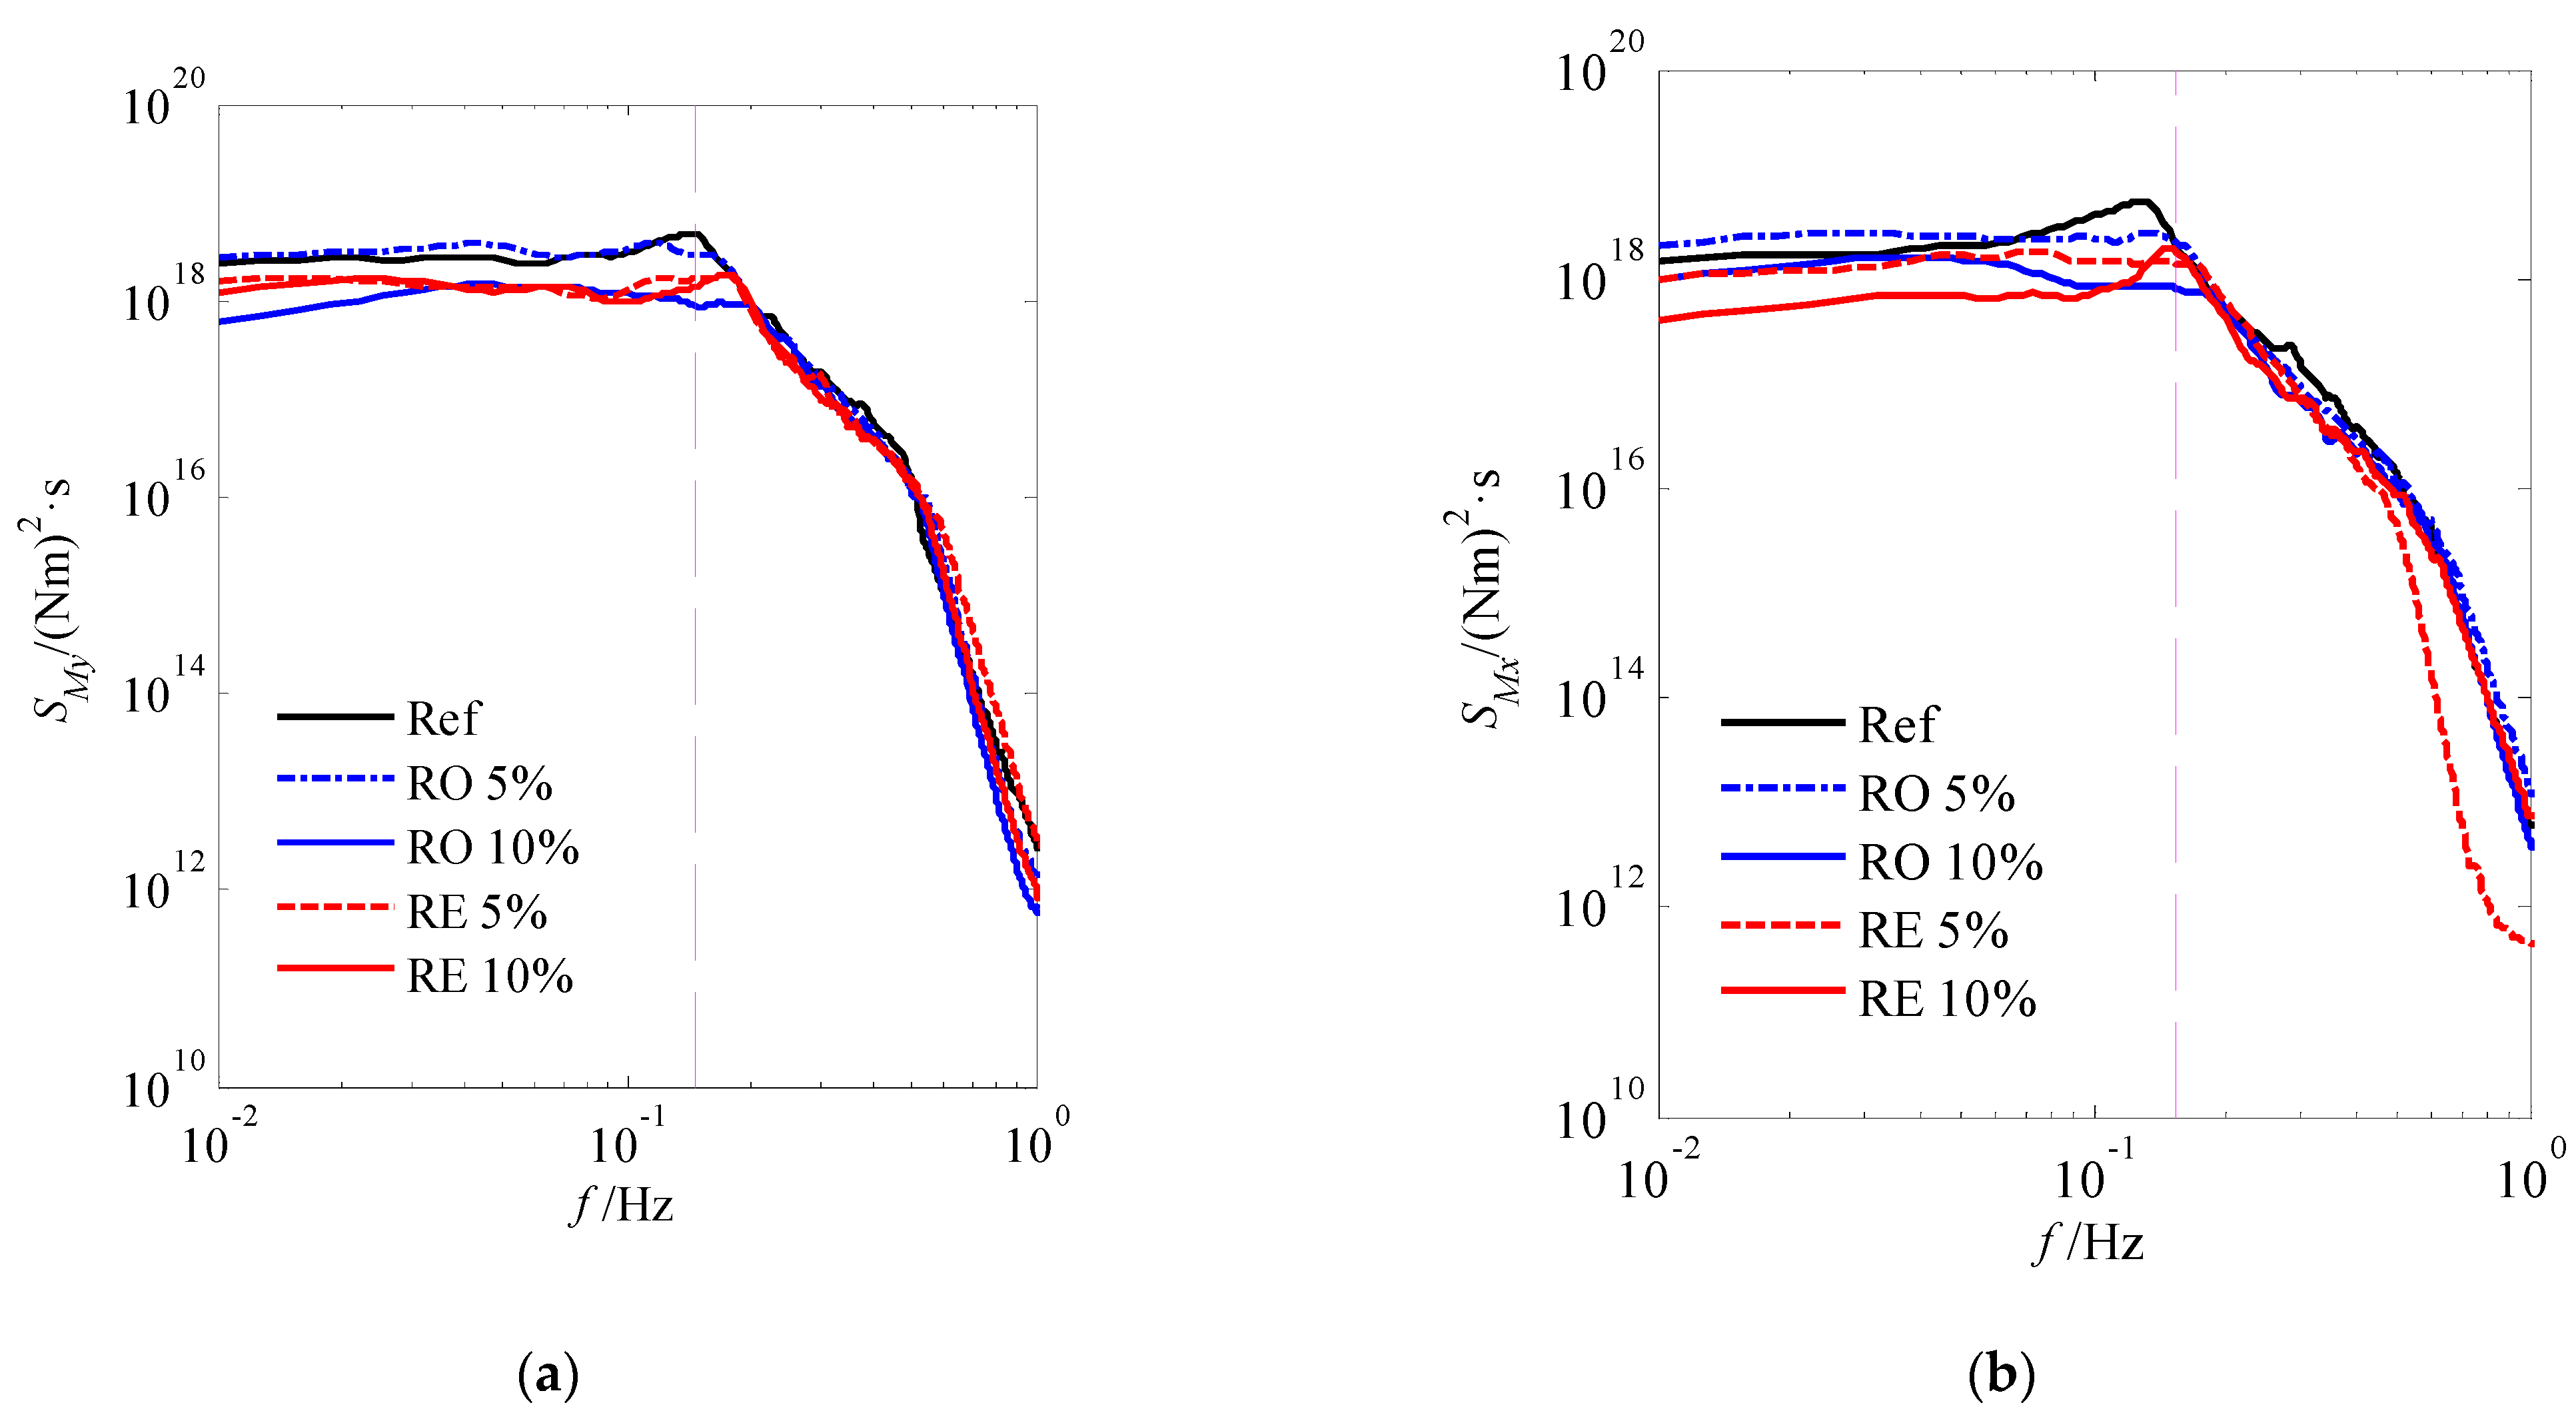
3.3. Spectrum of Fluctuating Base Overturning Moment
4. Wind-Induced Response of the Building
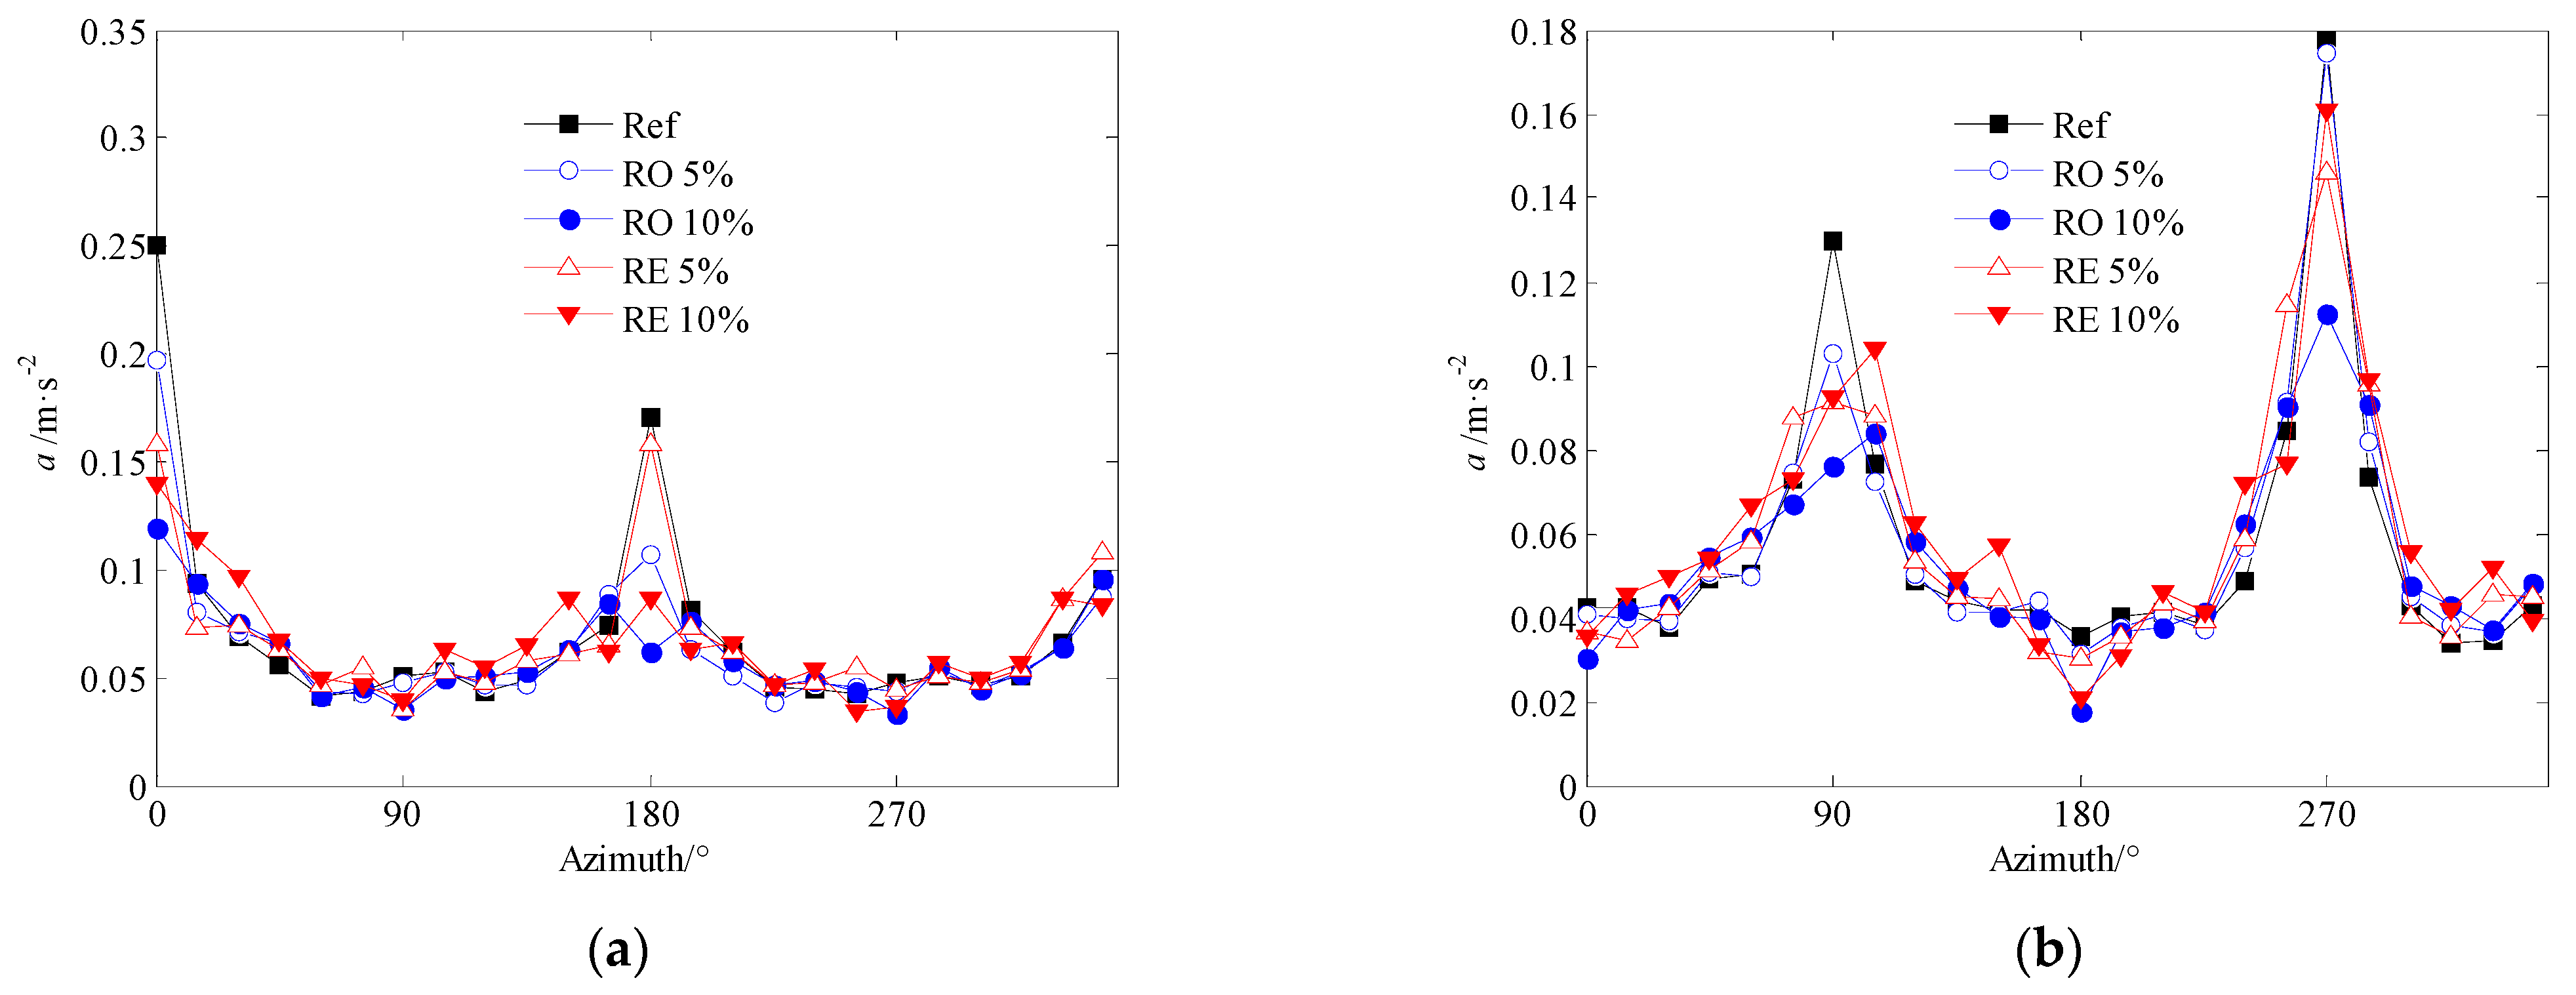
4.1. Acceleration and Displacement
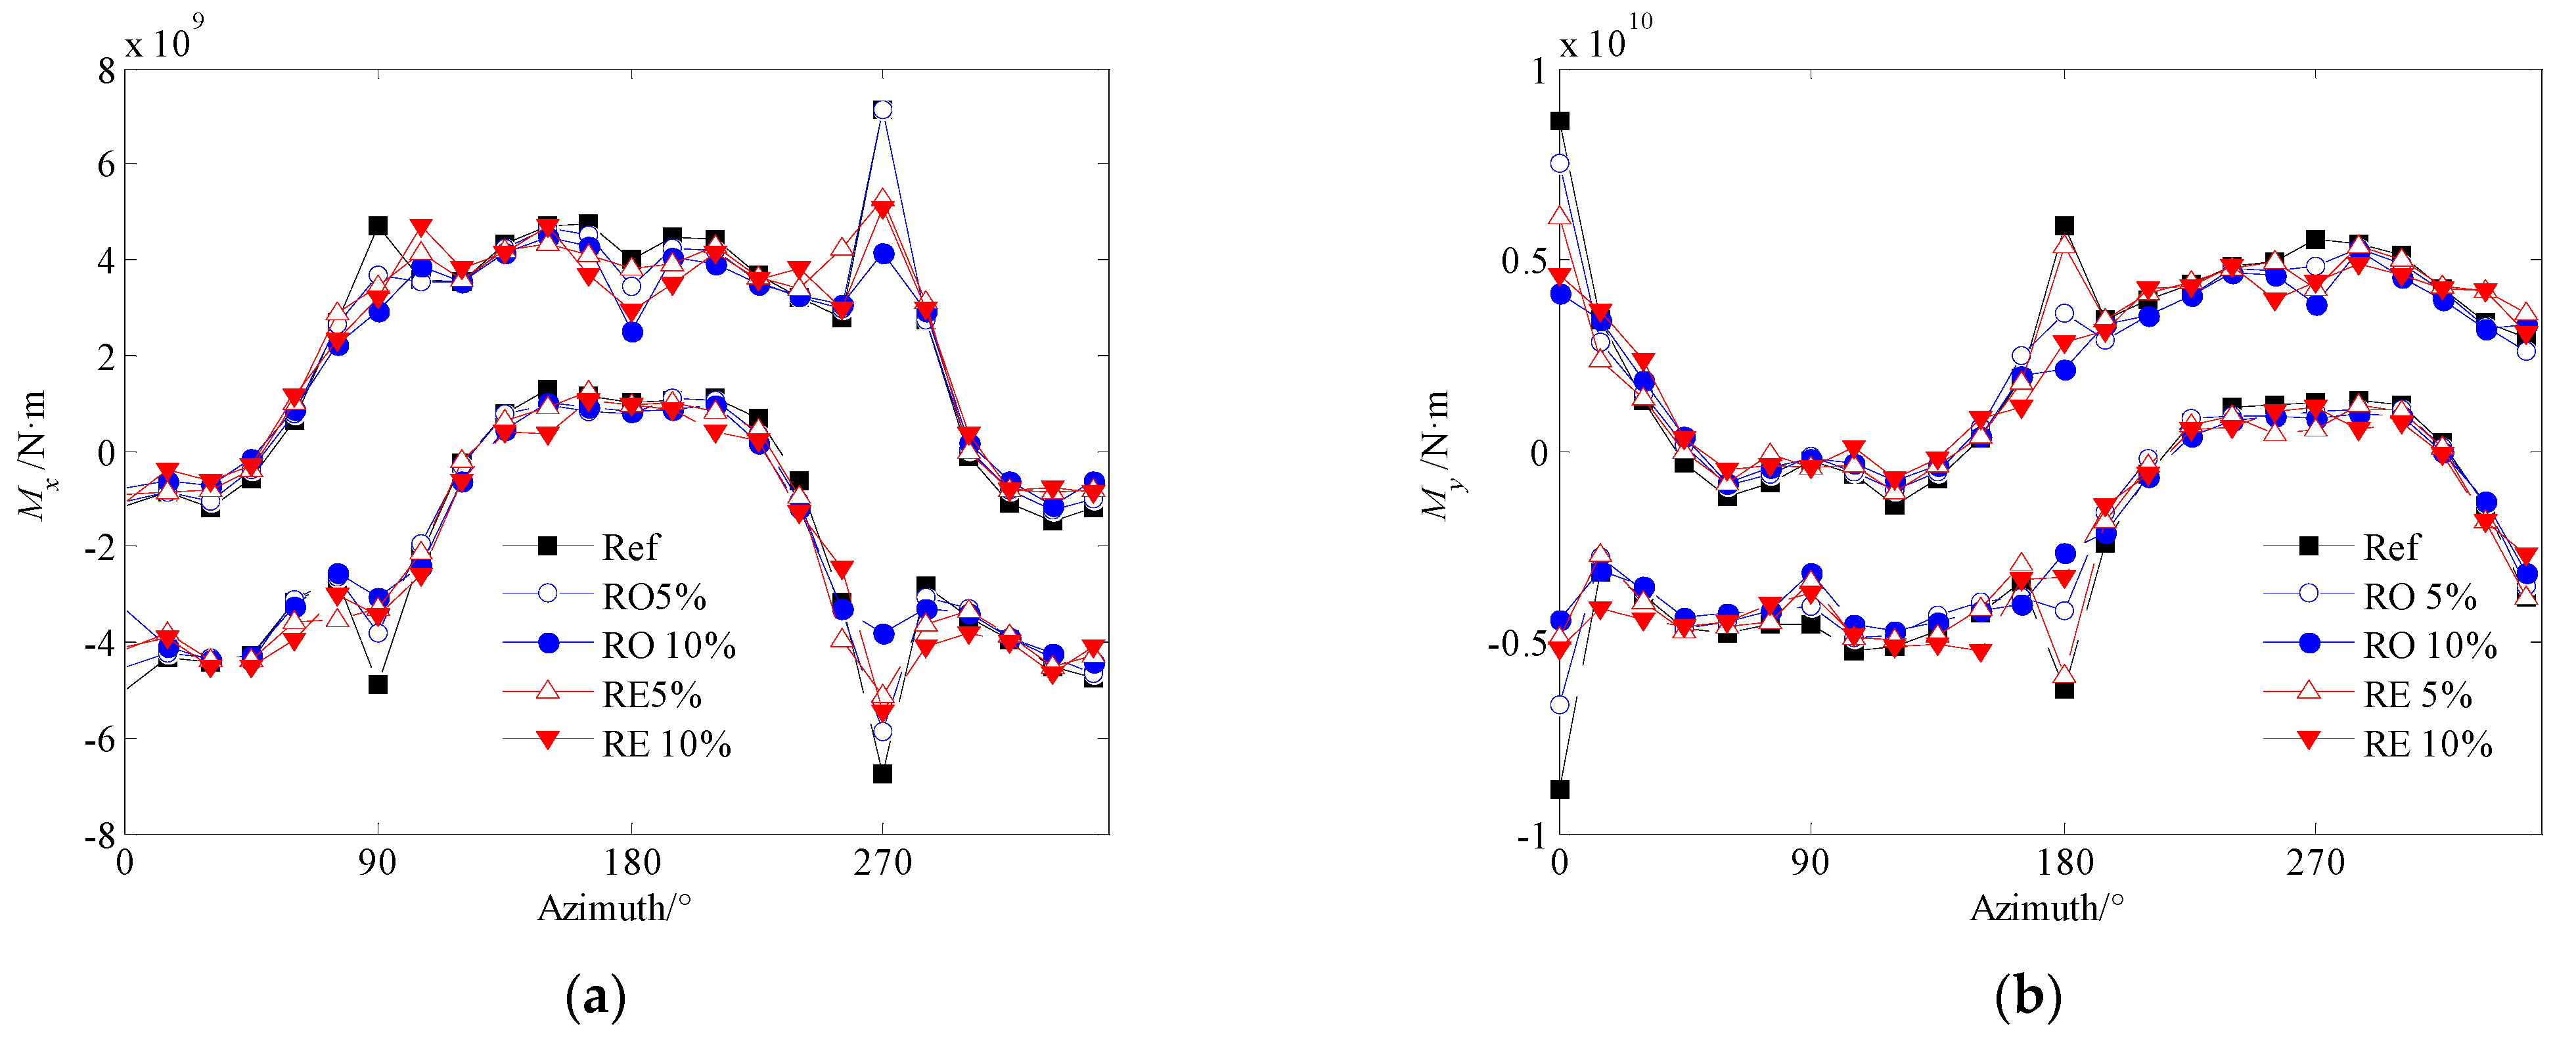
4.2. Wind-Induced Base Overturning Moments
5. Comparisons with the SPI Test
5.1. Experimental Setup of SPI
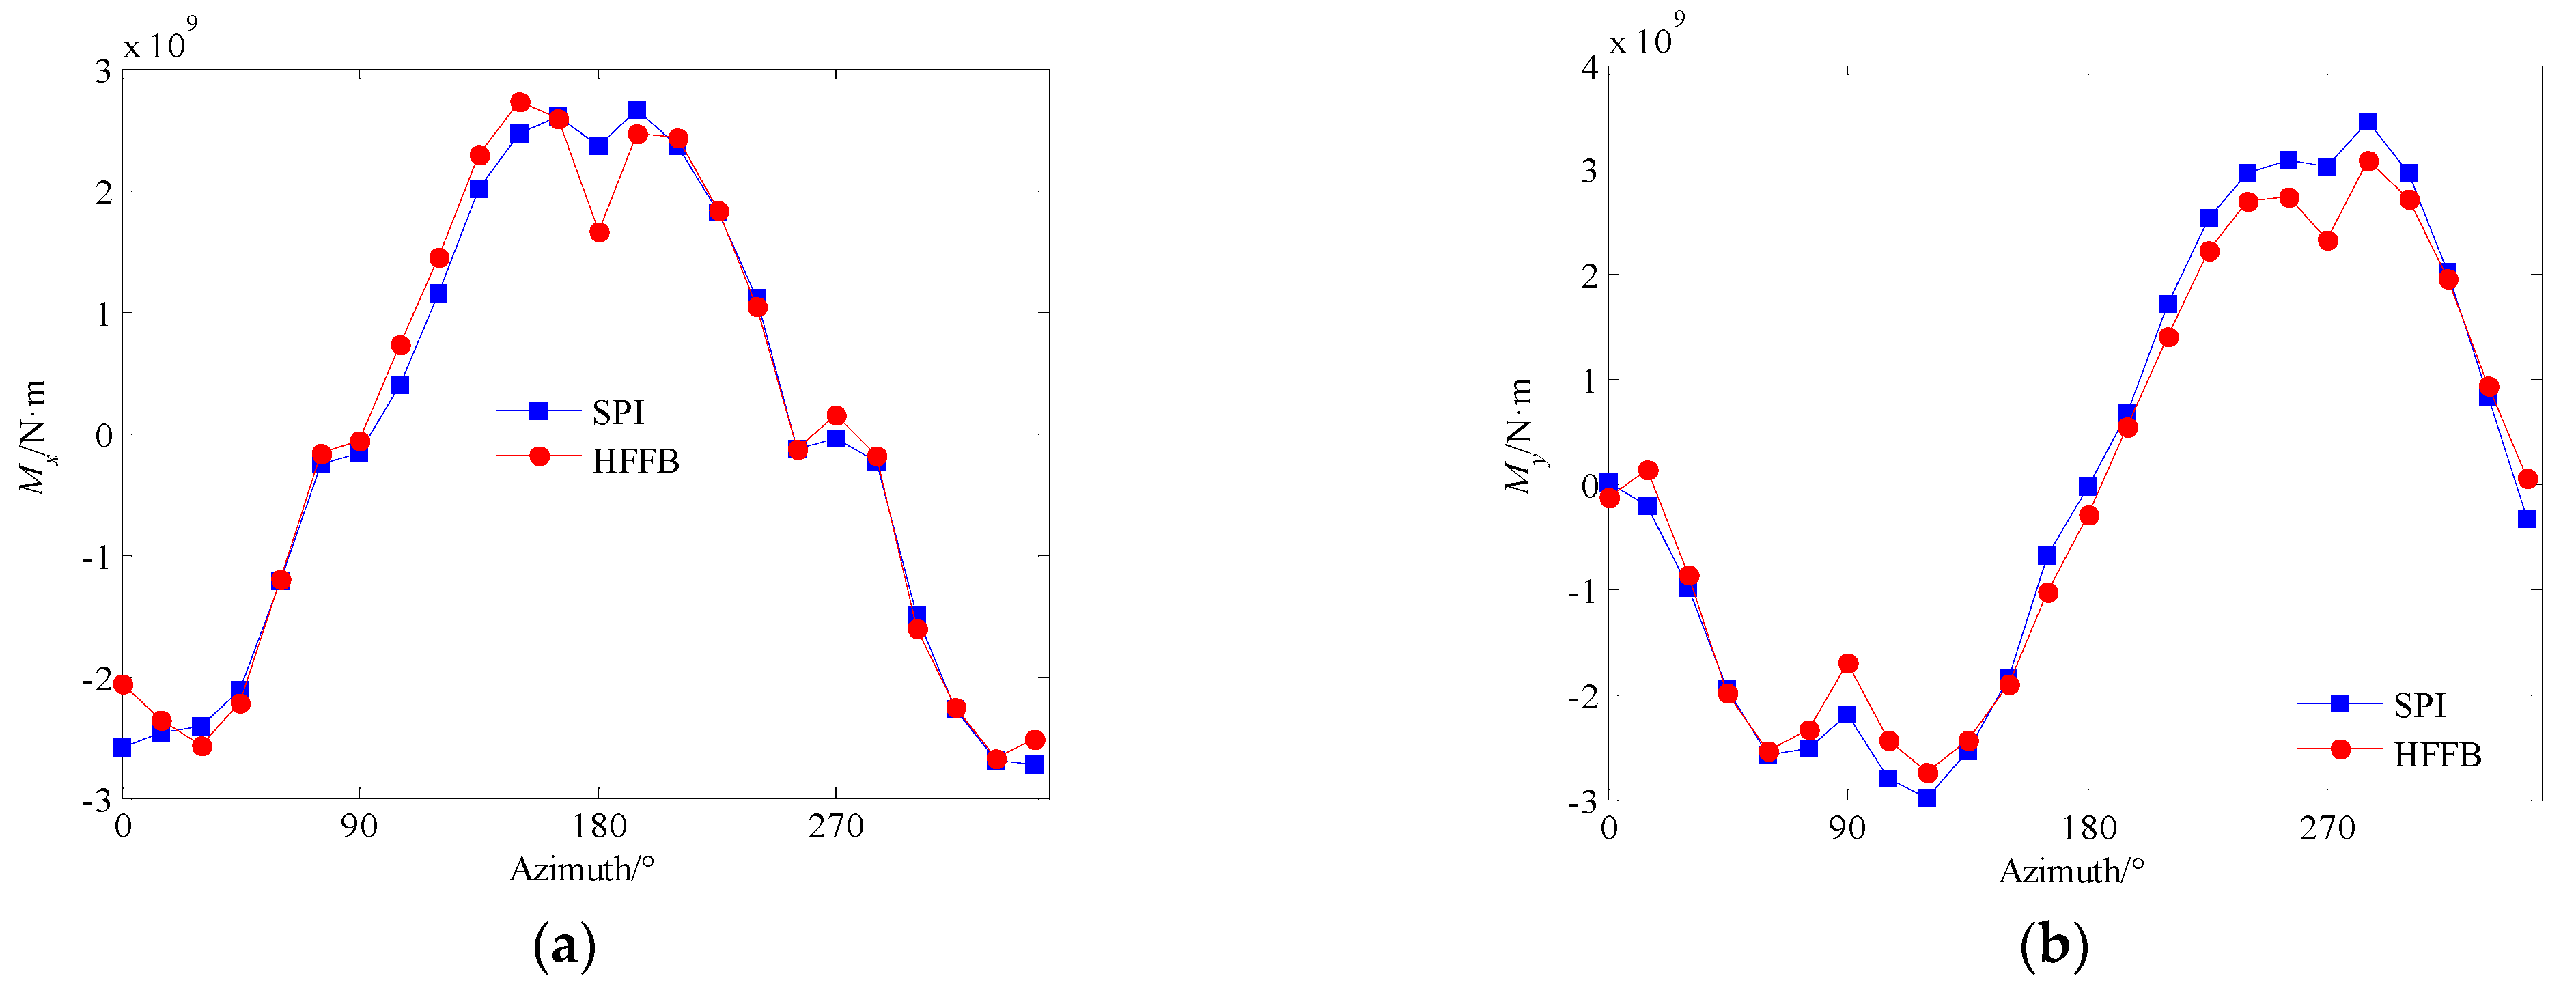
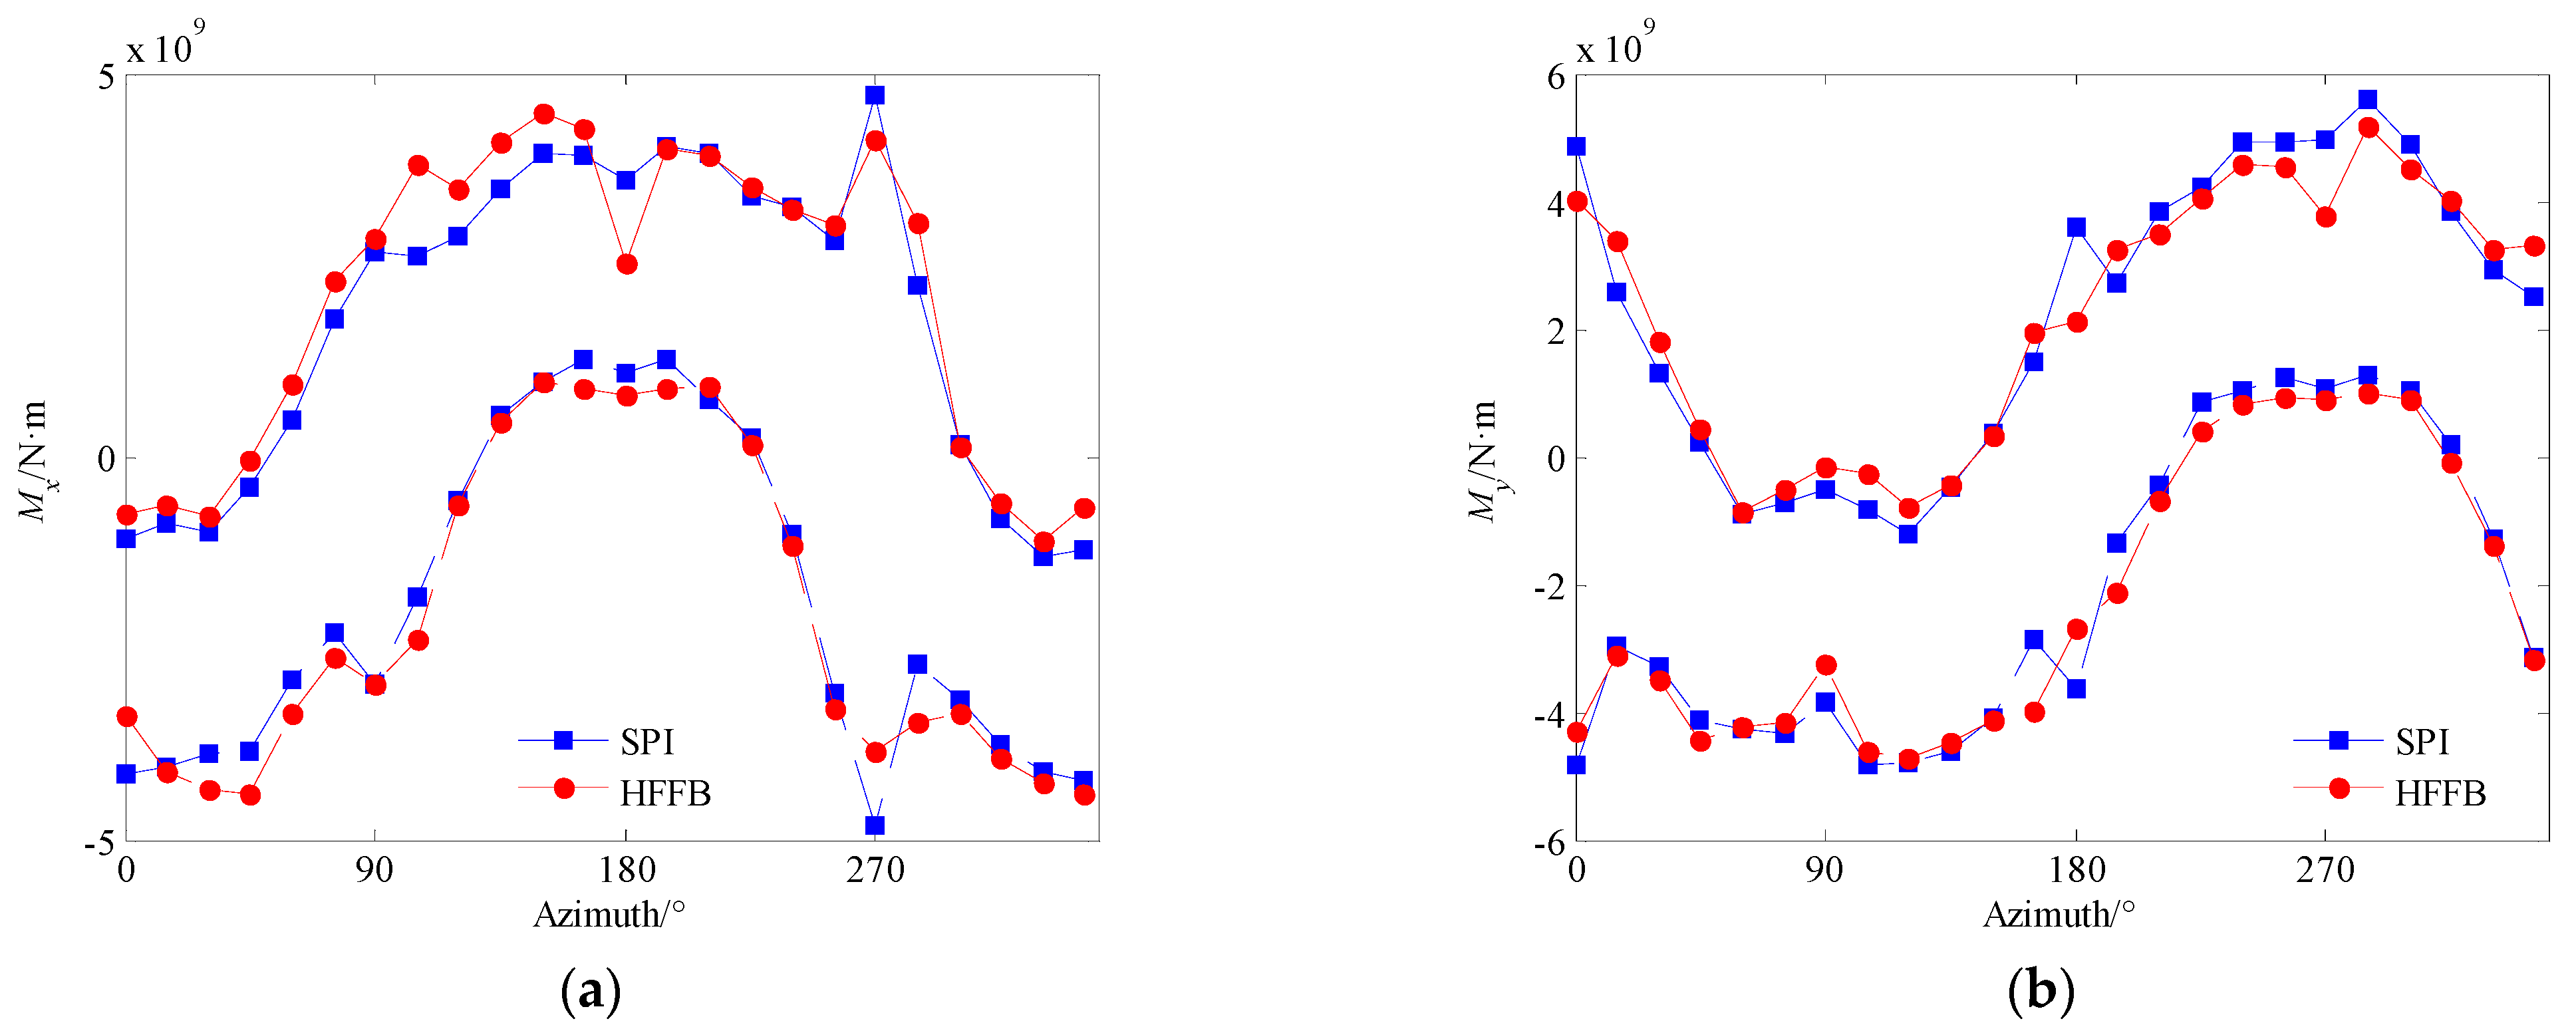
5.2. Comparison of the Results of the HFFB and SPI Test
6. Conclusions
- (1)
- For the mean values of the base moments in the along-wind direction, the RO10% model reveals the smallest value among the five models. The results show that the mean base bending moment on the building will not be symmetrical about the wind azimuth due to the interfering effect induced by the neighboring buildings;
- (2)
- The standard deviation of the base bending moment of the building in the cross-wind direction is much larger than that in the along wind direction, indicating that the cross-wind fluctuations originating from vortex shedding will be dominated provided a remarkable building height;
- (3)
- The peak values of the power spectrum of the base bending moment decrease significantly for the models with corner modifications compared with the unmodified model. The aerodynamic treatments of corner modifications have a considerable benefit of disrupting the regular shedding of vortices and causing the cross-wind accelerations and displacements of buildings to be appreciably smaller than that of the unmodified model;
- (4)
- For the wind-induced base bending moments, the model with a 10% roundness radius to width ratio has the best mitigation effect not only in the along wind direction but also in the cross-wind direction among the four corner modifications;
- (5)
- Furthermore, the mean and extreme base overturning moments obtained by the SPI and the HFFB tests are almost coincidental versus the wind azimuth with acceptable discrepancy. The discrepancy may be partially due to facts such as the integrating error of the SPI technique and model fabrications. However, the disparities are relatively small, indicating that the two types of tests can be verified with each other.
Author Contributions
Funding
Institutional Review Board Statement
Informed Consent Statement
Data Availability Statement
Conflicts of Interest
References
- Mooneghi, M.A.; Kargarmoakhar, R. Aerodynamic Mitigation and Shape Optimization of Buildings: Review. J. Build. Eng. 2016, 6, 225–235. [Google Scholar] [CrossRef]
- Li, Y.; Tian, X.; Tee, K.F.; Li, Q.; Li, Y. Aerodynamic treatments for reduction of wind loads on high-rise buildings. J. Wind Eng. Ind. Aerod. 2018, 172, 107–115. [Google Scholar] [CrossRef]
- Xie, J. Aerodynamic optimization of super-tall buildings and its effectiveness assessment. J. Wind Eng. Ind. Aerod. 2014, 130, 88–98. [Google Scholar] [CrossRef]
- Xie, J.; Yang, X. Exploratory study on wind-adaptable design for super-tall buildings. Wind Struct. 2019, 29, 489–497. [Google Scholar]
- Xu, Z.; Xie, J. Application of Wind Fairings for Building Aerodynamic Optimization. In Wind Engineering for Natural Hazards; ASCE: Reston, VA, USA, 2018; pp. 193–204. [Google Scholar]
- Quan, Y.; Gu, M. Power spectra of across-wind loads on high-rise buildings. J. Tongji Univ. 2002, 5, 627–632. [Google Scholar]
- Tse, K.T.; Hitchcock, P.A.; Kwok, K.C.S.; Thepmongkorn, S.; Chan, C.M. Economic perspectives of aerodynamic treatments of square tall buildings. J. Wind Eng. Ind. Aerod. 2009, 97, 455–467. [Google Scholar] [CrossRef]
- Zhang, Z.; Quan, Y.; Gu, M.; Xiong, Y. Effects of corner chamfering and rounding modification on aerodynamic coefficients of square tall buildings. Chin. J. Civ. Eng. 2013, 46, 12–20. [Google Scholar]
- Zhang, Z.; Quan, Y.; Gu, M.; Xiong, Y. Effects of corner recession modification on aerodynamic coefficients of square high-rise buildings. Chin. J. Civ. Eng. 2013, 46, 58–65. [Google Scholar]
- Irwin, P.; Kilpatrick, J.; Robinson, J.; Frisque, A. Wind and tall buildings: Negatives and positives. Struct. Des. Tall Spec. Build. 2008, 17, 915–928. [Google Scholar] [CrossRef]
- Xie, Z.; Li, J. Experimental study on cross wind effect of tapered super-tall buildings under action of strong wind. J. Build. Struct. 2011, 32, 118–126. [Google Scholar]
- Kawai, H. Effect of corner modifications on aeroelastic instabilities of tall buildings. J. Wind Eng. Ind. Aerod. 1998, 74, 719–729. [Google Scholar] [CrossRef]
- Cao, H.; Quan, Y.; Gu, M. Along-wind aerodynamic damping of high-rise buildings with aerodynamically modified square cross-sections. Vib. Shock. 2012, 31, 84–89. [Google Scholar]
- Wang, L.; Liang, S.; Wang, Z.; Zhang, Z. Effect of aerodynamic optimization to across-wind response of supertall buildings. J. Zhejiang Univ. 2016, 50, 1239–1246, 1265. [Google Scholar]
- Liao, C. CFD Numerical Simulation of Aerodynamic Characteristics of Different Cross Sections Tall Buildings in All Wind Directions; Hunan University: Changsha, China, 2014. [Google Scholar]
- Elshaer, A.; Bitsuamlak, G.; El Damatty, A. Enhancing wind performance of tall buildings using corner aerodynamic optimization. Eng. Struct. 2017, 136, 133–148. [Google Scholar] [CrossRef]
- Ding, F.; Kareem, A. Tall Buildings with Dynamic Facade under Winds. Engineering 2020, 6, 1443–1453. [Google Scholar] [CrossRef]
- Yang, Y. Optimization of Aerodynamic Performance of High-Rise Buildings Based on CFD; Harbin Institute of Technology: Harbin, China, 2019. [Google Scholar]
- Abdelaziz, K.M.; Alipour, A.; Hobeck, J.D. A smart façade system controller for optimized wind-induced vibration mitigation in tall buildings. J. Wind. Eng. Ind. Aerod. 2021, 212, 104601. [Google Scholar] [CrossRef]
- Lin, P.; Ding, F.; Hu, G.; Li, C.; Xiao, Y.; Tse, K.T.; Kwok, K.C.S.; Kareem, A. Machine learning-enabled estimation of crosswind load effect on tall buildings. J. Wind Eng. Ind. Aerod. 2022, 220, 104860. [Google Scholar] [CrossRef]
- Ministry of Housing and Urban-Rural Development of the People’s Republic of China. JGJ/T 338-2014. Standard for wind Tunnel Test of Buildings and Structures; China Architecture and Building Press: Beijing, China, 2012.
- ASCE (American Society of Civil Engineers). Wind Tunnel Testing for Building and Other Structures (ASCE Manual No. 49: 2021); ASCE: Reston, VA, USA, 2021. [Google Scholar]
- Ministry of Housing and Urban-Rural Development of the People’s Republic of China. GB 50009-2012. Load Code for the Design of Building Structures; China Architecture and Building Press: Beijing, China, 2012.
- Tschanz, T.; Davenport, A.G. The base balance technique for the determination of dynamic wind loads. J. Wind Eng. Ind. Aerod. 1983, 13, 429–439. [Google Scholar] [CrossRef]
- Xie, J.; Irwin, P.A. Application of the force balance technique to a building complex. J. Wind Eng. Ind. Aerod. 1998, 77, 579–590. [Google Scholar] [CrossRef]
- Housing and Urban-Rural Development of the Guangdong Province. Load Code for the Design of Building Structures (DBJ 15-101-2014); China City Press: Beijing, China, 2014.
- Yang, X.; Qin, W.; Ke, Y.; Xie, J. Effects of porous double skin façade system on structural wind responses of tall buildings. J. Harbin Univ. Technol. 2021, 53, 70–78. [Google Scholar]


| Reference | Corner Modification | Method | Parameters Involved | |||
|---|---|---|---|---|---|---|
| Pressure Coefficient | Base Force | Aerodynamic Spectrum | Wind-Induced Response | |||
| Quan et al. [6] | CH, RE, RO | HFFB | √ | √ | ||
| K.T. Tse et al. [7] | CH, RE | HFFB | √ | √ | ||
| Zhang et al. [8,9] | CH, RO, RE | HFFB | √ | |||
| Irwin et al. [10] | RE | SPI | √ | √ | ||
| Xie et al. [11] | RE | SPI | √ | √ | √ | |
| Li et al. [2] | CH, RO, RE | SPI | √ | √ | √ | |
| Kawai [12] | CH, RE, RO | AE | √ | |||
| Cao et al. [13] | CH, RE | AE | √ | |||
| Wang et al. [14] | CH, RO, RE | AE | √ | |||
| Liao et al. [15] | CH, RE | CFD | √ | √ | ||
| Elshaer et al. [16] | RE | CFD | √ | √ | √ | |
| Ding et al. [17] | RO, CH | CFD | √ | |||
| Yang [18] | RO | CFD | √ | |||
| Abdelaziz [19] | RE | CFD | √ | √ | √ | |
| Case1 | Case2 | Case3 | Case4 | Case5 | |
|---|---|---|---|---|---|
| Section outline |  |  |  |  |  |
| Plan | Reference | 5% roundness | 10% roundness | 5% recession | 10% recession |
| Abbreviation | Ref | RO5% | RO10% | RE5% | RE10% |
| Model picture |  |  |  |  |  |
| Case | Ref | RO 5% | RO 10% | RE 5% | RE 10% |
|---|---|---|---|---|---|
| Cross-wind (0°) | 8.88 | 7.51 | 4.39 | 6.12 | 5.17 |
| Along-wind (270°) | 5.53 | 4.83 | 3.81 | 4.25 | 4.44 |
| Height | Tap Number | Height | Tap Number | Height | Tap Number |
|---|---|---|---|---|---|
| 10 m | 17 | 145 m | 28 | 255 m | 26 |
| 20 m | 17 | 160 m | 40 | 265 m | 37 |
| 50 m | 28 | 180 m | 28 | 280 m | 26 |
| 70 m | 28 | 200 m | 26 | 300 m | 44 |
| 95 m | 28 | 220 m | 26 | 310 m | 44 |
| 120 m | 28 | 240 m | 26 |
Publisher’s Note: MDPI stays neutral with regard to jurisdictional claims in published maps and institutional affiliations. |
© 2022 by the authors. Licensee MDPI, Basel, Switzerland. This article is an open access article distributed under the terms and conditions of the Creative Commons Attribution (CC BY) license (https://creativecommons.org/licenses/by/4.0/).
Share and Cite
Ke, Y.; Shen, G.; Yu, H.; Xie, J. Effects of Corner Modification on the Wind-Induced Responses of High-Rise Buildings. Appl. Sci. 2022, 12, 9739. https://doi.org/10.3390/app12199739
Ke Y, Shen G, Yu H, Xie J. Effects of Corner Modification on the Wind-Induced Responses of High-Rise Buildings. Applied Sciences. 2022; 12(19):9739. https://doi.org/10.3390/app12199739
Chicago/Turabian StyleKe, Yanyu, Guohui Shen, Hangcong Yu, and Jiming Xie. 2022. "Effects of Corner Modification on the Wind-Induced Responses of High-Rise Buildings" Applied Sciences 12, no. 19: 9739. https://doi.org/10.3390/app12199739
APA StyleKe, Y., Shen, G., Yu, H., & Xie, J. (2022). Effects of Corner Modification on the Wind-Induced Responses of High-Rise Buildings. Applied Sciences, 12(19), 9739. https://doi.org/10.3390/app12199739