
A Survey of Photoplethysmography and Imaging Photoplethysmography Quality Assessment Methods


Abstract
1. Introduction
2. Background
2.1. PPG Signal and Its Application
- Extraction of physiological parameters, which can be illustrated by the extraction or estimation of physiological variables such as pulse rate, pulse rate variability, blood oxygen saturation [15], blood pressure [16], jugular venous pulse, respiration rate, cardiac output, arterial stiffness, left ventricular ejection time [10].
- Monitoring of patients by the screening PPG signals to follow their cardiovascular state. It allows the rise of alarms in case of the detection of abnormal situations such as fibrillation in intensive care units.
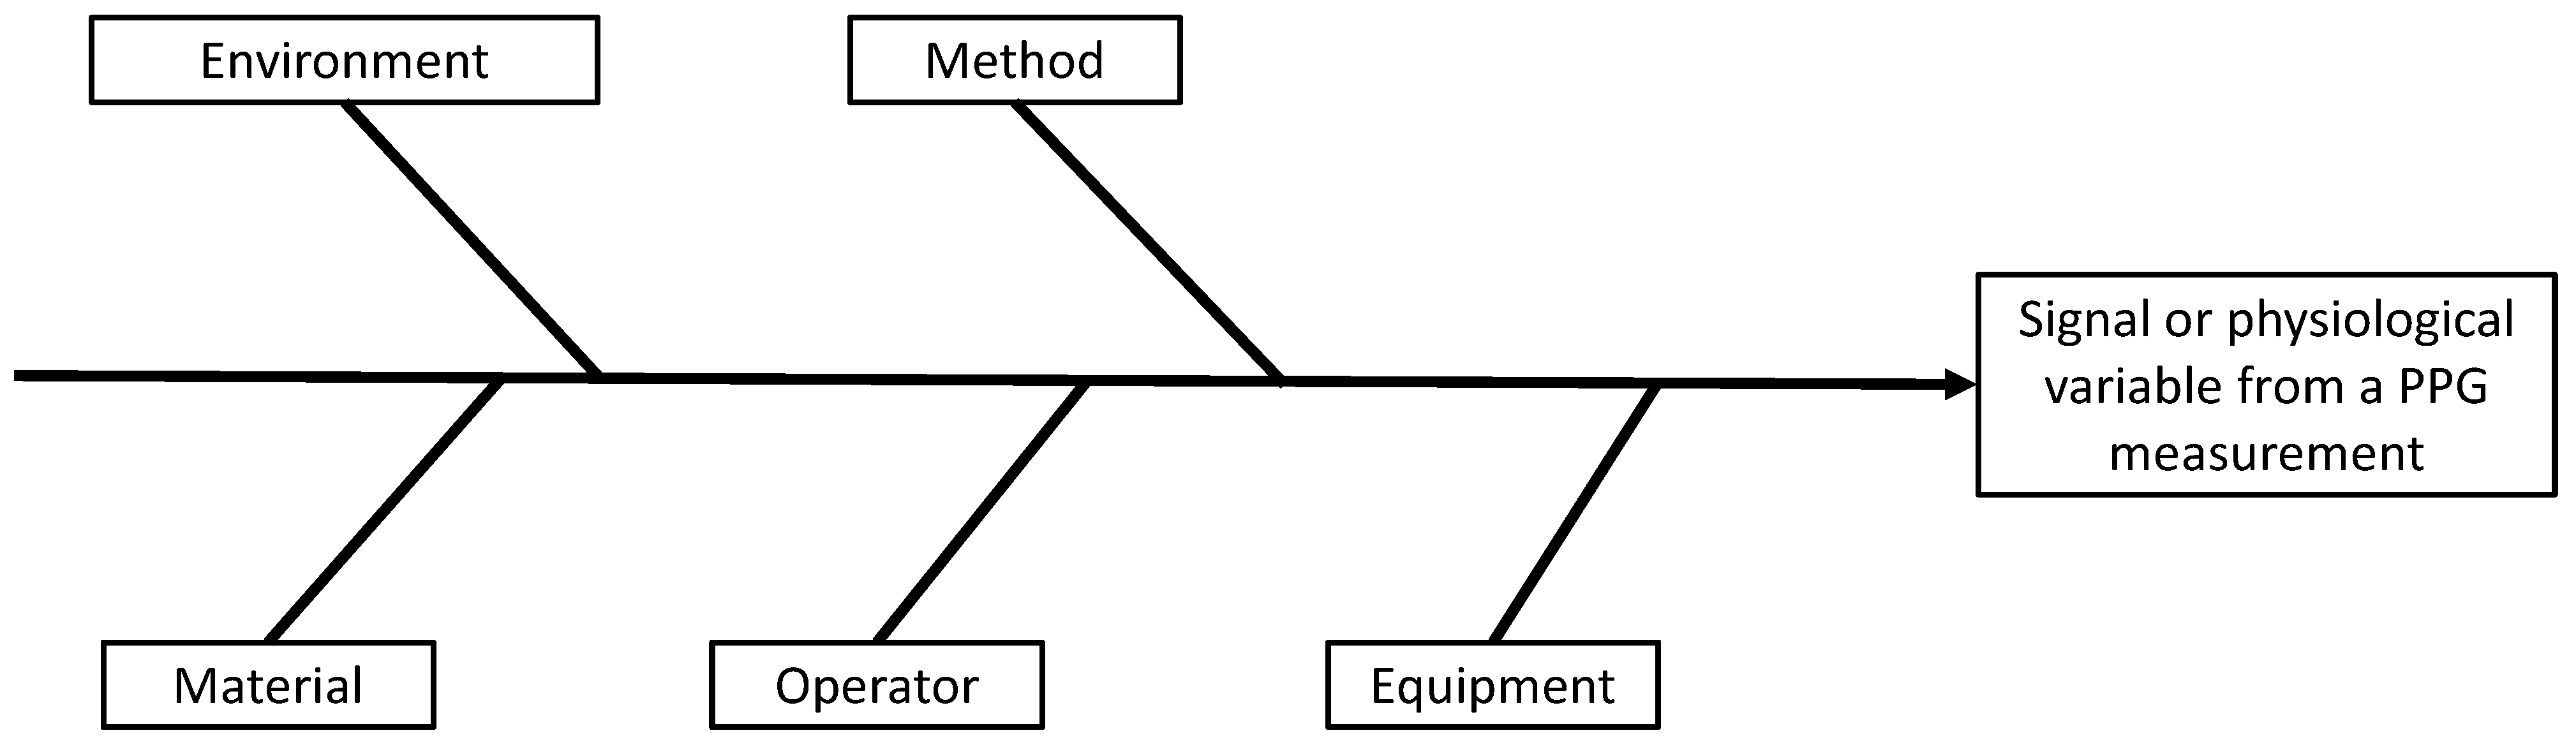
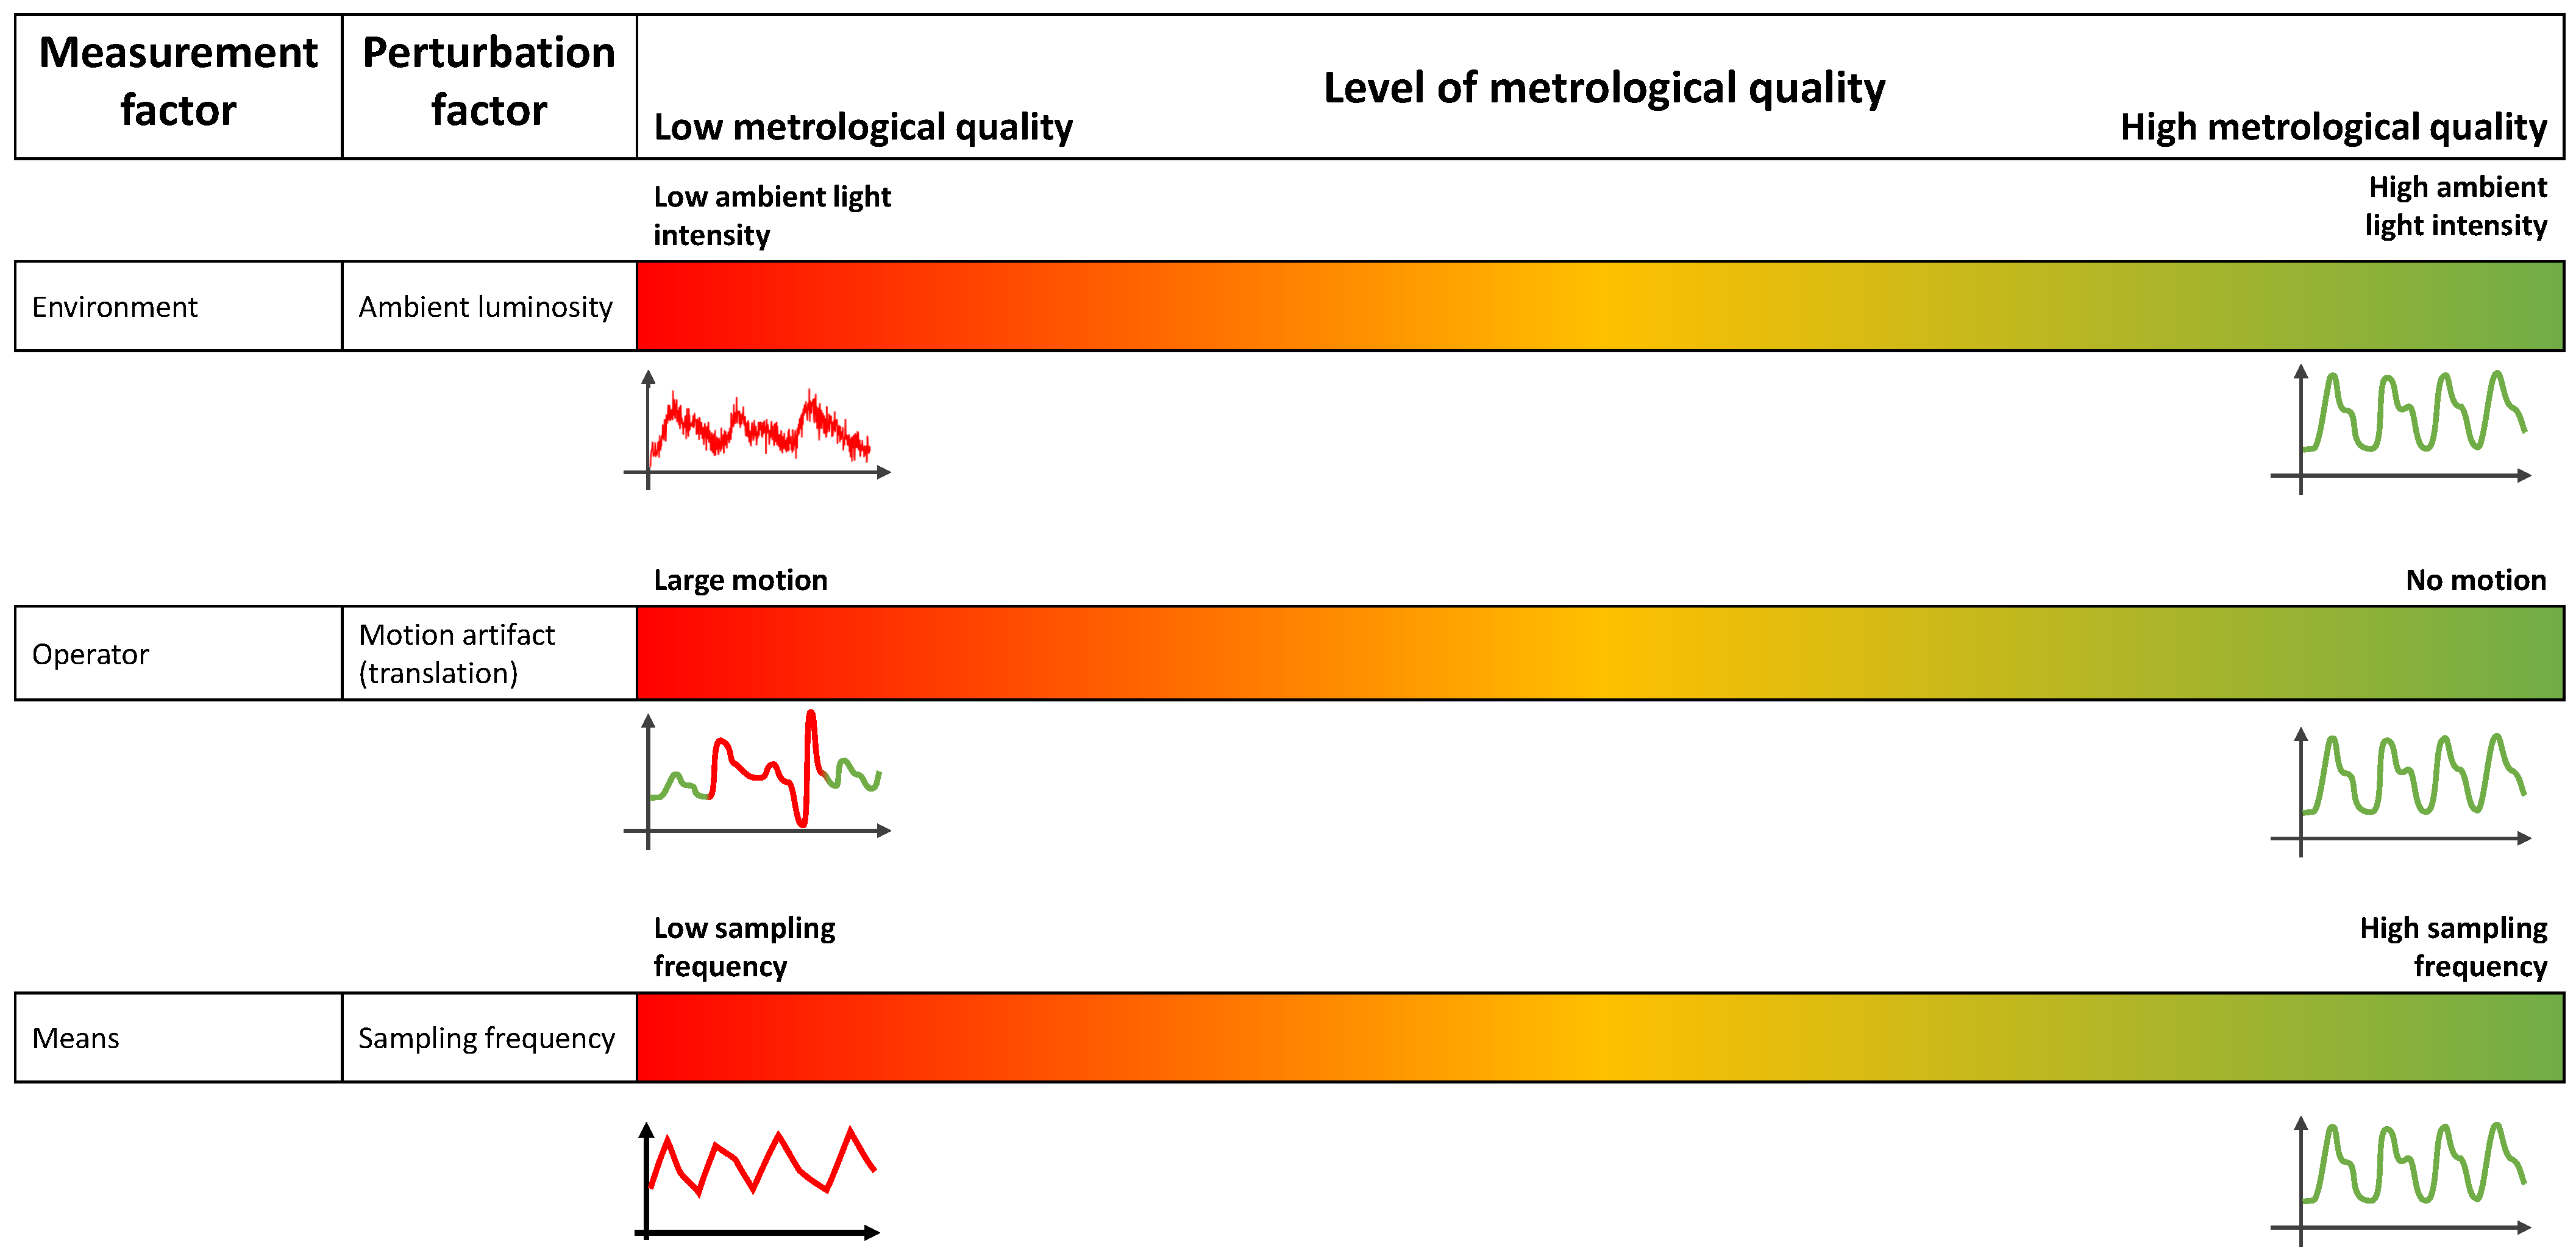
2.2. Measurement Factors Influencing a PPG Signal
- the environment: the external conditions in which the measurement is taken (e.g., temperature, pressure, ambient light, occurrence of a perturbation from the environment hiding the portion of skin in case of iPPG);
- the material: the portion of skin subjected to the measurement;
- the operator: the person performing the measurement;
- the equipment: the device used for the measurement (e.g., a pulse oximeter/smartwatch for PPG or a camera for iPPG);
- the methods: the physics behind the measurement and the algorithm dedicated to the extraction of the desired measurand and the protocol of measurement.
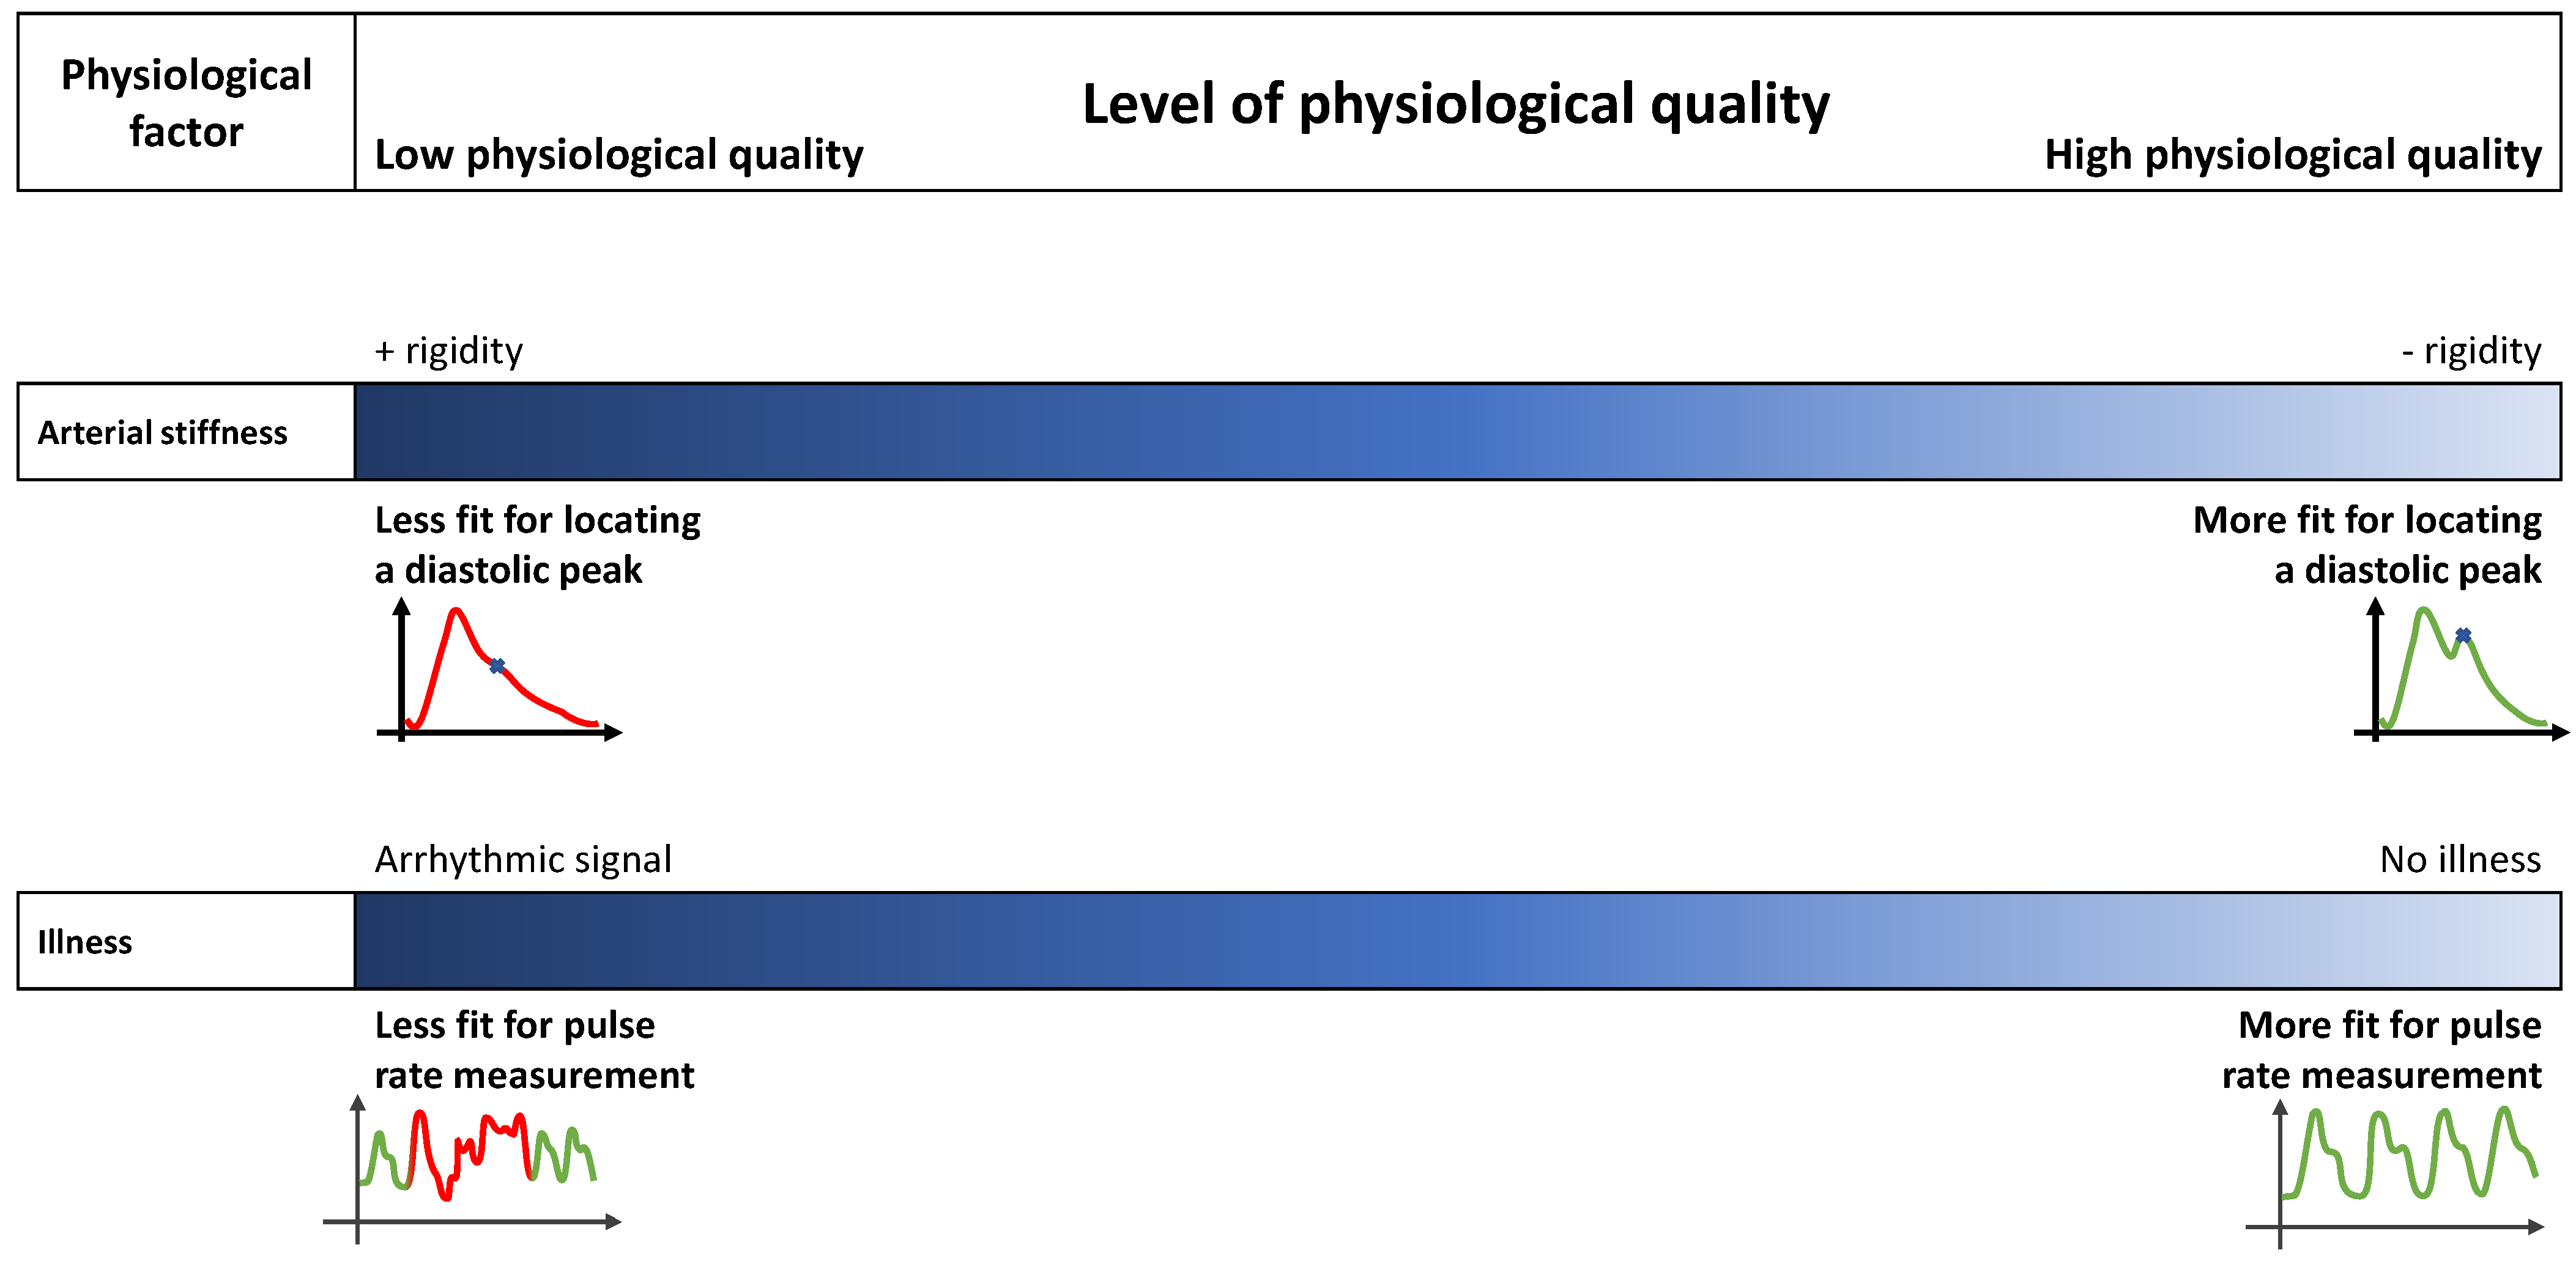
2.3. Physiological Factors Influencing a PPG Signal
3. Introduction to Signal Quality Index for Photoplethysmographic Signals
3.1. Definition of Quality
3.1.1. Metrological Quality
3.1.2. Physiological Quality
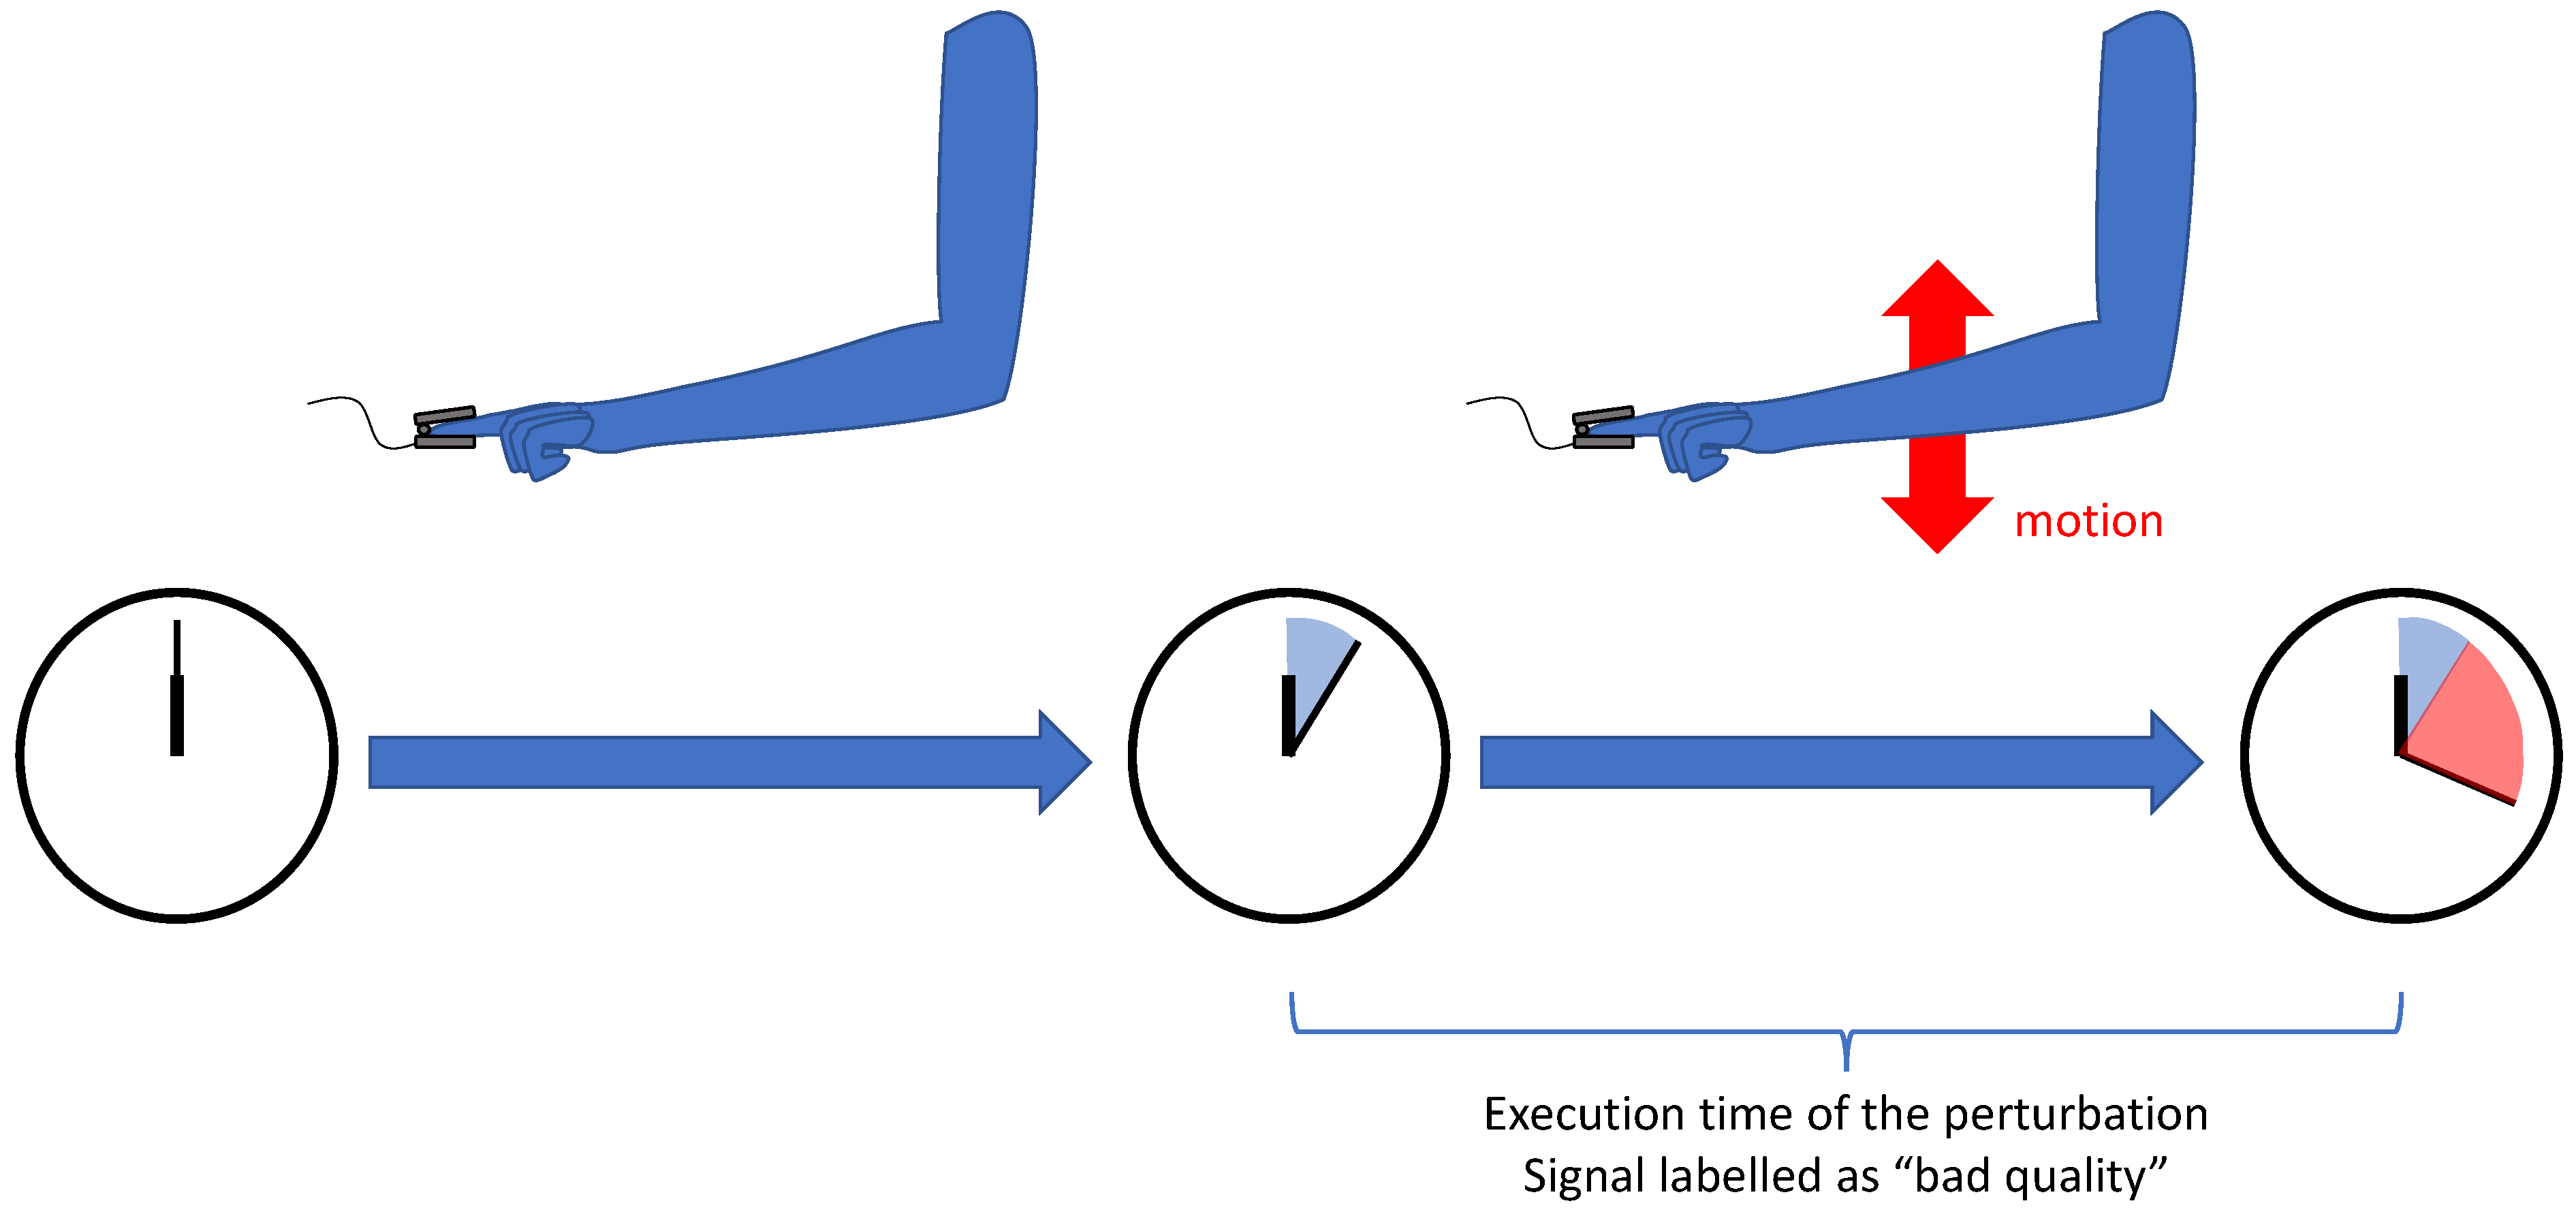
3.1.3. Annotation
- A PPG signal is a physiological signal, and evaluating its metrological quality needs the opinion of experts in the field. Consequently, the process of annotation can be expensive, and the annotation of large datasets is difficult.
- Because of its physiological nature, a PPG signal measured from a patient must be coherent with the physiological possibilities of the human body and with other physiological signals (e.g., ECG or continuous blood pressure). This coherence offers the possibility for the annotators to be guided
- –
- with a set of rules that the PPG signal must comply with;
- –
- with another physiological signal not affected by the perturbation.
3.2. Applications
- Reducing false alarms during patient monitoring;
- Presenting clean signals for experts’ interpretation;
- Cleaning datasets for machine learning applications;
- Suppressing irrelevant signals to maintain performance of physiological variable predictions;
- Integrating the SQI into the signal processing algorithm to evaluate or improve its performance.
3.2.1. Keeping or Removing PPG Signals
- Avoiding misinterpretation and false alarms from corrupted signals;
- Maintaining the performance of an application by keeping only relevant signals;
- Preparing an artifact-free dataset for the training and testing of a machine/deep learning estimator to achieve good performance [60].
3.2.2. Supporting the Signal Processing Chain
4. SQI for cPPG
4.1. Rule-Based
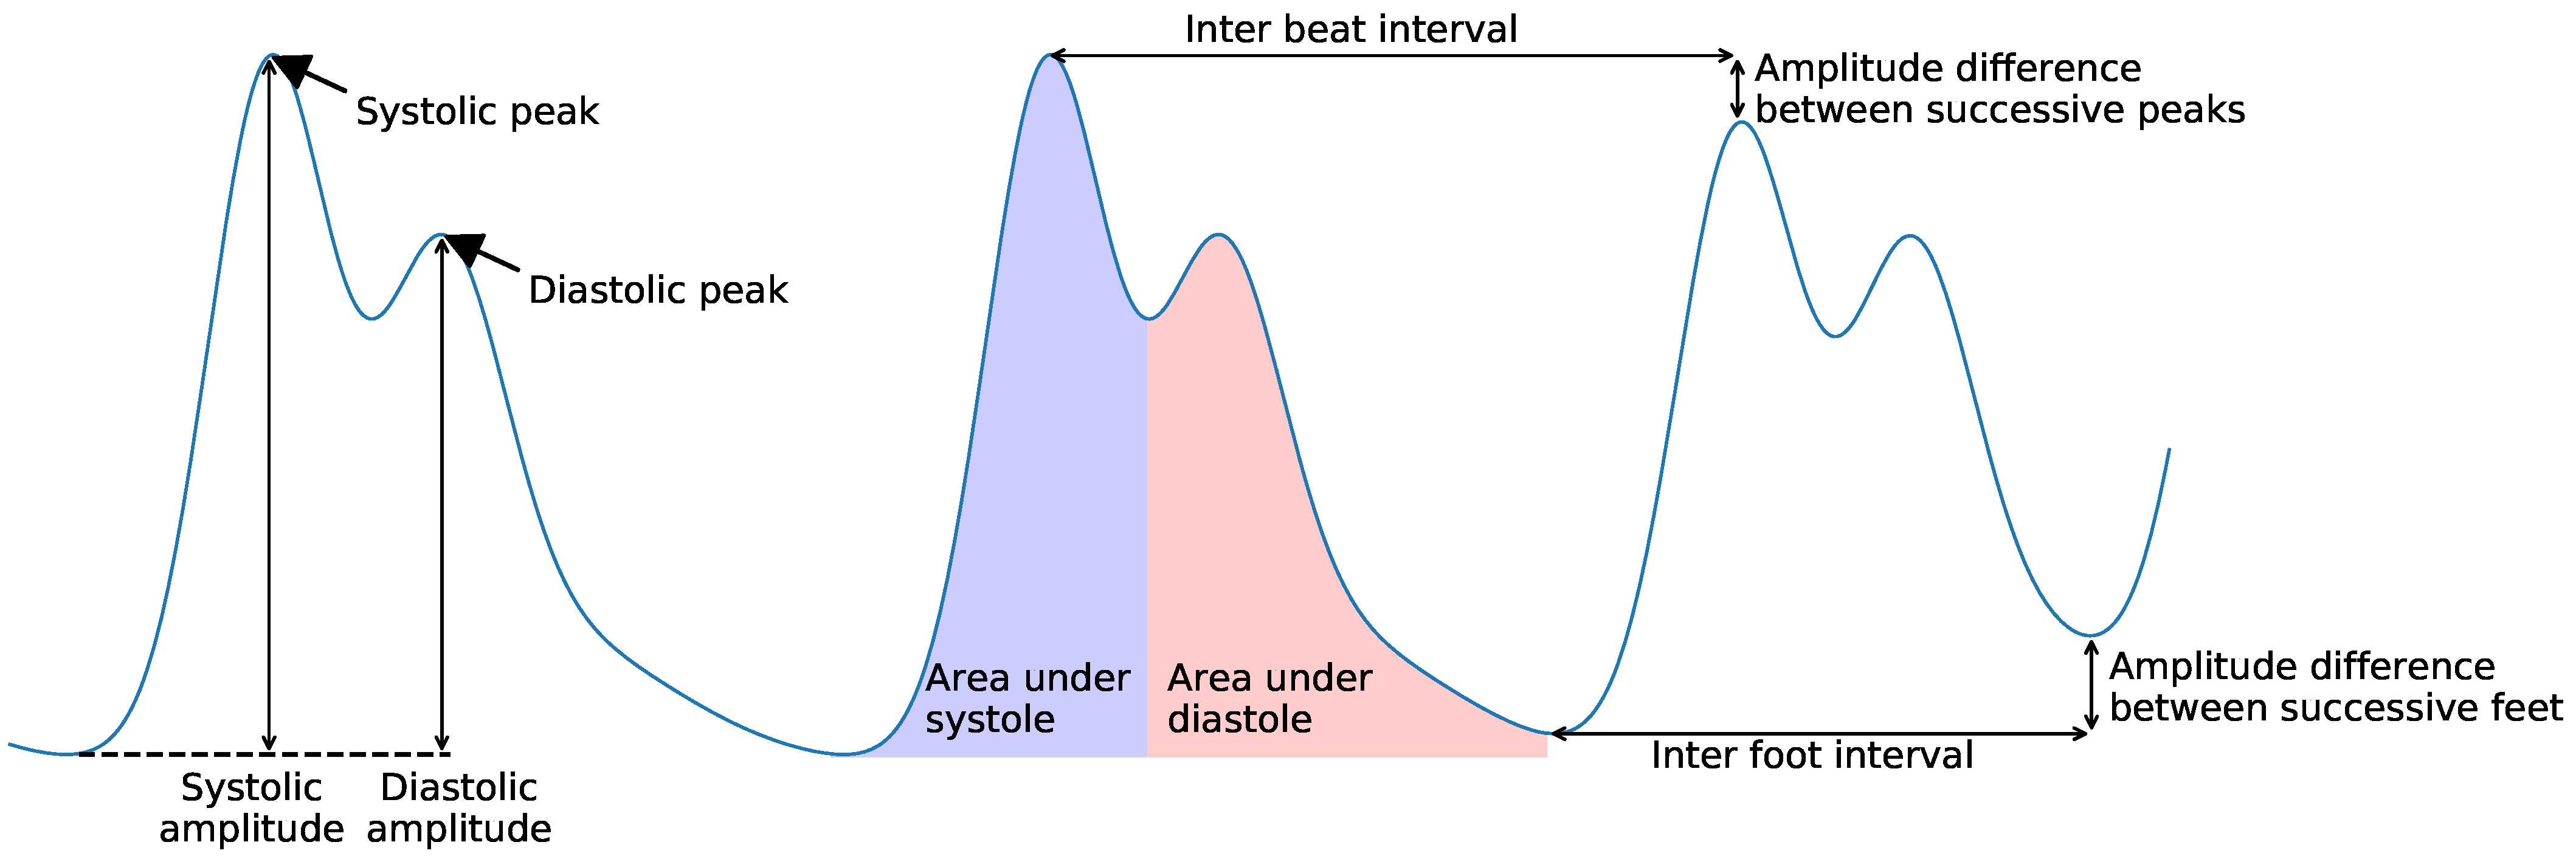
4.1.1. Criteria Based on Signal Features
4.1.2. Stability of the PPG Waveform
4.2. Machine Learning
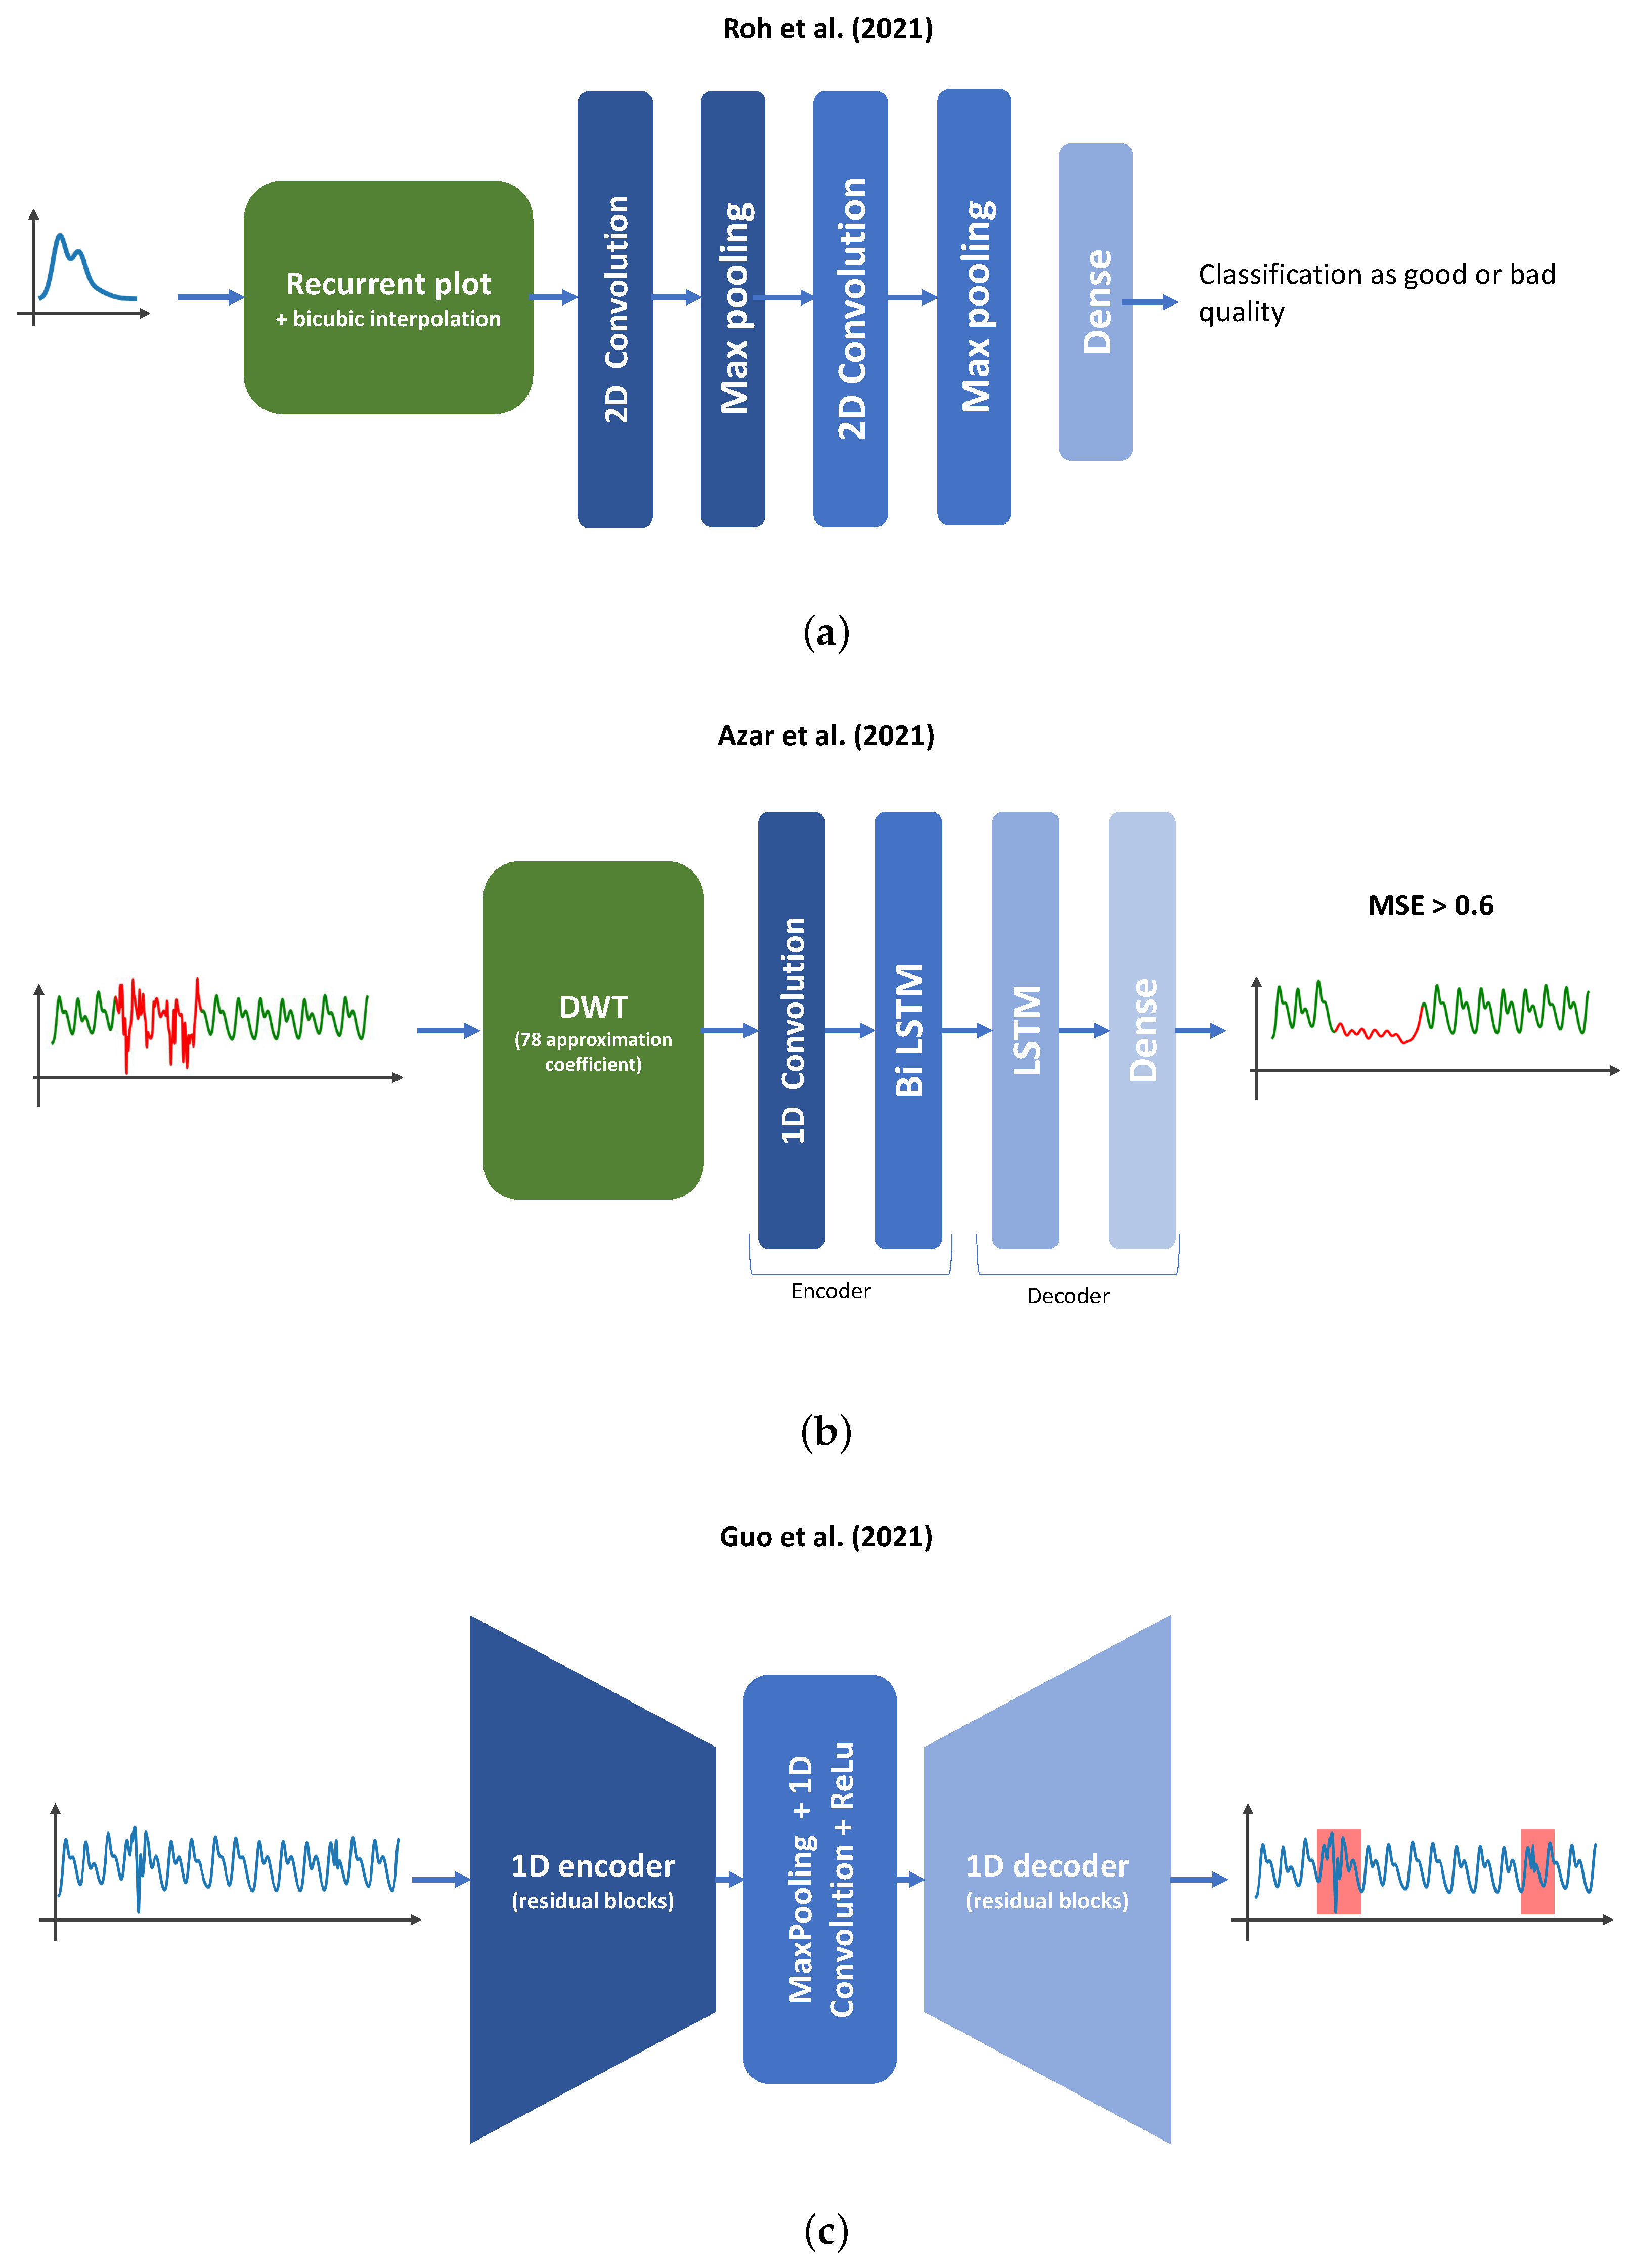
4.3. Deep Learning
5. Design of SQI for iPPG
5.1. Existing Studies
- A camera is a widely used technology allowing remote and continuous monitoring of physiological variables (e.g., PR, PRV);
- This technology imposes less constraints on the patient as the signal can be taken remotely;
- Several potential applications exist for telemedicine (e.g., PR, blood pressure, blood oxygenation).
5.2. Potential Developments in This Domain
6. Conclusions
Author Contributions
Funding
Institutional Review Board Statement
Data Availability Statement
Conflicts of Interest
Abbreviations
| CNN | convolutional neural network |
| DTW | dynamic time warping |
| DWT | discrete wavelet transform |
| HMM | hidden Markov model |
| HR | heart rate |
| HRV | heart rate variability |
| ICA | independent component analysis |
| LSTM | long short-term memory |
| MLP | multi-layer perceptron |
| PCA | principal component analysis |
| POS | plane orthogonal to skin |
| PPG | photoplethysmography |
| cPPG | contact photoplethysmography |
| iPPG | imaging photoplethysmography |
| PR | pulse rate |
| SNR | signal to noise ratio |
| SQI | signal quality index |
| SSR | spatial subspace rotation |
| SVM | support vector machine |
References
- Elgendi, M. On the Analysis of Fingertip Photoplethysmogram Signals. CCR 2012, 8, 14–25. [Google Scholar] [CrossRef] [PubMed]
- Kyriacou, P.A. Introduction to photoplethysmography. In Photoplethysmography; Elsevier: Amsterdam, The Netherlands, 2022; pp. 1–16. [Google Scholar] [CrossRef]
- Ghamari, M. A review on wearable photoplethysmography sensors and their potential future applications in health care. IJBSBE 2018, 4, 195. [Google Scholar] [CrossRef]
- Lister, T.; Wright, P.A.; Chappell, P.H. Optical properties of human skin. J. Biomed. Opt. 2012, 17, 0909011. [Google Scholar] [CrossRef] [PubMed]
- Kyriacou, P.A.; Chatterjee, S. The origin of photoplethysmography. In Photoplethysmography; Elsevier: Amsterdam, The Netherlands, 2022; pp. 17–43. [Google Scholar] [CrossRef]
- Budidha, K.; Kyriacou, P.A. Photoplethysmography technology. In Photoplethysmography; Elsevier: Amsterdam, The Netherlands, 2022; pp. 43–68. [Google Scholar] [CrossRef]
- Alian, A.A.; Shelley, K.H. PPG in clinical monitoring. In Photoplethysmography; Elsevier: Amsterdam, The Netherlands, 2022; pp. 341–359. [Google Scholar] [CrossRef]
- Nizami, S.; Green, J.R.; McGregor, C. Implementation of Artifact Detection in Critical Care: A Methodological Review. IEEE Rev. Biomed. Eng. 2013, 6, 127–142. [Google Scholar] [CrossRef] [PubMed]
- Orphanidou, C. Signal Quality Assessment in Physiological Monitoring; SpringerBriefs in Bioengineering; Springer International Publishing: Cham, Switzerland, 2018. [Google Scholar] [CrossRef]
- Mejía-Mejía, E.; Allen, J.; Budidha, K.; El-Hajj, C.; Kyriacou, P.A.; Charlton, P.H. Photoplethysmography signal processing and synthesis. In Photoplethysmography; Elsevier: Amsterdam, The Netherlands, 2022; pp. 69–146. [Google Scholar] [CrossRef]
- Park, J.; Seok, H.S.; Kim, S.S.; Shin, H. Photoplethysmogram Analysis and Applications: An Integrative Review. Front. Physiol. 2022, 12, 808451. [Google Scholar] [CrossRef]
- Maeda, Y.; Sekine, M.; Tamura, T. Relationship Between Measurement Site and Motion Artifacts in Wearable Reflected Photoplethysmography. J. Med. Syst. 2011, 35, 969–976. [Google Scholar] [CrossRef]
- Jihyoung, L.; Matsumura, K.; Yamakoshi, K.i.; Rolfe, P.; Tanaka, S.; Yamakoshi, T. Comparison between red, green and blue light reflection photoplethysmography for heart rate monitoring during motion. In Proceedings of the 2013 35th Annual International Conference of the IEEE Engineering in Medicine and Biology Society (EMBC), Osaka, Japan, 3–7 July 2013; pp. 1724–1727. [Google Scholar] [CrossRef]
- Almarshad, M.A.; Islam, M.S.; Al-Ahmadi, S.; BaHammam, A.S. Diagnostic Features and Potential Applications of PPG Signal in Healthcare: A Systematic Review. Healthcare 2022, 10, 547. [Google Scholar] [CrossRef]
- Tamura, T. Current progress of photoplethysmography and SPO2 for health monitoring. Biomed. Eng. Lett. 2019, 9, 21–36. [Google Scholar] [CrossRef]
- Wesseling, K.H.; Settels, J.J.; de Wit, B. The Measurement of Continuous Finger Arterial Pressure Noninvasively in Stationary Subjects. In Biological and Psychological Factors in Cardiovascular Disease; Schmidt, T.H., Dembroski, T.M., Blümchen, G., Eds.; Springer: Berlin/Heidelberg, Germany, 1986; pp. 355–375. [Google Scholar] [CrossRef]
- Allen, J. Photoplethysmography for the assessment of peripheral vascular disease. In Photoplethysmography; Elsevier: Amsterdam, The Netherlands, 2022; pp. 189–235. [Google Scholar] [CrossRef]
- Pereira, T.; Tran, N.; Gadhoumi, K.; Pelter, M.M.; Do, D.H.; Lee, R.J.; Colorado, R.; Meisel, K.; Hu, X. Photoplethysmography based atrial fibrillation detection: A review. Npj Digit. Med. 2020, 3, 3. [Google Scholar] [CrossRef]
- Liu, Z.; Zhou, B.; Jiang, Z.; Chen, X.; Li, Y.; Tang, M.; Miao, F. Multiclass Arrhythmia Detection and Classification From Photoplethysmography Signals Using a Deep Convolutional Neural Network. JAHA 2022, 11, e023555. [Google Scholar] [CrossRef]
- May, J.M.; Mejía-Mejía, E.; Nomoni, M.; Budidha, K.; Choi, C.; Kyriacou, P.A. Effects of Contact Pressure in Reflectance Photoplethysmography in an In Vitro Tissue-Vessel Phantom. Sensors 2021, 21, 8421. [Google Scholar] [CrossRef] [PubMed]
- Mironenko, Y.; Kalinin, K.; Kopeliovich, M.; Petrushan, M. Remote Photoplethysmography: Rarely Considered Factors. In Proceedings of the 2020 IEEE/CVF Conference on Computer Vision and Pattern Recognition Workshops (CVPRW), Seattle, WA, USA, 14–19 June 2020; pp. 1197–1206. [Google Scholar] [CrossRef]
- Khan, M.; Pretty, C.G.; Amies, A.C.; Elliott, R.; Shaw, G.M.; Chase, J.G. Investigating the Effects of Temperature on Photoplethysmography. IFAC-PapersOnLine 2015, 48, 360–365. [Google Scholar] [CrossRef]
- Wang, W.; Shan, C. Impact of makeup on remote-PPG monitoring. Biomed. Phys. Eng. Express 2020, 6, 035004. [Google Scholar] [CrossRef] [PubMed]
- Moço, A.V.; Stuijk, S.; de Haan, G. Motion robust PPG-imaging through color channel mapping. Biomed. Opt. Express 2016, 7, 1737. [Google Scholar] [CrossRef]
- Hartmann, V.; Liu, H.; Chen, F.; Qiu, Q.; Hughes, S.; Zheng, D. Quantitative Comparison of Photoplethysmographic Waveform Characteristics: Effect of Measurement Site. Front. Physiol. 2019, 10, 198. [Google Scholar] [CrossRef]
- Budidha, K.; Kyriacou, P.A. Photoplethysmography for Quantitative Assessment of Sympathetic Nerve Activity (SNA) During Cold Stress. Front. Physiol. 2019, 9, 1863. [Google Scholar] [CrossRef]
- Trumpp, A.; Schell, J.; Malberg, H.; Zaunseder, S. Vasomotor assessment by camera-based photoplethysmography. Curr. Dir. Biomed. Eng. 2016, 2, 199–202. [Google Scholar] [CrossRef]
- Bousefsaf, F.; Maaoui, C.; Pruski, A. Peripheral vasomotor activity assessment using a continuous wavelet analysis on webcam photoplethysmographic signals. BME 2016, 27, 527–538. [Google Scholar] [CrossRef]
- Fine, J.; Branan, K.L.; Rodriguez, A.J.; Boonya-Ananta, T.; Ramella-Roman, J.C.; McShane, M.J.; Coté, G.L. Sources of Inaccuracy in Photoplethysmography for Continuous Cardiovascular Monitoring. Biosensors 2021, 11, 126. [Google Scholar] [CrossRef]
- Djeldjli, D.; Bousefsaf, F.; Maaoui, C.; Bereksi-Reguig, F.; Pruski, A. Remote estimation of pulse wave features related to arterial stiffness and blood pressure using a camera. Biomed. Signal Process. Control. 2021, 64, 102242. [Google Scholar] [CrossRef]
- Xu, G.; Dong, L.; Yuan, J.; Zhao, Y.; Liu, M.; Hui, M.; Zhao, Y.; Kong, L. Rational selection of RGB channels for disease classification based on IPPG technology. Biomed. Opt. Express 2022, 13, 1820. [Google Scholar] [CrossRef] [PubMed]
- van Gastel, M.; Stuijk, S.; de Haan, G. Robust respiration detection from remote photoplethysmography. Biomed. Opt. Express 2016, 7, 4941. [Google Scholar] [CrossRef] [PubMed]
- Nowara, E.M.; McDuff, D.; Veeraraghavan, A. A Meta-Analysis of the Impact of Skin Type and Gender on Non-contact Photoplethysmography Measurements. In Proceedings of the 2020 IEEE/CVF Conference on Computer Vision and Pattern Recognition Workshops (CVPRW), Seattle, WA, USA, 14–19 June 2020; pp. 1148–1155. [Google Scholar] [CrossRef]
- Seok, D.; Lee, S.; Kim, M.; Cho, J.; Kim, C. Motion Artifact Removal Techniques for Wearable EEG and PPG Sensor Systems. Front. Electron. 2021, 2, 685513. [Google Scholar] [CrossRef]
- Chong, J.W.; Dao, D.K.; Salehizadeh, S.M.A.; McManus, D.D.; Darling, C.E.; Chon, K.H.; Mendelson, Y. Photoplethysmograph Signal Reconstruction Based on a Novel Hybrid Motion Artifact Detection–Reduction Approach. Part I: Motion and Noise Artifact Detection. Ann. Biomed. Eng. 2014, 42, 2238–2250. [Google Scholar] [CrossRef]
- Dao, D.; Salehizadeh, S.M.A.; Noh, Y.; Chong, J.W.; Cho, C.H.; McManus, D.; Darling, C.E.; Mendelson, Y.; Chon, K.H. A Robust Motion Artifact Detection Algorithm for Accurate Detection of Heart Rates From Photoplethysmographic Signals Using Time–Frequency Spectral Features. IEEE J. Biomed. Health Inform. 2017, 21, 1242–1253. [Google Scholar] [CrossRef]
- Vandecasteele, K.; Lázaro, J.; Cleeren, E.; Claes, K.; Van Paesschen, W.; Van Huffel, S.; Hunyadi, B. Artifact Detection of Wrist Photoplethysmograph Signals. In Proceedings of the 11th International Joint Conference on Biomedical Engineering Systems and Technologies, SCITEPRESS-Science and Technology Publications, Funchal, Portugal, 19–21 January 2018; pp. 182–189. [Google Scholar] [CrossRef]
- Naeini, E.K.; Azimi, I.; Rahmani, A.M.; Liljeberg, P.; Dutt, N. A Real-time PPG Quality Assessment Approach for Healthcare Internet-of-Things. Procedia Comput. Sci. 2019, 151, 551–558. [Google Scholar] [CrossRef]
- Liu, S.H.; Wang, J.J.; Chen, W.; Pan, K.L.; Su, C.H. Classification of Photoplethysmographic Signal Quality with Fuzzy Neural Network for Improvement of Stroke Volume Measurement. Appl. Sci. 2020, 10, 1476. [Google Scholar] [CrossRef]
- Liu, S.H.; Li, R.X.; Wang, J.J.; Chen, W.; Su, C.H. Classification of Photoplethysmographic Signal Quality with Deep Convolution Neural Networks for Accurate Measurement of Cardiac Stroke Volume. Appl. Sci. 2020, 10, 4612. [Google Scholar] [CrossRef]
- Gao, H.; Wu, X.; Shi, C.; Gao, Q.; Geng, J. A LSTM-Based Realtime Signal Quality Assessment for Photoplethysmogram and Remote Photoplethysmogram. In Proceedings of the 2021 IEEE/CVF Conference on Computer Vision and Pattern Recognition Workshops (CVPRW), Nashville, TN, USA, 19–25 June 2021; pp. 3826–3835. [Google Scholar] [CrossRef]
- Li, Q.; Clifford, G.D. Dynamic time warping and machine learning for signal quality assessment of pulsatile signals. Physiol. Meas. 2012, 33, 1491–1501. [Google Scholar] [CrossRef]
- Karlen, W.; Kobayashi, K.; Ansermino, J.M.; Dumont, G.A. Photoplethysmogram signal quality estimation using repeated Gaussian filters and cross-correlation. Physiol. Meas. 2012, 33, 1617–1629. [Google Scholar] [CrossRef]
- Fischer, C.; Domer, B.; Wibmer, T.; Penzel, T. An Algorithm for Real-Time Pulse Waveform Segmentation and Artifact Detection in Photoplethysmograms. IEEE J. Biomed. Health Inform. 2017, 21, 372–381. [Google Scholar] [CrossRef] [PubMed]
- Fischer, C.; Glos, M.; Penzel, T.; Fietze, I. Extended algorithm for real-time pulse waveform segmentation and artifact detection in photoplethysmograms. Somnologie 2017, 21, 110–120. [Google Scholar] [CrossRef]
- Sabeti, E.; Reamaroon, N.; Mathis, M.; Gryak, J.; Sjoding, M.; Najarian, K. Signal quality measure for pulsatile physiological signals using morphological features: Applications in reliability measure for pulse oximetry. Inform. Med. Unlocked 2019, 16, 100222. [Google Scholar] [CrossRef]
- Pradhan, N.; Rajan, S.; Adler, A. Evaluation of the signal quality of wrist-based photoplethysmography. Physiol. Meas. 2019, 40, 065008. [Google Scholar] [CrossRef] [PubMed]
- Sappia, M.S.; Hakimi, N.; Colier, W.N.J.M.; Horschig, J.M. Signal quality index: An algorithm for quantitative assessment of functional near infrared spectroscopy signal quality. Biomed. Opt. Express 2020, 11, 6732–6754. [Google Scholar] [CrossRef] [PubMed]
- Soto, J.T.; Ashley, E. DeepBeat: A multi-task deep learning approach to assess signal quality and arrhythmia detection in wearable devices. arXiv 2020, arXiv:2001.00155. [Google Scholar]
- Mahmoudzadeh, A.; Azimi, I.; Rahmani, A.M.; Liljeberg, P. Lightweight Photoplethysmography Quality Assessment for Real-time IoT-based Health Monitoring using Unsupervised Anomaly Detection. Procedia Comput. Sci. 2021, 184, 140–147. [Google Scholar] [CrossRef]
- Elgendi, M. Optimal Signal Quality Index for Photoplethysmogram Signals. Bioengineering 2016, 3, 21. [Google Scholar] [CrossRef]
- Pereira, T.; Gadhoumi, K.; Ma, M.; Colorado, R.; J Keenan, K.; Meisel, K.; Hu, X. Robust Assessment of Photoplethysmogram Signal Quality in the Presence of Atrial Fibrillation. In Proceedings of the 2018 Computing in Cardiology Conference (CinC), Maastricht, The Netherlands, 23–26 September 2018. [Google Scholar] [CrossRef]
- Seok, H.S.; Han, S.; Park, J.; Roh, D.; Shin, H. Photoplethysmographic Pulse Quality Assessment Methods Based on Similarity Analysis. In Proceedings of the 2018 Joint 10th International Conference on Soft Computing and Intelligent Systems (SCIS) and 19th International Symposium on Advanced Intelligent Systems (ISIS), Toyama, Japan, 5–8 December 2018; pp. 350–353. [Google Scholar] [CrossRef]
- Roh, D.; Shin, H. Recurrence Plot and Machine Learning for Signal Quality Assessment of Photoplethysmogram in Mobile Environment. Sensors 2021, 21, 2188. [Google Scholar] [CrossRef]
- Pereira, T.; Ding, C.; Gadhoumi, K.; Tran, N.; Colorado, R.A.; Meisel, K.; Hu, X. Deep learning approaches for plethysmography signal quality assessment in the presence of atrial fibrillation. Physiol. Meas. 2019, 40, 125002. [Google Scholar] [CrossRef]
- Guo, Z.; Ding, C.; Hu, X.; Rudin, C. A supervised machine learning semantic segmentation approach for detecting artifacts in plethysmography signals from wearables. Physiol. Meas. 2021, 42, 125003. [Google Scholar] [CrossRef] [PubMed]
- Krishnan, R.; Natarajan, B.; Warren, S. Analysis and detection of motion artifact in photoplethysmographic data using higher order statistics. In Proceedings of the 2008 IEEE International Conference on Acoustics, Speech and Signal Processing, Las Vegas, NV, USA, 31 March–4 April 2008; pp. 613–616, ISSN 1520-6149. [Google Scholar] [CrossRef]
- Selvaraj, N.; Mendelson, Y.; Shelley, K.H.; Silverman, D.G.; Chon, K.H. Statistical approach for the detection of motion/noise artifacts in Photoplethysmogram. In Proceedings of the 2011 Annual International Conference of the IEEE Engineering in Medicine and Biology Society, Boston, MA, USA, 30 August–3 September 2011; pp. 4972–4975. [Google Scholar] [CrossRef]
- Tabei, F.; Kumar, R.; Phan, T.N.; McManus, D.D.; Chong, J.W. A Novel Personalized Motion and Noise Artifact (MNA) Detection Method for Smartphone Photoplethysmograph (PPG) Signals. IEEE Access 2018, 6, 60498–60512. [Google Scholar] [CrossRef] [PubMed]
- Salah, M.; Omer, O.A.; Hassan, L.; Ragab, M.; Hassan, A.M.; Abdelreheem, A. Beat-Based PPG-ABP Cleaning Technique for Blood Pressure Estimation. IEEE Access 2022, 10, 55616–55626. [Google Scholar] [CrossRef]
- Benezeth, Y.; Bobbia, S.; Nakamura, K.; Gomez, R.; Dubois, J. Probabilistic Signal Quality Metric for Reduced Complexity Unsupervised Remote Photoplethysmography. In Proceedings of the 2019 13th International Symposium on Medical Information and Communication Technology (ISMICT), Oslo, Norway, 8–10 May 2019; pp. 1–5. [Google Scholar] [CrossRef]
- Wang, W.; den Brinker, A.C.; Stuijk, S.; de Haan, G. Algorithmic Principles of Remote PPG. IEEE Trans. Biomed. Eng. 2017, 64, 1479–1491. [Google Scholar] [CrossRef]
- de Haan, G.; Jeanne, V. Robust Pulse Rate From Chrominance-Based rPPG. IEEE Trans. Biomed. Eng. 2013, 60, 2878–2886. [Google Scholar] [CrossRef] [PubMed]
- Wang, W.; Stuijk, S.; de Haan, G. A Novel Algorithm for Remote Photoplethysmography: Spatial Subspace Rotation. IEEE Trans. Biomed. Eng. 2016, 63, 1974–1984. [Google Scholar] [CrossRef] [PubMed]
- Li, Q.; Clifford, G.D. Signal quality and data fusion for false alarm reduction in the intensive care unit. J. Electrocardiol. 2012, 45, 596–603. [Google Scholar] [CrossRef]
- Narendra Kumar Reddy, G.; Sabarimalai Manikandan, M.; Narasimha Murty, N.V.L. On-Device Integrated PPG Quality Assessment and Sensor Disconnection/Saturation Detection System for IoT Health Monitoring. IEEE Trans. Instrum. Meas. 2020, 69, 6351–6361. [Google Scholar] [CrossRef]
- Aliamiri, A.; Shen, Y. Deep learning based atrial fibrillation detection using wearable photoplethysmography sensor. In Proceedings of the 2018 IEEE EMBS International Conference on Biomedical & Health Informatics (BHI), Las Vegas, NV, USA, 4–7 March 2018; pp. 442–445. [Google Scholar] [CrossRef]
- Sukor, J.A.; Redmond, S.J.; Lovell, N.H. Signal quality measures for pulse oximetry through waveform morphology analysis. Physiol. Meas. 2011, 32, 369–384. [Google Scholar] [CrossRef]
- Couceiro, R.; Carvalho, P.; Paiva, R.P.; Henriques, J.; Muehlsteff, J. Detection of motion artifact patterns in photoplethysmographic signals based on time and period domain analysis. Physiol. Meas. 2014, 35, 2369–2388. [Google Scholar] [CrossRef]
- Orphanidou, C.; Bonnici, T.; Charlton, P.; Clifton, D.; Vallance, D.; Tarassenko, L. Signal Quality Indices for the Electrocardiogram and Photoplethysmogram: Derivation and Applications to Wireless Monitoring. IEEE J. Biomed. Health Inform. 2014, 19, 832. [Google Scholar] [CrossRef] [PubMed]
- Vila, G.; Godin, C.; Charbonnier, S.; Campagne, A. Real-Time Quality Index to Control Data Loss in Real-Life Cardiac Monitoring Applications. Sensors 2021, 21, 5357. [Google Scholar] [CrossRef] [PubMed]
- Hao, J.; Bo, G. A Quality Assessment System for PPG Waveform. In Proceedings of the 2021 IEEE 3rd International Conference on Circuits and Systems (ICCS), Chengdu, China, 29–31 October 2021; pp. 170–175. [Google Scholar] [CrossRef]
- Roy, M.S.; Gupta, R.; Sharma, K.D. Photoplethysmogram Signal Quality Evaluation by Unsupervised Learning Approach. In Proceedings of the 2020 IEEE Applied Signal Processing Conference (ASPCON), Kolkata, India, 7–9 October 2020; pp. 6–10. [Google Scholar] [CrossRef]
- Bashar, S.K.; Han, D.; Ding, E.; Whitcomb, C.; McManus, D.D.; Chon, K.H. Smartwatch Based Atrial Fibrillation Detection from Photoplethysmography Signals. Annu. Int. Conf. IEEE Eng. Med. Biol. Soc. 2019, 2019, 4306–4309. [Google Scholar] [CrossRef]
- Bashar, S.K.; Han, D.; Soni, A.; McManus, D.D.; Chon, K.H. Developing a novel noise artifact detection algorithm for smartphone PPG signals: Preliminary results. In Proceedings of the 2018 IEEE EMBS International Conference on Biomedical & Health Informatics (BHI), Las Vegas, NV, USA, 4–7 March 2018; pp. 79–82. [Google Scholar] [CrossRef]
- John, A.; Cardiff, B.; John, D. A Generalized Signal Quality Estimation Method for IoT Sensors. In Proceedings of the 2020 IEEE International Symposium on Circuits and Systems (ISCAS), Seville, Spain, 12–14 October 2020; pp. 1–5. [Google Scholar] [CrossRef]
- Papini, G.B.; Fonseca, P.; Aubert, X.L.; Overeem, S.; Bergmans, J.W.; Vullings, R. Photoplethysmography beat detection and pulse morphology quality assessment for signal reliability estimation. In Proceedings of the 2017 39th Annual International Conference of the IEEE Engineering in Medicine and Biology Society (EMBC), Jeju, Korea, 11–15 July 2017; pp. 117–120. [Google Scholar] [CrossRef]
- Papini, G.B.; Fonseca, P.; Eerikäinen, L.M.; Overeem, S.; Bergmans, J.W.M.; Vullings, R. Sinus or not: A new beat detection algorithm based on a pulse morphology quality index to extract normal sinus rhythm beats from wrist-worn photoplethysmography recordings. Physiol. Meas. 2018, 39, 115007. [Google Scholar] [CrossRef] [PubMed]
- Li, H.; Huang, S. A High-Efficiency and Real-Time Method for Quality Evaluation of PPG Signals. IOP Conf. Ser. Mater. Sci. Eng. 2020, 711, 012100. [Google Scholar] [CrossRef]
- Petitjean, F.; Ketterlin, A.; Gançarski, P. A global averaging method for dynamic time warping, with applications to clustering. Pattern Recognit. 2011, 44, 678–693. [Google Scholar] [CrossRef]
- Lim, P.K.; Ng, S.C.; Lovell, N.H.; Yu, Y.P.; Tan, M.P.; McCombie, D.; Lim, E.; Redmond, S.J. Adaptive template matching of photoplethysmogram pulses to detect motion artefact. Physiol. Meas. 2018, 39, 105005. [Google Scholar] [CrossRef]
- Saeed, M.; Villarroel, M.; Reisner, A.T.; Clifford, G.; Lehman, L.W.; Moody, G.; Heldt, T.; Kyaw, T.H.; Moody, B.; Mark, R.G. Multiparameter Intelligent Monitoring in Intensive Care II: A public-access intensive care unit database. Crit. Care Med. 2011, 39, 952–960. [Google Scholar] [CrossRef]
- Karlen, W.; Raman, S.; Ansermino, J.M.; Dumont, G.A. Multiparameter Respiratory Rate Estimation From the Photoplethysmogram. IEEE Trans. Biomed. Eng. 2013, 60, 1946–1953. [Google Scholar] [CrossRef]
- Aboy, M.; McNames, J.; Thong, T.; Tsunami, D.; Ellenby, M.; Goldstein, B. An Automatic Beat Detection Algorithm for Pressure Signals. IEEE Trans. Biomed. Eng. 2005, 52, 1662–1670. [Google Scholar] [CrossRef]
- Jarchi, D.; Casson, A. Description of a Database Containing Wrist PPG Signals Recorded during Physical Exercise with Both Accelerometer and Gyroscope Measures of Motion. Data 2016, 2, 1. [Google Scholar] [CrossRef]
- Zhang, Z.; Pi, Z.; Liu, B. TROIKA: A General Framework for Heart Rate Monitoring Using Wrist-Type Photoplethysmographic Signals During Intensive Physical Exercise. IEEE Trans. Biomed. Eng. 2015, 62, 522–531. [Google Scholar] [CrossRef] [PubMed]
- Pereira, T.; Gadhoumi, K.; Ma, M.; Liu, X.; Xiao, R.; Colorado, R.A.; Keenan, K.J.; Meisel, K.; Hu, X. A Supervised Approach to Robust Photoplethysmography Quality Assessment. IEEE J. Biomed. Health Inform. 2020, 24, 649–657. [Google Scholar] [CrossRef] [PubMed]
- Behar, J.; Oster, J.; Qiao, L.; Clifford, G.D. ECG Signal Quality During Arrhythmia and Its Application to False Alarm Reduction. IEEE Trans. Biomed. Eng. 2013, 60, 1660–1666. [Google Scholar] [CrossRef]
- Scalzo, F.; Xu, P.; Asgari, S.; Bergsneider, M.; Hu, X. Regression analysis for peak designation in pulsatile pressure signals. Med. Biol. Eng. Comput. 2009, 47, 967–977. [Google Scholar] [CrossRef]
- Liu, C.; Li, Q.; Clifford, G. Evaluation of the Accuracy and Noise Response of an Open:source Pulse Onset Detection Algorithm on Pulsatile Waveform Databases. In Proceedings of the 2016 Computing in Cardiology Conference (CinC), Vancouver, BC, Canada, 11–14 September 2016. [Google Scholar] [CrossRef]
- Goh, C.H.; Tan, L.K.; Lovell, N.H.; Ng, S.C.; Tan, M.P.; Lim, E. Robust PPG motion artifact detection using a 1-D convolution neural network. Comput. Methods Programs Biomed. 2020, 196, 105596. [Google Scholar] [CrossRef]
- Azar, J.; Makhoul, A.; Couturier, R.; Demerjian, J. Deep recurrent neural network-based autoencoder for photoplethysmogram artifacts filtering. Comput. Electr. Eng. 2021, 92, 107065. [Google Scholar] [CrossRef]
- Zhang, O.; Ding, C.; Pereira, T.; Xiao, R.; Gadhoumi, K.; Meisel, K.; Lee, R.J.; Chen, Y.; Hu, X. Explainability Metrics of Deep Convolutional Networks for Photoplethysmography Quality Assessment. IEEE Access 2021, 9, 29736–29745. [Google Scholar] [CrossRef]
- Reiss, A.; Indlekofer, I.; Schmidt, P.; Van Laerhoven, K. Deep PPG: Large-Scale Heart Rate Estimation with Convolutional Neural Networks. Sensors 2019, 19, 3079. [Google Scholar] [CrossRef]
- Kachuee, M.; Kiani, M.M.; Mohammadzade, H.; Shabany, M. Cuff-less high-accuracy calibration-free blood pressure estimation using pulse transit time. In Proceedings of the 2015 IEEE International Symposium on Circuits and Systems (ISCAS), Lisbon, Portugal, 24–27 May 2015; pp. 1006–1009. [Google Scholar] [CrossRef]
- Sun, Y.; Thakor, N. Photoplethysmography Revisited: From Contact to Noncontact, From Point to Imaging. IEEE Trans. Biomed. Eng. 2016, 63, 463–477. [Google Scholar] [CrossRef]
- Macwan, R.; Bobbia, S.; Benezeth, Y.; Dubois, J.; Mansouri, A. Periodic Variance Maximization Using Generalized Eigenvalue Decomposition Applied to Remote Photoplethysmography Estimation. In Proceedings of the 2018 IEEE/CVF Conference on Computer Vision and Pattern Recognition Workshops (CVPRW), Salt Lake City, UT, USA, 18–22 June 2018; pp. 1413–14138. [Google Scholar] [CrossRef]
- Bobbia, S.; Luguern, D.; Benezeth, Y.; Nakamura, K.; Gomez, R.; Dubois, J. Real-Time Temporal Superpixels for Unsupervised Remote Photoplethysmography. In Proceedings of the 2018 IEEE/CVF Conference on Computer Vision and Pattern Recognition Workshops (CVPRW), Salt Lake City, UT, USA, 18–22 June 2018; pp. 1422–14227. [Google Scholar] [CrossRef]
- Botina-Monsalve, D.; Benezeth, Y.; Macwan, R.; Pierrart, P.; Parra, F.; Nakamura, K.; Gomez, R.; Miteran, J. Long Short-Term Memory Deep-Filter in Remote Photoplethysmography. In Proceedings of the 2020 IEEE/CVF Conference on Computer Vision and Pattern Recognition Workshops (CVPRW), Seattle, WA, USA, 14–19 June 2020; pp. 1242–1249. [Google Scholar] [CrossRef]
- Fallet, S.; Schoenenberger, Y.; Martin, L.; Braun, F.; Moser, V.; Vesin, J.M. Imaging Photoplethysmography: A Real-time Signal Quality Index. In Proceedings of the 2017 Computing in Cardiology (CinC), Rennes, France, 24–27 September 2017. [Google Scholar] [CrossRef]
- Ernst, H.; Malberg, H.; Schmidt, M. More Reliable Remote Heart Rate Measurement by Signal Quality Indexes. In Proceedings of the 2020 Computing in Cardiology, Rimini, Italy, 13–16 September 2020. [Google Scholar] [CrossRef]
- Wang, W.; den Brinker, A.C.; Stuijk, S.; de Haan, G. Amplitude-selective filtering for remote-PPG. Biomed. Opt. Express 2017, 8, 1965. [Google Scholar] [CrossRef] [PubMed]
- Welch, P. The use of fast Fourier transform for the estimation of power spectra: A method based on time averaging over short, modified periodograms. IEEE Trans. Audio Electroacoust. 1967, 15, 70–73. [Google Scholar] [CrossRef]
- Tyapochkin, K.; Smorodnikova, E.; Pravdin, P. Smartphone PPG: Signal processing, quality assessment, and impact on HRV parameters. In Proceedings of the 2019 41st Annual International Conference of the IEEE Engineering in Medicine and Biology Society (EMBC), Berlin, Germany, 23–27 July 2019; pp. 4237–4240. [Google Scholar] [CrossRef]
- Bobbia, S.; Macwan, R.; Benezeth, Y.; Mansouri, A.; Dubois, J. Unsupervised skin tissue segmentation for remote photoplethysmography. Pattern Recognit. Lett. 2019, 124, 82–90. [Google Scholar] [CrossRef]
- Liu, I.; Ni, S.; Peng, K. Enhancing the Robustness of Smartphone Photoplethysmography: A Signal Quality Index Approach. Sensors 2020, 20, 1923. [Google Scholar] [CrossRef] [PubMed]
- Zhang, Z.; Girard, J.M.; Wu, Y.; Zhang, X.; Liu, P.; Ciftci, U.; Canavan, S.; Reale, M.; Horowitz, A.; Yang, H.; et al. Multimodal Spontaneous Emotion Corpus for Human Behavior Analysis. In Proceedings of the 2016 IEEE Conference on Computer Vision and Pattern Recognition (CVPR), Las Vegas, NV, USA, 27–30 June 2016; pp. 3438–3446. [Google Scholar] [CrossRef]
- Wang, W.; Balmaekers, B.; de Haan, G. Quality metric for camera-based pulse rate monitoring in fitness exercise. In Proceedings of the 2016 IEEE International Conference on Image Processing (ICIP), Phoenix, AZ, USA, 25–28 September 2016; pp. 2430–2434. [Google Scholar] [CrossRef]
- Fallet, S.; Moser, V.; Braun, F.; Vesin, J.M. Imaging Photoplethysmography: What are the Best Locations on the Face to Estimate Heart Rate? In Proceedings of the 2016 Computing in Cardiology Conference (CinC), Vancouver, BC, Canada, 11–14 September 2016. [Google Scholar] [CrossRef]


| Measurement Factor | cPPG | iPPG |
|---|---|---|
| Means | Low resolution of the sensor | |
| Inadequate sampling frequency of the sensor | ||
| Clipping | ||
| Sensor’s noise | ||
| Power source interference [1] | Automatic exposition | |
| Contact pressure [20] | Rolling shutter [21] | |
| Irregular frame rate [21] | ||
| Environment | Ambient light | |
| Temperature [22] | ||
| Low luminosity | ||
| Nonstable environment (varying luminosity) | ||
| Material | Motion artifacts | |
| Presence of makeup [23] | ||
| Ballistocardiographic artifacts [24] | ||
| Physiological Factor | cPPG | iPPG |
|---|---|---|
| Measurement site | Impact on the shape of the PPG pulse [25] | |
| Autonomic nervous system (sympathetic and parasympathetic) | Impact on the baseline of the signal [26] | |
| Impact on pulse amplitude [7,27,28] | ||
| Arterial stiffness | Impact on the waveform [29,30] | |
| Impact on pulse wave velocity [29,30] | ||
| Presence of disease (Arrythmia, premature ventricularcontraction, etc.) | Pulse to pulse interval [1,18] PPG waveform [7,18] | Pulse with multiple peaks (diabetes), incomplete pulses (arrythmia) [31] |
| Respiration | Baseline wandering Modification of the waveform shape [25] Modification of frequency and amplitude of the AC component [29] | Modification of the pulse rate [32] |
| Skin thickess | Lower PPG signal intensity and modification of the waveform [29] | |
| Skin tone | Higher absorption of lower-wavelength light (green) [29] | Signal of lower amplitude and more subject to noise [33] |
| Venous return | Affects both low-frequency components and AC components [29] | |
| References | Details | Annotation Type | |
|---|---|---|---|
| [35] | Evolution of PR between 2 pulses and sudden evolution of the value of the blood oxygenation. | Automatic annotation | |
| [35,36,37,38] | Comparison between PR estimated from the PPG signal and the HR estimated from ECG. | ||
| [39,40] | Comparison between stroke volume measured from cPPG and a reference taken from impedance cardiography. | ||
| [40] | Comparison of left ventricular ejection time measured by a reference with the one measured by cPPG. | ||
| [41] | Labelling by computing already existing quality indicators. | ||
| [36,42,43,44,45,46,47,48,49,50] | Not Guided | Manual annotation | |
| [51,52,53,54] | Guided | By rules | |
| [55,56] | By reference signal | ||
| [35,57,58,59] | Perturbations artificially created during recording | ||
| Scale | Domain | Features | References | |
|---|---|---|---|---|
| Pulse | Temporal | Amplitude | Pulse amplitude | [44,45,68,69] |
| Area under pulse | [44,45] | |||
| Mean, std of pulse waveform | [35,37] | |||
| Temporal | Pulse width | [44,45] | ||
| Pulse rate | [36,70] | |||
| Derivative | Ratio of maximum positive slope over minimum negative slope | [59] | ||
| Spectral | Entropy | [51] | ||
| Principal frequencies and residual noise | [69] | |||
| Statistical | Skewness | [37,50,51,57,69] | ||
| Kurtosis | [37,50,51,57,69] | |||
| Inter-beat | Temporal | IBI | [35,37,46,59,71] | |
| Successive IBI | [59] | |||
| Inter-foot interval | [46] | |||
| Amplitude difference between successive peaks (mean, std) | [35,37,44,45,46] | |||
| Amplitude difference between successive feet | [46,69] | |||
| Difference between pulse widths | [44,45] | |||
| Difference between rising times | [44,45] | |||
| Signal | Temporal | Amplitude of the signal | [48,72] | |
| Difference between autocorrelation of PPG from red and infrared | [48] | |||
| Ratio of oxygenated and deoxygenated blood measured | [48] | |||
| Ratio between systolic and diastolic time | [35] | |||
| Kurtosis | [58] | |||
| Shannon entropy on signal amplitude distribution | [47,58] | |||
| Shannon entropy on signal amplitude distribution | [47,58] | |||
| Permutation and sample entropy | [73] | |||
| Predictor (autoregressive model) coefficients fitted on 5 s signals | [66] | |||
| Spectral | Variable-Frequency Complex Demodulation (VFCDM) | Residual noise | [36] | |
| Projected frequency modulation difference | [36] | |||
| Difference between PR and IBI | [36] | |||
| Energy and amplitude of dominant frequencies in PR range | [74,75] | |||
| Energy of non-dominant frequencies in PR range | [74] | |||
| Variation of dominant frequencies with time | [75] | |||
| Power spectrum | Variation of dominant frequencies with time | [37] | ||
| Spectral entropy | [73] | |||
| Hjort parameters | [37] | |||
| Statistics | SNR | [47,51] | ||
| Variance of the signal | [37] | |||
| 2 first peaks of correlogram of the signal | [47] | |||
| First peak amplitude and time and number of zero crossing of the auto-correlation of the signal | [72] | |||
| Detrended Fluctuation Analysis, Fractal Dimension, and Higuchi Fractal Dimension | [73] | |||
| Reference | Data | Performance |
|---|---|---|
| [68] | 13 subjects | Cohen’s = 0.64 |
| 8 records of 1 min per subject | Sen = 0.89 | |
| Spe = 0.77 | ||
| Acc = 0.83 | ||
| [58] | 24 subjects | Acc = 0.888 |
| >134 min of recording | Sen = 0.869 | |
| Spe = 0.983 | ||
| [43] | Capnobase [83] | 90% of the signals with artifacts had a score |
| Complex System Laboratory [84] | below 95/100 | |
| 14% of good-quality signals are labelled as | ||
| artifacts for a score below 85/100 | ||
| [65] | MIMIC II [82] | Evaluation by the impact on false alarm |
| reduction with suppression | ||
| [70] | Physionet/CinC 2011 | Sen = 0.91 |
| + author-collected database | Spe = 0.95 | |
| [44,45] | 63 subjects | Performance of extended algorithm: |
| 31.5 h of annotated signals | Acc = 0.984 | |
| Sen = 0.995 | ||
| Spe = 0.916 | ||
| Pre = 0.986 | ||
| [77] | Capnobase [83] | Performance on Capnobase |
| Complex System Laboratory [84] | for a threshold of 0.8: | |
| Sen = 0.9664 | ||
| PPV = 0.9926 | ||
| [81] | 19 subjects (>5 min per record) | Mean performance (over authors’ dataset): |
| + PhysioNet MIMIC II | Acc = 0.935 | |
| Sen = 0.869 | ||
| Spe = 0.902 | ||
| [53] | 3 subjects | Best performance: |
| 6 min records | Acc = 0.9258 | |
| Sen = 0.9297 | ||
| Spe = 0.9218 | ||
| PPV = 0.9225 | ||
| [48] | 14 subjects | Classification performance: |
| 158 records of 10 s | Acc = 0.9268 | |
| Sen = 0.9286 | ||
| Spe = 0.9245 | ||
| Pre = 0.6420 | ||
| F1-score = 0.9353 | ||
| [79] | Capnobase [83] | Sen = 0.9466 |
| Complex System Laboratory | PPV = 0.9678 | |
| [66] | 15,000 records of 5 s from 3 different devices | Acc = 0.9321 |
| + MIMIC II [82] + Complex System | Sen = 0.9822 | |
| Laboratory [84] + Wrist [85] + Cup [86] | Spe = 0.9071 | |
| [72] | 19,700 segments of 4 s | Acc = 0.9989 |
| Sen = 0.9994 | ||
| Spe = 0.9939 |
| Reference | Data | Machine Learning Method | Performance |
|---|---|---|---|
| [42] | 104 subjects, 1055 pulsations | MLP | Acc = 0.952 |
| Sen = 0.990 | |||
| Spe = 0.806 | |||
| PPV = 0.952 | |||
| [35] | 33 subjects | SVM + temporal neighbor voting | Mean performance on 3 artefacts |
| (finger motion, head motion, walking): | |||
| Acc = 0.938 | |||
| Sen = 0.943 | |||
| Spe = 0.924 | |||
| [69] | 15 subjects | C-SVC | Mean performance: |
| 22 records of 1 min per subject | Acc = 0.885 | ||
| Sen = 0.843 | |||
| Spec = 0.915 | |||
| [36] | 5 different datasets | SVM | Precision in the detection of the |
| (Chon Lab and UMass Medical center) | occurrence time of a MNA | ||
| Difference in Transit Time = 0.91 ± 0.59 s | |||
| [52] | 13 subjects | SVM | Acc = 0.9033 |
| Sen = 0.9505 | |||
| Spe = 0.9163 | |||
| [37] | 17 subjects | SVM | Acc = 0.984 |
| 24 h record per subject | Sen = 0.8550 | ||
| Spe = 0.9184 | |||
| [59] | 40 subjects | Fuzzy neural network | Mean performance: |
| records of 1.5 to 2 min | Acc = 0.8992 | ||
| Sen = 0.8421 | |||
| Spe = 0.9363 | |||
| [46] | 46 subjects | Test of 3 machine learning models: | Best score from SVM, mean performance: |
| + Capnobase dataset | Classification and regression tree, SVM, | Sen = 0.9576 | |
| ensemble tree | Spe = 0.9190 | ||
| PPV = 1 | |||
| [47] | 26 subjects | Test of k-nearest neighbor, | Best score for random forest: |
| multi-class SVM, Naïve Bayes, | Acc = 0.745 | ||
| decision tree, random forest | |||
| [39] | 10 subjects | Fuzzy neural network | Performance on detection of |
| 3 min per record | bad-quality pulses : | ||
| Acc = 0.86 | |||
| Pre = 0.97 | |||
| Sen = 0.84 | |||
| [73] | 30 subjects | Self-organizing map | Acc = 0.9201 |
| 10 min per subject | Sen = 0.9580 | ||
| [50] | 5 subjects | Unsupervised elliptical envelope | Results of the leave-one-subject-out test |
| 12 min of recording per hour for | algorithm | in the classification of bad quality: | |
| each subject during 6 days | Pre = 0.85 | ||
| Sen = 0.98 |
| Reference | Data | Entry | Deep Learning Architecture | Performance |
|---|---|---|---|---|
| [67] | 19 subjects | 30 s PPG signal + index | 3 CNN + 2 dense layers | Acc = 0.9002 |
| 1443 records of 30 s length | indicating motion detected by | AUC = 0.9521 | ||
| the smartwatch accelerometer | ||||
| injected into the dense part of | ||||
| the network | ||||
| [38] | 5 days data collection | 60 s signal window | 1 CNN + dense network | Best performance: |
| AUC = 0.88 | ||||
| Pre =0.7674 | ||||
| Sen = 0.8354 | ||||
| [55] | 2 private datasets | 2 entries are tested: | 1D entry: | Best performance (ResNet18): |
| 1D entry, 30 s of normalized | Attention LSTM ending with | Acc = 0.9851 | ||
| PPG signal | dense network | Spe = 0.9791 | ||
| 2D entry, normalized RGB | Fully connected network | Sen = 0.9877 | ||
| plot image of the signal | 2D entry: | |||
| VGG19, Resnet18, Resnet50, | ||||
| Xception | ||||
| [40] | 14 subjects | 2D images of the plot of | ResNet50; VGG19 | Best performance (ResNet50): |
| zero-padded PPG pulse and | Acc = 0.94 | |||
| its derivative | Pre = 0.96 | |||
| Sen = 0.92 | ||||
| [49] | 183 subjects | Raw PPG signal | 1 CNN + 1 shared CNN | - |
| + 2 separated CNN with | ||||
| dense layer | ||||
| [91] | 38 subjects | 5 s of normalized PPG signal | 13 layers 1D CNN | Acc = 0.945 |
| BIDMC and ICU dataset from | Sen = 0.967 | |||
| MIMIC | Spe = 0.904 | |||
| [54] | 76 subjects | PPG pulse signal converted to | 2D CNN + 1 dense | Acc = 0.975 |
| recurrence plot | Sen = 0.964 | |||
| Spe = 0.987 | ||||
| [41] | PPG : | 5 points window of 64Hz | 3-unit LSTM + dense layer | Average Acc = 0.7973 |
| DaLiA dataset [94] and | PPG signal | |||
| Cuffless Blood Pressure | ||||
| Estimation dataset [95] | ||||
| iPPG: 6 subjects | ||||
| [92] | 2 subjects | Discrete wavelet transform | Autoencoder used | Pre = 0.90 |
| + data augmentation | (DWT) approximation | Encoder : 1D CNN | Sen = 0.95 | |
| coefficients from second level | + bidirectional LSTM layer | |||
| of 6 s PPG signal | Decoder : LSTM layer | |||
| + dense layer | ||||
| [56] | 44 subjects | 30 s bandpass-filtered signal | 1D U-Net (5 residual encoder, | Mean performance |
| 5 residual decoder) | DICE score = 0.8734 ± 0.0018 |
| Scale | Domain | Features | References | |
|---|---|---|---|---|
| Pulse | Temporal | Amplitude | Difference between systole and diastole (pulse amplitude) | [101] |
| Amplitude before and after perturbation for iPPG extracted by POS or SSR | [100] | |||
| Template matching [70] | [99] | |||
| Signal | Temporal | Std of the signal | [64,101] | |
| Spectral | SNR (from frequency spectrum) | [63,97,98,99,101,102] | ||
| Relative difference between highest and second highest amplitude of the signal spectrum | [101] | |||
| Maximum scalar product between PPG periodogram [103] and predefined filters | [104] | |||
| Probabilistic | SNR (obtained using HMM models) | [61] | ||
| Reference | Data | Algorithm Type | Performance |
|---|---|---|---|
| [100] | 31 video records | Rule-based algorithm | Evaluated on contribution |
| over HR estimation | |||
| [61] | UBFC-RPPG dataset [105] | Hidden Markov Model | Evaluated on contribution |
| over HR estimation | |||
| [104] | 200,000 smartphone PPG | Rule-based algorithm | - |
| records | |||
| [36] | 5 different datasets | SVM | Evaluated on contribution |
| (Chon Lab and | over HR estimation | ||
| UMass Medical Center) | |||
| [106] | 226 subjects | Fitting each pulse to a | Evaluated on impact on |
| sinusoidal model using | error between HRV | ||
| non-linear least square | estimated from PPG and | ||
| optimization. If the fitting | ECG | ||
| fails (i.e., no convergence or | |||
| error high) or the model | |||
| parameters are outside a | |||
| statistical range, the pulse is | |||
| bad-quality. | |||
| [101] | Bingamton–Pittsburgh–RPI | Rule-based algorithm | Evaluated on contribution |
| Multimodal Spontaneous | over HR estimation | ||
| Emotion database [107] | |||
| [41] | 6 subjects | 3-unit LSTM + dense layer | Evaluated on contribution |
| + augmentation with PPG | over HR estimation | ||
| DaLiA dataset |
Publisher’s Note: MDPI stays neutral with regard to jurisdictional claims in published maps and institutional affiliations. |
© 2022 by the authors. Licensee MDPI, Basel, Switzerland. This article is an open access article distributed under the terms and conditions of the Creative Commons Attribution (CC BY) license (https://creativecommons.org/licenses/by/4.0/).
Share and Cite
Desquins, T.; Bousefsaf, F.; Pruski, A.; Maaoui, C. A Survey of Photoplethysmography and Imaging Photoplethysmography Quality Assessment Methods. Appl. Sci. 2022, 12, 9582. https://doi.org/10.3390/app12199582
Desquins T, Bousefsaf F, Pruski A, Maaoui C. A Survey of Photoplethysmography and Imaging Photoplethysmography Quality Assessment Methods. Applied Sciences. 2022; 12(19):9582. https://doi.org/10.3390/app12199582
Chicago/Turabian StyleDesquins, Théo, Frédéric Bousefsaf, Alain Pruski, and Choubeila Maaoui. 2022. "A Survey of Photoplethysmography and Imaging Photoplethysmography Quality Assessment Methods" Applied Sciences 12, no. 19: 9582. https://doi.org/10.3390/app12199582
APA StyleDesquins, T., Bousefsaf, F., Pruski, A., & Maaoui, C. (2022). A Survey of Photoplethysmography and Imaging Photoplethysmography Quality Assessment Methods. Applied Sciences, 12(19), 9582. https://doi.org/10.3390/app12199582