Article

Impact Resistance and Flexural Performance Properties of Hybrid Fiber-Reinforced Cement Mortar Containing Steel and Carbon Fibers

1
Public Safety Research Center (PSRC), Konyang University, 121, Daehak-ro, Nonsan-si 32992, Korea
2
School of Disaster and Safety Engineering, Konyang University, 121, Daehak-ro, Nonsan-si 32992, Korea
3
Department of International Civil and Plant Engineering, Konyang University, 121, Daehak-ro, Nonsan-si 32992, Korea
*
Author to whom correspondence should be addressed.
Appl. Sci. 2022, 12(19), 9439; https://doi.org/10.3390/app12199439
Submission received: 23 August 2022 / Revised: 14 September 2022 / Accepted: 16 September 2022 / Published: 21 September 2022

Abstract

:
Fiber-reinforced cement mortar (FRCM) has been widely used since it has many advantages compared to plain mortar (PM), and various fibers are highly applicable as repair and reinforcement materials for concrete. In the present paper, an experimental study was planned to investigate the properties, such as flexural performance (flexural strength and toughness), compressive strength, and impact resistance of mono fiber-reinforced cement mortar (MFRCM) containing only steel fiber (SF) or carbon fiber (CF), as well as hybrid fiber-reinforced cement mortar (HyFRCM) containing different combinations of SF and CF. The fiber content was used in five levels (0.0, 0.25, 0.5, 0.75, and 1.0%) at a total volume fraction of 1.0% by volume. The results show that HyFRCM containing 0.75% SF and 0.25% CF improved compressive strength, flexural strength, and impact resistance compared to MFRCM and other HyFRCM, resulting in a synergistic effect of hybrid reinforced fibers. It is noted that, in the case of HyFRCM containing 0.5% SF and 0.5% CF, the flexural strength was slightly lower, but the highest flexural toughness was obtained, which led us to judge that the result shown in this investigation can be the optimal fiber combination to improve toughness and energy absorption capacity.

1. Introduction

Cement-based composites have been widely used worldwide as some of the most frequently employed construction materials for buildings and civil structures, owing to their excellent quality and durability in comparison with the cost [1,2]. Nevertheless, cement-based composites have well-known disadvantages, such as weak flexural and tensile strength, and low performance in terms of strain capacity, ductility, toughness, and fatigue. As a means to improve these drawbacks, fiber-reinforced cement mortar (FRCM) has been developed by inputting chopped fibers in cement composites irregularly and discontinuously dispersed [3,4,5]. In general, fibers are used to improve the shrinkage cracking, flexural performance (flexural strength and toughness) and impact resistance of cement composites [6,7,8]. In mono fiber-reinforced cement mortar (MFRCM), which contains one type of fiber, it is difficult to expect a synergistic effect of fiber reinforcement over a certain level within a limited range [9,10,11,12]. However, a hybrid fiber-reinforced cement mortar (HyFRCM) in which two or more different fibers are properly incorporated can achieve much improved mechanical properties and impact resistance because different fibers share their roles in it [13,14,15,16].
The most commonly applied fibers in the construction of concrete structures are classified into micro and macro fibers according to their size (length and diameter). Micro-fibers have a length of 5 to 10 mm and a diameter of 7 to 30 μm and, according to the material, they are classified into carbon fiber (CF), glass fiber (GF), and basalt fiber (BF) [17,18,19,20]. On the other hand, macro-fibers have a length of 25 to 60 mm and a diameter of 0.2 to 0.8 mm, in such types as steel fiber (SF) and polyvinyl alcohol fiber (PVAF) [21,22,23].
Figure 1 shows the action of the hybrid fibers of different sizes in relation to crack bridging occurring in the cement matrix. As seen in Figure 1, the micro-fibers are cross-linked at the stage of micro-cracks, and at the stage where these micro-cracks develop into macro-cracks, the macro-fibers cross-linked in the cracks, which is expected to improve flexural performance and impact resistance. In other words, short micro-fibers more effectively control micro-cracks, while relatively long macro-fibers more effectively control large cracks [24,25,26].
Although MFRCM has been used only for a single fiber, various studies have been conducted recently on HyFRCM, which can maximize the effect that a single fiber cannot exert if two or more fibers with different material properties are used in an appropriate ratio. Even in the case of HyFRCM containing different combinations of SF and CF, it is considered to be very effective in terms of improving mechanical properties, such as impact resistance, flexural performance, and compressive strength, but the problem is that information on fiber combinations is too limited. In consideration of constructability and economic feasibility particularly, fibers with a fiber combination of 1.0% or less are widely applied to the construction of concrete structures, but research on this is necessary.
Therefore, it is intended in this study to evaluate such properties as flexural performance, compressive strength, and impact resistance of HyFRCM containing SF and CF with the goal of developing FRCM containing fibers with different material properties to obtain a synergistic effect that cannot be achieved with single fibers alone. In addition, their performance is compared and reviewed with plain mortar (PM). For this objective, the optimal fiber combination of HyFRCM incorporated with SF and CF was examined.

2. Materials and Methods

2.1. Materials

The cement used in this investigation was Ordinary Portland Cement (OPC) manufactured by Company S, with a specific gravity of 3.13 and a fineness of 3860 cm2/g. For fine aggregate, Jumunjin standard sand produced in Jumunjin-eup, Gangneung-si, Gangwon-do was used in order to make a homogeneous mortar mixture. The specific gravity of the fine aggregate with a dry and saturated surface was 2.65. The admixture used is a polycarboxylic acid-based product manufactured by Company D in Korea, and a light yellow, high-performance water reducing agent with a specific gravity of 1.04 and pH 5.0 ± 1.5. In this investigation, two types of fibers (SF and CF) with different properties were used. Table 1 shows the physical properties of the SF used in this investigation. The SF has a diameter of 0.5 mm, a length of 30 mm, and a tensile strength of 1100 MPa.
In addition, the physical properties of CF used in this investigation are shown in Table 2. CF has a diameter of 7 μm and a length of 6 mm, and the tensile strength and modulus of elasticity are 4900 MPa and 230 GPa, respectively. It is manufactured by Japanese company T, which uses acrylic nitrile (polyacrylonni-trile, PAN) as a raw material. Figure 2 is a photographic representation of the SF and CF used in this investigation.

2.2. Mix Proportion and Mixing Procedure

The mixture designations and proportions used in this investigation are summarized in Table 3. As seen in Table 3, a mixture of six types of cement mortars was prepared. The water:cement ratio (W/C) was set to be 0.46, and the cement mortar was mixed in a ratio (mass ratio) of cement:fine aggregate:water = 1:2:0.46. Specimens were prepared by adding 0.5% to 1.5% of SP (super-plasticizer) based on the mass of cement in order to secure a certain fluidity while mixing. In the case of PM or SF, SP was not added separately. As for the mixing method, cement and fine aggregate were put first, and dry mixing was performed at a low speed for 30 s. Subsequently, 1/3 of the mixing water was added to the mixture and further mixed for 30 s. In order to secure the dispersibility of the fibers, fibers were added and mixed at a medium speed for 1.5 min. Then, the remaining water and SP were added and mixed for 30 s immediately. Following the stop for 30 s, the attached cement mortar was removed and, finally, the mixer was operated again and mixed at a high speed for 2 min. The total mixing time was about 5 min. Compaction of cement mortars was achieved by using a vibrating table, and the vibration times varied depending on the stiffness of the mixtures. After the mold was completed, all specimens were covered with a plastic sheet for 36 h to prevent moisture evaporation, and the molds were demolded and cured in water until the age of 28 days in a curing tank in which the temperature was maintained at 20 ± 2 °C.

2.3. Test Methods

2.3.1. Flexural Performance Test

For the flexural performance test, beam specimens of 100 × 100 × 400 mm3 suggested by ASTM C1609/C1609M [27] and the Korean regulations of KS F 2566 [28] were fabricated, and tests of all specimens were performed at the age of 28 days. Figure 3 shows the set-up of the test equipment installed by the third-point loading method for the flexural performance test. It is the test equipment of a universal testing machine (UTM) with a capacity of 2500 kN.
Meanwhile, deflection and applied load were measured using two linear variable displacement transducers (LVDTs) set up in the center of both sides of the specimen. The loading rate was controlled at a constant speed of 0.2 mm/min until the specimen was destroyed at L/1500 per minute, and the flexural load was recorded by using a load cell with a capacity of 850 kN. The flexural strength (fr) in the third-point loading method is calculated by Equation (1) at the maximum load [27,28].
f r = P L b h 2  
where, P is the maximum load (N), L is the span length (mm), b is the width of the specimen (mm), and h is the height of the specimen (mm).
Equivalent flexural strength is defined as the average flexural strength at a given deflection (L/150) in the load-deflection curve obtained from the flexural performance test. The equivalent flexural strength in the third-point loading method is calculated as in Equation (2) [27,28].
f r = A b δ t b × L b h 2  
where, f’r is the equivalent flexural strength (MPa), δtb is the deflection (mm) of L/150, L is the span length (mm), b is the width of the specimen (mm), and h is the height (mm) of specimen, and Ab is the area (J, kN·mm) from the load-deflection curve to δtb.

2.3.2. Evaluation Methods of Flexural Performance

Figure 4 is a graph presented in ASTM C1609/C1609M [27] and the domestic regulation of KS F 2566 [28], showing a typical load-center point pure deflection curve to obtain the flexural performance of a beam specimen. As evidenced in Figure 4, the flexural toughness evaluates the energy absorption capacity by accumulating the sum of the area under the load-deflection curve until the deflection reaches L/600 and L/150. In this study, the respective load values P600 and P150 are read from the load-deflection curve for the deflection values corresponding to L/600 and L/150, and then f600 and f150 are obtained by substituting the values into the flexural strength Equation (1). Thus, the flexural toughness measured at 0.5 mm with a deflection of L/600 is T600, and that measured at 2.0 mm with a deflection of L/150 is T150.

2.3.3. Impact Resistance Test

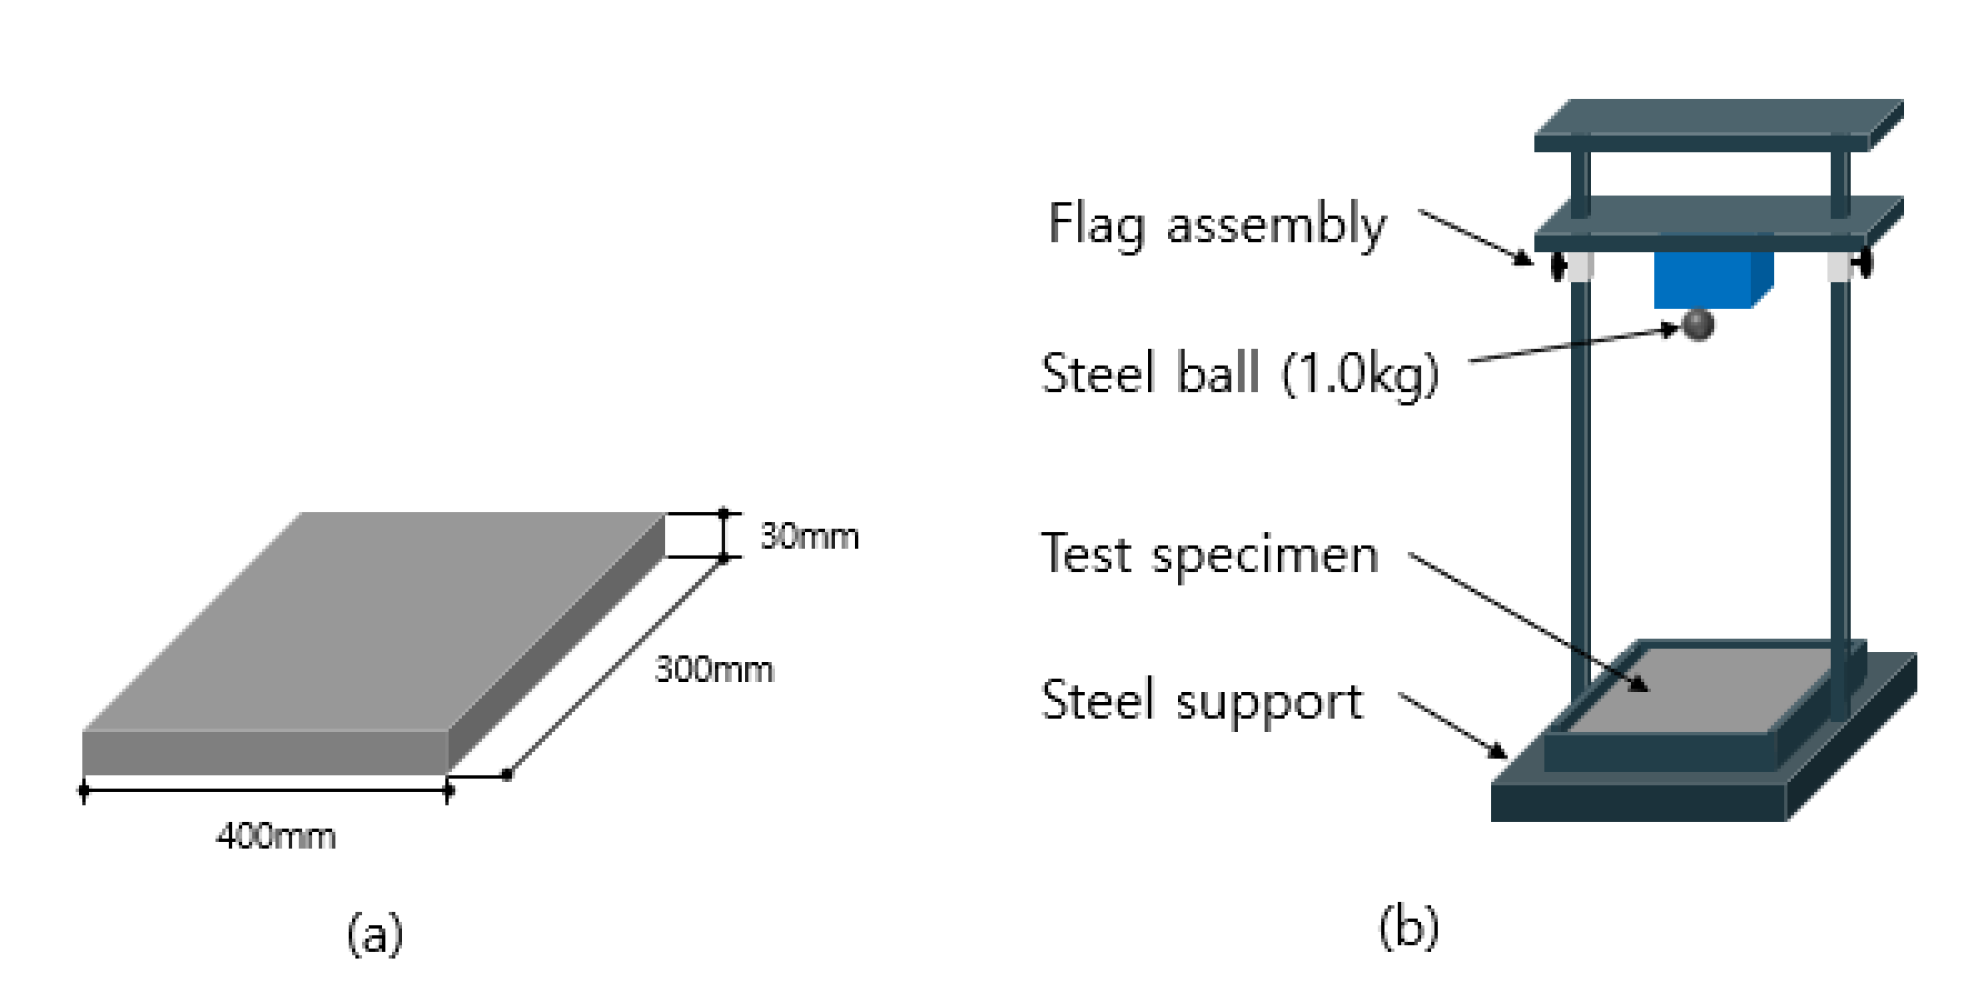
The impact resistance test of the specimens was performed in compliance with the Korean regulations KS F 2221 [29]. Figure 5 indicates a schematic diagram of a cement mortar specimen for impact resistance test as well as the test equipment used. The size of all the specimens was 400 × 300 mm (width × length), and the thickness was 30 mm. A total of 18 specimens were prepared and measured at the age of 28 days. For a blow, the specimen was placed horizontally so as to be supported on the entire surface of the sand, and a 1.0 kg steel ball (41 mm in diameter) was allowed to naturally drop from a height of 900 mm above the center of the surface of the specimen. Then, the number of blows until the first crack appeared and the number of blows until the final fracture of the specimen were measured. Equation (3) was adopted to calculate the energy absorption at a specific height.
Ei = (N) mgh
where, Ei is the impact energy (N·m), N is the number of blows, m is the mass of drop hammer (N), g is the gravitational acceleration (9.80 m/s2), and h is the height of drop hammer (m).

2.3.4. Compression Test

For the compression test, a mold was manufactured according to the test method of KS L ISO 679 [30], and the compressive strength was measured at the age of 28 days. The compressive strength of the specimens cut from 40 × 40 × 160 mm3 size was measured by using a universal testing machine (UTM, Korea, UT-100F, MTDI, Daejeon City, Republic of Korea) with a capacity of 100 kN, and the loading rate was applied at a constant speed under the conditions of 2400 N/s.

3. Results and Discussion

3.1. Properties of Mechanical

3.1.1. Flexural Strength Test Results

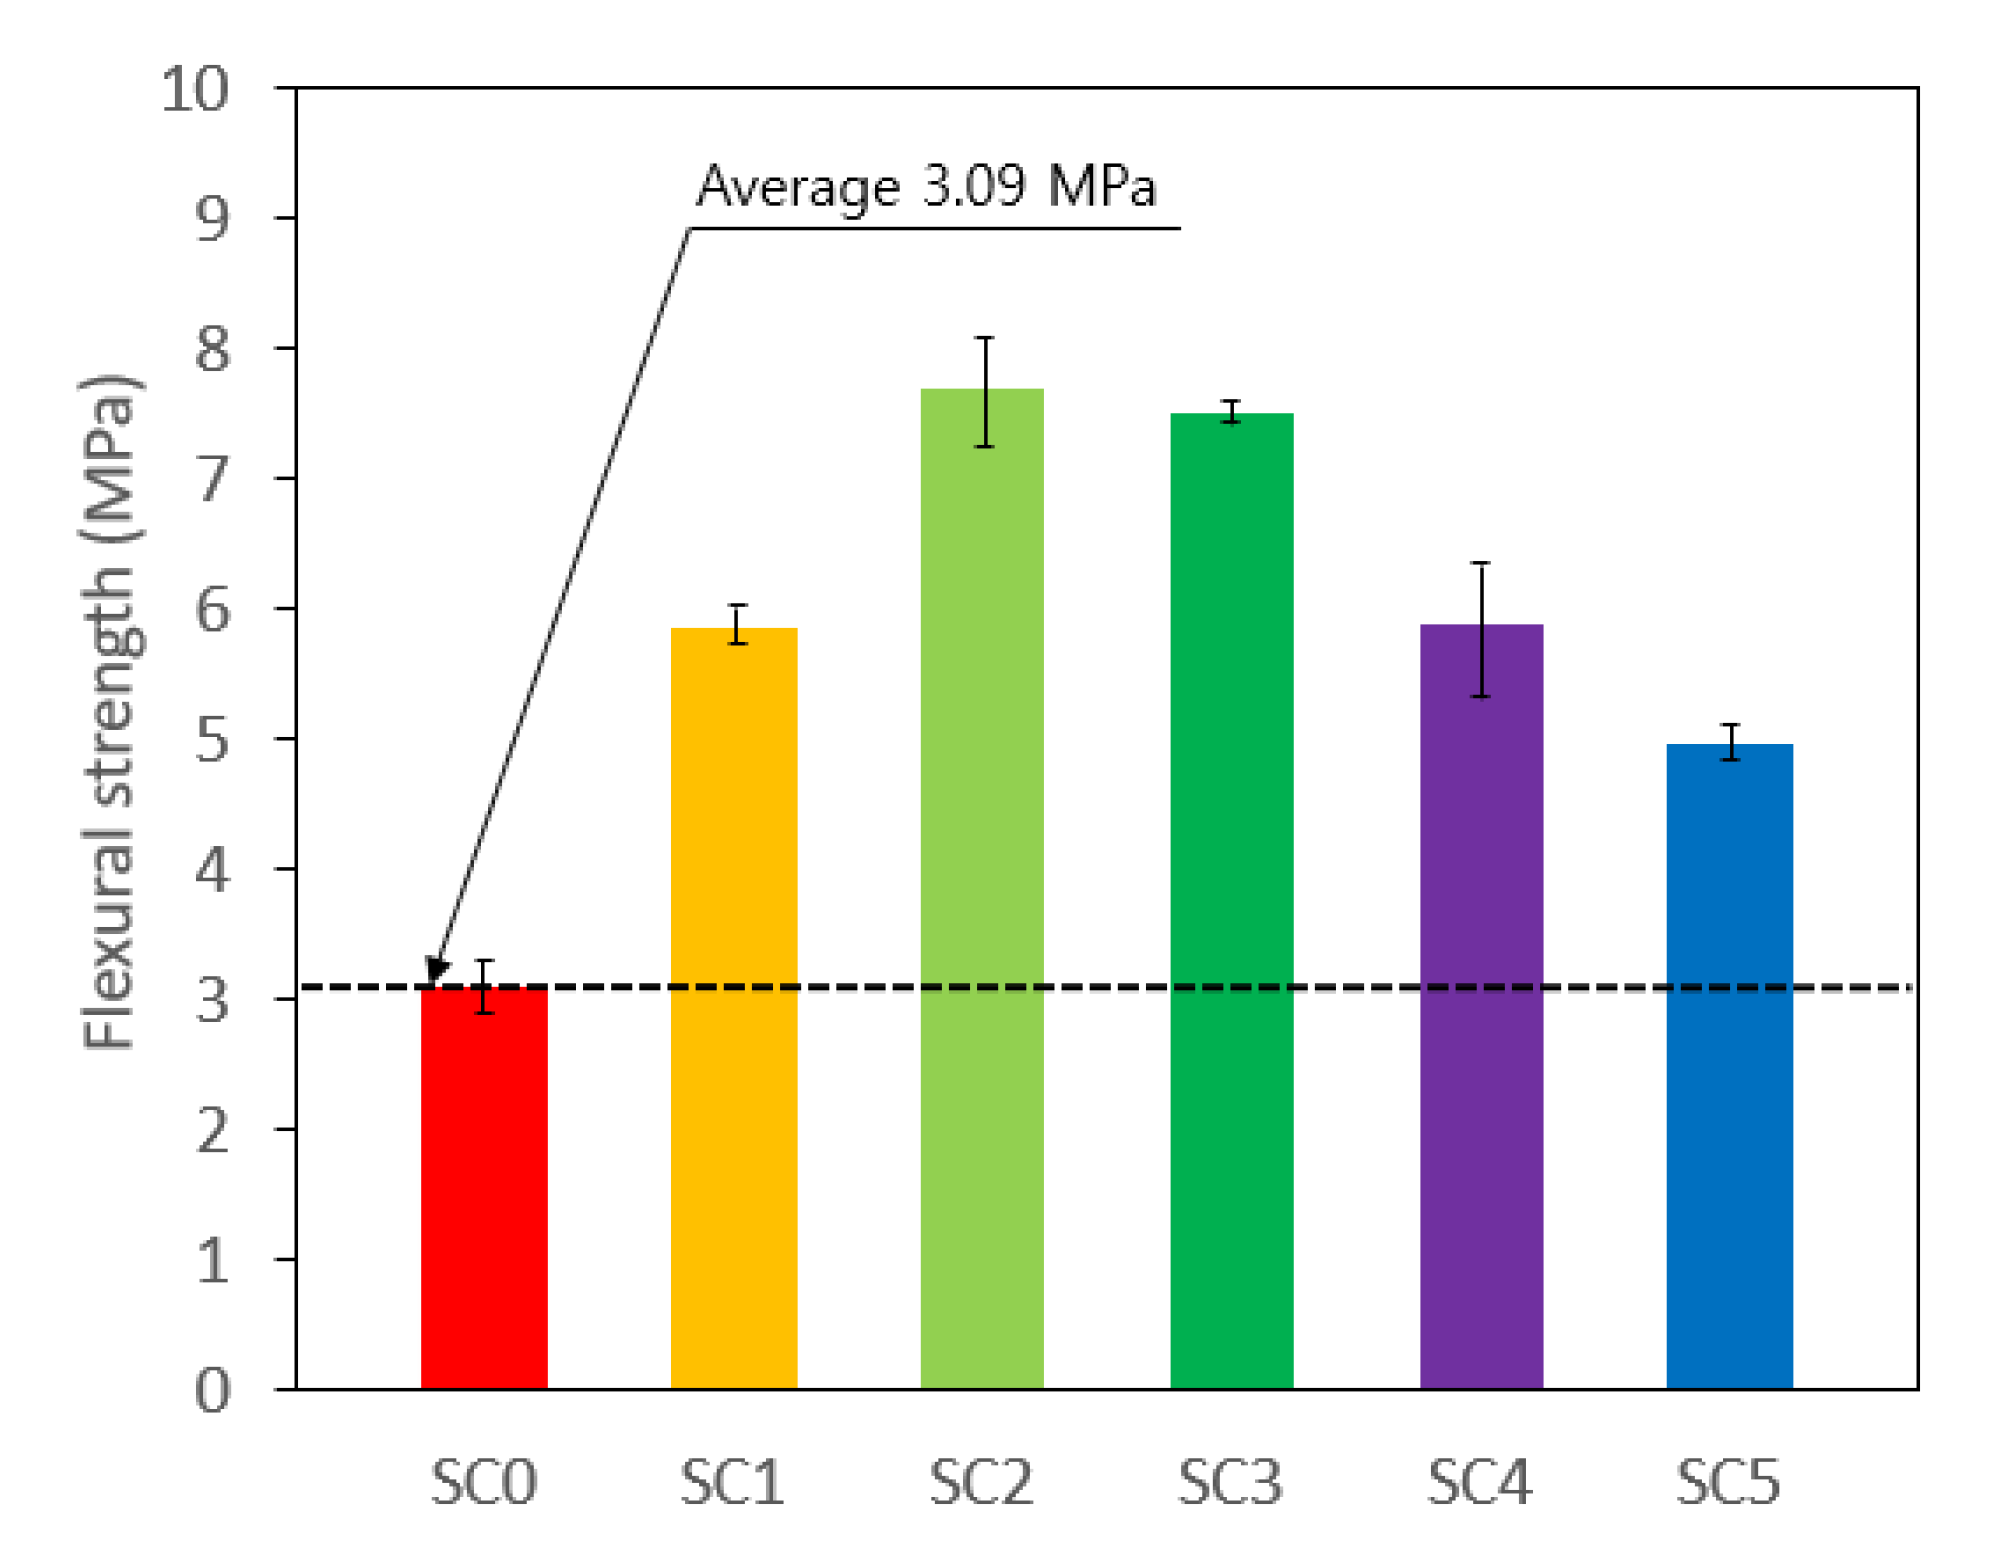
Figure 6 presents the average flexural strength test results of MFRCM and HyFRCM compared to PM. As is clear from Figure 6, the average flexural strength of PM at the age of 28 days was 3.09 MPa. The average flexural strength of MFRCM containing only CF or SF was 4.96 MPa and 5.85 MPa, respectively, which was about 60.5~89.3% compared to PM. According to the results, HyFRCM containing 0.75% SF and 0.25% CF had the highest average flexural strength of 7.68 MPa, revealing the highest flexural strength improved by about 148.5% compared to PM. It also turns out that the average flexural strength of HyFRCM containing 0.75% SF and 0.25% CF or 0.5% SF and 0.5% CF increased by about 31.3% and 28.2%, respectively, compared to the flexural strength of MFRCM containing only SF. This is thought to be because the incorporated fiber plays a cross-linking role in preventing cracks from growing and improving flexural strength through redistribution of stress. That is, it is considered that the performance is improved by controlling the rather macro-cracks of the relatively long steel fibers while the short carbon fibers control the micro-cracks [31]. Once SF and CF are used in an appropriate fiber combination, a synergistic effect could be obtained by increased flexural strength even in the low fiber volume fraction range. Since the optimal fiber combination to obtain the maximum flexural strength is found to be 0.75% SF and 0.25% CF in this experimental investigation, it is believed to be the most appropriate mixing ratio to improve flexural strength.

3.1.2. Compressive Strength Test Results

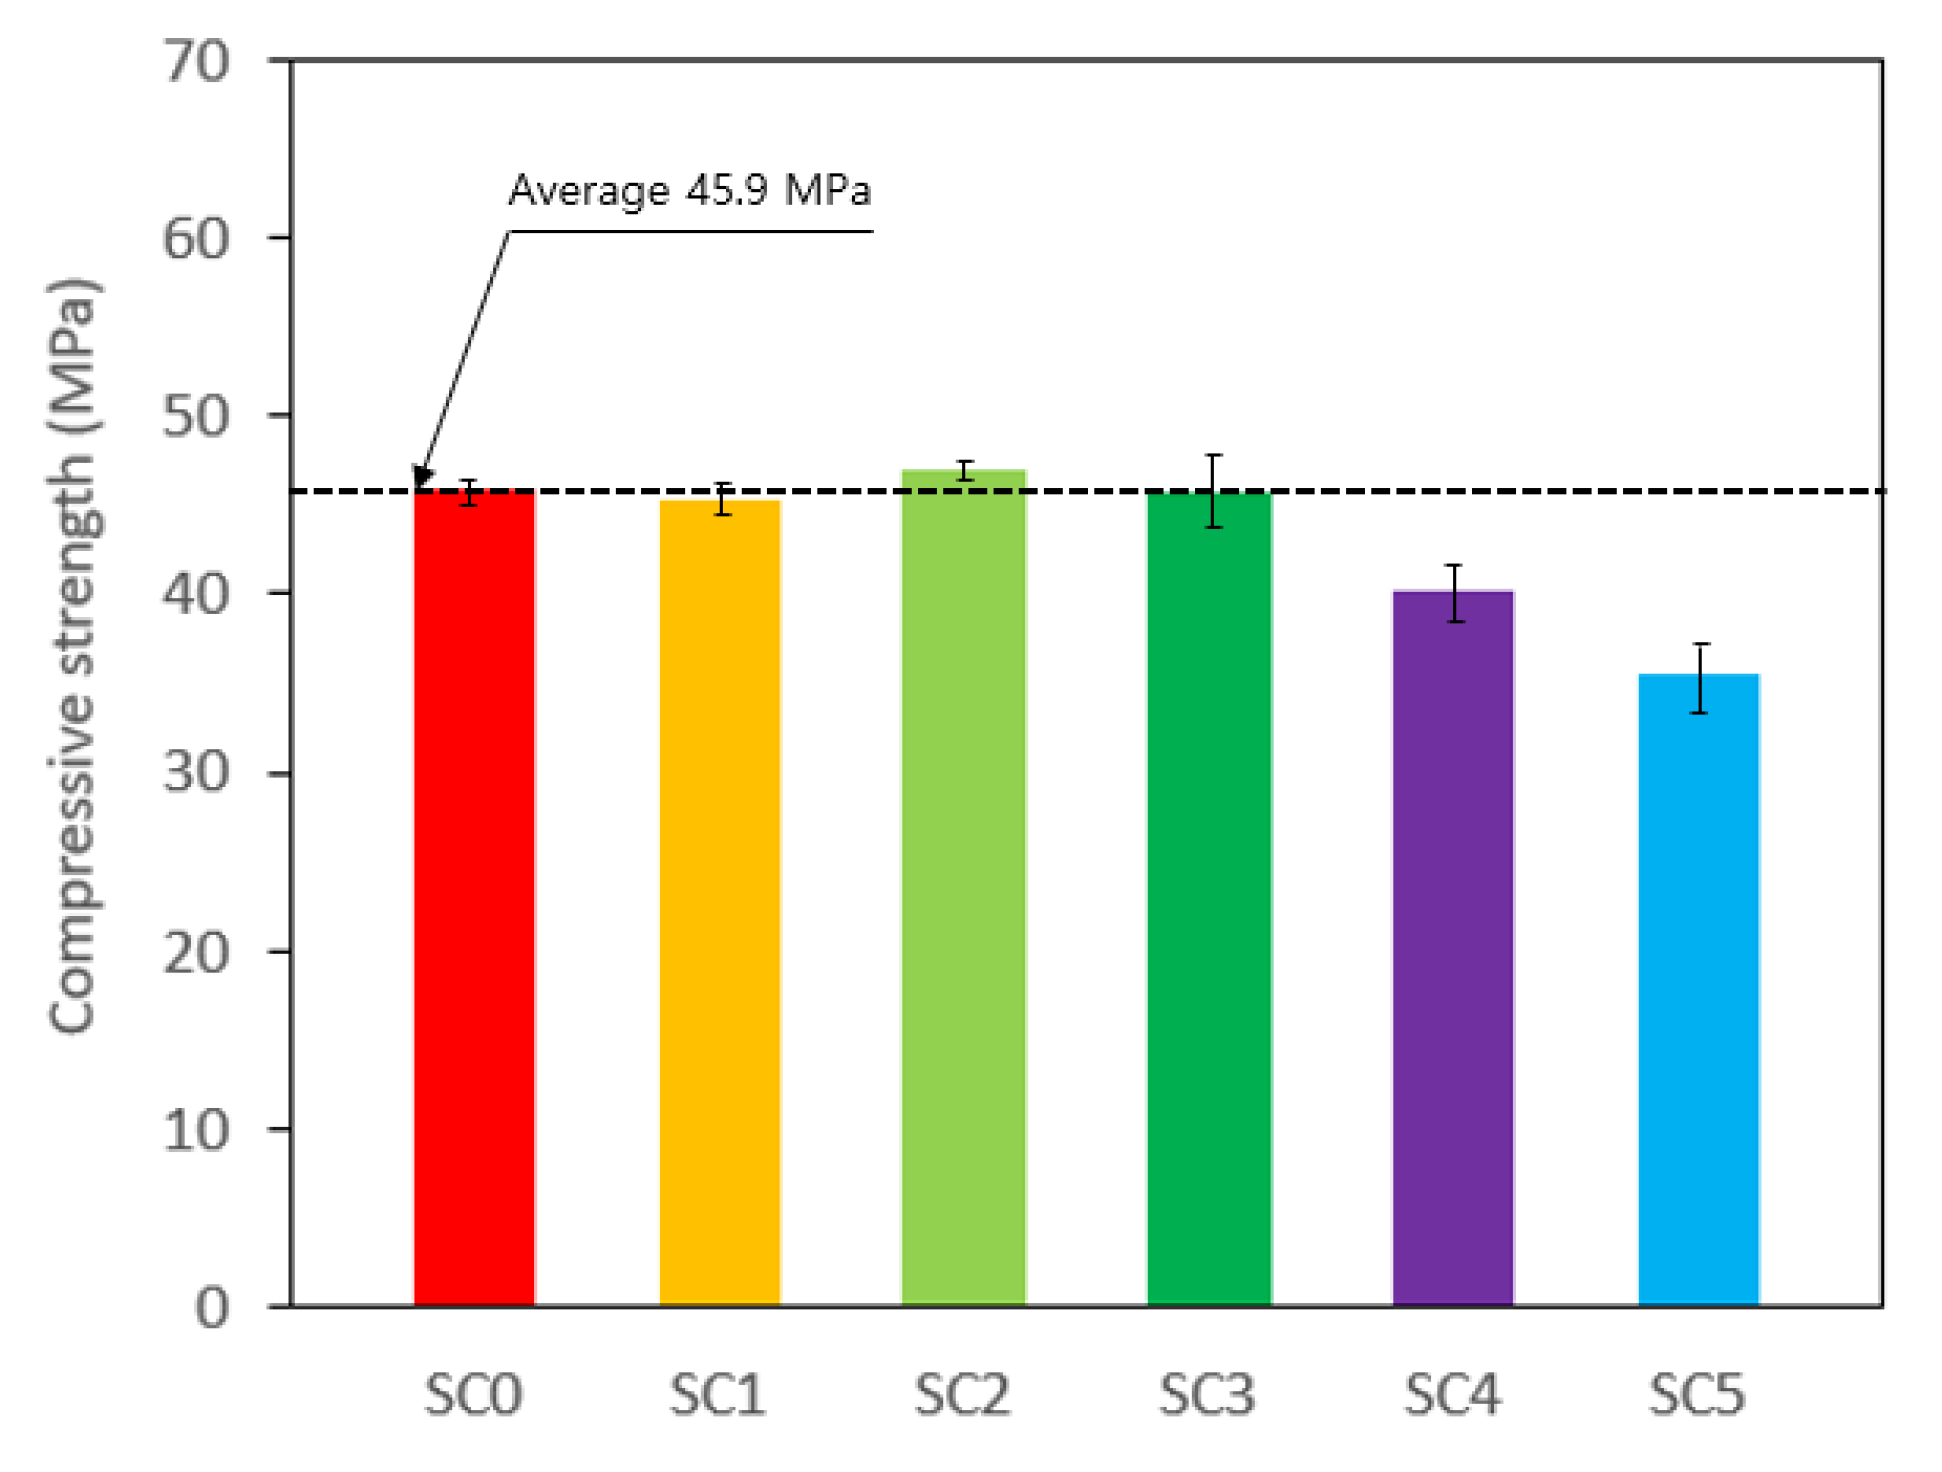
Figure 7 shows the average compressive strength test results of MFRCM and HyFRCM compared to PM. As shown in Figure 7, the average compressive strength of PM at the age of 28 days was 45.9 MPa, and the average compressive strength of MFRCM containing only SF or CF was 45.3 MPa and 35.6 MPa, respectively. However, the average compressive strength of HyFRCM containing 0.75% SF and 0.25% CF was 46.9 MPa, the highest compressive strength that was ever obtained in this experimental investigation. The reason for the increase in compressive strength is that it is reinforced with micro-CF, which is relatively small compared to SF. In the case of MFRCM containing only CF, however, the average compressive strength was 35.6 MPa, a decrease by about 22.4% compared to PM. This seems to be because the compressive strength was lowered as the interfacial bonding force between the fibers and the matrix after curing became weak due to the non-hydrophilicity of the fiber surface [32]. If a large amount of CF was used, particularly, the dispersibility was lowered, and the workability and compressive strength were greatly affected due to the fiber balls phenomenon. Therefore, considering that the HyFRCM containing 0.75% SF and 0.25% CF was shown as the optimum fiber combination for obtaining the maximum compressive strength in this experimental investigation, it is considered to be the most appropriate mixing ratio to improve the compressive strength.

3.1.3. Comparative Review of Equivalent Flexural Strength and Residual Flexural Strength

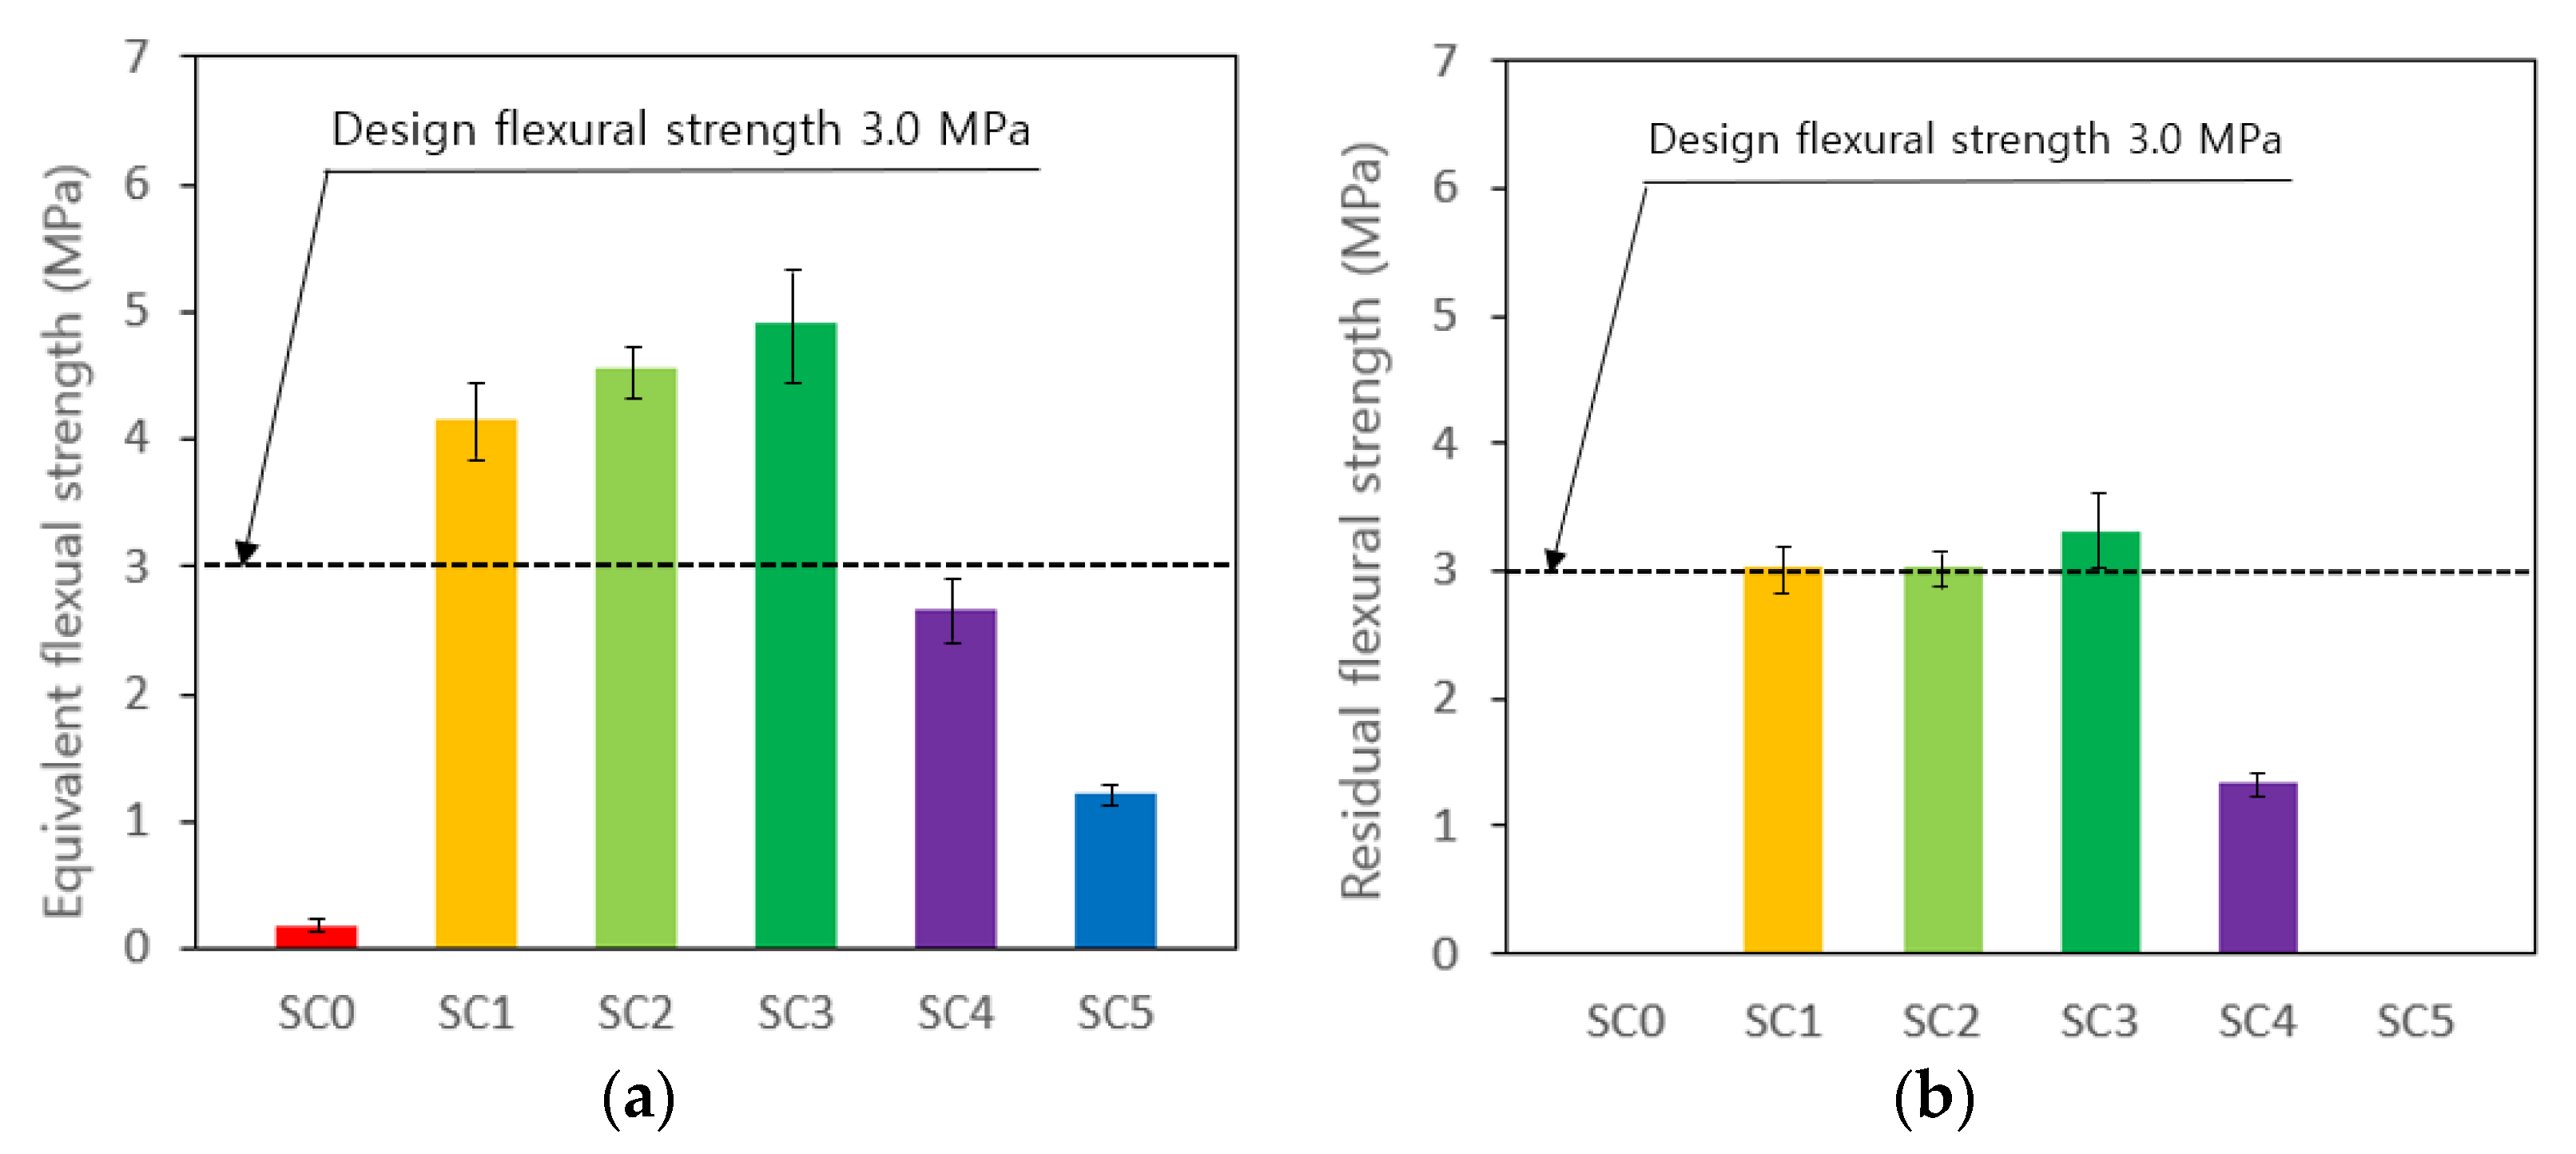
In Korea, the flexural toughness specification requires that the equivalent flexural strength be 68% or more of the maximum flexural strength until the deflection becomes 2 mm through the flexural performance test for the beam specimen, and the maximum flexural strength is required to satisfy the design flexural strength (4.5 MPa). The maximum flexural strength, equivalent flexural strength, the ratio of equivalent flexural strength, residual flexural strength, and the ratio of residual flexural strength for each specimen are summarized in Table 4, and the calculation results of equivalent flexural strength and residual flexural strength of each specimen are shown in a graph in Figure 8. As can be seen from Table 4 and Figure 8, the MFRCM containing only PM or CF was difficult to make a relative comparison due to its rapid brittle behavior after initial cracking, and it was destroyed before the deflection reached 0.5 mm for L/600 and 2.0 mm for L/150. However, MFRCM containing SF only and HyFRCM containing SF and CF failed at a deflection of 2.0 mm or more due to their ductile behavior. In the case of HyFRCM containing 0.5% SF and 0.5% CF especially, it exhibited the highest equivalent flexural strength, which could mean that the CF bears the stress, such as the SF when the initial crack occurs, and the SF bears the stress after the crack occurs, resulting in higher equivalent flexural strength by relieving the stress concentration borne by SF. On the other hand, the residual flexural strength of the MFRCM containing only PM or CF could not be obtained, while the HyFRCM containing 0.5% SF and 0.5% CF featured the highest residual flexural strength. It was made clear that the SF has a higher crack suppression effect and strain capacity compared to the CF when the specimen is broken. When MFRCM and HyFRCM were compared with PM, both maximum flexural strength and equivalent flexural strength tended to increase significantly, and the equivalent flexural strength of HyFRCM containing 0.5% SF and 0.5% CF increased by about 25.3 times. Therefore, as demonstrated in Table 4 and Table 5, the application of equivalent flexural strength is judged to be a rather conservative evaluation, given that it has a predetermined residual flexural strength and a large amount of flexural toughness even under a deflection of 2.0 mm or more.

3.2. Evaluation of Flexural Performance

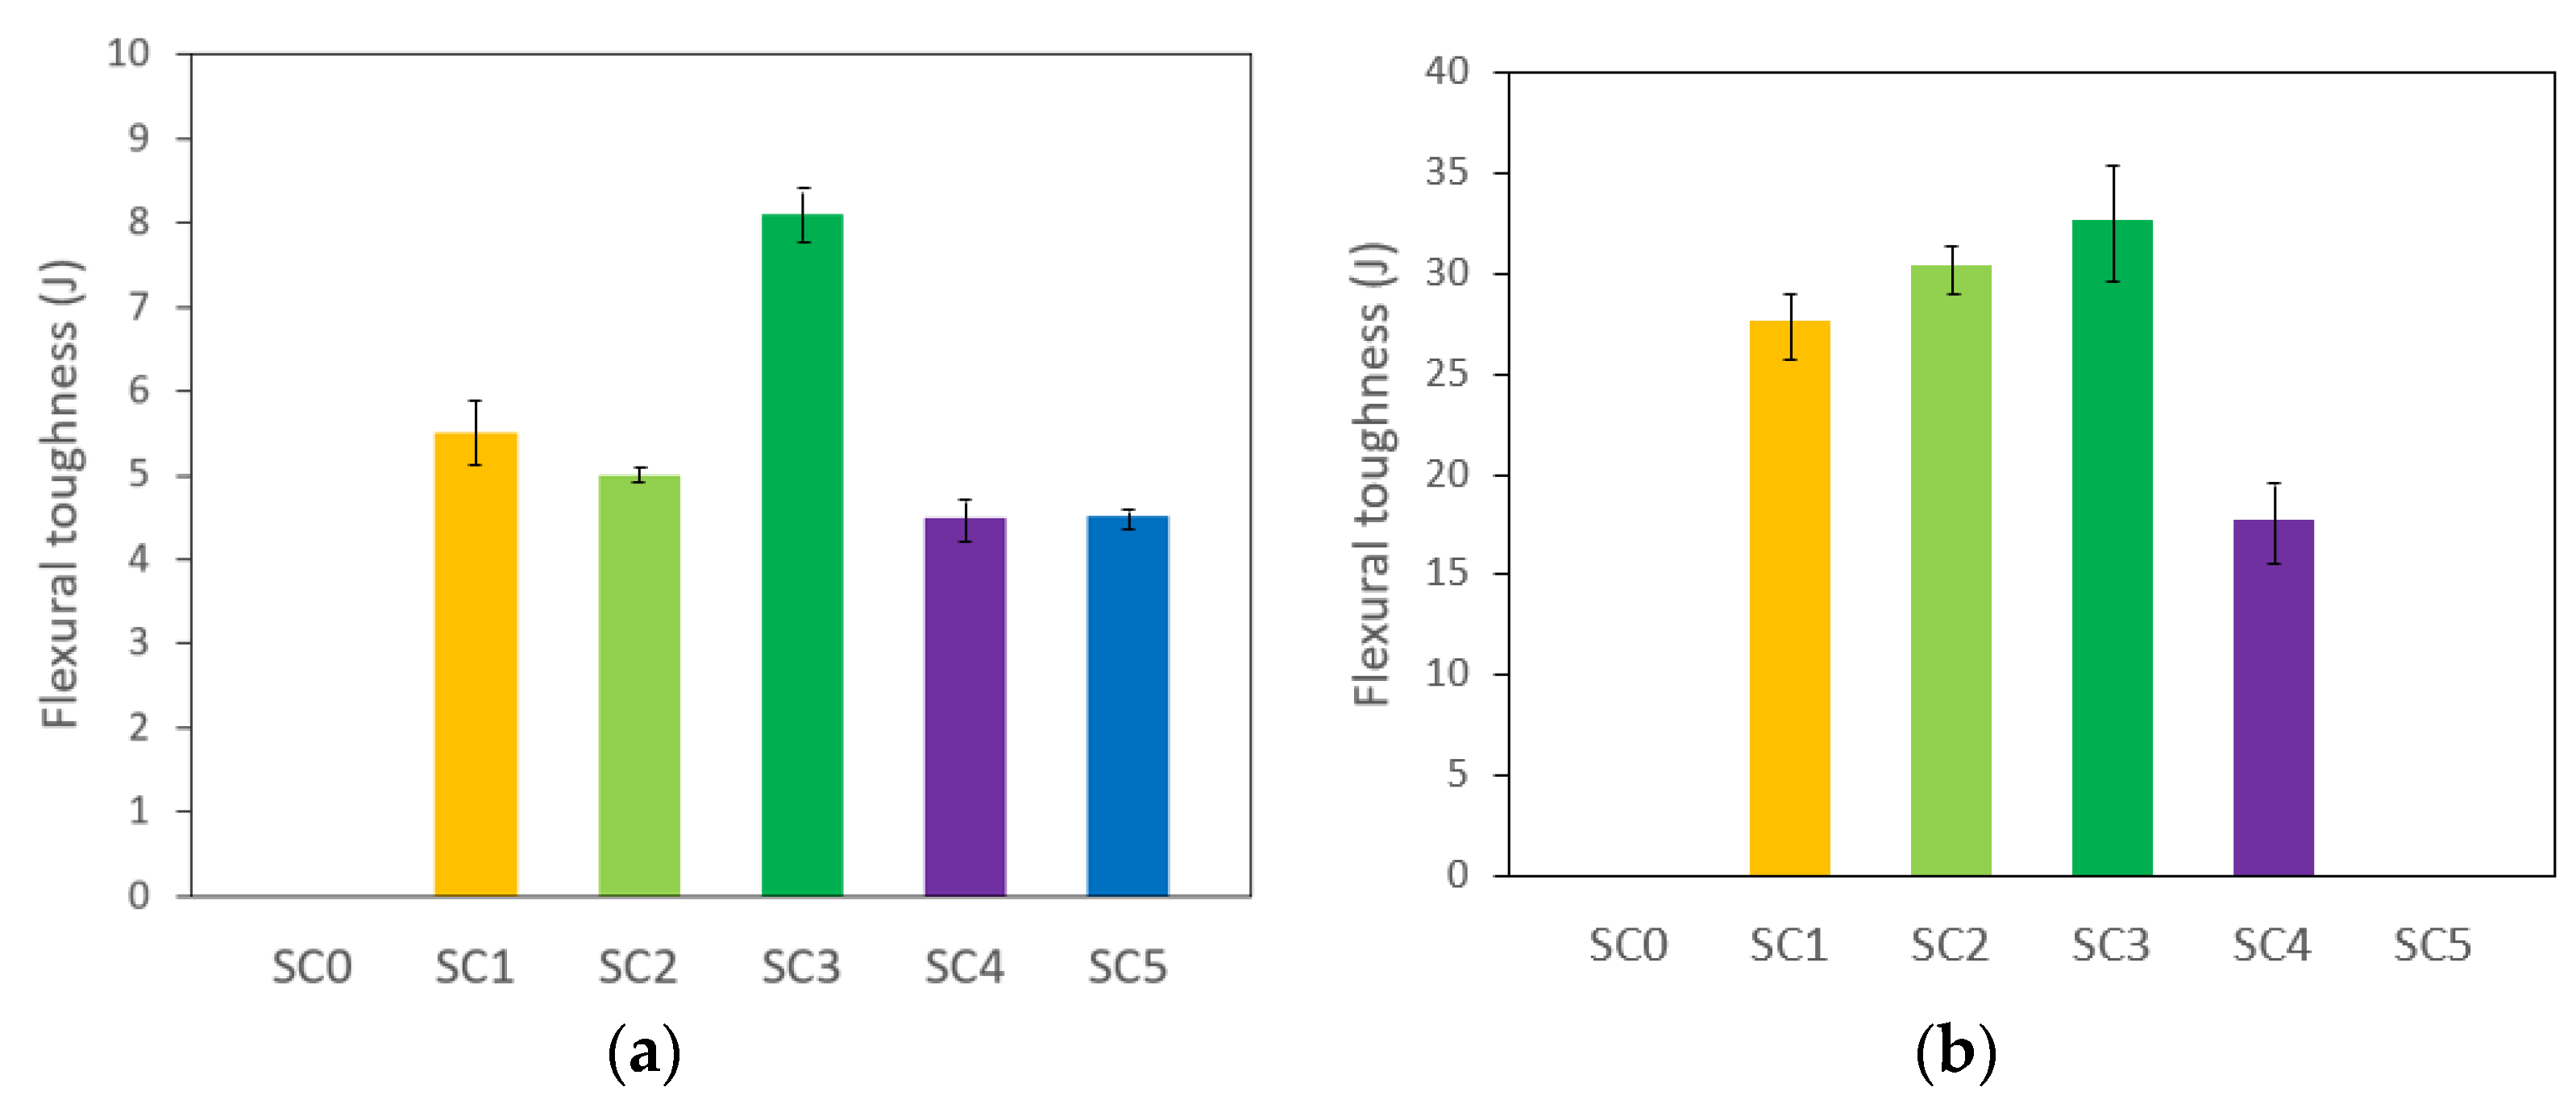
Flexural performance is an important parameter in evaluating the effect of fibers on the post-peak behavior of FRCM. To obtain the flexural performance properties of FRCM, various methods have been developed, and intensive studies have been carried out [33,34,35]. Therefore, in order to evaluate the flexural performance of the specimen in this study, tests were performed using the third-point loading method according to the test method specified in ASTM C 1609/C 1609/M and Korean regulation KS F 2566. Table 5 summarizes the flexural performance test data with parameters such as P600, P150, f600, f150, T600, and T150, and Figure 9 shows the flexural toughness measurement results of MFRCM and HyFRCM at L/600 and L/150. As shown in Table 5, in the case of MFRCM containing only CF, the flexural toughness could not be measured at T150, and the average flexural toughness at T600 was the lowest 4.51 J. On the other hand, in the case of HyFRCM containing 0.5% SF and 0.5% CF, the average flexural toughness at T600 and T150 was the highest 8.11 J and 32.7 J, respectively, and the flexural toughness significantly improved the post-cracking, indicating that it had the highest load-carrying capacity. It is judged that the flexural toughness is improved as the SF controls the macro-cracks relatively, while the CF controls the micro-cracks.

3.3. Evaluation of Impact Resistance

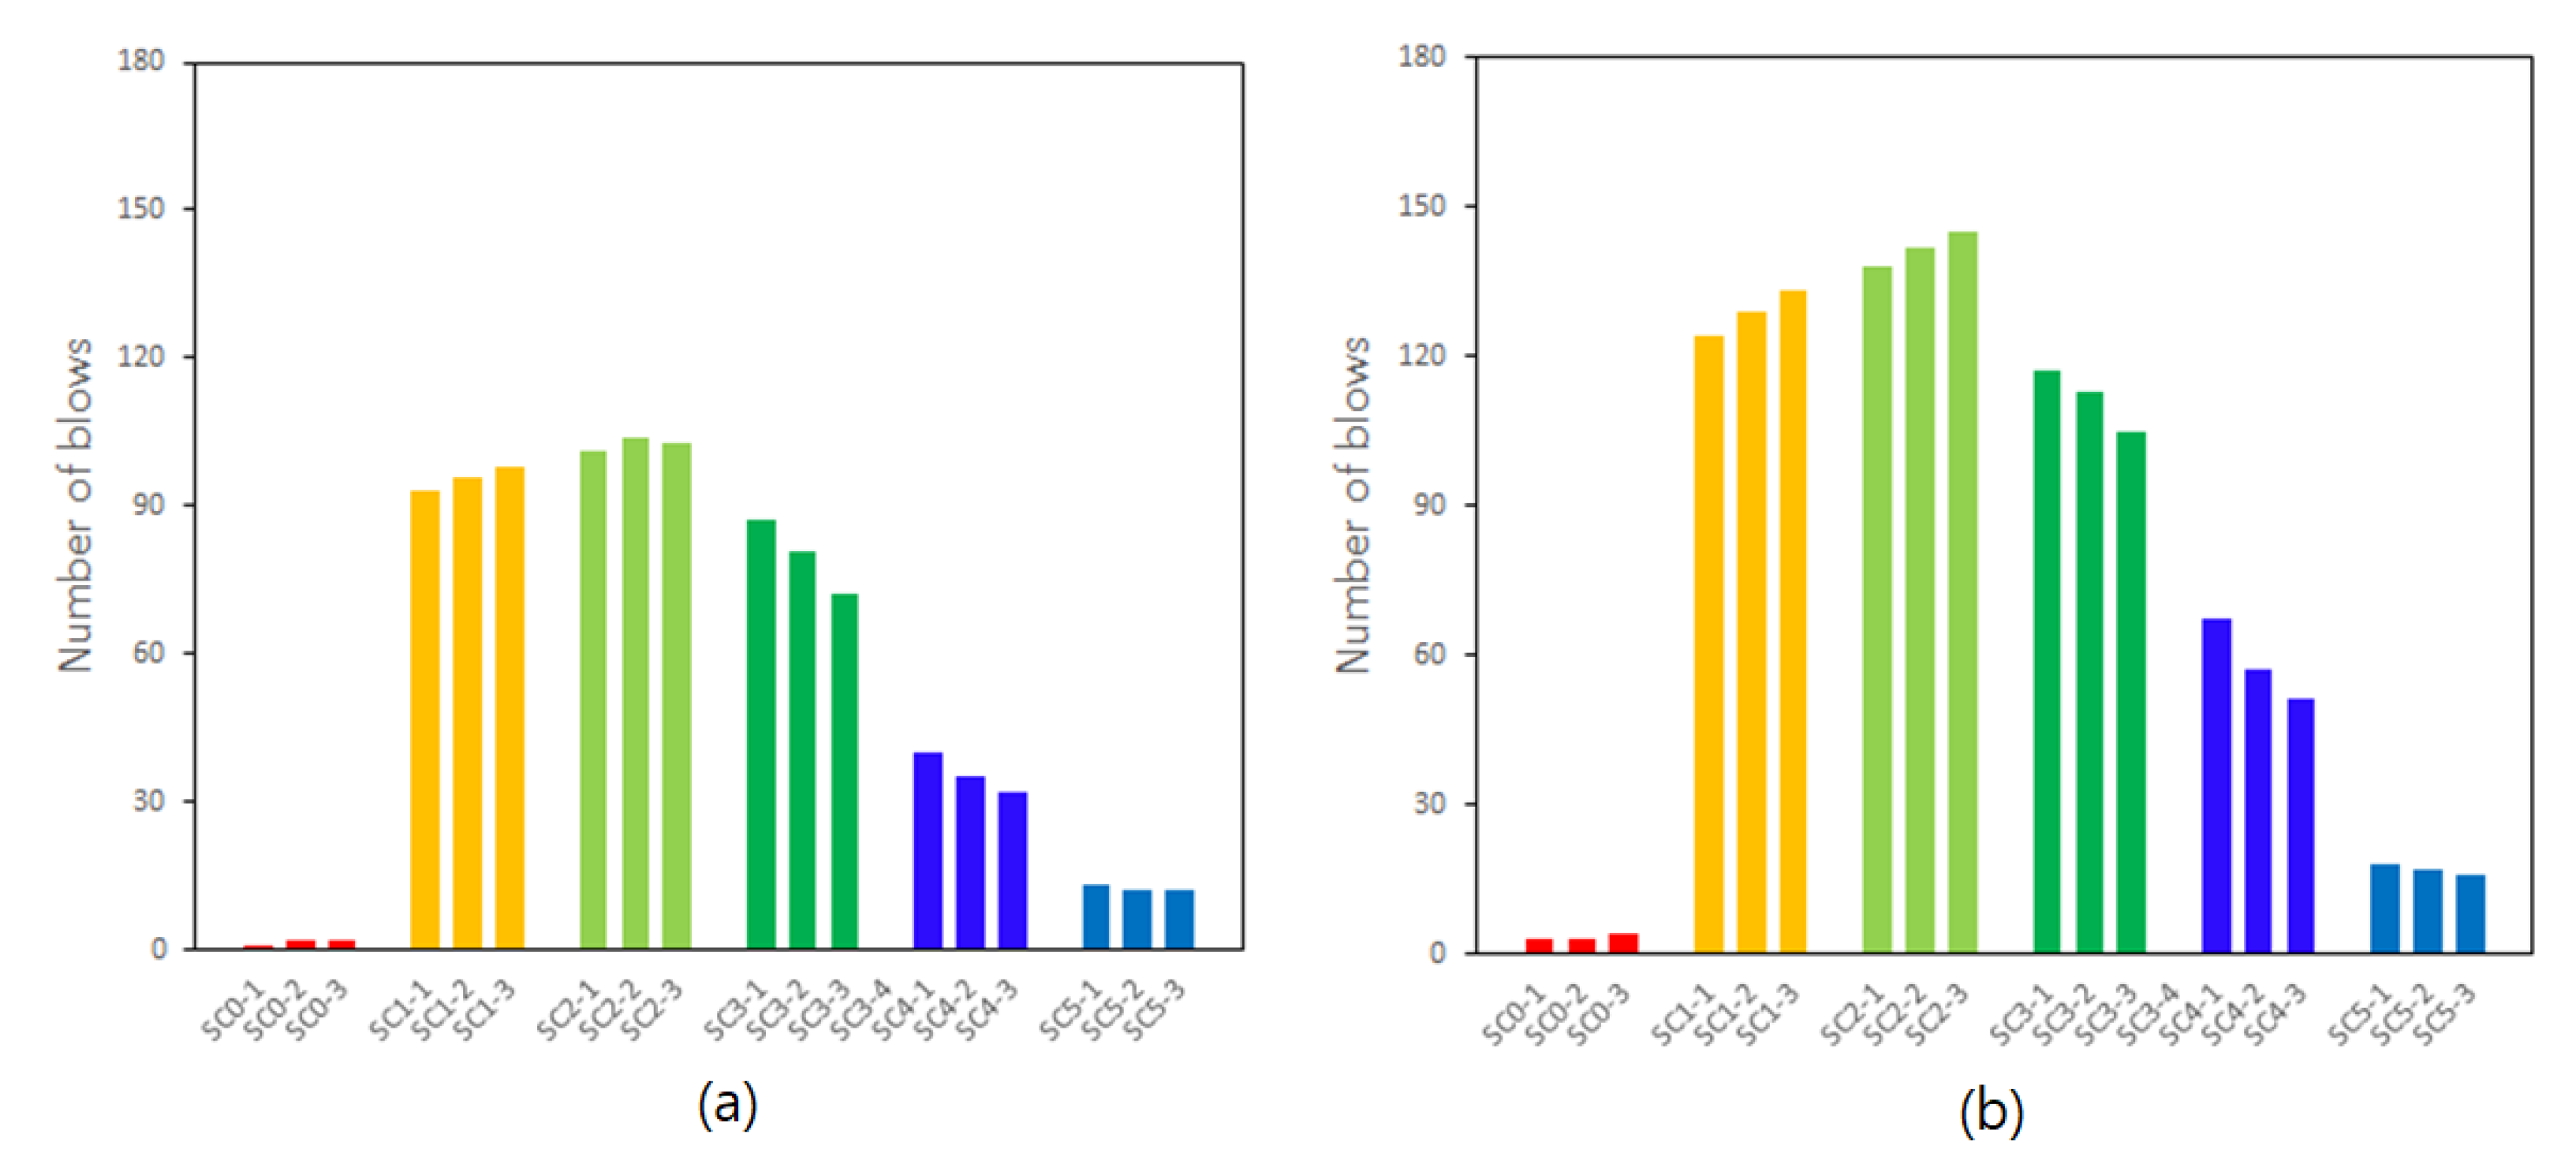
In Table 6, the test results for the impact resistance of each specimen are summarized and Figure 10 also shows the number of blows for the first crack and the number of blows for final failure. As seen in Table 6 and Figure 10, it is obvious that the impact resistance is greatly improved compared to the PM specimen if SF and CF are incorporated. The improvement of the impact resistance can be mainly due to the randomly distributed fibers in the cement matrix. These fibers, each acting as a miniature energy-absorbing mechanism, support a certain percentage of the load during each impact event. Thus, MFRCM and HyFRCM specimens can bear more impact blows and improve the impact resistance to the first crack compared to PM specimens. After the first crack occurs and is followed by the others, the fibers across these cracks act not only as energy-absorbing mechanisms but also as load transfer mechanisms. The mechanisms may defend the cracked MFRCM and HyFRCM disks against the tendency to fall into different pieces, therefore, improving the failure impact resistance. However, SF showed better performance than CF, having smaller dimensions and the same volume fraction (%) due to higher elastic modulus and tensile stress. The impact resistance of the PM specimen turned out to be about 1 to 2 blows from the first crack to the final failure, revealing that the impact ductility in the specimen had little effect. On the other hand, although there was a slight difference depending on the amount of SF and CF mixture in the case of MFRCM and HyFRCM specimens, the average number of blows from the first crack to final failure reached 39 times in the case of HyFRCM specimen containing 0.75% SF and 0.25% CF, showing that the fiber and impact ductility acted on the specimen even after the first crack occurred, resulting in a slight increase of the number of blows. Therefore, it is judged that the HyFRCM specimen containing 0.75% SF and 0.25% CF is dispersed throughout the specimen due to the cross-linking action of the fibers, and the time from the first crack to the final failure is delayed.
Meanwhile, Figure 11 shows the crack and fracture patterns of the fractured surface after the impact resistance test. As is clear from Figure 11, the specimen exhibited a brittle fracture pattern at the same time as the occurrence of abrupt micro-cracks in the vertical direction in the case of the PM specimen, whereas the MFRCM and HyFRCM specimens containing SF and CF showed cracking in the vertical or diagonal direction. It is analyzed here that the impact resistance increases as the fibers in the cement matrix exert a tensile force against the impact transmitted to the outside. As a consequence, it seems that after the first crack appearance, CF could not bridge on macro-cracks due to their short length. On the other hand, SF bridged on macro-cracks and arrested them.

4. Conclusions

In this study, the properties, such as flexural performance, compressive strength, and impact resistance of MFRCM and HyFRCM, were investigated. From the obtained experimental study, the following conclusions can be drawn:
1
The compressive strength of MFRCM and HyFRCM did not improve significantly compared to PM, whereas the flexural strength showed a high improvement effect of about 60.5~148.5%.
2
The mechanical properties of HyFRCM with high SF content were relatively higher than those with low SF content, and HyFRCM containing 0.75% SF and 0.25% CF featured higher strength and impact resistance than other HyFRCM and MFRCM.
3
Although the flexural strength of HyFRCM containing 0.5% SF and 0.5% CF was slightly low, the maximum effect was exhibited in terms of flexural toughness, and the effect of improving flexural toughness by hybridization of SF and CF could be confirmed.
4
Compared to PM, both MFRCM and HyFRCM significantly improved flexural performance, such as maximum flexural strength, flexural toughness, and equivalent flexural strength. In the case of HyFRCM, the application of equivalent flexural strength is judged to be a rather conservative evaluation since it has a predetermined residual flexural strength and a large amount of flexural toughness even under a deflection of 2.0 mm or more.
5
The flexural toughness test results showed that the average flexural toughness of T600 and T150 in HyFRCM containing 0.5% SF and 0.5% CF was 8.1 J and 32.7 J, respectively. After cracking, flexural toughness was greatly improved, which was the most effective in terms of load-carrying capacity.
6
From the impact resistance test, the number of blows from the first crack to the final fracture of the PM specimen is found to be about 1 to 2, whereas, in the case of MFRCM and other HyFRCM specimens, there was a slight difference depending on the amount of SF and CF incorporated but, HyFRCM specimen incorporated with 0.75% SF and 0.25% CF showed the utmost impact resistance. It is thus believed that the effect of increasing the impact ductility by SF and CF is large.

Author Contributions

Conceptualization, J.-G.P. and G.-H.H.; methodology, J.-G.P. and D.-J.S.; validation, G.-H.H. and D.-J.S.; formal analysis, J.-G.P. and D.-J.S.; investigation, J.-G.P. and D.-J.S.; writing—original draft preparation, J.-G.P.; writing—review and editing, G.-H.H. and D.-J.S.; visualization, J.-G.P. and D.-J.S.; supervision, G.-H.H.; project administration, G.-H.H.; funding acquisition, G.-H.H. All authors have read and agreed to the published version of the manuscript.

Funding

This research was funded by Basic Science Research Program through the National Research Foundation of Korea (NRF) of the Ministry of Education, Republic of Korea (Grant no. NRF-2018R1A6A1A03025542).

Institutional Review Board Statement

Not applicable.

Informed Consent Statement

Not applicable.

Data Availability Statement

Not applicable.

Acknowledgments

This research was supported by Basic Science Research Program through the National Research Foundation of Korea (NRF) funded by the Ministry of Education (Grant no. NRF-2018R1A6A1A03025542).

Conflicts of Interest

The authors declare that there is no conflict of interest.

References

  1. Malchiodi, B.; Marchetti, R.; Barbieri, L.; Pozzi, P. Recovery of cork manufacturing waste within mortar and polyurethane: Feasibility of use and physical, mechanical, thermal insulating properties of the final green composite construction materials. Appl. Sci. 2022, 12, 3844. [Google Scholar] [CrossRef]
  2. Nili, M.; Afroughsabet, V. The long-term compressive strength and durability properties of silica fume fiber-reinforced concrete. Mater. Sci. Eng. A 2012, 531, 107–111. [Google Scholar] [CrossRef]
  3. ACI 544.2R-89; Measurement of Properties of Fiber Reinforced Concrete (Reapproved 2009). ACI Committee 544: Farmington Hills, Mi, USA, 2009.
  4. Brandt, A.M. Fibre reinforced cement-based (FRC) composites after over 40 years of development in building and civil engineering. Compos. Struct. 2008, 86, 3–9. [Google Scholar] [CrossRef]
  5. Yoo, D.-Y.; Banthia, N. Mechanical properties of ultra-high-performance fiber-reinforced concrete: A review. Cem. Concr. Compos. 2016, 73, 267–280. [Google Scholar] [CrossRef]
  6. Hussein, Z.M.; Khalil, W.L.; Hisham; Ahmed, K. Impact strength and shrinkage of sustainable fiber reinforced crushed brick aggregate concrete. Mater. Proc. 2021, 42, 3022–3027. [Google Scholar] [CrossRef]
  7. Mastali, M.; Dalvand, A. Use of silica fume and recycled steel fibers in self-compacting concrete (SCC). Constr. Build. Mater. 2016, 125, 196–209. [Google Scholar] [CrossRef]
  8. Won, J.-P.; Park, C.-G. Effects of specialty cellulose fibers on improvement of flexural performance and control of cracking of concrete. J. Korea Concr. Inst. 2000, 4, 89–98. [Google Scholar]
  9. Heo, G.-H.; Park, J.-G.; Kim, C.-G. Evaluating the resistance performance of the VAEPC and the PAFRC composites against a low-velocity impact in varying temperature. Adv. Civ. Eng. 2020, 2020, 7901512. [Google Scholar] [CrossRef]
  10. Kim, K.-C.; Yang, I.-H.; Joe, C. Effects of single and hybrid steel fiber lengths and fiber contents on the mechanical properties of high-strength fiber-reinforced concrete. Adv. Civ. Eng. 2018, 2018, 7826156. [Google Scholar] [CrossRef]
  11. Nili, M.; Afroughsabet, V. The effects of silica fume and polypropylene fibers on the impact resistance and mechanical properties of concrete. Constr. Build. Mater. 2010, 24, 927–933. [Google Scholar] [CrossRef]
  12. Yoo, D.-Y.; Yoon, Y.-S. A review on structural behavior, design, and application of ultra-high-performance fiber-reinforced concrete. Int. J. Concr. Struct. Mater. 2016, 10, 125–142. [Google Scholar] [CrossRef] [Green Version]
  13. Banthia, N.; Soleimani, S.M. Flexural response of hybrid fiber-reinforced cementitious composites. ACI Mater. J. 2005, 102, 382–389. [Google Scholar]
  14. Kim, D.-J.; Park, S.-H.; Ryu, G.-S.; Koh, K.-T. Comparative flexural behavior of hybrid ultra high performance fiber reinforced concrete with different macro fibers. Constr. Build. Mater. 2011, 25, 4144–4155. [Google Scholar] [CrossRef]
  15. Lee, J.-H.; Park, C.-G. Effect of polyvinyl alcohol fiber volume fraction on pullout behavior of structural synthetic fiber in hybrid fiber reinforced cement composites. J. Korea Concr. Inst. 2011, 23, 461–469. [Google Scholar] [CrossRef]
  16. Rashiddadash, P.; Ramezanianpour, A.A.; Mahdikhani, M. Experimental investigation on flexural toughness of hybrid fiber reinforced concrete (HFRC) containing metakaolin and pumice. Constr. Build. Mater. 2014, 51, 313–320. [Google Scholar] [CrossRef]
  17. Ivorra, S.; Garcés, P.; Catalá, G.; Andión, L.G.; Zornoza, E. Effect of silica fume particle size on mechanical properties of short carbon fiber reinforced concrete. Mater. Des. 2010, 31, 1553–1558. [Google Scholar] [CrossRef]
  18. Tassew, S.T.; Lubell, A.S. Mechanical properties of glass fiber reinforced ceramic concrete. Constr. Build. Mater. 2014, 51, 215–224. [Google Scholar] [CrossRef]
  19. Monaldo, E.; Nerilli, F.; Vairo, G. Basalt-based fiber-reinforced materials and structural applications in civil engineering. Compos. Struct. 2019, 214, 246–263. [Google Scholar] [CrossRef]
  20. Ralegaonkar, R.; Gavali, H.; Aswath, P.; Abolmaali, S. Application of chopped basalt fibers in reinforced mortar: A reviewBasalt-based fiber-reinforced materials and structural applications in civil engineering. Constr. Build. Mater. 2018, 164, 589–602. [Google Scholar] [CrossRef]
  21. Atahan, H.N.; Pekmezci, B.Y.; Tuncel, E.Y. Behavior of PVA fiber-reinforced cementitious mposites under static and impact flexural effects. J. Mater. Civ. Eng. 2013, 25, 1438–1445. [Google Scholar] [CrossRef]
  22. Huang, J.; Zhou, Y.; Yang, X.; Dong, Y.; Jin, M.; Liu, J. A multi-scale study of enhancing mechanical property in ultra-high performance concrete by steel-fiber@nano-silica. Constr. Build. Mater. 2022, 342, 128069. [Google Scholar] [CrossRef]
  23. Pakravan, H.R.; Ozbakkaloglu, T. Synthetic fibers for cementitious composites: A critical and in-depth review of recent advances. Constr. Build. Mater. 2019, 207, 491–518. [Google Scholar] [CrossRef]
  24. Markovic, I. High-Performance Hybrid-Fibre Concrete–Development and Utilisation. Ph.D. Thesis, Technische University, Delft, The Netherlands, 2006. [Google Scholar]
  25. Pakravan, H.R.; Latifi, M.; Jamshidi, M. Hybrid short fiber reinforcement system in concrete: A review. Constr. Build. Mater. 2017, 142, 280–294. [Google Scholar] [CrossRef]
  26. Vandewalle, L. Postcracking behaviour of hybrid steel fiber reinforced concrete. In Proceedings of the 6th International Conference on Fracture Mechanics of Concrete and Concrete Structures, Catania, Italy, 17–22 June 2007. [Google Scholar]
  27. ASTM 1609/C 1609M; Standard Test Method for Flexural Performance of Fibre-Reinforced Concrete (Using Beam with Third-Point Loading). American Society for Testing Materials (ASTM): West Conshohocken, PA, USA, 2008.
  28. KS F 2566; Standard Test Method for Flexural Performance of Fiber Reinforced Concrete. Korean Agency for Technology and Standards (KATS): Eumseong County, Korea, 2014.
  29. KS F 2221; Test Method of Impact for Building Boards. Korean Agency for Technology and Standards (KATS): Eumseong County, Korea, 2009.
  30. KS L ISO 679; Methods of Testing Cements-Determination of Strength. Korean Agency for Technology and Standards (KATS): Eumseong County, Korea, 2016.
  31. Betterman, L.R.; Ouyang, C.; Shah, S.P. Fiber-matrix interaction in microfiber-reinforced mortar. Adv. Cem. Base Mater. 1995, 2, 53–61. [Google Scholar] [CrossRef]
  32. Heo, G.-H.; Park, J.-G.; Song, K.-C.; Park, J.-H.; Jun, H.-M. Mechanical properties of SiO2-coated carbon fiber-reinforced mortar composites with different fiber length and fiber volume fractions. Adv. Civ. Eng. 2020, 2020, 8881273. [Google Scholar] [CrossRef]
  33. ASTM C 1018; Standard Test Method for Flexural Toughness and First-Crack Strength of Fibre-Reinforced Concrete (Using Beam with Third-Point Loading). American Society for Testing Materials (ASTM): West Conshohocken, PA, USA, 1997.
  34. JSCE-SF4; Methods of Tests for Flexural Strength and Flexural Toughness of Steel Fiber Reinforced Concrete. Japan Society of Civil Engineers (JSCE): Tokyo, Japan, 1984.
  35. Banthia, N.; Trottier, J.F. Test methods for flexural toughness characterization of fiber reinforced concrete: Some concerns and a proposition. ACI Mater. J. 1995, 92, 48–57. [Google Scholar]
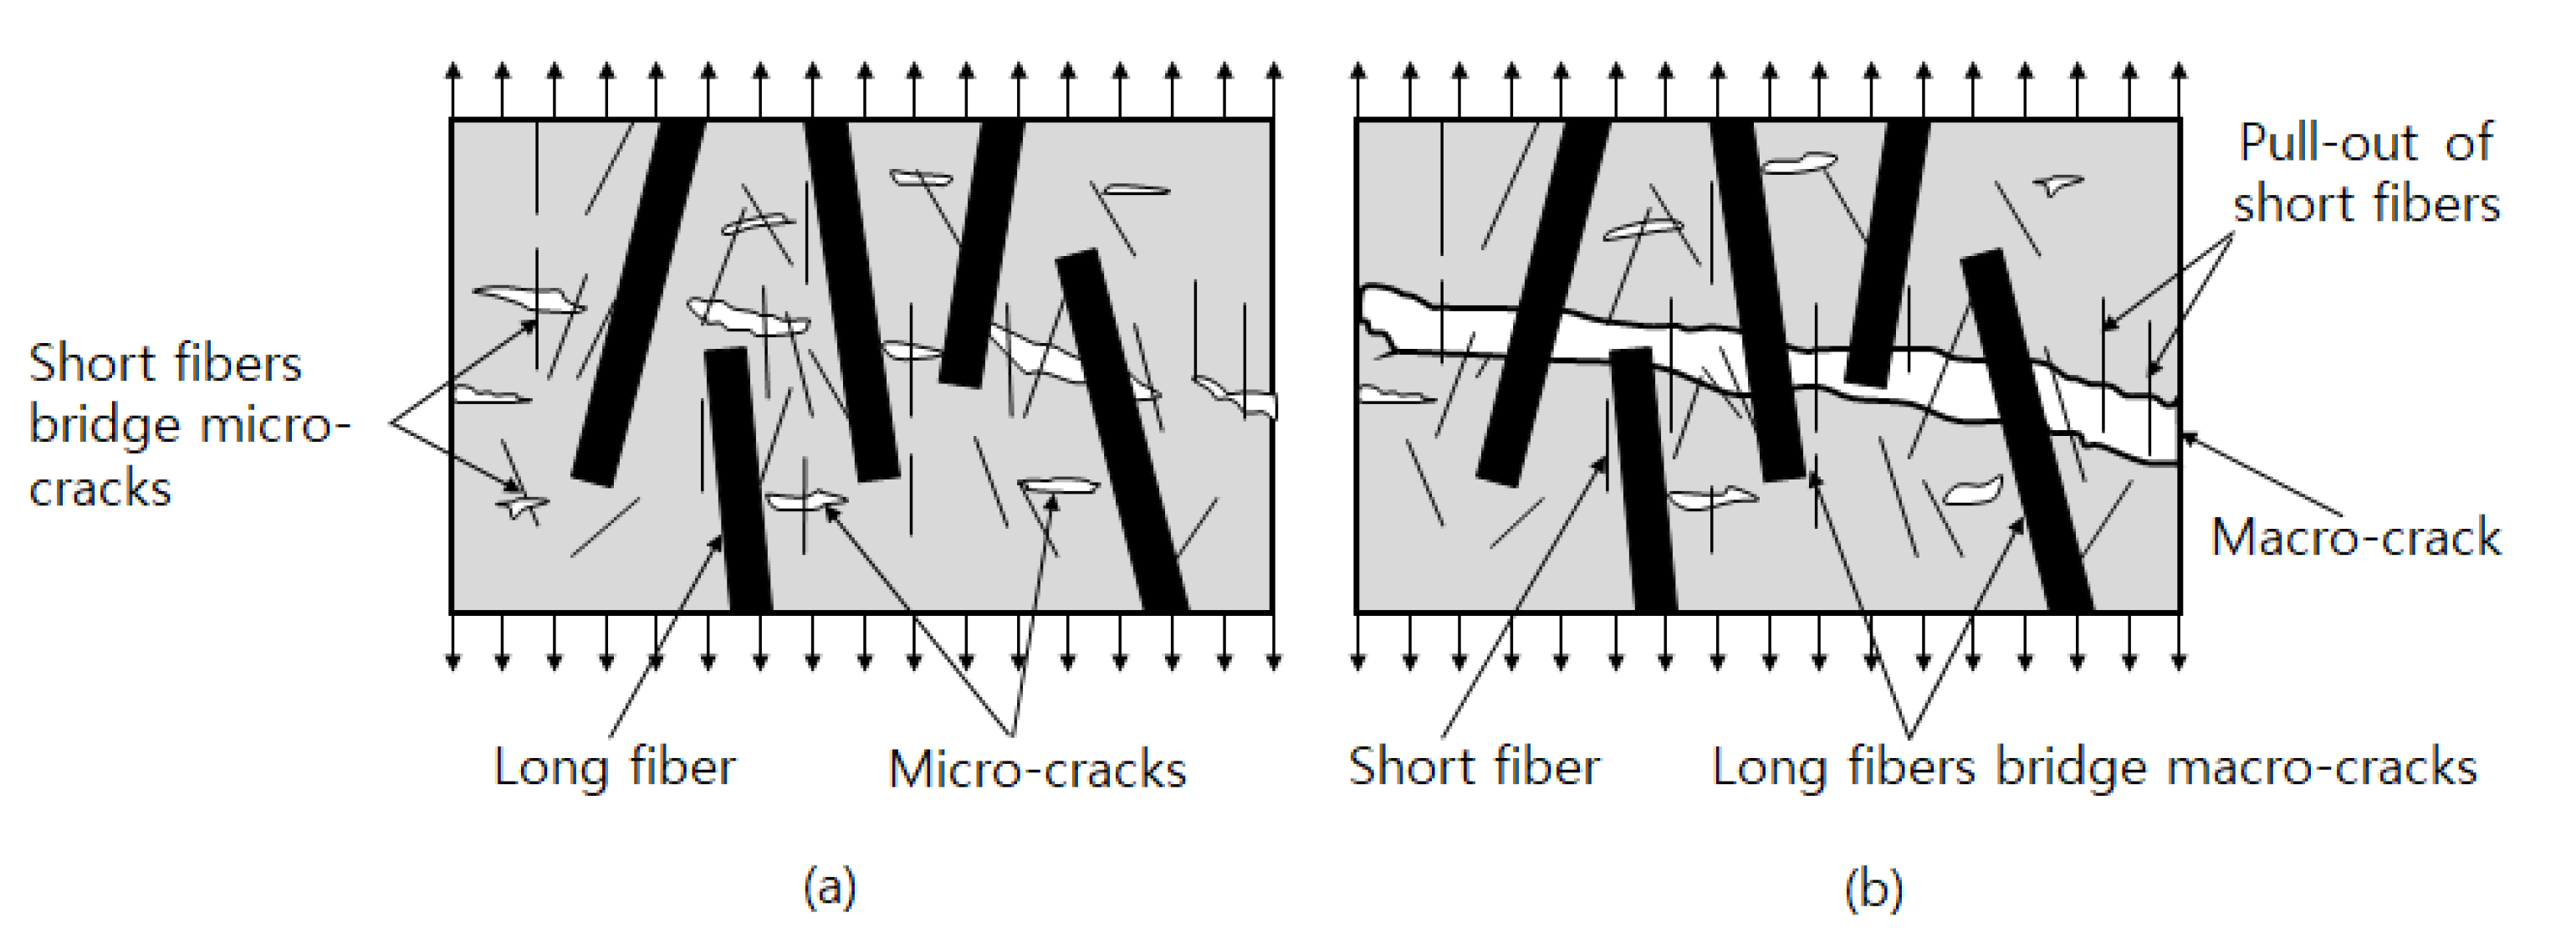
Figure 1. Bridging action of the hybrid with different size; (a) first phase of loading, and (b) second phase of loading.
Applsci 12 09439 g001
Figure 2. Morphology of fibers; (a) SF, and (b) CF.
Applsci 12 09439 g002
Figure 3. View of specimens and set-up for flexural performance test.
Applsci 12 09439 g003
Figure 4. Definition of flexural toughness according to ASTM C1609/C1609M and KS F 2566; (a) when the maximum load and the first peak load match, and (b) when the maximum load and the first peak load are different.
Applsci 12 09439 g004
Figure 5. Impact resistance test; (a) schematic diagram for specimen fabrication, and (b) used apparatus for implementation of impact resistance test.
Applsci 12 09439 g005
Figure 6. Flexural strength of MFRCM and HyFRCM versus PM.
Applsci 12 09439 g006
Figure 7. Compressive strength of MFRCM and HyFRCM versus PM.
Applsci 12 09439 g007
Figure 8. Variation of calculation results of (a) equivalent flexural strength, and (b) residual flexural strength.
Applsci 12 09439 g008
Figure 9. Flexural toughness of MFRCM and HyFRCM; (a) when the deflection is L/600 (0.5 mm), and (b) when the deflection is L/150 (2.0 mm).
Applsci 12 09439 g009
Figure 10. Number of blows for specimens; (a) first crack, and (b) final failure.
Applsci 12 09439 g010
Figure 11. Failure surface of specimens under impact resistance; (a) PM, (b) MFRCM (SF), (c) MFRCM (CF), and (d) HyFRCM (SF and CF).
Applsci 12 09439 g011
Table 1. Physical properties of SF.
Length
(mm)
Diameter
(mm)
Aspect Ratio
(L/D)
Density
(g/cm3)
Tensile Strength
(MPa)
Elongation
(%)
Elastic Modulus
(GPa)
300.5607.851100>3.5>210
Table 2. Physical properties of CF.
Length
(mm)
Diameter
(μm)
Aspect Ratio
(L/D)
Density
(g/cm3)
Tensile Strength
(MPa)
Elongation
(%)
Elastic Modulus
(GPa)
Carbon Content
(%)
678571.849002.1230>92
Table 3. Mixture designation and used materials proportions.
Designation of MixturesFiber TypeFiber Mix Proportion by Volume (Vf)Total Volume Fraction (%)Mixture Proportions
(Unit Weight, kg/m3)
SP
(C × %)
(%)(kg/m3)WCFA
SP0 (plain)00.00.00.02976451290-
SC1SF
CF
1.0
0.0
78.5
0.0
1.029764512900.0~1.5
SC2SF
CF
0.75
0.25
58.87
13.50
SC3SF
CF
0.5
0.5
39.25
9.00
SC4SF
CF
0.25
0.75
19.62
4.50
SC5SF
CF
0.0
1.0
0.0
18.0
W, water; C, cement; FA, fine aggregate; SP, super-plasticizer.
Table 4. Calculation results of equivalent flexural strength and residual flexural strength.
Mixture IDFiber Mix Proportion by Volume (%)Total Volume Fraction (%)fr
(MPa)
(1)
fr
(MPa)
(2)
fr/fr
(2)/(1)
Rr
(MPa)
(3)
Rr/fr
(3)/(1)
SFCF
SC0-10002.94(0.21)(0.07)--
SC0-23.24(0.15)(0.05)--
SC0-33.09(0.18)(0.06)--
Average 3.09(0.18)(0.06)
SC1-1101.05.793.970.692.880.50
SC1-25.974.410.743.300.55
SC1-35.794.080.702.940.51
Average5.854.150.713.040.52
SC2-10.750.258.164.760.583.120.38
SC2-27.204.400.612.880.40
SC2-37.684.510.593.090.40
Average7.684.560.593.030.39
SC3-10.50.57.504.410.592.960.40
SC3-27.445.360.723.510.47
SC3-37.564.950.653.450.46
Average7.504.910.653.310.44
SC4-10.250.756.422.930.461.440.22
SC4-25.342.330.441.320.25
SC4-35.882.760.471.260.21
Average5.882.670.461.340.23
SC5-1014.83(1.28)(0.26)--
SC5-25.10(1.19)(0.23)--
SC5-34.95(1.23)(0.25)
Average 4.96(1.23)(0.25)
fr, maximum flexural strength; fr, equivalent flexural strength; fr/fr, equivalent flexural strength ratio; Rr, residual flexural strength; Rr/fr, residual flexural strength ratio; values in brackets indicate the value destroyed ones when the span did not reach L/150 (2 mm).
Table 5. Test results of flexural performance indices using ASTM C 1609 and KS F 2566.
Mixture IDFiber Mix Proportion by Volume (%)Total Volume Fraction (%)P600
(kN)
P150
(kN)
f600
(MPa)
f150
(MPa)
T600
(J)
T150
(J)
SFCF
SC0-1000------
SC0-2------
SC0-3------
Average
SC1-1101.018.49.605.522.885.0126.5
SC1-218.510.85.553.245.9929.4
SC1-318.99.805.672.945.5027.2
Average18.610.15.583.025.5027.7
SC2-10.750.2525.310.57.593.155.0531.7
SC2-221.99.916.572.974.9529.3
SC2-322.910.26.873.064.9930.1
Average23.410.27.013.065.0030.4
SC3-10.50.524.39.797.292.937.7129.4
SC3-223.611.77.083.518.5035.7
SC3-324.011.57.203.458.1133.0
Average24.011.07.193.308.1132.7
SC4-10.250.7518.24.805.461.444.7519.5
SC4-212.44.303.721.294.1515.5
SC4-315.94.204.771.264.6018.4
Average15.54.434.651.334.5017.8
SC5-10115.2-4.56-4.59-
SC5-215.3-4.59-4.44-
SC5-315.2-4.56-4.50-
Average 15.2 4.57 4.51
Table 6. Results obtained from the impact resistance test.
Mixture IDNo. of Blows for First Crack (1)No. of Blows for Final Failure (2)Increased
(2) − (1)
Absorbed Energy
(First Crack) (N-m)
Absorbed Energy
(Final Failure) (N-m)
SC0-11328.8226.46
SC0-223117.6426.46
SC0-324217.6435.28
Average23214.7029.40
SC1-19312431820.261093.68
SC1-29612933846.721137.78
SC1-39813335864.361173.06
Average9612933843.781134.84
SC2-110113837890.821217.16
SC2-210414238917.281252.44
SC2-310414541917.281278.90
Average10314239908.461249.50
SC3-18711730767.341031.94
SC3-28111332714.42996.66
SC3-37210533635.04926.10
Average8011232705.60984.90
SC4-1406727352.80590.94
SC4-2355722308.70502.74
SC4-3325119282.24449.82
Average365823314.58514.50
SC5-113185114.66158.76
SC5-212175105.84149.94
SC5-312164105.84141.12
Average12175108.78149.94
Publisher’s Note: MDPI stays neutral with regard to jurisdictional claims in published maps and institutional affiliations.