Article

Novel Application of Infrared Radiation Therapy: Spirit Identity Powder-Generated Far Infrared Radiation Inhibits the Proliferation of Human Male Liver Cancer Cells by Activating the Transmembrane Attack Complex

SI BIO-Research Institute, SI Vector. Co., Ltd., 49, Anseong-si 17525, Korea
*
Author to whom correspondence should be addressed.
Appl. Sci. 2022, 12(19), 9416; https://doi.org/10.3390/app12199416
Submission received: 19 August 2022 / Revised: 9 September 2022 / Accepted: 10 September 2022 / Published: 20 September 2022
(This article belongs to the Section Biomedical Engineering)

Abstract

:
Far infrared radiation (FIR) has been primarily used as a therapeutic modality for its inhibitory effect on the proliferation of cancer cells. Previous studies have focused on the inhibitory effects of FIR on mitochondrial metabolism, neglecting its effect on cancer cell membranes. In this study, we investigated the biological inhibitory effect of FIR on the membrane of liver cancer cells. We fabricated an FIR radiator (power density of 37.2 mW/cm2, emissivity of 92.3%) using spirit identity (SI) powder and irradiated liver cancer cells for 3 h for 3 days, resulting in decreased cell viability and ATP production in irradiated cells. To corroborate the mechanism underlying the inhibitory effect on the cell membrane, we performed transcriptional analyses of mRNA and protein expression. Transcriptional analysis showed activation of transmembrane signaling receptors in the gene ontology and systemic lupus erythematosus in the KEGG pathway. The mRNA results showed significantly high expression of membrane attack complex (MAC), and protein analysis results showed a higher expression of proteins C7 and C8β than C5 and C6. Thus, SI powder-generated FIR can inhibit the proliferation of liver cancer cells by activating the MAC in the cell membrane.

1. Introduction

The far infrared is a region in the infrared spectrum of electromagnetic radiation, defined as any radiation with a wavelength of 3–1000 µm. Owing to its long wavelength, far infrared radiation (FIR) can penetrate up to 40 mm beneath the skin [1]. Furthermore, FIR allows even transmission of energy as heat [2,3], applying rotational and vibrational modes to the molecule-forming bonds. This motion can alter cell membrane potential and mitochondrial metabolism [4]. Therefore, FIR can serve as a non-invasive and convenient therapeutic modality through its thermal and non-thermal effects [5,6]. FIR reportedly improves blood flow, endothelial function, and ventricular arrhythmias, reducing the frequency of cardiovascular diseases, and improving the patency of arteriovenous fistulas in patients with hemodialysis [6,7,8,9]. FIR also increased angiogenesis in mice with hindlimb ischemia by upregulating arterial endothelial nitric oxide synthase (eNOS) [6]. Besides, FIR stimulated cell signaling as a non-thermal effect. For instance, FIR stimulated platelet-derived growth factor-mediated skeletal muscle cell migration through extracellular matrix-integrin signaling [10]. FIR can also promote ischemia-induced angiogenesis in diabetic mice, restoring high glucose-suppressed endothelial progenitor cell functions both in vitro and in vivo [11]. Moreover, FIR exposure attenuated high-grade glycosylation end-product-induced damage in vascular endothelial cells activated by promyelocytic leukemia zinc finger protein and alleviated ischemia-reperfusion injury induced by heme oxygenase-1 in rat testis [12,13].
In contrast, FIR has also been known to exert inhibitory effects on cells. FIR exposure curbed the vascular endothelial growth factor (VEGF)-induced proliferation and phosphorylation of extracellular signal-regulated kinases in human umbilical vein endothelial cells (HUVEC) and the proliferation of human tongue squamous carcinoma cells (HSC3) and human epidermoid carcinoma cells (A431) via overexpression of a 70 kDa heat shock protein (HSP70) [14,15]. In cancer therapy, FIR reportedly inhibits murine melanoma cell growth [16]. FIR inhibited the proliferation, migration, and angiogenesis of HUVEC via decreasing secretory clustering [17]. In addition, FIR inhibited breast cancer cell proliferation via increased nuclear Ca2+/calmodulin binding-modulated activation of checkpoint kinase 2 and suppressed the proliferation of human lung cancer cells by activating transcription factor 3 (ATF3) [18,19]. Consequently, FIR exerts excitatory or inhibitory effects on cells. The FIR energy density used in these studies [1,15] ranged from 0.1–13 mW/cm2, suggesting that these effects do not depend on the density of FIR but on the cellular signals specifically triggering FIR. Cell signaling can be classified into two kinds: anabolism and catabolism. FIR affects cells via anabolism. During anabolism, FIR is absorbed by mitochondrial cytochrome c oxidase in the form of photons similar to near-infrared radiation [20,21,22]. These accepted photons activate the enzyme by photodissociating the inhibitory molecule (NO) from the copper B site [23]. The loss of NO yields a marked elevation in mitochondrial membrane potential, which increases electron transport, oxygen consumption, and adenosine triphosphate (ATP), leading to the activation of transcription factors [24], ultimately benefiting cells and tissues. However, which FIR exposure affects the cellular plasma membrane to trigger anabolism is still unknown. The mechanism related to anabolism likely involves the mitochondrial membrane, particularly mitochondrial calcium channels [25]. Therefore, this study aimed to investigate the inhibitory effect of FIR on cancer cells via the complement membrane attack complex (MAC) in the plasma membrane. To this end, we fabricated a tourmaline-based powder and induced an FIR-inhibitory effect on cells.

2. Materials and Methods

2.1. Spirit Identity (SI) Fabrication

The SI powder was carefully fabricated by mixing tourmaline (56.24%; TaeYangBio, Buyeo-gun, Korea), CaOH (18.18%; Baek Kwang Mineral Products, Seoul, Korea), CaSO4 (1.29%; Serim Food, Bucheon-si, Korea), reduced graphene oxide (1.18%; Graphene Alpha, Jangsu-gun, Korea), amethyst (1.06%; Sejin, Gyeongju-si, Korea), and other materials (22.11%) as shown in Figure 1. A small sample of the resulting SI powder was used for characterization by scanning electron microscopy (SEM), energy dispersive spectrometer (EDS), and X-ray diffraction (XRD). For the cellular experiment, SI powder was flattened into a thin fabric (with width, height, and thickness of 90 mm × 130 mm × 5 mm, respectively) and set at 50 mm from the bottom of the culture plates for daily treatment in the incubator (ST180, Thermofisher, Merelbeke, Belgium), as shown in Figure 2A.

2.2. Cell Culture

The human male liver cancer cell line SNU-761 (Seoul, Korea) was purchased from the Korean Cell Line Bank. Cells were maintained in RPMI 1640 medium (Welgene, Gyeongsan-si, Korea), supplemented with 10% fetal bovine serum and 1% antibiotics (penicillin, 100 U/mL) and streptomycin (100 μg/mL; Gibco, Life Technologies Cells), and were incubated at 37 °C in a humidified environment with 5% CO2. Then, 3 × 10⁵ cells were seeded in 100-mm-diameter culture dishes (NuncTM, Thermo Scientific, Merelbeke, Belgium) for proliferation.

2.3. Cell Viability

Cell viability was investigated using the water-soluble tetrazolium salt-1 (WST-1) assay (EZ-3000, DoGenBio, Seoul, Korea), and 1.0 × 10⁴ cells were seeded in a 96-well plate (NuncTM, Thermo Scientific, Merelbeke, Belgium) 24 h before the experiment. Next, the plate was placed on the flat SI powder fabric. The cell viability was assessed 1, 2, and 3 days after seeding. Absorption was measured at 450 nm using a plate reader (Tecan, Männedorf, Switzerland).

2.4. Adenine Tri-Phosphatase (ATP) Assay

For ATP evaluation with the ATP assay kit (ab83355, Abcam, Cambridge, UK), 1.0 × 10³ cells/well were seeded in a 96-well white plate (3610, Corning, New York, USA). The plate was then placed on the SI powder fabric. On days 1, 2, and 3, after seeding, the media was replaced with Dulbecco’s phosphate buffered saline in cold. Next, ATP assay buffer of 100 µL (included in the kit) was incorporated into lyse cells. Following lysis, cell lysates were deproteinized with perchloric acid (PCA) in cold and potassium hydroxide (KOH). The concentration of hydrogen ion was maintained at pH 6.5–8.0. Working solution for ATP was prepared according to the given manufacturer’s protocol instructions and added to the lysed cells. Afterward, samples were incubated in the dark for 30 min at room temperature, and the absorbance was measured at a wavelength of 570 nm (Synergy HT, Biotek, Winooski, VT, USA).

2.5. Affymetrix Whole Transcript Expression Arrays

For the Affymetrix whole transcript expression array, 3.0 × 10⁵ cells/well were seeded in a 6-well plate (NuncTM, Thermo Scientific, Merelbeke, Belgium) and placed on the SI powder fabric for 3 days. Next, cells were harvested, and the purity and integrity of the RNA were evaluated by OD 260/280 ratio. The RNA was analyzed by the Agilent 2100 Bioanalyzer (Agilent Technologies, Palo Alto, Santo Clara, CA, USA) for quality control. The Affymetrix whole transcript expression array was processed based on the manufacturer’s protocol (GeneChip Whole Transcript PLUS reagent kit, Thermofisher, Waltham, MA, USA). The cDNA was synthesized with the GeneChip WT (Whole Transcript) Amplification kit, according to the manufacturer’s instructions. The sense cDNA was then shattered and biotin-labeled with terminal deoxynucleotidyl transferase (TdT) using the GeneChip WT Terminal labeling kit. Labeled DNA target of about 5.5 μg was hybridized to the Affymetrix GeneChip Rat 2.0 ST Array for 16 h at 45 °C. After cleaning, hybridized arrays were stained on a GeneChip Fluidics Station 450 and scanned on a GCS3000 Scanner (Affymetrix). Signal values were calculated with the Affymetrix® GeneChip™ Command Console software. Gene Enrichment and Functional Annotation analyses for significant probe lists were performed using gene ontology (GO; Release 1 July 2022, http://geneontology.org) and KEGG (Release 1 January 2022, http://kegg.jp).

2.6. Quantitative Polymerase Chain Reaction (qPCR)

For the qPCR, 3.0 × 10⁵ cells/well were seeded in a 6-well plate (NuncTM, Thermo Scientific, Merelbeke, Belgium) and placed on the SI powder fabric for 3 days. Afterward, cells were harvested, and the cDNA was extracted using the Toyobo ReverTra Ace qPCR RT kit (TOFSQ-101, Toyobo, New York, NY, USA) for cDNA synthesis according to the manufacturer’s recommendations. Then, qPCR was carried out on a QuantStudio 12K FLEX Sequence Detection System (Applied Biosystems, Waltham, MA, USA) at a final volume of 10 µL in 384-well microtiter plates. Optimum reaction conditions were set using Universal Master Mix of 5 µL (Applied Biosystems, Waltham, USA) containing dNTPs, reaction buffer and Ampli Taq Gold, 90 nM of primer(s), MgCl2, and 250 nM fluorescence-labeled TaqMan probe. Template cDNA of 2 µL was then added to the reaction mixture. The reaction cycle was as follows: 10 min template denaturation at 95 °C, followed by 40 cycles at 95 °C for 15 s and 60 °C for 60 s. All samples in triplicate were amplified, and the corresponding data were analyzed with Sequence Detector software (Applied Biosystems, Waltham, USA). The probe assay IDs used in this study were Hs99999905 for GAPDH, Hs01004342 for C5, Hs01110040 for C6, Hs00940408 for C7, Hs00175098 for C8α, Hs00163867 for C8β, Hs00167188 for C8γ, Hs01036223 for C9, Hs01034249 for TP53, and Hs00231228 for PBX1.

2.7. Western Blot Analysis

For western blotting experiments, liver cancer cells were trypsinized into single cells, yielding 5.0 × 10⁵ cells after 3 days of daily exposure to SI powder fabric. Cell lines were lysed with RIPA buffer, including 0.1 mM EDTA, 1% IGEPAL, 150 mM NaCl, 10 mM NaF, 50 mM Tris-HCl (pH 7.8), and a protease inhibitor cocktail. Proteins were subjected to sodium dodecyl sulfate-polyacrylamide gel electrophoresis (SDS-PAGE) and transferred onto a polyvinylidene fluoride (PVDF) membrane. After transfer, complement component C8 beta chain (C8B; Invitrogen, Thermo Fisher Scientific, Chelmsford, MA, USA) and complement component 7 (C7; Invitrogen, Thermo Fisher Scientific) primary antibodies were diluted to the membrane (1:1000) at 4 °C for overnight incubation. Then, the next day, the membrane was treated with secondary antibodies at room temperature for 1 h. Protein bands were visualized by adding an enhanced chemiluminescence substrate (ECL). The quantitative densitometric value of each protein was normalized to β-actin and displayed in histograms.

2.8. Statistical Analysis

Statistical analyses were performed on datasets collected from tumor specimens. The data are presented as the mean ± standard deviation. Statistical significance between the experimental groups was determined using a two-tailed paired Student’s t-test (significance, * p < 0.05; ** p < 0.01; *** p < 0.001).

3. Results

3.1. Characterization of the SI Powder

The SI powder was characterized in the EDS of SEM as being predominantly composed of oxygen (49.52%), silicon (16.88%), calcium (10.61%), iron (5.51%), magnesium (5.15%), and aluminum (8.06%), with trace amounts of phosphate (0.74%), chloride (1.19%), potassium (0.22%), and titanium (0.35%). XRD data showed that the SI powder was composed of silicon dioxide (SiO2), identified according to the International Conference on Bioscience and Biotechnology (ICBB) number 00-047-1300 (Figure 1). The SI powder generated electromagnetic wavelengths and energy in the range of 3–1000 µm, peaking at 5–20 µm. The powder had a power density of 37.2 mW/cm2 with an emissivity of 92.3% relative to an ideal black body according to Plank’s law, measured by an FTIR spectrometer (M-2400C, Midac, Costa Mesa, CA, USA) performed by the Korean Infrared Association (Seoul, Korea). Cells were exposed to FIR for 60 min per day for 3 days.

3.2. Cell Viability and ATP Production by SI Powder

The viability of liver cancer cells was evaluated by ATP production, which SI powder inhibited. The viability of cells placed on the SI powder fabric appeared to decrease significantly over time compared to that of the control (0.15-fold change at day 3, p < 0.001). The ATP production of cells placed on the SI powder fabric was significantly diminished on day 3 (0.11-fold changes, p < 0.01) compared to that of the control group (Figure 2).

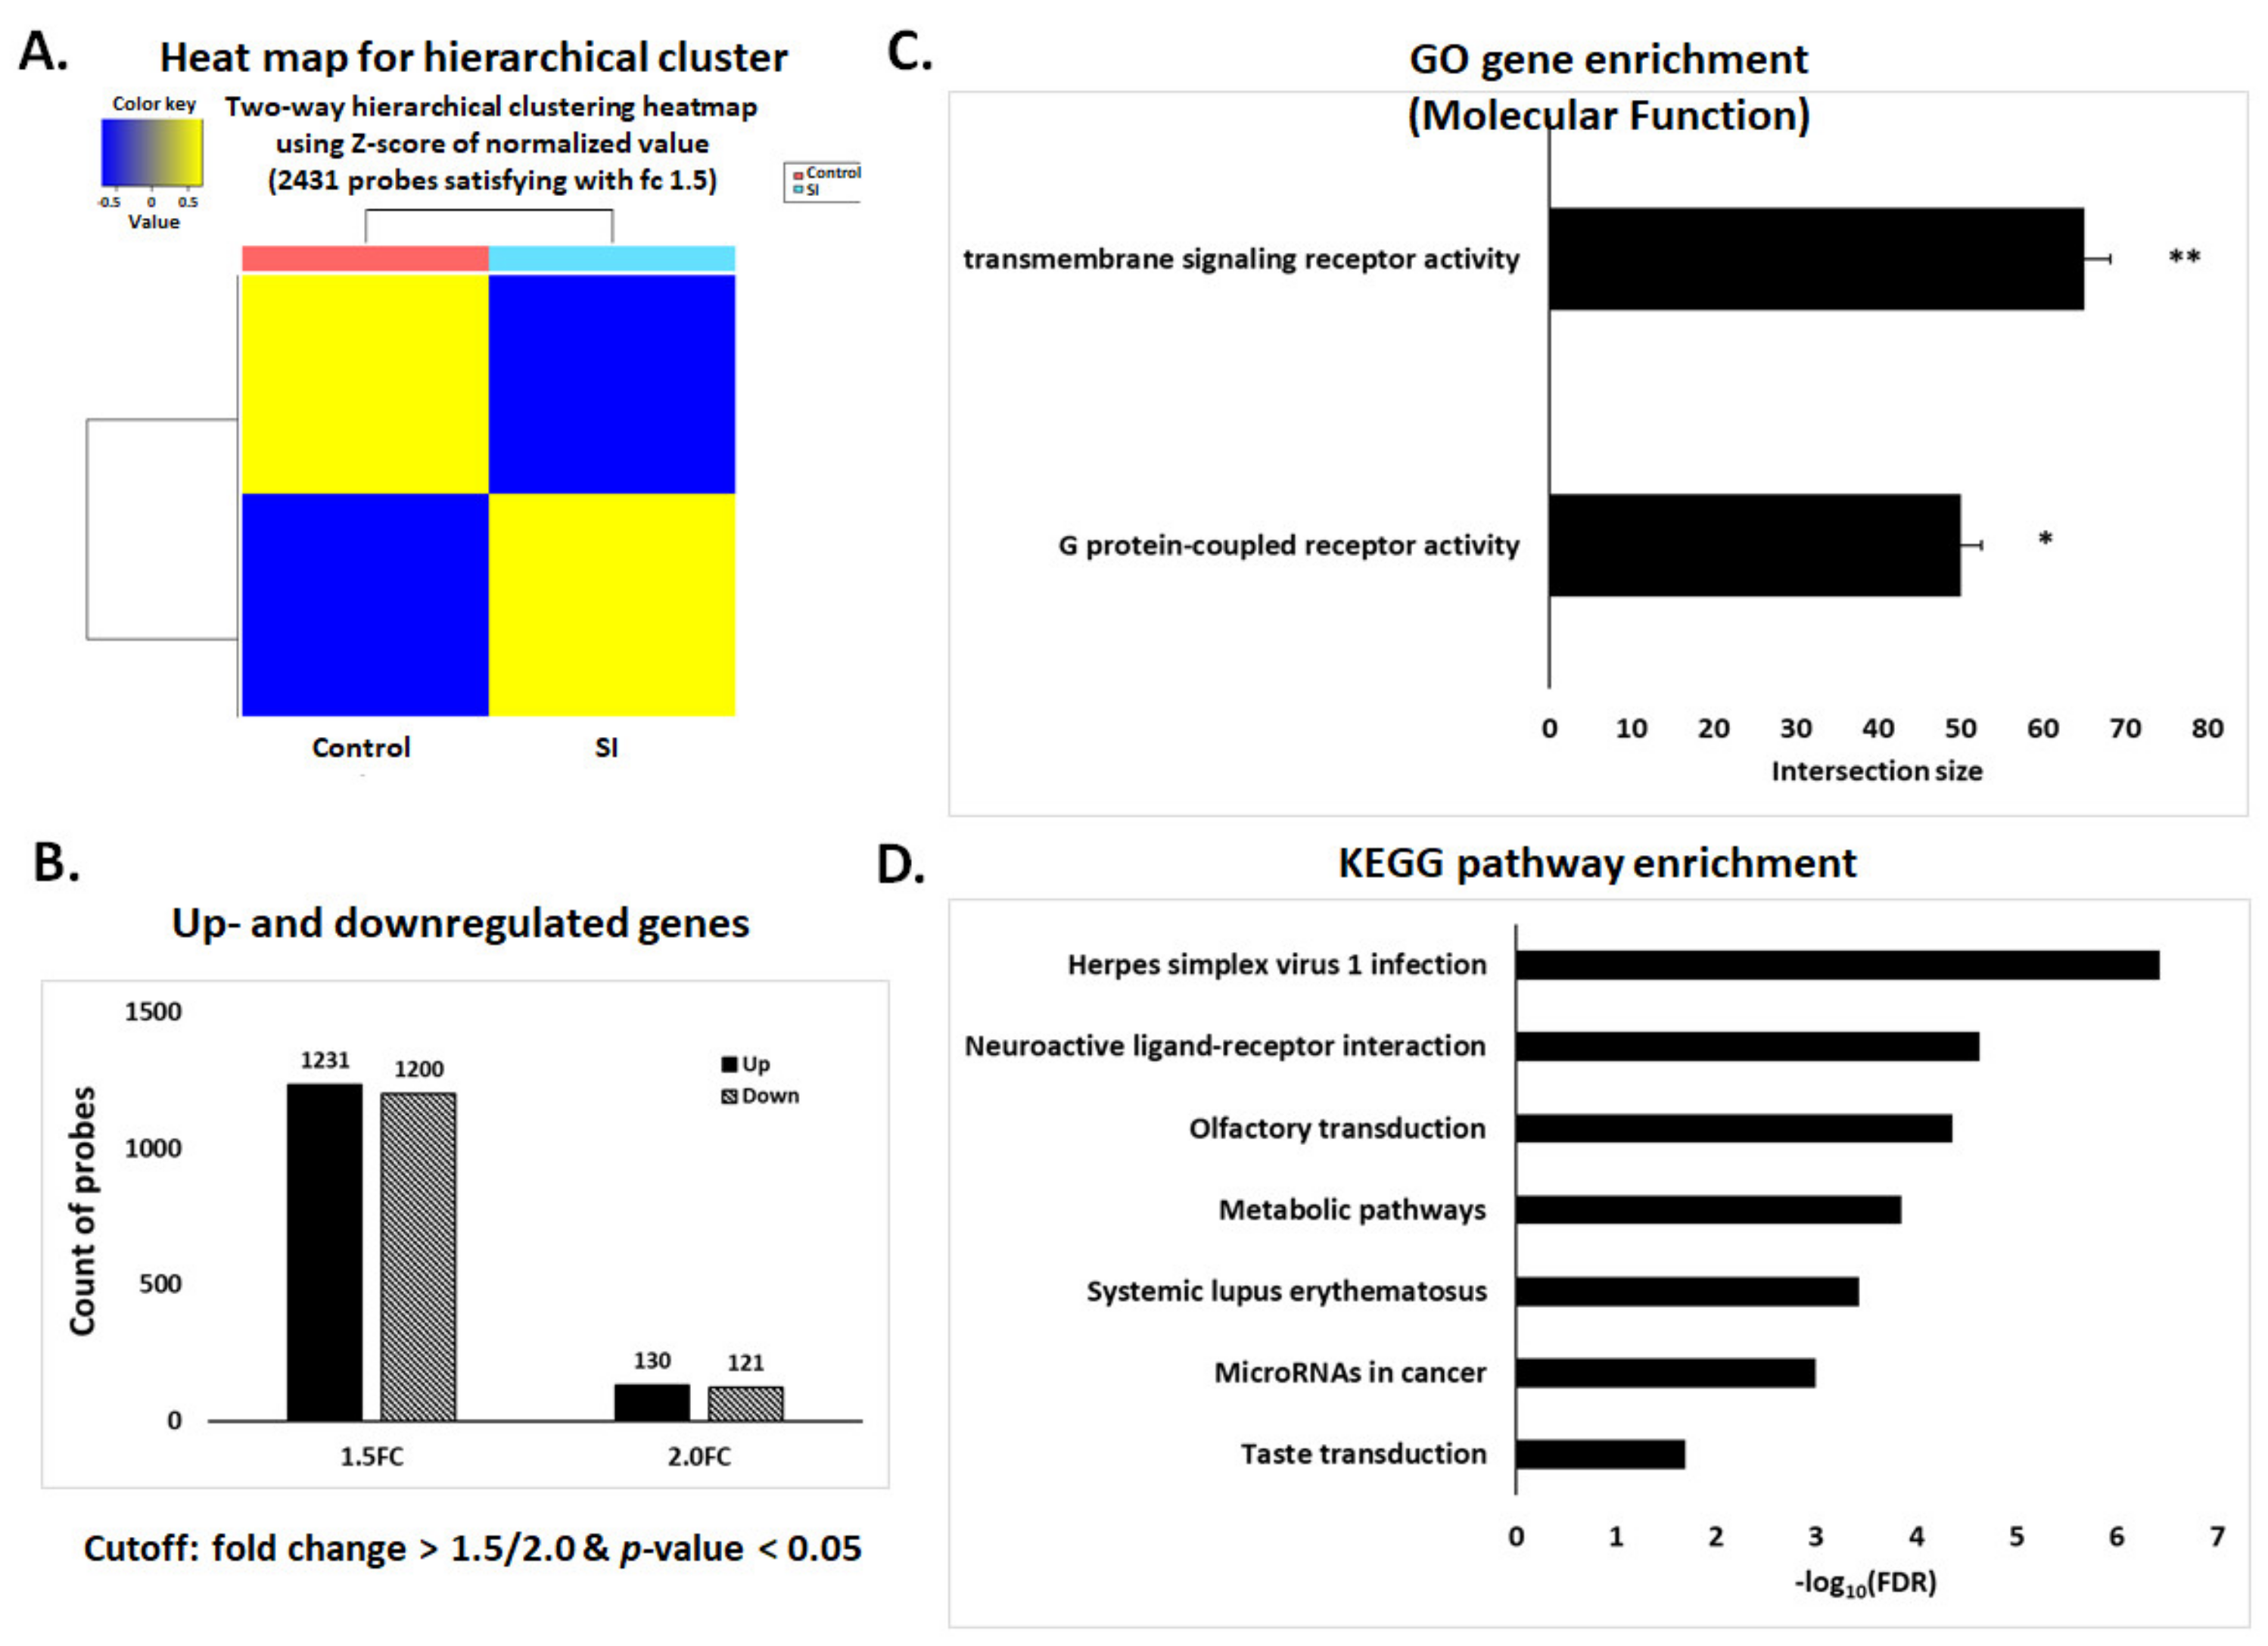
3.3. Affymetrix Gene Chip Analysis

Following the observed SI powder effects on decreasing cell proliferation, the gene profile was examined by Clarion S Affymetrix Gene Chip analyses 3 days after SI powder exposure. Differentially expressed genes were identified by microarray analysis of significance (SAM; with a false discovery rate (FDR) < 0.05). Relative heat maps are shown in Figure 3A, where hierarchical clustering was generated by whole-transcriptional analysis-derived normalization of CEL files. By comparing sham-exposed and FIR-exposed cancer cells, we identified 2431 (fold change > 1.5) and 251 (fold change > 2.0) differentially expressed transcription clusters (1231 upregulated and 1200 downregulated, fold change > 1.5; 130 upregulated and 121 downregulated, fold change > 2.0; Figure 3B).
To confirm the cellular signaling subjected to SI powder, gene set and pathway enrichment analyses in GO and KEGG databases were performed. In the molecular function category of the GO functional analysis, cells exposed to FIR displayed significant overactivation of transmembrane signaling receptor activity and G protein-coupled receptor activity targets (Figure 3C). In particular, FIR from SI powder-exposed cells displayed significant overactivation of the systemic lupus erythematosus pathway related to transmembrane signaling receptor activity in the GO enrichment analysis. Cells also displayed overactivation of the herpes simplex virus 1 infection, neuroactive ligand-receptor interaction, olfactory transduction, metabolic pathways, systemic lupus erythematosus, microRNAs in cancer, and taste transduction pathway in the KEGG pathway enrichment analysis (Figure 3D).

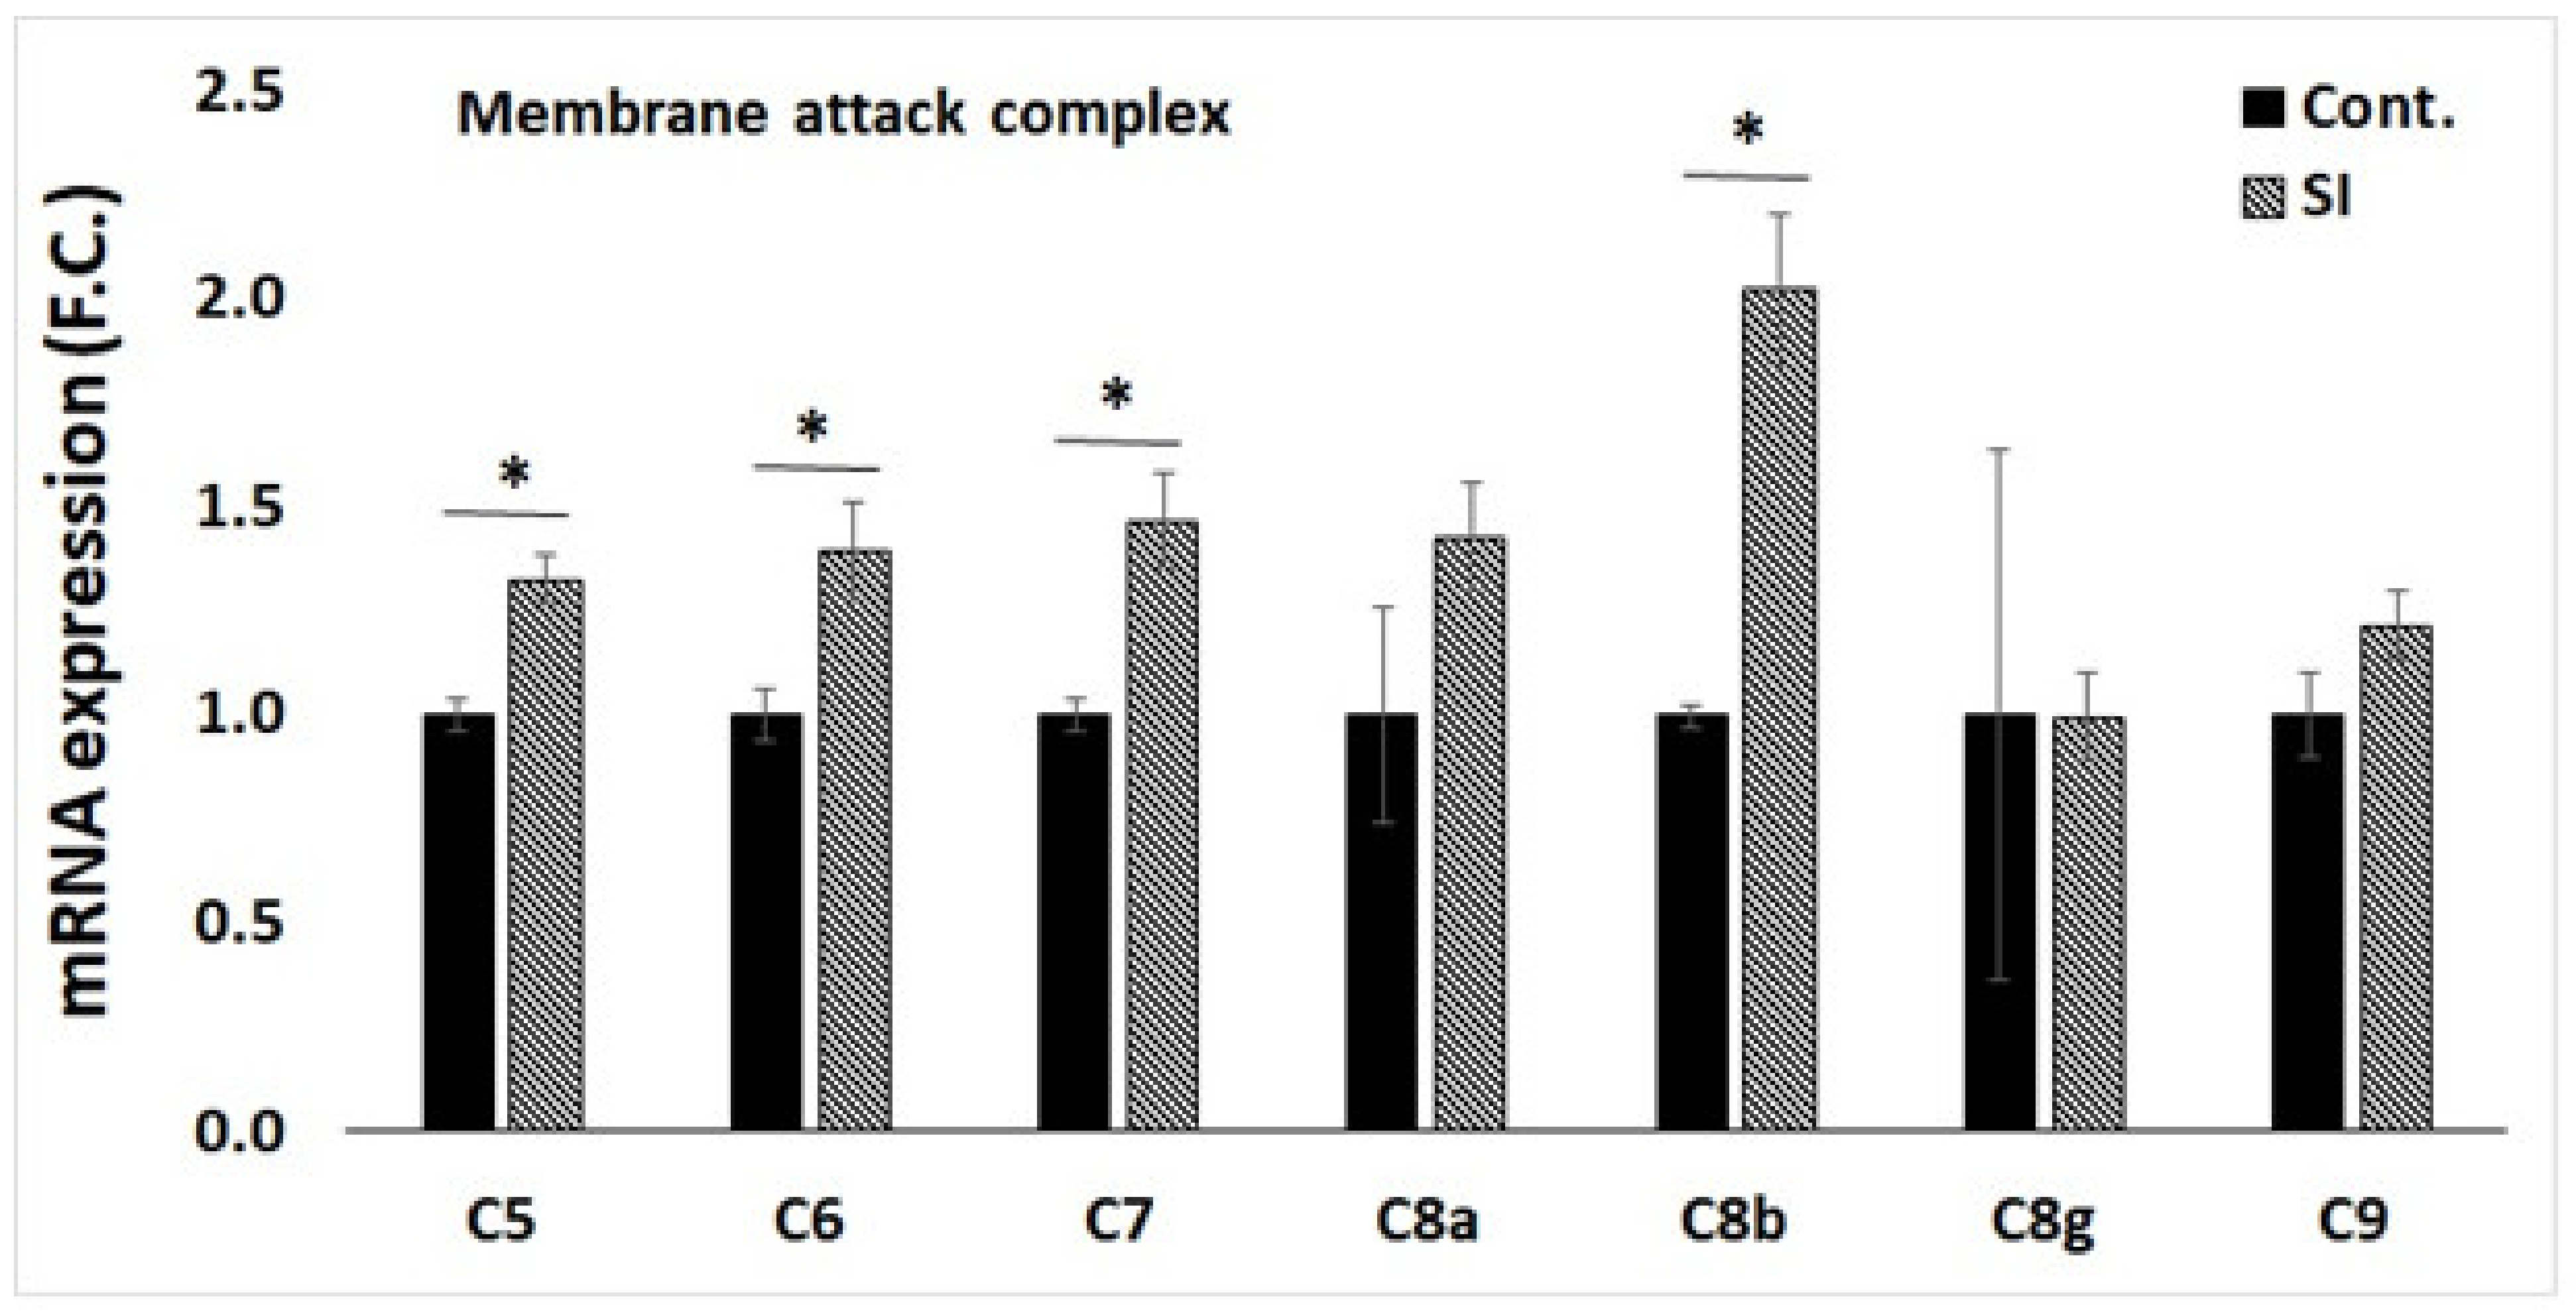
3.4. qPCR Validation of Transcriptome Data for Selected Genes

Based on the above results, transmembrane signaling receptors in the GO involve complement receptors, and systemic lupus erythematosus involves MAC signaling [26]. Among apoptotic pathways, we selected complementary MAC for mRNA expression analysis, which plays a key role in the innate and adaptive immune response by forming pores in the plasma membrane of target cells [26,27]. Next, we evaluated the expression levels of genes involved in the most upregulated pathways 72 h after SI powder exposure (Figure 4). In Figure 4, we observed a significant increase in the expression of C5, C6, C7, and C8β in FIR-exposed cells (C5, 1.32-fold p < 0.05; C6, 1.39-fold p < 0.05; C7, 1.46-fold p < 0.05; C8β, 2.02-fold p < 0.05), in accordance with our transcriptomic analysis.

3.5. Western Blot Analysis

Next, we selected significantly expressed C7 and C8β genes for western blot analysis to confirm cellular inhibitory signals at the molecular level. Proteins C7 and C8β are soluble complement proteins in MAC. Protein C7 is a member of initiation in MAC and C8β is a member of polymerization in MAC. C7 was slightly expressed in cells exposed to SI powder, whereas C8β protein was well expressed in all samples (Figure 5A). The expression of proteins was quantified to compare between groups relative to that of β-actin protein. The C7 and C8β proteins were significantly highly expressed in cells exposed to SI powder than in control groups (C7, 1.81-fold p < 0.01; C8β, 1.13-fold p < 0.01; Figure 5B). These results were in accordance with the mRNA expression pattern.

4. Discussion

In this study, we characterized the SI powder fabric and its radiation of 37.2 mW/cm2. The radiation power density was slightly higher than other FIR-emitting fabrics [1]. This fabric showed cell viability inhibiting properties. The decreases in cell viability resulted from reduced ATP production (Figure 2). Initial ATP level indicates the physiological state of the cell [28], and ATP depletion is a proxy for cell proliferation inhibition [29]. In addition, a reduced basal intracellular ATP concentration correlates with cell viability [30]. Thus, exposure to FIR triggers ATP depletion, forcing cancer cells into halting cell proliferation [15]. To induce such ATP depletion in cells through cell pathways, we performed transcriptional microarray analyses. The results showed 1231 upregulated and 1200 downregulated genes, with fold changes exceeding 1.5 (p < 0.05). Among upregulated genes, apoptosis-related genes were classified as membrane attack complex, natural killer cell-mediated cytotoxicity, and zinc finger-related genes. These genes also appeared in the gene enrichment and KEGG pathways. The GO enrichment analysis of pathways regulated by these genes showed that SI-exposure activated transmembrane signaling receptor genes and G protein-coupled receptor genes. The transmembrane signaling receptor transduced an extracellular signal across the cell membrane, initiating a change in cell physiology. The G protein-coupled receptor sensed a chemoattractant and activated a membrane-associated G protein, promoting the exchange of GDP for GTP on the alpha subunit of the heterotrimeric G protein complex. According to GO annotations, the transmembrane signaling receptor activity involves a number of G protein-coupled receptors. Such gene enrichments correspond to pathway enrichments in KEGG analysis (Figure 3). According to the KEGG analysis, systemic lupus erythematosus is particularly related to the MAC pathways. MAC is a cytolytic effector of innate and adaptive immunity that forms pores in the plasma membrane of pathogens or targeted cells, leading to osmolysis [26]. Osmolysis disrupts the cell membrane of target cells, leading to cell death [31] because the MAC, composed of the complement components C5b, C6, C7, C8, and several C9 molecules [26], needs to be assembled first. To assemble MAC, C5 cleaves into the small anaphylatoxin C5a and the large fragment C5b by C5 convertase. C6 binds the labile C5b intermediate, resulting in a stable C5b6 complex. C7 binds C5b-6, anchoring the newly formed C5b-7 complex to the membrane surface. C8 (composed of C8α, C8β, and C8γ) is incorporated into the assembly precursor to form the C5b-8 initiator complex, marking the first membrane permeation event. Finally, multiple copies of C9 join the assembly and cross the membrane, ultimately creating the final MAC [26,32]. The pore formation facilitates the entry of toxic substances into the cell, such as nitrogen oxide and oxygen radicals, which further stimulate cells to produce inflammatory mediators and growth factors, leading to cell proliferation inhibition [33,34]. Johnson et al. reported the C5b-9-mediated inhibition of endothelial cell proliferation [35]. Roos et al. reported that C5b-9 inhibited cell proliferation in rat mesangial cells through caspase activation [27,36]. In this study, C5, C6, C7, and C8β were significantly expressed, as evidenced by qPCR. These activations imply that FIR exposure triggered C5 to form MACs in cancer cells. According to this mechanism, C8, as a heterotrimeric complex, undergoes a conformational rearrangement, with the C8α subunit being the first component to penetrate the lipid bilayer [37]. In addition, C8α and C8β are related by a rotation with only a small translational component along the rotation axis [38]. In this study, C8α and C8β were significantly more expressed in irradiated cells than in the controls; however, C8α expression was not significant, suggesting that FIR exposure activated and recruited C8α and C8β, yielding the final MAC. This result was confirmed by protein expression analysis performed via western blot. The C7 and C8β were significantly highly expressed in response to FIR exposure. As stated above, protein C7 stands in the middle of the MAC-forming process as it is triggered by C5b and then C8β next to C7. These findings suggest that FIR exposure inhibits cancer cell proliferation by forming MAC in the cell membrane.
However, this study has limitations, such as the focus on MAC expression. According to the transcriptome analysis, several pathways related to the inhibition of cell proliferation were categorized as upregulated genes related to MAC, natural killer cell-mediated cytotoxicity, and zinc finger. One of them was confirmed by mRNA and protein expression. Everything else concerns the inhibition effects of FIR exposure, such as reactive oxygen species that can cause apoptosis.
In summary, we demonstrated that the SI powder-generated FIR could inhibit liver cancer cell proliferation by activating the MAC cellular pathway in the cell membrane. These findings highlight the strong association between FIR and the expression of MAC-related genes and could open new avenues for the therapeutic management of cancer.

Author Contributions

Conceptualization, H.B.K. and J.-H.P.; methodology, H.B.K.; validation, H.B.K.; formal analysis, H.B.K.; investigation, H.B.K.; resources, J.-H.P.; data curation, H.B.K.; writing—original draft preparation, H.B.K.; writing—review and editing, H.B.K.; visualization, H.B.K.; supervision, H.B.K.; project administration, H.B.K.; funding acquisition, J.-H.P. All authors have read and agreed to the published version of the manuscript.

Funding

This research received no external funding.

Institutional Review Board Statement

Not applicable.

Informed Consent Statement

Not applicable.

Data Availability Statement

The data presented in this study are available on request from the corresponding author.

Acknowledgments

We would like to thank J.G. for his technical support of far infrared for this experiment in the Korea Far Infrared Association. All authors have read and approved the final version of the manuscript.

Conflicts of Interest

The authors declare no conflict of interest.

References

  1. Vatansever, F.; Hamblin, M.R. Far infrared radiation (FIR): Its biological effects and medical applications. Photonics Lasers Med. 2012, 4, 255–266. [Google Scholar] [CrossRef] [PubMed]
  2. Niwa, Y.; Miyachi, Y.; Ishimoto, K.; Kanoh, T. Why are natural plant medicinal products effective in some patients and not in others with the same disease? Planta Med. 1991, 57, 299–304. [Google Scholar] [CrossRef] [PubMed]
  3. Plaghki, L.; Decruynaere, C.; Van Dooren, P.; Le Bars, D. The fine tuning of pain thresholds: A sophisticated double alarm system. PLoS ONE 2010, 5, e10269. [Google Scholar] [CrossRef] [PubMed]
  4. Sheppard, A.R.; Swicord, M.L.; Balzano, Q. Quantitative evaluations of mechanisms of radiofrequency interactions with biological molecules and processes. Health Phys. 2008, 95, 365–396. [Google Scholar] [CrossRef]
  5. Huang, P.H.; Chen, J.W.; Lin, C.P.; Chen, Y.H.; Wang, C.H.; Leu, H.B.; Lin, S.J. Far infra-red therapy promotes ischemia-induced angiogenesis in diabetic mice and restores high glucose-suppressed endothelial progenitor cell functions. Cardiovasc. Diabetol. 2012, 11, 99. [Google Scholar] [CrossRef]
  6. Akasaki, Y.; Miyata, M.; Eto, H.; Shirasawa, T.; Hamada, N.; Ikeda, Y.; Biro, S.; Otsuji, Y.; Tei, C. Repeated thermal therapy up-regulates endothelial nitric oxide synthase and augments angiogenesis in a mouse model of hindlimb ischemia. Circ. J. 2006, 70, 463–470. [Google Scholar] [CrossRef]
  7. Imamura, M.; Biro, S.; Kihara, T.; Yoshifuku, S.; Takasaki, K.; Otsuji, Y.; Minagoe, S.; Toyama, Y.; Tei, C. Repeated thermal therapy improves impaired vascular endothelial function in patients with coronary risk factors. J. Am. Coll. Cardiol. 2001, 38, 1083–1088. [Google Scholar] [CrossRef]
  8. Kihara, T.; Biro, S.; Ikeda, Y.; Fukudome, T.; Shinsato, T.; Masuda, A.; Miyata, M.; Hamasaki, S.; Otsuji, Y.; Minagoe, S.; et al. Effects of repeated sauna treatment on ventricular arrhythmias in patients with chronic heart failure. Circ. J. 2004, 68, 1146–1151. [Google Scholar] [CrossRef]
  9. Lin, C.C.; Liu, X.M.; Peyton, K.; Wang, H.; Yang, W.C.; Lin, S.J.; Durante, W. Far infrared therapy inhibits vascular endothelial inflammation via the induction of heme oxygenase-1. Arterioscler. Thromb. Vasc. Biol. 2008, 28, 739–745. [Google Scholar] [CrossRef]
  10. Lee, D.; Seo, Y.; Kim, Y.W.; Kim, S.; Bae, H.; Choi, J.; Lim, I.; Bang, H.; Kim, J.H.; Ko, J.H. Far-infrared radiation stimulates platelet-derived growth factor mediated skeletal muscle cell migration through extracellular matrix-integrin signaling. Korean J. Physiol. Pharmacol. 2019, 23, 141–150. [Google Scholar] [CrossRef] [Green Version]
  11. Lin, T.C.; Lin, C.S.; Tsai, T.N.; Cheng, S.M.; Lin, W.S.; Cheng, C.C.; Wu, C.H.; Hsu, C.H. Stimulatory influences of far infrared therapy on the transcriptome and genetic networks of endothelial progenitor cells receiving high glucose treatment. Acta Cardiol. Sin. 2015, 31, 414–428. [Google Scholar]
  12. Chen, C.H.; Chen, T.H.; Wu, M.Y.; Chou, T.C.; Chen, J.R.; Wei, M.J.; Lee, S.L.; Hong, L.Y.; Zheng, C.M.; Chiu, I.J.; et al. Far-infrared protects vascular endothelial cells from advanced glycation end products-induced injury via PLZF-mediated autophagy in diabetic mice. Sci. Rep. 2017, 7, 40442. [Google Scholar] [CrossRef]
  13. Tu, Y.P.; Chen, S.C.; Liu, Y.H.; Chen, C.F.; Hour, T.C. Postconditioning with far-infrared irradiation increases heme oxygenase-1 expression and protects against ischemia/reperfusion injury in rat testis. Life Sci. 2013, 92, 35–41. [Google Scholar] [CrossRef]
  14. Hsu, Y.H.; Chen, Y.C.; Chen, T.H.; Sue, Y.M.; Cheng, T.H.; Chen, J.R.; Chen, C.H. Far-infrared therapy induces the nuclear translocation of PLZF which inhibits VEGF-induced proliferation in human umbilical vein endothelial cells. PLoS ONE 2012, 7, e30674. [Google Scholar] [CrossRef]
  15. Ishibashi, J.; Yamashita, K.; Ishikawa, T.; Hosokawa, H.; Sumida, K.; Nagayama, M.; Kitamura, S. The effects inhibiting the proliferation of cancer cells by far-infrared radiation (FIR) are controlled by the basal expression level of heat shock protein (HSP) 70A. Med. Oncol. 2008, 25, 229–237. [Google Scholar] [CrossRef]
  16. Leung, T.K.; Chan, C.F.; Lai, P.S.; Yang, C.H.; Hsu, C.Y.; Lin, Y.-S. Inhibitory effects of far-infrared irradiation generated by ceramic material on murine melanoma cell growth. Int. J. Photoenergy 2012, 2012, 646845. [Google Scholar] [CrossRef]
  17. Hwang, S.; Lee, D.H.; Lee, I.K.; Park, Y.M.; Jo, I. Far-infrared radiation inhibits proliferation, migration, and angiogenesis of human umbilical vein endothelial cells by suppressing secretory clusterin levels. Cancer Lett. 2014, 346, 74–83. [Google Scholar] [CrossRef]
  18. Cho, D.H.; Lee, H.J.; Lee, J.Y.; Park, J.H.; Jo, I. Far-infrared irradiation inhibits breast cancer cell proliferation independently of DNA damage through increased nuclear Ca2+/calmodulin binding modulated-activation of checkpoint kinase 2. J. Photochem. Photobiol. B 2021, 219, 112188. [Google Scholar] [CrossRef]
  19. Yamashita, K.; Dalkhsuren, S.O.; Ishikawa, T.; Sumida, K.; Ishibashi, J.; Hosokawa, H.; Ueno, A.; Nasu, F.; Kitamura, S. Far infrared ray radiation inhibits the proliferation of A549, HSC3 and Sa3 cancer cells through enhancing the expression of ATF3 gene. J. Electromagn. Anal. Appl. 2010, 2, 382–394. [Google Scholar] [CrossRef]
  20. Heitbrink, D.; Sigurdson, H.; Bolwien, C.; Brzezinski, P.; Heberle, J. Transient binding of CO to Cu(B) in cytochrome c oxidase is dynamically linked to structural changes around a carboxyl group: A time-resolved step-scan Fourier transform infrared investigation. Biophys. J. 2002, 82, 1–10. [Google Scholar] [CrossRef]
  21. Rich, P.R.; Breton, J. Attenuated total reflection Fourier transform infrared studies of redox changes in bovine cytochrome c oxidase: Resolution of the redox Fourier transform infrared difference spectrum of heme a(3). Biochemistry 2002, 41, 967–973. [Google Scholar] [CrossRef]
  22. Maréchal, A.; Rich, P.R. Water molecule reorganization in cytochrome c oxidase revealed by FTIR spectroscopy. Proc. Natl. Acad. Sci. USA 2011, 108, 8634–8638. [Google Scholar] [CrossRef]
  23. Lane, N. Cell Biology: Cell biology: Power games. Nature 2006, 443, 901–903. [Google Scholar] [CrossRef]
  24. Chen, A.C.H.; Arany, P.R.; Huang, Y.Y.; Tomkinson, E.M.; Sharma, S.K.; Kharkwal, G.B.; Saleem, T.; Mooney, D.; Yull, F.E.; Blackwell, T.S.; et al. Low-level laser therapy activates NF-kB via generation of reactive oxygen species in mouse embryonic fibroblasts. PLoS ONE 2011, 6, e22453. [Google Scholar] [CrossRef]
  25. Calì, T.; Ottolini, D.; Brini, M. Mitochondrial Ca(2+) as a key regulator of mitochondrial activities. Adv. Exp. Med. Biol. 2012, 942, 53–73. [Google Scholar]
  26. Xie, C.B.; Jane-Wit, D.; Pober, J.S. Complement membrane attack complex: New roles, mechanisms of action, and therapeutic targets. Am. J. Pathol. 2020, 190, 1138–1150. [Google Scholar] [CrossRef]
  27. Nauta, A.J.; Daha, M.R.; Tijsma, O.; van de Water, B.; Tedesco, F.; Roos, A. The membrane attack complex of complement induces caspase activation and apoptosis. Eur. J. Immunol. 2002, 32, 783. [Google Scholar] [CrossRef]
  28. Bajerski, F.; Stock, J.; Hanf, B.; Darienko, T.; Heine-Dobbernack, E.; Lorenz, M.; Naujox, L.; Keller, E.R.J.; Schumacher, H.M.; Friedl, T.; et al. ATP content and cell viability as indicators for cryostress across the diversity of life. Front. Physiol. 2018, 9, 921. [Google Scholar] [CrossRef]
  29. Tsujimoto, Y. Apoptosis and necrosis: Intracellular ATP level as a determinant for cell death modes. Cell Death Differ. 1997, 4, 429–434. [Google Scholar] [CrossRef]
  30. Sánchez-Lozada, L.G.; Lanaspa, M.A.; Cristóbal-García, M.; García-Arroyo, F.; Soto, V.; Cruz-Robles, D.; Nakagawa, T.; Yu, M.A.; Kang, D.H.; Johnson, R.J. Uric acid-induced endothelial dysfunction is associated with mitochondrial alterations and decreased intracellular ATP concentrations. Nephron Exp. Nephrol. 2012, 121, e71–e78. [Google Scholar] [CrossRef]
  31. Rus, H.; Cudrici, C.; Niculescu, F. The role of the complement system in innate immunity. Immunol. Res. 2005, 33, 103–112. [Google Scholar] [CrossRef]
  32. Bayly-Jones, C.; Bubeck, D.; Dunstone, M.A. The mystery behind membrane insertion: A review of the complement membrane attack complex. Philos. Trans. R. Soc. Lond. B Biol. Sci. 2017, 372, 20160221. [Google Scholar] [CrossRef] [PubMed] [Green Version]
  33. Savill, J. Apoptosis and the kidney. J. Am. Soc. Nephrol. 1994, 5, 12–21. [Google Scholar] [CrossRef] [PubMed]
  34. Sandau, K.; Pfeilschifter, J.; Brüne, B. Nitric oxide and superoxide induced p53 and Bax accumulation during mesangial cell apoptosis. Kidney Int. 1997, 52, 378–386. [Google Scholar] [CrossRef] [PubMed]
  35. Hughes, J.; Nangaku, M.; Alpers, C.E.; Shankland, S.J.; Couser, W.G.; Johnson, R.J. C5b-9 membrane attack complex mediates endothelial cell apoptosis in experimental glomerulonephritis. Am. J. Physiol. Renal Physiol. 2000, 278, F747–F757. [Google Scholar] [CrossRef] [PubMed]
  36. Song, S.; Wang, D.; Zhao, K.; Wu, Y.; Zhang, P.; Liu, J.; Yang, G.; Gong, P.; Liu, Z. Donor-acceptor structured photothermal COFs for enhanced starvation therapy. Chem. Eng. J. 2022, 442, 135963. [Google Scholar] [CrossRef]
  37. Serna, M.; Giles, J.L.; Morgan, B.P.; Bubeck, D. Structural basis of complement membrane attack complex formation. Nat. Commun. 2016, 7, 10587. [Google Scholar] [CrossRef]
  38. Lovelace, L.L.; Cooper, C.L.; Sodetz, J.M.; Lebioda, L. Structure of human C8 protein provides mechanistic insight into membrane pore formation by complement. J. Biol. Chem. 2011, 286, 17585–17592. [Google Scholar] [CrossRef] [Green Version]
Figure 1. SI powder characterization. (A) SI powder fabrication. (B) SEM image shows powder morphology. (C) EDS shows compounds of SI powder fabric. (D) (1) XRD peaks of SI powder fabric and (2) peaks of SiO2 among SI powder compounds.
Applsci 12 09416 g001
Figure 2. SI powder set-up and viability and ATP production: (A) SI powder block set beneath a cell plate to radiate FIR to cells; viability (B) and ATP production (C) of cells radiated to FIR for 3 days. Data are shown as the mean ± standard deviation (n = 3) after a two-tailed paired Student’s t-test (* p < 0.05, ** p < 0.01 and *** p < 0.001).
Applsci 12 09416 g002
Figure 3. Transcriptomic analysis: (A) heat maps of differentially expressed genes in cells subjected to sham and FIR; (B) a graph of the number of significantly upregulated and downregulated genes in cells; (C,D) bar graphs displaying GO enrichment and KEGG pathway enrichment, respectively, show that there are differentially expressed genes between sham and FIR-exposed cells. Data are shown as the mean ± standard deviation (n = 3) after a two-tailed paired Student’s t-test (* p < 0.05 and ** p < 0.01).
Applsci 12 09416 g003
Figure 4. mRNA expression for MAC showed significant expression of C8β. Data are shown as the mean ± standard deviation (n = 3) after a two-tailed paired Student’s t-test (* p < 0.05).
Applsci 12 09416 g004
Figure 5. Changes in protein expression of C7 and C8b after FIR exposure: (A) changes in protein expression; (B) western blotting analysis. Data are shown as the mean ± standard deviation (n = 3) after a two-tailed paired Student’s t-test (** p < 0.01).
Applsci 12 09416 g005
Publisher’s Note: MDPI stays neutral with regard to jurisdictional claims in published maps and institutional affiliations.

