Article

Mask-Aware Semi-Supervised Object Detection in Floor Plans

by
Tahira Shehzadi
1,2,3,*,
Khurram Azeem Hashmi
1,2,3,
Alain Pagani
3,
Marcus Liwicki
4,
Didier Stricker
1,3 and
Muhammad Zeshan Afzal
1,2,3
1
Department of Computer Science, Technical University of Kaiserslautern, 67663 Kaiserslautern, Germany
2
Department of Computer Science, Mindgarage, Technical University of Kaiserslautern, 67663 Kaiserslautern, Germany
3
German Research Institute for Artificial Intelligence (DFKI), 67663 Kaiserslautern, Germany
4
Department of Computer Science, Luleå University of Technology, 971 87 Luleå, Sweden
*
Author to whom correspondence should be addressed.
Appl. Sci. 2022, 12(19), 9398; https://doi.org/10.3390/app12199398
Submission received: 31 August 2022 / Revised: 13 September 2022 / Accepted: 14 September 2022 / Published: 20 September 2022

Abstract

:
Research has been growing on object detection using semi-supervised methods in past few years. We examine the intersection of these two areas for floor-plan objects to promote the research objective of detecting more accurate objects with less labeled data. The floor-plan objects include different furniture items with multiple types of the same class, and this high inter-class similarity impacts the performance of prior methods. In this paper, we present Mask R-CNN-based semi-supervised approach that provides pixel-to-pixel alignment to generate individual annotation masks for each class to mine the inter-class similarity. The semi-supervised approach has a student–teacher network that pulls information from the teacher network and feeds it to the student network. The teacher network uses unlabeled data to form pseudo-boxes, and the student network uses both label data with the pseudo boxes and labeled data as the ground truth for training. It learns representations of furniture items by combining labeled and label data. On the Mask R-CNN detector with ResNet-101 backbone network, the proposed approach achieves a mAP of 98.8%, 99.7%, and 99.8% with only 1%, 5% and 10% labeled data, respectively. Our experiment affirms the efficiency of the proposed approach, as it outperforms the previous semi-supervised approaches using only 1% of the labels.

1. Introduction

Semi-supervised learning-based research is receiving more attention in the past few years, as it can use label data to increase model performance when it is impossible to annotate large datasets. The first layout of the semi-supervised approach-based learning uses consistency-based self-learning [1,2] approaches. The main idea is to create artificial labels and then predict those self-generated labels by training the model on label data with stochastic augmentations. Those self-generated labels can be the network’s predictive distribution or one-hot prediction. The second improvement in semi-supervised approach-based learning is the variety of available data augmentation techniques. Data augmentation techniques boost the performance of the training network [3,4] and are also efficient for consistency-based learning [2,5]. The augmentation approaches progress from image transformation such as cropping, flipping, scaling, brightness, colour augmentation, contrast, saturation, translation, and rotation to image generation [6,7,8] and model training by reinforcement-learning [9,10]. Previously, the researchers applied supervised learning techniques for floor-plan object detection. We use the semi-supervised approach for floor-plan analysis, which matches the previous semi-supervised approaches using only 1% of the label data.
The floor-plan object detection problem has high value because of its usage in tremendous applications such as property value estimation, furniture setting and designing, etc. The floor-plan objects include furniture items, windows, doors, and walls. Humans can readily recognize floor-plan objects, but to automatically recognize and detect floor-plan objects is challenging because of the similarity between room types and furniture items. For example, the Drawing room contains a limited number of furniture items, and the furniture category of the kitchen and dining room is almost similar. There are many applications of floor-plan object detection, such as 3d reconstruction of floor-plan [11] and similarity search [12]. Floor-plan object detection is necessary for floor-plan analysis applications. Figure 1 is an overview of the floor-plan layout with different furniture items that explains room size and furniture categories. The top left room is the dining room, where a single round table is present. The top right room contains a kitchen with a bathroom. The next room is a living area where different sofa items are present. Thus, all other rooms have names according to their furniture items. This floor-plan category can help furniture installation.
The semi-supervised approach-based object detection needs a small amount of labeled data with label data. There are some multi-stage approaches [13,14] that use label data for training in the first stage, followed by unlabeled data for generating pseudo labels, and then retraining on unannotated data. The model performance depends on the accuracy of the generated pseudo label, but the available training data is small, which reduces model efficiency. To increase label data, we generate pseudo labels using a semi-supervised approach and then use these pseudo labels and small portions such as 1% of the label data to train the model. We randomly sample label and labeled data, in which both portions include all classes present in available data. We used two models for our experiment on the floor-plan dataset, the first is for detector training, and the second is for generating pseudo labels for unlabeled data. This approach provides simplified multi-stage training. Further, it uses the flywheel effect [15], in which the pseudo label generator and training detector can boost each other to improve model performance with increasing training iterations. Another important benefit of this approach is that more weight is provided to the pseudo-label generator model rather than the training detector model, as it guides the training model instead of providing hard category labels, as in earlier techniques [13,14]. This approach is also proposed in the Soft-Teacher model [16]. In this network, the teacher model uses a pseudo-label generator, and the student model uses the training detector.
Using a semi-supervised approach, we detected objects on the pixel level, such as different furniture items in the floor-plan data. We used Mask R-CNN [17] with Feature Pyramid Network (FPN) [18] as a detection method, ResNet-50 [19] and ResNet-101 network as a backbone pre-trained on the ImageNet dataset [4] with the student–teacher approach. We used 1%, 5%, and 10% floor-plan images as labeled data for training and the rest of the images as label data. We used five data folds for each percentage level and calculated the final performance by taking the average of these five folds. Figure 2 compares the performance of both these backbones under the different percentage of label data settings. The increasing colour of bars indicates the increase in the percentage of label data. We obtain 98.8(%) mAP, 99.7(%) mAP, and 99.8(%) mAP on Mask R-CNN [17] with ResNet-101 [19] backbone network for 1%, 5%, and 10% floor-plan images, respectively. This paper provides an end-to-end semi-supervised approach-based object detection in the floor-plan domain. The main contribution of this work is as follows:
  • We present the Mask R-CNN [17]-based semi-supervised trainable network with the ResNet-50 [19] and ResNet-101 backbone network for object detection in the floor-plan domain.
  • The Mask R-CNN [17]-based semi-supervised approach improves the state-of-the-art performance on the publicly available floor-plan dataset named SFPI [20], using only 1% of the labels.
The remaining paper is arranged as follows. Section 2 talks about the previous research on semi-supervised approaches-based learning and floor-plan datasets. Section 3 explain the methodology and Section 4 discusses the dataset briefly. Section 5 is about experimental setup. Section 6 discusses the evaluation matrices. In Section 7, we analyze the experimental results. Finally, Section 8 summarizes the experimental work and gives an idea about future directions.

2. Related Work

Object detection and semi-supervised learning are essential steps toward floor-plan image analysis. This section overviews previous work in these domains and contains three parts. The first section describes the literature about object detection. The second section explains previous semi-supervised approaches. Finally, we explain the literature on the floor-plan domain.

2.1. Object Detection and Its Applications

Object detection is the main computer-vision domain in which extensive work has been conducted in the past few years with two main types: single-stage detectors [21,22,23] and two-stage detectors [17,24,25]. The two-stage detectors extract the object regions in the first stage and then classify and localize the object in the second stage. These detectors, such as Faster R-CNN [25], firstly generate region proposals, making a separate prediction for every object in the image. In contrast, single-stage detectors perform classification and localization in one pass through the neural network. The basic difference between these detectors is the cascade filter for object proposals. These detectors provide good results on a large amount of label data and are used in different applications in many fields for Instance Segmentation [26] and object detection, such as face detection [27] and pedestrian detection [28]. It is also used in document analysis for formula detection [29], table detection [30,31], and other page object detections [32].

2.2. Semi-Supervised Learning

Semi-supervised-based image classification has two types: pseudo-label-based learning and consistency-based learning. The consistency-based learning [33,34,35] examine the similarity between original and augmented images. It provides more weight to label data than unlabeled data, which helps in perturbations of the same image for producing similar labels. There are different methods to apply perturbations using noise [33], augmentation [35], and adversarial training [34]. In [36], the author predicted the training steps to assemble the training object. In [37], the author takes the weighted average by ensembling rather than predicting the model, called the exponential mean-average (EMA). In [5,38], the authors annotated the unlabeled images with pseudo labels using the classification model and then retrained the detector using this pseudo-label data. They analyzed the effect of data augmentation for semi-supervised learning [2,39].
Semi-supervised object detection has two types: pseudo-label-based learning [14,40] and consistency-based learning [41,42]. In [14,40], labels generated from different augmented images are ensembled to predict labels of unlabeled images. In [43], pseudo-labels are generated by training the SelectiveNet [44]. In [45], the labeled image contains the detected box of the label image, and the author calculated the localization consistency estimation for the attached label image. It needs a deep detection procedure [45], as the image itself is changed. Recently, intricate augmentation approaches, including CTAugment [46] and RandAugment [47], are proven to be very effective for semi-supervised learning on object detection [1,2].

2.3. Floor-Plan Analysis

Research on object detection in floor-plan data is growing because of its usage in tremendous applications such as property value estimation, furniture setting, and designing, etc. Ghorbel et al. [48] proposed a handwritten floor-plan recognition model. This network provides a CAD model for floor-plans data. In [49], the author proposed a room detection model for the floor-plan dataset. Moreover, [50] proposed a model for understanding the floor-plan using Hough-transform and subgraph-isomorphism. Several graphic recognition methods are applied to identify the basic structure and also consider human feedback during the analysis phase.
In [51], the author used a deep learning network to parse floor-plan images. The author applied Cascade Mask R-CNN [52] to obtain floor-plan information and keypoint-CNN for segmentation to extract accurate corner locations and obtained the final segmentation results after post-processing. In [53], textural information is extracted from floor-plan images. This work is helpful for visually impaired people to analyze house design and for customers to buy a house online. The morphological closure is applied to detect the walls of the floor-plan image, the flood fill method to detect corners, and scale-invariant features for door identification. After extracting all this information, the author applied text synthesis techniques.
In [54], the author proposed an object recognition method for floor-plan images. The main target is to recognize floor-plan items such as windows, walls, rooms, doors, and furniture items. To extract features, the VGG network [55] is used. It recognizes room types based on furniture items present in the room. However, room type identification is not demonstrating good results, as the variation in furniture items is less. It also detects room boundaries for doors, windows, and walls, which gives good results.
Liu et al. [56] detected edges in the floor-plan dataset using the deep network and then used Integer programming to detect walls of different rooms by combining those corner points. However, this approach can only recognize walls of rectangular rooms with uniform thickness; it works on the Manhattan assumption that aligns the walls with two main axes in a floor-plan image. Yamasaki et al. [57] applied a fully convolutional network (FCN) to label pixels for detecting similar structure houses by forming a graph model of the floor-plan dataset with different classes. Their method ignores spatial relations between different classes, as it detects pixels of different classes separately by using a simple segmentation network.
In [58], Faster R-CNN [25] is used to detect kitchen items such as stoves, sliding doors, simple doors, and bathtubs, and then it adopted the fully convolutional network (FCN) to detect the walls’ pixels. They also estimated the size of the different rooms by recognizing text using a library tool. Maće et al. [49] used Hough transform to identify doors and walls in floor-plan images. In [59], the author used a pixel-based segmentation approach to detect doors, walls, windows, and the bag-of-words (BOW) network to classify image patches. They trained these patches to generate graphs for detecting walls. The author detected the walls in [11] by recognizing parallel lines, determined the room size by calculating the distance between parallel lines, and estimated the wall thickness by the clustering distance value.

3. Method

The experiment is performed on Mask R-CNN [17] with ResNet-50 [19] and ResNet-101 backbone. We used this model with convolutional networks (CNN) and a student–teacher network. In this section, we explain the individual modules of the experiment.

3.1. Mask R-CNN

Mask R-CNN [17] is an extended version of Faster R-CNN [25] with a new branch for providing masks to the detected objects with the two already present branches for the classification and regression layer. This branch is applied on RoIs (Region of Interest) to deal with detection on the pixel level to segment each stance accurately. The basic architecture of Mask R-CNN is identical to Faster R-CNN, as it uses a similar architecture to generate object proposals. The major difference is that Mask R-CNN uses an RoI-align layer rather than an RoI-Pooling layer to reduce misalignment on the pixel level because of spatial quantization. Generally, the training of Mask R-CNN [17] and Faster R-CNN [25] is identical. For accuracy and speed, we prefer ResNet-101 [19] as a backbone with the feature Pyramid Network(FPN) [60]. We create the mask for each class for pixel-level classification to reduce interclass similarity. We created the ground truth for the mask using object width, height and bounding box coordinates. The masks of all classes are in square boxes having four corner points as ( x m i n y m i n , x m a x y m i n , x m a x y m a x , x m i n y m a x ). Where ( x m i n , y m i n ) is the first corner point of the mask and obtained other corner points by adding the width and height of the bounding box in the first corner point. The model learns the mask of each class separately and is defined as the average binary cross-entropy loss, as shown in the following Equation (1).
L m a s k = 1 M 2 1 l , m M y l m l o g y l m n + ( 1 y l m ) l o g ( 1 y l m n )
where y l m is the label of pixel (l,m) in true mask area M M and y l m n is the estimated value of the same pixel for the ground-truth class n. The loss function of Mask R-CNN [17] is the combination of localization, classification and segmentation mask loss, where classification and localization loss is the same as in Faster R-CNN [25].

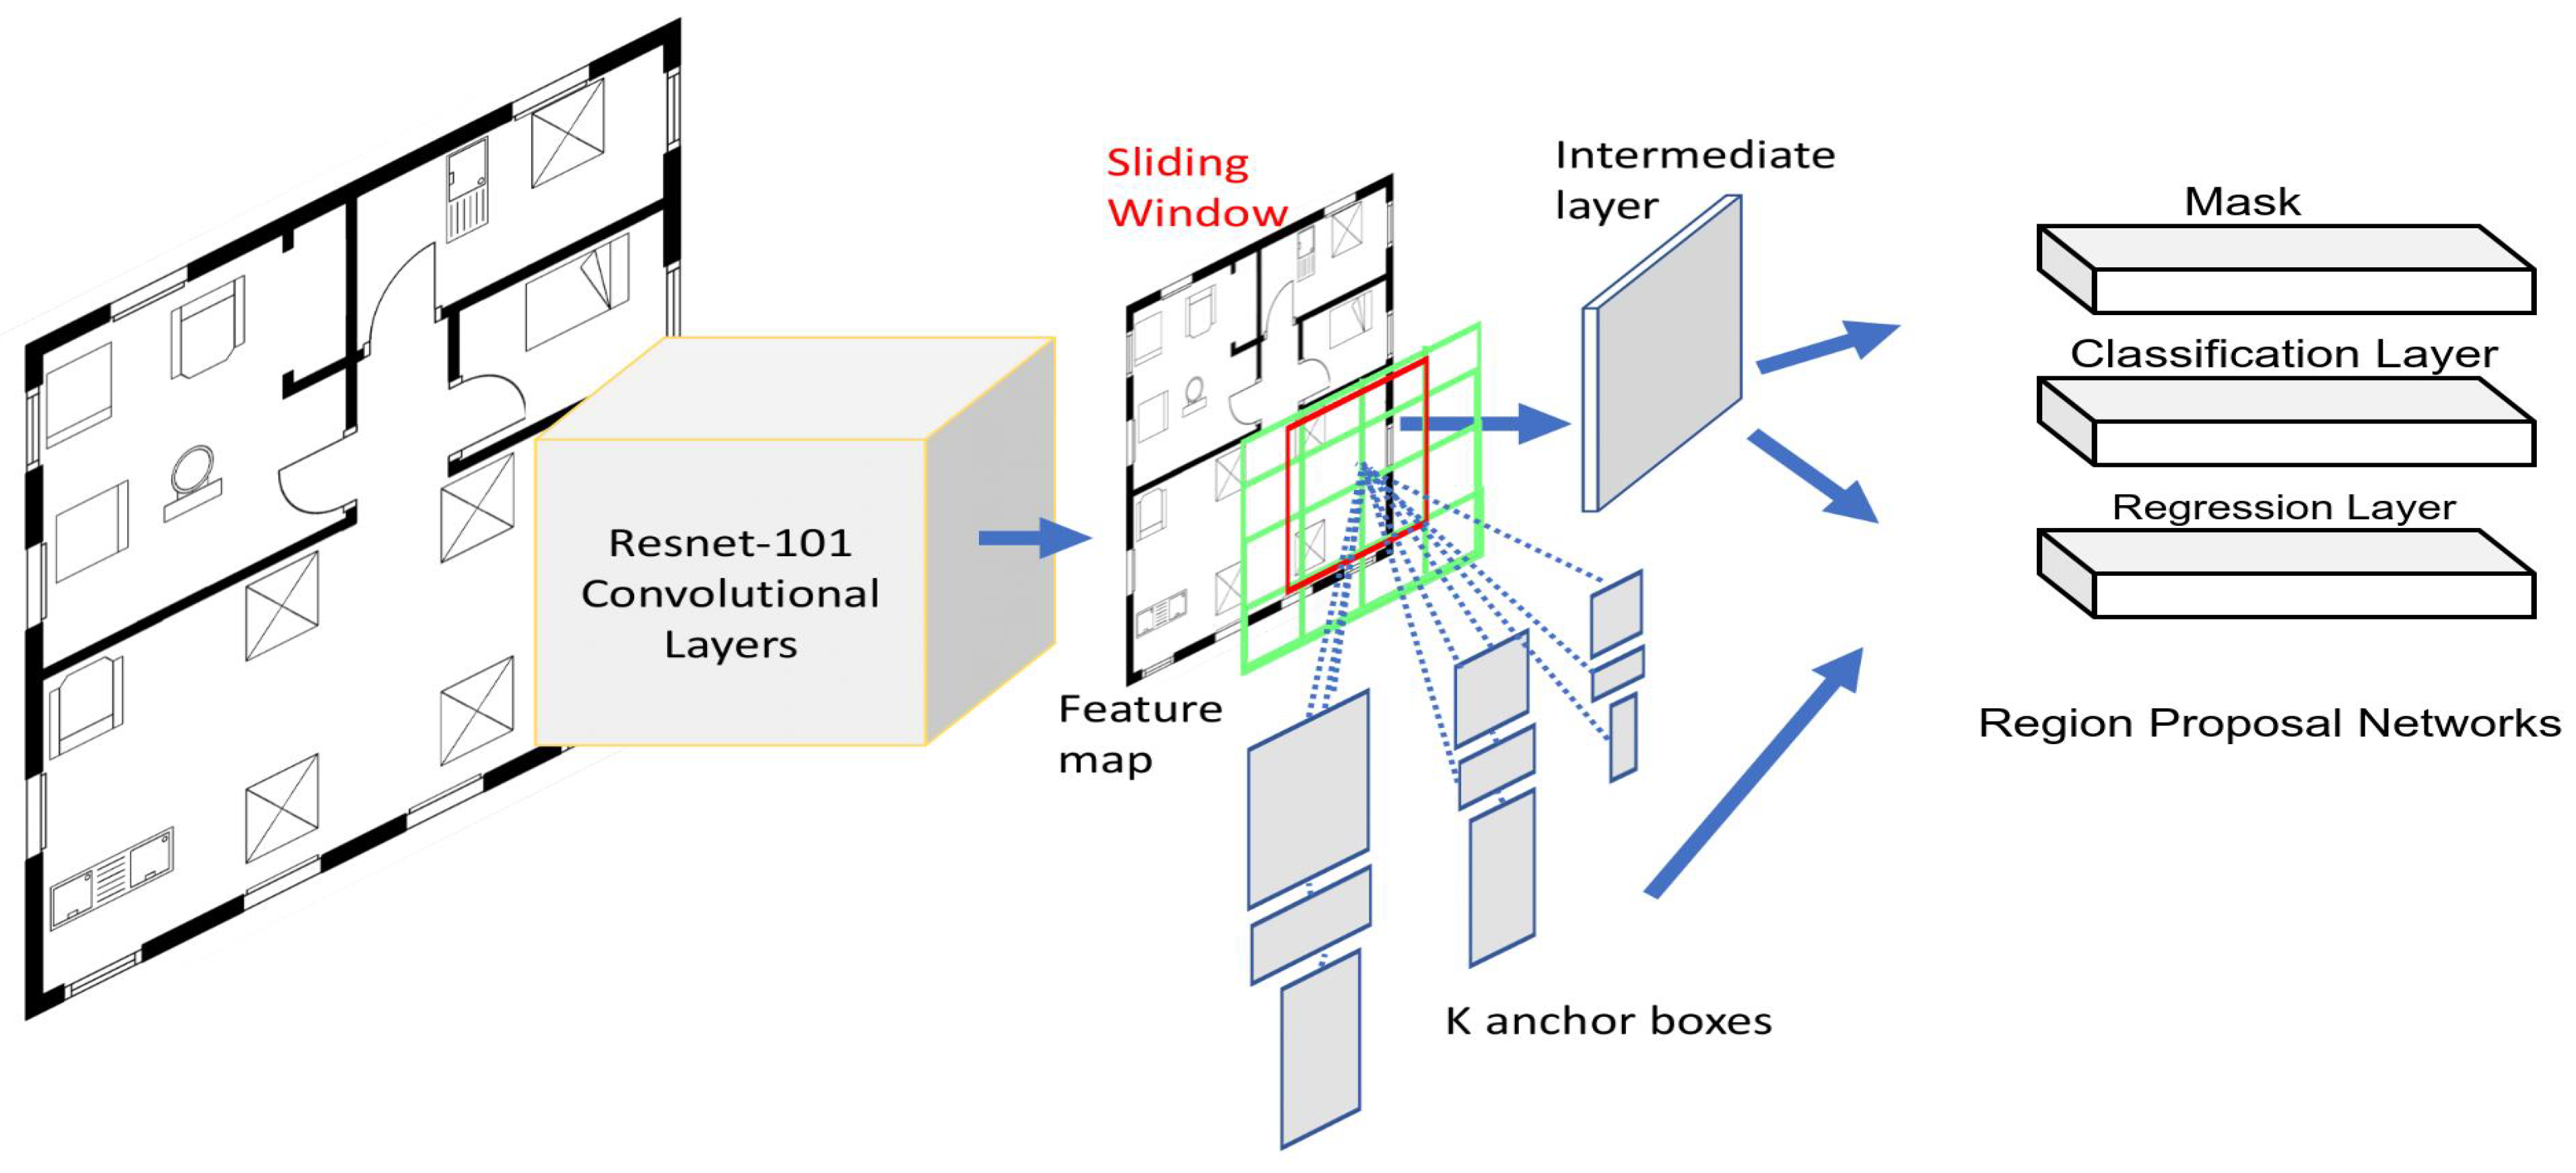
3.2. Backbone Network

The model performance drops both for train and test data. This reduction is not because of overfitting. Instead, network initialization, exploding, or vanishing gradients can also cause this problem. These can be easily optimized compared to the plain network, whose training error increases with adding more layers. The ResNet-50 [19] network is formed by replacing the 2-layer block of resnet-34 with a 3-layer block. This network has a higher accuracy than the resnet-34 network. The ResNet-101 contains three more layers. We used ResNet-50 [19] and ResNet-101 backbone network for this semi-supervised experiment. Figure 3 explains the Mask R-CNN [17] framework with ResNet-101 backbone. This network obtains a convolution feature map from the backbone layer, provides anchors generated by a sliding window and predicts the regions by the Region-Proposal Network (RPN). Then, we implement a pooling process to resize and a Fully connected layer to produce three nodes as a mask, softmax classification, and bounding-box regression.

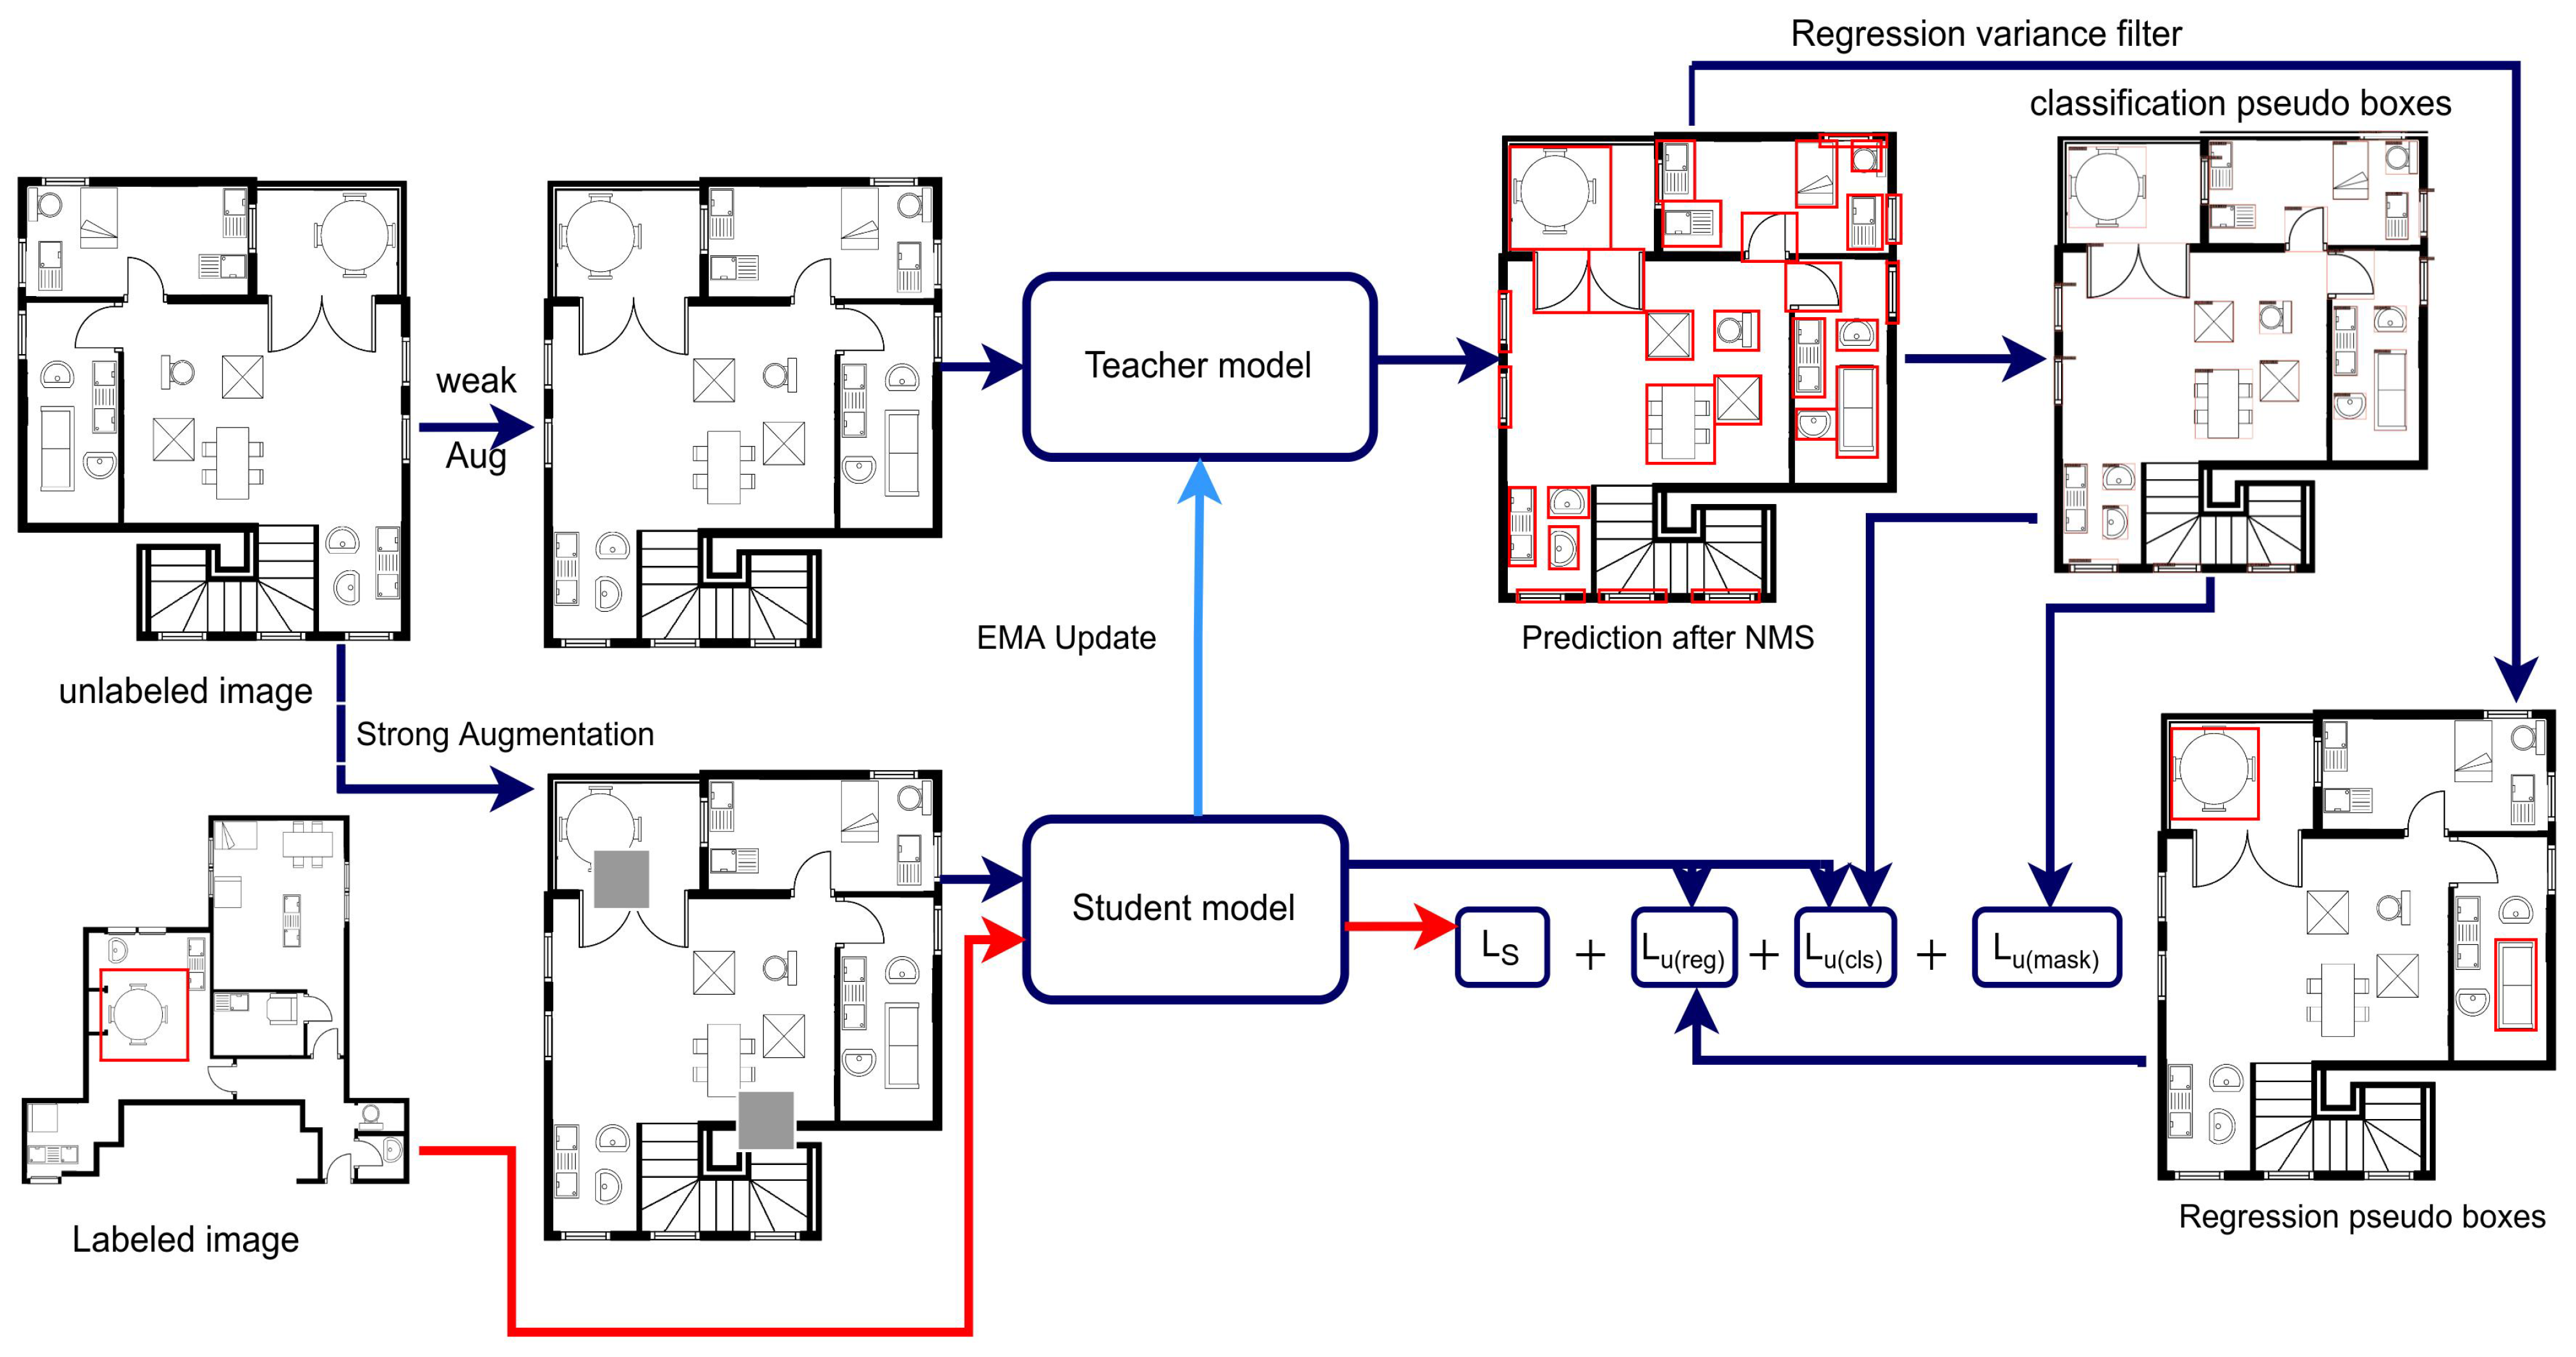
3.3. Semi-Supervised Model
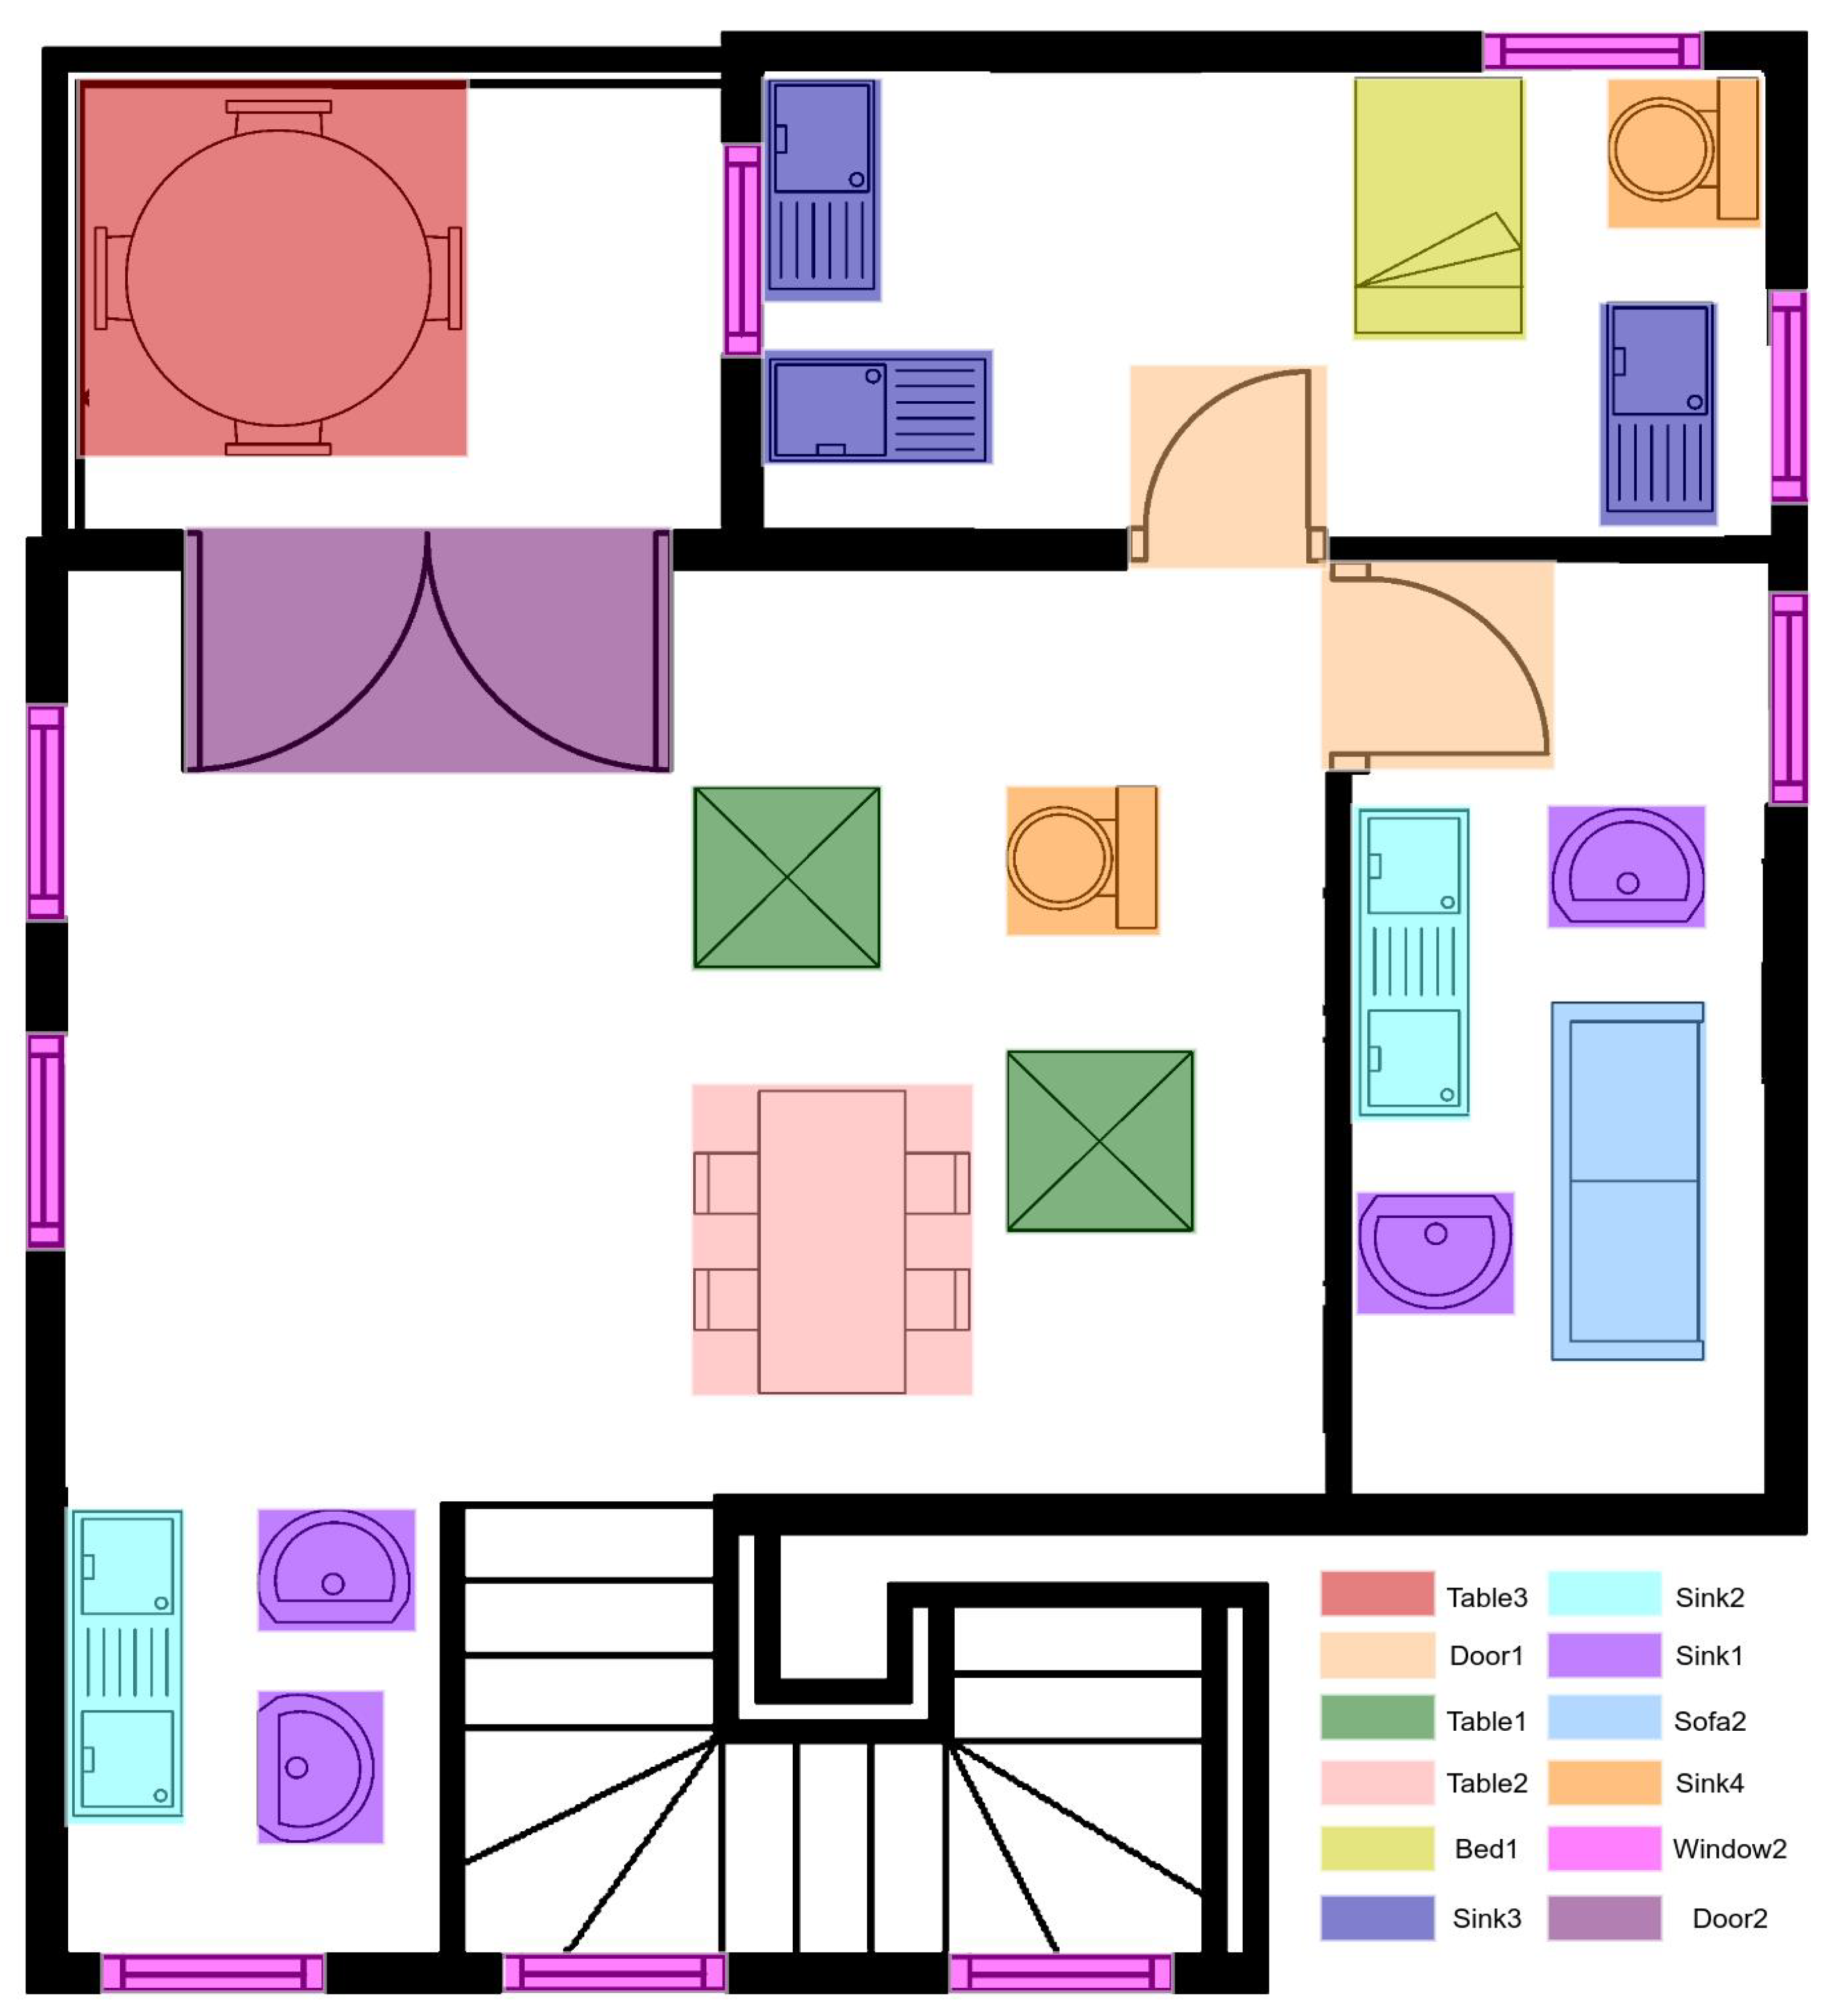
Creating pseudo labels for object detection is more challenging than image classification, where the simple probability distribution is considered for a pseudo-label generation. To obtain high-quality pseudo labels and avoid overfitting, strong augmentation is applied to the student model, and weak augmentation is used for the teacher model. The performance of the model is dependent on the quality of pseudo labels. Setting a high threshold on the foreground value to obtain more student-created boxes can provide better results than a low threshold. We get the best results when the threshold value is 0.9. However, a high threshold value provides good foreground precision, and the recall of box-candidate decreases quickly. Suppose we apply intersection over union (IoU) between teacher-created pseudo-boxes and student-created box-candidate to provide background and foreground labels as an ordinary object detection model does. In that case, we incorrectly classified some foreground boxes as negative, which reduces performance.
To eliminate this problem, we use the student–teacher network to generate pseudo-labels using a semi-supervised approach based on Mask R-CNN to provide pixel-to-pixel alignment to generate individual annotation masks for each class to mine the inter-class similarity and then use these pseudo labels as well as a small portion such as 1% of label data to train the model. This label and labeled data sampling includes all classes present in available data. The random samples of labeled and label images are selected using sampling ratio s r to make training batches. The teacher model uses label data to form pseudo-boxes, and the student model uses both label data with the pseudo boxes and labeled data as ground truth for training. We assessed the reliability of student-created box candidates of a real background and used it to weigh background-class loss. Equation (2) is the total loss that is the combination of unsupervised and supervised loss:
L = L s u p + α L u n
where L s u p represents the supervised loss of labeled data while L u n represents the unsupervised loss of label data, α is the controlling factor of unsupervised loss. We normalized these losses by their respective amount of floor-plan images in the training batch. The supervised and unsupervised loss is the combination of classification, localization, and segmentation mask loss as shown in Equations (3) and (4), respectively. The mask loss is explained in Equation (1) while classification and localization loss is the same as in Faster R-CNN [25].
L s u p = 1 N b n = 1 N b ( L c l a s s ( I b n ) + L r g ( I b n ) + L m a s k ( I b n ) )
L u n = 1 N u n = 1 N u ( L c l a s s ( I u n ) + L r g ( I u n ) + L m a s k ( I u n ) )
where I b n represents n-th labeled-image, I u n represents n-th label-image, N b indicates total labeled-images, N u indicates total label-images, L c l a s s , L r g and L m a s k is the classification, regression, and mask loss, respectively.
Figure 4 explains the overall architecture of the student–teacher approach. We initialized the teacher and student model randomly to start training; then, the student model updates the teacher model just like [2,61] using the exponential moving average (EMA) approach. Generating pseudo-labels for detecting objects is more challenging than classifying objects, as an image typically has multiple objects. To annotate those objects, we need location and category. The teacher model obtains label images to detect objects and generate many bounding boxes. The non-maximum suppression (NMS) is applied to minimize redundant boxes generated on the image objects. Even though we eliminated most iterating boxes, some non-foreground boxes remain.
The FixMatch [2] is a supervised learning-based image classification approach used to get better pseudo boxes and speed up student network training. We applied weak augmentation for generating pseudo-labels by the teacher network and strong augmentation for training the student network. Calculating the reliability score is a little bit difficult. So, we used the background value generated by the teacher model using weak augmentation as a signal for the student model. This approach is just like simple negative-mining, not like OHEM [62,63] or Focal Loss [63], known as hard negative-mining. To measure the consistency of regression boxes, we used a box jittering approach in which we sample teacher-generated pseudo boxes b k and refine them by feeding those boxes into the teacher model to obtain a refined box b k , as follows:
b k ^ = f i l t e r e d ( j i t t e r ( b k ) )
We repeated this process many times to obtain N j i t t e r filtered jitter boxes. The location probability of an object as a regression-variance is determined as follows:
σ ¯ k = 1 4 n = 1 4 ( σ ^ n )
σ ^ n = σ n 0.5 ( h ( b k ) + w ( b k ) )
where σ ^ n is the normalization of σ n , σ n is standard-derivation of nth coordinate of filtered jittered boxes, w ( b k ) is the width and h ( b k ) is the height of jittered box b k .
The localization accuracy will be more when the regression variance of the box is smaller. However, it is not feasible to assess the regression-variance of box candidates during the training process. Thus, we compute reliability only for those boxes whose foreground value is above 0.5, reducing the number of boxes from hundreds to 16 per image, minimizing the computational cost.

4. Dataset

We need a large dataset with various floor-plan layouts for deep neural network training, and there should be enough classes to analyze variation in furniture items. The dataset is created from SESYD [64] named SFPI (Synthetic Floor-Plan Images) [20]. It contains 16 furniture classes as window1, sofa1, sink1, table1, door1, window2, sofa2, sink2, table2, door2, tub, sink3, table3, sink3, armchair, sink4, and bed placed in various rooms, which helps in generating more realistic results. We have 10,000 floor-plan dataset images containing 1,000 floor-plan layouts and around 300,000 furniture items of 16 classes. We have different types of augmentation to create variation in our dataset. The first type of augmentation is rotation. We rotate with a random angle between [0, 30, 60, 90, 120, 180, 210, 270, 330].
Figure 5 shows that tub and sink furniture class items have different directions based on the provided angle. Another augmentation method is scaling with a random scaling factor between [20, 40, 75, 100, 145, 185, 200]. During scaling, we keep the same aspect ratio for all furniture classes. Figure 5 shows the sample image of this floor-plan dataset in which all furniture items are nearly the same size. The red and blue rectangular box objects demonstrate that sink and tub classes can vary in orientation. Further, we notice that some furniture items are present in particular rooms, which helps recognize room categories for different furniture items. This SFPI dataset is publicly available and can be downloaded from here https://cloud.dfki.de/owncloud/index.php/s/mkg5HBBntRbNo8X, accessed on 29 August 2022.

5. Experiments

5.1. Implementation Details

We used Mask R-CNN [17] based semi-supervised approach with ResNet-50 [19] and ResNet-101 backbone pre-trained on ImageNet [4] as a detection method. The training data contains 1%, 5%, and 10% floor-plan images as labeled data and the remaining images as label training data. We have 5 data folds for each type and calculated the final performance as the average of all folds. Our methodology and hyper-parameters are formulated from MMDetection [65]. For training, we used anchors with a three-aspect ratio and five-scale value and formed 1k and 2k region proposals with a 0.7 non-maximum suppression threshold. We selected a total of 512 proposals from 2k as box candidates for the training of RCNN. The IoU threshold value is set to 0.5 for mask bounding boxes.

5.1.1. Partially Labeled Data

We performed training for 80 k iterations on 8 GPUs (A100) using eight images per GPU. For initial training, the learning rate has the value of 0.01 and then is reduced to 0.001 at 30 k iteration and 0.0001 at 40 k iteration. The momentum and weight decay values are 0.9 and 0.0001, respectively. The data sampling ratio has an initial value of 0.2 and then decreases to 0 for the last 5 k iterations, and the foreground threshold has a 0.9 value.
For selecting box regression pseudo-labels, we set a threshold value of 0.02, and the N j i t t e r value is set as 10 to calculate the reliability of box localization. The jitter boxes are sampled by setting offset values for all coordinates and selecting the offsets from −6% to 6% width or height of pseudo-box candidates. Moreover, different augmentations are used, such as FixMatch [2], to generate pseudo-label and train the labeled and label data.

5.1.2. Fully Labeled Data

We have 150 k training iterations on 4 GPUs (A100) using eight images per GPU. For initial training, the learning rate has a value of 0.01 and then is reduced to 0.001 at 30 k iteration and 0.0001 at 40 k iteration. The momentum has a value of 0.9. The data sampling ratio has an initial value of 0.2 and then decreases to 0 for the last 15 k iterations, and the foreground threshold has a 0.9 value. The weight decay has a value of 0.0001. We assigned the N j i t t e r value of 10 to estimate box localization probability and the threshold value of 0.02 for selecting box regression pseudo labels.

6. Evaluation Criteria

We used some detection evaluation metrics to evaluate the performance of the semi-supervised based floor-plan object detection approach. This section explains the evaluation metrics used.

6.1. Intersection over Union

We calculated the intersection over union(IoU) in Equation (8) by taking the intersection divided by the union for the area of the ground-truth box A g and the generated bounding box A p .
I o U = a r e a ( A g A p ) a r e a ( A g A p )
IoU is used to estimate whether a detected object is false positive or true positive.

6.2. Average Precision

We calculated the average precision(AP) using a precision-recall curve. It is the area under the precision-recall curve and can be determined using the following Equation (9):
A P = k = 1 N ( R k + 1 R k ) P i n t r ( R k + 1 )
where R1, R2, …, R k are the values of the recall parameter.

6.3. Mean Average Precision

The mean average precision (mAP) is the most common metric for evaluating the performance of object detection methods. We calculate it by taking the mean of average precision for all classes s of the dataset. While working with a floor-plan dataset, it is preferred to calculate mAP to lower 16 classes to a set of classes s. The overall performance of mAP depends on class mapping, where a slight change in the performance of one class can affect overall mAP; that is the only drawback of mAP. We set the IoU threshold value of 0.5 and 0.75 to calculate the mAP, as shown in Equation (10):
m A P = 1 S s = 1 S A P s
where S is the total number of classes. For our floor-plan dataset S, its value is 16.

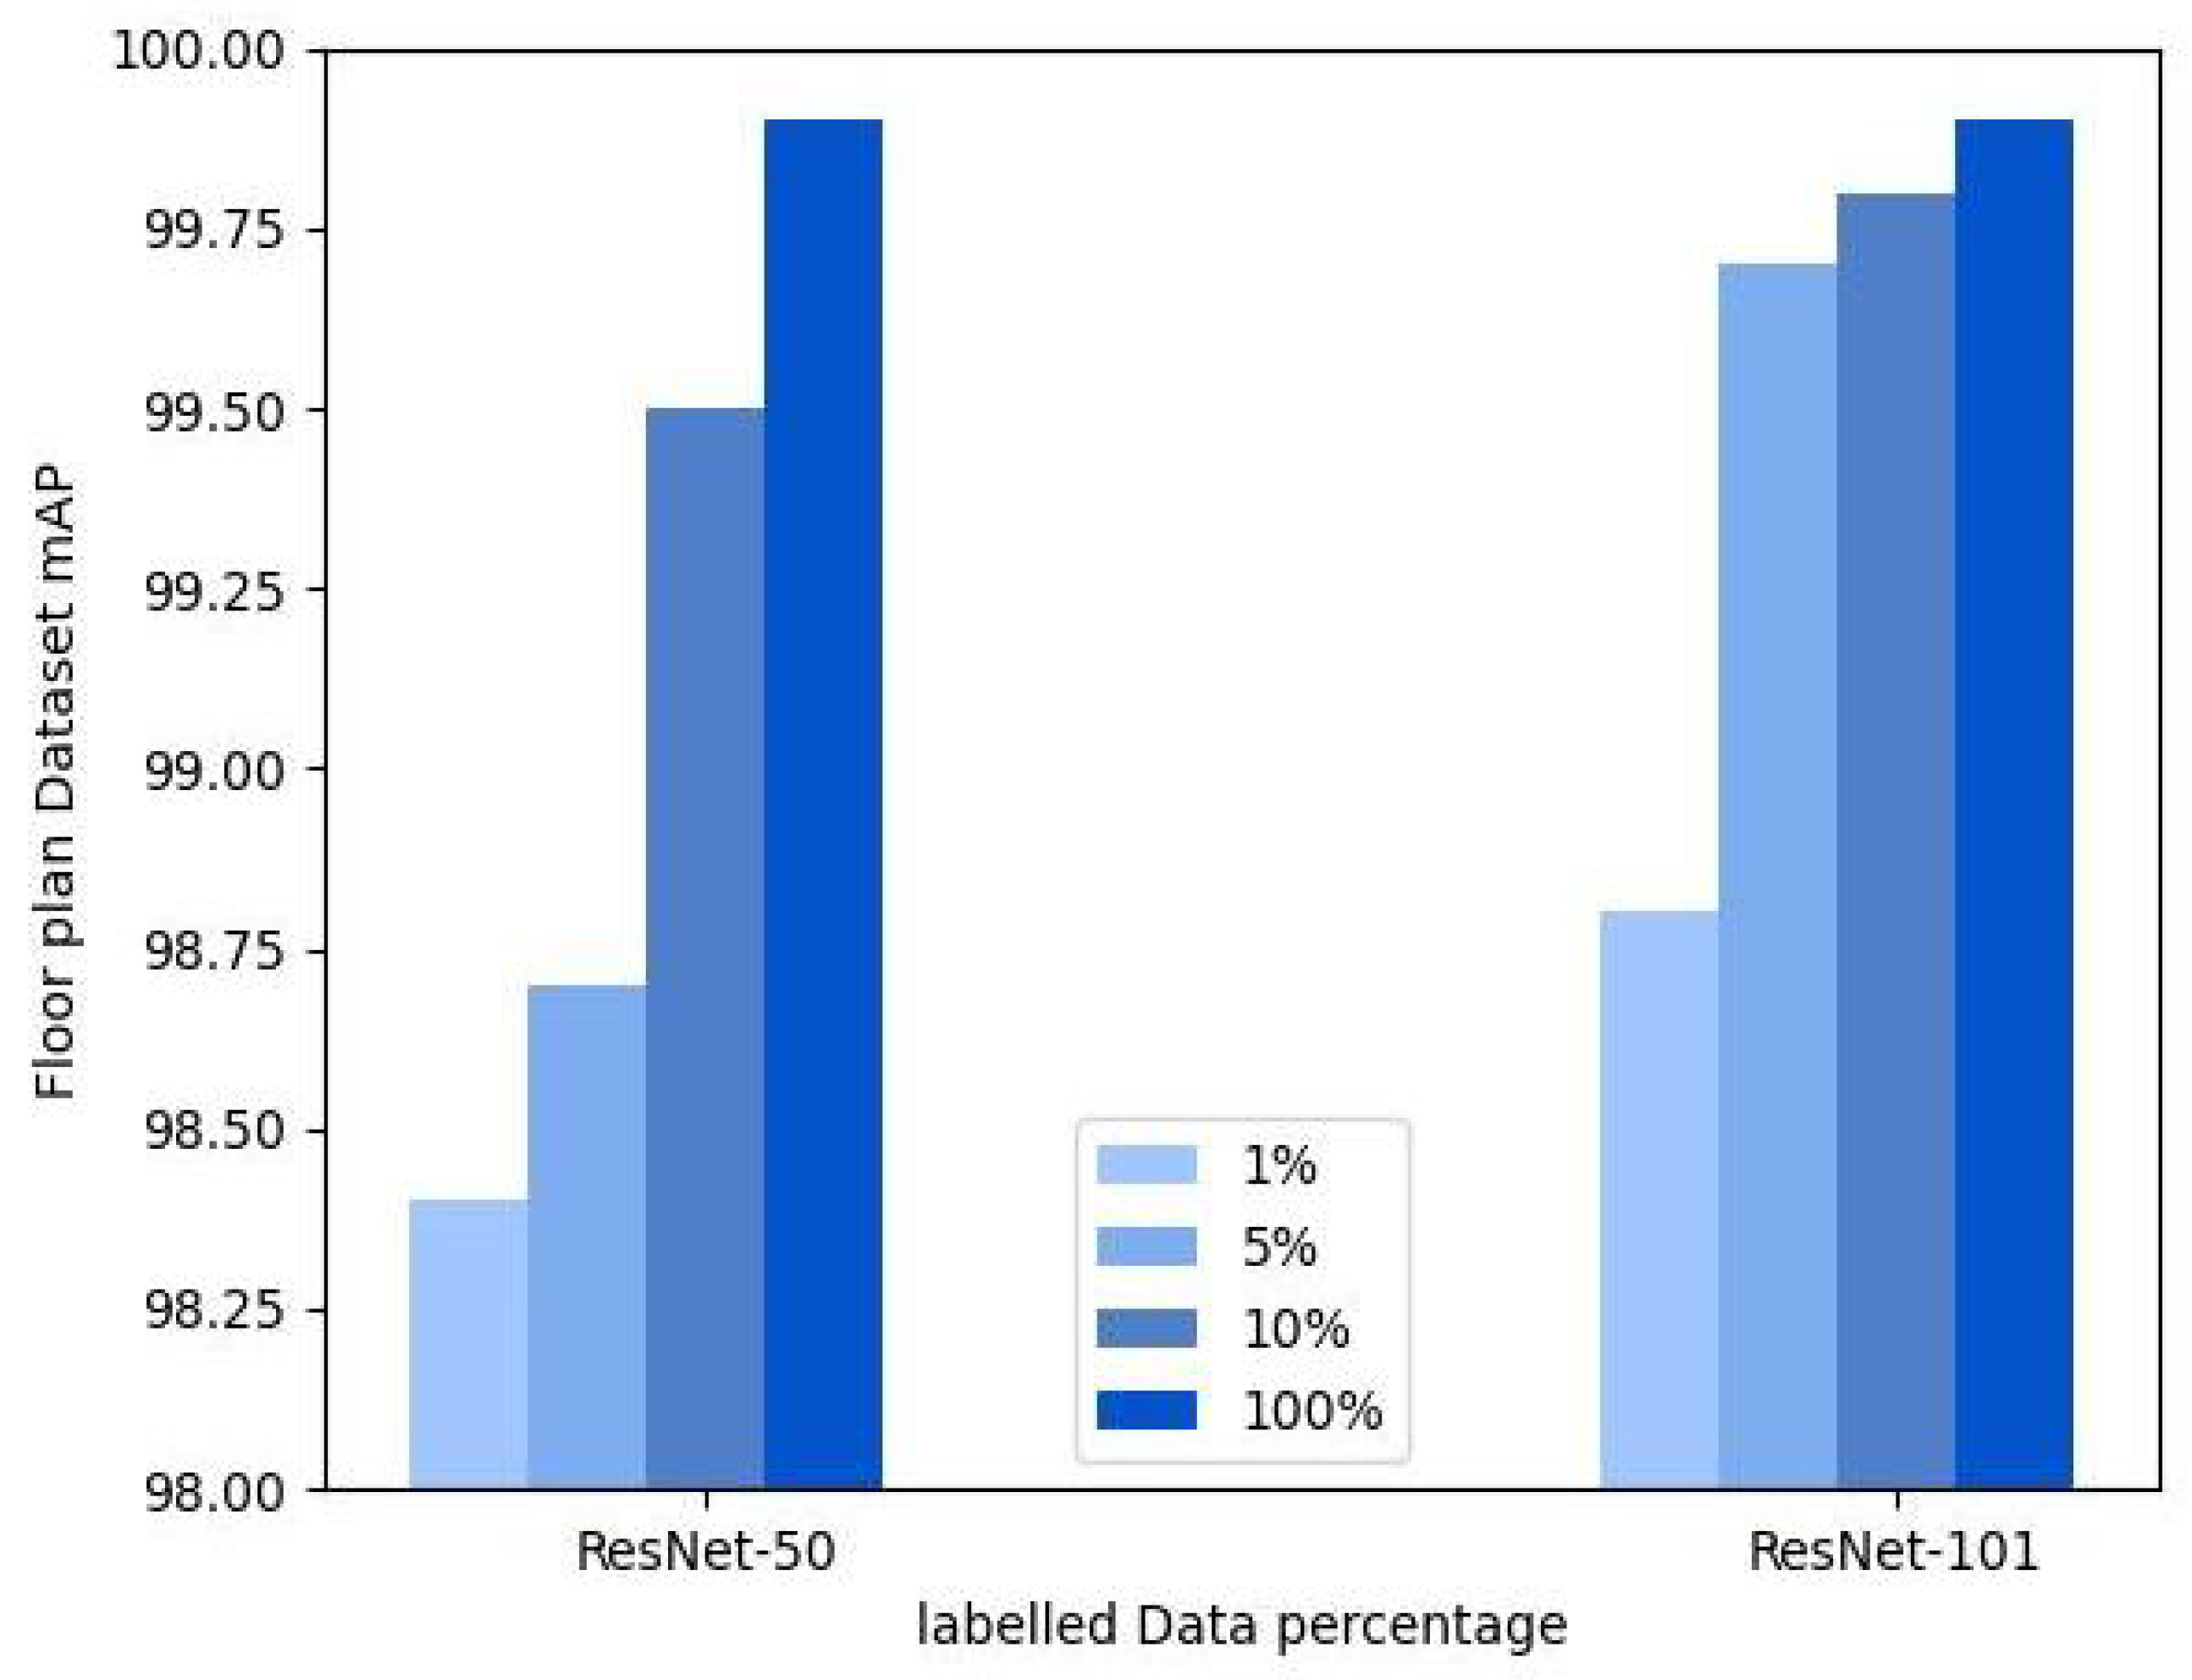
7. Results and Discussion

We use Mask R-CNN [17] based semi-supervised network on the floor-plan dataset. This section will explain the qualitative as well as quantitative results of the student–teacher network. For our experiment, we take 1%, 5%, and 10% floor-plan images as labeled data and the rest of the floor-plan images as label data. We have 5 data folds for each type and calculated the final performance as the average of all folds. We train and evaluate the approach on Faster-RCNN [25], and Mask R-CNN [17]. Furthermore, we also compare the algorithm’s performance on ResNet-50 [19] and ResNet-101 backbone with Mask R-CNN [17].
Figure 6 shows the average precision of every class separately. It is evident that some classes, such as armchairs, door2, table3, bed, table1, tub, door1, sink2 and table2 demonstrate one average precision, while all other classes show average precision above 0.95 except window1 class. We can observe for which classes our model performs well and where we need further improvements. Figure 7 shows the furniture items detection and localization on the floor-plan test dataset. The final result, where furniture items are detected and labeled in different colours, accurately detects all 16 classes.
Using different backbone networks, we determine the relative error between Mask R-CNN [17] and Faster R-CNN [25] detectors. Table 1 shows a comparison of these detectors with ResNet-50 [19] and ResNet-101 backbone on floor-plan dataset under semi-supervised setting. It shows that Mask R-CNN decreases the error by 8.94%, 16%, and 37.5% with ResNet-50 backbone and 29.4%, 50%, and 50% with ResNet-101 backbone for 1%, 5%, and 10% label data, respectively. Using 1% labeled data, we are obtaining 98.8% mAP on Mask R-CNN with ResNet-101 backbone, which demonstrates that this approach provides the best results using a small amount of labeled data. This comparison also demonstrates that the ResNet-101 backbone provides better results than the ResNet-50 [19] backbone for both detectors.
We also study the behaviour of hyper-parameters on model performance. The first hyperparameter is the jittered-box value that calculates the localization reliability of pseudo boxes. Table 2 compares the performance under different values of jittered boxes. By setting a jittered box value of 10 it gives a mAP of 99.6%, while A P 0.5 and A P 0.75 are 99.8% and 99.7%, respectively. We can observe from Table 2 that the model gives the highest accuracy shown in bold when N j i t t e r has a value of 10.
We apply intersection over union (IoU) between the teacher-created pseudo-boxes and student-created box-candidate to provide background and foreground labels as an ordinary object detection model does. In that case, some foreground boxes are incorrectly classified as negative, reducing performance. Table 3 shows the box regression-variance threshold. We obtain the best results shown in bold by setting the threshold value to 0.02. However, a high threshold value provides good foreground precision, and the recall of box-candidate decreases quickly.
Figure 8 shows a test image where some furniture items are miss-classified. The network confuses between window1 and window2. The green box wrongly detects two windows, as one window is named window2. The size of window1 and window2 objects is small compared to all other floor-plan objects. The detection performance of such small objects can be improved further, where the background occupies 95% area of the image.
Comparison with prior SOTA approaches Table 4 shows the comparison of our semi-supervised network performance with previously presented semi-supervised approaches on an average of five data folds with 1%, 5%, and 10% floor plan label data. For supervised training on Mask R-CNN, we used just 1%, 5%, and 10% label data for training. This mask-aware semi-supervised training gives 98.8% mAP on just 1% labels, as this dataset is formed by applying different augmentation approaches explained in Section 4. This behavior can also be observed in other semi-supervised approaches, as they also give high mAP on just 1% label data. It is observed from Table 4 that our Mask R-CNN-based semi-supervised approach shown in bold outperforms the previous semi-supervised approaches.
Table 5 shows the comparison of our semi-supervised network performance for five data folds with 10% label data on Faster R-CNN [25] and Mask R-CNN [17] with previously presented supervised approaches. We can not directly compare the results of Ziran et al. [68] because of the different datasets. It is observed from Table 5 that the semi-supervised approach outperforms the previous supervised approaches using just 10% of label data.

8. Conclusions and Future Work

We examine the capabilities of the semi-supervised approach to detect objects in floor-plan data. It pulls information from the teacher network and feeds it to the student network. The teacher model uses label data to form pseudo-boxes, and the student model uses both label data (with the pseudo boxes) and labeled data as ground truth for training. On Mask R-CNN [17] detector with ResNet-101 backbone, the proposed approach achieves 98.8(%) mAP, 99.7(%) mAP, 99.8(%) mAP with 1%, 5%, and 10% labeled data, respectively. We can observe from the results that we can obtain the best performance by just using 1% labeled data. Furthermore, this experiment can be implemented in various floor-plan applications such as floor-plan text generation, and furniture fitting, helping impaired people to analyze house design and for customers to buy a house online. Earlier, all these applications used supervised learning approaches [68,69] for floor-plan object detection. However, now with our experiment, it is clear that the semi-supervised [16] approach gives better results for these applications.
In future, we can improve Mask R-CNN [17]-based semi-supervised floor-plan detection system in different ways. We can add text information to detect room types, especially rooms that are not physically separated, like the dining hall attached to the kitchen. We can also label rooms according to their functionality. Further research using noisy labels in training and uncertainty estimation are also a few important topics to boost the efficiency of semi-supervised-based object detection.

Author Contributions

Writing—original draft preparation, T.S., K.A.H., M.Z.A.; writing—review and editing, T.S., K.A.H., M.Z.A.; supervision and project administration, A.P., D.S. and M.L. All authors have read and agreed to the submitted version of the manuscript.

Funding

The work leading to this publication has been partially funded by the European project INFINITY under Grant Agreement ID 883293.

Institutional Review Board Statement

Not applicable.

Informed Consent Statement

Not applicable.

Data Availability Statement

Not applicable.

Conflicts of Interest

The authors declare no conflict of interest.

References

  1. Berthelot, D.; Carlini, N.; Cubuk, E.D.; Kurakin, A.; Sohn, K.; Zhang, H.; Raffel, C. ReMixMatch: Semi-Supervised Learning with Distribution Alignment and Augmentation Anchoring. arXiv 2019, arXiv:1911.09785. [Google Scholar]
  2. Sohn, K.; Berthelot, D.; Li, C.; Zhang, Z.; Carlini, N.; Cubuk, E.D.; Kurakin, A.; Zhang, H.; Raffel, C. FixMatch: Simplifying Semi-Supervised Learning with Consistency and Confidence. Adv. Neural Inf. Process. Syst. 2020, 33, 596–608. [Google Scholar]
  3. Simard, P.; Steinkraus, D.; Platt, J. Best practices for convolutional neural networks applied to visual document analysis. In Proceedings of the Seventh International Conference on Document Analysis and Recognition, Edinburgh, Scotland, 3–6 August 2003; pp. 958–963. [Google Scholar] [CrossRef]
  4. Krizhevsky, A.; Sutskever, I.; Hinton, G.E. ImageNet Classification with Deep Convolutional Neural Networks. Commun. ACM 2017, 60, 84–90. [Google Scholar] [CrossRef]
  5. Xie, Q.; Hovy, E.H.; Luong, M.; Le, Q.V. Self-training with Noisy Student improves ImageNet classification. arXiv 2019, arXiv:1911.04252. [Google Scholar]
  6. Zhu, J.; Park, T.; Isola, P.; Efros, A.A. Unpaired Image-to-Image Translation using Cycle-Consistent Adversarial Networks. arXiv 2017, arXiv:1703.10593. [Google Scholar]
  7. Hoffman, J.; Tzeng, E.; Park, T.; Zhu, J.; Isola, P.; Saenko, K.; Efros, A.A.; Darrell, T. CyCADA: Cycle-Consistent Adversarial Domain Adaptation. arXiv 2017, arXiv:1711.03213. [Google Scholar]
  8. Zakharov, S.; Kehl, W.; Ilic, S. DeceptionNet: Network-Driven Domain Randomization. In Proceedings of the 2019 IEEE/CVF International Conference on Computer Vision (ICCV), Seoul, Korea, 27 October–2 November 2019; pp. 532–541. [Google Scholar] [CrossRef]
  9. Cubuk, E.D.; Zoph, B.; Mané, D.; Vasudevan, V.; Le, Q.V. AutoAugment: Learning Augmentation Strategies From Data. In Proceedings of the 2019 IEEE/CVF Conference on Computer Vision and Pattern Recognition (CVPR), Long Beach, CA, USA, 16–20 June 2019; pp. 113–123. [Google Scholar] [CrossRef]
  10. Zoph, B.; Cubuk, E.D.; Ghiasi, G.; Lin, T.; Shlens, J.; Le, Q.V. Learning Data Augmentation Strategies for Object Detection. arXiv 2019, arXiv:1906.11172. [Google Scholar]
  11. Gimenez, L.; Hippolyte, J.L.; Robert, S.; Suard, F.; Zreik, K. Review: Reconstruction of 3D building information models from 2D scanned plans. J. Build. Eng. 2015, 2, 24–35. [Google Scholar] [CrossRef]
  12. Ahmed, S.; Liwicki, M.; Weber, M.; Dengel, A. Automatic Room Detection and Room Labeling from Architectural Floor Plans. In Proceedings of the 2012 10th IAPR International Workshop on Document Analysis Systems, Gold Coast, QLD, Australia, 27–29 March 2012; pp. 339–343. [Google Scholar] [CrossRef]
  13. Sohn, K.; Zhang, Z.; Li, C.; Zhang, H.; Lee, C.; Pfister, T. A Simple Semi-Supervised Learning Framework for Object Detection. arXiv 2020, arXiv:2005.04757. [Google Scholar]
  14. Zoph, B.; Ghiasi, G.; Lin, T.; Cui, Y.; Liu, H.; Cubuk, E.D.; Le, Q.V. Rethinking Pre-training and Self-training. arXiv 2020, arXiv:2006.06882. [Google Scholar]
  15. Gurkan, H.; de Véricourt, F. Contracting, Pricing, and Data Collection Under the AI Flywheel Effect; Working Paper; ESMT: Berlin, Germany, 2022. [Google Scholar] [CrossRef]
  16. Xu, M.; Zhang, Z.; Hu, H.; Wang, J.; Wang, L.; Wei, F.; Bai, X.; Liu, Z. End-to-End Semi-Supervised Object Detection with Soft Teacher. arXiv 2021, arXiv:2106.09018. [Google Scholar]
  17. He, K.; Gkioxari, G.; Dollár, P.; Girshick, R. Mask R-CNN. In Proceedings of the 2017 IEEE International Conference on Computer Vision (ICCV), Venice, Italy, 22–29 October 2017; pp. 2980–2988. [Google Scholar] [CrossRef]
  18. Lin, T.Y.; Dollár, P.; Girshick, R.; He, K.; Hariharan, B.; Belongie, S. Feature Pyramid Networks for Object Detection. In Proceedings of the 2017 IEEE Conference on Computer Vision and Pattern Recognition (CVPR), Honolulu, HI, USA, 21–26 July 2017; pp. 936–944. [Google Scholar] [CrossRef]
  19. Szegedy, C.; Ioffe, S.; Vanhoucke, V. Inception-v4, Inception-ResNet and the Impact of Residual Connections on Learning. arXiv 2016, arXiv:1602.07261. [Google Scholar] [CrossRef]
  20. Mishra, S.; Hashmi, K.A.; Pagani, A.; Liwicki, M.; Stricker, D.; Afzal, M.Z. Towards Robust Object Detection in Floor Plan Images: A Data Augmentation Approach. Appl. Sci. 2021, 11, 11174. [Google Scholar] [CrossRef]
  21. Liu, W.; Anguelov, D.; Erhan, D.; Szegedy, C.; Reed, S.; Fu, C.Y.; Berg, A.C. SSD: Single Shot MultiBox Detector. In Proceedings of the Computer Vision–ECCV 2016, Amsterdam, The Netherlands, 11–14 October 2016; Leibe, B., Matas, J., Sebe, N., Welling, M., Eds.; Springer International Publishing: Cham, Switzerland, 2016; pp. 21–37. [Google Scholar]
  22. Redmon, J.; Divvala, S.; Girshick, R.; Farhadi, A. You Only Look Once: Unified, Real-Time Object Detection. In Proceedings of the 2016 IEEE Conference on Computer Vision and Pattern Recognition (CVPR), Las Vegas, NV, USA, 27–30 June 2016; pp. 779–788. [Google Scholar] [CrossRef]
  23. Tian, Z.; Shen, C.; Chen, H.; He, T. FCOS: Fully Convolutional One-Stage Object Detection. In Proceedings of the 2019 IEEE/CVF International Conference on Computer Vision (ICCV), Seoul, Korea, 27 October–2 November 2019; pp. 9626–9635. [Google Scholar] [CrossRef]
  24. Girshick, R. Fast R-CNN. In Proceedings of the 2015 IEEE International Conference on Computer Vision (ICCV), Santiago, Chile, 7–13 December 2015; pp. 1440–1448. [Google Scholar] [CrossRef]
  25. Ren, S.; He, K.; Girshick, R.; Sun, J. Faster R-CNN: Towards Real-Time Object Detection with Region Proposal Networks. IEEE Trans. Pattern Anal. Mach. Intell. 2017, 39, 1137–1149. [Google Scholar] [CrossRef] [PubMed]
  26. Hashmi, K.A.; Pagani, A.; Liwicki, M.; Stricker, D.; Afzal, M.Z. Exploiting Concepts of Instance Segmentation to Boost Detection in Challenging Environments. Sensors 2022, 22, 3703. [Google Scholar] [CrossRef] [PubMed]
  27. Zhang, F.; Fan, X.; Ai, G.; Song, J.; Qin, Y.; Wu, J. Accurate Face Detection for High Performance. arXiv 2019, arXiv:1905.01585. [Google Scholar]
  28. Khan, A.H.; Munir, M.; van Elst, L.; Dengel, A. F2DNet: Fast Focal Detection Network for Pedestrian Detection. arXiv 2022, arXiv:2203.02331. [Google Scholar]
  29. Hashmi, K.A.; Pagani, A.; Liwicki, M.; Stricker, D.; Afzal, M.Z. Cascade Network with Deformable Composite Backbone for Formula Detection in Scanned Document Images. Appl. Sci. 2021, 11, 7610. [Google Scholar] [CrossRef]
  30. Nazir, D.; Hashmi, K.A.; Pagani, A.; Liwicki, M.; Stricker, D.; Afzal, M.Z. HybridTabNet: Towards Better Table Detection in Scanned Document Images. Appl. Sci. 2021, 11, 8396. [Google Scholar] [CrossRef]
  31. Hashmi, K.A.; Pagani, A.; Liwicki, M.; Stricker, D.; Afzal, M.Z. CasTabDetectoRS: Cascade Network for Table Detection in Document Images with Recursive Feature Pyramid and Switchable Atrous Convolution. J. Imaging 2021, 7, 214. [Google Scholar] [CrossRef]
  32. Naik, S.; Hashmi, K.A.; Pagani, A.; Liwicki, M.; Stricker, D.; Afzal, M.Z. Investigating Attention Mechanism for Page Object Detection in Document Images. Appl. Sci. 2022, 12, 7486. [Google Scholar] [CrossRef]
  33. Bachman, P.; Alsharif, O.; Precup, D. Learning with Pseudo-Ensembles. Adv. Neural Inf. Process. Syst. 2014, 27. [Google Scholar] [CrossRef]
  34. Miyato, T.; Maeda, S.I.; Koyama, M.; Ishii, S. Virtual Adversarial Training: A Regularization Method for Supervised and Semi-Supervised Learning. IEEE Trans. Pattern Anal. Mach. Intell. 2019, 41, 1979–1993. [Google Scholar] [CrossRef] [PubMed]
  35. Sajjadi, M.; Javanmardi, M.; Tasdizen, T. Regularization with Stochastic Transformations and Perturbations for Deep Semi-Supervised Learning. In Proceedings of the 30th International Conference on Neural Information Processing Systems (NIPS’16), Barcelona, Spain, 5–10 December 2016; Curran Associates Inc.: Red Hook, NY, USA, 2016; pp. 1171–1179. [Google Scholar]
  36. Laine, S.; Aila, T. Temporal Ensembling for Semi-Supervised Learning. arXiv 2016, arXiv:1610.02242. [Google Scholar]
  37. Tarvainen, A.; Valpola, H. Mean teachers are better role models: Weight-averaged consistency targets improve semi-supervised deep learning results. In Proceedings of the Advances in Neural Information Processing Systems, Long Beach, CA, USA, 4–9 December 2017; Guyon, I., Luxburg, U.V., Bengio, S., Wallach, H., Fergus, R., Vishwanathan, S., Garnett, R., Eds.; Curran Associates, Inc.: Red Hook, NY, USA, 2017; Volume 30. [Google Scholar]
  38. Grandvalet, Y.; Bengio, Y. Semi-Supervised Learning by Entropy Minimization. In Proceedings of the 17th International Conference on Neural Information Processing Systems (NIPS’04); MIT Press: Cambridge, MA, USA, 2004; pp. 529–536. [Google Scholar]
  39. Xie, Q.; Dai, Z.; Hovy, E.; Luong, T.; Le, Q. Unsupervised Data Augmentation for Consistency Training. In Proceedings of the Advances in Neural Information Processing Systems, Online Conference, 6–12 December 2020; Larochelle, H., Ranzato, M., Hadsell, R., Balcan, M., Lin, H., Eds.; Curran Associates, Inc.: Red Hook, NY, USA, 2020; Volume 33, pp. 6256–6268. [Google Scholar]
  40. Radosavovic, I.; Dollár, P.; Girshick, R.; Gkioxari, G.; He, K. Data Distillation: Towards Omni-Supervised Learning. In Proceedings of the 2018 IEEE/CVF Conference on Computer Vision and Pattern Recognition, Salt Lake City, UT, USA, 18–22 June 2018; pp. 4119–4128. [Google Scholar] [CrossRef]
  41. Jeong, J.; Lee, S.; Kim, J.; Kwak, N. Consistency-based Semi-supervised Learning for Object detection. In Proceedings of the Advances in Neural Information Processing Systems; Wallach, H., Larochelle, H., Beygelzimer, A., d’Alché-Buc, F., Fox, E., Garnett, R., Eds.; Curran Associates, Inc.: Red Hook, NY, USA, 2019; Volume 32. [Google Scholar]
  42. Tang, P.; Ramaiah, C.; Xu, R.; Xiong, C. Proposal Learning for Semi-Supervised Object Detection. In Proceedings of the 2021 IEEE Winter Conference on Applications of Computer Vision (WACV), Virtual Conference, 5–9 January 2021; pp. 2290–2300. [Google Scholar]
  43. Li, Y.; Huang, D.; Qin, D.; Wang, L.; Gong, B. Improving Object Detection with Selective Self-Supervised Self-Training. In Proceedings of the Computer Vision—ECCV 2020: 16th European Conference, Glasgow, UK, 23–28 August 2020; Proceedings, Part XXIX. Springer: Berlin/Heidelberg, Germany, 2020; pp. 589–607. [Google Scholar] [CrossRef]
  44. Geifman, Y.; El-Yaniv, R. SelectiveNet: A Deep Neural Network with an Integrated Reject Option. arXiv 2019, arXiv:1901.09192. [Google Scholar]
  45. Wang, K.; Yan, X.; Zhang, D.; Zhang, L.; Lin, L. Towards Human-Machine Cooperation: Self-Supervised Sample Mining for Object Detection. In Proceedings of the 2018 IEEE/CVF Conference on Computer Vision and Pattern Recognition, Salt Lake City, UT, USA, 18–23 June 2018; pp. 1605–1613. [Google Scholar] [CrossRef]
  46. Xie, Q.; Dai, Z.; Hovy, E.H.; Luong, M.; Le, Q.V. Unsupervised Data Augmentation. arXiv 2019, arXiv:1904.12848. [Google Scholar]
  47. Cubuk, E.D.; Zoph, B.; Shlens, J.; Le, Q.V. RandAugment: Practical Data Augmentation with No Separate Search. arXiv 2019, arXiv:1909.13719. [Google Scholar]
  48. Ghorbel, A.; Lemaitre, A.; Anquetil, E.; Fleury, S.; Jamet, E. Interactive interpretation of structured documents: Application to the recognition of handwritten architectural plans. Pattern Recognit. 2015, 48, 2446–2458. [Google Scholar] [CrossRef]
  49. Macé, S.; Locteau, H.; Valveny, E.; Tabbone, S. A system to detect rooms in architectural floor plan images. In Proceedings of the DAS ’10, Boston, MA, USA, 9–11 June 2010. [Google Scholar]
  50. Lladós, J.; López-Krahe, J.; Martí, E. A System to Understand Hand-Drawn Floor Plans Using Subgraph Isomorphism and Hough Transform. Mach. Vis. Appl. 1997, 10, 150–158. [Google Scholar] [CrossRef]
  51. Eklund, A. Cascade Mask R-CNN and Keypoint Detection Used in Floorplan Parsing. Dissertation. 2020. Available online: https://www.mysciencework.com/publication/show/cascade-mask-rcnn-keypoint-detection-used-floorplan-parsing-907b4082 (accessed on 29 August 2022).
  52. Cai, Z.; Vasconcelos, N. Cascade R-CNN: Delving Into High Quality Object Detection. In Proceedings of the 2018 IEEE/CVF Conference on Computer Vision and Pattern Recognition, Salt Lake City, UT, USA, 18–23 June 2018; pp. 6154–6162. [Google Scholar] [CrossRef]
  53. Goyal, S.; Chattopadhyay, C.; Bhatnagar, G. Plan2Text: A framework for describing building floor plan images from first person perspective. In Proceedings of the 2018 IEEE 14th International Colloquium on Signal Processing Its Applications (CSPA), Penang, Malaysia, 9–10 March 2018; pp. 35–40. [Google Scholar] [CrossRef]
  54. Zeng, Z.; Li, X.; Yu, Y.K.; Fu, C.W. Deep Floor Plan Recognition Using a Multi-Task Network With Room-Boundary-Guided Attention. In Proceedings of the 2019 IEEE/CVF International Conference on Computer Vision (ICCV), Seoul, Korea, 27 October–2 November 2019; pp. 9095–9103. [Google Scholar] [CrossRef] [Green Version]
  55. Simonyan, K.; Zisserman, A. Very Deep Convolutional Networks for Large-Scale Image Recognition. arXiv 2015, arXiv:1409.1556. [Google Scholar]
  56. Liu, C.; Wu, J.; Kohli, P.; Furukawa, Y. Raster-to-Vector: Revisiting Floorplan Transformation. In Proceedings of the 2017 IEEE International Conference on Computer Vision (ICCV), Venice, Italy, 22–29 October 2017; pp. 2214–2222. [Google Scholar] [CrossRef]
  57. Yamasaki, T.; Zhang, J.; Takada, Y. Apartment Structure Estimation Using Fully Convolutional Networks and Graph Model. In Proceedings of the 2018 ACM Workshop on Multimedia for Real Estate Tech (RETech’18), Yokohama, Japan, 11 June 2018; Association for Computing Machinery: New York, NY, USA, 2018; pp. 1–6. [Google Scholar] [CrossRef]
  58. Dodge, S.; Xu, J.; Stenger, B. Parsing floor plan images. In Proceedings of the 2017 Fifteenth IAPR International Conference on Machine Vision Applications (MVA), Nagoya, Japan, 8–12 May 2017; pp. 358–361. [Google Scholar] [CrossRef]
  59. de las Heras, L.P.; Ahmed, S.; Liwicki, M.; Valveny, E.; Sánchez, G. Statistical segmentation and structural recognition for floor plan interpretation. Int. J. Doc. Anal. Recognit. (IJDAR) 2014, 17, 221–237. [Google Scholar] [CrossRef]
  60. Lin, T.; Dollár, P.; Girshick, R.B.; He, K.; Hariharan, B.; Belongie, S.J. Feature Pyramid Networks for Object Detection. arXiv 2016, arXiv:1612.03144. [Google Scholar]
  61. Tarvainen, A.; Valpola, H. Weight-averaged consistency targets improve semi-supervised deep learning results. arXiv 2017, arXiv:1703.01780. [Google Scholar]
  62. Shrivastava, A.; Gupta, A.; Girshick, R. Training Region-Based Object Detectors with Online Hard Example Mining. In Proceedings of the 2016 IEEE Conference on Computer Vision and Pattern Recognition (CVPR), Las Vegas, NV, USA, 27–30 June 2016; pp. 761–769. [Google Scholar] [CrossRef]
  63. Lin, T.Y.; Goyal, P.; Girshick, R.; He, K.; Dollar, P. Focal Loss for Dense Object Detection. In Proceedings of the IEEE International Conference on Computer Vision (ICCV), Venice, Italy, 22–29 October 2017. [Google Scholar]
  64. Delalandre, M.; Valveny, E.; Pridmore, T.; Karatzas, D. Generation of Synthetic Documents for Performance Evaluation of Symbol Recognition & Spotting Systems. Int. J. Doc. Anal. Recognit. 2010, 13, 187–207. [Google Scholar] [CrossRef]
  65. Chen, K.; Wang, J.; Pang, J.; Cao, Y.; Xiong, Y.; Li, X.; Sun, S.; Feng, W.; Liu, Z.; Xu, J.; et al. MMDetection: Open MMLab Detection Toolbox and Benchmark. arXiv 2019, arXiv:1906.07155. [Google Scholar]
  66. Liu, Y.; Ma, C.; He, Z.; Kuo, C.; Chen, K.; Zhang, P.; Wu, B.; Kira, Z.; Vajda, P. Unbiased Teacher for Semi-Supervised Object Detection. arXiv 2021, arXiv:2102.09480. [Google Scholar]
  67. Chen, B.; Chen, W.; Yang, S.; Xuan, Y.; Song, J.; Xie, D.; Pu, S.; Song, M.; Zhuang, Y. Label Matching Semi-Supervised Object Detection. arXiv 2022, arXiv:2206.06608. [Google Scholar]
  68. Ziran, Z.; Marinai, S. Object Detection in Floor Plan Images. In Proceedings of the Artificial Neural Networks in Pattern Recognition, Siena, Italy, 19–21 September 2018; Pancioni, L., Schwenker, F., Trentin, E., Eds.; Springer International Publishing: Cham, Switzerland, 2018; pp. 383–394. [Google Scholar]
  69. GitHub, I. Open Source Survey. 2019. Available online: https://github.com/dwnsingh/Object-Detection-in-Floor-Plan-Images (accessed on 29 August 2022).
Figure 1. The sample image of the floor-plan dataset containing furniture items. The bottom right corner of the image shows labels of furniture items.
Applsci 12 09398 g001
Figure 2. Compares the performance of ResNet-50 [19] with the ResNet-101 backbone network using Mask R-CNN [17] framework under different label data settings.
Applsci 12 09398 g002
Figure 3. The overview of Mask R-CNN [17] framework with ResNet-101 [19] backbone for floor-plan object detection.
Applsci 12 09398 g003
Figure 4. The complete architecture of the semi-supervised approach. The red arrows show the supervised, and dark blue arrows show unsupervised training. The total loss is the combination of unsupervised and supervised loss.
Applsci 12 09398 g004
Figure 5. Sample image of the floor-plan dataset with different types of augmentation to create variation.
Applsci 12 09398 g005
Figure 6. Class-wise average precision (AP) results of 5 data folds with 10% label data using Mask R-CNN [17] with ResNet-101 [19] backbone.
Applsci 12 09398 g006
Figure 7. Test images where furniture items are detected and labeled using Mask R-CNN [17] with ResNet-101 [19] backbone on 10% label data.
Applsci 12 09398 g007
Figure 8. Test images where furniture items are miss-classified using Mask R-CNN [17] with ResNet-101 [19] backbone on 10% label data.
Applsci 12 09398 g008
Table 1. Different supervised train detectors compared on floor-plan under the semi-supervised setting on Faster R-CNN [25] and Mask R-CNN [17] with ResNet-50 [19] and ResNet-101 backbone.
DetectorBackbone1%5%10%
Faster R-CNNResNet-5098.198.599.2
Faster R-CNNResNet-10198.399.499.6
Mask R-CNNResNet-5098.27 ↓ 8.9498.74 ↓ 1699.5 ↓ 37.5
Mask R-CNNResNet-10198.8 ↓ 29.499.7 ↓ 5099.8 ↓ 50
Table 2. The performance comparison by setting different values of jittered boxes using Mask R-CNN [17] with ResNet-101 [19] backbone on 10% label data.
N j i t t e r mAP[email protected][email protected]
50.9960.9980.997
100.9981.01.0
150.9971.01.0
Table 3. The performance comparison by setting different box regression-variance thresholds to select pseudo-boxes for box regression using Mask R-CNN [17] with ResNet-101 [19] backbone on 10% label data.
ThresholdmAP[email protected][email protected]
0.040.9980.9981.0
0.030.9971.01.0
0.020.9981.01.0
0.010.9921.01.0
Table 4. Previously comared semi-supervised detectors with our approach trained on an average of 5 data folds with 1%, 5%, and 10% SFPI label dataset.
MethodDetector 1 % 5%10%
SupervisedMask R-CNN92.26 ± 0.1692.89 ± 0.1593.16 ± 0.12
STAC [13]Faster R-CNN94.86 ± 0.12 (+2.6)95.43 ± 0.14 (+2.54)97.12 ± 0.15 (+3.96)
Unbiased Teacher [66]Faster R-CNN96.12 ± 0.143 (+3.86)96.87 ± 0.15 (+3.98)97.18 ± 0.12 (+4.02)
Label Match [67]Faster R-CNN98.1 ± 0.12 (+6.01)98.54 ± 0.16 (+5.65)99.1 ± 0.12 (+5.94)
Mask-Aware (Our)Faster R-CNN98.27 ± 0.20 (+6.01)99.74 ± 0.25 (+6.85)99.5 ± 0.15 (+6.43)
Mask-Aware (Our)Mask R-CNN98.8 ± 0.10 (+6.54)99.7 ± 0.15 (+6.81)99.8 ± 0.10 (+6.64)
Table 5. Previously compared supervised detectors with our semi-supervised approach that is trained on the floor-plan dataset using Mask R-CNN [17] and Faster R-CNN [25] with ResNet-101 [19] backbone on 10% label data. *We cannot directly compare the results of Ziran et al. [68] because of the different datasets.
MethodApproach_DatasetDetectormAP
Ziran et al. [68]supervised_d1Faster R-CNN0.31
Ziran et al. [68]supervised_d2Faster R-CNN0.39
Singh et al. [69]supervised_(SESYD+ROBIN)Faster R-CNN0.756
Singh et al. [69]supervised_(SESYD+ROBIN)YOLO0.857
Mishra et al. [20]supervised_SFPICascade Mask R-CNN0.995
Ourssemi-supervised_SFPIFaster R-CNN0.996
Ourssemi-supervised_SFPIMask R-CNN0.998
Publisher’s Note: MDPI stays neutral with regard to jurisdictional claims in published maps and institutional affiliations.

