1. Introduction
To monitor cerebral, tissue, or organ metabolism and hemodynamics simultaneously, we developed a noninvasive super-continuum infrared spectroscopy of cytochrome c oxidase (SCISCCO) system that is applied to attention test studies in pilot human studies and bleeding control experiments in swine animal studies. High brightness from a super-continuum laser (SCL) permits high signal-to-noise ratio measurements of cytochrome c oxidase (CCO), oxygenated hemoglobin (HbO), and deoxygenated hemoglobin (HbR), and the measurements agree with the expectations based on physiological principles. Laboratory measurements of the CCO solutions as well as human response to breath-holding challenges are principled and consistent with previously reported studies. A self-contained, portable, ruggedized, cart-based SCISCCO prototype is assembled and used in swine animal studies with hemorrhage shock followed by treatments using aortic balloons with and without drug supplementation, and the fidelity is verified by comparison with existing laboratory monitors.
For diagnosis and monitoring of conditions such as concussions, stroke, traumatic brain injury, and other medical applications, a noninvasive point-of-care method for monitoring tissue metabolism would offer significant value. MRI-based functional imaging technology can detect changes in blood oxygenation, a correlate of neural activity, and thus may offer diagnosis and prediction of prognosis in cases of concussions and other cerebral traumas. However, MRI often has limited utility due to expense, poor portability, and only imaging one point in time rather than continuous monitoring. Potential relationships between changes in cerebral metabolism and patient outcomes cannot be effectively exploited clinically because we lack a practical, low-cost, noninvasive means to monitor cerebral oxygenation and metabolism in the emergency department, operating room, and other medical facilities.
Much of what we know about human brain function today in health and disease is offered through the lens of tissue oxygenation. Oxygen is necessary for cellular metabolism. Thus, changes in the flow of oxygenated blood to areas of the brain may reflect a change in underlying neural activity. Functional magnetic resonance (fMRI) uses magnetic fields to noninvasively assess the flow of hemoglobin within cerebral blood vessels, also known as the BOLD signal, an established correlate of regional brain activity. Optical methods such as functional near-infrared spectroscopy (fNIRS) measure changes in the oxidation state of hemoglobin by capturing subtle changes in the color properties of red blood cells. The key advantages of optical imaging devices are that they are silent, compact, portable, and do not interfere with other medical devices, which makes them an ideal bedside complement to fMRI and even computerized tomography scans [
1]. Nevertheless, the core limitation of all hemodynamic neuroimaging systems is that they capture changes in blood flow to the brain but not changes in the neural tissue itself. This limitation is of particular importance in the presence of illness or injury, when brain tissue dysfunction may occur without alterations in the regional hemodynamics. As such, there has been particular interest in measuring the optically active markers of cellular function, such as cytochromes.
Another area of medical importance is bleeding control, as severe bleeding associated with injuries can lead to death or significant morbidity. Bleeding, especially non-compressible internal bleeding, is a major cause of preventable trauma-related deaths in both military and civilian settings. Most of these fatalities occur within the first hour (“golden hour”), and there is a critical need for therapies that can stabilize the patient long enough to transfer them to higher echelons of care for definitive repair of injuries. For external sources of blood loss, advanced hemostatic dressings and tourniquets can be used to control the bleeding, but no such tools are available for the control of internal hemorrhage.
As an example, one area where the medical profession has failed to alter the mortality rate remains in the period immediately following injury, including the pre-hospital phase. The majority of these deaths are due to hemorrhagic shock (HS) or traumatic brain injury (TBI) [
2,
3,
4,
5]. Of these two conditions, bleeding is more apparent and treatable, which makes it the number one cause of preventable deaths. Despite numerous advances in trauma care, a recent multi-national trial of more than 20,000 patients [
6] demonstrated that the majority of deaths occur within a few hours after injury, with less than 2.5 percent of the injured succumbing to multiple organ failure in a delayed fashion.
To control internal hemorrhage, resuscitative endovascular balloon occlusion of the aorta (REBOA), which may control internal bleeding by stopping the blood flow below of the inflated balloon, has recently gained prominence as a technique for controlling non-compressible torso hemorrhage [
7,
8,
9]. Even though the use of REBOA may lead to early survival advantages for HS, concerns have been raised regarding the risk of end-organ ischemia (and a reperfusion injury following balloon deflation) with the application of complete REBOA [
10]. Partial REBOA might be an alternative, but to adjust the degree of occlusion, instrumentation is needed to verify the downstream tissue and organ condition.
Another promising approach to controlling bleeding is to administer drugs concurrently (with REBOA inflation), and this approach has been shown to decrease ischemic injury and preserve organ function. Valproic acid (VPA) is one such drug that has been shown to sustain life despite massive blood loss and that has been in clinical use for over 50 years. When given in an appropriate dose, VPA quickly upregulates numerous cyto-protective pathways [
11] and improves survival in models of ischemia-reperfusion [
12,
13], lethal hemorrhage, TBI with hemorrhage, and polytrauma [
14,
15,
16,
17]. VPA is safe, shelf-stable, and easy to administer, and its co-administration with REBOA may attenuate the adverse consequences of aortic occlusion. However, to understand how to use partial REBOA effectively, adding VPA also optimally requires the ability to monitor the brain, tissue, and organ metabolic states as well as the hemodynamic response.
1.1. Near-Infrared Spectroscopy (NIRS)
More than 30 years of extensive research has been invested into methods of measuring brain tissue oxygenation using noninvasive spectroscopy. The optical characteristics of oxygenated and deoxygenated hemoglobin that make pulse oximetry possible were first used to monitor cerebral tissue perfusion and oxygenation in 1977 with the development of near-infrared spectroscopy (NIRS) [
18]. There has since been increasing interest in applying the technique to noninvasively detect brain tissue at risk for secondary injury.
NIRS emits and detects reflected wavelengths between 700 and 1000 nm, a range in which the absorption by water molecules is low enough to allow signal transmission through tissues. Moreover, since melanin, which is responsible for skin color, has minimal absorption above 700 nm, NIRS signals should also be substantially independent of skin color (although there is recent controversy over the influence of skin color on oximetry measurements [
19]). The oxidation state (or redox state) of optically active biological molecules can then be detected and their relative concentrations measured. In neuro-critical care, the concentrations of chromophores such as HbO and HbR within the target brain tissue are the most commonly measured biological molecules. This technique is used to detect cerebral hypoxia and malperfusion and has been able to identify patients with increasing intracranial pressure. The measurements [
20] obtained trend with invasively monitored brain tissue oxygen tension, sparing the need for probes placed directly into the brain tissue. HbO and HbR spectral signals have even been coupled with blood pressure signals to provide a continuously updating measure of cerebrovascular reactivity in traumatic brain injury. Spectroscopically derived cerebrovascular reactivity indices demonstrated reasonable agreement with other surrogates of patient autoregulatory status and can identify patients with an increased risk of mortality or a poor functional outcome.
While NIRS is a promising technique, multiple challenges limit its clinical adoption. Signal contamination by injured extracranial tissue and intracranial hematomas limit tissue penetration and the reliability of the signal obtained. Patient temperature, movement, and ambient light also interfere with reliable readings, lending to concerns about its accuracy. Finally, tissue oxygenation is still only a surrogate measure of neuronal function. Interpretation of this data is unclear, as decreased oxygen utilization may either reflect cellular dysfunction or decreased oxygen demand (as occurs in deep sedation).
To determine if changes in brain tissue oxygen tension are indicative of cellular dysfunction, cellular metabolism should also be measured. Shock-induced derangements in cellular metabolism may appear earlier than systemic changes in the laboratory or hemodynamic parameters and may be evident prior to changes in diagnostic imaging. While structural damage to neurons may be visible in imaging, functional damage is not. Early detection of brain cell metabolic dysfunction could alert providers to the progression of secondary brain injury and detect a time-sensitive window for treatment.
As an example of other applications, NIRS has been used in clinical settings to detect cerebral and distal limb ischemia, and different clinical interventions can be established based on the NIRS data [
21]. In addition, vascular occlusion tests have demonstrated that NIRS can be used for noninvasive detection of tissue ischemia [
22,
23]. Moreover, NIRS has been applied to other organs such as the kidney [
24], and the kidney was shown to have a different response from the cerebral measurements. However, most of the NIRS studies used a few wavelengths of light and only measured the hemodynamic response. The broadband SCISCCO with the simultaneous measurement of HbO and HbR as well as CCO could provide much more information on tissue viability, as illustrated in this paper.
A promising light-sensitive marker of cellular metabolism is CCO. As the terminal enzyme in the electron transport chain during mitochondrial adenosine triphosphate (ATP) production, changes in CCO oxidation states can indicate whether or not mitochondria are able to compensate for changes in oxygen delivery at the cellular level [
25]. Such changes have been validated against other measures of cellular metabolism, including functional magnetic resonance spectroscopy and invasive cerebral microdialysis [
26]. Furthermore, changes in the spectral signal of CCO are more specific to brain [
27] tissue and less susceptible to interference from extra cranial tissue injury or intracranial hematoma than the measures of HbO and HbR alone. In other experiments, CCO has also been used to assess acute carbon monoxide poisoning, since carbon monoxide binds to CCO and causes mitochondrial dysfunction [
28]. Simultaneous measurement of tissue oxygenation with HbO and HbR and metabolic function with CCO will provide greater insights into the hemodynamic events that precede brain injury and could become valuable for guiding therapeutic interventions.
The challenge with measuring CCO is that accurately resolving changes in its redox state requires a high-brightness broadband laser covering a wide part of the near-infrared wavelength band. Additionally, a high signal-to-noise ratio is needed because the spectral signal of CCO is less than 10% of that for hemoglobin, hiding changes in CCO concentration within the noise of background signal variation. The upside of developing and using the appropriate light source is that by capturing changes in CCO, we can directly measure neural or tissue metabolism to aid in the diagnosis and management of neurological or organ injury or illness.
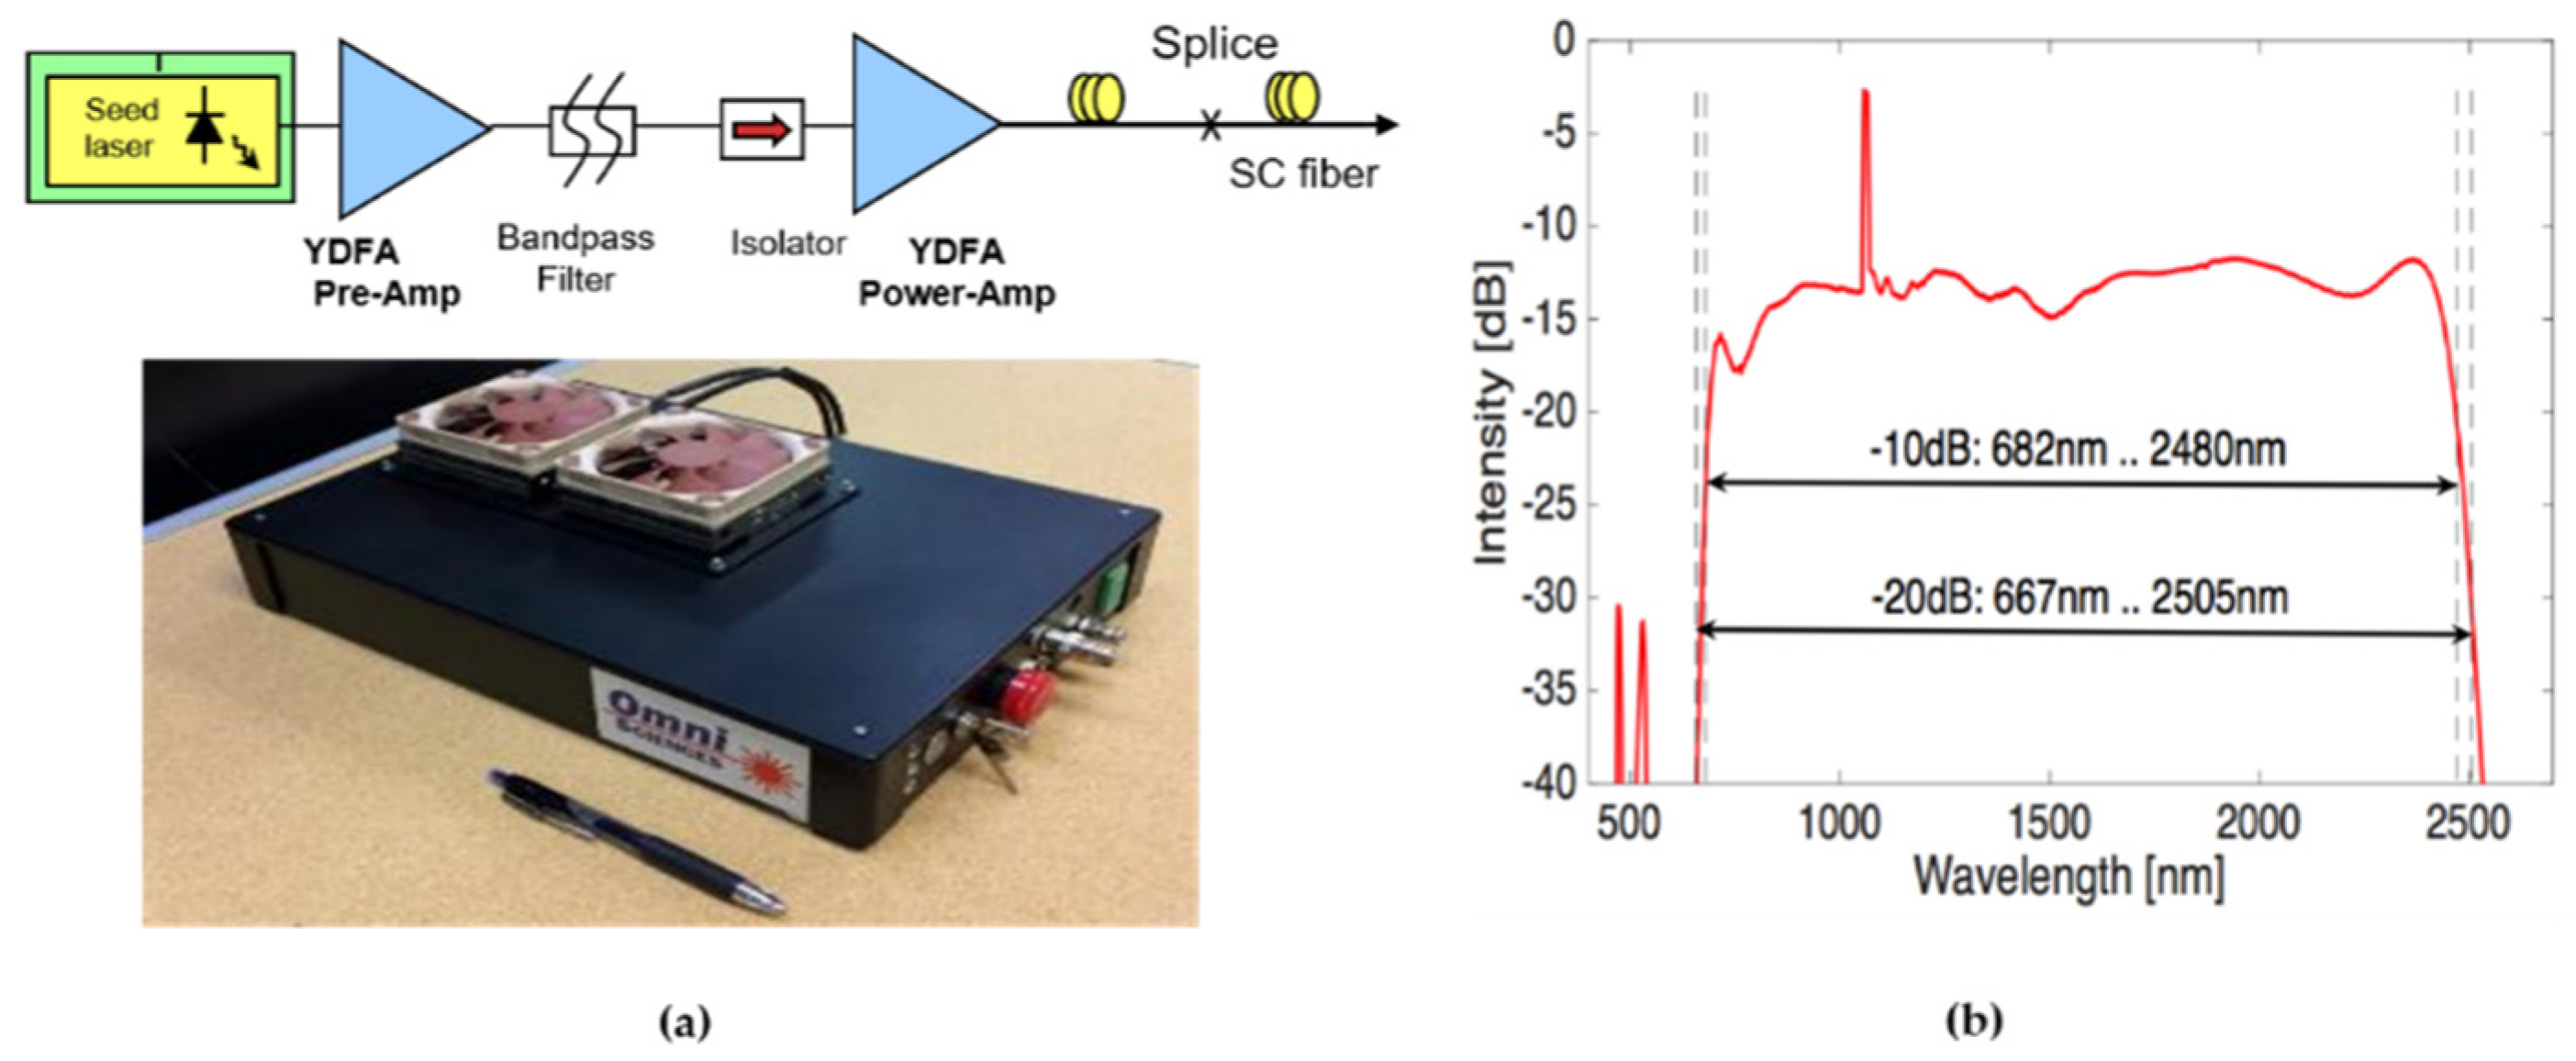
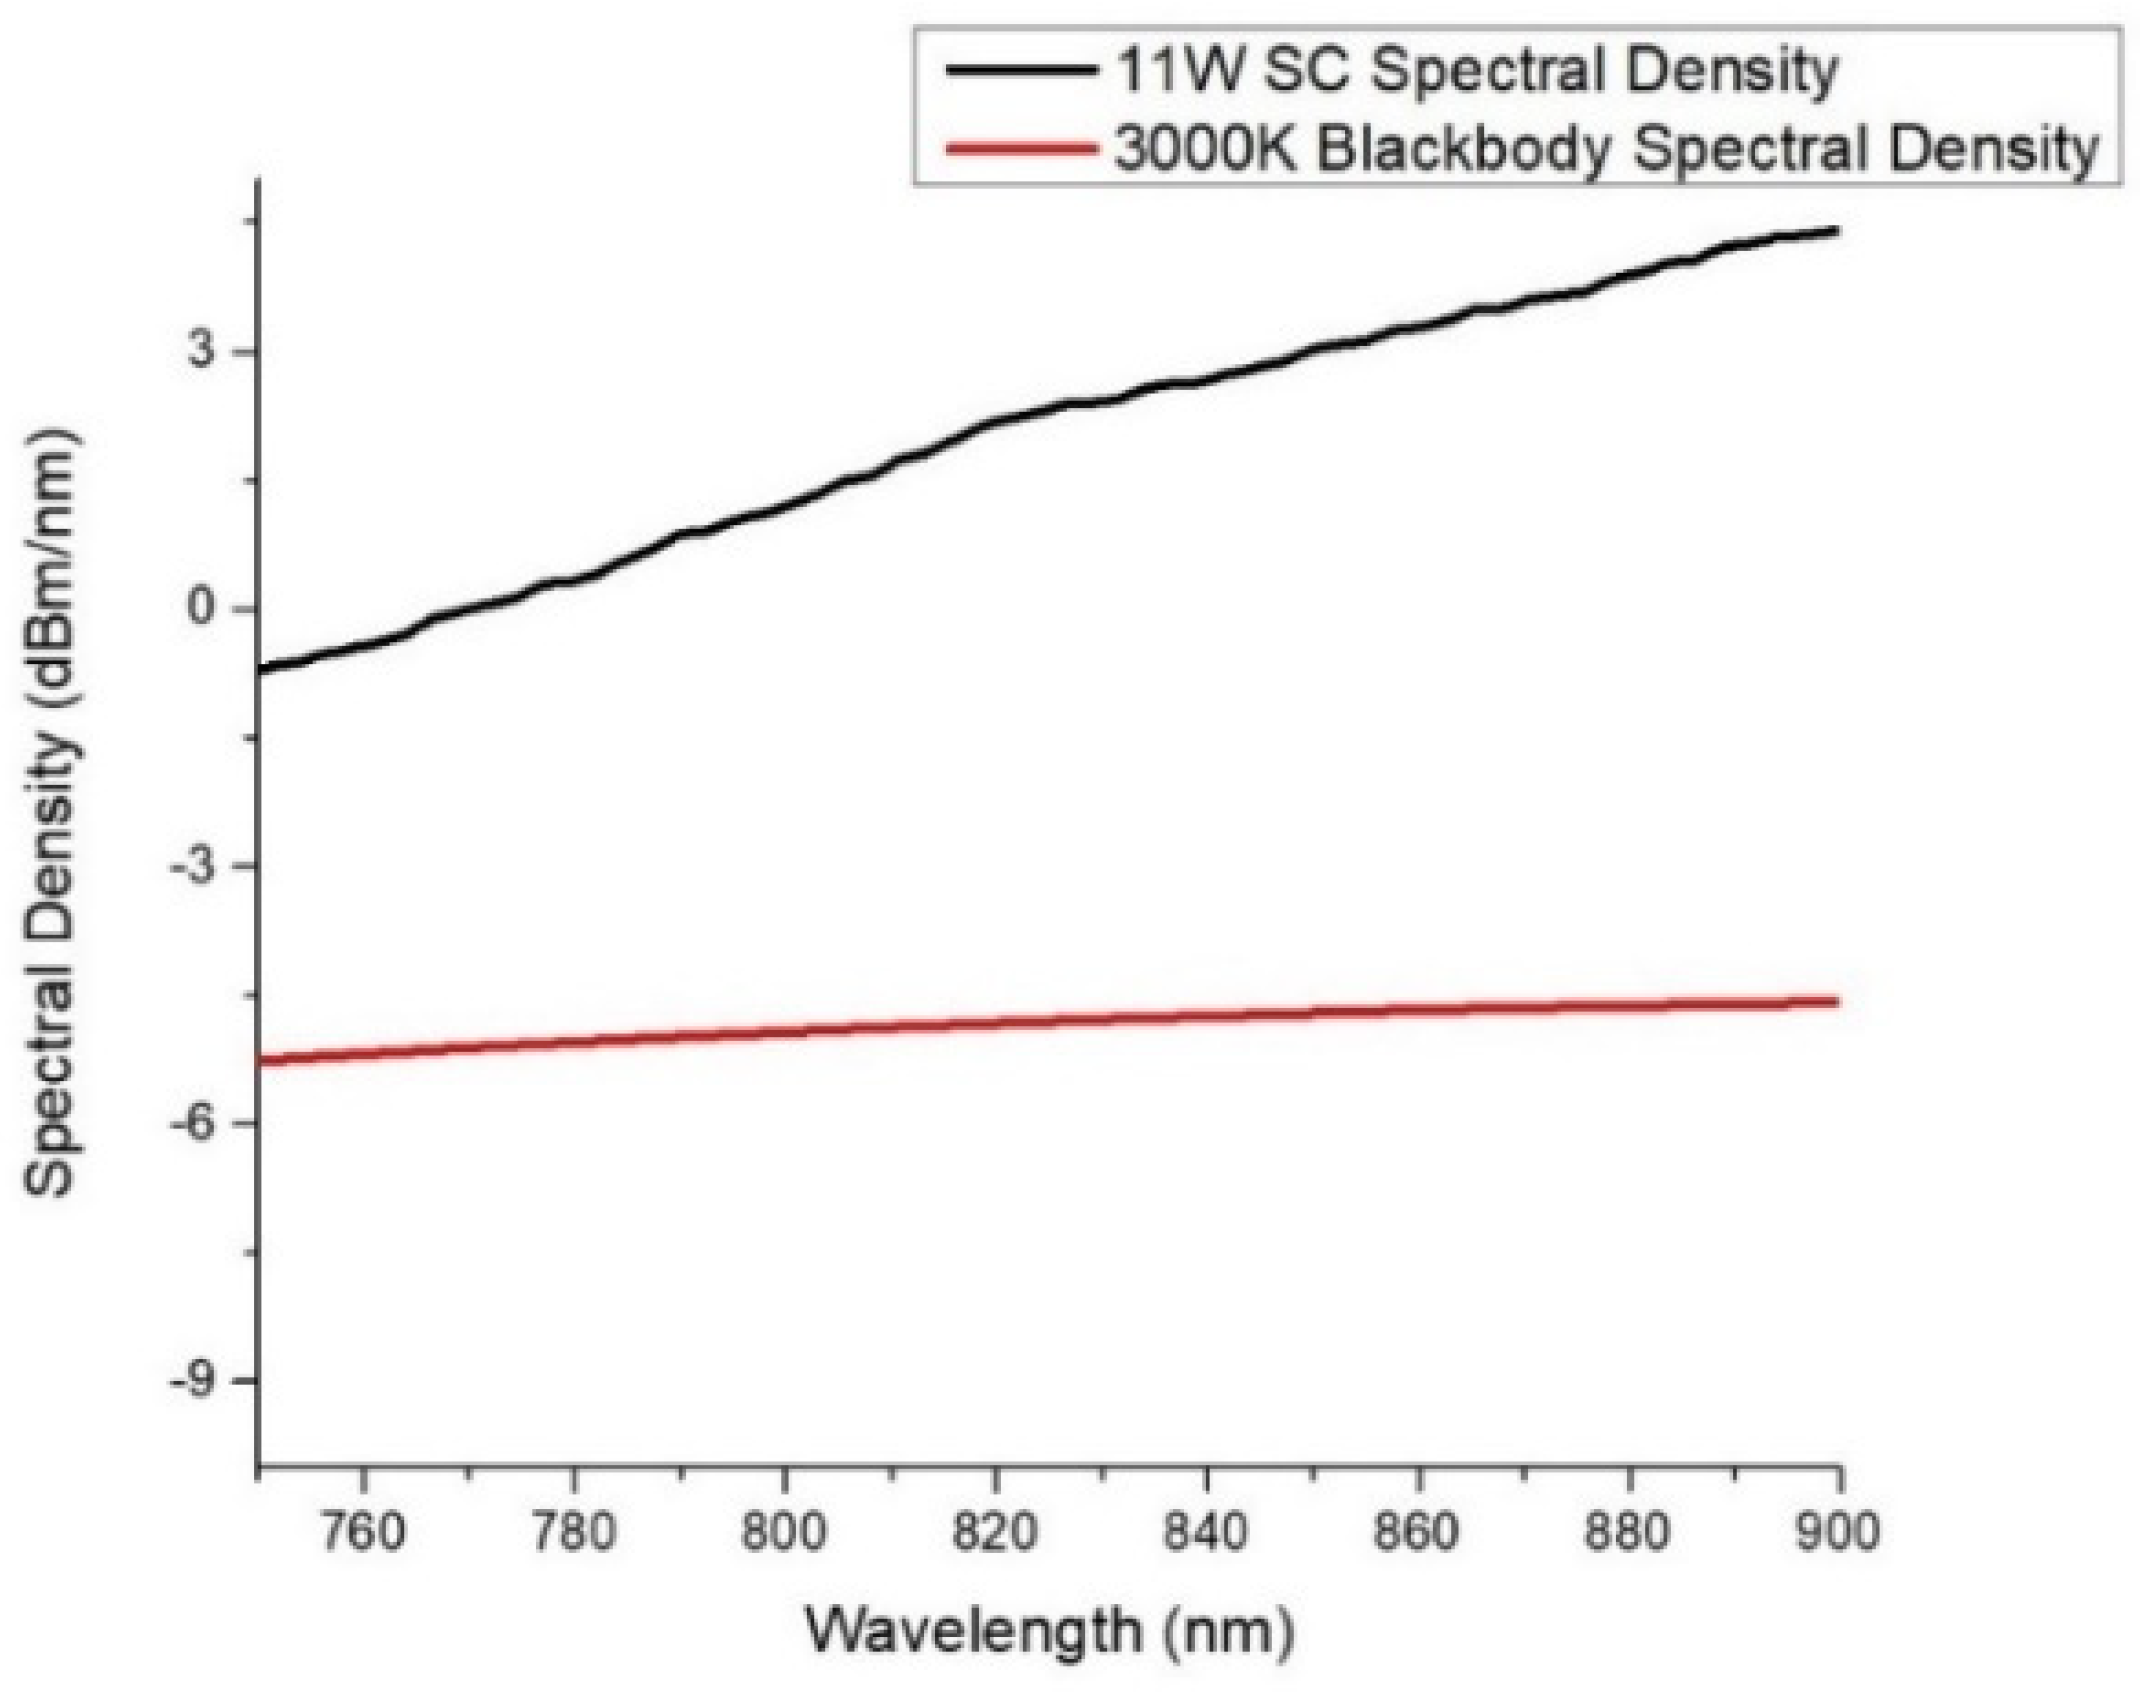
In this paper, we offer a noninvasive optical imaging approach to capturing CCO in the brain and other tissues or organs using the SCISCCO system, which uses an all-fiber integrated super-continuum light source. The 11-W SCL source generates an output spectrum that extends from 670 nm to 2500 nm, more than encompassing the wavelength range needed to detect CCO, HbO, and HbR. When compared with existing NIRS-based devices that employ a lamp source coupled into a fiber bundle, our SCL provides an almost order of magnitude higher brightness [
29]. Moreover, the SCL’s pulsed light source and the detection system can be synchronized to further improve the signal-to-noise ratio by almost two orders of magnitude. These features uniquely allow us to obtain the tissue penetration, signal strength, and resolution necessary to provide continuous monitoring of cerebral or tissue oxygenation and metabolism.
Beyond assessing brain metabolism, other organs and tissue can also benefit from simultaneous monitoring of metabolic and hemodynamic responses. One example explored in this paper is hemorrhagic shock and treatment methodologies using pilot animal in vivo studies. In particular, the SCISSCO system is applied to swine animal models undergoing induction of HS followed by different treatment modalities, such as partial REBOA (pREBOA) and VPA pharmaceuticals. The optimization of the application of these different treatments can benefit from understanding the viability of the tissue and organs in the injured sections. Thus, the SCISCCO system may be a clinically useful tool for monitoring brain and organ metabolism which could be utilized to diagnose concussions, monitor cerebral metabolism in traumatic brain injury patients, or in an operating or emergency room to gauge at-risk organs’ responses to treatments.
1.2. Cytochrome C Oxidase
CCO is a photo-sensitive enzyme that reacts with oxygen in the last step of the mitochondrial electron transport chain. In the electron transport chain, protons are moved across the mitochondrial inner membrane to produce ATP, the energy source used for cells to live and function. CCO exists in two states: oxidized CCO and reduced CCO. The sum of these two CCO states is a constant. The ratio of oxidized CCO to reduced CCO is termed the redox state and can be detected by its spectroscopic signal. (Note that when we refer to “CCO measurement”, we mean that we are measuring the changes in the redox state of CCO.) Increased cellular activity uses more energy in the form of ATP. This increase in ATP utilization results in the conversion of oxidized CCO to reduced CCO, which equates to a reduction in the redox state of CCO and a decrease in the spectroscopic signal. It follows that a reduction in ATP synthesis, such as that which occurs when the substrates for ATP generation (oxygen and blood flow) are reduced from ischemic or hypoxic insults induced by illness or injury, would be reflected by changes in the CCO redox state.
CCO is responsible for more than 95% of oxygen metabolism in the body and is essential for the efficient generation of ATP [
30]. Thus, measuring CCO adds key precision in the understanding of brain and organ cellular function [
31]. Simultaneous measurements of CCO and the hemoglobin redox states can provide complimentary information on the brain’s or organ’s metabolism and hemodynamics, which can improve the diagnosis and management of illness or injury. CCO concentration is also significantly higher in the brain than in extracerebral tissues. As such, there is minimal spectral interference from the scalp and skull when brain tissue is assessed noninvasively [
32]. Therefore, noninvasive spectroscopic assessment of CCO and the hemoglobin redox states has the potential to significantly enhance many areas of clinical practice.
Despite the attractiveness of CCO as a metabolic marker, measuring CCO is difficult for a number of reasons. First, the in vivo concentration of CCO is between 5% and 10% that of hemoglobin. Because CCO and hemoglobin have overlapping spectra, there can be significant cross-talk between CCO changes and the hemodynamic response. Second, CCO is an enzyme with four redox centers, one of which—copper A—has a broad absorption peak in the NIR spectrum between 700 and 900 nm that changes depending on its redox state. The relatively broad, featureless spectrum for the redox state of CCO makes it more difficult to distinguish from other interfering spectra. Thus, a high-brightness NIR light source can be a key enabling technology that permits the measurement of CCO in humans and animals and distinguishing the CCO from the hemodynamic response, skin interference, and motion artifacts. The SCL used in the experiments described in this paper provides the high brightness required for measuring CCO with an enhanced signal-to-noise ratio.
1.3. Super-Continuum Infrared Spectroscopy
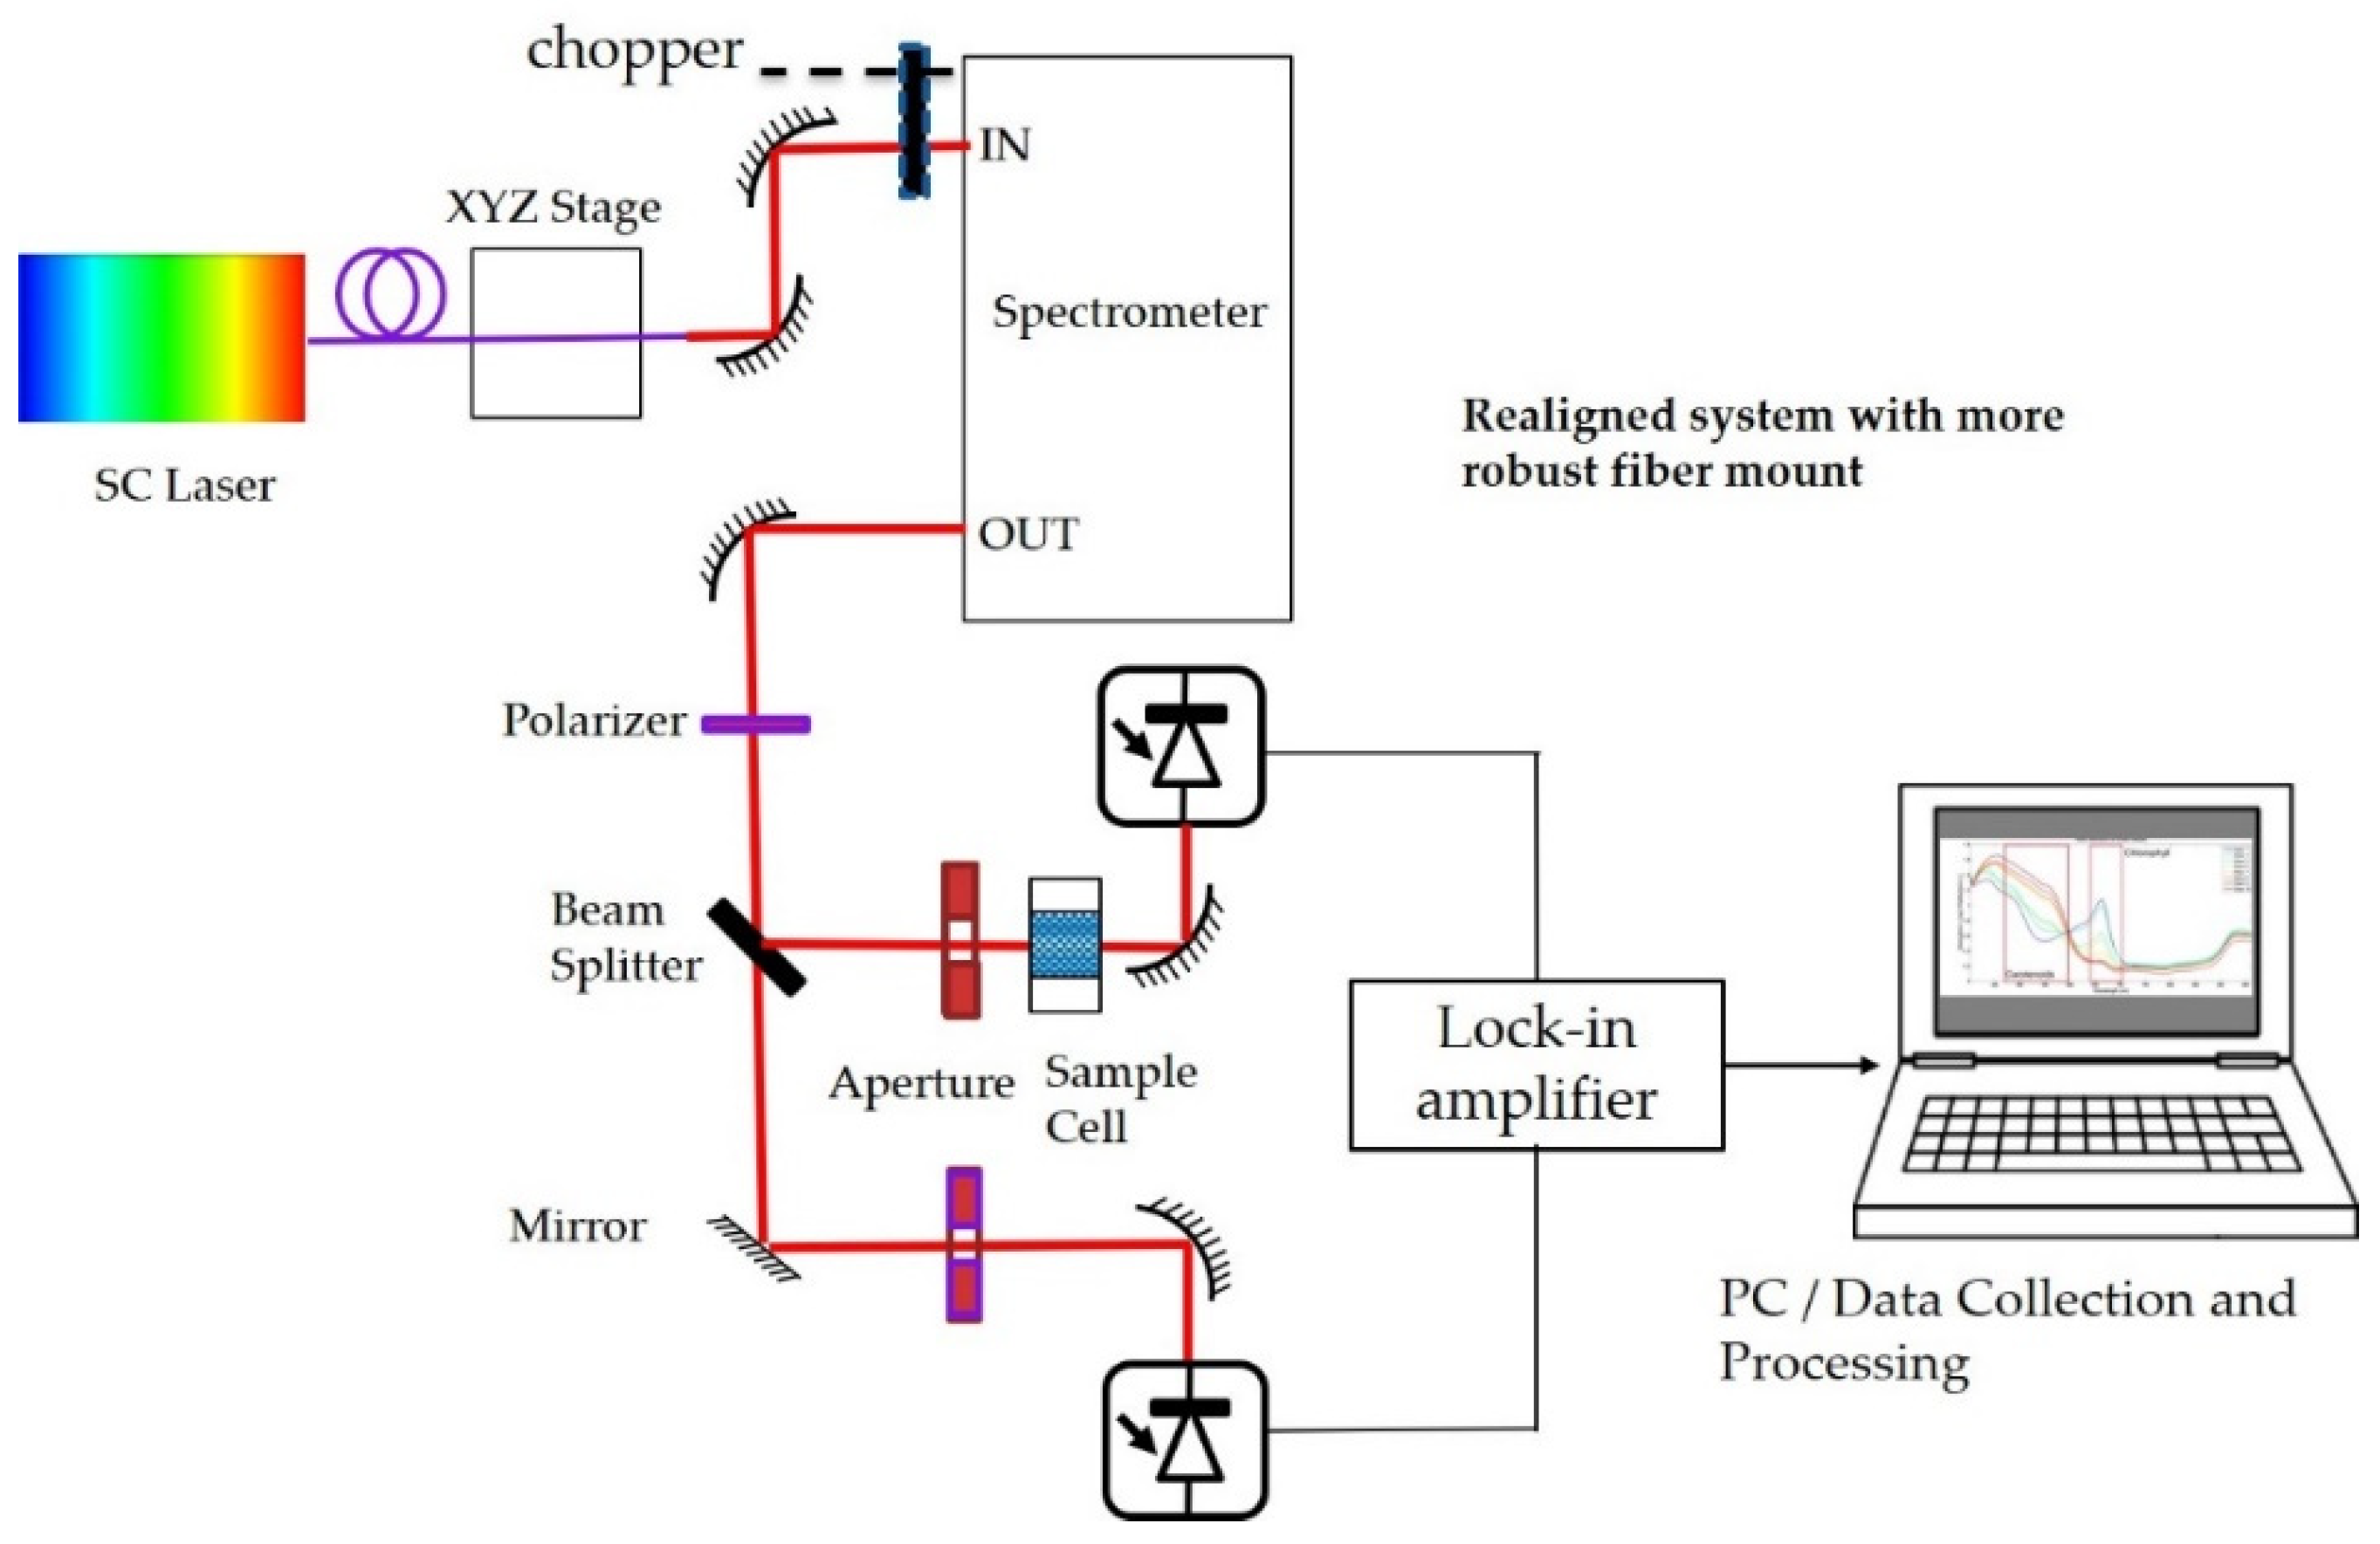
To noninvasively interrogate the redox state of the CCO enzyme as well as blood oxygenation, we developed a SCISCCO system that uses an all-fiber integrated super-continuum light source. Our novel SCL can provide almost an order of magnitude improvement in brightness compared with the tungsten-halogen lamps typically employed for CCO measurements. The signal-to-noise ratio (SNR) for the measurements using the SCL is not only enhanced by the increase in NIR light brightness, but it can be further enhanced because the SCL is pulsed, and the detection system can be synchronized to the SCL (improvements we plan on adding in the near future). For example, the SNR may further obtain improvement of ~30 times which arises from time-gated detection of the pulsed SCL light, and change detection (i.e., subtracting SCL on from SCL off) further improves the SNR by subtracting the background light. The high-brightness fiber delivery of our SCL NIR light will permit clinical applications through deeper brain penetration and a higher SNR, which will help to distinguish the CCO signal from clutter or interference from hemoglobin and other chemicals in the brain or organs, as well as scattered light from the scalp, skull, or environment. The diagnostic instrument prototype integrates the SCL with a two-arm differential set-up and receivers, and laboratory tests quantify the sensitivity and selectivity of CCO measurements.
Following the introduction, the remainder of the paper is organized as follows.
Section 2 describes the set-up and results for the laboratory measurements of CCO, particularly the optical spectra for CCO. Then, in
Section 3, the modification of the set-up for human testing is explained. Three sets of human tests are conducted. In
Section 3.1, the experimental results for the blood pressure test are presented, showing that we obtain similar results to those in published literature on CCO. In
Section 3.2, the breath-holding tests are described, confirming that our measurements for hemoglobin correlate with the measurements when using an fNIRS commercial system. Then, in
Section 3.3, attention tests are conducted on 25 healthy human participants, which is the key pilot human study reported in this paper.
Section 4 provides a detailed analysis of the results from the healthy human attention tests, and a hypothesis is derived from the experiments. A discussion in
Section 4 also explains the basis of the hypothesis that the redox state of CCO decreases during the attention test periods. Then, a comparison is made between our results and those reported in the literature. Although other reports in the literature were unable to draw a conclusion on the change in CCO during attention test procedures, our results appear to have a higher SNR and are more definitive in showing that the redox state of CCO decreases during the attention test period, which is qualitatively consistent with the reported behavior of CCO in mitochondria.
Having shown the efficacy of the laboratory-based SCISCCO system,
Section 5 describes a cart-based SCISCCO prototype, which is a stand-alone unit that includes the SCL, optical system, electronics, and processing computer. The hardware and software are integrated so the cart-based prototype can be used in laboratory or hospital settings as well as transported to remote locations, such as from the University of Michigan in Ann Arbor to the Northwestern University medical campus in Chicago. To validate the instrument’s measurements, and to show that it can be used in the context of existing protocols,
Section 6 describes the cart-based SCISCCO prototype being applied to swine animal models undergoing induction of hemorrhagic shock followed by different treatment modalities, including pREBOA and VPA. The data verify that the measured HbO and HbR concentration changes across different clinical phases are consistent with the expectations based on physiological principles.
3. Results
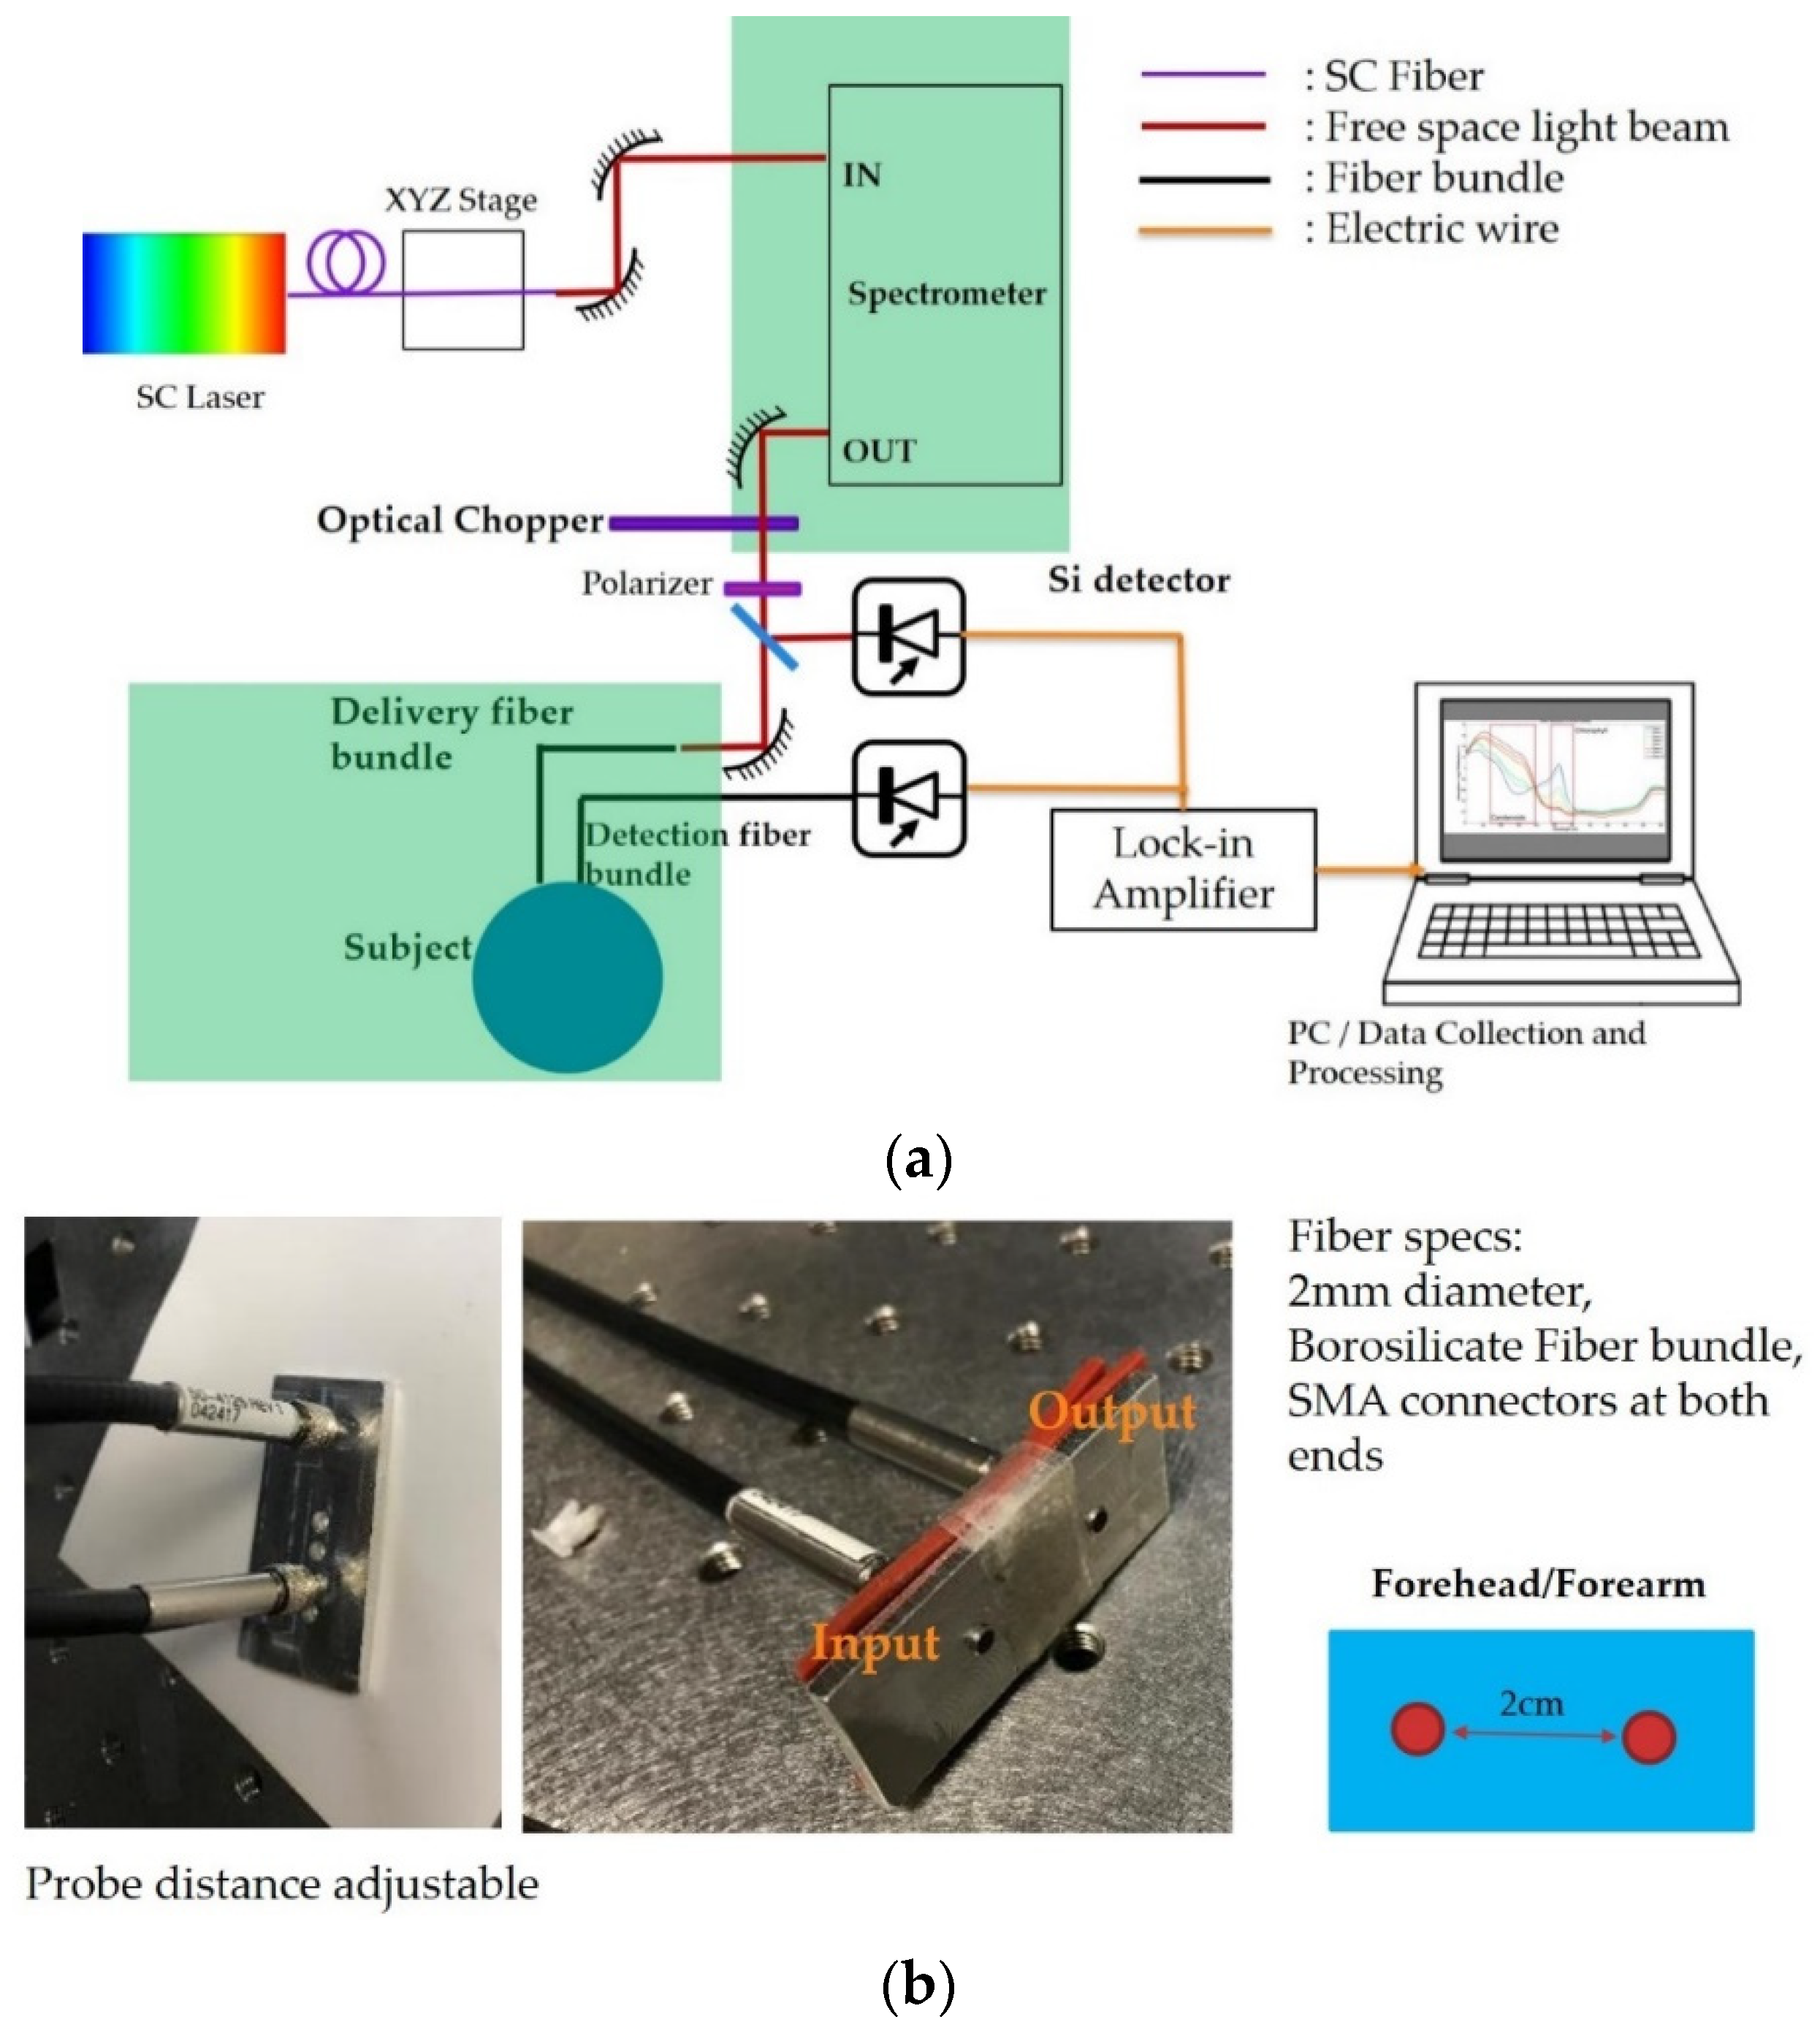
The configuration of the SCISCCO for use with human participants is illustrated in
Figure 5a where, similar to the set-up in
Figure 1, the NIR and SWIR SC light source was followed by a tunable spectrometer, optical chopper, and polarizer. Unlike the previous lab set-up, a beam splitter with a 99:1 ratio was used to split the beam into a sample and reference arm (i.e., much less power delivered to the reference arm beam). The reference arm was sent to one silicon detector, and this was used to divide out the laser fluctuations. The sample arm beam was coupled into a fiber-based probe for the delivery of light to and collection of light from the human participant. The outputs from the two silicon detectors in the sample and reference arms were sent to a lock-in amplifier synchronized to the optical chopper. The output from the lock-in amplifier was sent to a computer for data collection and analysis.
Figure 5b provides more details on the SC fiber probe for placement on the human participant for the blood pressure tests (
Section 3.1) and the breath-holding tests (
Section 3.2). As will be described in
Section 3.3, this probe was slightly modified for use in the attention test. The fibers used for delivery and pick-up were a 2-mm diameter borosilicate fiber bundle with SMA connectors on both ends. The two fibers were mounted on a solid base. Although the distance between the probes was adjustable, the experiments were conducted with a spacing of 2 cm between the delivery and pick-up fibers. For a “banana pattern” optical penetration pattern, this would mean that signals are measured from a ~2-cm penetration into the sample or skin (perhaps less with intervening bones). This probe was used on the forearm for the blood pressure test and on the forehead for the breath-holding test.
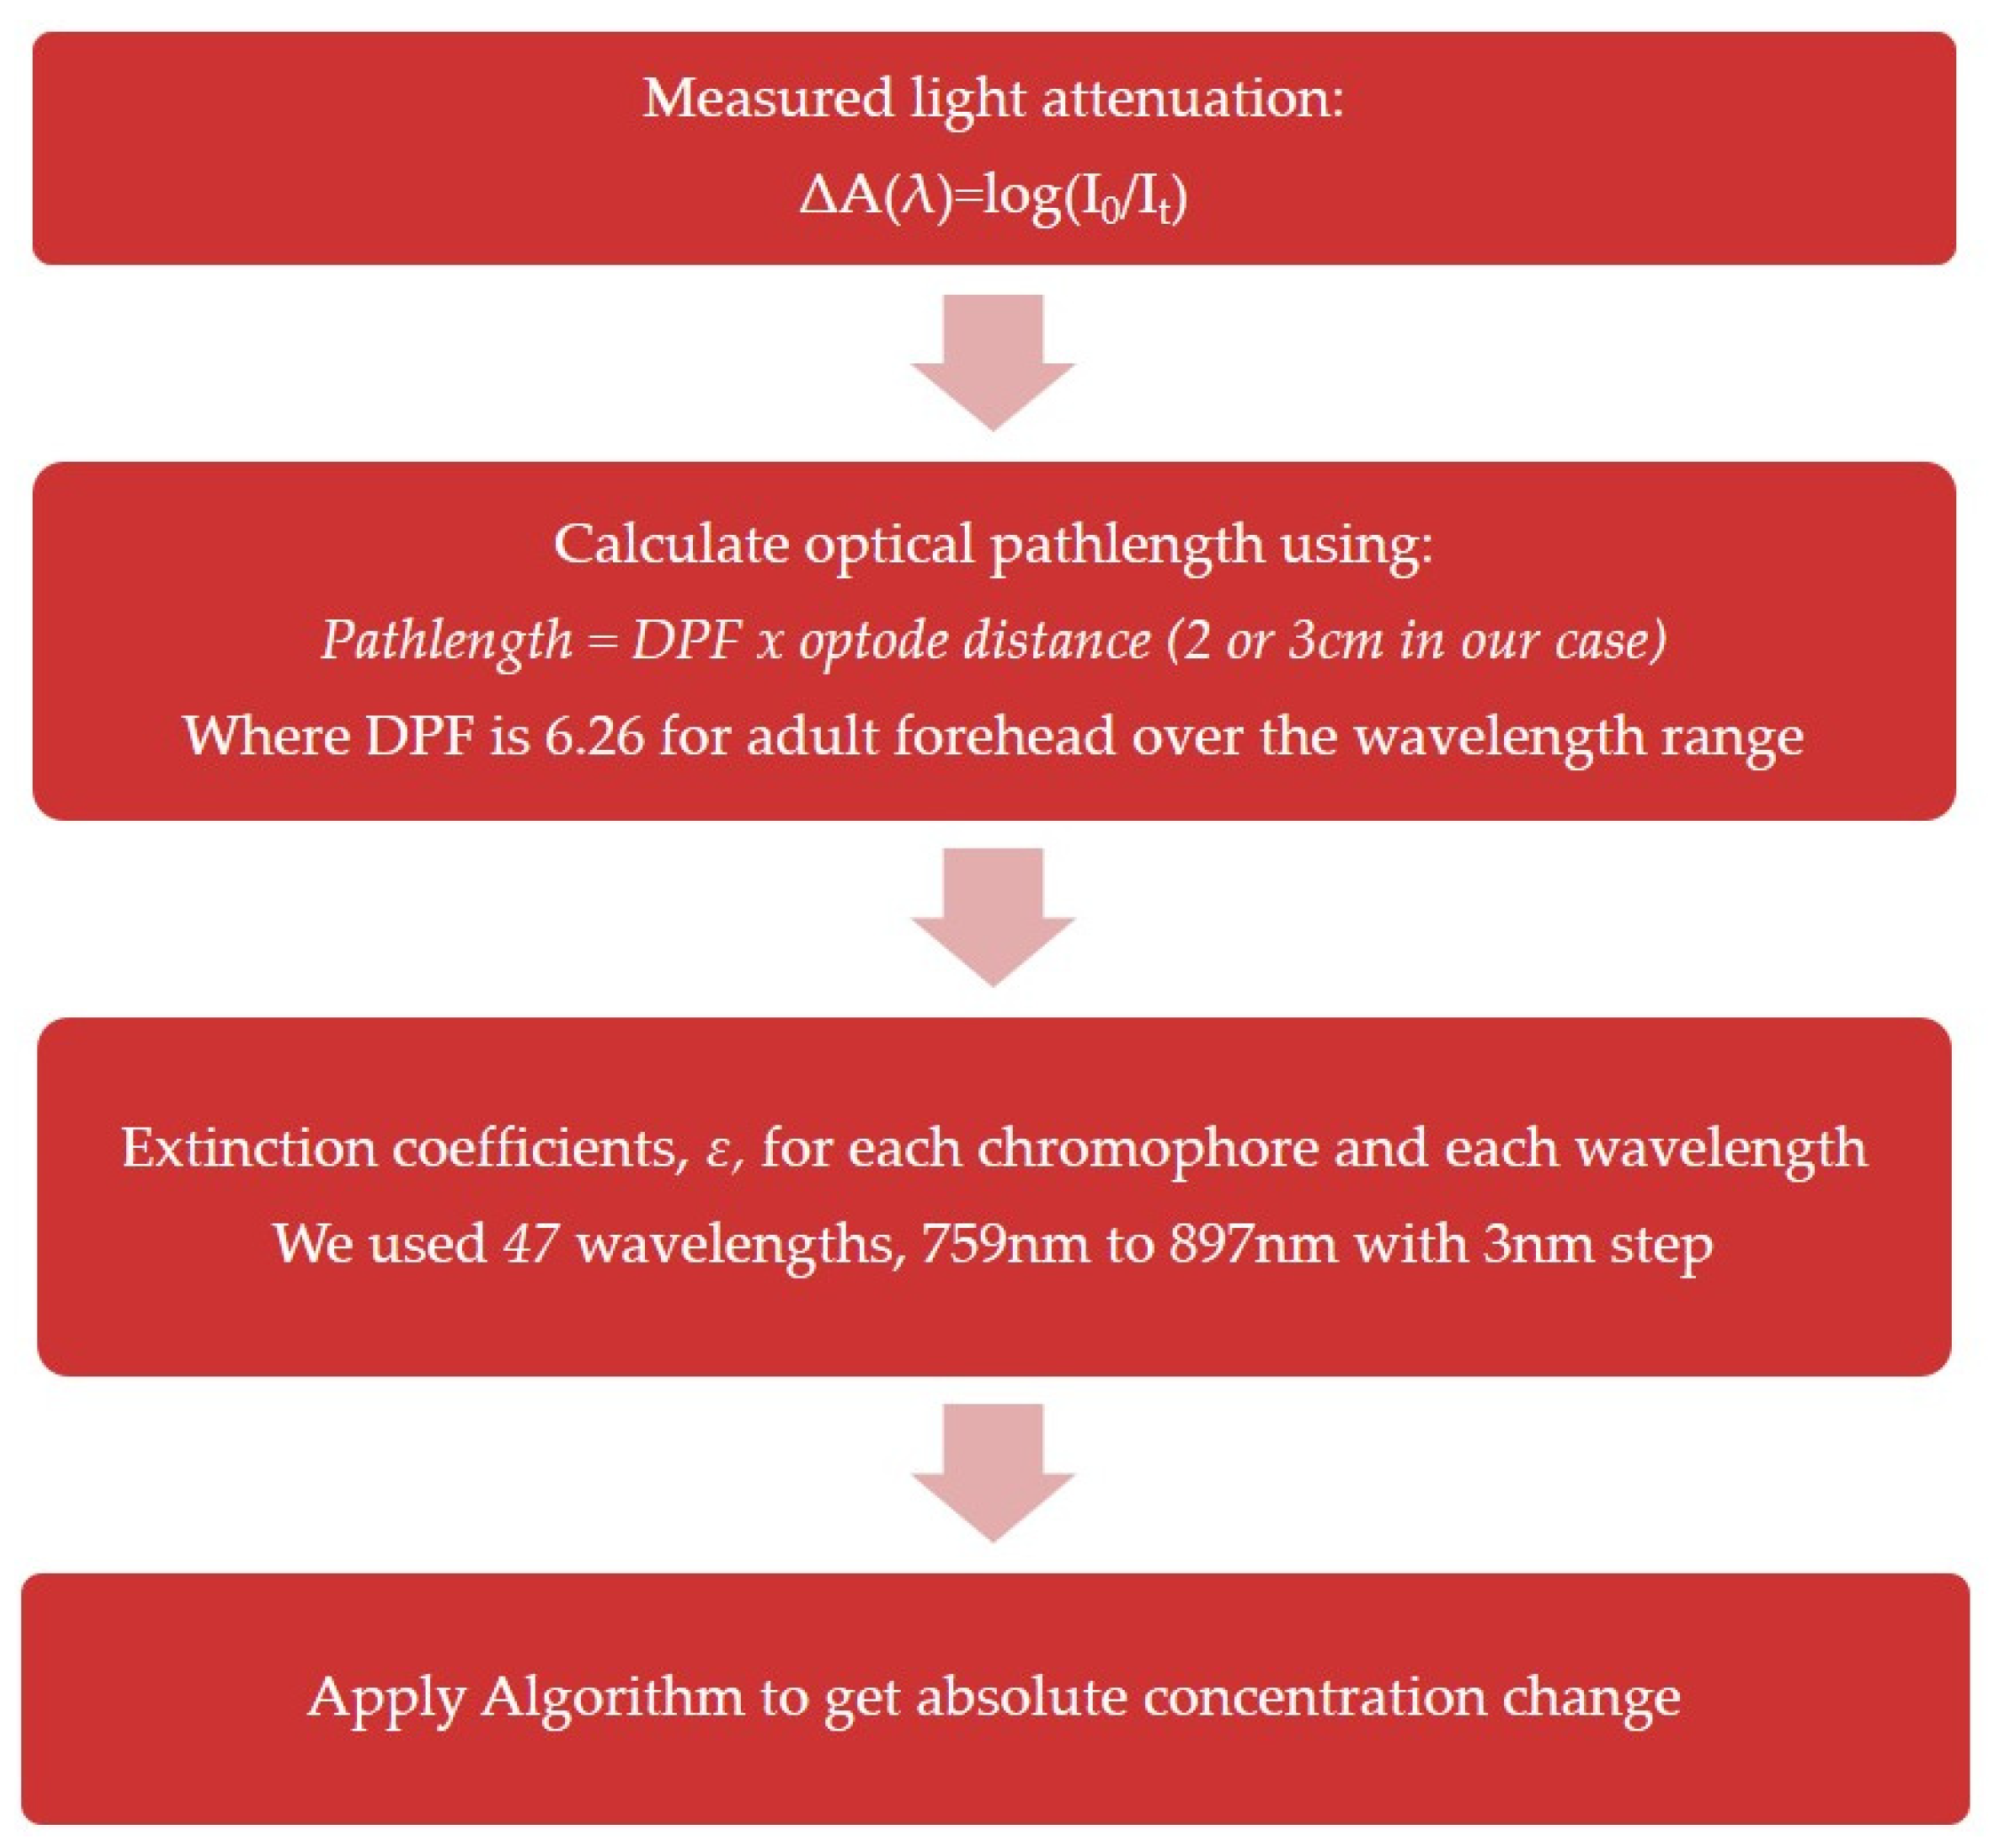
3.1. Algorithm for Processing the Measured Spectra
The measured wavelength-dependent optical intensity change was translated into the chromophore concentration change using a modified Beer–Lambert law-based algorithm first described by Matcher et al. [
37]. A block diagram or flow chart illustrating the algorithm is included in
Figure 6, and further details on the algorithm are provided in
Appendix A.
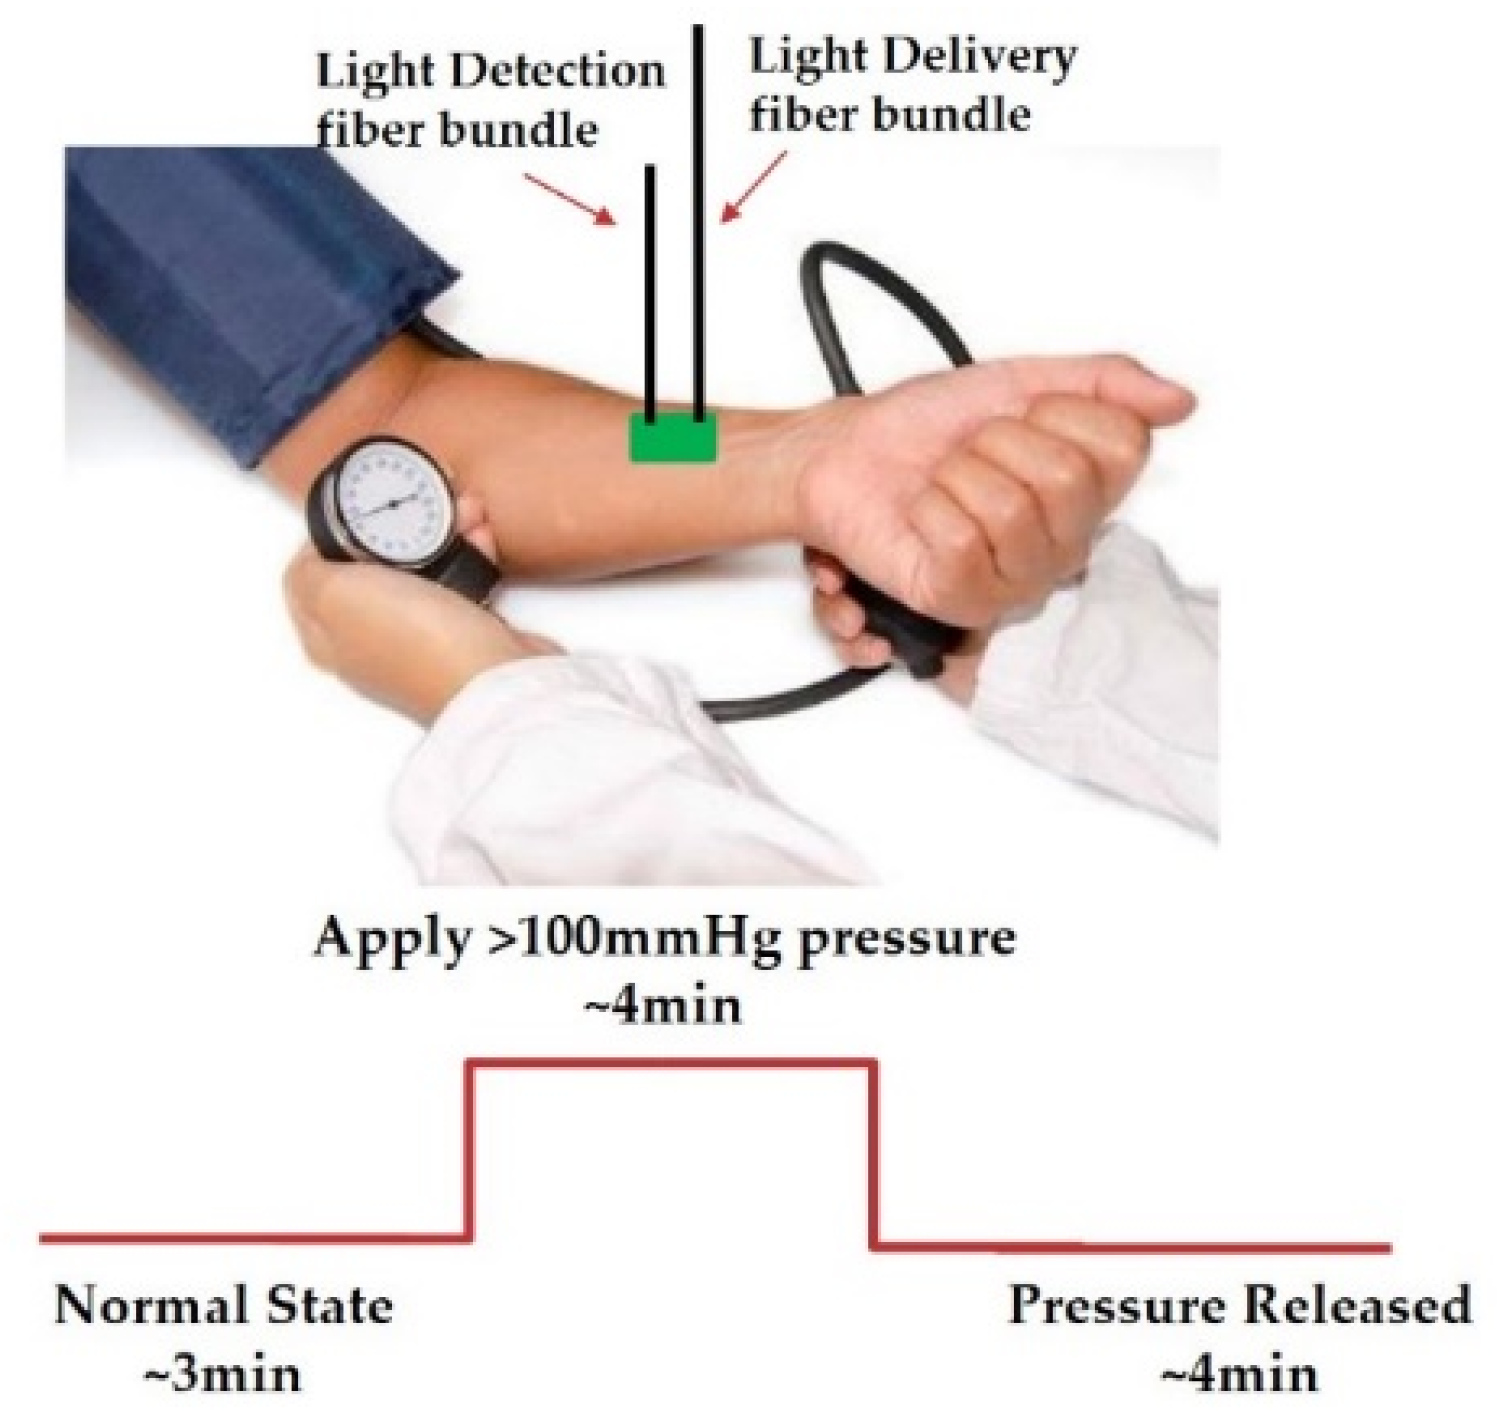
3.2. Blood Pressure Testing Using SCISCCO on Forearm
The authors of [
39] reported using an SC system for CCO measurements in a blood pressure test, where the SC source was a commercial SC source based on mode-locked lasers. Consequently, as a first step toward validating our system, we wanted to confirm that our new SCISCCO system obtained comparable results to those reported in the literature. The approximate set-up and protocol for the blood pressure test are illustrated in
Figure 7. A blood pressure cuff was wrapped on the upper arm, and then the probe from
Figure 5b and the SCISCCO system from
Figure 5a were applied to the forearm on the same side. The test protocol was that the healthy human participant was in a normal state (deflated cuff) for about 3 min, and then the cuff was inflated to above 100 mmHg of pressure for 4 min, after which the pressure was released for about 4 min. The spectrum of the diffusely reflected light was measured continuously through the test, with each complete spectrum measurement requiring about 30 s due to the speed of the mechanical rotation of the grating in the spectrometer in
Figure 5a. (Note that in the attention test reported later in this paper, we optimized the data collection to reduce the scan time to ~17 s.)
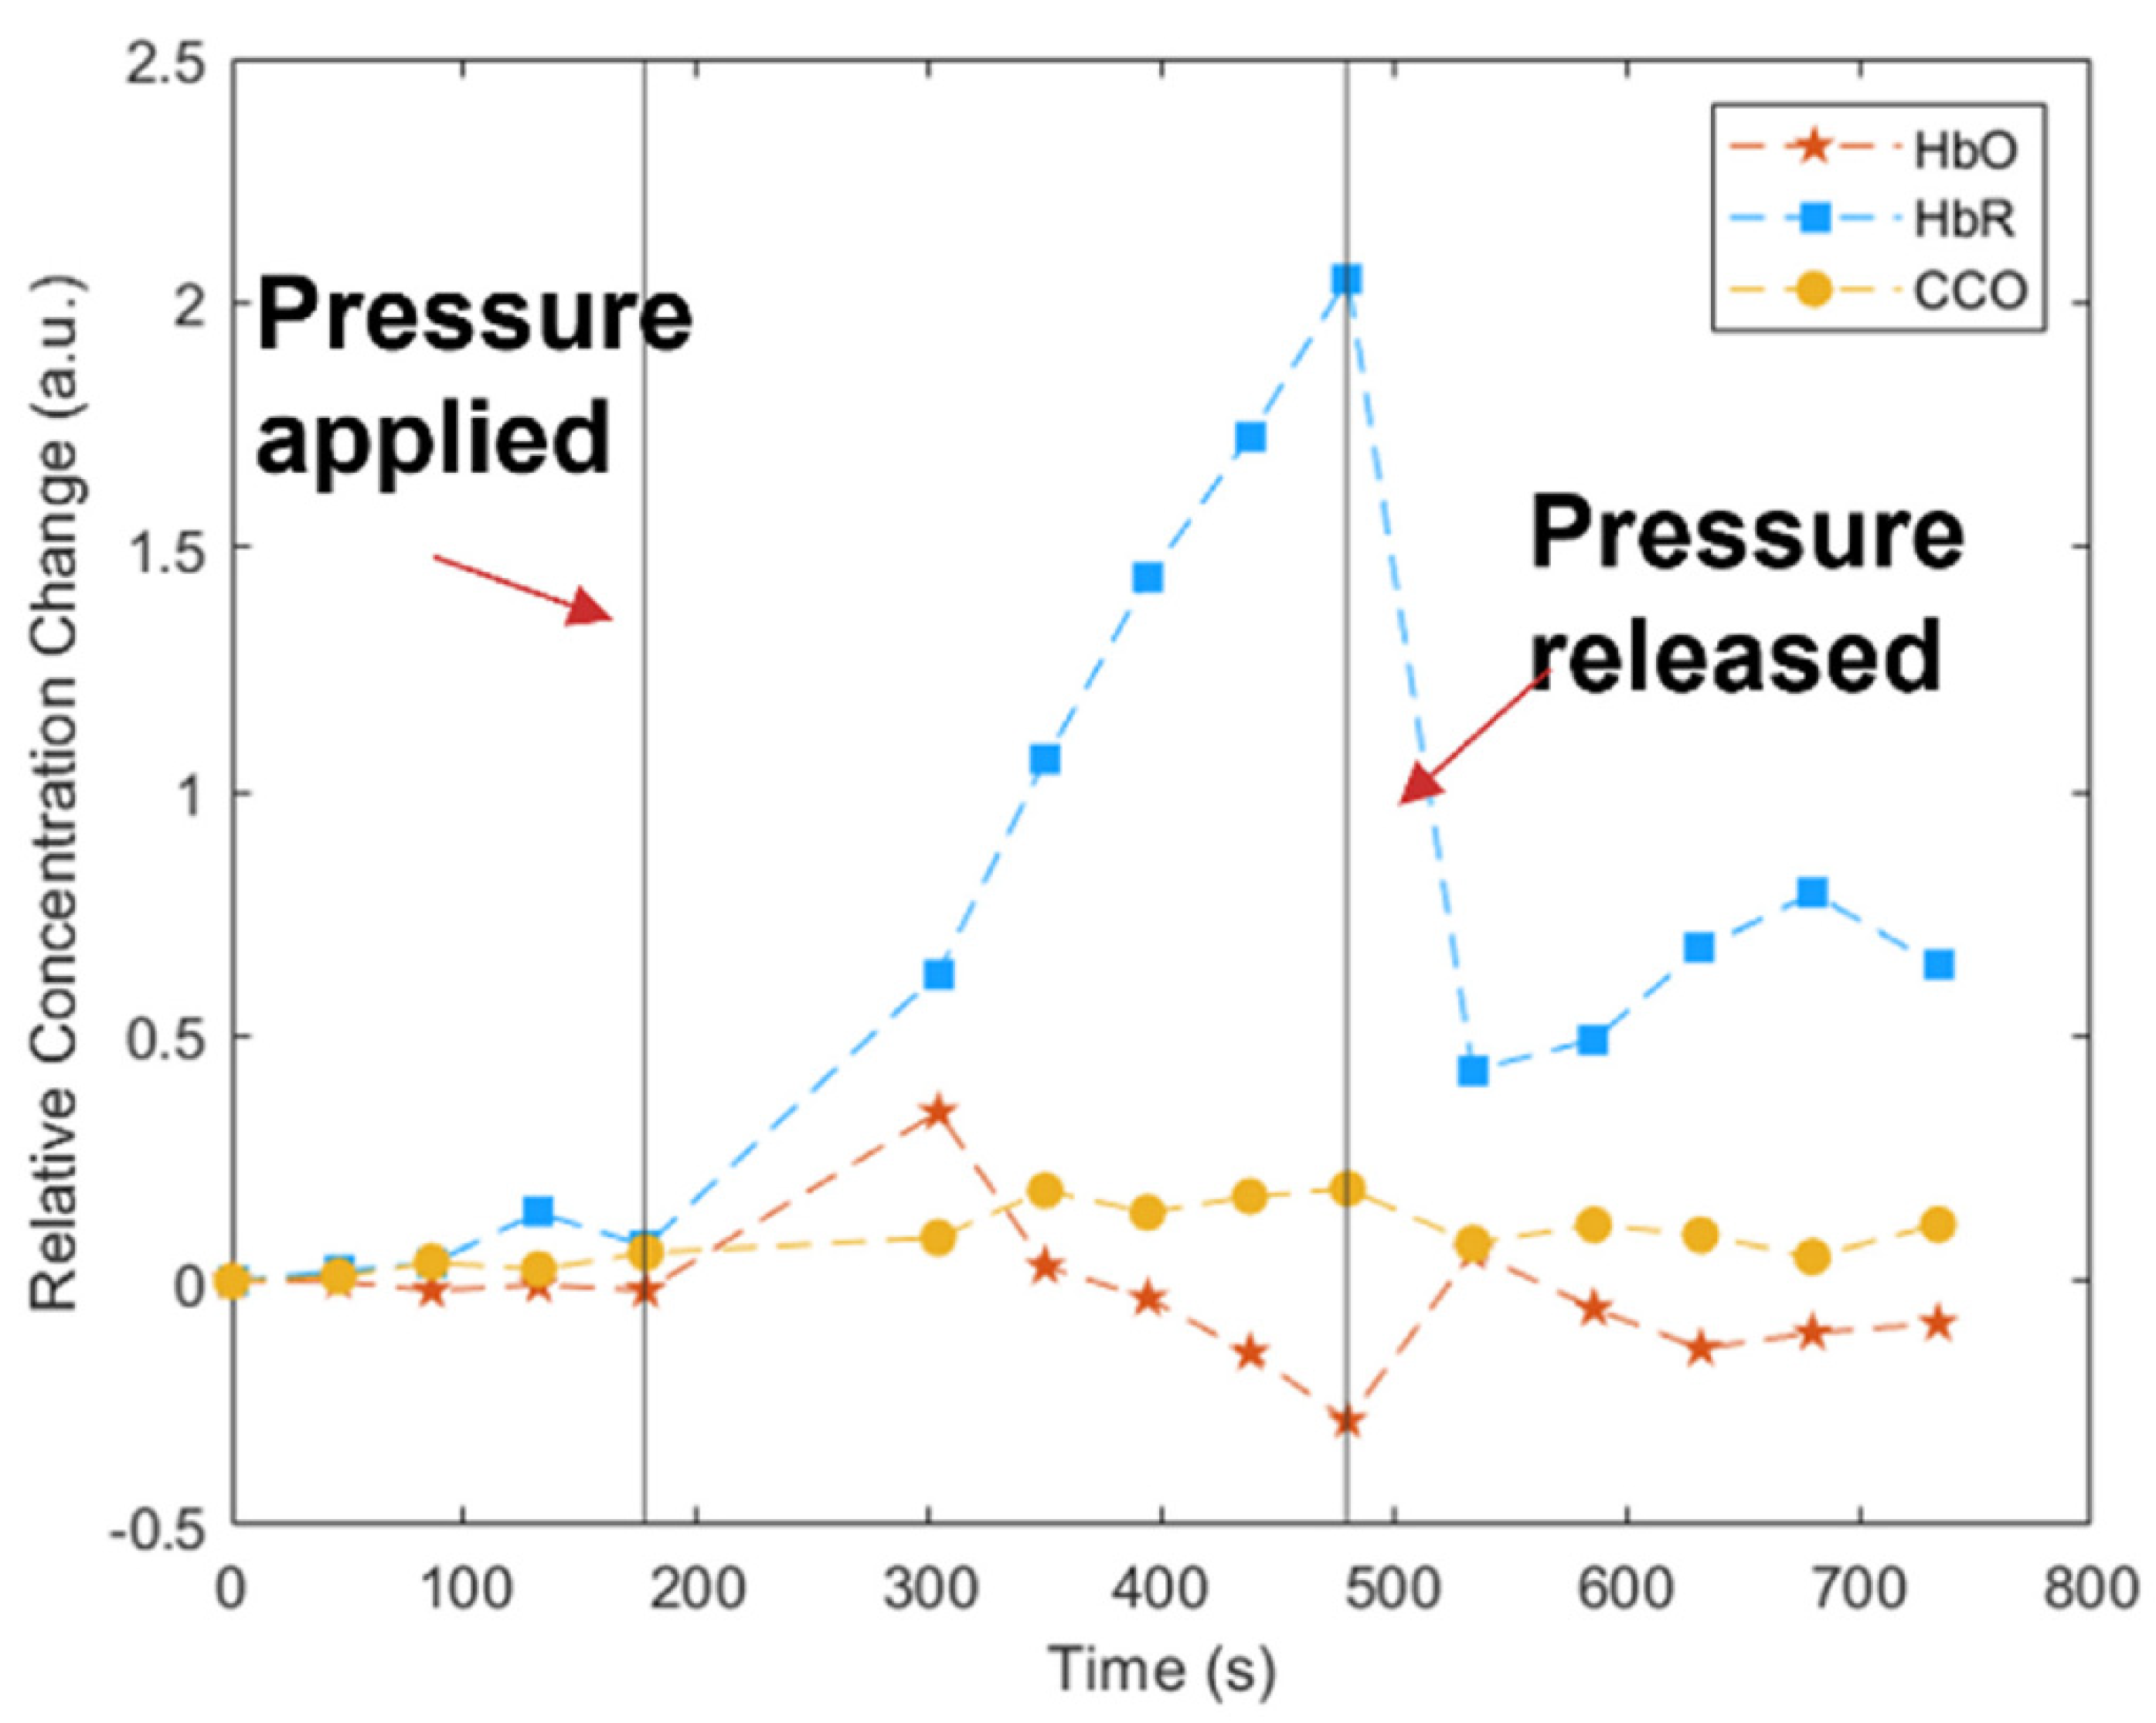
Exemplary results for the change in HbO (red stars and lines), HbR (blue squares and lines), and CCO (yellow circles and lines) for the blood pressure test are illustrated in
Figure 8 from our SCISCCO measurements. In particular, the HbR increased after applying the cuff pressure, the HbO decreased, and the CCO remained relatively unchanged (within the noise of the measurement). The results in
Figure 8 are similar to those obtained in [
39], thereby validating that our SCISCCO system matched the previously reported literature measurements for CCO using different kinds of super-continuum light sources. In particular, Figure 13 in [
39] shows the same trends in HbR (increasing during cuff occlusion), HbO (rising at first, and then falling during cuff occlusion), and CCO (basically remaining approximately the same during cuff occlusion) as we saw in our results of
Figure 8. However, the magnitudes of the changes and the relative changes between different parameters were different from those in [
39] and our experiments, probably because they were performed on different participants and the precise protocol and cuff occlusion may have been different. For example, in [
39], the HbR changed from ~0 to ~20, the HbO went up to ~5 and down to ~−5, and the CCO changed by less than ~2 (numbers should be considered relative to each other). On the other hand, in
Figure 8, which is plotted in arbitrary units, the HbR changed from ~0 to ~2.1, the HbO went up to ~0.3 and down to ~−0.3, and the CCO changed by less than ~0.15. Thus, the qualitative behavior matched, but the quantitative numbers were not the same due to different experimental conditions. We believe that the CCO did not change in the forearm for several reasons. First, the forearm muscles have a relatively low level of CCO compared, for example, with the brain. Second, for only a 4-min tightening of pressure, there is blood constriction, but there is not expected to be a significant change in the metabolism of the muscles, since muscle is less affected by oxygen deprivation.
3.3. Breath-Holding Test Using SCISCCO on the Forehead
As further confirmation of the validity of our measurements, we also compared our SCISCCO system results with a commercial fNIRS system (CW6, TechEn Inc., Milford, MA, USA). fNIRS only provides information regarding HbO and HbR (although typically the results for HbR are noisier and less reliable). Since the SCISCCO signal can be used to derive HbO, HbR, and CCO, in this test, we could at least compare the results for HbO and HbR. If those two measurements were relatively consistent, then we could reasonably assert that the CCO measurement was reliable.
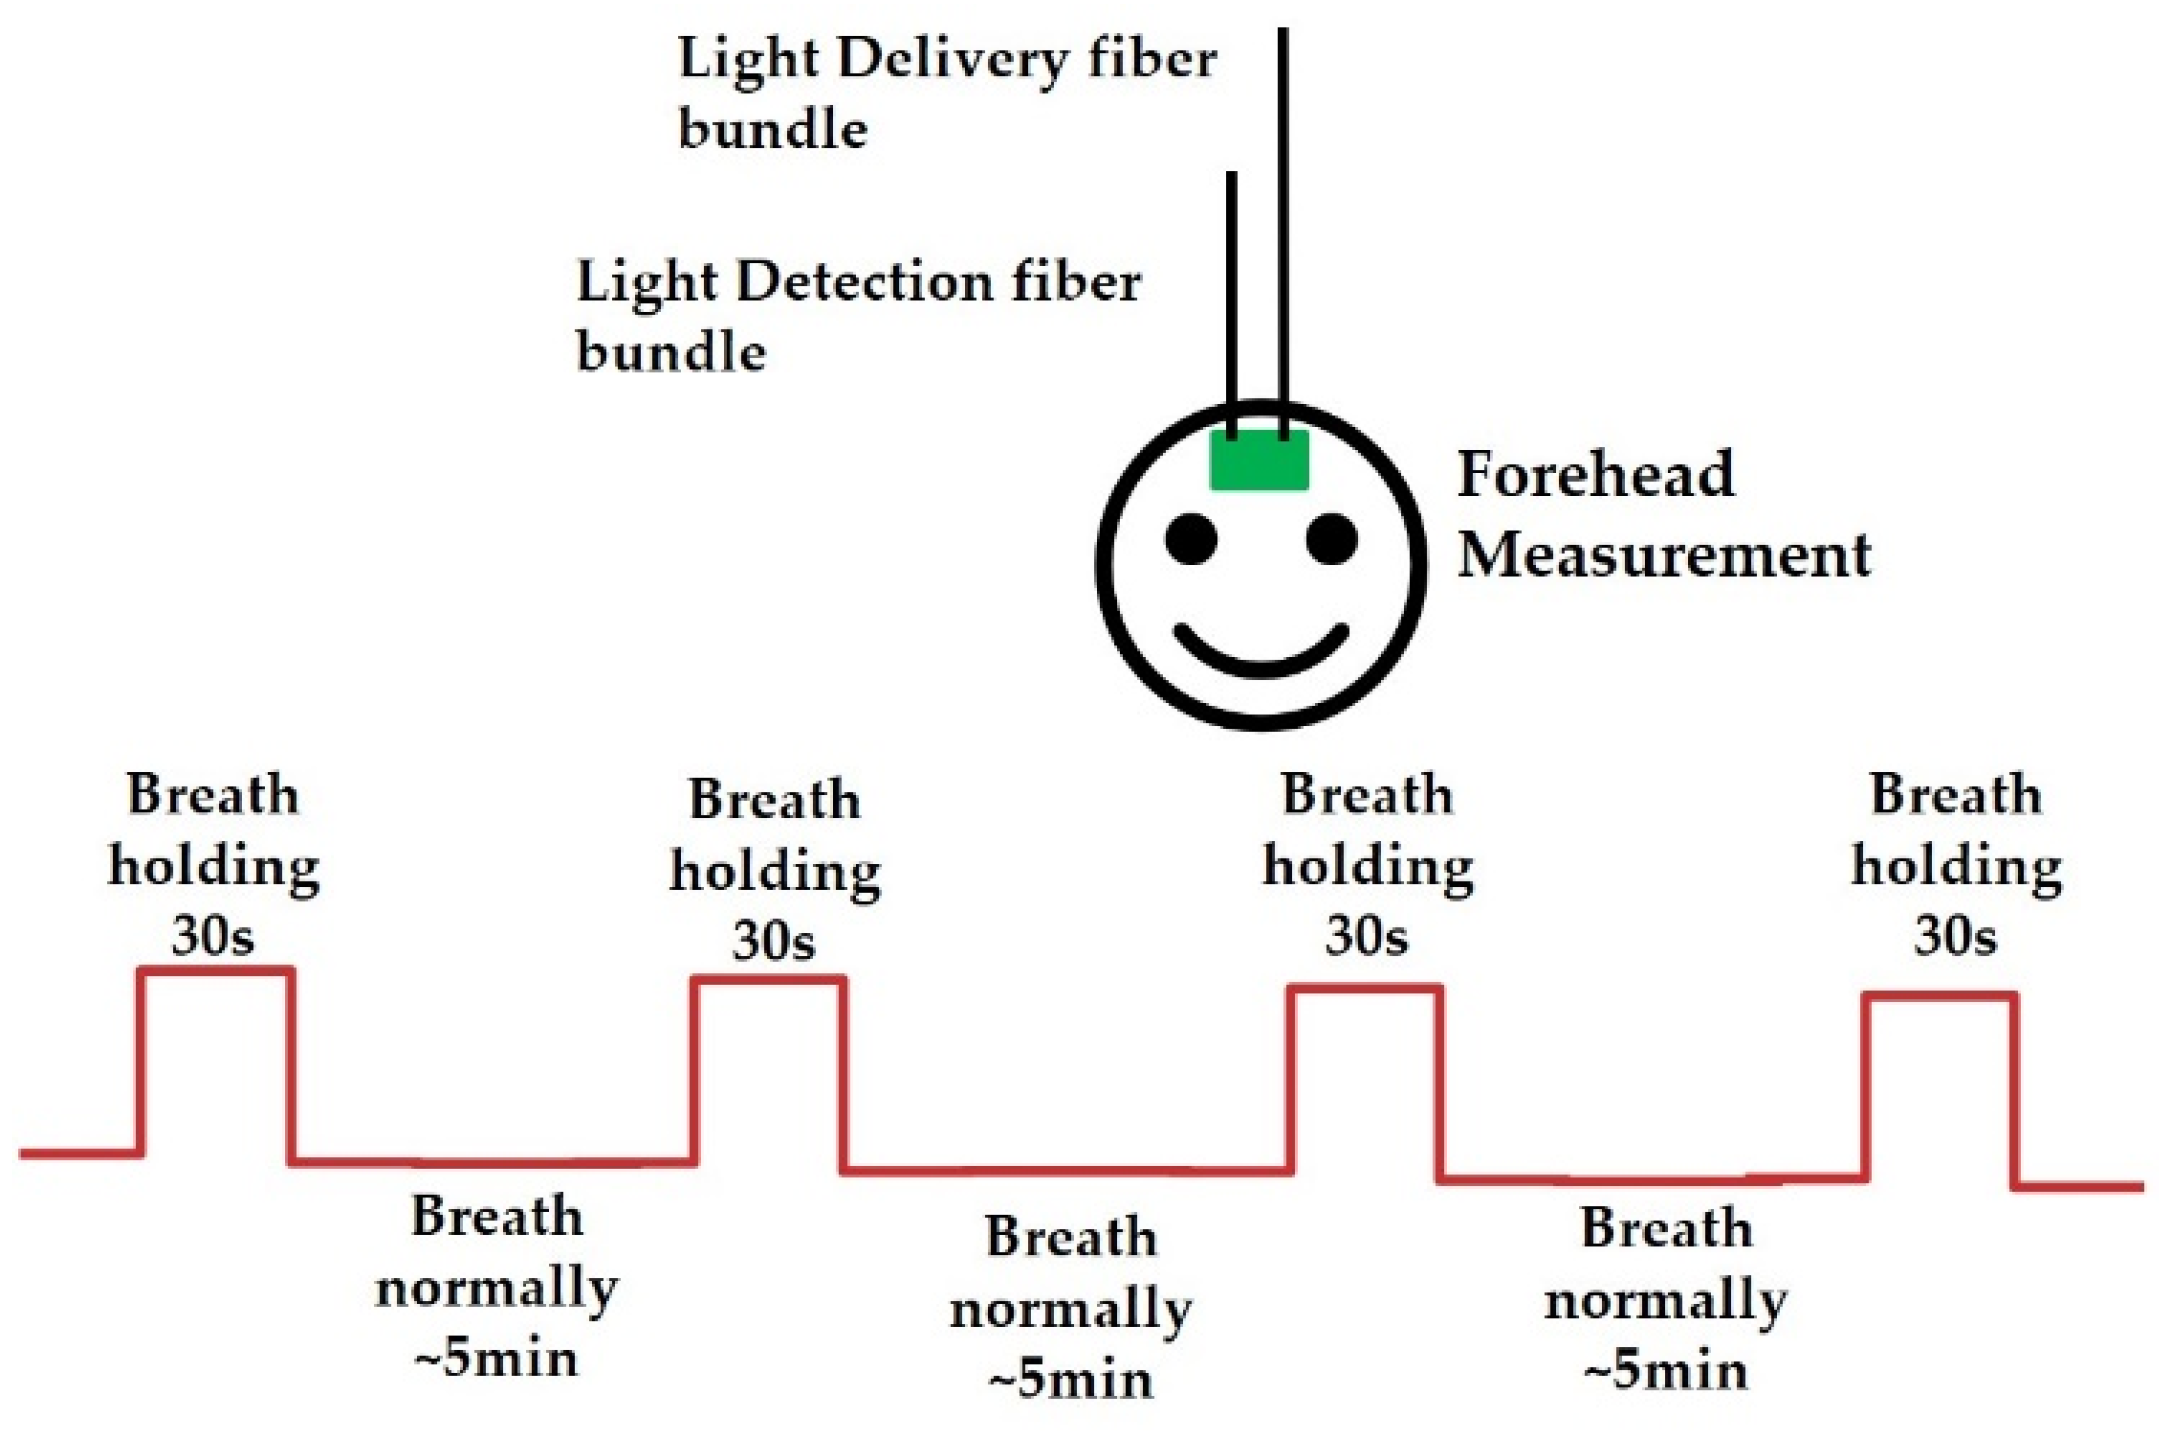
The set-up and protocol for the breath-holding test are illustrated in
Figure 9. The probe from
Figure 5b and the SCISCCO system from
Figure 5a were then applied to the forehead of the healthy human participant. For the fNIRS system, the probes were placed on the left and right sides of the head. All of the fNIRS probes were secured with a silicone rubber band, and the source and detector separation was 3 cm.
The protocol was for the participant to breath normally for about 5 min and hold his or her breath for 30 s, and then the sequence was repeated multiple times. The spectrum was measured continuously, with each spectral scan requiring about 30 s to collect due to the spectrometer’s speed of tuning.
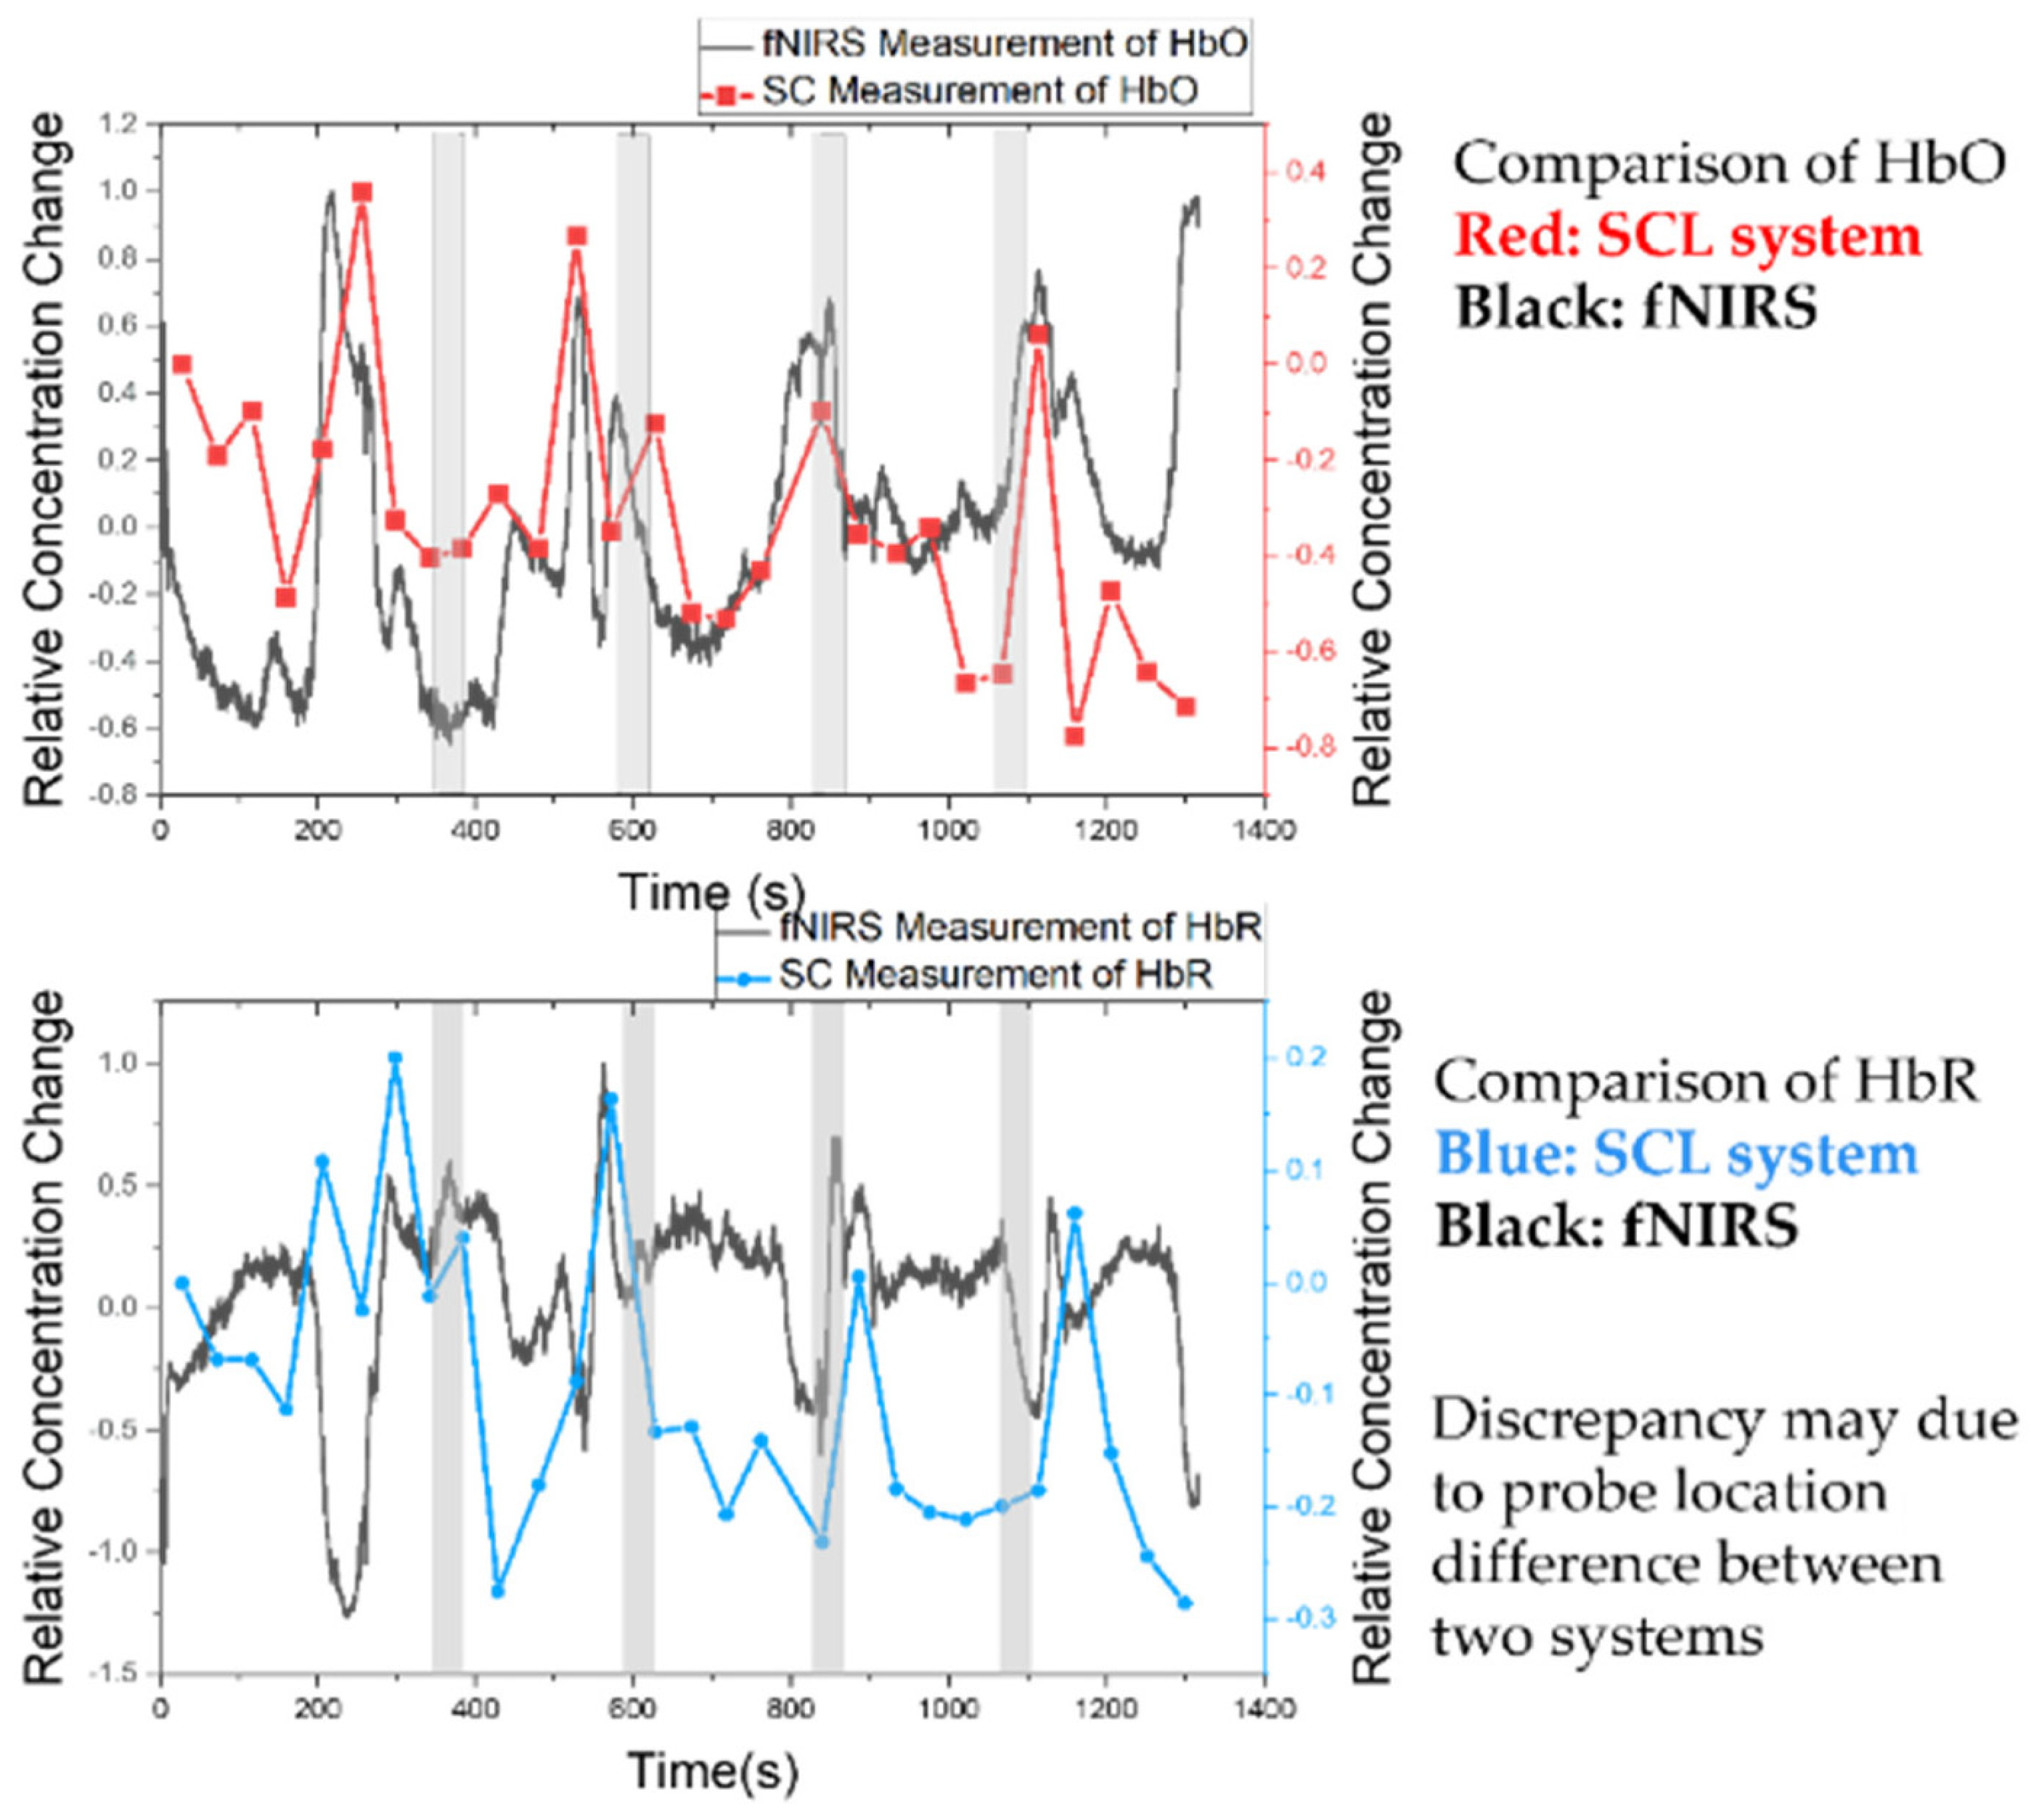
Figure 10 shows the comparison between the fNIRS system (black curve) and the SCISCCO system (red for HbO and blue for HbR) for simultaneous measurements. The top curve shows the comparison for HbO, with the shaded regions corresponding to the breath-holding periods. Both systems show that the HbO increased during the breath-holding period, and there was reasonable correlation between the two measurements. The bottom curve shows the comparison for HbR, where the results were generally similar but the correlation was not as good. It should be noted that in fNIRS systems, the HbR tends to be noisier, in part because of less sensitivity to shorter wavelengths for the system. A similar rationale may also apply to the SCISCCO system. Moreover, the discrepancy between the two systems may also be attributable in part to changes in HbO concentration during the breath-holding periods and the low sampling rates. SCISCCO failed to capture this dynamic consistently. During breath holding, the HbO increased during the first 10–20 s, followed by a decline in HbO concentration [
40]. Yet, as our system measured the levels about every 30 s due to hardware limitations, we may not have captured this dynamic in terms of its rise and fall during the breath-holding period. The measurement time limitation arose from the spectrometer’s scanning speed. In the later experiments with the attention test (next section), we were able to optimize the system to reduce the measurement time down to ~17 s. Even shorter data acquisition times could be achieved using fast tunable filters, such as acousto-optic tunable filters.
In
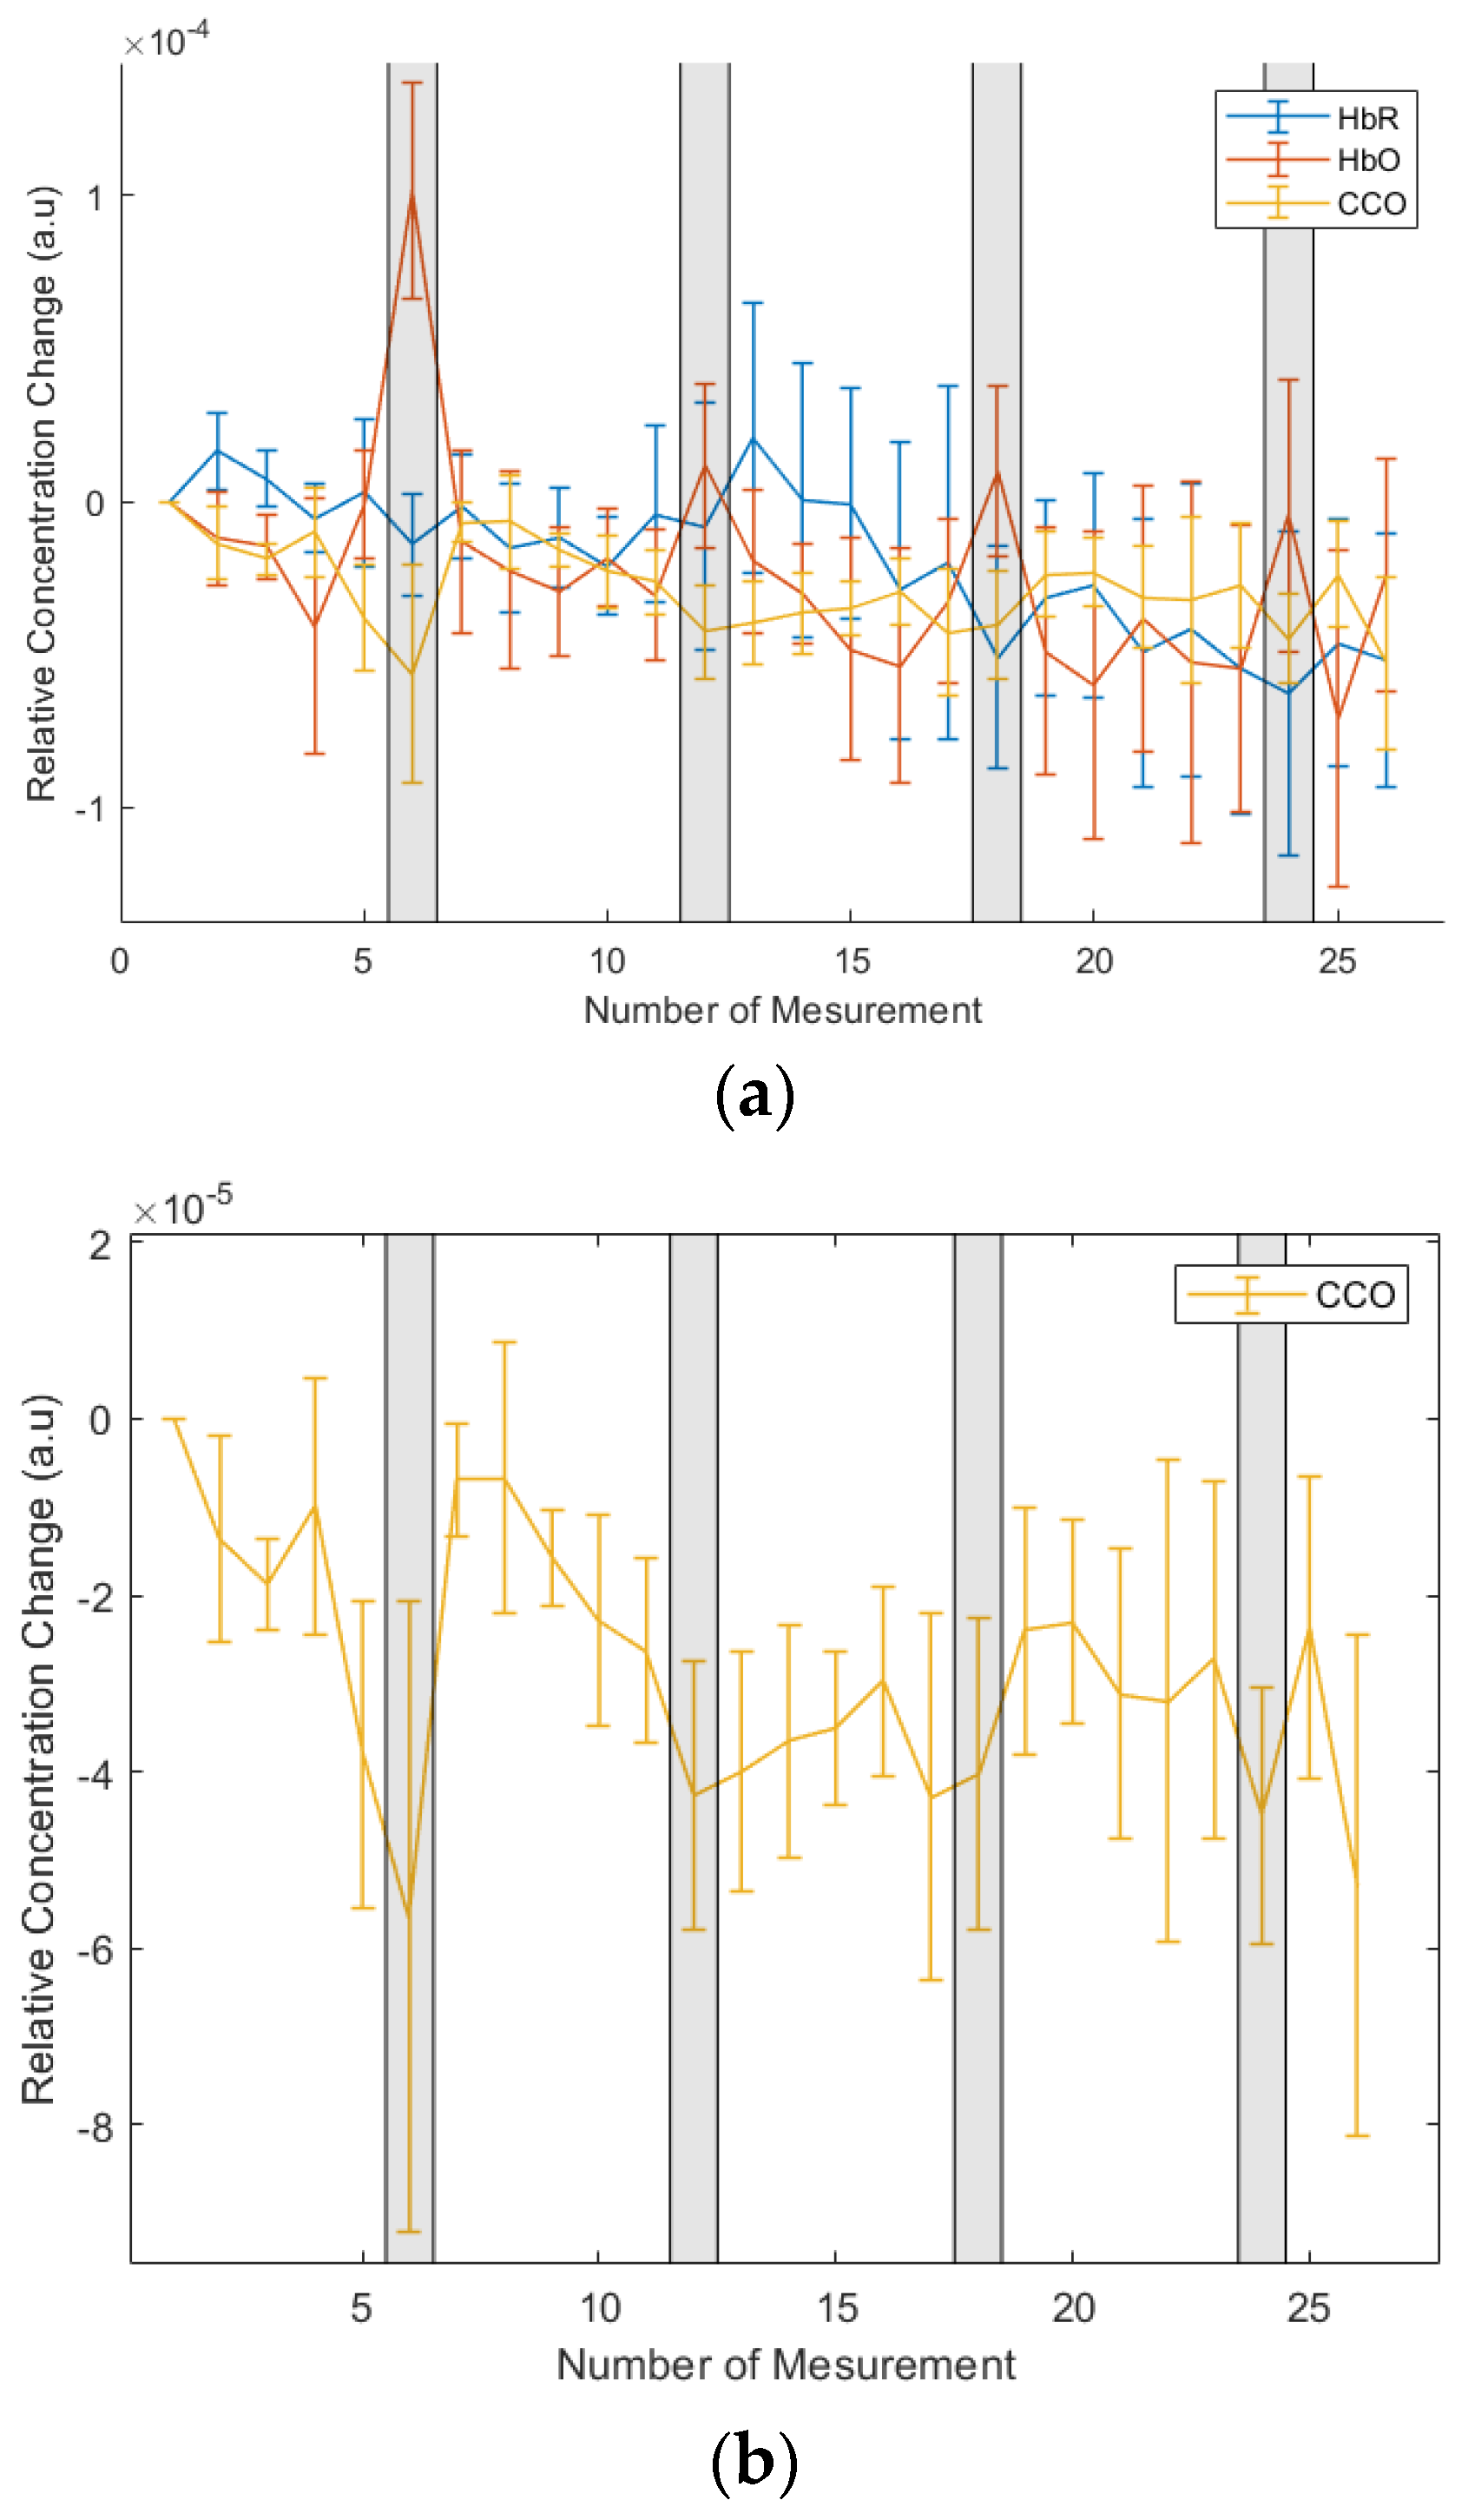
Figure 11, the typical results from the SCISCCO system for the breath-holding test are illustrated.
Figure 11a shows the overlap of the HbO, HbR, and CCO signals through the protocol, with the shaded regions corresponding to the periods of breath holding.
Figure 11b shows in more detail the CCO measurements for the breath-holding test. This curve resulted from averaging five measurements from three different healthy human participants, with each participant being measured three times. What we found was that for at least three out of the four breath-holding periods, the CCO level decreased during the breath-holding period.
Thus, we confirmed through the breath-holding test that we obtained a similar hemodynamic response for the fNIRS and SCISCCO measurements. The correlation for HbO was reasonably good, but the correlation with HbR was poorer due to higher noise levels. It should be noted that the hemodynamic responses we observed were consistent with the results published in the literature. For example, it was found in [
40] that during the breath-holding period, the HbO increased, and right after the end of the breath-holding period, the HbR increased. This is consistent with our results in
Figure 10. In addition, the breath-holding test described in this section is a physiological test. The next section will detail the attention test, which is a cognitive test. It turns out that the fNIRS and SCISCCO generally correlate in both the physiological and cognitive tests. Finally, although we found that the CCO decreased during the breath-holding period, we only tested three healthy human participants. We did not use a larger sample set because the goal of this test was to show correlation between the fNIRS and SCISCCO systems, rather than understanding how CCO should change during the physiological test.
3.4. Attention Test with a Modified Probe for SCISCCO and fNIRS
Having validated the SCISCCO system against the published literature and a commercial fNIRS system for hemodynamic response, we next moved to a pilot human study on 25 healthy human participants. The test was a cognitive attention test, where the expectation was that the active part of the brain would be in the forehead region, since the frontal lobe is central to attentional capabilities. For example, to complete an attentional task, the participant needed to focus on the target information, ignore distractors, and remember the necessary task rules or instructions to complete the task. The frontal lobe is essential in keeping all these aspects of attention “on” and operating cohesively to accomplish a given task [
41,
42].
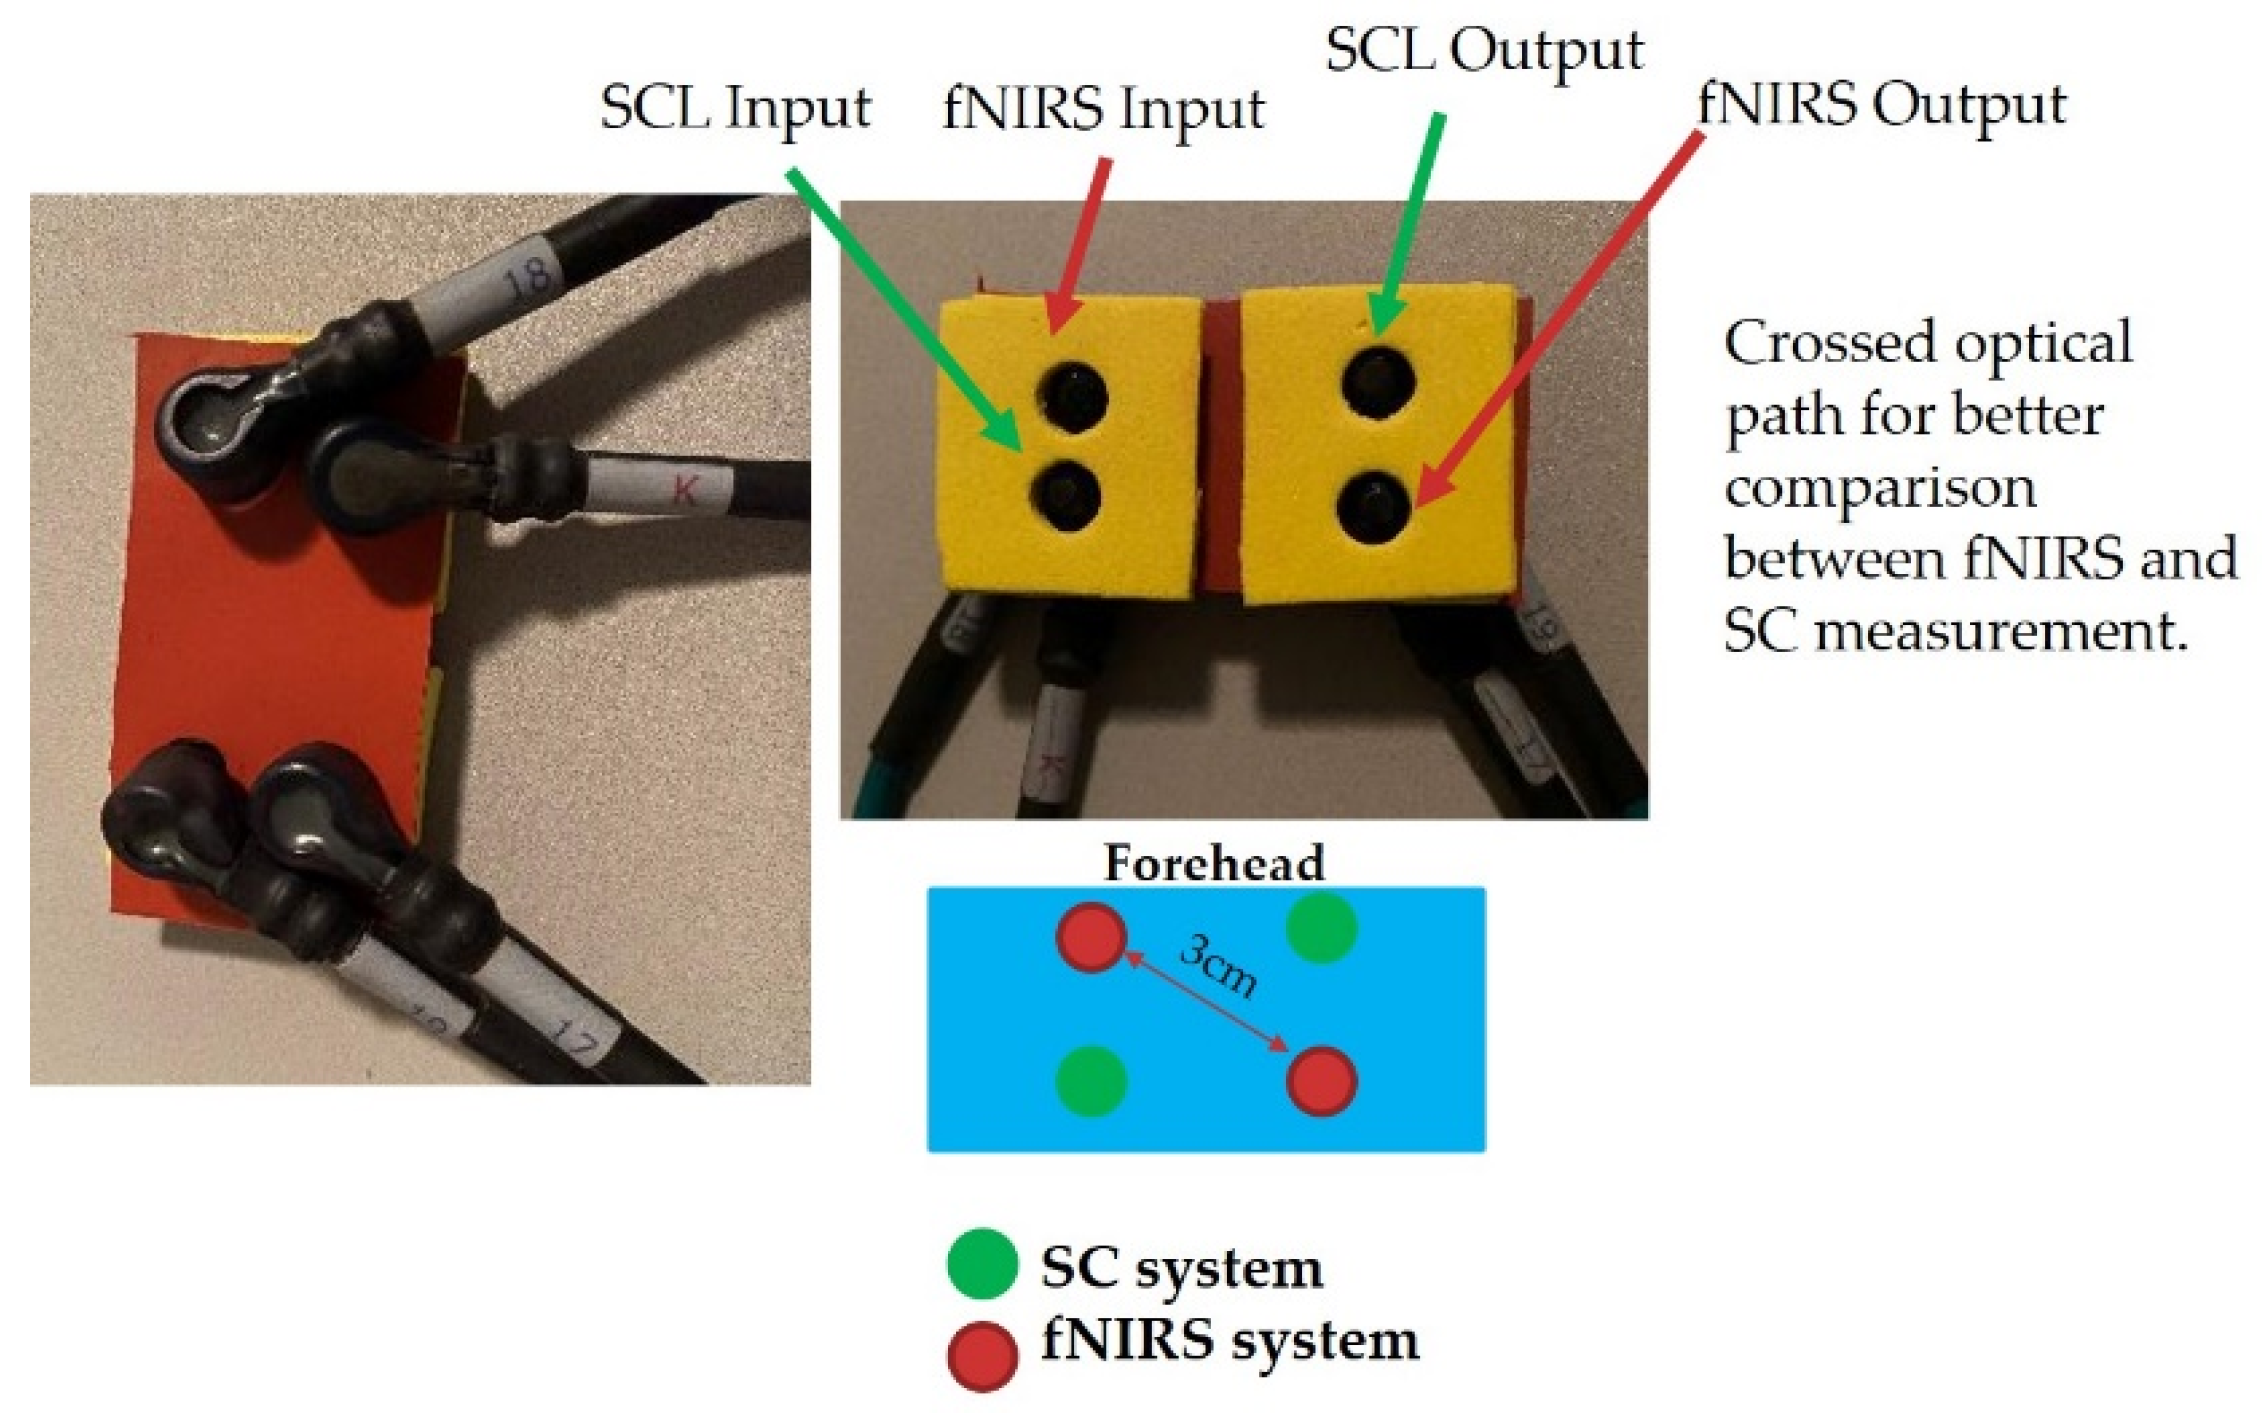
Because of the concern for the breath-holding test that fNIRS and SCISCCO system correlation may be affected by different probe locations, we modified the probe for the attention test to have the fNIRS and SCISCCO fibers interleaved and covering approximately the same region of the forehead. The new probe is shown in
Figure 12, where the two SCISCCO fibers (light excitation and receiving fibers) were placed along one diagonal of a rectangle (green dots) while the two fNIRS fibers were placed along the other diagonal of the rectangle (red dots). The excitation fibers and the receiving fibers were placed approximately 3 cm apart.
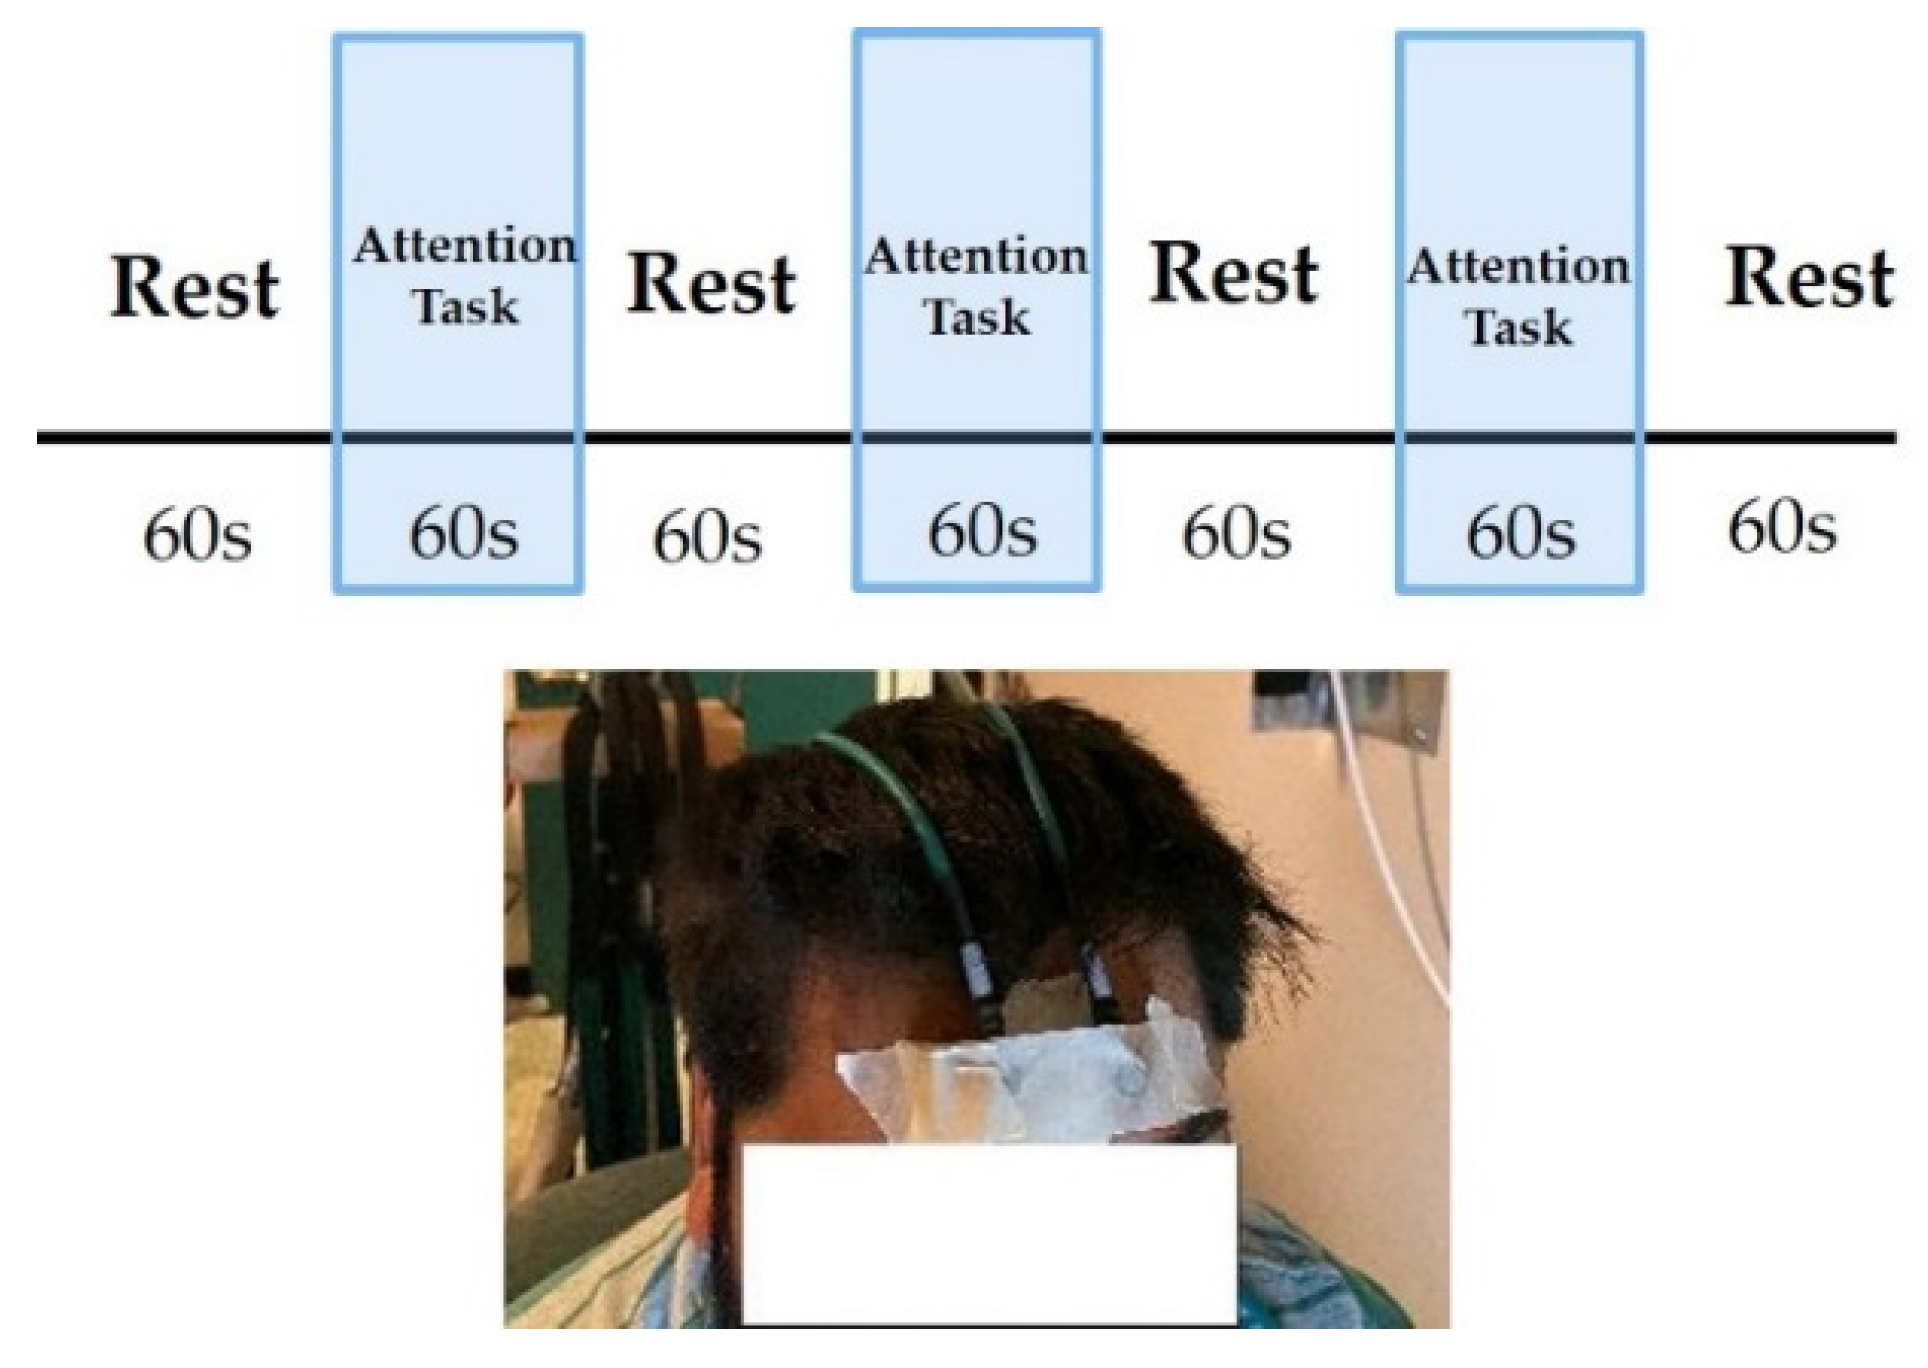
Figure 13 illustrates the attention test protocol and the CCO probe location. The photograph shows that the CCO probe was placed with 3 cm of separation on the forehead. The fNIRS probe included a regular band at the left and right hemispheres and one reference channel at the forehead. The probe was taped to the forehead of the participant to minimize motion artifacts during the measurement.
The attention test protocol shown at the top of
Figure 13 has each test comprising three task blocks, and then the test was repeated three times (i.e., for each participant, there were nine blocks in total for the attention task). Each cycle of the protocol had a 60-s rest period followed by a 60-s attention test, which was repeated 3 times in the same test, and ended with a 60-s rest period. This protocol was then repeated three times. The description of the cognitive attention test is as follows. The participant would see a capital letter (e.g., A-, B-, C-, or D-) followed by a small letter (e.g., a-, b-, c-, or d-). Sometimes, the two letters were the same, and sometimes they were different. The participant would press a key when the small letter was observed, corresponding to a particular small letter (e.g., when the letter “b” was shown, the participant pressed the letter “b” on the keyboard).
Since this is a cognitive test rather than a physiological test, we first wanted to verify that the fNIRS and SCISCCO systems still showed good correlation at least for HbO.
Figure 14 shows the HbO comparison for the two systems, where the black curve is for the fNIRS system while the red curve is for the SCISCCO system, and the blue shaded regions correspond to the period of the attention test. We found that the HbO behavior for the two systems tracked each other and demonstrated an expected pattern. The slight phase shift between the two curves may have resulted from the SCISCCO system being controlled separately from the fNIRS system, which may have introduced an unintentional delay.
3.5. Cognitive Attention Test Pilot Human Study with SCISCCO
The new probe of
Figure 12 and the SCISCCO system of
Figure 5a were then used in a pilot human study involving 25 healthy participants and the cognitive attention test protocol. Since the measurement site was on the forehead, where there is limited fat between the skin and skull, the data on the BMI, fat percentage, and subcutaneous fat of the healthy participants were not collected. One problem encountered in the measurement was the slow speed of our current implementation of the SCISCCO system (~17 s per scan), which meant that motion artifacts and other environmental fluctuations within the scan time could corrupt the actual data taken during the measurement.
More specifically, the current SCISCCO system implementation of
Figure 5a required about 17 s per wavelength scan. In the wavelength range of 750–900 nm, we took 50 data points in 3-nm steps. It took approximately 100 ms for the grating in the spectrometer to move to a particular wavelength step, and then the data acquisition time was about 100 ms once at that step (waiting for the lock-in amplifier to settle, read the output value, etc.). Therefore, 50 data points at a time of 200 ms per point corresponded to 10 s. Furthermore, it took around 7 s for initialization of the instrument and moving the grating back to the starting position. This long data acquisition time was due to the particular scanning spectrometer used in our experiments, but a much faster acquisition time could be achieved if tunable filters were used instead. For example, if we replaced the grating spectrometer with an acousto-optic tunable filter, then the data acquisition time was expected to drop to ~0.5 s [
39]. In the future, we intend to upgrade the SCISCCO system to an acousto-optic tunable filter wavelength selection system.
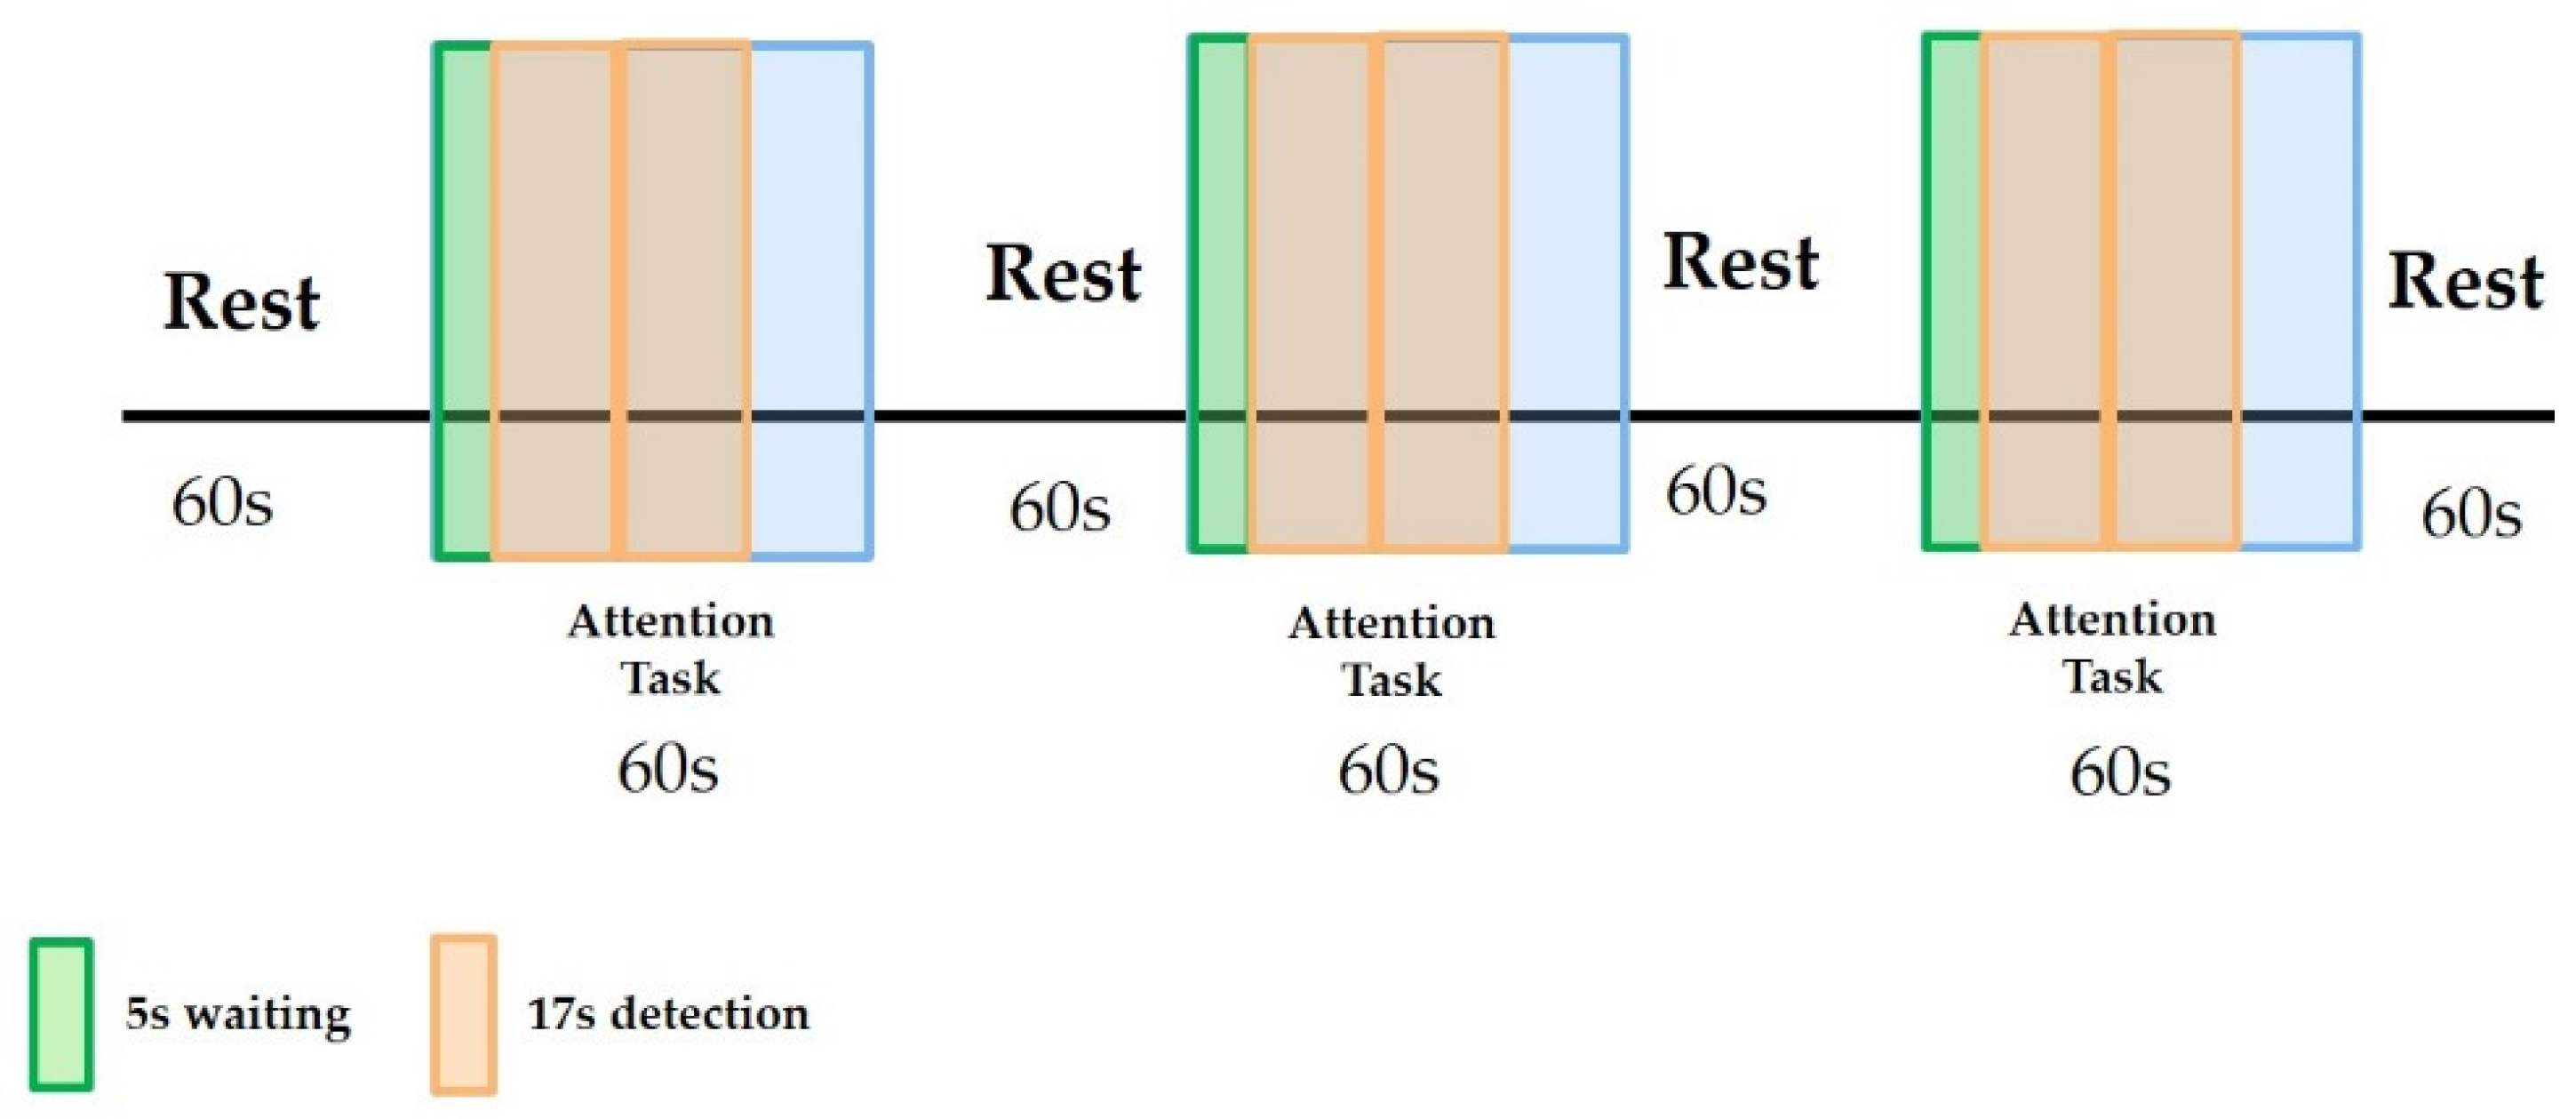
The detection time relative to the attention test protocol is illustrated in
Figure 15. The attention task period was 60 s, but it took about 5 s for the human participant to respond. Therefore, our detection began about 5 s after the start of the attention task, leaving about 55 s in which to conduct the measurements. In principle, we should have been able to fit 3 of the 17-s scans within the 55 s measurement time. However, because of some timing inaccuracy in starting and stopping as well as other timing jitters, we completed only two scans per attention task period to avoid obtaining only a partial scan or a scan that overlapped the attention period and the rest period.
The slow data acquisition or scan time could lead to data corruption due to motion artifacts, environmental changes, and other fluctuations within the 17-s scan time. For example, if the participant moved within the 17 s (a fairly common occurrence), the current embodiment of the SCISCCO system could not distinguish changes in the hemodynamic or CCO signal from the motion artifact. As a consequence of this timing difference, not all blocks of data collected with the SCISCCO system would be accurate. Therefore, we applied a screening filter to the data collected on the 25 participants to determine which data sets to accept.
For the attention study, we screened or filtered our data based on the HbO observation. During the attention test, we expected the activity to require more brain function and a consequent increase in the oxygen sent to the brain (i.e., an increase in HbO). We conducted two-step filtration in our data screening. First, we discarded data from the “outlier” participants. There were three types of outliers, which led us to discard the data from eight participants. There were technical errors in data acquisition during two of the participants’ measurements. Hence, the data from these two participants were discarded. Three additional participants were removed due to unsatisfactory signal quality, which we believe was due to significant motion artifacts. Unsatisfactory signal quality was defined as when the SNR between two adjacent measurements was more than three standard deviations from the mean. Finally, yet another three participants had more than three out of nine data blocks with HbO concentrations lower than the baseline, and they were discarded because we expected increasing HbO during the attention blocks, as established by prior research [
41]. All of these eight participants discarded were probably due to improper placement of the probe, motion artifacts, or other environmental fluctuations leading to data errors.
After the first step in our data screening of removing the outliers, we were left with 17 participants’ data out of the original 25 participants. We then further filtered the data in two different ways (described in more detail below and in
Appendix B) to remove artifacts in the data sets from these 17 participants that may have been related to motion during the data acquisition time. Both screening methods provided comparable results and supported the following hypothesis: during the attention task, although the HbO concentration increased, the redox state of CCO decreased. It is noteworthy that HbO and CCO are not always uncorrelated when measured in other parts of the body. For example, in the blood pressure test previously discussed, CCO was more or less constant, while the HbO increased initially (
Figure 8).
In the second screening step, we did not accept all nine blocks of attention test data for the 17 participants remaining after removing the outliers. To further remove data affected by motion artifacts, we used one of two second screening methods. The first method is called the “best of six” approach, described further in
Appendix B. The table in
Figure 16 shows the results of applying the best of six screening method after the outliers were removed.
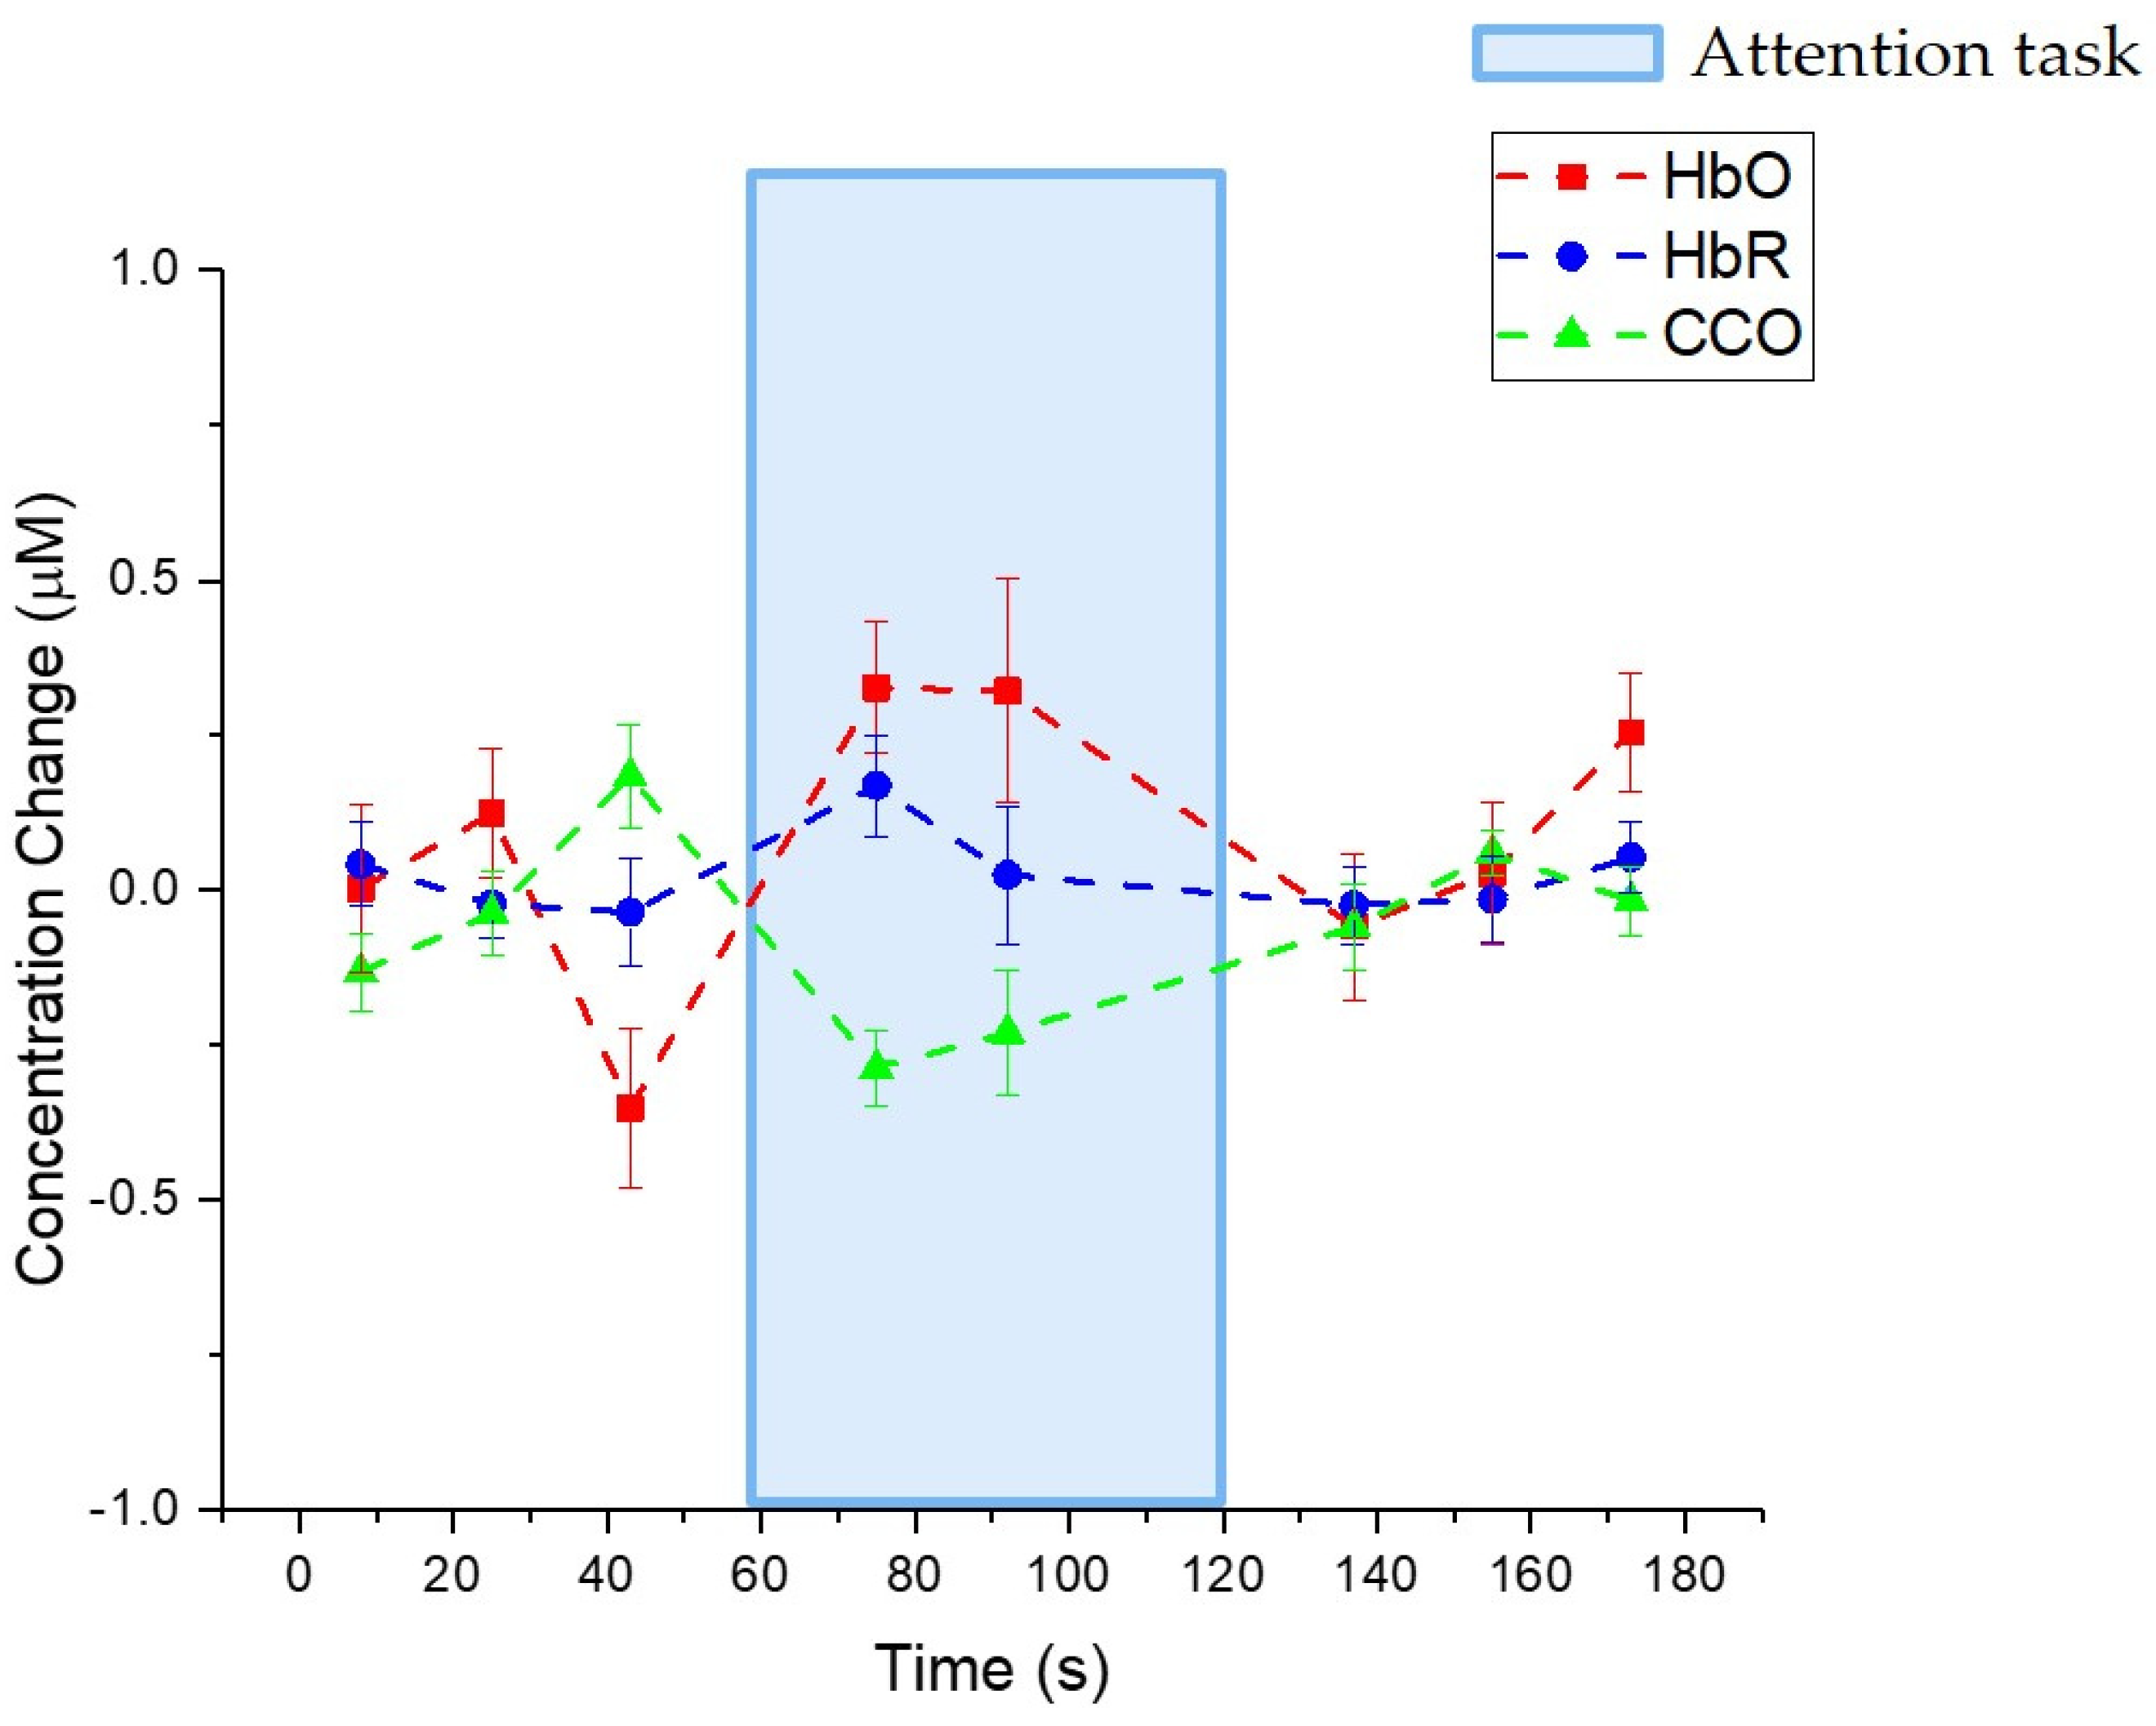
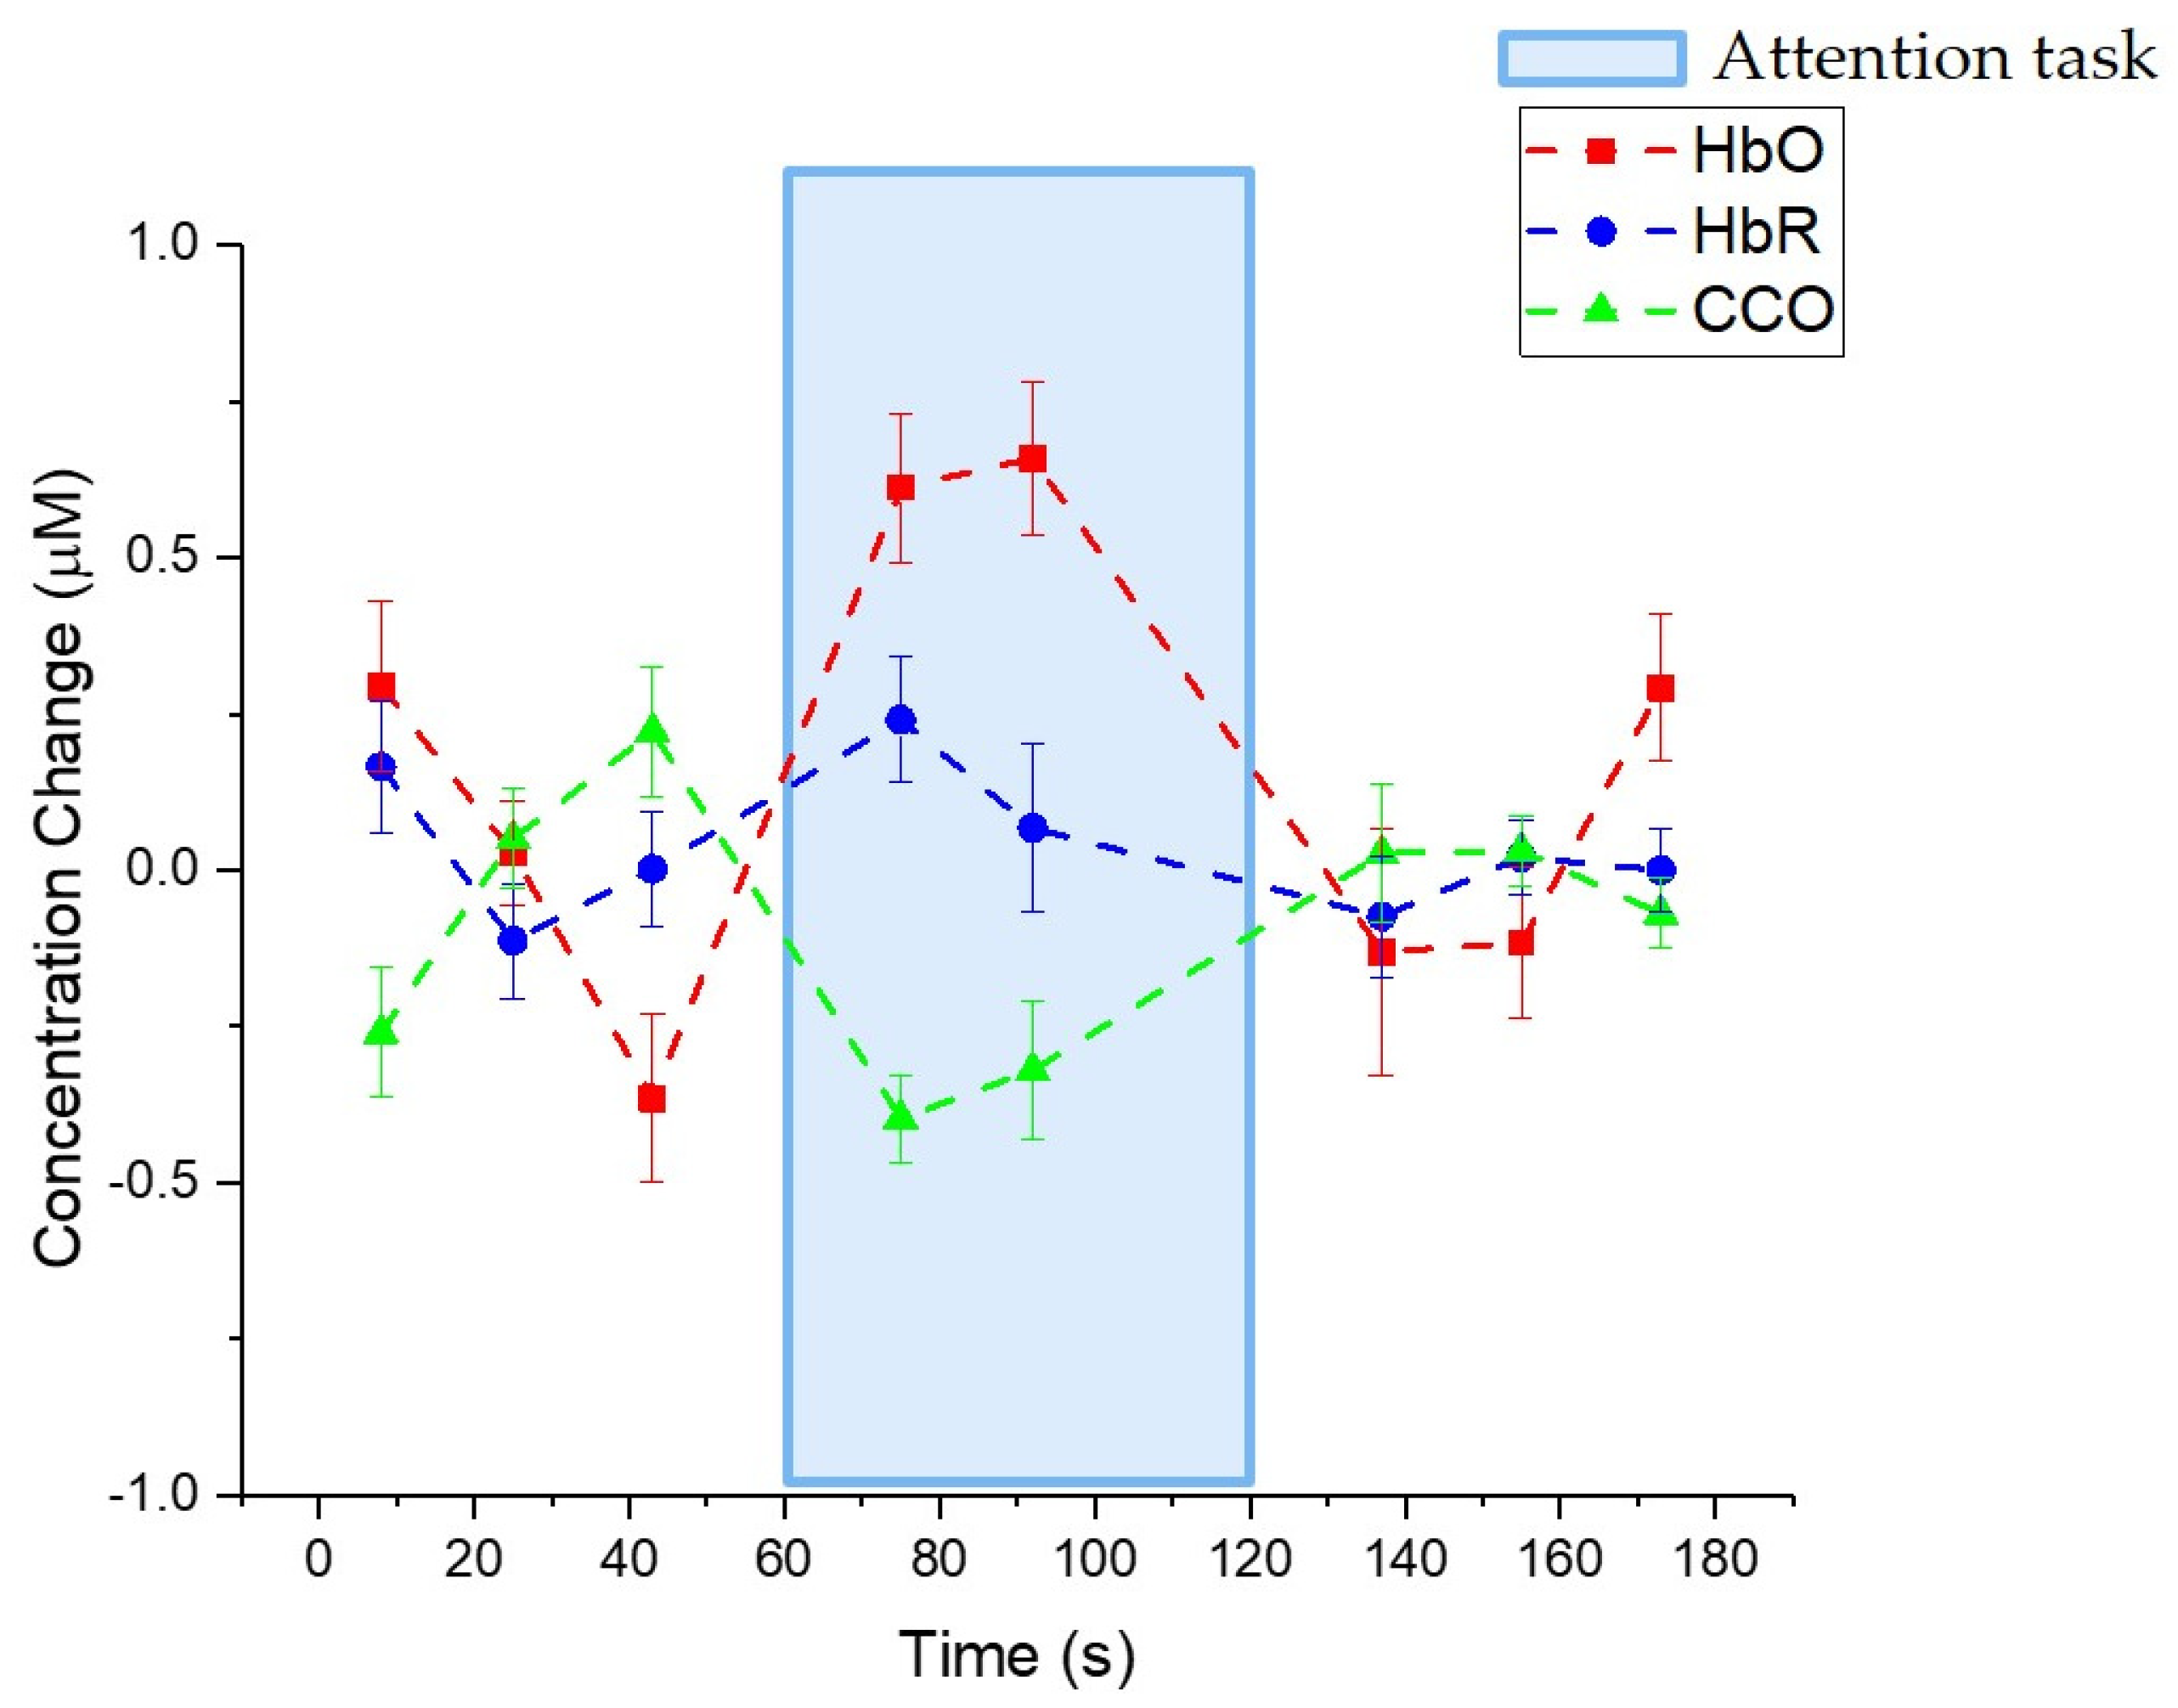
Figure 17 illustrates the change in HbO, HbR, and the redox state of CCO after applying “best of six” screening. The lines show the average values, while the error bars indicate the standard error. During the attention test period, the HbO increased on average, while the redox state of CCO decreased on average. The HbR was more unpredictable, but this may be because HbR is generally harder to measure and has a lower signal-to-noise ratio in the measurement.
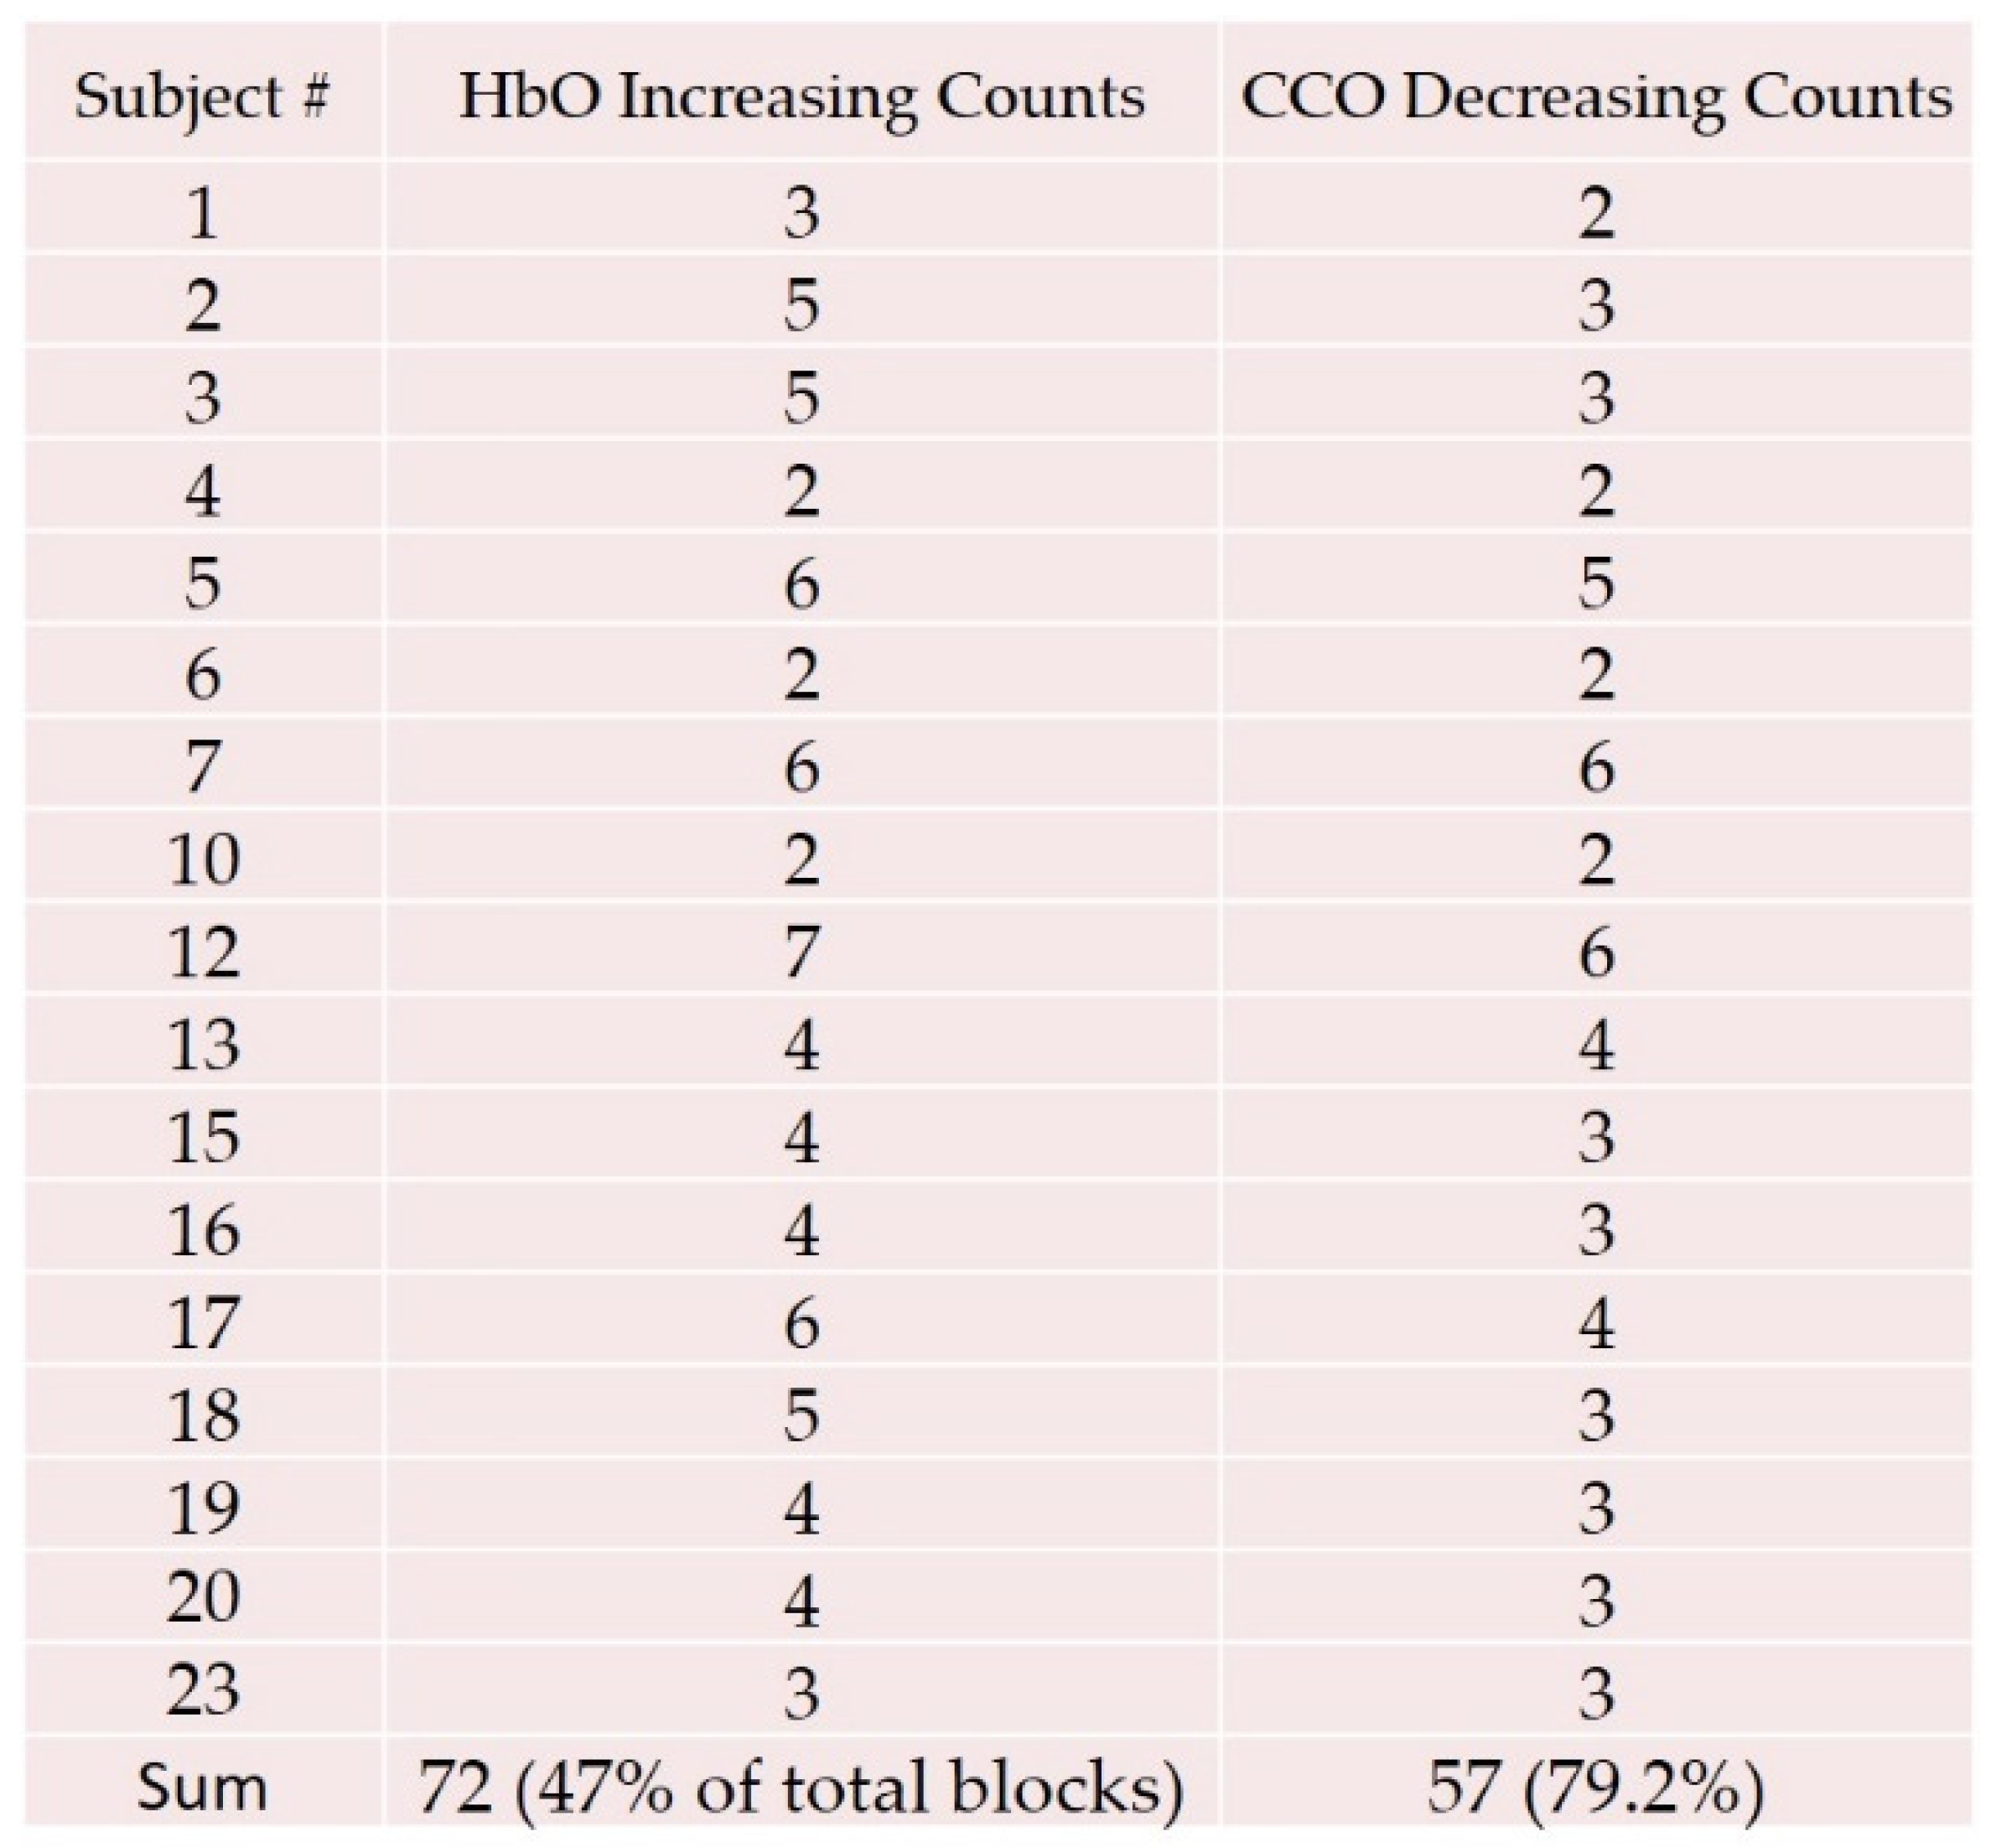
As an alternative second screening method, we applied “HbO increasing” processing after removing the outlier participants. This alternative second screening yielded approximately the same results of HbO increasing and the redox state of CCO decreasing during the attention test, although with a larger contrast for the CCO change and HbO change. The table in
Figure 18 illustrates the data selection. For the “HbO increasing” data selection method,
Figure 19 shows the change in HbO, HbR, and the redox state of CCO during the attention test. The lines correspond to the averages of the data, while the bars indicate the variance in the measurements. As in the previous analysis, we found that the HbO increased during the attention test and the CCO decreased. With the HbO screening method, the amount of the concentration change was larger, but the results were consistent with the “best of six” approach. As before, the HbR did not show a clear trend, which may have been due to the difficulty of measuring HbR.
4. Discussion of the Cognitive Attention Test Results
Based on the cognitive attention test results, two questions were worth discussing. First, why was the redox state of CCO decreasing during the attention test? Second, how did the results compare with the literature? We show below that the redox state of CCO decreasing was consistent with the models on CCO in cell metabolism and that our results were more definite than other published results because of a higher signal-to-noise ratio due to a number of factors in our experimental set-up. Recall that when referring to “CCO measurements”, we mean that we are measuring the changes in the redox state of CCO. CCO exists in two states: oxidized CCO and reduced CCO. The sum of these two is a constant, and the redox state of CCO is defined as the ratio of oxidized CCO to reduced CCO.
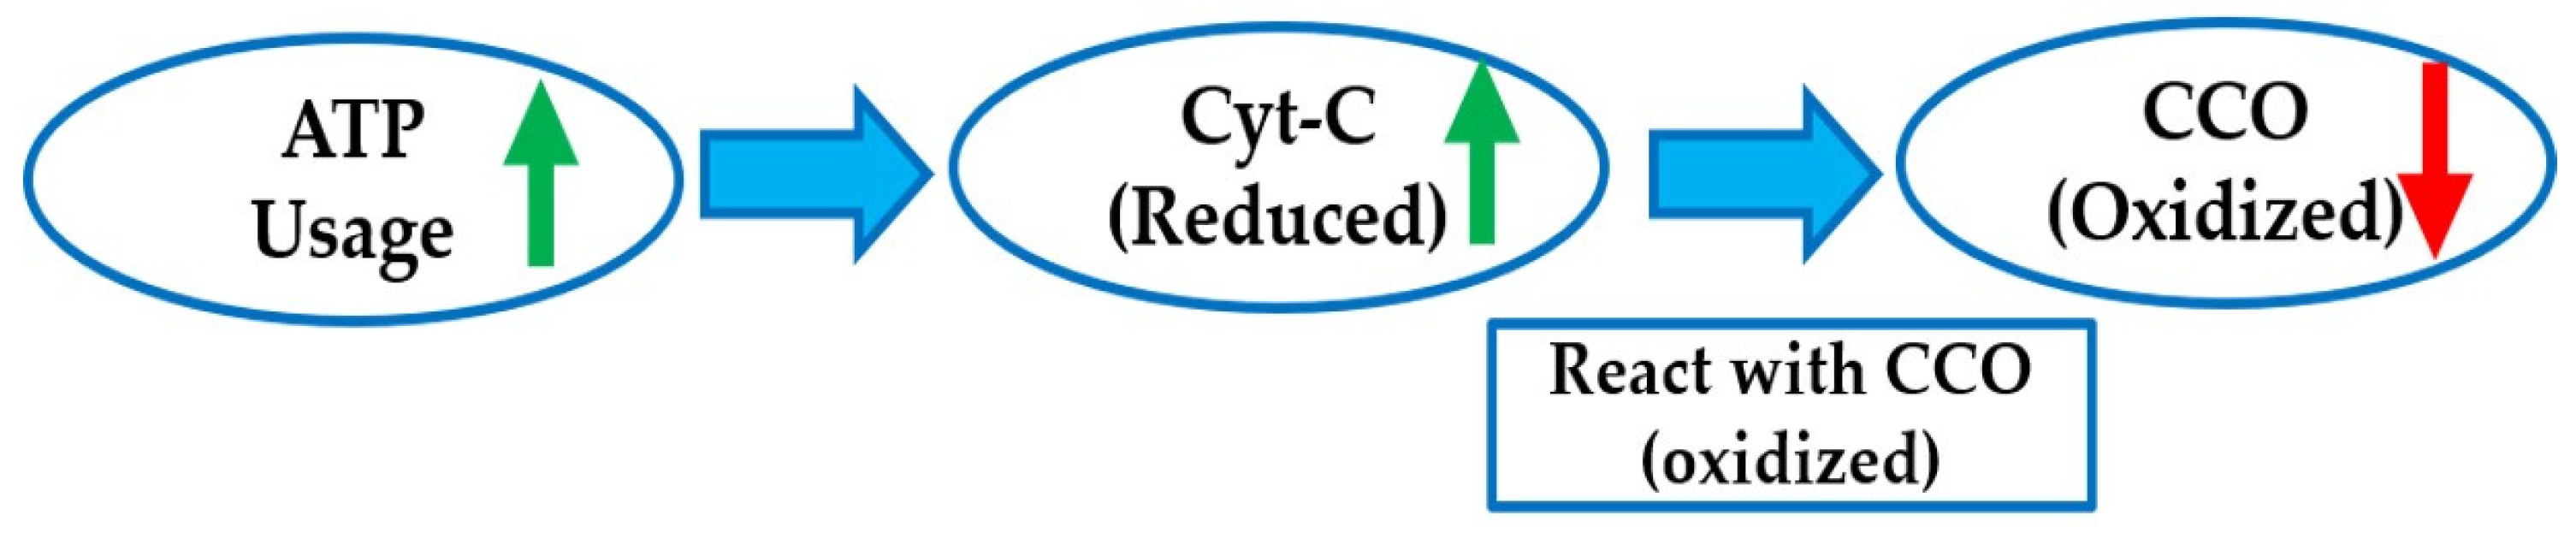
In this study, we observed that the level of oxidized CCO decreased (and thus the reduced level increased) during the attention test and that the CCO redox state returned to resting levels during the recovery period. These observations are consistent with the interpretation of the CCO redox state as an indicator of the cellular ATP demand and hydrolysis rate (
Figure 20). The levels of reduced cytochrome c, the substrate and electron donor for the CCO reaction, increase with increasing ATP hydrolysis [
25]. The CCO enzyme becomes increasingly reduced as cytochrome c becomes increasingly reduced, with increasing rates of metabolic ATP use and demand. The paradoxical increase in oxygenation that occurs concurrently with increased metabolic ATP use during the attention test protocol was observed in BOLD imaging [
40], and it is understood to be associated with a hyperemic response to local metabolic demand [
40]. Thus, our observations were consistent with the expected physiological response in local oxygenation while providing the first noninvasive simultaneous measurements of both cerebral oxygenation and metabolic demand using an optical sensor.
Here is perhaps a more intuitive way of explaining the experimental results. When the attention test begins, the frontal lobe part of the brain, which controls important cognitive skills in humans, becomes more active (compared with a baseline or resting state). The more active frontal lobe requires more oxygen to operate, and the circulatory system of the human responds by delivering more oxygenated hemoglobin to the frontal lobe. Hence, during the attention test, there was an increase in the HbO level provided by the blood transport system. The more active frontal lobe also requires more energy (ATP) to operate. As we discussed above, the levels of reduced cytochrome c (cyt-c) increased as the ATP usage increased, which in turn caused more oxidized CCO enzyme to become reduced. Therefore, in our measurements of CCO, we saw a decreased level of oxidized CCO during the attention tasks (
Figure 20).
This simple picture can also be used to understand the other experiments described in this paper. For the blood pressure test (i.e., applying >100 mmHg of pressure for ~4 min and measuring with the probe on the forearm), we found in
Figure 8 that the CCO level did not change substantially from the baseline. This is reasonable, because even when applying pressure to the upper arm, the muscles are not working in the forearm, so they do not need additional energy or an increased rate of metabolism.
In the breath-holding test (i.e., holding one’s breath for ~30 s, breathing normally for ~5 min, and then measuring with the probe on the forehead), we found in
Figure 10 and
Figure 11a that the HbO increased during the breath-holding period. In addition, in
Figure 11b, we found that during the breath-holding period, the redox state of CCO decreased generally. These results are consistent with our simple picture of brain function. First, the brain is a protected organ, so when one’s breath is held, the “fight or flight” response activates to help the brain. Second, when humans voluntarily withhold their breath, the brain continues to attempt to initiate breathing via the central respiratory rhythm that appears to continue throughout breath holding. Thus, in response to the breath holding, the brain is put in alert mode and becomes more active, thereby requiring more energy and leading to a decrease in the CCO level and, ideally, an eventual involuntary cessation of the voluntary breath holding [
43]. All of these experiments highlight that the hemodynamic response is related to the transport or circulatory system, while the CCO measurements provide insight into the metabolism or energy use in the organ.
A key result in this paper is the pilot human study on healthy human participants during an attention test. Previously published results also studied the attention test in humans (e.g., [
27]), but the CCO measurements in their study were inconsistent or inconclusive, at least in part due to the lower brightness of light used in the experiments. On the other hand, our results are more definitive; namely, HbO increased and CCO decreased during the attention test. We believe that our results are more conclusive because our measurements were made with a higher signal-to-noise ratio (SNR). There are several reasons for the higher SNR. First, the authors of [
27] used a lamp, while we used the super-continuum laser as a light source. The lamp had lower brightness, while at the same time, it was harder to couple the incoherent light from a lamp into a fiber for delivery to the test participant or sample. On the other hand, the light from the fiber-based SCL was brighter as well as easy to couple into a delivery fiber. As described in
Section 2, this resulted in an increase of nearly an order of magnitude in the spectral density coupled into the delivery fiber or signal brightness and, hence, the SNR. Moreover, the set-up in
Figure 5a used for the human testing had a number of attributes that increased the SNR. First, we used a reference arm to divide out any laser or environmental fluctuations or variations, which is particularly important when using a super-continuum laser that has intensity fluctuations in shorter wavelengths. We also found it was important to use a polarizer before splitting the beam, because varying polarization states can lead to fluctuations due to polarization-dependent components in the apparatus. In addition, by using the lock-in amplifiers, we also increased the SNR because it could block out ambient light as well as other stray signals. Specifically, the lock-in amplifier significantly attenuates signals that are not at the chopper frequency. As discussed before, the SNR and tolerance to motion artifacts could also be further improved in the set-up of
Figure 5a by using a faster tunable filter in place of the scanning grating spectrometer, such as an acousto-optic tunable filter.
5. Cart-Based SCISCCO Prototype System for Lab and Hospital Use
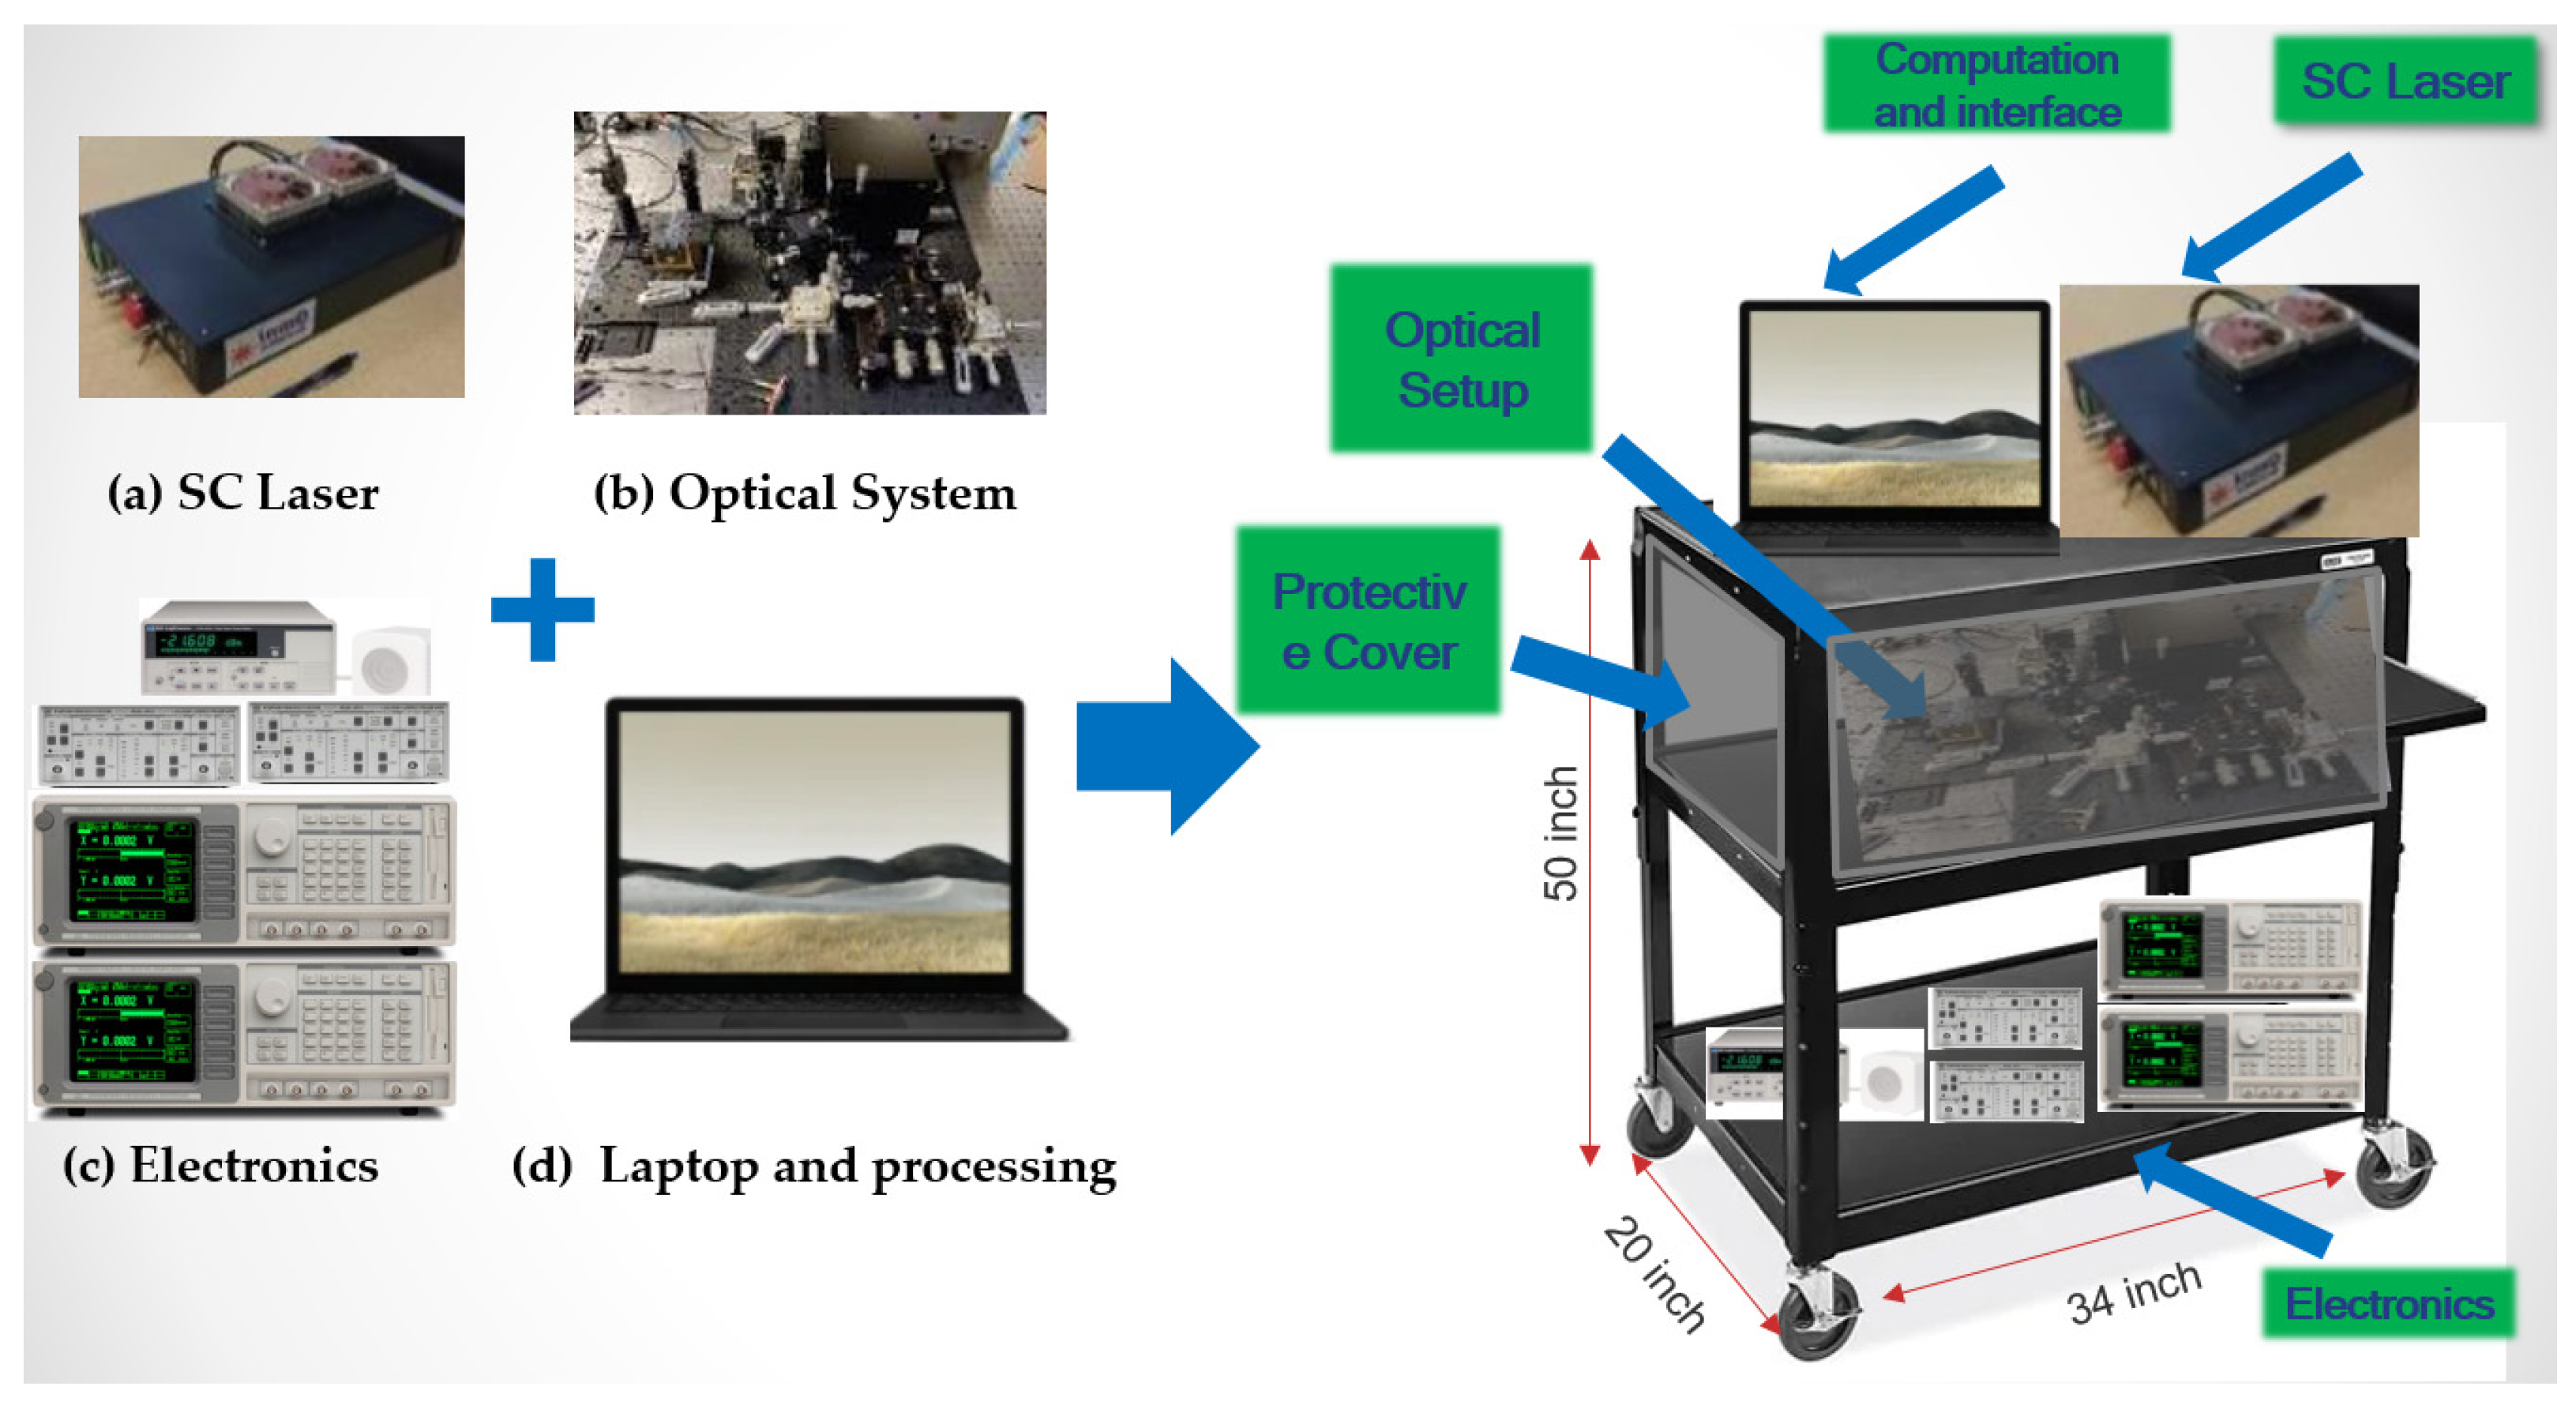
For use in laboratory and hospital settings at remote locations, a cart-based SCISCCO prototype system has been developed that integrates the hardware and software into a single, portable assembly. The ruggedness of the system was also tested for transporting to remote locations and operation within typical laboratory and hospital settings and being transportable within a hospital to various locations such operating rooms, the ICU, or the emergency department. High-level system schematics of the cart-based SCISCCO prototype are shown in
Figure 21. The various components of the system (SC laser, optical system, electronics, and laptop for processing, as shown on the left side of
Figure 21) are integrated into a cart system that can be rolled through standard hallways and doorways (right side of
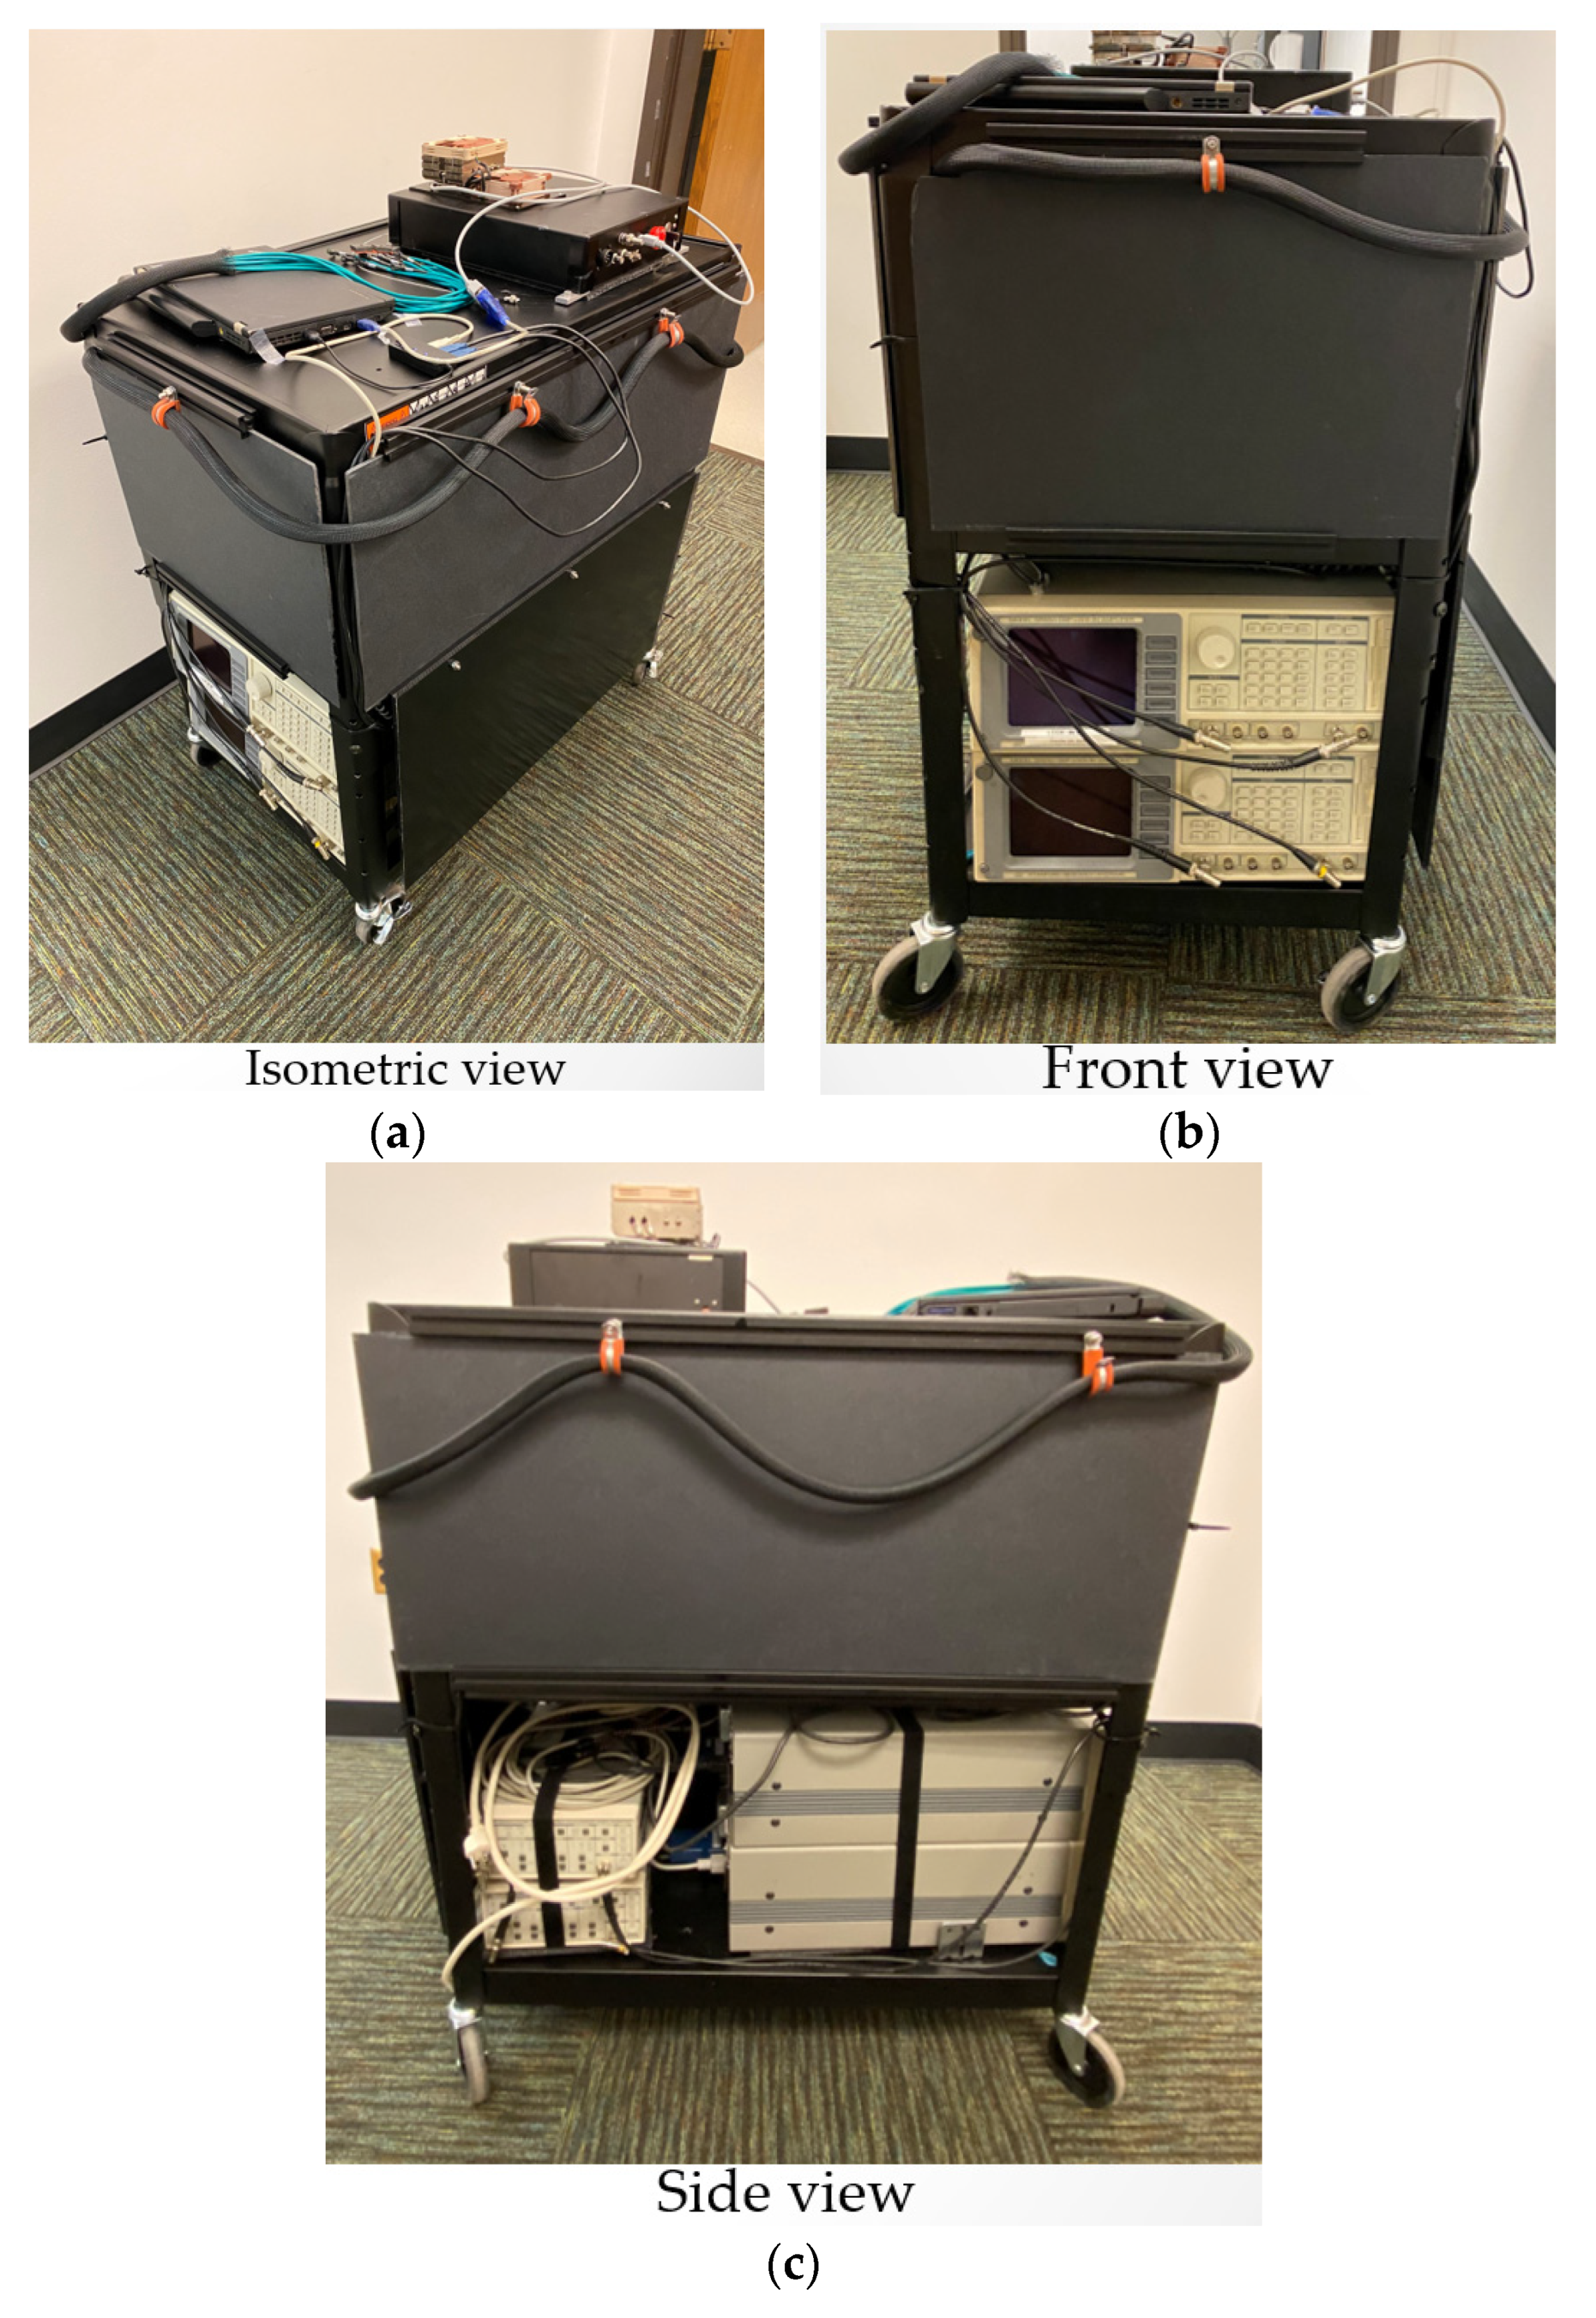
Figure 21). The rolling cart system has three levels: the top level comprises the super-continuum laser and laptop for processing, the middle level comprises the optical system hardware, and the bottom level comprises the electronics and lock-in amplifiers. Photographs of the assembled SCISCCO prototype are provided in
Figure 22. In particular,
Figure 22 illustrates (a) an isometric view of the SCISCCO prototype, (b) a front view (left), and (c) a side view of the prototype.
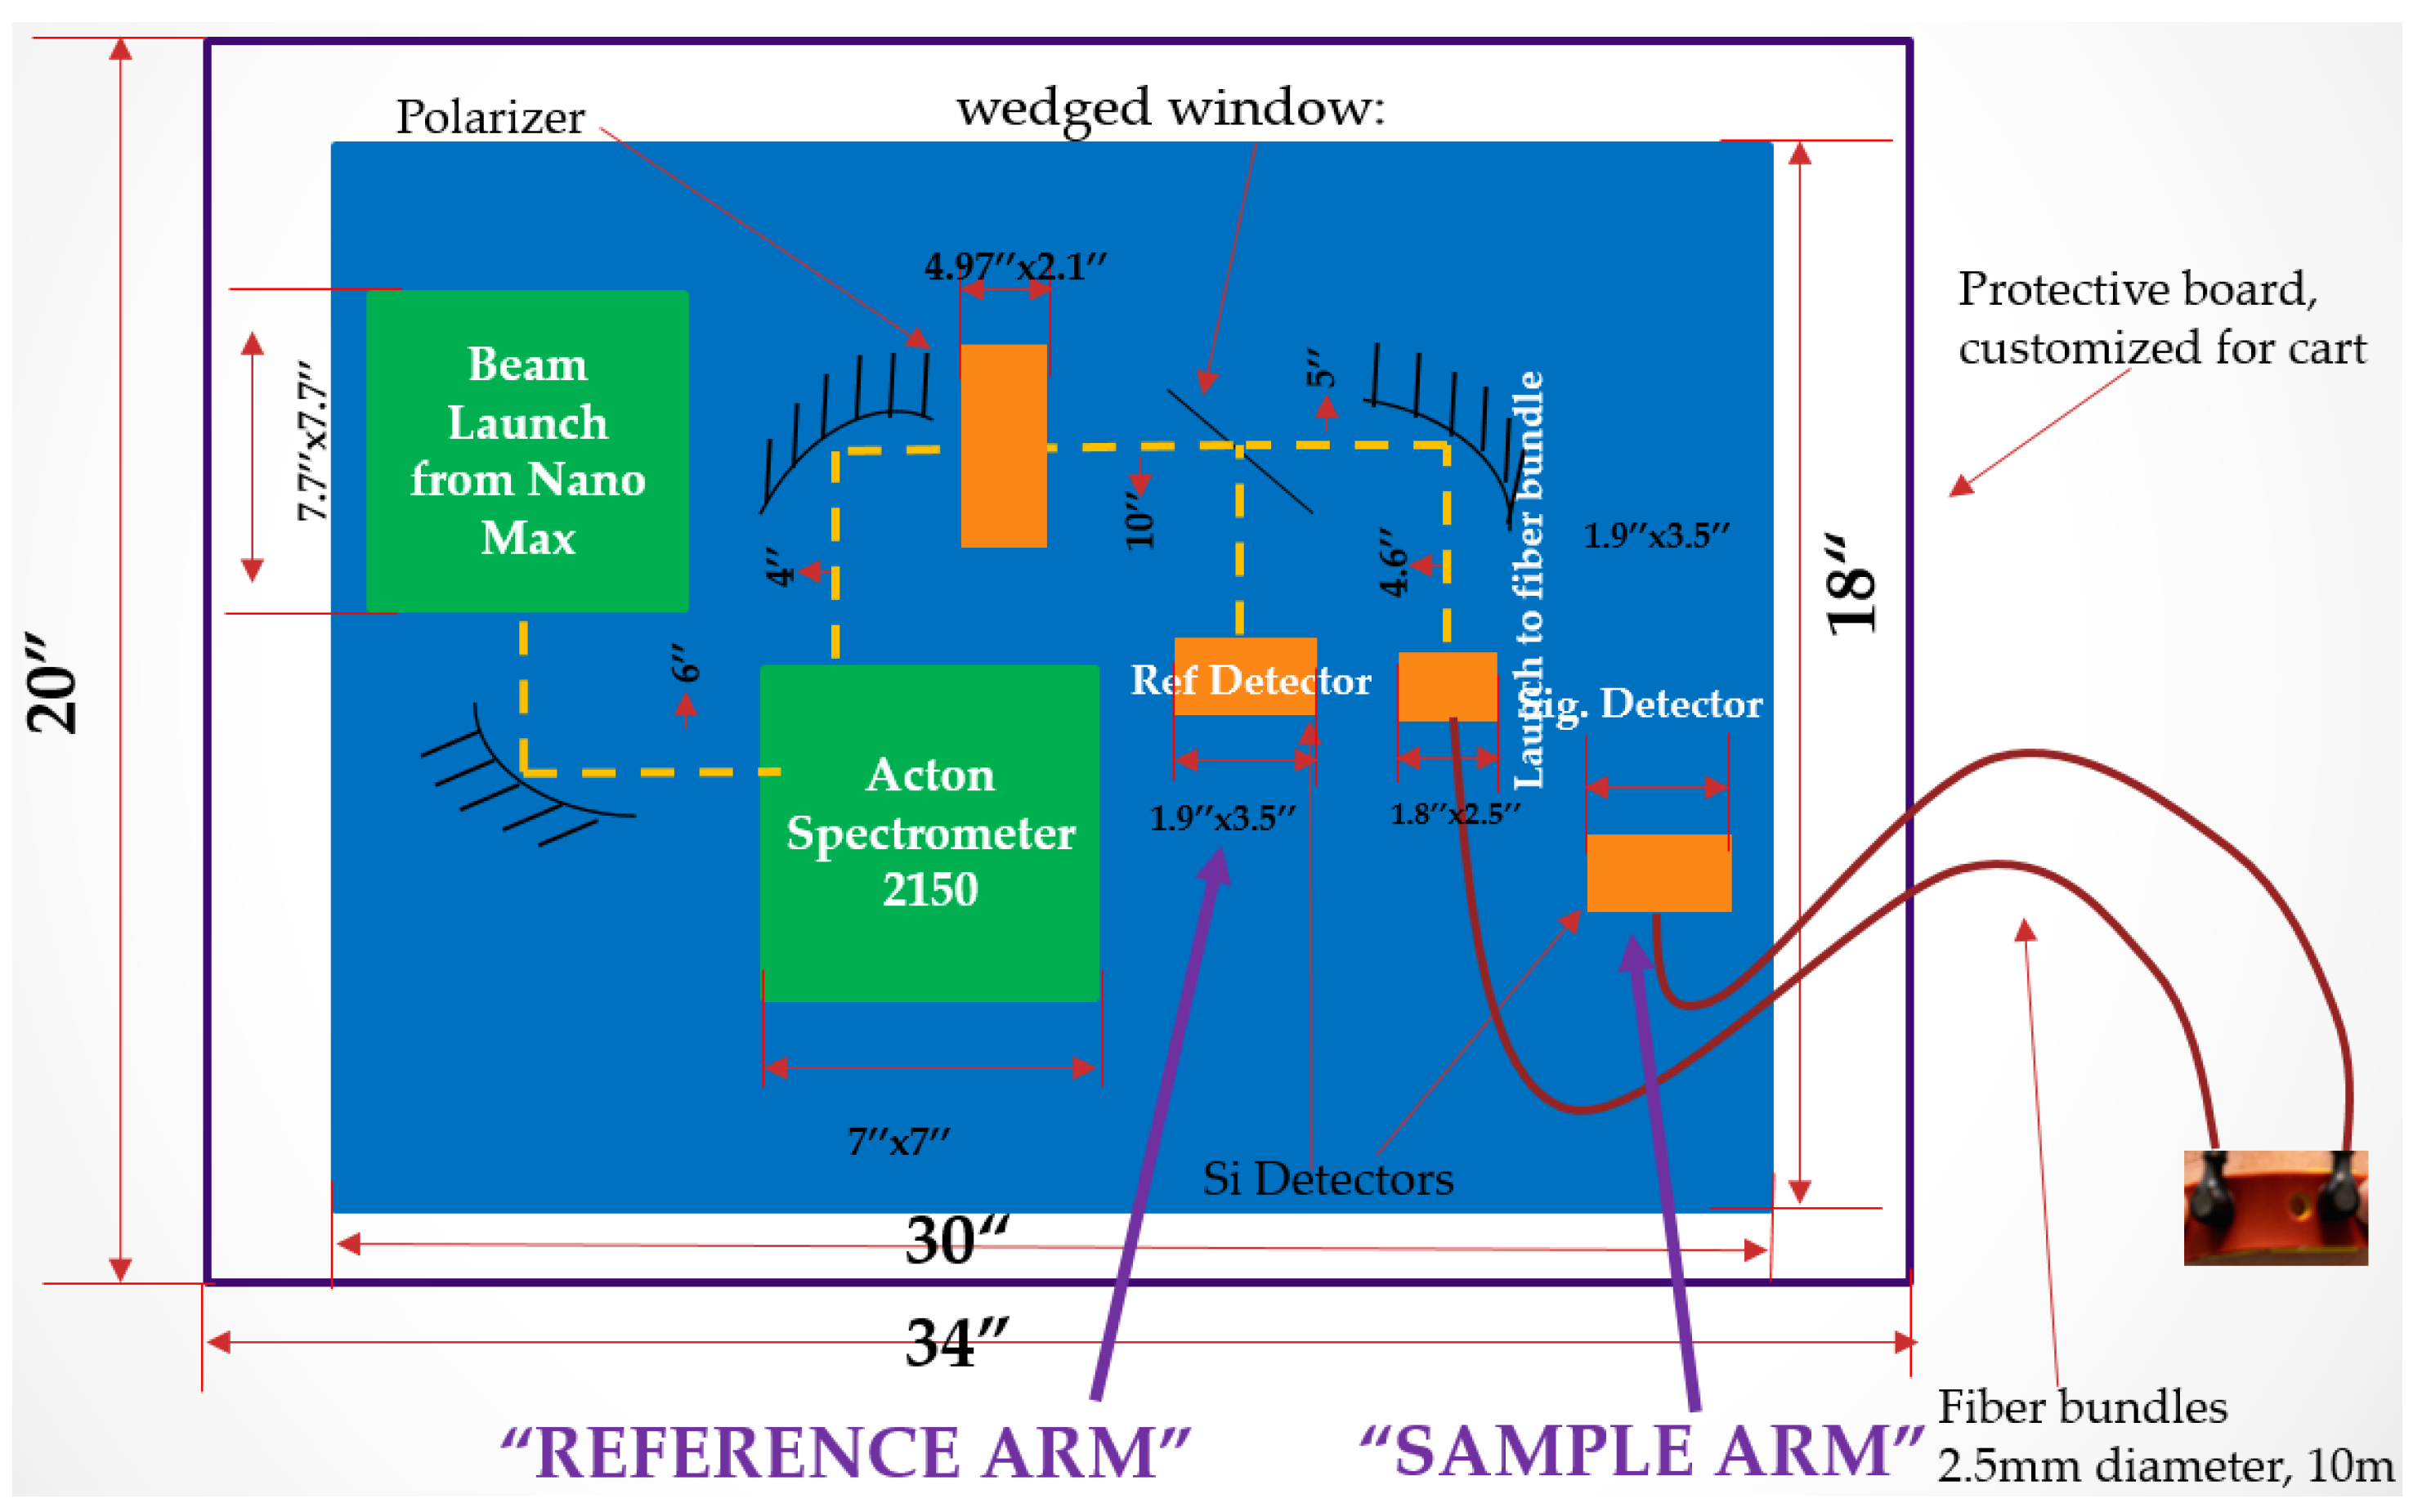
A detailed block diagram of the optical system and hardware layout (i.e., the middle level of the cart) is provided in
Figure 23. The output from the SC laser is coupled via a fiber into the NanoMax beam launcher. A turning mirror is used to direct the NanoMax output into an Acton 2150 spectrometer. The spectrometer output is then passed through a polarizer, and a wedged window is used to split the beam after the polarizer into a reference arm and a sample arm. The sample arm is coupled to a fiber to deliver to the target, and the return light is then collected and coupled through another fiber to the detector. The fibers in the reference arm to and from the target are 10 m in length and 2.5 mm in diameter.
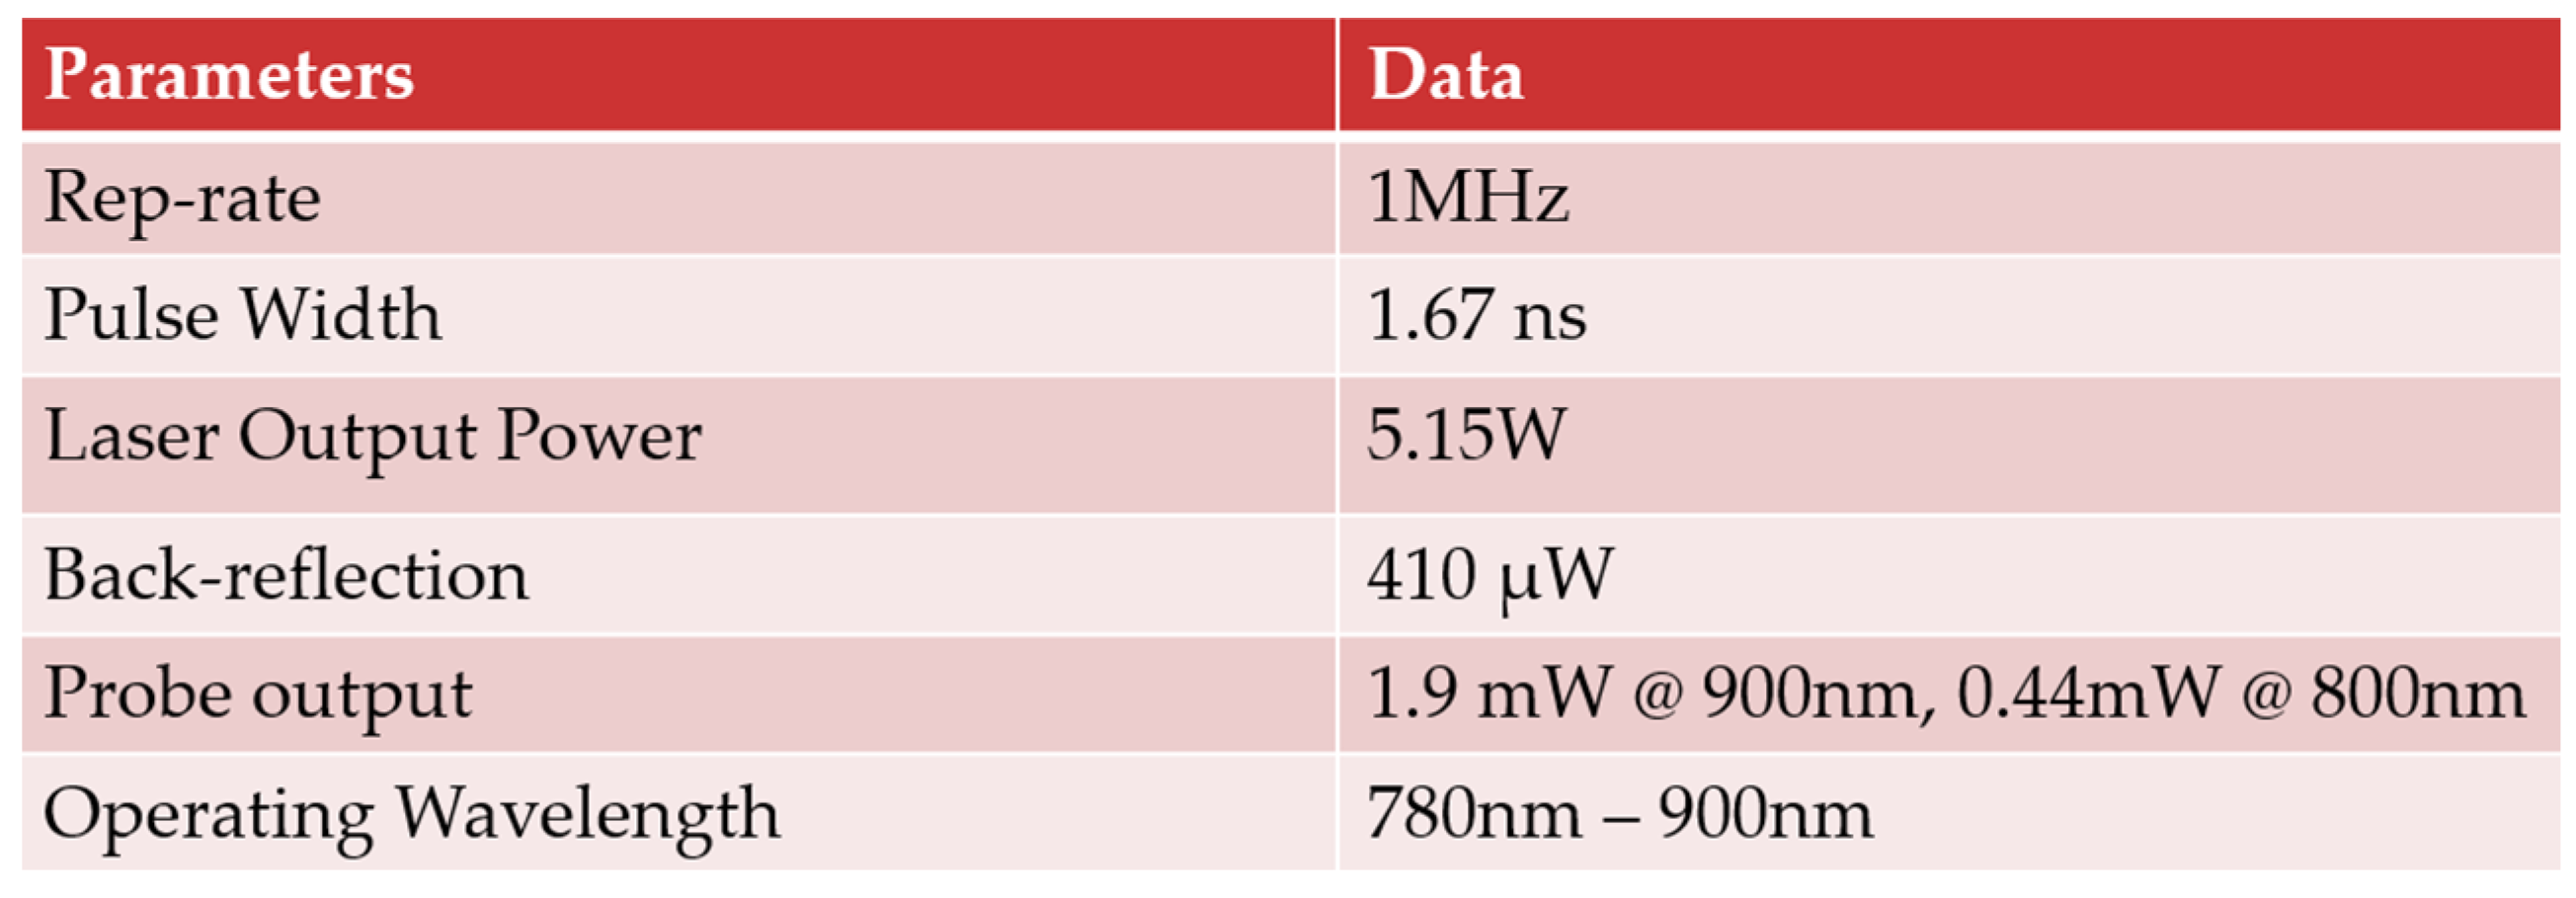
Figure 24 summarizes the measured performance metrics for the cart-based SCISSCO prototype. The SC laser was adjusted to a pulse repetition rate of 1 MHz, and the output pulse width was approximately 1.67 ns. The SC time-averaged laser output power was 5.15 W, and the back-reflection into the laser was measured to be 410 microwatts. The output from the fiber probe delivered to the target was 1.9 mW at a 900-nm wavelength and 0.44 W at a 800-nm wavelength. The SCISCCO system was tuned through the spectrometer between 780 nm and 900 nm, thus enabling the CCO and hemodynamic response measurements.
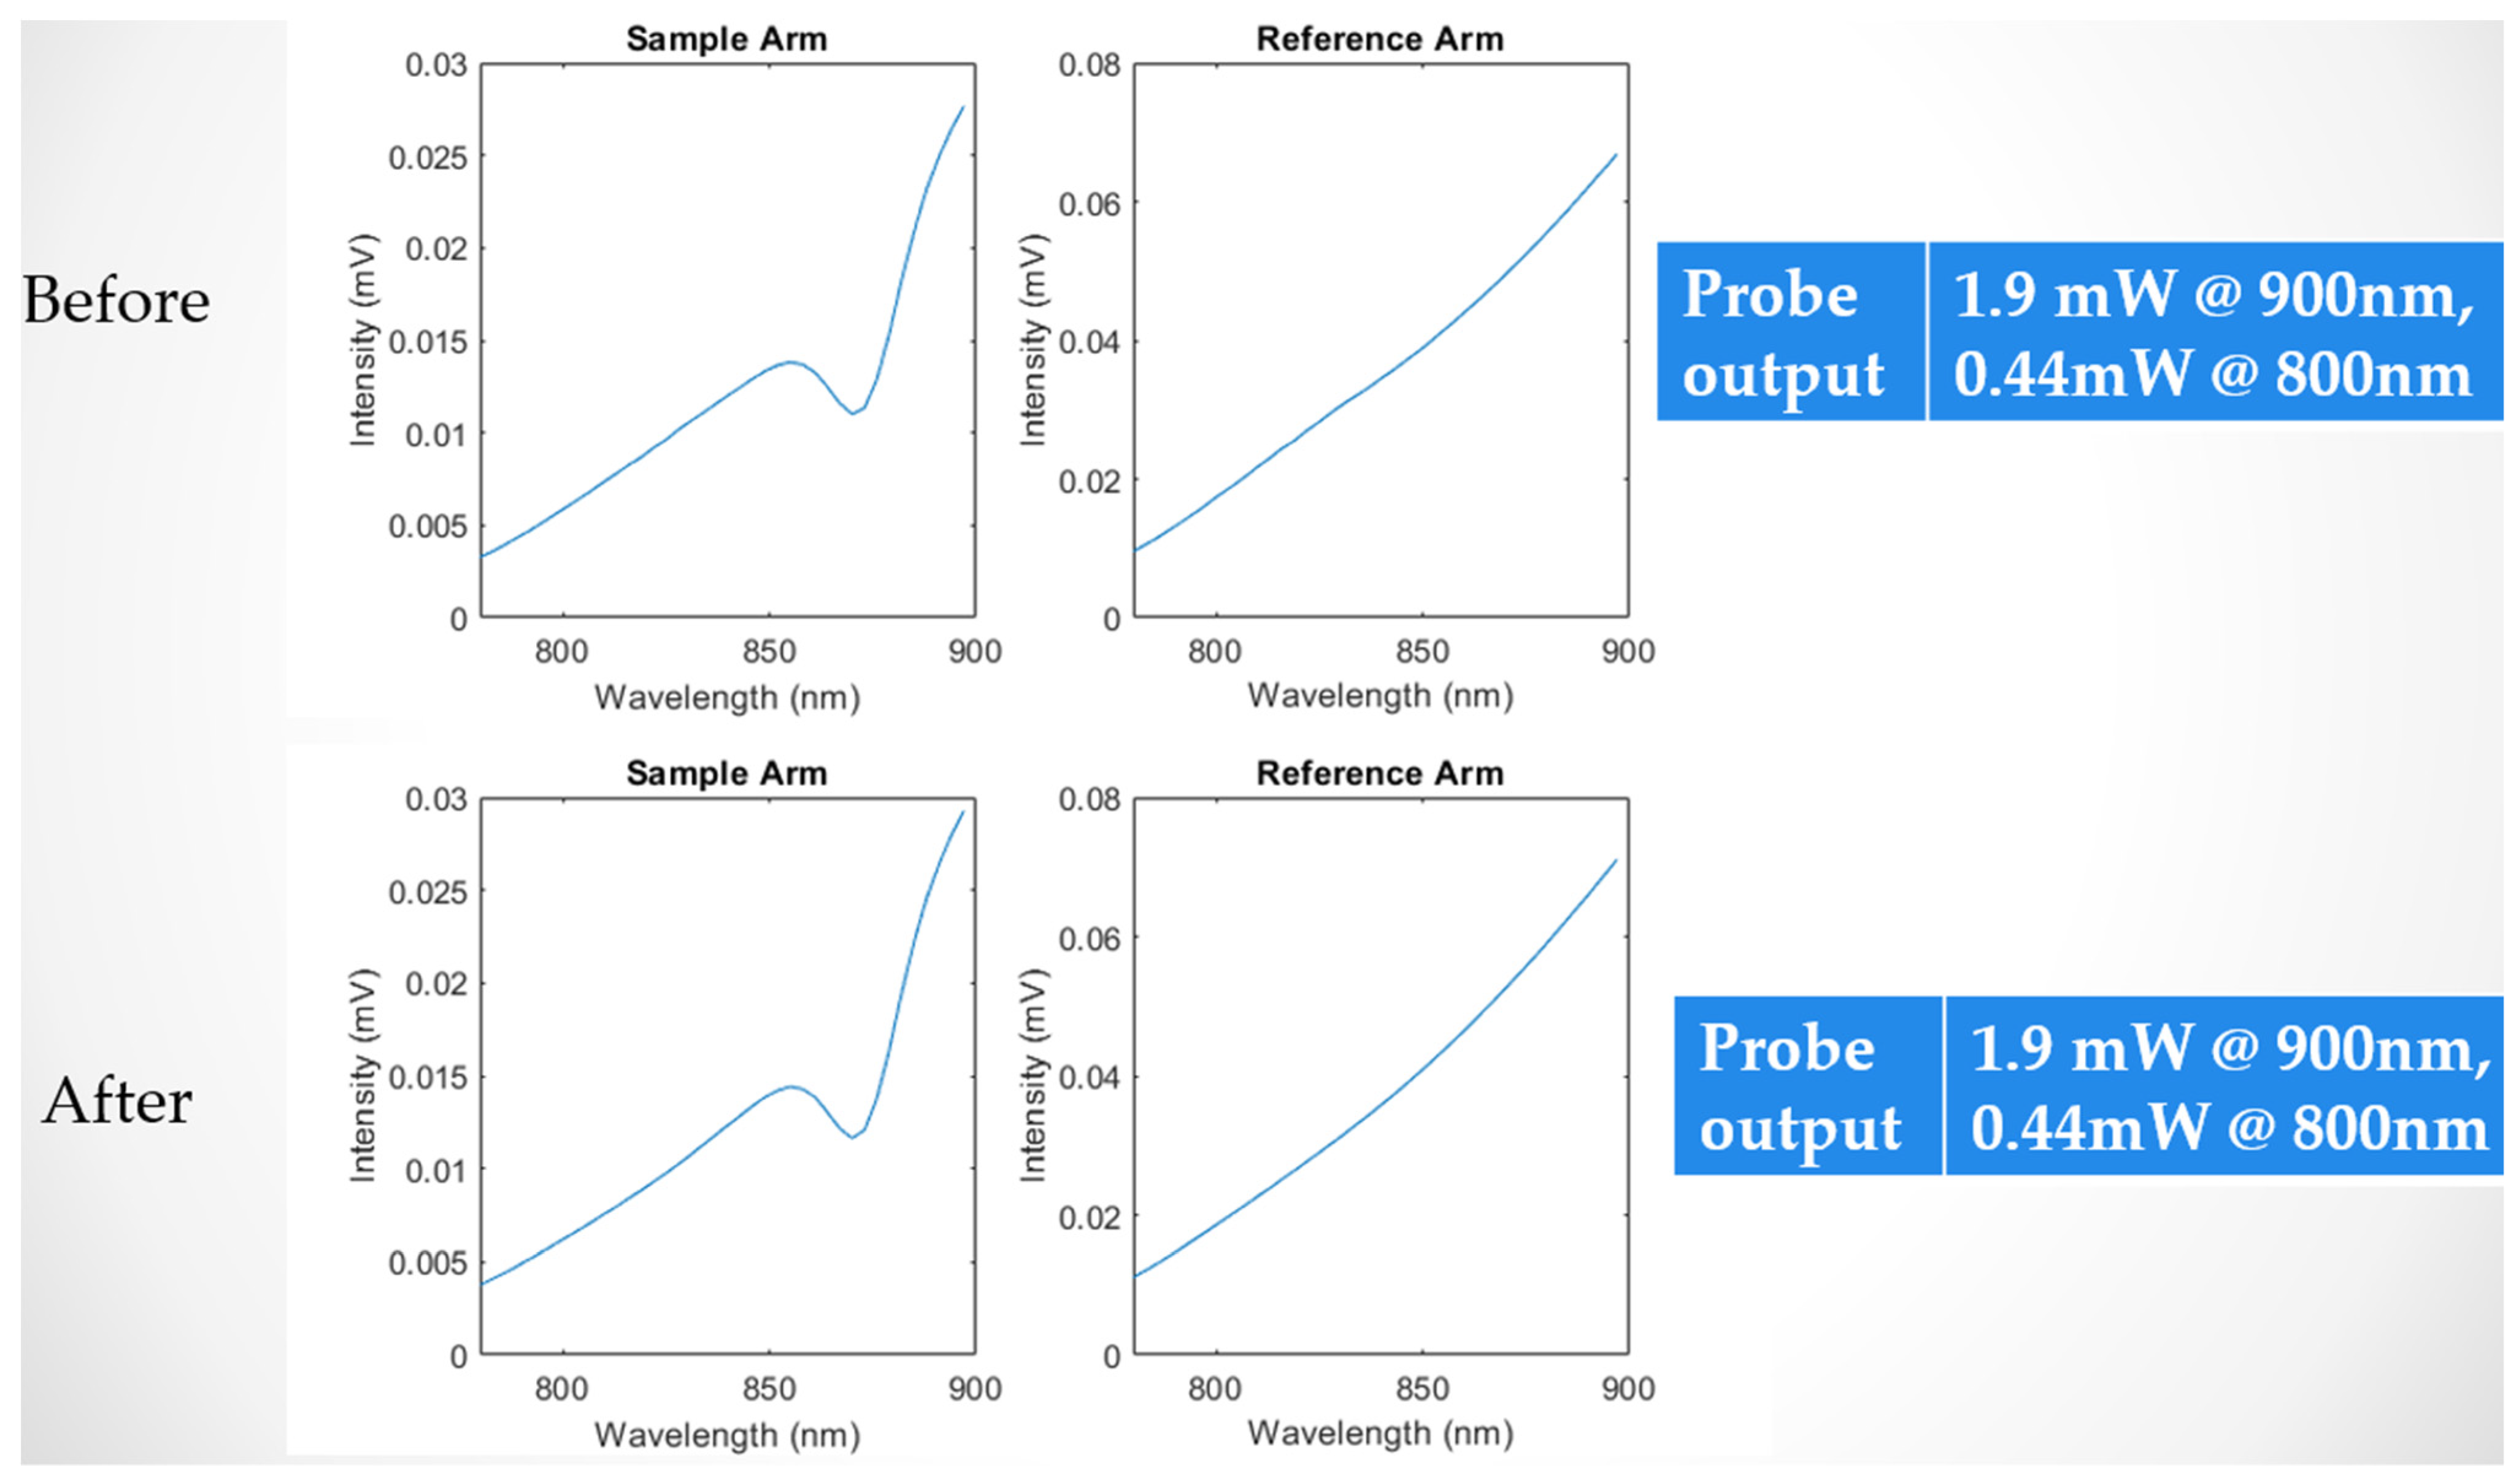
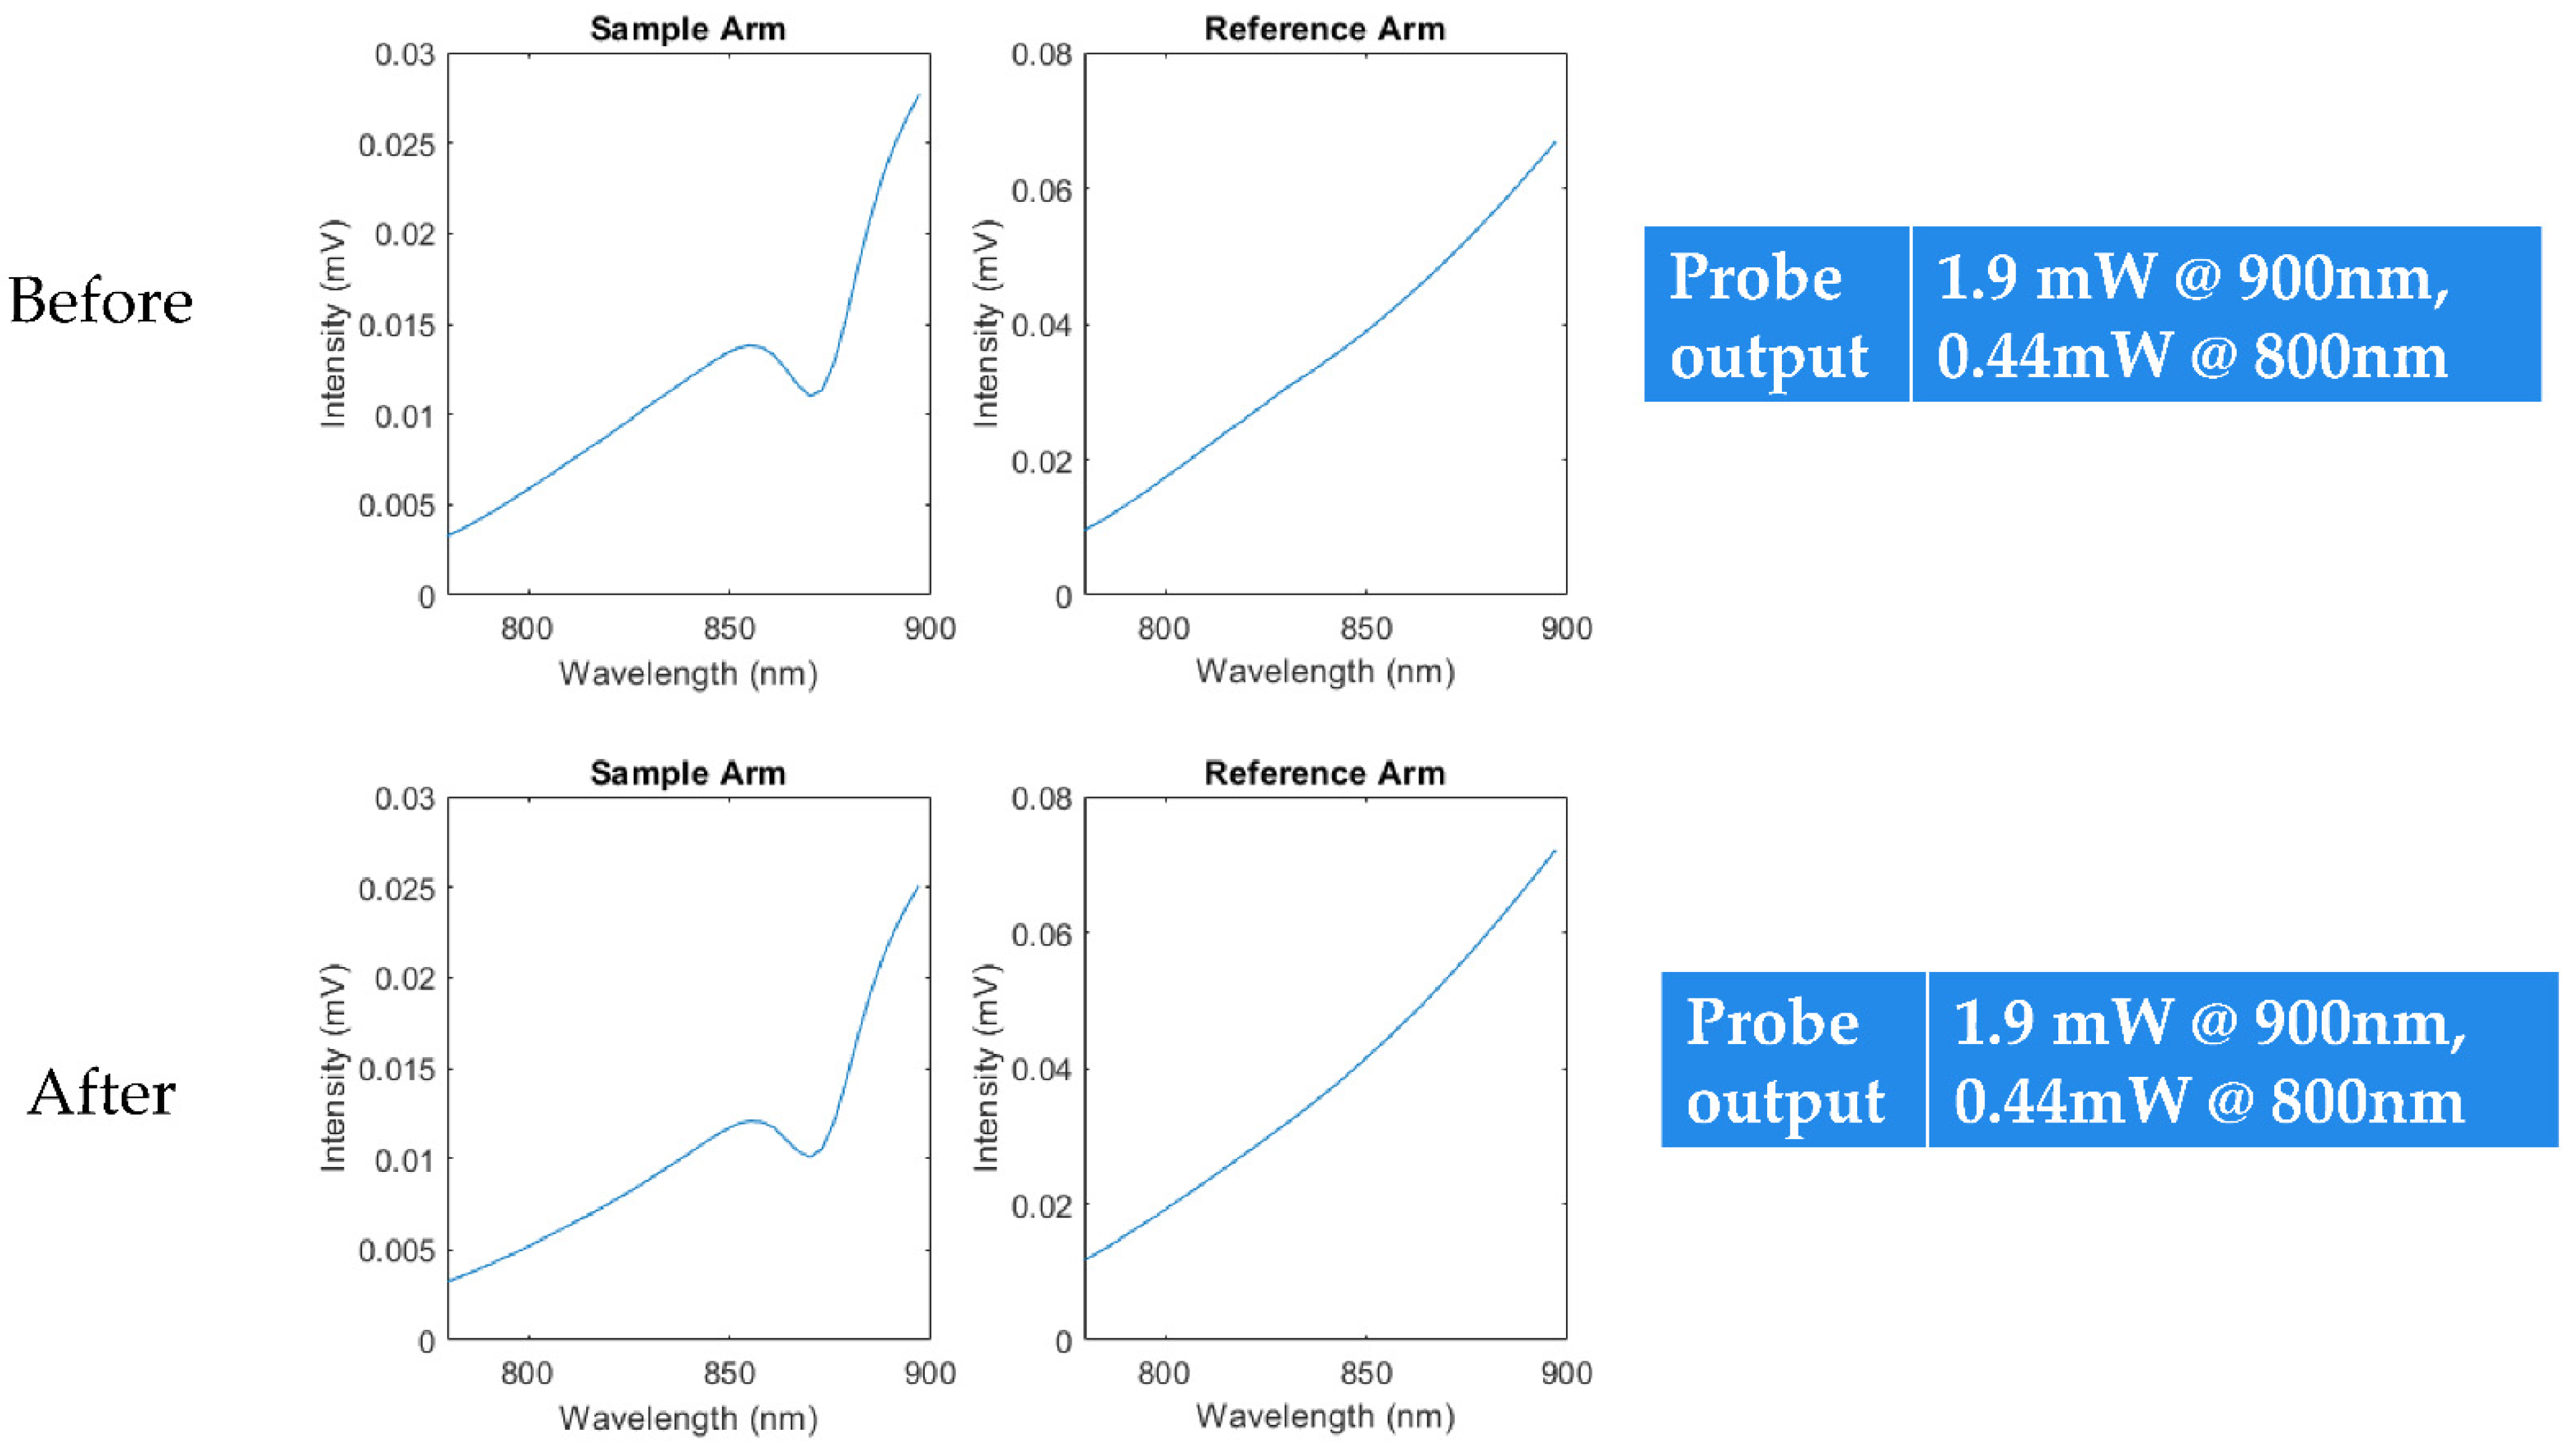
All of the components in the SCISCCO prototype were mechanically secured to enable the cart unit to move in a lab or hospital setting as well as be transportable via a vehicle from one location to another. For example, the SCISCCO prototype was transported from the University of Michigan in Ann Arbor to Northwestern University Medical Center in Chicago for the animal testing (described further in the next section). To verify the stability of the SCISCCO system, we first rolled the cart system across brick hallways indoors and measured the spectrum and SNR before and after the movement. For instance,
Figure 25 illustrates the spectrum of the sample and reference arm (from
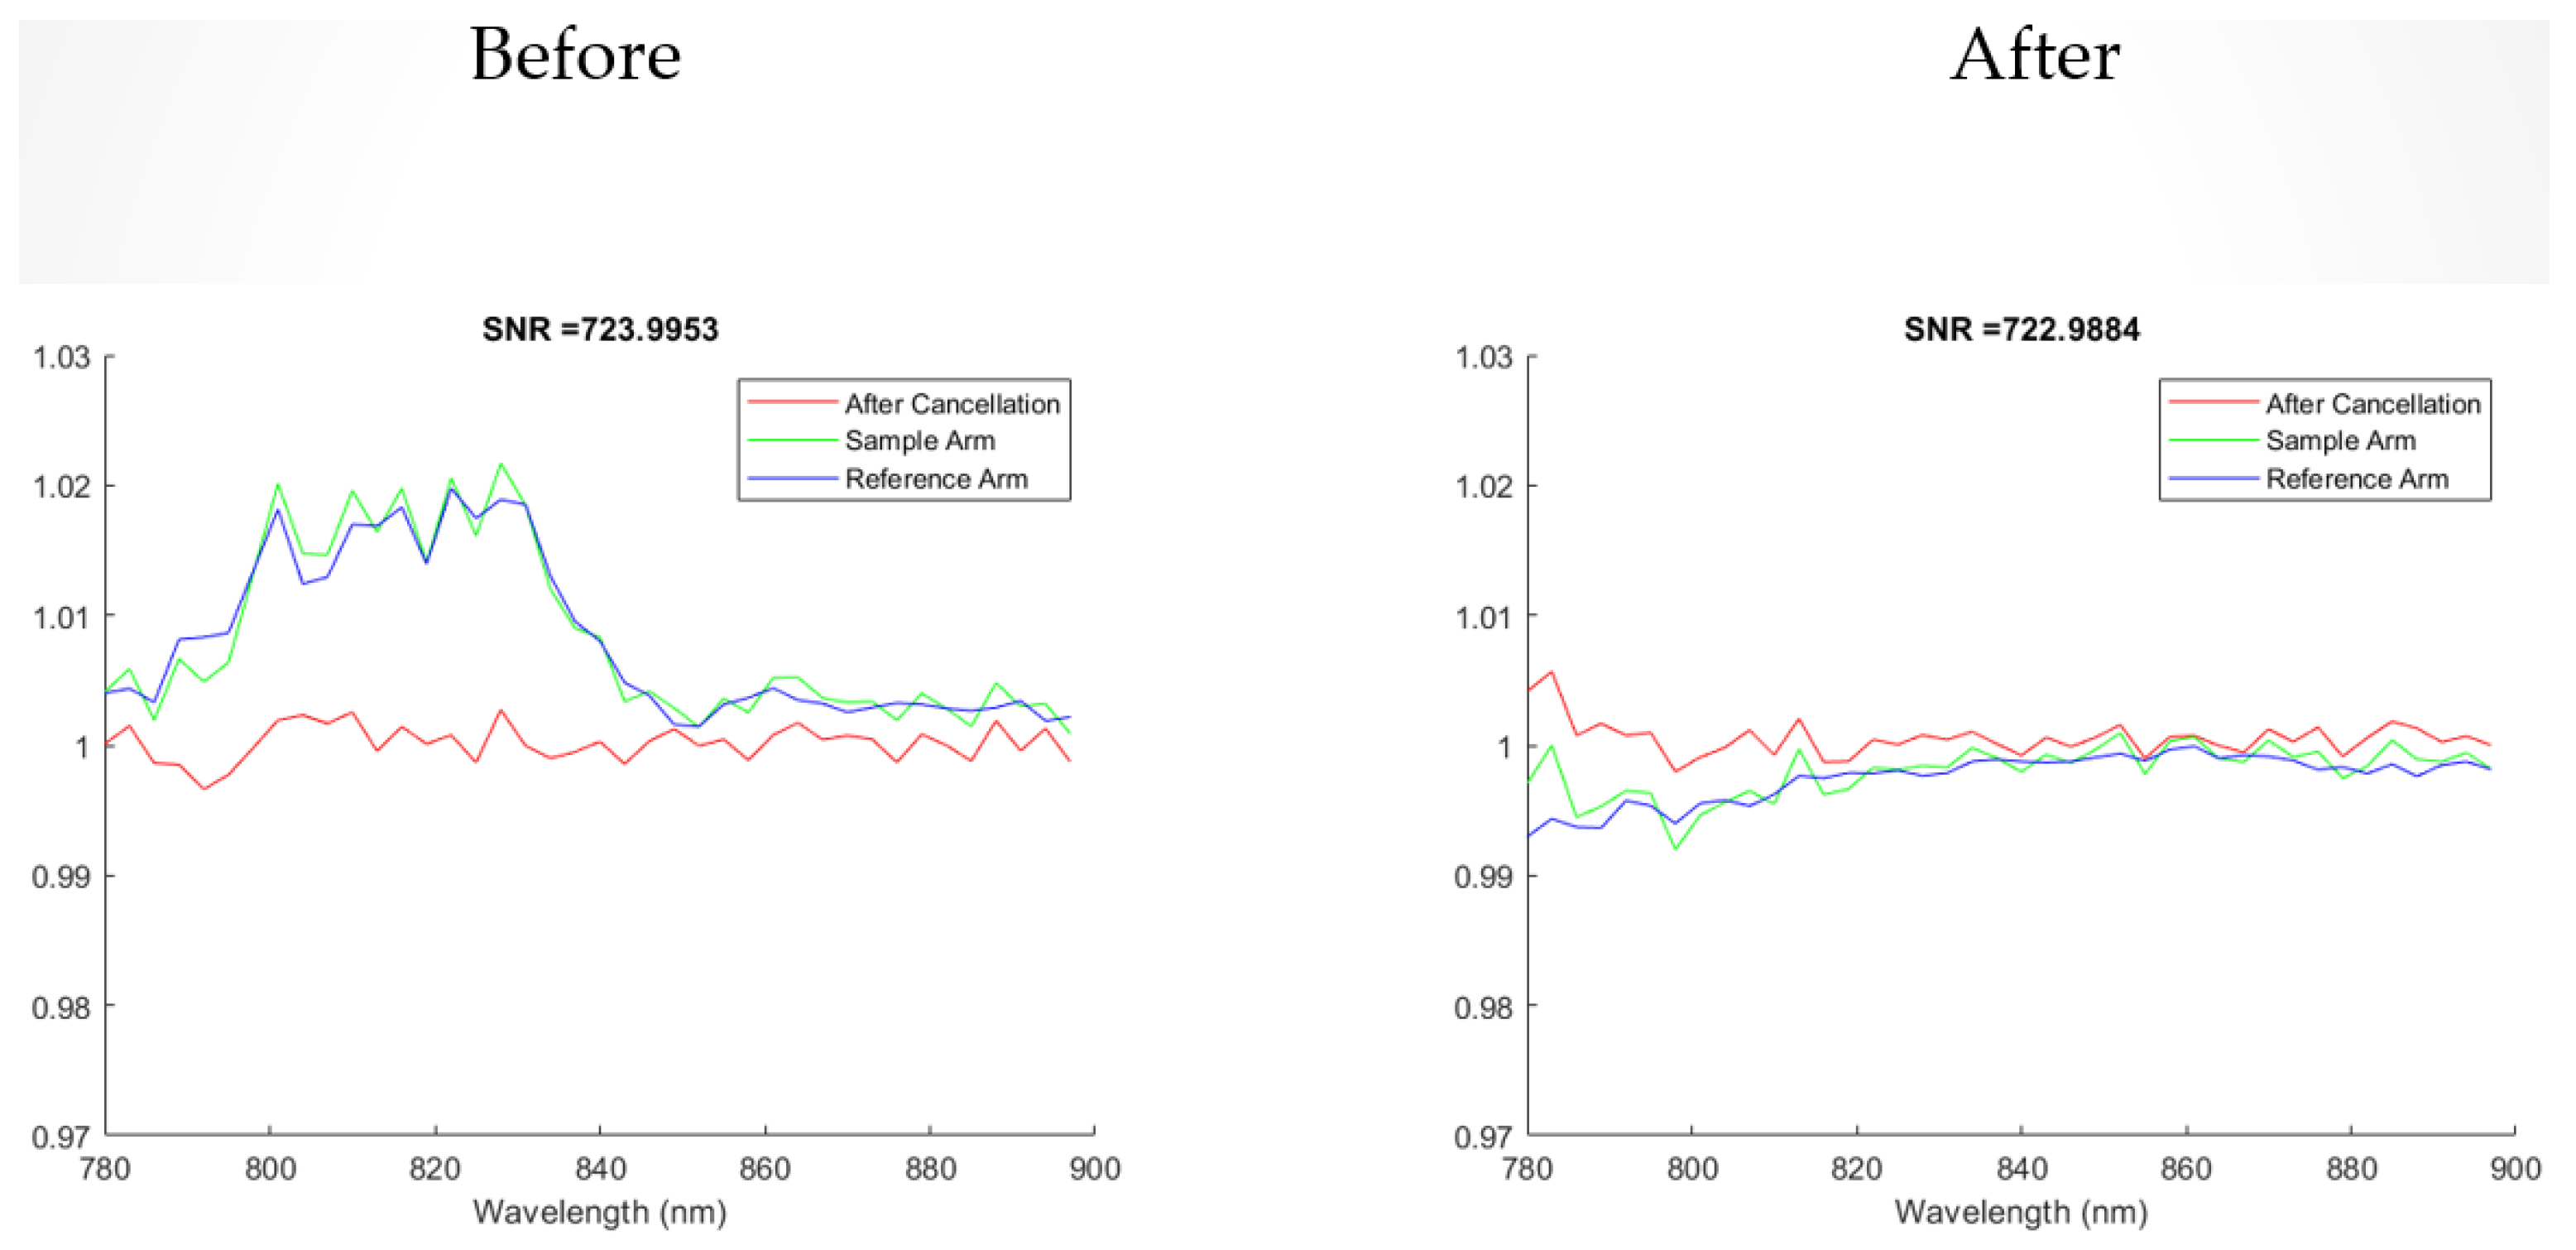
Figure 24) before and after the shaking movement, where a polystyrene scattering medium was used in the sample arm for testing. In addition, the SNR of the sample arm, the reference arm, and the sample divided by the reference (the “after cancellation”) are shown in
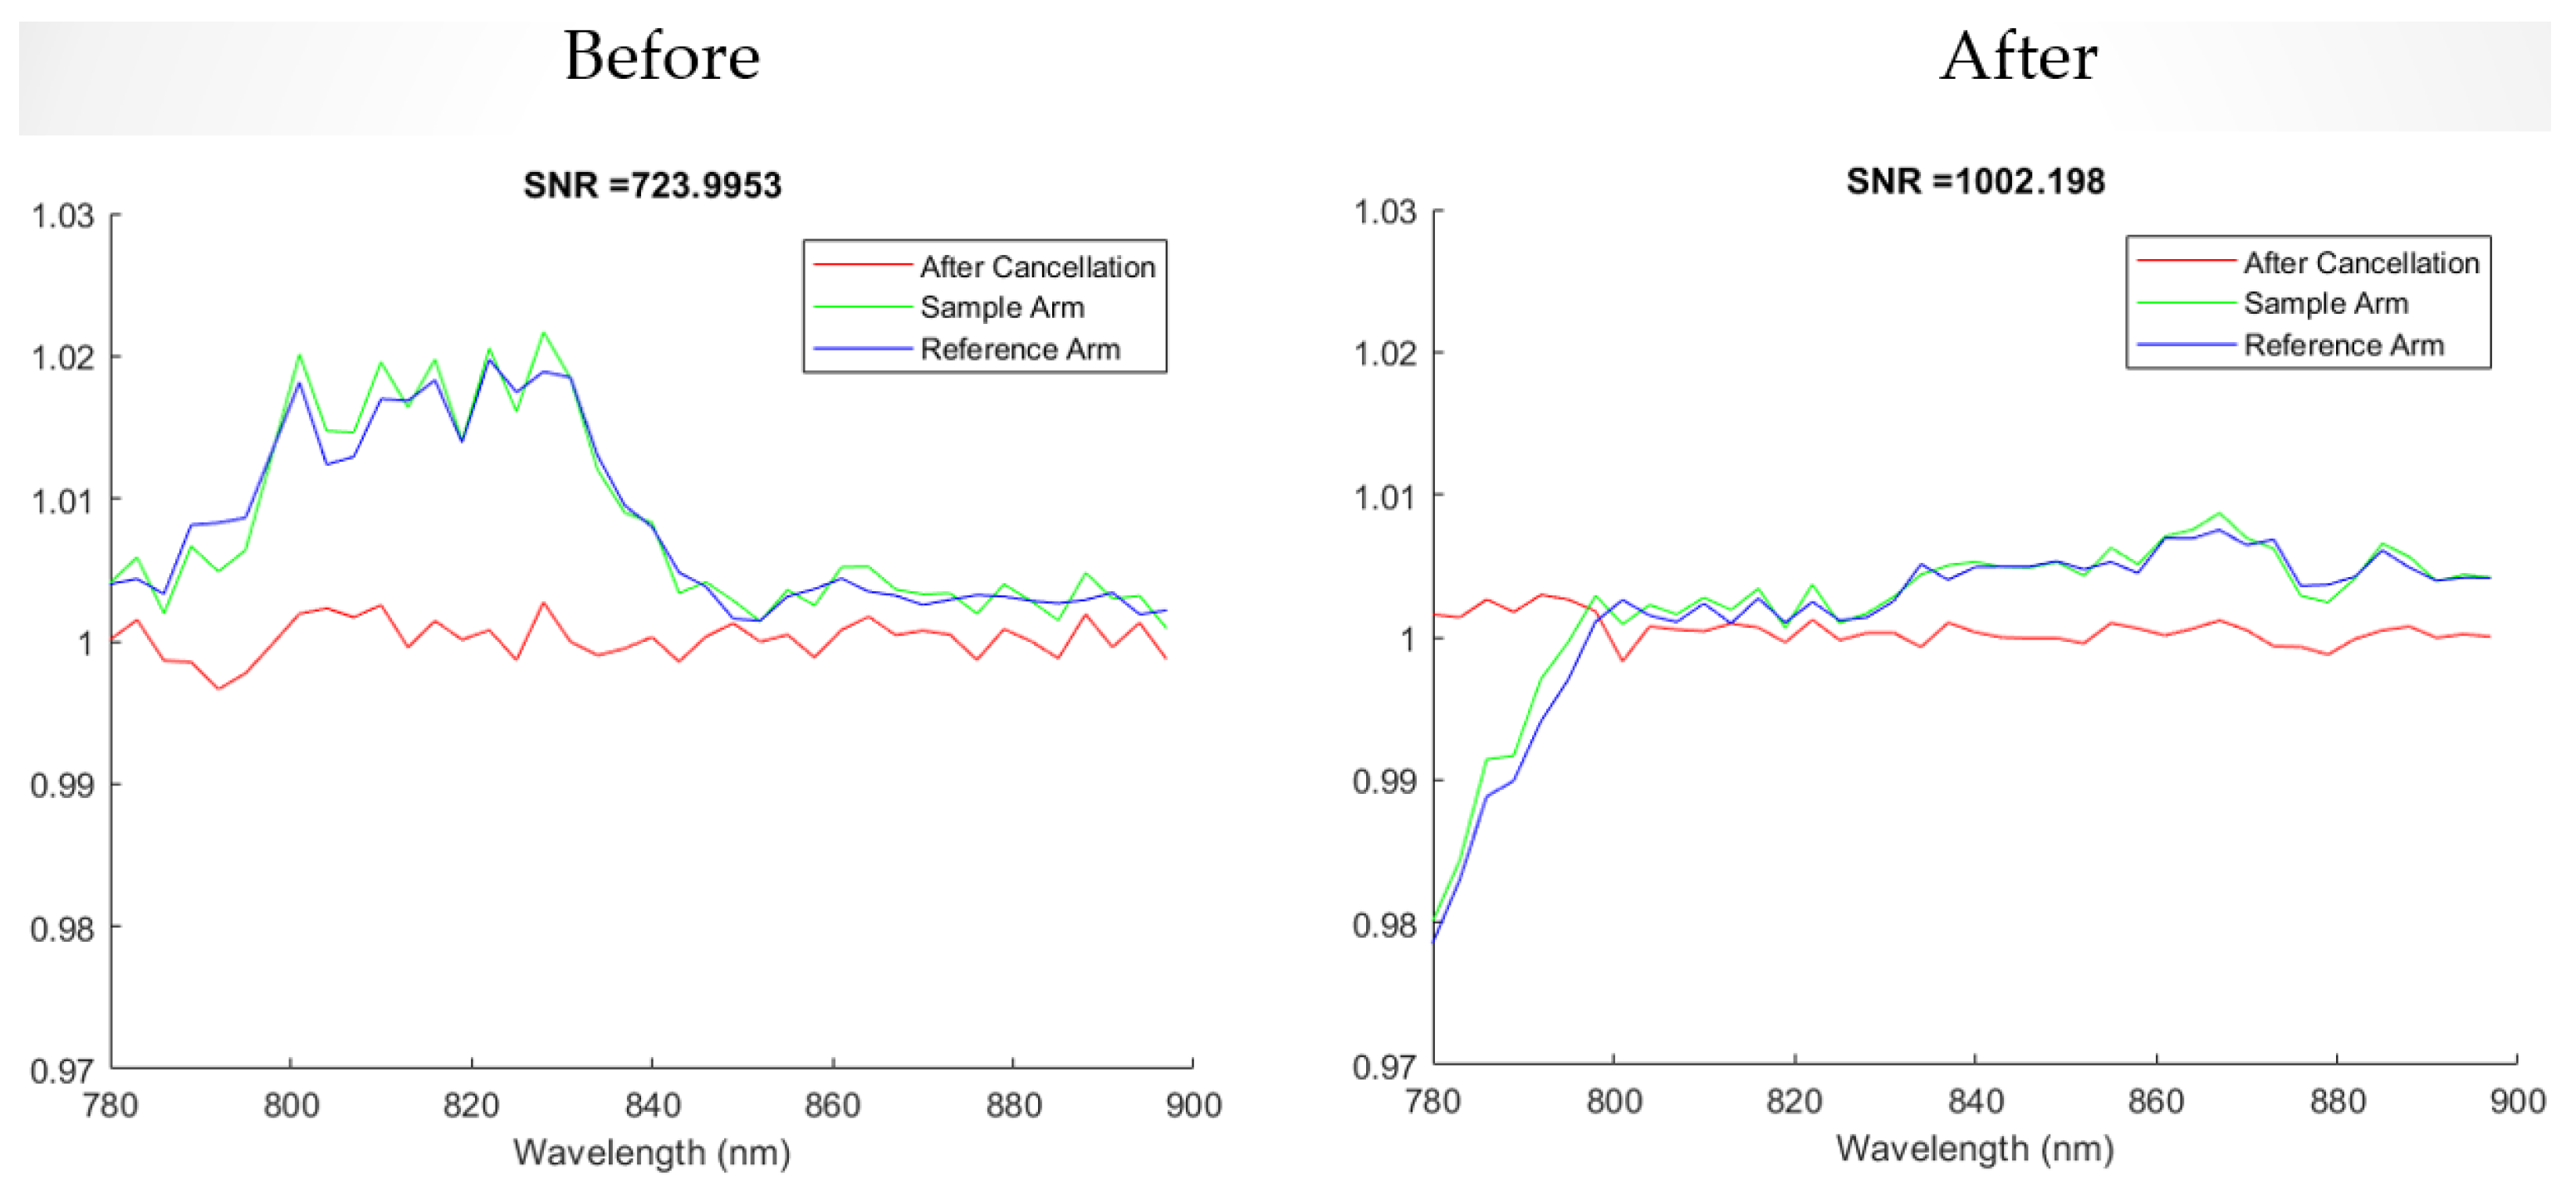
Figure 26 before and after the movement. In both instances, the after cancellation remained very close to one, which is indicative of the overall stability of the system. Beyond the indoor tests, the cart-based SCISCCO prototype was also transported over local paved and dirt Michigan roads in a van to verify that it was stable enough to be transported between different locations.
Figure 27 shows that the spectrum remained stable, while
Figure 28 shows that the SNR remained stable, with the after cancellation staying close to one.
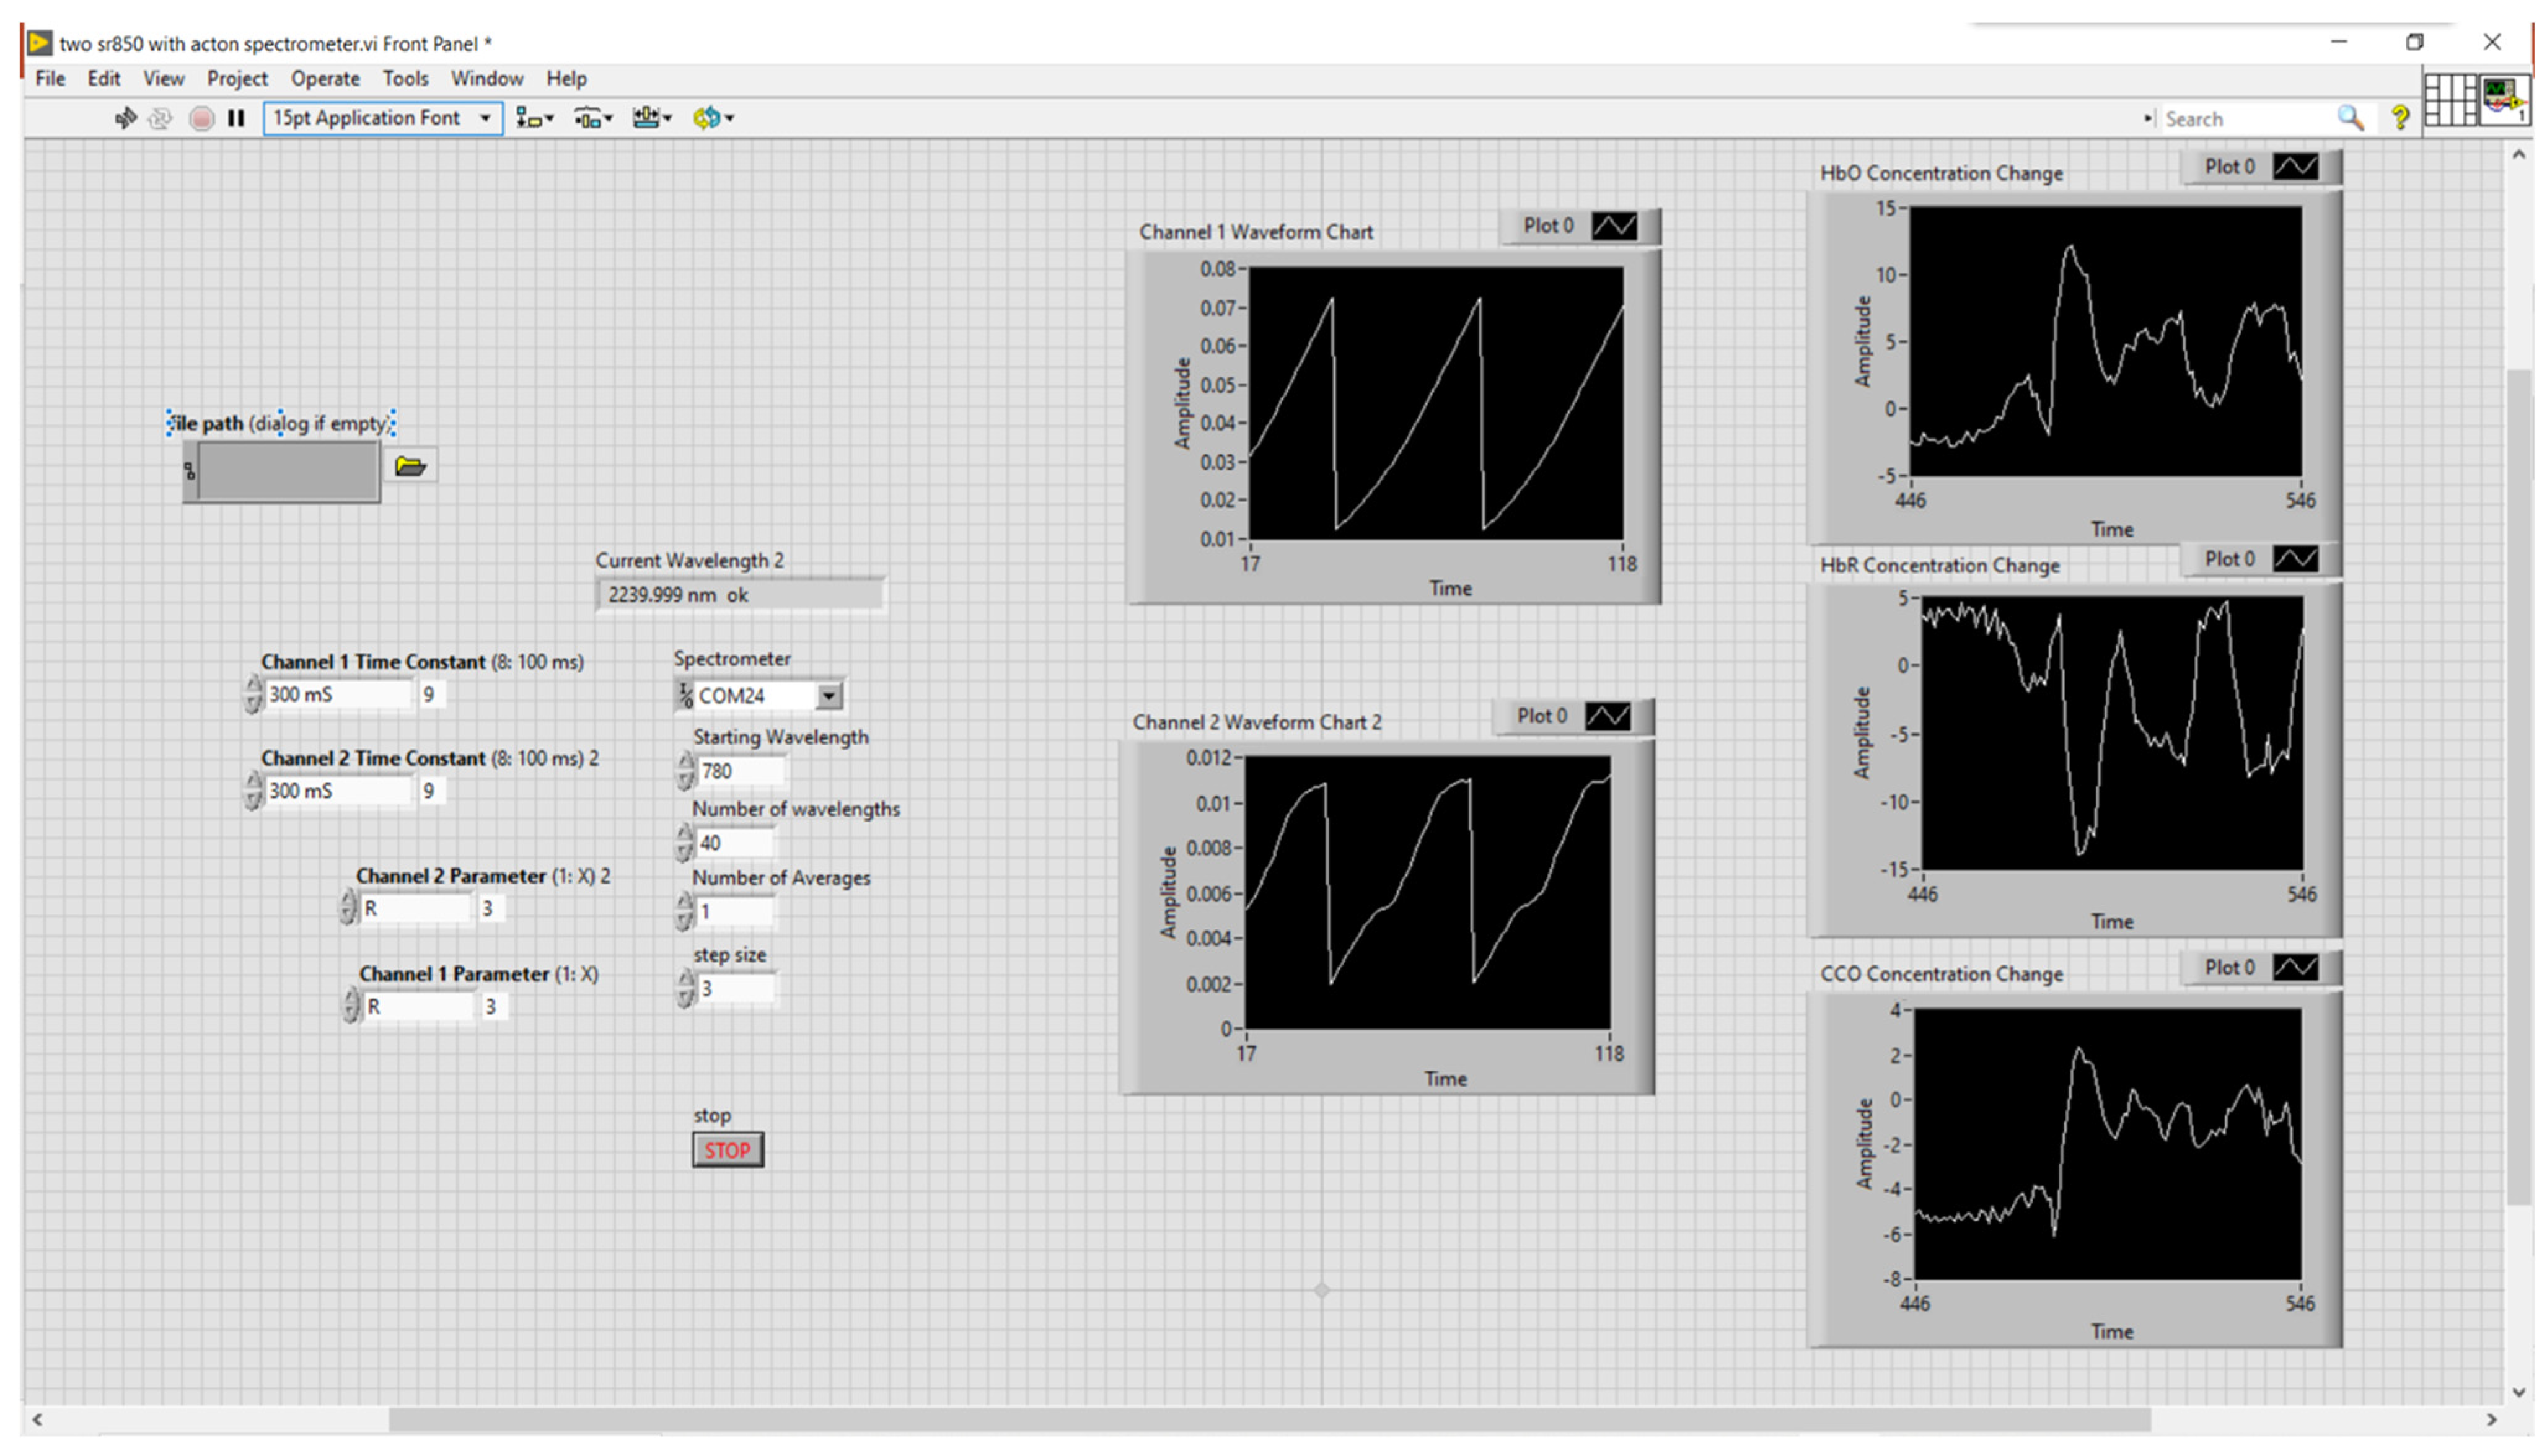
For convenient use by trained personnel, software with a simple graphical user interface was developed that displayed the input parameters and output data. A screenshot of the SCISCCO software user interface is provided in
Figure 29, where the left side corresponds to the input module, where the user inputs various parameters, while the right side corresponds to the output plots of the data as a function of the measurement time.
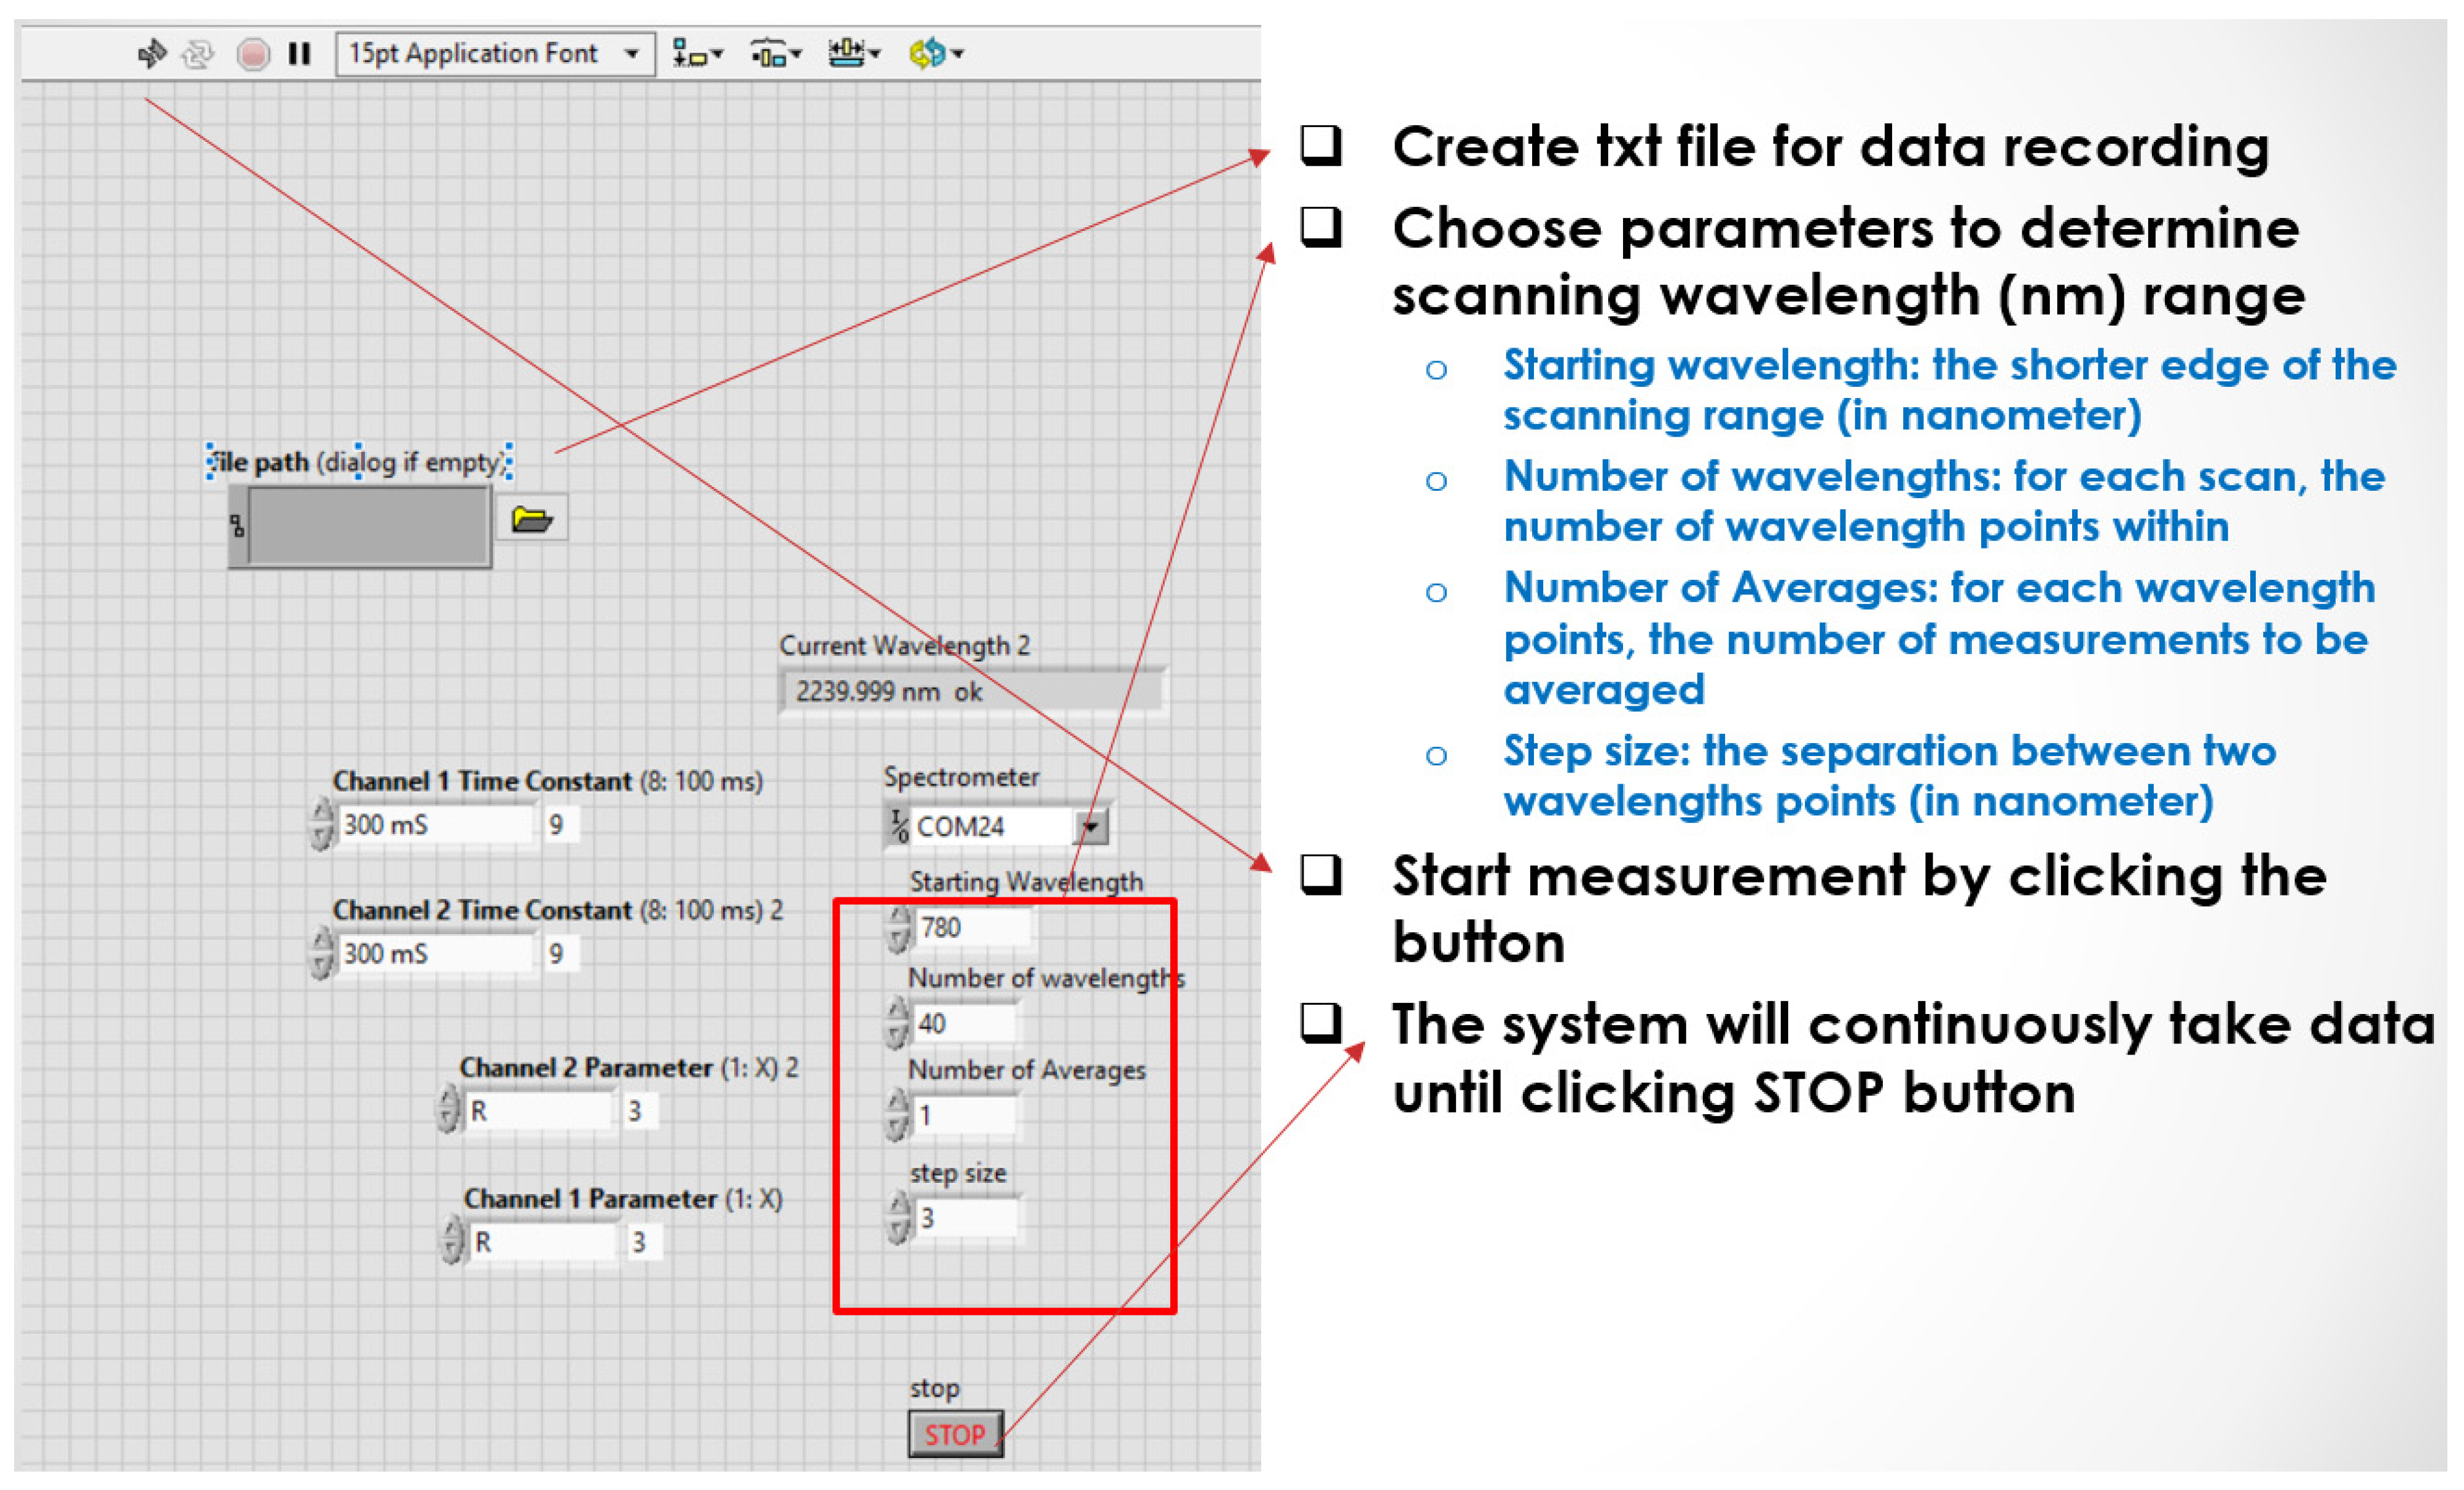
Figure 30 provides more details on the input parameters for the measurement that were set by the user, which include the data file name, parameters for the scanning range of the spectrometer, a start button for beginning the data collection, and a stop button to complete the data collection.
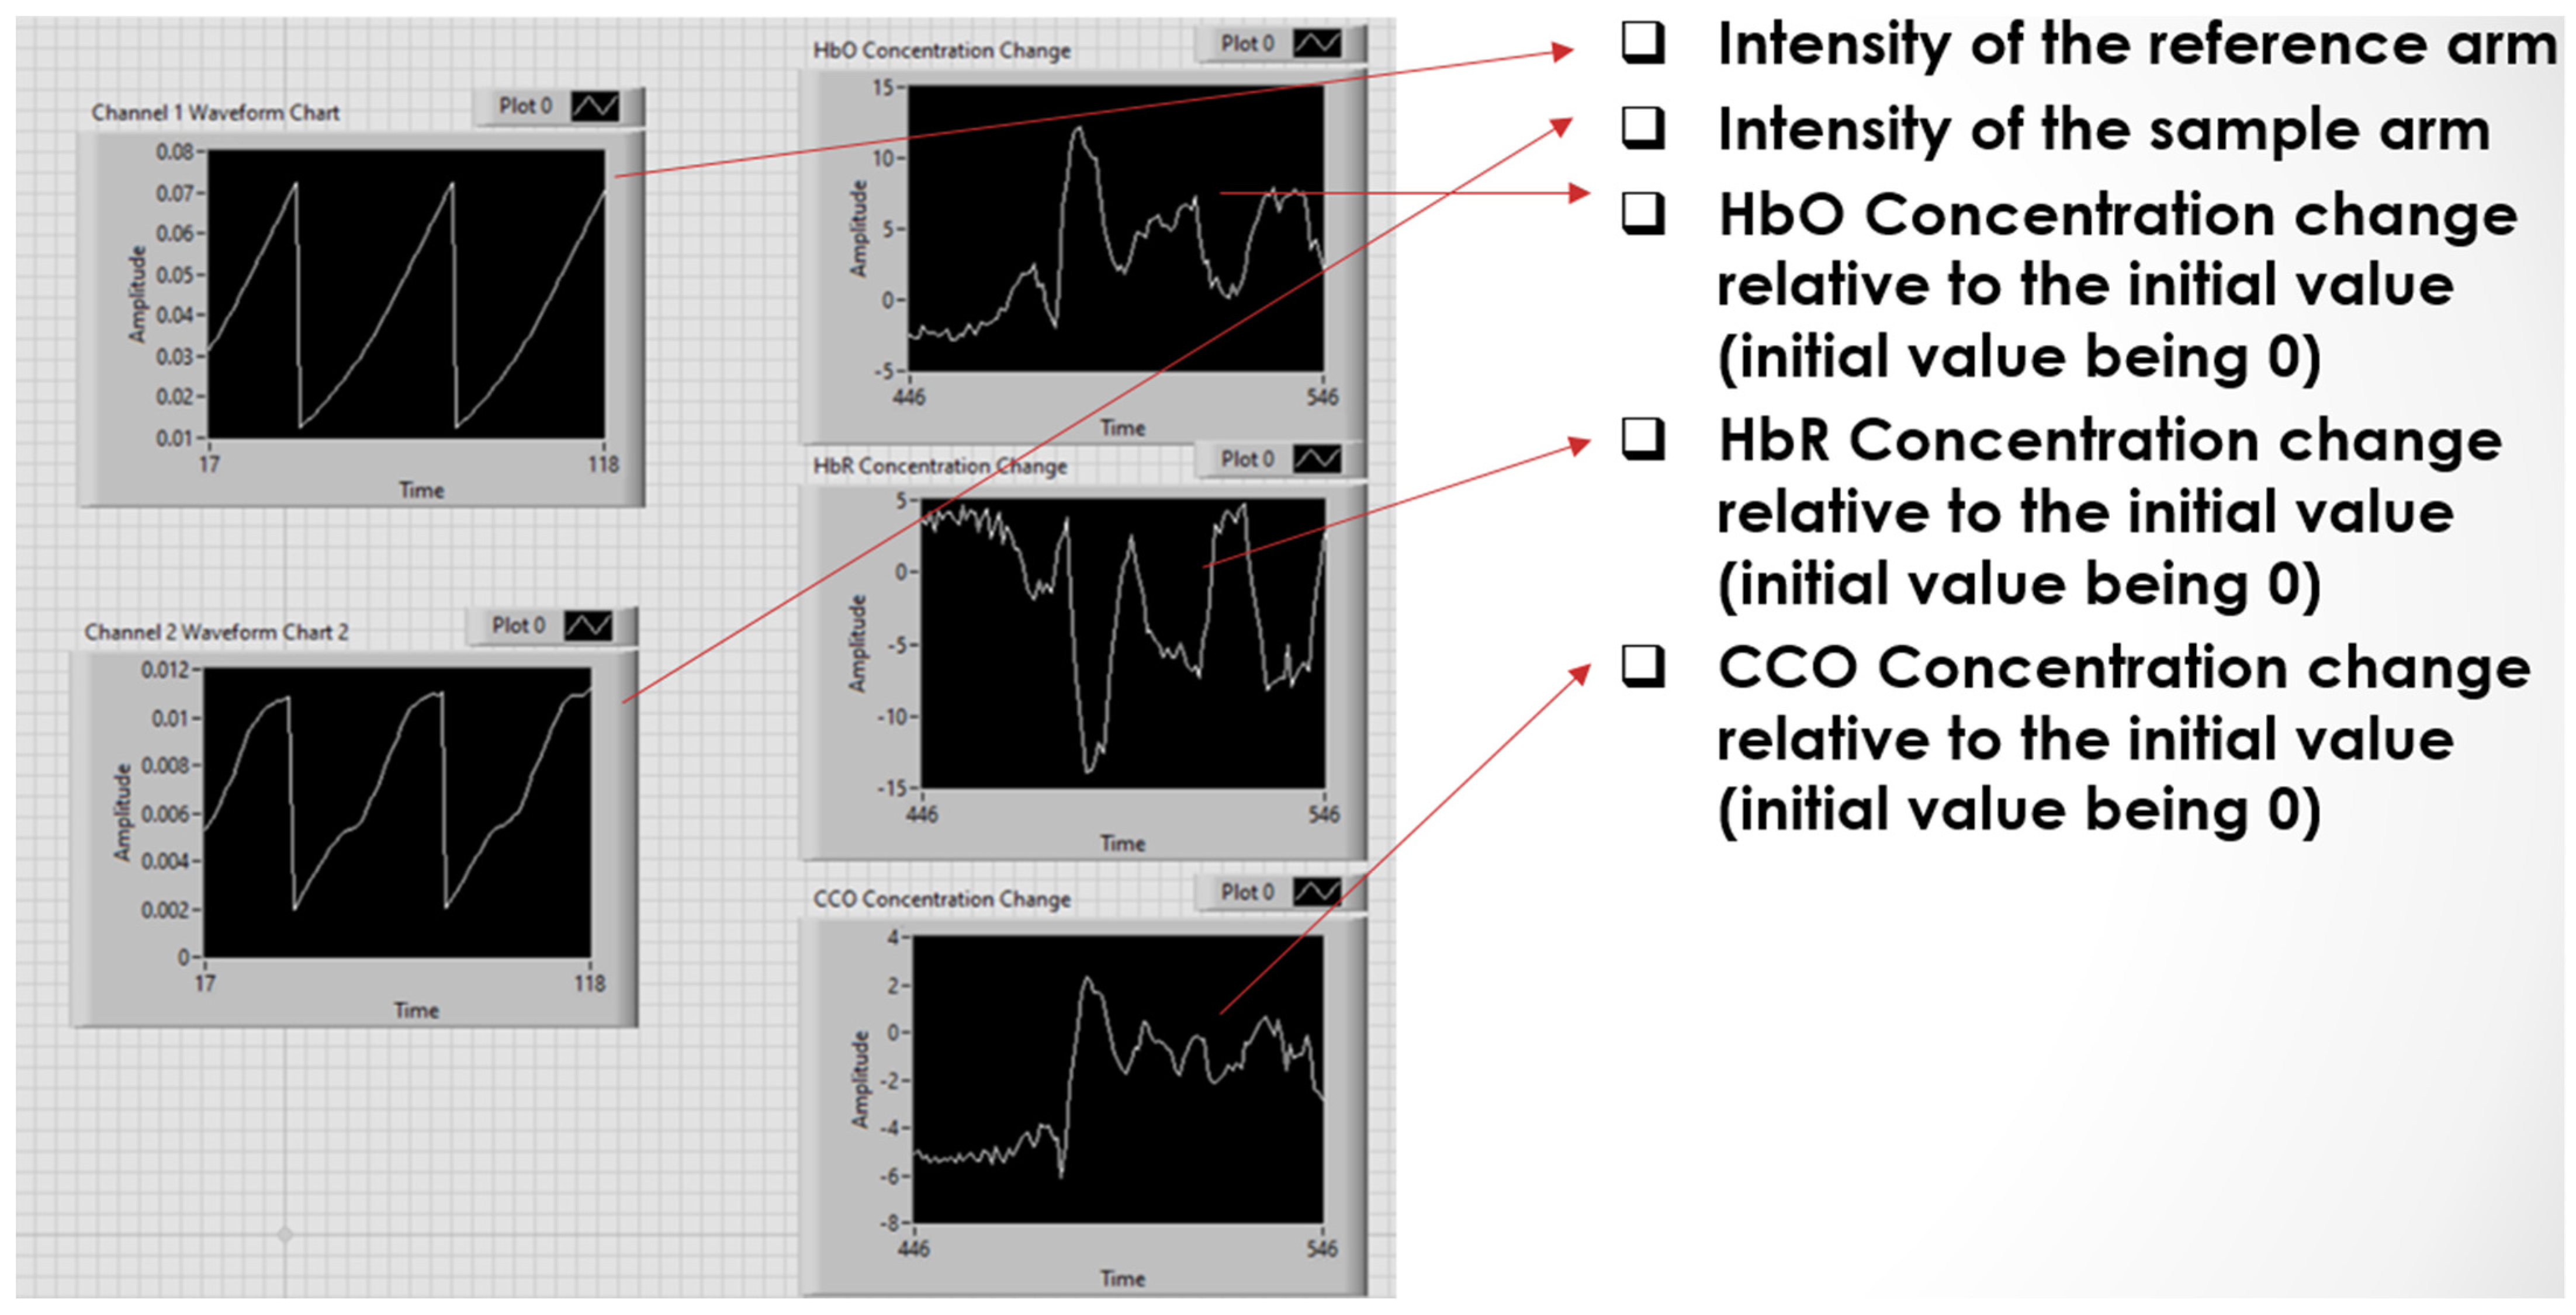
Figure 31 provides more details on the output calculated from the measurement, where the algorithms described in
Section 3 (and
Figure 6) were used to perform the processing [
37,
38]. The left two graphs are of the intensity of the reference arm and the sample arm, and using the algorithms, the calculated outputs are the HbO, HbR, and the CCO concentration. In summary, the SCISCCO hardware and software were integrated into a stable, convenient-to-operate cart system, and this system was transported to Northwestern University for animal testing as described below.
6. Swine Animal Trials Using the Prototype in Hemorrhagic Shock
The cart-based SCISCCO prototype system was applied to swine subjected to hemorrhagic shock (HS) and treated with different resuscitation strategies. This preliminary study examines two innovative strategies that have emerged in recent years for mitigating the effects of blood loss. The first strategy is resuscitative endovascular balloon occlusion of the aorta (REBOA). REBOA employs a balloon catheter to obstruct blood flow within the aorta. This maneuver temporarily halts internal bleeding and improves circulation to the heart, lungs, and brain. Blood flow can only be stopped in this way for minutes at a time before deadly ischemic injury develops from a lack of blood flow to vital organs. To mitigate this ischemic burden and extend the safe duration of balloon occlusion, new balloon catheters have been designed. These balloons partially obstruct blood flow to slow blood loss and improve central circulation but still permit enough blood flow to the remaining tissue to avoid ischemic tissue injury. This technique is termed partial REBOA (pREBOA). The second innovative strategy used to enhance survival after major bleeding is the seizure medication valproic acid (VPA). VPA has been found to have properties that alter cell survival and enhance ischemia tolerance. In animal studies, VPA can sustain life despite massive blood loss even without blood transfusion. The swine experiments we describe were conducted to determine if pREBOA and VPA could be used together to achieve synergistic effects. The SCISSCO device was applied to swine undergoing these experiments to test the feasibility of using the new cart-based prototype. Additionally, the measurements obtained in this pilot study validated the instrument’s measurements against the physiological and hemodynamic parameters with known outcomes.
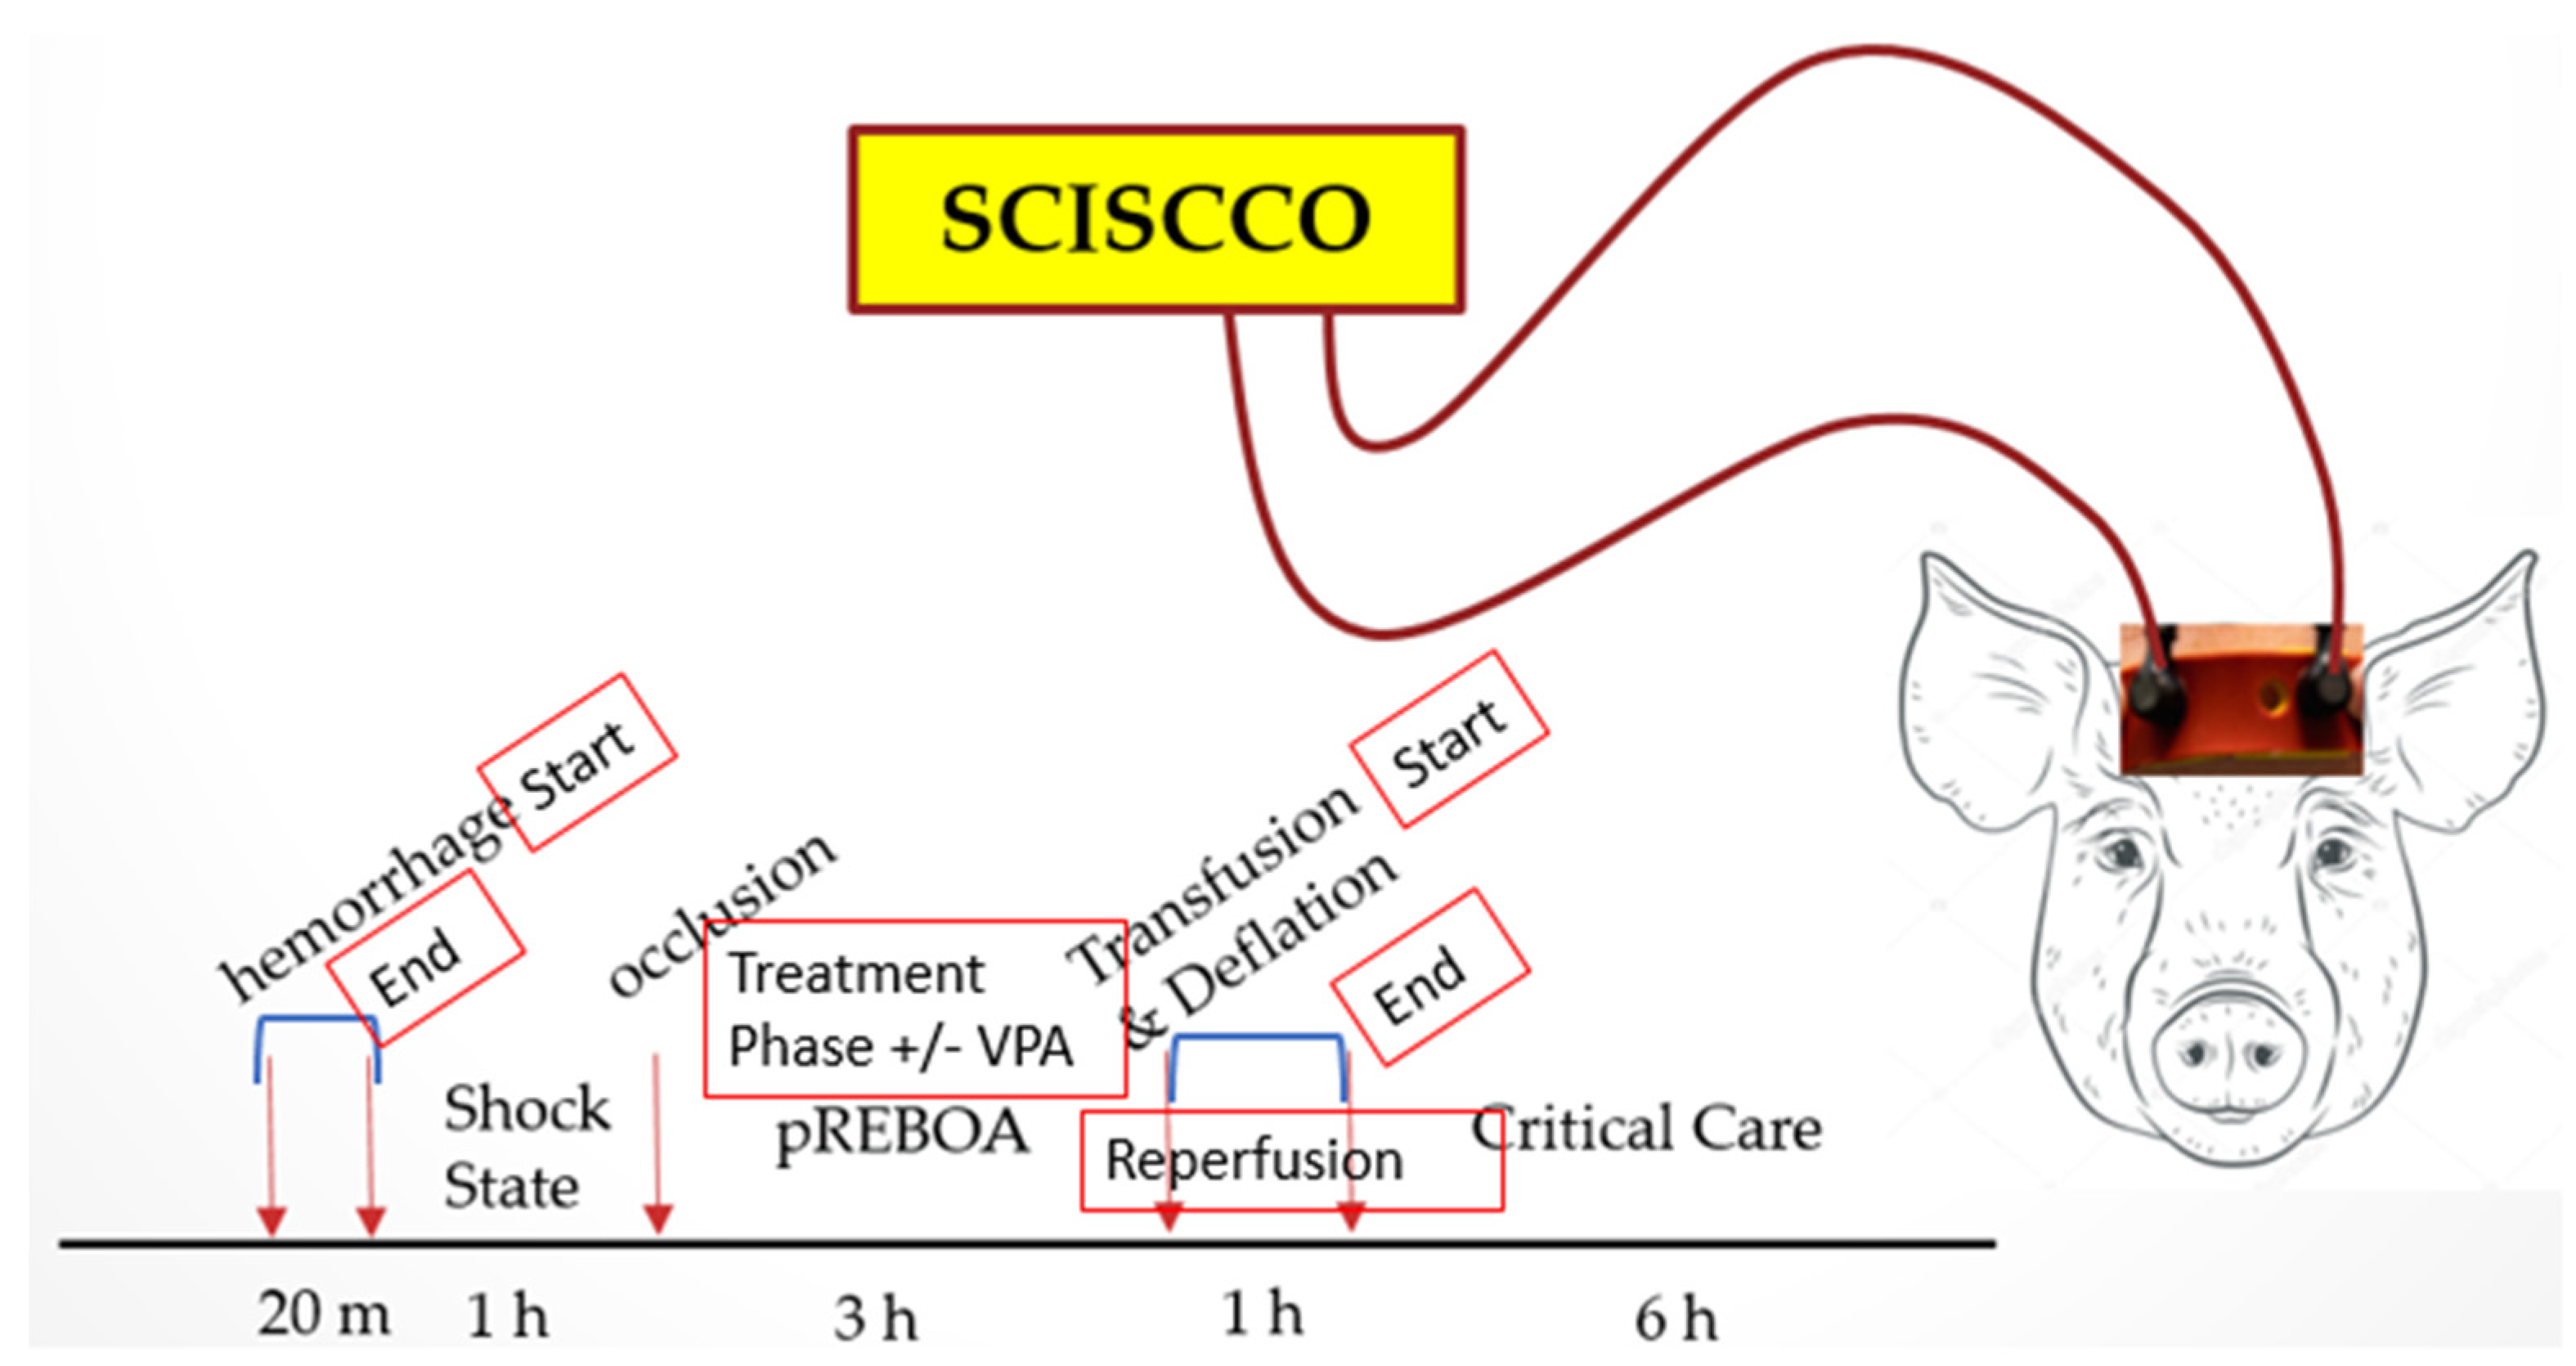
The animal study design is illustrated in
Figure 32. In the experiments, the SC probes were secured on the forehead of the swine (Yorkshire swine, weight: 40–60 kg) with surgical tape during the entirety of the surgical procedure to detect the hemodynamic and metabolic responses of the brain. Following induction, intubation, and instrumentation, the swine were subjected to a 40% total blood volume controlled hemorrhage and then an hour of non-resuscitated shock (MAP: 30–35 mmHg) prior to the initiation of pREBOA for 3 h with or without concurrent VPA infusion, followed by whole blood transfusion concurrent with balloon deflation and reperfusion. The surviving animals were provided critical care, employing standard resuscitation and correction of metabolic and electrolyte abnormalities until the end of the study.
6.1. Expected Outcomes
Taken together, HbO, HbR, and CCO reflect the metabolic supply and demand relationship involved in ATP production at the cellular level. At rest, the body’s baseline metabolic needs require a steady state of ATP production. As ATP is produced through the electron transport chain, the reduced state of CCO accepts electrons to become the oxidized state of CCO briefly before passing the electrons off again. This ratio of oxidized to reduced CCO is measured by the SCISCCO device to produce the CCO signal. When the substrates needed for ATP production (oxygen and blood flow) are abundant, the CCO signal can increase with the increasing HbO to match demand. Therefore, for the brain of a healthy anesthetized animal, the HbO and CCO signals demonstrate correlated behavior. The HbO and CCO signals may become uncorrelated during periods of exertion such as exercise, deep thought, or stress when demand increases and the HbO supply is stable. There are many compensatory mechanisms for increasing oxygen delivery to meet demand in a healthy animal, so changes in the CCO signal may be expected to be transient until the compensatory mechanisms are exhausted. When the demand for ATP is stable, as would be expected under the effects of general anesthesia, the relationship between the CCO and HbO depends on the availability of substrates. When the body’s compensatory mechanisms maintain sufficient oxygen delivery and blood flow to the brain, then the CCO signal would remain stable. Since there is little CCO in reserve, when compensatory mechanisms to maintain oxygen delivery are insufficient, then the electron transport chain fails, resulting in a higher proportion of CCO existing in its resting, reduced state. Thus, the CCO signal would decrease from the baseline, correlating with HbO and being negatively correlated with HbR. If the CCO has an inadequate supply of oxygen, then the electron transport chain shuts down, and ATP cannot be produced. When the electron transport chain is not functioning, CCO exists in its resting, fully reduced state. We summarize in the table in
Figure 33 the expected behavior of CCO, HbO, and HbR in various physiological states. The status column indicates whether or not our preliminary findings verified these results to date.
6.2. Partial REBOA without VPA
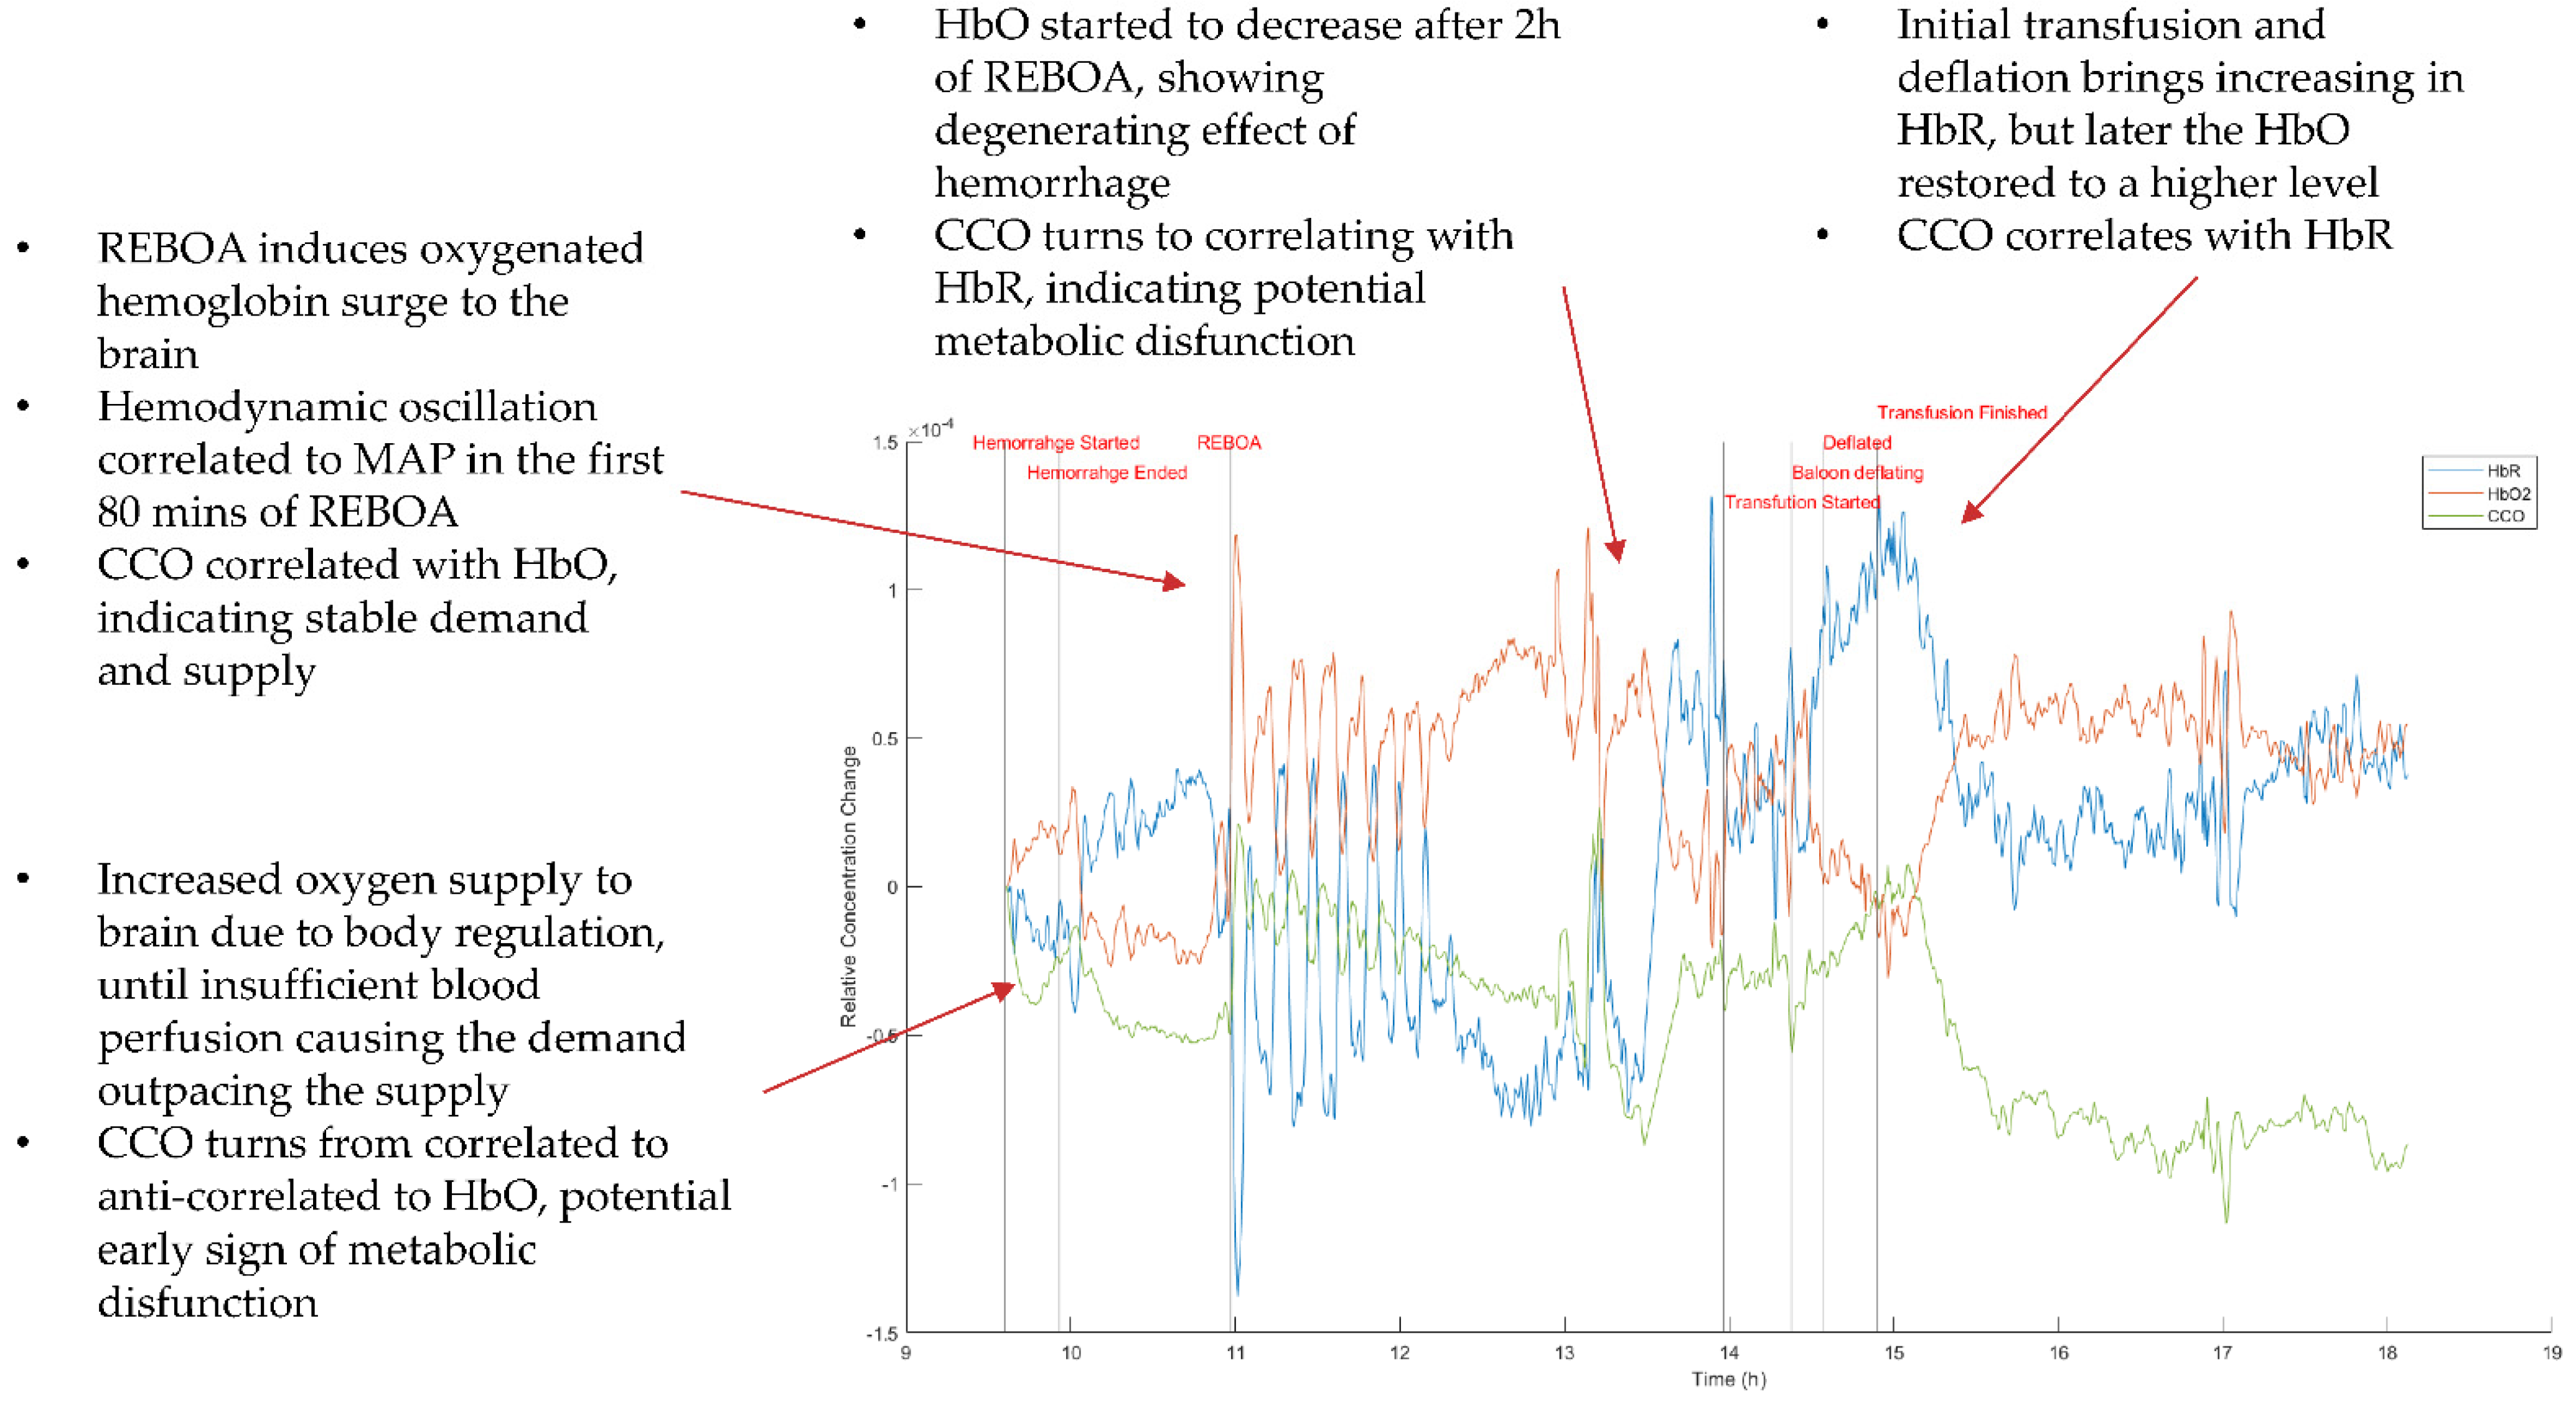
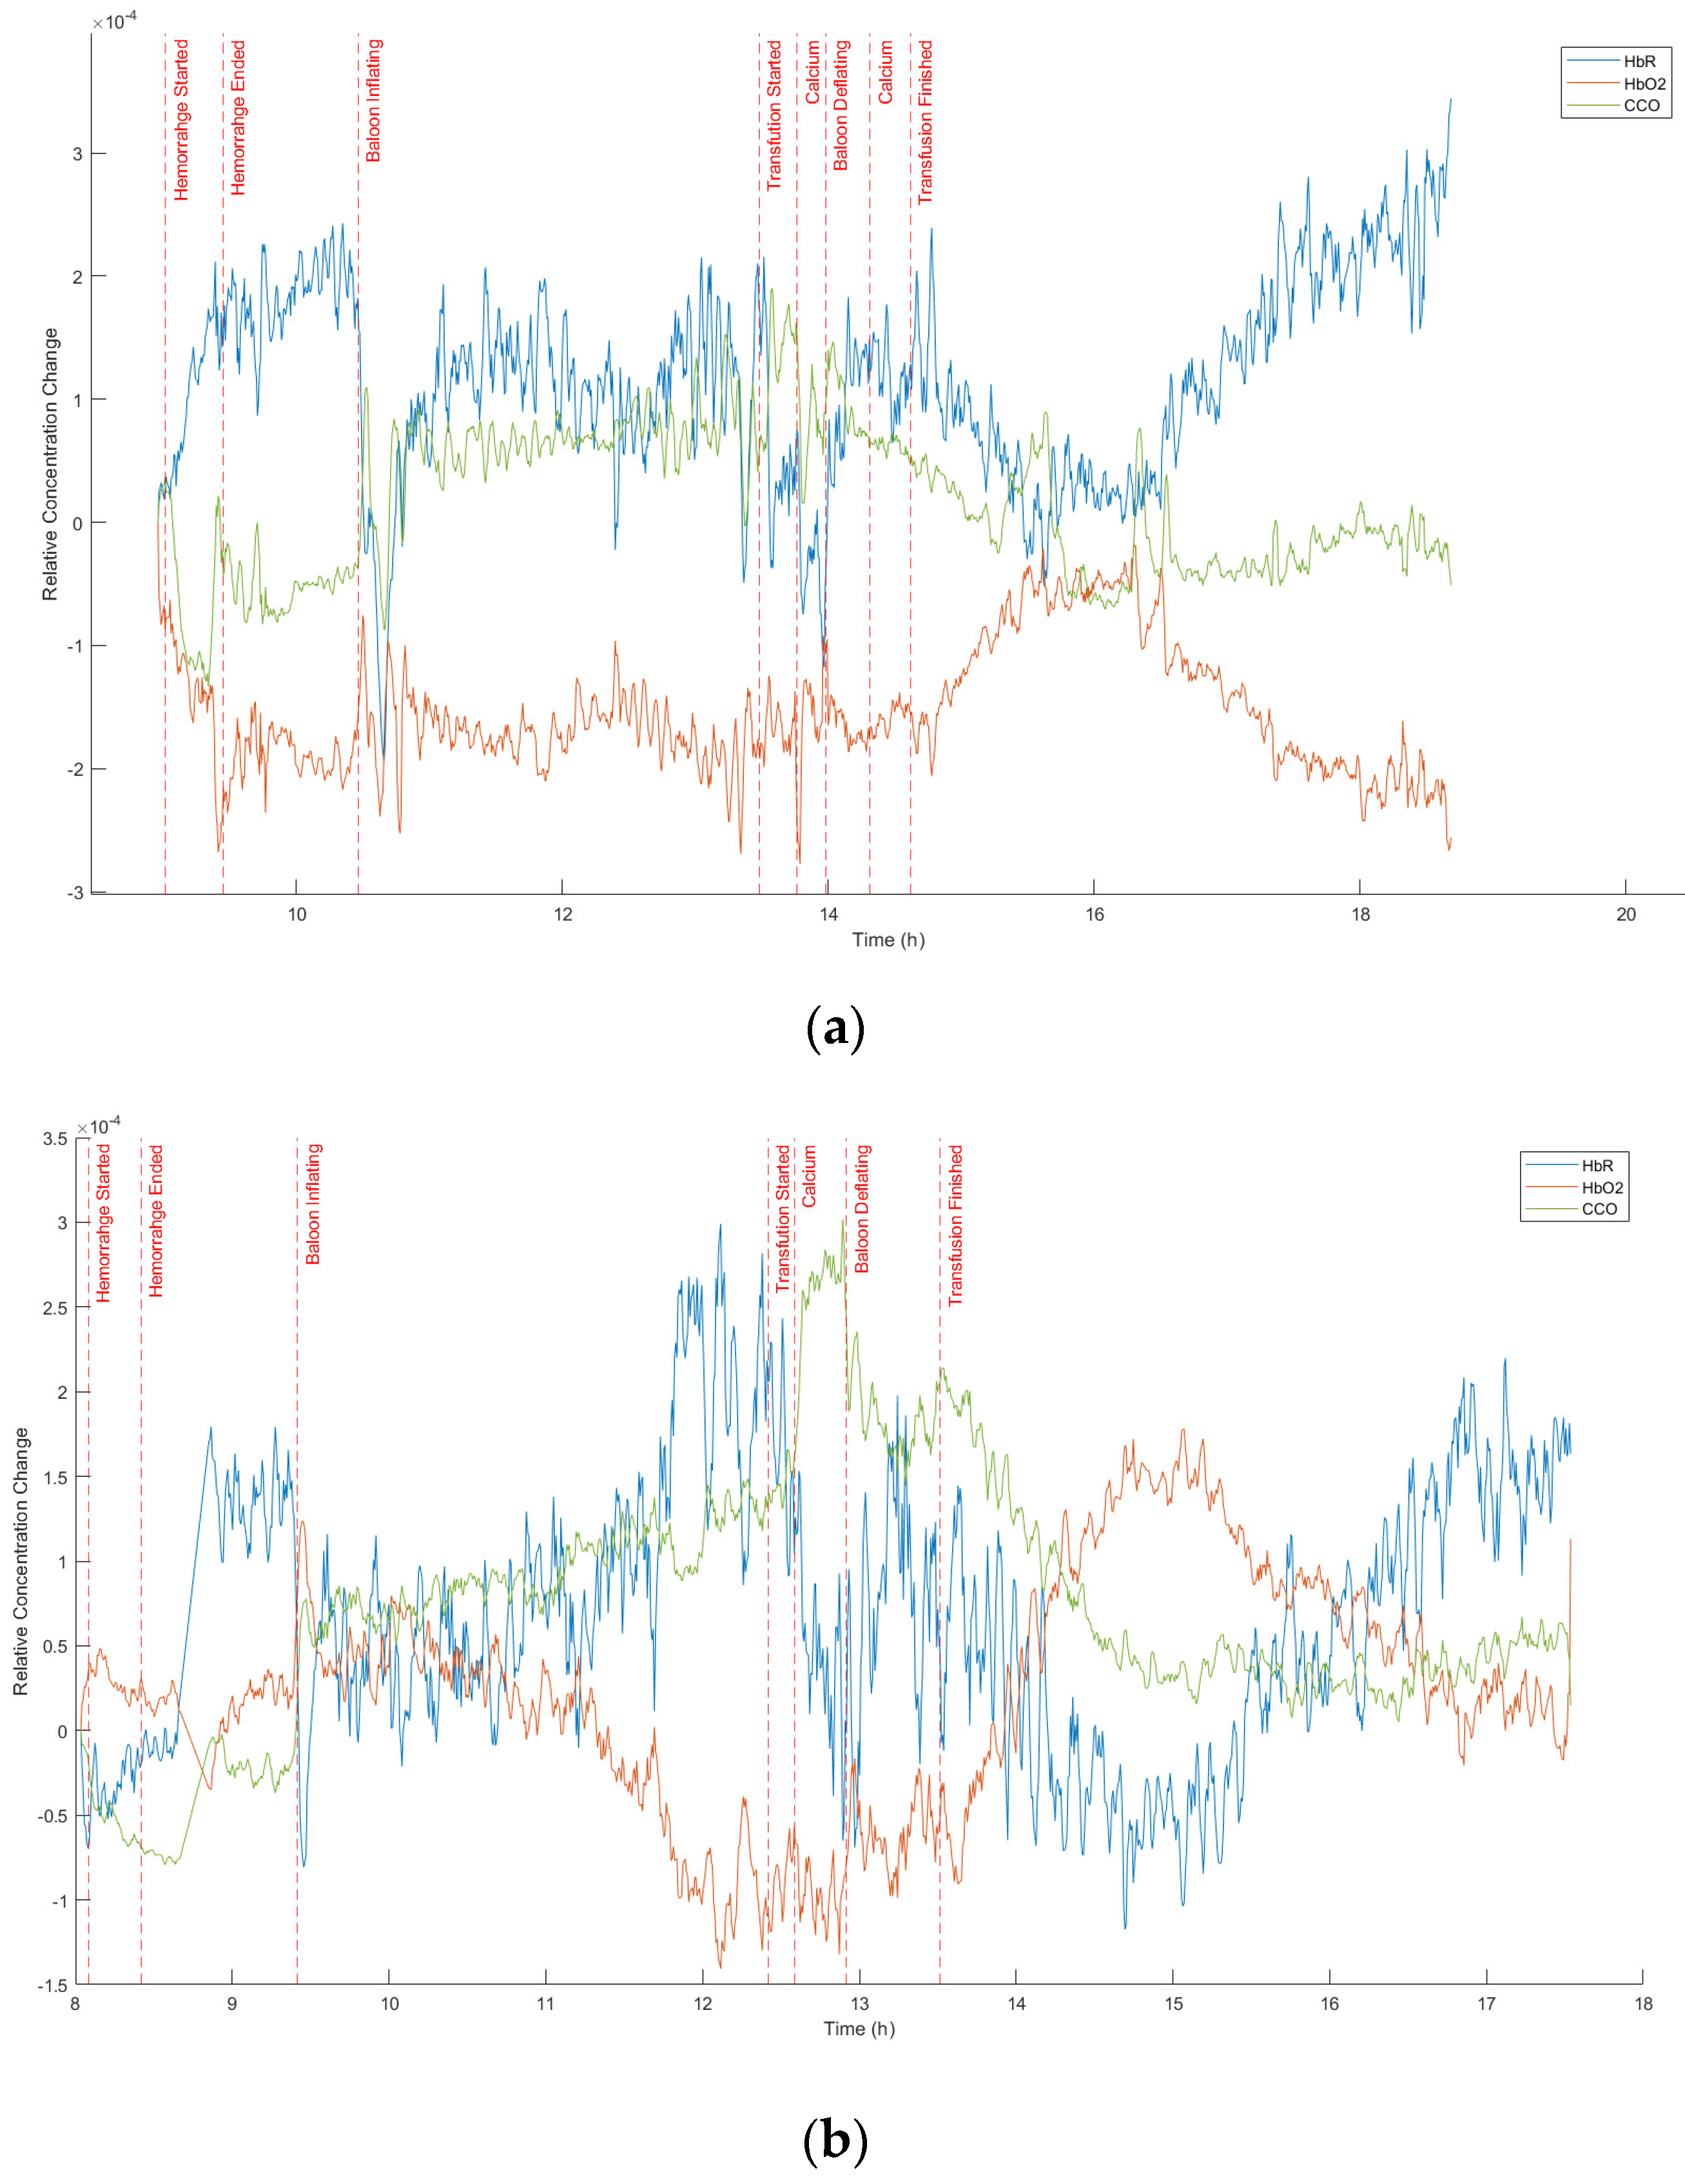
An exemplary data set measured by the SCISCCO system with the swine undergoing a pREBOA procedure is illustrated in
Figure 34. The red curve corresponds to the HbO concentration, the blue curve corresponds to the HbR concentration, and the green curve corresponds to the CCO concentration. The vertical lines and their labels represent key events during the swine experiments, and the data were collected over more than 8 h continuously. The words at each stage in
Figure 33 help to describe the behavior observed using the SCISCCO instrument.
The measured HbR and HbO concentration changes across different clinical phases were consistent with our expectations based on physiological principles. As hemorrhaging begins, SCISCCO detects that the HbO concentration increases, which indicates increased oxygen supply to brain due to the body’s regulation mechanisms in response to hemorrhage, such as tachycardia. Next, we observed that the HbR concentration increased sharply while the HbO concentration dropped abruptly at the same time as when hemorrhaging ensued until shortly after the blood loss was halted. This corresponded to oxygen deprivation to the brain, as the rate of hemorrhage outpaced the compensatory mechanisms, termed “stage 4 shock”. Interestingly, the CCO concentration switched from negatively correlating to positively correlating with HbO before the initially increasing HbO reached the maximum, and this lasted throughout the first hour of REBOA. This could represent the limit of cerebral autoregulation, as the CCO redox state no longer reflected the ability of compensatory regulation to meet the metabolic demands. Instead ATP generation passively followed the oxygen supply as indicated by the tissue HbO concentration.
When the REBOA was applied (occlusion was initiated), oxygenated blood was prevented from going to the abdomen and lower extremities, and more oxygenated blood was then shunted to the brain. There was a 10-min period of complete aortic occlusion that was followed by the onset of pREBOA, which was reflected in the increase in HbO at occlusion that then dipped and recovered throughout the intervention phase. During the first 80 min of the REBOA period, we observed oscillation of the animal’s blood pressure, and this was captured by the SCISCCO system (e.g.,
Figure 35b). During this period, the mean arterial pressure (MAP) showed a clear correlation with HbR and negative correlation with HbO and CCO. In the third hour of the pREBOA period, the HbO started to decrease, as the persistent insufficient blood supply led to degenerating body function and an exhaustion of all compensatory mechanisms. The CCO redox state gradually and continuously decreased throughout the REBOA period, indicating the lowered but stable demand of an anesthetized animal and the gradually degenerating blood supply. It is also noteworthy that at the end of the REBOA period, CCO switched back to correlating with HbO concurrent with the administration of blood transfusion, which improved the blood supply and tissue oxygenation. After 3 h of pREBOA, massive transfusion of fresh whole blood was initiated (resuscitation), and the balloon was deflated, which increased flow past the balloon site and circulated distal ischemic metabolites. This initial reperfusion injury is notable with the surge of deoxygenated blood that initially returns upon balloon deflation and then washes out as transfusion restores oxygenated blood. At ~30 min after the transfusion ended, the HbO was restored to a relatively high level, and this corresponded to the animal being successfully resuscitated. These findings suggest that the novel SCISCCO instrument detected rapid changes in swine cerebral metabolism that were consistent with the expected physiological principles. What remained unclear was the metabolic demand of the distal tissue beds. Survival of the animal depends not only on survival of the brain but also survival of the organs distal to the point of occlusion. Gathering information about distal tissue viability could be important for determining the upper limit of the pREBOA application. In the future, this might be collected by supplementing the SCISCCO system with an additional fiber probe set that is applied to the distal limbs or organs.
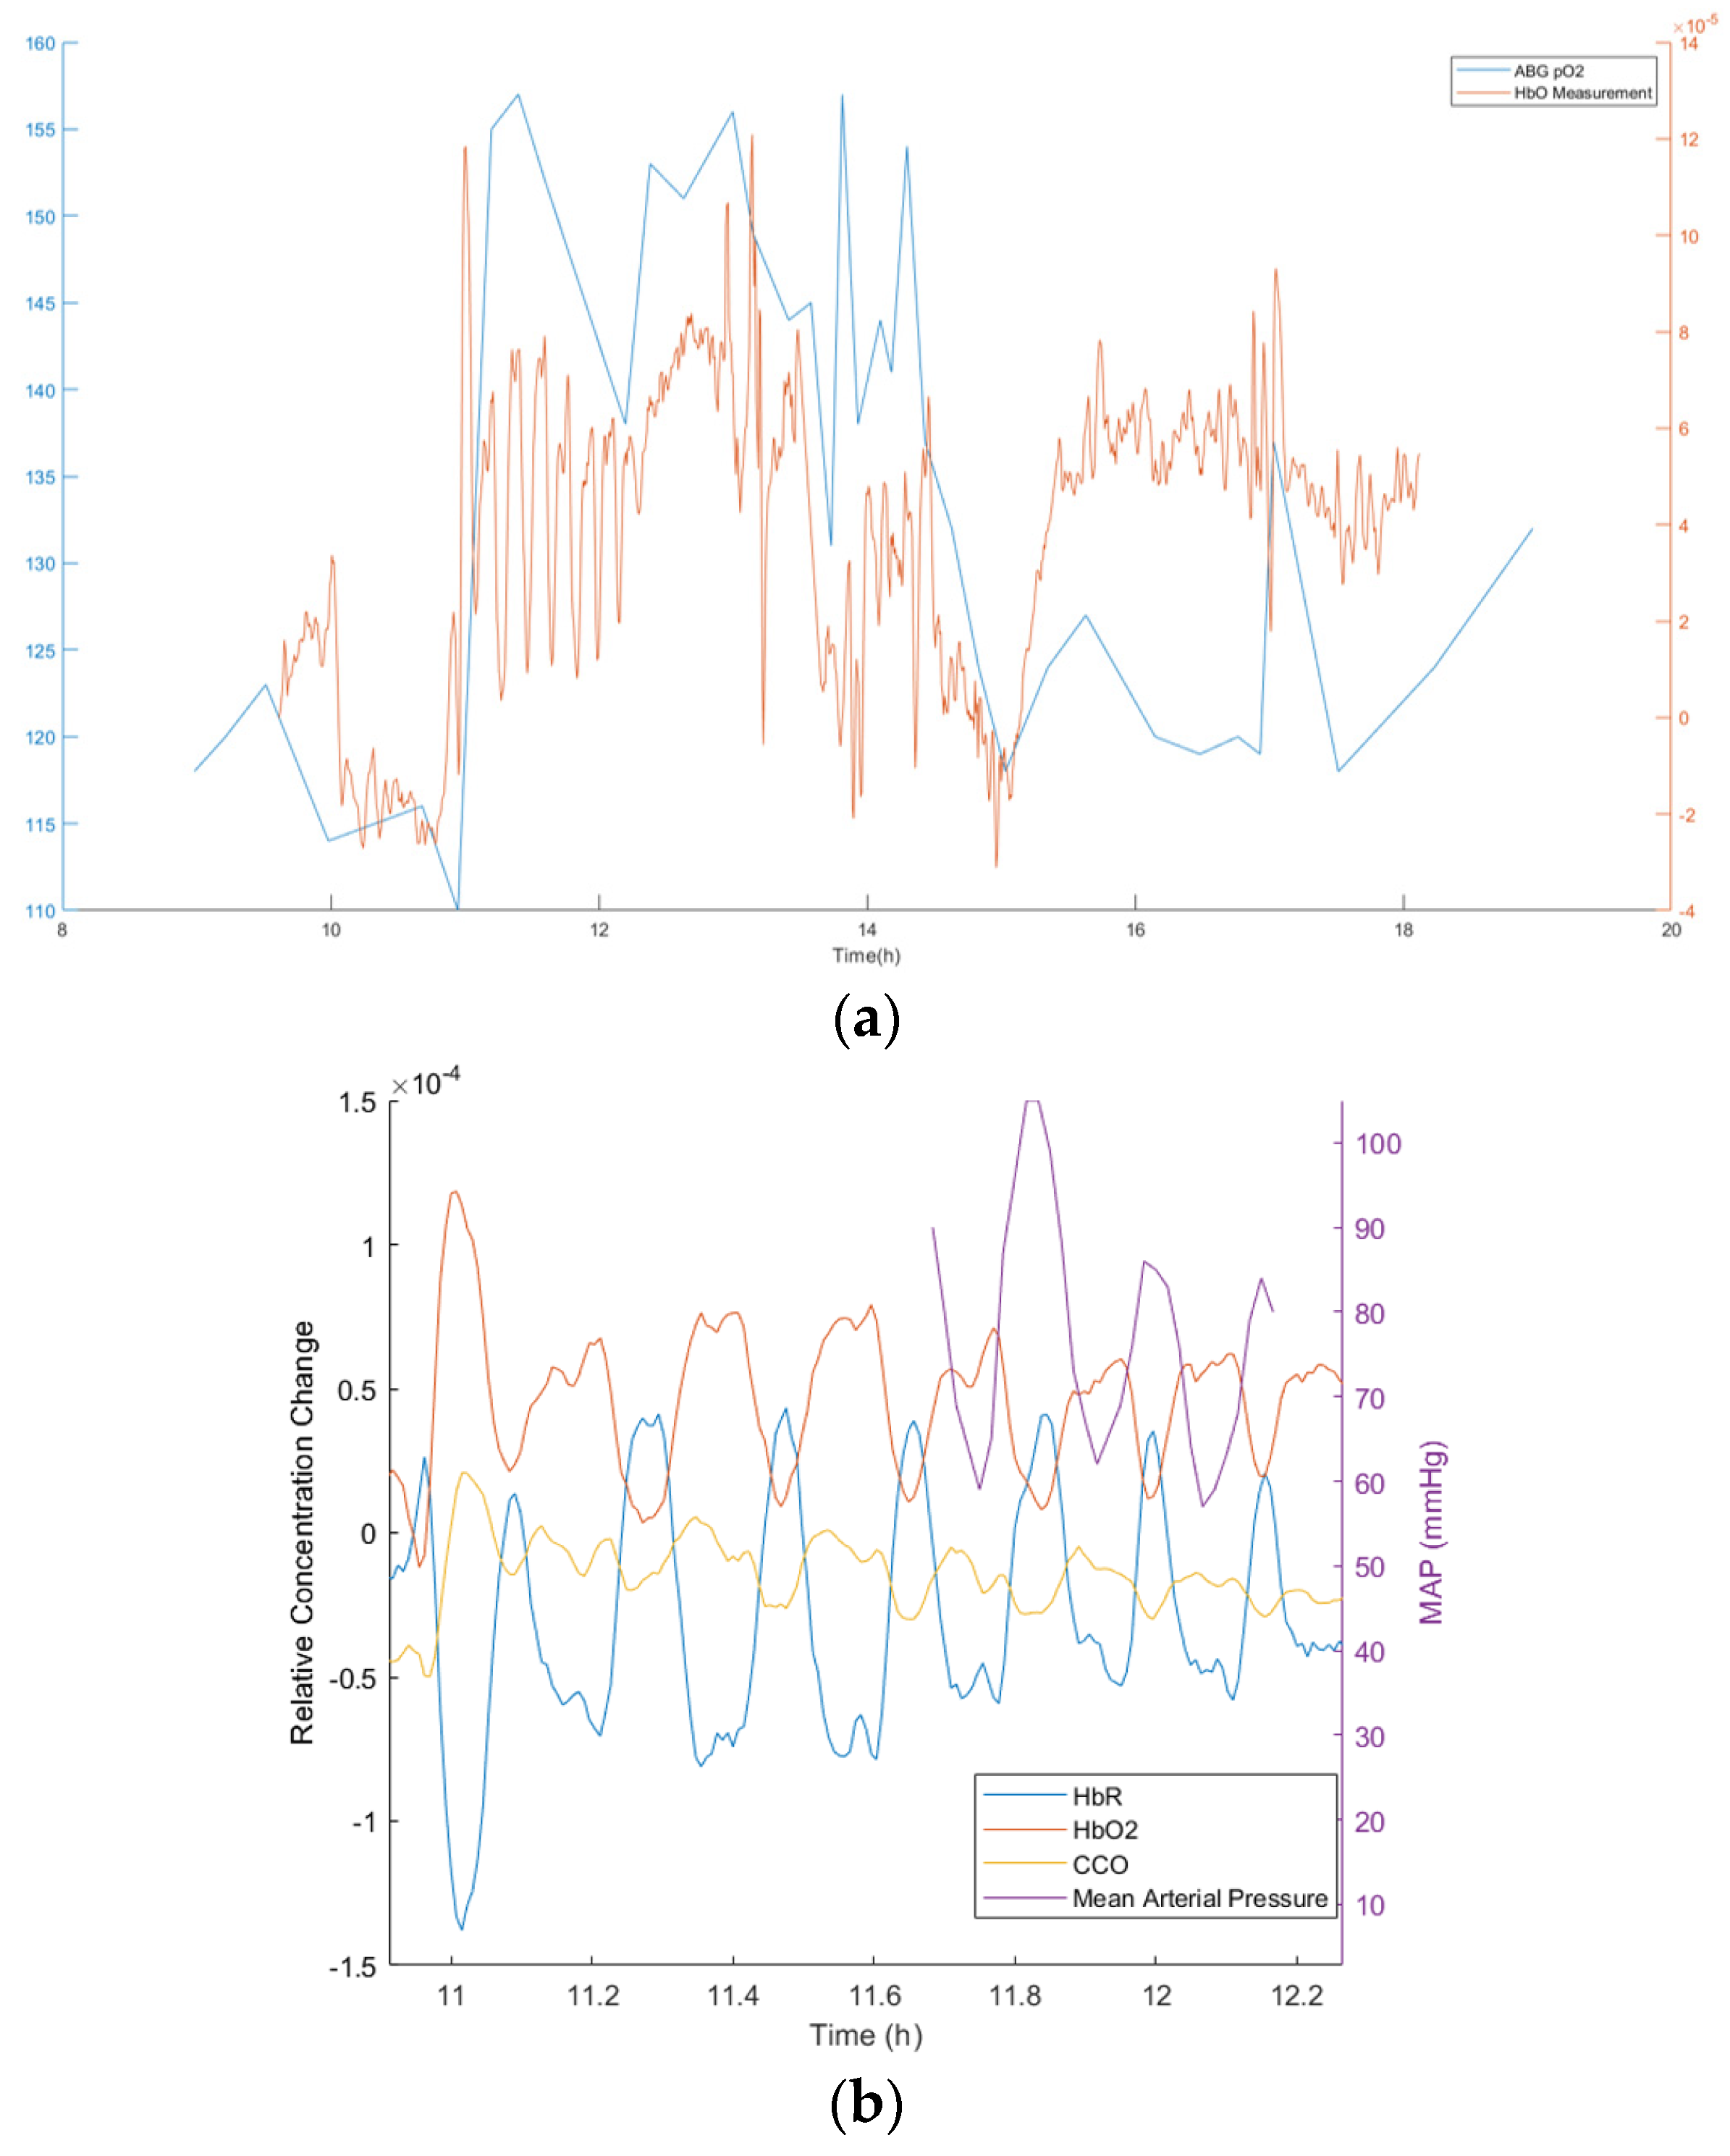
During this preliminary experiment, the data collected by the SCISCCO system was also compared with other independent instruments. For example,
Figure 35a shows the oxygenated hemoglobin (HbO) measured with the SCISCCO system (red curve) compared with the oxygenation measured using an arterial blood gas (ABG) instrument (blue curve). There was reasonable agreement between the two measurements, and the SCISCCO system provided a finer temporal resolution. As another example, in
Figure 34, immediately after the REBOA occlusion was expanded (around hour 11, as labeled in the figure), there was an oscillatory behavior observed for more than an hour afterward.
Figure 35b expands the data to show the behavior in more detail (red curve = HbO, blue curve = HbR, and yellow curve = CCO). We also plotted on this graph the mean arterial pressure measured with an independent instrument (purple curve). The oscillatory response seen with the SCISCCO instrument correlated with similar fluctuations in the mean arterial blood pressure.
6.3. Partial REBOA Combined with VPA in Swine Experiments after HS
Another two sets of preliminary data were taken using the SCISCCO instrument in the swine experiments with partial REBOA augmented with VPA. The results from two different experiments (performed on two separate days with different pigs) are illustrated in
Figure 36. Compared with the pREBOA-only experiments, in the pREBOA plus VPA experiments, the effect of the REBOA appeared to be less significant in terms of increasing the blood oxygen. Additionally, during the critical care phase, the blood oxygen recovered at first but then degraded. In particular, in the experiment shown in
Figure 36b, during REBOA, the HbO decreased and CCO increased, indicating potential deterioration of the animal’s state. Further experiments will be required to better understand the hemodynamic and metabolic dynamics observed in both the pREBOA and the pREBOA plus VPA experiments.
In summary, the SCISSCO prototype was used to simultaneously measure the hemodynamic (HbO and HbR) and metabolic (CCO) dynamics during swine procedures using only pREBOA as well as pREBOA plus VPA. This shows the efficacy of the SCISCCO instrument, thus permitting future detailed animal studies to study how HbO, HbR, and CCO dynamics change for different swine experiments. The data extracted from the detailed animal studies may provide actionable information that can guide and improve the efficacy of the pREBOA with or without VPA.
7. Conclusions
In summary, we developed a SCISCCO system that measures the changes in HbO, HbR, and the redox state of CCO simultaneously, and the instrument was used in pilot human and animal studies. The light source for the SCISCCO system was an all-fiber integrated modulational instability-initiated SCL that output up to 11 W of time-averaged power covering the NIR and SWIR wavelength range of 670–2500 nm. The CCO measurements were performed over 750–900 nm, the wavelength range over which the brightness of the SCL was almost an order of magnitude higher than a lamp or black body radiation source in our fiber-coupled configuration. This wavelength range covers much of the broad spectral absorption of CCO as well as the differing spectrum between HbR and HbO, and it is beyond where melanin absorbs light, so the measurements were substantially independent of skin color. High SNR measurements were achieved because of the SCL’s high brightness, polarization filtering, a two-arm differential configuration to divide out SCL and environmental fluctuations, and the use of lock-in amplifiers to remove the effects from ambient light and other spurious signals.
For use in hospital and lab settings at remote locations or for portability within a hospital, a cart-based SCISCCO prototype system was also assembled that integrates the hardware and software into a single portable instrument. The rolling cart system has three levels: the top level comprises the SCL and laptop for processing, the middle level comprises the optical system hardware, and the bottom level comprises the electronics and lock-in amplifiers. A convenient GUI permits the user to input the measurement parameters and view the metabolic and hemodynamic data as a function of time. The stability of the cart-based prototype was verified by rolling the cart through buildings with brick flooring and driving in a van over local paved and dirt roads while measuring the spectral and power output as well as the balance between the sample and reference arms of the set-up.
To validate the fidelity of the SCISCCO system, we conducted several experiments initially with laboratory mixtures or healthy participants. First, we measured CCO in vitro to confirm the NIR absorption spectrum for CCO. To demonstrate in vivo feasibility, the measured responses of oxygenation and CCO changes during the blood pressure tests in the human participants were compared to data from the literature. Furthermore, we showed that the hemodynamic response during the physiological breath-holding tests as well as the cognitive attention tests were comparable between the SCISCCO system and a commercial fNIRS system.
Next, we conducted a pilot human study of 25 participants using a cognitive attention test. The results showed that during the attention task, the level of HbO increased and the level of oxidized CCO decreased. The measured behavior was consistent with prior studies showing an increase in HbO in the frontal lobe during attention tasks and the interpretation of the CCO redox state as an indicator of cellular ATP demand and metabolism in the active brain region. Thus, our measurements provide a noninvasive, simultaneous measurement of both the cerebral hemodynamic response and metabolic demand using a noninvasive optical sensor.
Finally, the cart-based SCISCCO prototype was transported to Northwestern University Medical Center and used in a series of swine animal tests aimed at controlling bleeding. In particular, the SCISCCO prototype was applied to swine animal models undergoing HS followed by pREBOA or pREBOA with VPA drug treatment. The data collected by the SCISCCO system were validated against other instruments, such as those used to measure arterial blood gases and the mean arterial pressure. In addition, the pilot animal studies established the feasibility of using the SCISCCO prototype within the context of existing protocols. The measured HbR and HbO concentration changes across different clinical phases during the 8-h continuous measurements were consistent with our expectations based on physiological principles. Although still preliminary data, the CCO concentration changes provide new insights into the swine metabolic reactions during the different phases of HS and the treatment using pREBOA with and without VPA.
Thus, the SCISCCO system provides a noninvasive tool for monitoring changes in metabolism as well as hemodynamic response. Using the all-fiber integrated SCL as the key enabling technology, the SCISCCO system has the potential of being a practical, cost-effective, portable, and noninvasive means of monitoring brain and organ oxygenation and metabolism in the emergency department, operating room, or other medical facilities. Applications of the SCISCCO system could range from a new tool for screening concussion patients (such as being used in the cognitive attention test results) to use in an intensive care unit to gauge a patient’s organ response to treatments (such as the cart-based system used in the animal trials).


 ,
, 


