Article

Vibration Energy Comparison Helps Identify Formation Time of New Free Surface in Urban Tunnel Blasting

1
School of Civil and Resource Engineering, University of Science and Technology Beijing, Beijing 100083, China
2
Beijing Tsinghua Holdings Habitat Development Lighting Institute Co., Ltd., Beijing 100089, China
*
Author to whom correspondence should be addressed.
Appl. Sci. 2022, 12(19), 10061; https://doi.org/10.3390/app121910061
Submission received: 8 September 2022 / Revised: 30 September 2022 / Accepted: 30 September 2022 / Published: 6 October 2022

Abstract

:
Cut blasting creates new free surfaces that facilitate rock breaking and reduces blast vibration. However, the time when the new free surface is formed is not clear in on-site blasting practices. This paper proposes a method to identify this formation time through a vibration energy comparison. Firstly, a variational mode decomposition method identified the initiation time sequence of high-precision detonators from the observed blast-induced vibration wave. Based on the superposition of the single-hole waves extracted from the single-free-surface blasting test, we constructed a predicted wave that shared the initiation time sequence with the observed one. The Hilbert transform found the accumulated energy curves of the two waves separately. By comparing the linear correlation of the two curves, we identified the new free surface’s formation time to improve the blast design. The tunnel-blasting case showed that 64.5 ms was required to form the new free surface. In the actual blasting, each cut hole used 1.0 kg of explosives. The maximum vibration velocity was 0.90 cm·s−1, which met the control target of less than 1.0 cm·s−1.

1. Introduction

The drill and blast method is a common way to excavate an underground roadway or tunnel [1]. Blasting in urban tunnels can induce vibrations in the ground and adjacent buildings [2]. The peak velocity of particle vibration (PPV) should not exceed the safety levels set by the construction specifications or the management. This will impact the construction’s progress when adopting the short-advance method or even when switching to the mechanical excavation method when the vibration velocity is required to be low. Thus, in densely populated and built-up areas, designers adjust blasting parameters and anticipate possible vibrations [3,4] to meet the needs of safety and maintain efficient production activities.
Vibrations from cut blasting are the focus of predictions. Many methods can predict blast vibrations [5]. The most commonly used are the charge–distance–velocity empirical equations and their improvements [6,7,8]. For example, Sharafat et al. [9] determined a critical particle velocity that was incorporated into a vibration attenuation model to obtain permissible charge weights to limit the blast damage to within a short distance from the charge. Matidza et al. [10] proved the Sadovsky model is a more satisfactory model for predicting blast-induced vibrations as compared to empirical models. Its advantage is that it is simple and easy to use. Its disadvantage is that it can only predict the PPV and cannot obtain the complete waveform. Because delay errors and other factors are not considered, more caution is required in predicting delay blasting. There is also the linear superposition method [11,12,13]. For example, Agrawal et al. [14] developed an innovative and simplified analytical approach to signature hole analysis to predict the production of blast-induced ground vibrations. This method relies on the observed blast vibration waves. Its advantage is that the measured vibration data imply the influence of the blast source and geological conditions, which can reflect the changes in the blast vibration wave more realistically. Its disadvantage is that it assumes that the vibration waveforms caused by the initiation of blast holes charged with the same explosive are identical, which is inconsistent with the knowledge from blasting practices.
Each blast hole has different free surface conditions during initiation due to different positions and initiation time sequences. These conditions significantly affect its rock-breaking capacity and the induced vibration wave. In cut blasting [15,16], the first few holes have only one free surface and easily cause the largest amplitude [17]. The subsequent holes usually have more than two free surfaces to make the blast much easier. Even if they use the same blasting parameters, the vibration waves caused by the earlier- and later-initiated holes differ significantly. The vibration frequency of the later-initiated hole is higher and the amplitude is lower [18]. Therefore, in using the linear superposition method to predict the vibration of cut blasting, it is necessary to clarify the formation time of the new free surface. This helps frame the duration that the linear superposition method holds the assumption and adjusts the blasting parameters after forming the new free surface based on the vibration-reduction effect.
The role of the free surface is in the two aspects of rock breaking and vibration reduction [19,20]. Qiu et al. [21] studied short-delay blasting with a single free surface in underground mines using electronic detonators. The authors stated that if the delay intervals were longer than the formation time of a new free surface, there would be two free surfaces for the later-detonated blast hole: the initial free surface and the new free surface produced by the former detonated blast hole. Blair [22] developed an analytical model of nonplanar radiation and studied the effect of the free surface on the body waves generated by the explosion; the author pointed out that the angle of incidence played an important role in the process. However, due to a lack of testing means and test conditions, the study could not define and evaluate the formation and action process of the new free surface by analyzing the dynamic rock-breaking effect in engineering practice. While blasting vibration data is easy to obtain and the analysis and processing methods have been perfected, it is difficult to analyze the formation of a new free surface at the amplitude level because the vibration wave oscillates and decays with time.
This paper proposes a method to identify the formation time of a new free surface by comparing the vibration energy for tunnels or roadways excavated using an inclined hole cut pattern. Since the free surface conditions change during the blasting process and the linear superposition method does not consider this change, this leads to a significant separable difference in the vibration energy between the two. This method relies on this difference to carry out the study. The specific approach is to process the field-measured multihole vibration data for delay blasting using the variational mode decomposition (VMD) method [23] combined with the Hilbert transform to obtain the accumulated energy curve of the vibration wave. In addition, the single-shot test provides the single-hole (single-free surface) vibration wave as the base wave. The base wave is superposed to obtain a predicted wave that shares the initiation time sequence [24,25] in the delay blasting. Finally, we find the formation time of the new free surface by comparing the ‘time-accumulated energy’ curves of the observed and predicted waves based on the change in the linear correlation of the two curves. This method provides a new idea to study the formation of new free surfaces for blasting. No complex test is needed in reference to solving vibration-reduction problems in engineering.
In this paper, Section 2 introduces the basic principle of the linear superposition method and points out why this method does not apply to vibration prediction after forming a new free surface. Then, we provide a vibration energy comparison method to identify the new free surface’s formation time. Section 3 presents the results of identifying the new free-surface formation time in the practice during cut blasting through a case study. Section 4 briefly describes the optimal selection of single-hole charges based on identification results and the implementation of blasting operations in the field.

2. Materials and Methods

This section will begin with the fundamental tenet of the linear superposition method. It will then point out that the defect of this method is that it ignores the changes in free surface conditions that occur during cut blasting. Then, we propose a method that exploits this defect precisely to identify when a new free surface forms.

2.1. Fundamentals of Linear Superposition Method and Parameter Selection Method

Anderson et al. first proposed the linear superposition method in 1985. Now, it has been enriched and developed. This method considers the vibration as the result of the superposition of independent vibrations induced by the initiation of each blast hole. We can repeat the vibration waves of each blast hole as long as the charge parameters are consistent.
The method first collects vibration data from a single-shot test. The data is then linearly superposed according to the initiation time sequence of the holes to obtain the predicted vibration amplitude at each moment. Whether the maximum amplitude value exceeds the preset threshold is a basis for the verdict on whether the charge and initiation time sequence is reasonable.
The single-shot test involves drilling a single hole in the cross-section at a suitable location according to the cut-hole design then loading and detonating the explosives. At the same time, an instrument is placed at the measurement point on the ground directly above the blasting source. It collects the single-hole vibration wave caused by the blasting of the hole. The waveform is a discrete series {(tn, g(tn))} of time and amplitude. As shown in Equation (1), multiple identical waveforms are superposed according to the multihole initiation time sequence (δt1, δt2, …, δtM) to form the predicted waveform S′(t):
S t n = m = 1 M g t n δ t m ,
where tn is the time, g(tn) is the amplitude, δtm is the initiation time of the mth delay, M is the number of delays participate in superposition, and S′(t) is the predicted waveform.
Equation (1) can hold provided that for the mth delay of the detonators, there is always an initiation time δtm ∈ {tn} such that there exists g(tnδtm) that can add with g(tn). Conversely, no amplitude data corresponding to δtm cannot be superposed. It is necessary to fit the single-hole vibration data as a continuous function so that there is an amplitude value at any moment.
The first step in the fitting is to intercept the single-hole waveform. If the maximum amplitude is Amax, then the duration from the measurement point starts to move to the first time the amplitude reaches Amax/e, which is the major vibration part of the waveform, and the duration time is tmain. The waveform is shortened at t0, as seen in Equation (2), causing the first wave and the major vibration part of the last wave to stop simultaneously:
t 0 = δ t M + t main ,
where t0 is the total time of a single-hole waveform, M is the number of detonator delays involved in the superposition, δtM is the initiation time of the Mth delay, and tmain is the duration time of the single-hole wave’s major vibration part.
The discrete series {(tn, g(tn))} are fitted into a function g(t) in the form of a Fourier series, as shown in Equation (3):
g t = a 0 + l = 1 L a l cos l × t × w + b l sin l × t × w ,
w = 2 π / t 0 ,   a 0 = 1 / N n = 0 N 1 g t n ,
a l = 2 / N n = 0 N 1 g t n cos 2 π l n / N ,
b l = 2 / N n = 0 N 1 g t n sin 2 π l n / N .
where g(t) is the fitted value of the amplitude; t is the time; L is the adjustable series to ensure that the error between the actual and the fitted peak values is acceptable; ω is the fundamental frequency; a0, al, bl are coefficients; N is the total number of sampling points (tn, g(tn)); n is the number of each sampling point (0 ≤ nN − 1); tn is the time coordinate; and g(tn) is the amplitude coordinate.
Since Equation (4) extends the function over the entire time domain, any point outside 0~t0 where the amplitude of the vibration wave exists will have a value of 0:
f t = 0 t 0   g t 0 < t t 0 0 t > t 0 ,
where f(t) is the time-domain expansion function of the single-hole blast vibration waveform.
On this basis, Equation (5) replaces Equation (1)—a continuous function replaces the discrete one. It avoids the problem that the waves cannot be superposed because the detonator’s initiation time δtm is not equal to any sampling time {tn} of the vibration data:
S t = m = 1 M f t δ t m ,
where S″(t) is the predicted waveform function, f(t) is the single-hole waveform, δtm is the initiation time of the mth delay, and M is the total number of the detonator delays involved in the superposition.
S″(t) shows a time-amplitude curve with repeated oscillations; the absolute value of amplitude has the maximum value S″(t)max.
Waveform prediction serves in the selection of blasting parameters. Maximizing the charge per hole to increase the advance per round without exceeding the control threshold [v] of vibration velocity is better. Therefore, several single-shot tests collected vibration data {(tn, g(tn))} for all possible masses (Q) of the explosive charged in a single hole. According to the flow described above, the maximum value S″(t)max is obtained. If S″(t)max is less than the preset threshold [v], this charge Q is available. Then, we took the maximum value of all available charges Q as the final used charge per hole, which could meet the construction needs of maximizing the advance per round.
Figure 1 shows the flow to select the charge amount per hole according to waveform superposition.

2.2. Problem of Linear Superposition Method and Solutions

The equipment could record the observed wave S(t) caused by several cut holes initiated as the design time sequence during blasting. By contrasting the wave S(t) with the predicted wave S″(t), it was possible to evaluate the prediction effect of the linear superposition method. In general, the early stage of cut blasting showed good agreement between the waves S″(t) and S(t), whereas the middle and late stages showed significant discrepancies. The wave S(t) constantly decayed with time and the amplitude per peak gradually shrank. Due to the waveform superposition, the wave S″(t) not only did not decrease over time, but also retained a high peak amplitude.
The reason for these problems was that the linear superposition method did not consider the changes in the free surface during the cut blasting. The linear superposition model for vibration prediction finds it challenging to achieve widespread adoption. To this end, this research looked into a method to identify when the new free surface formed and frame the applicable range/period of the linear superposition method.
However, it is difficult to directly observe the start time and impact of the new free surface from the velocity. This is because a vibrometer breaks down the vibration into three directions: X, Y, and Z. When taking the Z direction as an example, when the particle deviates from its initial position and moves in the positive direction of Z, the vibration velocity is recorded as a positive value. The opposite is recorded as a negative value. Since the vibration of the particle is a reciprocating motion with damping, the velocity value might be positive or negative at times. In addition, the velocity value oscillates between peaks and valleys and does not monotonically vary. This study was therefore required to define a new parameter. The new free surface was characterized and evaluated by analyzing and comparing this parameter. Unlike the velocity, this parameter was required to have a non-negative, single-increasing character. It must be noted that the velocity value could be positive or negative but the energy value was constant. The energy value could be large or small but its cumulative value had to monotonically increase. This study provided an approach to first obtaining the non-negative instantaneous vibration energy from the velocity data. Then, the energy value was integrated to obtain its cumulative value at any moment; i.e., the accumulated energy curve. In this paper, the cumulative value was defined as a new parameter to study the action of the free surface.
Since the vibration wave induced by each hole was assumed to be the same, the accumulated energy curve for the predicted wave S″(t) would steeply rise over time. The appearance of a new free surface during blasting reduced the energy of the observed wave S(t), so its accumulated energy curve could only gradually increase. The two accumulated energy curves corresponding to the two cases diverged based on whether or not to consider the change in the free surface conditions. The time when the divergence appeared was when the new free surface was formed or began to function.

2.3. Vibration Energy Comparison Method

This section describes the specific details of the method used to identify the formation time of the new free surface. First, the observed wave S(t) and the predicted wave S″(t) of a multihole delay blasting were collected. The former was measured on-site and single-hole waves superposed the latter. The Hilbert transform found the instantaneous vibration energy of both waves and then the energy value was integrated to obtain the cumulative value at any moment. To compare the two accumulated energy curves and find the divergence point as the formation time of the new free surface, the details are as follows.
Take the observed wave S(t) as an example. The VMD method can decompose S(t) into many intrinsic mode function (IMF) components. Each IMF component is a time-amplitude function ci(t). The S(t) can be expressed as the sum of each ci(t) and the residual r(t), as shown in Equation (6):
S t = c i t + r t ,
where S(t) is the observed wave, t is the time, ci(t) is its IMF components, i is the number of the component, and r(t) is the residual.
The Hilbert transform is performed on each IMF component ci(t) to obtain H[ci(t)]. Then build the analytic function zi(t) as shown in Equation (7), which is expressed in plural form:
z i t = c i t + j H c i t = a i t e j Φ i t ,
a i t = c i 2 t + H 2 c i t ,   Φ i t = tan 1 H c i t / c i t .
where ai(t) is an amplitude function, Φi(t) is a phase function, dΦi(t)/dt = fi(t). fi(t) is the instantaneous frequency, e is the Napierian base, and j is the imaginary unit.
Equation (8) obtains the Hilbert spectrum H(f, t) and removes the residual r(t):
H f , t = Re i = 1 n z i t = Re i = 1 n a i t e j Φ i t ,
where Re denotes taking the real part of the plural.
By integrating the frequency, Equation (9) defines the Hilbert instantaneous energy IE(t):
I E t = H 2 f , t d f ,
where IE(t) is the instantaneous energy, H(f, t) is the Hilbert spectrum, and f is the frequency.
Equation (10) computes the cumulative value E(t) of the instantaneous energy IE(t) of the wave at each moment:
E t = 0 t I E τ d τ ,
where E(t) is the cumulative value of the instantaneous energy.
The observed wave S(t) is affected by the variation of the free surface condition while the predicted wave S″(t) does not consider the variation in the calculation. After the formation of the new free surface, the two accumulated energy curves E(t) and E″(t) of the instantaneous energy will show a divergence. Given that one of the sides involved in the comparison used a linear superposition model, the difference between the observed and predicted results can be measured using the linear correlation. Equation (11) calculates this linear correlation. Before the formation of the new free surface, the two curves will remain similar with a linear correlation close to one. After that, the blasting process is no longer linear and the similarity between the two will decrease.
ρ t = COV E t , E t STD E t × STD E t ,
where ρ(t) is the linear correlation of the two curves before the moment t, COV is the covariance of the two variables, and STD is the standard deviation of the variables.
Figure 2 shows how to identify the new free-surface formation time.

3. Results

3.1. Engineering Background and Challenges

A significant project in Chongqing is the Yuzhong tunnel in the Xiaoshizi district. Sandstone dominates the tunnel, with surrounding rocks of class IV. The cross-section is 11.5 m in width, 9.5 m in height, and 19–25 m in burial depth. Excavation used the benching tunneling method. The operation environment is complicated. As shown in Figure 3, an ancient arhat temple is now on the grounds surrounded by skyscrapers. The top of the underground tunnel is tangent to subway Line 1 and subway Line 6 runs below it. The ground vibration velocity of the area along the tunnel cannot exceed 1.0 cm·s−1.
The demand was difficult for conventional technology to meet because there were two challenges. One was a small number of available detonator delays. A single delay needs to initiate lots of holes and charges. The vibration velocity is bound to exceed the limit. The other was that using the short-advance partial-excavation method would significantly reduce efficiency and increase costs. It used the new technology of precision-controlled blasting to control blast-induced vibrations in urban underground tunnels while ensuring blasting efficiency.
We customized a new high-precision NONEL detonator series with 25 delays to solve the problems of conventional detonators such as delays being too short and delay errors being significant. We detected 10 samples per delay to test and record the range of the initiation time δtm and renumbered the remaining after removing any that may have jumped the queue. To control the vibration while keeping the regular advance, we arranged eight inclined cut holes during the stage of cut blasting. Each delay of the detonators only initiated one cut hole. The initiation times for the first eight delays were within the time range shown in Figure 4 [26]. There was no error in the first delay. After the cut blasting, the difficulty of breaking the rock was reduced and replaced with one delay to initiate multiple holes.
Using this idea, the problem transformed into how to predict the vibration induced by cut blasting and how to maximize the single hole charge/advance per round without exceeding the blast vibration limit. The linear superposition method can predict the wave for the entire duration of cut blasting but does not consider the changes caused by the formation process of the new free surface, which will inevitably lead to inaccurate vibration prediction results after the new free surface’s formation at the later stage of cut blasting. Thus, it was best to identify the new free surface’s formation time using the method described in this paper, then the optimal parameters were selected by using waveform superposition.

3.2. Identification of New-Free-Surface Formation Time

The actual blasting arranged eight cut holes with 1.0 kg of explosive in each with each detonator delay corresponding to one blast hole. We placed a monitoring instrument (a TC4850 or TC4850N blast vibrometer) on the ground closest to the blast source. The placement was approximately 20 m from the geometric center of the cutting area. For this shallow-buried tunnel in an urban area, our test distance generally did not exceed 50 m. The sampling frequency was 8 kHz, which balanced the needs of the blast vibration signal’s highest frequency, the capture of the maximum vibration velocity, and the delay error of the detonator. Figure 5 shows that the observed vibration signal S(t) lasted for 2 s. The vibration wave was divided into five IMF components using the VMD method. The envelopes of components were derived through the Hilbert transform, as shown in Figure 6.
The magnitudes of IMF1–IMF3 were considerable and the attenuation impact of IMF3 was evident, as shown in Figure 6. Therefore, according to the envelope of IMF3, the VMD method identified the actual initiation times of the first six delays as 0 ms, 38.5 ms, 77.25 ms, 102.25 ms, 135.125 ms, and 162.75 ms, combined with the possible initiation times indicated by the detonator samples, as shown in Figure 7. The initiation times of the third and fourth delays were earlier than the detonator sample test results and the remaining delays were within the range obtained from the detonator sample test.
We also conducted several single-shot tests. Each hole contained 1.0 kg of explosives. The blast hole initiation conditions were the same as those of the first blast hole of the actual blast on site for both single-free surface conditions. The test obtained single-hole vibration data {(tn, g(tn))} as shown in Figure 8. We chose a smooth, full vibration curve among theses to calculate with 4–5 peaks in the major vibration part. The predicted signal S″(t) was obtained by superposing the data according to the identified initiation time sequence (δt1, δt2, …, δt6).
Figure 9 compares the two vibration curves of S(t) and S″(t). The amplitudes of the observed and predicted waves were relatively consistent at the early stage of the cut blasting. After that, the amplitudes of the two curves appeared significantly different. The observed wave S(t) showed a significant attenuation. The cause was the formation of a new free surface during blasting, which altered the situation of the rock around the holes initiated later and affected the vibration intensity. However, the predicted wave S″(t) constructed using the linear superposition method increased the amplitude rather than decreasing it. Since the velocity value was sometimes positive and sometimes negative, as well as sometimes increasing and sometimes decreasing, we could not obtain an accurate formation time of the new free surface by simply comparing the velocity signals. We needed another stable and reliable parameter. Thus, we found the accumulated energy curves of S(t) and S″(t).
Figure 10 compares the accumulated energy curves E(t) and E″(t) calculated from S(t) and S″(t) according to Equations (6)–(10). The two curves agreed very well until 60 ms after initiation. After that, the trends of the two curves appeared to be significantly different. The curve E(t) from the observed wave S(t) increased slowly while the curve E″(t) from the predicted wave S″(t) maintained a trend of high increase. The difference between the two gradually increased with time. The vibration-reduction effect of the new free surface was visible.
Here, we needed to recall the principle to determine the new free surface. Assuming that the initiations of each cut hole were independent and did not interfere with each other and each had the same initiation conditions, this could be considered a linear model. The actual blasting process was a nonlinear model due to the inclusion of nonlinear factors such as the new free surface. The linear correlation curves of the two models with time could describe when the new free surface formed and when it played a significant role.
The linear correlation ρ(t) measured the exact moment of separation of E(t) and E″(t). As seen in Figure 11, the linear correlation of the two accumulated energy curves was high until 64.5 ms, indicating that the new free surface had not yet formed or was not yet functional. From 64.5 ms to 91.375 ms, the linear correlation of the two curves decreased rapidly, indicating that the new free surface was forming and acting on the blast vibration, which affected the correctness of the linear superposition model. After 91.375 ms, the free surface had fully formed and the linear correlation between the two has rebounded. Therefore, a new free surface formed at 64.5 ms during the blasting in this project.

3.3. Selection of Charge Amount per Hole

A new free surface formed at 64.5 ms after the detonators of the first and second delays initiated. Since its action was still not stabilized until 91.375 ms, for safety reasons, we needed to superpose the single-hole waves of the first three blast holes to optimize the single-hole charge amount.
We conducted single-shot tests in the field to select the optimal charge to achieve safety and a high advance. The Monte Carlo method was used to select 1000 initiation time sequences at random at first to simulate the detonations’ randomness. Then, 1000 different superposed waves were superposed by single-hole waves according to the sequences. Each superposed wave had a peak velocity. After comparison, we could obtain the maximum value of the peak velocity for the different single-hole charges. This was the most unfavorable situation for vibration control. Therefore, it was used to judge whether the charge amount in a single hole would cause the superposed vibration to exceed the limit in blasting practice. Table 1 and Table 2 shows the calculation results.
Figure 12 shows the single-hole waves for 1.0 kg and 1.2 kg and their superposition process. For each hole with 1.0 kg of explosive, the wave of the first delay was f1.0(t). If the detonators of the second and the third delays initiated at 37.77 ms and 88.90 ms, respectively, the superposed wave was f1.0(t) + f1.0(t − 37.77) + f1.0(t − 88.90). The maximum vibration peak of the superposed wave was 0.775 cm·s−1. For each hole with 1.2 kg of explosive, the wave of the first delay was f1.2(t). If the detonators of the second and third delays initiated at 41.37 ms and 91.94 ms, respectively, the superposed wave was f1.2(t) + f1.2(t − 41.37) + f1.2(t − 91.94). The maximum vibration peak of the superposed wave was 0.868 cm·s−1. Thus, in theory, 1.0 kg or 1.2 kg explosive charged in each hole could ensure that the vibration peak did not exceed the safety threshold before the formation of the new free surface.

3.4. Application on Site

The Yuzhong tunnel is a double-tube tunnel; the left tube has a larger area of 149 m2. The center diaphragm (CD) method was applied to excavate the upper bench of the left track.
Since we only selected 10 samples per detonator delay to test their actual initiation times in the sample test, the range of initiation times for each delay may have been narrower. In addition, although the new free surface could reduce the vibration amplitude of the subsequent holes, it still had the possibility of exceeding the control threshold [v] of vibration velocity after superposing with the first three holes.
For safety reasons, half of the working face area (1) was detonated first; we charged each cut hole with 1.0 kg to ensure that the blast vibration did not exceed the threshold of 1.0 cm·s−1. Figure 13 shows the actual layout of the blast holes. For the first four delays of the detonators, one delay had one blast hole. For the fifth and sixth delays of the detonators, they all had two holes. Sixteen blasts were executed in one month using this design. We measured the vibration velocity on the ground each time. The maximum vibration velocity was 0.90 cm·s−1, which did not exceed the threshold, as shown in Figure 14. The velocity from 64.5 ms to 91.375 ms was significantly smaller than for the other periods. The operation results showed that the new free surface achieved the expected vibration reduction.

4. Conclusions

The innovation of this paper was that from the perspective of vibration control of urban shallow-buried tunnels, an identification method of new-free-surface formation time was given. At present, there is no unified definition of the formation standard of a free surface in practice, so the formation time of a new free surface cannot be accurately identified. In the past, even if high-precision detonators and hole-by-hole initiation were used, researchers could only ignore the new free surface and calculate all possible vibration waves caused by multihole cut blasting by using the traversal method. Such calculations are conservative and time-consuming. Our method provides a basis for further improvements in vibration-control technology.
(1)
A vibration-prediction method that considered the action of the newly created free surface during blasting was proposed. The crucial step was to determine the formation time of the new free surface by comparing the vibration energy. The specific process combined the detonator sample test of each delay with the VMD method so the exact initiation time sequence of each delay could be determined in the observed blast vibration wave. The predicted wave with the same initiation time sequence was constructed using the linear superposition method. The Hilbert transform then found the accumulated energy curves of the observed and predicted the vibration waves. The new-free-surface formation time was found by comparing the linear correlation of the two curves.
(2)
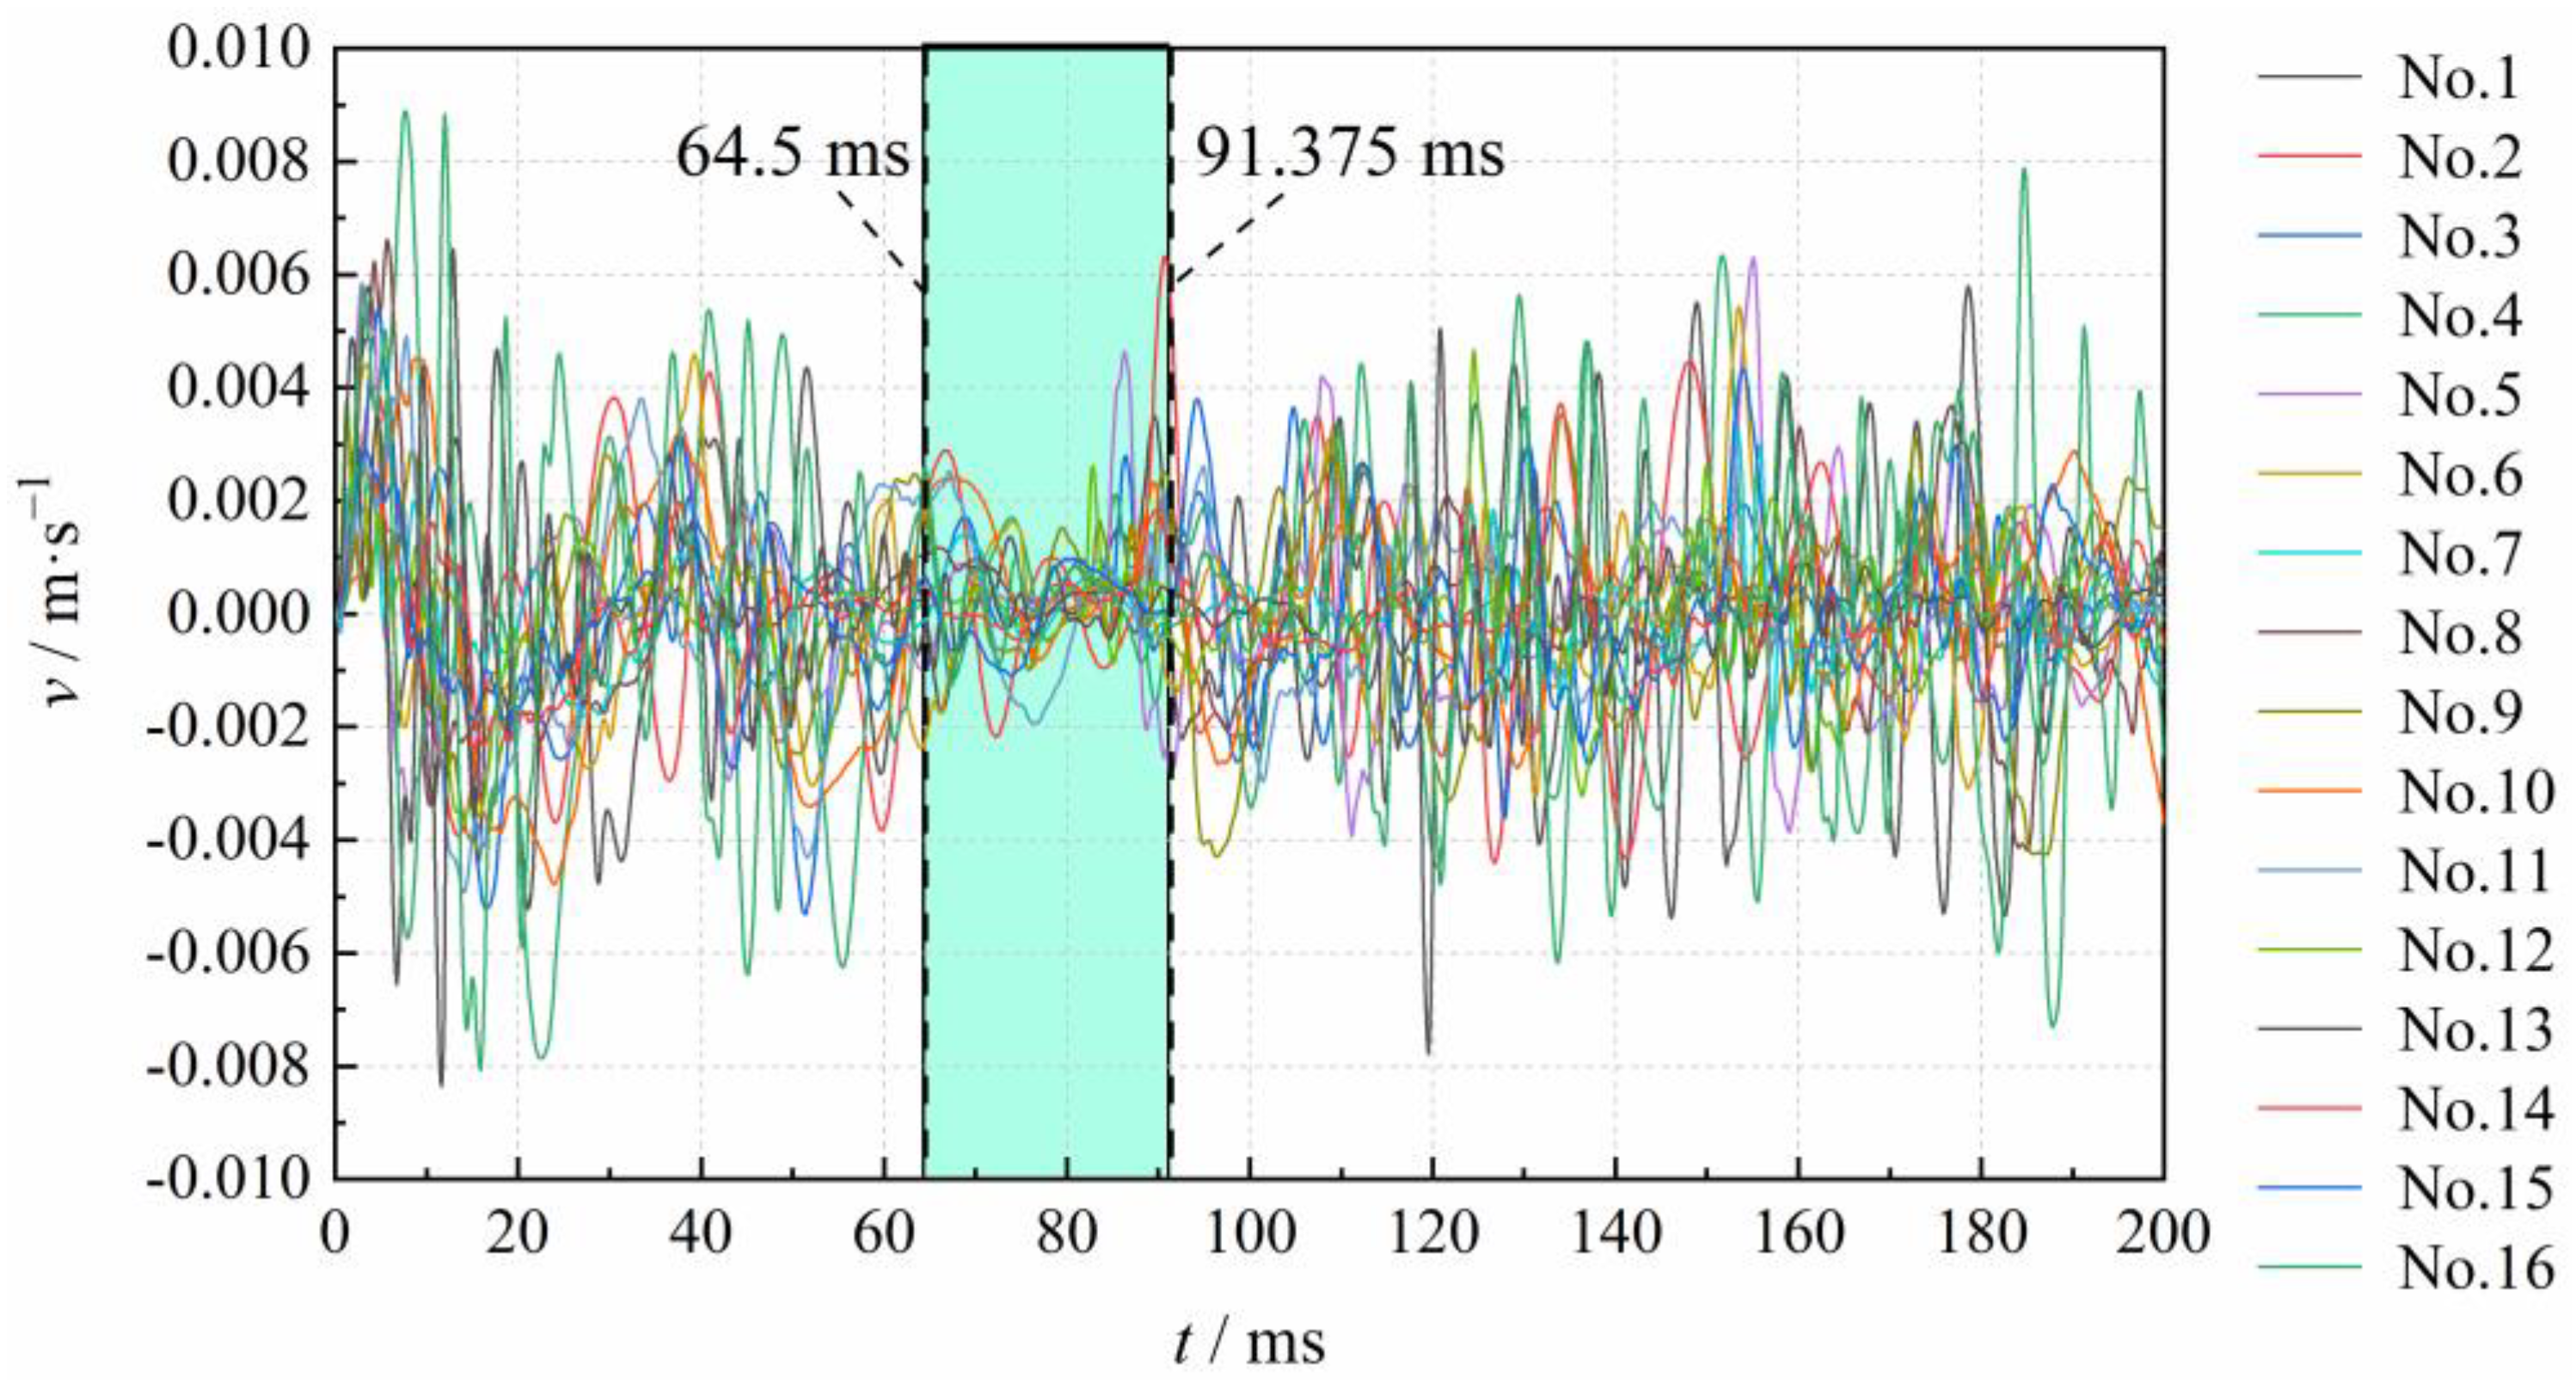
The formation time of the new free surface was determined to be 64.5 ms through the case study, while the change in rock conditions around the blast hole caused by its action could last up to 91.375 ms. For this reason, the applicable range of the linear superposition model for predicting the superposed vibration velocity was determined to be the first three blast holes. The maximum vibration peaks that could be achieved by using 1.0 kg and 1.2 kg in a single-hole charge were 0.775 cm-s−1 and 0.868 cm-s−1, respectively, under a vibration velocity threshold of 1.0 cm-s−1. Considering that the actual range of the detonator’s delay error may have been larger and due to the superposed effect of vibration caused by subsequent holes, a single-hole charge of 1.0 kg was finally used to ensure blasting safety.
(3)
There is great potential for solving complex blast calculation problems through the rapid development of computer technology. Since NONEL detonators have a wide range of delay errors, using their nominal initiation times to calculate superposed waves is simple but can result in significant errors. If the enumeration method traverses all possible initiation time groups, it will consume a lot of time. This paper used the Monte Carlo method to simulate the randomness of detonations, which saved computing time and accurately obtained the maximum superposed vibration velocity value. The blasting results in the field showed that the selected charge could meet the requirements for low-vibration velocity control.

Author Contributions

Conceptualization, H.W. and M.G.; methodology, H.W. and X.L.; software, Q.Z.; validation, H.W. and X.L.; formal analysis, H.W.; investigation, H.W., M.G., and X.W.; resources, M.G.; data curation, H.W.; writing—original draft preparation, H.W.; writing—review and editing, H.W., M.G., and Q.Z.; visualization, H.W., M.G., and Q.Z.; supervision, H.W. and X.W.; project administration, M.G.; funding acquisition, M.G. All authors have read and agreed to the published version of the manuscript.

Funding

This research was supported by the Fundamental Research Funds for the Central Universities (No. FRF-AT-19-005).

Institutional Review Board Statement

Not applicable.

Informed Consent Statement

Not applicable.

Data Availability Statement

Not applicable.

Acknowledgments

The authors sincerely thank all the editors and reviewers for their support and help.

Conflicts of Interest

The authors declare no conflict of interest.

References

  1. Verma, H.; Samadhiya, N.; Singh, M.; Goel, R.; Singh, P. Blast induced rock mass damage around tunnels. Tunn. Undergr. Space Technol. 2018, 71, 149–158. [Google Scholar] [CrossRef]
  2. Qu, S.; Yang, J.; Zhu, S.; Zhai, W.; Kouroussis, G.; Zhang, Q. Experimental study on ground vibration induced by double-line subway trains and road traffic. Transp. Geotech. 2021, 29, 100564. [Google Scholar] [CrossRef]
  3. Agrawal, H.; Mishra, A. Probabilistic analysis on scattering effect of initiation systems and concept of modified charge per delay for prediction of blast induced ground vibrations. Measurement 2018, 130, 306–317. [Google Scholar] [CrossRef]
  4. Ding, Z.; Nguyen, H.; Bui, X.-N.; Zhou, J.; Moayedi, H. Computational Intelligence Model for Estimating Intensity of Blast-Induced Ground Vibration in a Mine Based on Imperialist Competitive and Extreme Gradient Boosting Algorithms. Nat. Resour. Res. 2020, 29, 751–769. [Google Scholar] [CrossRef]
  5. Yan, Y.; Hou, X.; Fei, H. Review of predicting the blast-induced ground vibrations to reduce impacts on ambient urban communities. J. Clean. Prod. 2020, 260, 121135. [Google Scholar] [CrossRef]
  6. Yang, J.; Cai, J.; Yao, C.; Li, P.; Jiang, Q.; Zhou, C. Comparative Study of Tunnel Blast-Induced Vibration on Tunnel Surfaces and Inside Surrounding Rock. Rock Mech. Rock Eng. 2019, 52, 4747–4761. [Google Scholar] [CrossRef]
  7. Jayasinghe, B.; Zhao, Z.; Chee, A.G.T.; Zhou, H.; Gui, Y. Attenuation of rock blasting induced ground vibration in rock-soil interface. J. Rock Mech. Geotech. Eng. 2019, 11, 770–778. [Google Scholar] [CrossRef]
  8. Zeng, Y.; Li, H.; Xia, X.; Liu, B.; Zuo, H.; Jiang, J. Blast-induced rock damage control in Fangchenggang nuclear power station, China. J. Rock Mech. Geotech. Eng. 2018, 10, 914–923. [Google Scholar] [CrossRef]
  9. Sharafat, A.; Tanoli, W.A.; Raptis, G.; Seo, J.W. Controlled blasting in underground construction: A case study of a tunnel plug demolition in the Neelum Jhelum hydroelectric project. Tunn. Undergr. Space Technol. 2019, 93, 103098. [Google Scholar] [CrossRef]
  10. Matidza, M.I.; Jianhua, Z.; Gang, H.; Mwangi, A.D. Assessment of Blast-Induced Ground Vibration at Jinduicheng Molybdenum Open Pit Mine. Nat. Resour. Res. 2020, 29, 831–841. [Google Scholar] [CrossRef]
  11. Ainalis, D.; Kaufmann, O.; Tshibangu, J.-P.; Verlinden, O.; Kouroussis, G. Modelling the Source of Blasting for the Numerical Simulation of Blast-Induced Ground Vibrations: A Review. Rock Mech. Rock Eng. 2017, 50, 171–193. [Google Scholar] [CrossRef]
  12. Azizabadi, H.R.M.; Mansouri, H.; Fouché, O. Coupling of two methods, waveform superposition and numerical, to model blast vibration effect on slope stability in jointed rock masses. Comput. Geotech. 2014, 61, 42–49. [Google Scholar] [CrossRef]
  13. Liu, J.; Zhang, Y.; Yun, B. A new method for predicting nonlinear structural vibrations induced by ground impact loading. J. Sound Vib. 2012, 331, 2129–2140. [Google Scholar] [CrossRef]
  14. Agrawal, H.; Mishra, A.K. An innovative technique of simplified signature hole analysis for prediction of blast-induced ground vibration of multi-hole/production blast: An empirical analysis. Nat. Hazards 2020, 100, 111–132. [Google Scholar] [CrossRef] [Green Version]
  15. Zhang, H.; Li, T.; Wu, S.; Zhang, X.; Gao, W.; Shi, Q. A study of innovative cut blasting for rock roadway excavation based on numerical simulation and field tests. Tunn. Undergr. Space Technol. 2021, 119, 104233. [Google Scholar] [CrossRef]
  16. Chandrakar, S.; Paul, P.; Sawmliana, C. Influence of void ratio on “Blast Pull” for different confinement factors of development headings in underground metalliferous mines. Tunn. Undergr. Space Technol. 2020, 108, 103716. [Google Scholar] [CrossRef]
  17. Tian, X.; Song, Z.; Wang, J. Study on the propagation law of tunnel blasting vibration in stratum and blasting vibration reduction technology. Soil Dyn. Earthq. Eng. 2019, 126, 105813. [Google Scholar] [CrossRef]
  18. Yang, J.H.; Lu, W.B.; Jiang, Q.H.; Yao, C.; Zhou, C.B. Frequency comparison of blast-induced vibration per delay for the full-face millisecond delay blasting in underground opening excavation. Tunn. Undergr. Space Technol. 2016, 51, 189–201. [Google Scholar] [CrossRef]
  19. Zhang, Z.X.; Hou, D.F.; Guo, Z.; He, Z.; Zhang, Q. Experimental study of surface constraint effect on rock fragmentation by blasting. Int. J. Rock Mech. Min. Sci. 2020, 128, 104278. [Google Scholar] [CrossRef]
  20. Huo, X.; Shi, X.; Qiu, X.; Chen, H.; Zhou, J.; Zhang, S.; Rao, D. Study on Rock Damage Mechanism for Lateral Blasting under High In Situ Stresses. Appl. Sci. 2021, 11, 4992. [Google Scholar] [CrossRef]
  21. Qiu, X.; Shi, X.; Gou, Y.; Zhou, J.; Chen, H.; Huo, X. Short-delay blasting with single free surface: Results of experimental tests. Tunn. Undergr. Space Technol. 2018, 74, 119–130. [Google Scholar] [CrossRef]
  22. Blair, D. The free surface influence on blast vibration. Int. J. Rock Mech. Min. Sci. 2015, 77, 182–191. [Google Scholar] [CrossRef]
  23. Dragomiretskiy, K.; Zosso, D. Variational Mode Decomposition. IEEE Trans. Signal Process. 2013, 62, 531–544. [Google Scholar] [CrossRef]
  24. Shi, X.-Z.; Qiu, X.-Y.; Zhou, J.; Chen, X.; Fan, Y.-Q.; Lu, E.-W. Application of Hilbert-Huang transform based delay time identification in optimization of short millisecond blasting. Trans. Nonferrous Met. Soc. China 2016, 26, 1965–1974. [Google Scholar] [CrossRef]
  25. Wang, Z.; Fang, C.; Chen, Y.; Cheng, W. A comparative study of delay time identification by vibration energy analysis in millisecond blasting. Int. J. Rock Mech. Min. Sci. 2013, 60, 389–400. [Google Scholar] [CrossRef]
  26. Wu, H.; Gong, M. Calculation and application of hole by hole blasting vibration superposition based on measured delay times of detonators. Explos. Shock. Waves 2019, 39, 151–161. (In Chinese) [Google Scholar] [CrossRef]
Figure 1. Selection of optimal charge.
Applsci 12 10061 g001
Figure 2. Identification flow.
Applsci 12 10061 g002
Figure 3. Buildings around the tunnel.
Applsci 12 10061 g003
Figure 4. Initiation time range of detonators per delay.
Applsci 12 10061 g004
Figure 5. Observed wave.
Applsci 12 10061 g005
Figure 6. IMF components and envelopes: (a) IMF component 1; (b) Envelope 1; (c) IMF component 2; (d) Envelope 2; (e) IMF component 3; (f) Envelope 3; (g) IMF component 4; (h) Envelope 4; (i) IMF component 5; (j) Envelope 5.
Applsci 12 10061 g006
Figure 7. Envelope of the IMF3.
Applsci 12 10061 g007
Figure 8. Hole layout of the cut blasting test and a single-hole wave from the single-shot test.
Applsci 12 10061 g008
Figure 9. S(t) and S’(t).
Applsci 12 10061 g009
Figure 10. E(t) and E’(t).
Applsci 12 10061 g010
Figure 11. Linear correlation ρ of E(t) and E’(t).
Applsci 12 10061 g011
Figure 12. Single-hole waves and superposition process: (a) superposition of three waves (each hole had 1.0 kg of explosives); (b) superposition of three waves (each hole had 1.2 kg of explosives).
Applsci 12 10061 g012
Figure 13. Blasting excavation design of CD method.
Applsci 12 10061 g013
Figure 14. Vibration wave curves.
Applsci 12 10061 g014
Table 1. The results of solving for the maximum value of vibration velocity when the charge amount was 1.0 kg in a single hole.
No.δ2/msδ3/msPeak of S″(t)|/cm·s−1
144.6090.480.629
247.9090.900.638
71237.7788.900.775
99944.6287.190.639
100038.0689.700.769
Table 2. The results of solving for the maximum value of vibration velocity when the charge amount was 1.2 kg in a single hole.
No.δ2/msδ3/msPeak of|S″(t)|/cm·s−1
147.7787.830.783
238.7287.070.785
79441.3791.940.868
99943.0487.160.842
100046.0090.930.803
Publisher’s Note: MDPI stays neutral with regard to jurisdictional claims in published maps and institutional affiliations.

