Article

Employing Discrete Solid Phases to Represent C-S-H Solid Solutions in the Cemdata07 Thermodynamic Database to Model Cement Hydration Using the PHREEQC Geochemical Software

1
School of Civil & Structural Engineering, Technological University Dublin, D07 EWV4 Dublin, Ireland
2
Institute of Advanced Study, Collegium Basilea, 4053 Basel, Switzerland
3
Department of Civil & Environmental Engineering, University College Cork, T12 K8AF Cork, Ireland
*
Author to whom correspondence should be addressed.
Appl. Sci. 2022, 12(19), 10039; https://doi.org/10.3390/app121910039
Submission received: 21 September 2022 / Revised: 30 September 2022 / Accepted: 2 October 2022 / Published: 6 October 2022

Abstract

:
This paper presents a cement hydration model over time using the cemdata07 thermodynamic database and a series of derived discrete solid phases (DSPs) to represent calcium silicate hydrate (C-S-H) as a binary solid solution with two end-members. C-S-H in cement is amorphous and poorly crystalline with a range of molar Ca/Si ratios from 0.6 to 1.7. It displays strongly incongruent dissolution behaviour, where the release of calcium into solution is several orders of magnitude greater than silicon. It is, therefore, important that any cement hydration model provides a credible account of this behaviour. C-S-H has been described in the cemdata07 thermodynamic database as a number of solid solutions using different end-members with differing levels of complexity. While solid solutions can be included in most modern geochemical software programs, they often lead to a significant increase in computation time. This paper presents how an incongruent solid solution between two C-S-H end-members may be represented as a number of DSPs to model cement hydration over time using the PHREEQC geochemical software. By using DSPs rather than modelling C-S-H as a nonideal solid solution, this gives the user full control of the input for the model, reducing the computational demand and analysis time with no loss in accuracy in predicting stable-phase assemblages and their associated pore chemistry over time.

1. Introduction

Predictions of solid hydrate formation and pore solution chemistry over time using thermodynamic modelling has been shown to be a reliable method by several authors for many cement systems. To simulate hydration using thermodynamics requires descriptions of the solids and dissolved species in the system, along with data on the clinker oxide proportions, water/cement (w/c) ratio, curing temperature, relative humidity and Blaine fineness of the cement. To accurately model hydration over time, empirical rate equations are used to describe the dissolution of OPC clinker phases. Oxide components dissolved in the OPC clinker phases, the oversaturation of specific phases during the first 12 h of hydration and the release and uptake of alkali elements (K and Na) by C-S-H are also believed to produce accurate predictions.
The widely used and freely available geochemical software PHREEQC has been shown by the authors of [1] to be capable of predicting the hydration behaviour of Portland cement over time using an appropriate thermodynamic database and the molar reaction equations for the four main clinker phases alite (Ca3SiO5, C3S), belite (Ca2SiO4, C2S), aluminate (Ca3Al2O6, C3A) and aluminoferrite (Ca4Al2Fe3O10, C4AF). PHREEQC employs the law of mass action equations to perform complex geochemical simulations, allowing for the inclusion of kinetics and rates, details of which can be found in the literature [2,3,4,5,6,7,8,9,10].
C-S-H in cement is amorphous and poorly crystalline with a range of molar Ca/Si ratios between 0.6 and 1.7. It displays strongly incongruent dissolution behaviour, where the release of calcium into solution is several orders of magnitude greater than that of silicon. It is, therefore, important that any cement hydration model used to predict stable-phase assemblages, pH and pore chemistries over time employs a suitable C-S-H gel solubility model to accurately describe its variable composition and solubility behaviour. An example of this incongruent dissolution behaviour is given in [11].
Solid solutions are homogeneous crystalline structures where one or more component can be partly or wholly substituted on specific lattice sites with moieties of equivalent charge. If the host and substituting moieties are chemically similar, the formation of an ideal solid solution is possible. However, as is often the case, differences are sufficiently large enough to cause the formation of a nonideal solid solution, which can be readily confirmed by the appearance of a miscibility gap [12]. Solid solutions are of great importance in cement chemistry, where they can be used to describe the strongly incongruent dissolution behaviour of calcium silicate hydrate (C-S-H) gel [13,14], the substitution of SiO44− and 4OH in hydrogarnets [15,16,17] and the substitution of cationic Al3+ and Fe3+ and anionic 2OH, 2Cl, SO42− and CO32− components in AFt and AFm minerals [15,16,17].
If the thermodynamic properties of the unsubstituted and pure end-members are known, it is possible to calculate a series of DSPs that can be used to provide a credible thermodynamic model of cement hydration. Work by [18] demonstrates that DSPs can be derived for any ideal or nonideal solid solution. For example, [19] developed a DSP C-S-H gel solubility model based on two binary, nonideal, solid solutions that yielded satisfactory predictions of pH, Ca and Si concentrations for molar Ca/Si (C/S) ratios from 0 to 2.7, the occurrence of portlandite at C/S > 1.65, amorphous silica at C/S < 0.55 and congruent dissolution at C/S = 0.85. Previous work employing the density functional theory (DFT) [20,21] developed thermodynamic predictions for silicate hydrates and other chemical systems and provided accurate predictions of thermochemistry using constitutive models.
In the current paper, DSPs are derived for the jennite and tobermorite-II C-S-H gel solubility models in cemdata07 [7] and used to predict ordinary Portland cement (OPC) hydration as a function of time using the geochemical code PHREEQC. The results are compared to the experimentally supported GEM predictions from [22] using cemdata07 to provide comparisons. While a newer version of the cemdata07 database is now available [23], and other solid solution models are available, such as CSH-3T and CSHQ [23], the cemdata07 database and the jennite and tobermorite-II C-S-H gel solubility models are used here to demonstrate the accuracy of the DSP approach and how it can be simply applied in PHREEQC to model cement hydration. It is shown how this methodology gives the user full control of the input for the model with a faster follow-on analysis time and, most importantly, no loss in accuracy in the prediction of phase assemblages and pore chemistry as hydration continues.

2. Derivation of Discrete Solid Phases (DSPs) from Cemdata07 Solid Solution End-Members

The first step in deriving a series of DSPs was defining the pure end-members and their thermodynamic properties in terms of Gibbs free energy (G, J/mol), enthalpy (H, J/mol), entropy (S, J/K/mol), heat capacity (Cp, J/K/mol) and molar volume (V, cm3/mol) (see Table 1) [7]. These thermodynamic properties could then be used to calculate the solubility constant, log K and its variation with temperature for the dissolution reactions of each end-member (Table 2). As shown, the end-members were listed in order of increasing solubility and the analytical expressions described the variation of log K as a function of temperature (in Kelvin) where a, c and d were calculated using Equation (1) as functions of enthalpy (∆rH, J/mol), entropy (∆rS, J/K/mol) and heat capacity (∆rCp, J/K/mol) of reaction [7], b, e and f = 0, and T denotes temperature. Each of the end-members shown in Table 2 and their respective analytical expressions were written directly into PHREEQC to suit its data input syntax.
log K = a + b · T + c/T + d · log10(T) + e · T−2 + f · T2
Next, appropriate mole fractions were chosen to discretise the solid solutions and create the series of DSPs. In the current paper, mole fraction increments of 0.2 were used to describe the two-end-member CSH model in terms of Xi and Xj, where the sum of the mole fractions in each solid solution had to equal one. Using these mole fractions, the solid phase composition (CaO, SiO2, H2O), aqueous reaction components (H+, Ca+2, H2O and SiO2(aq)), mass (g/mol) and volume (cm3/mol) were determined for each DSP based on the original end-members. The solubility constant was determined for each DSP in the CSH model using Equation (2), where Ki and Kj are the log K values of the end-members.
K = (Ki·Xi)Xi·(Kj·Xj)Xj
The modelling of OPC hydration required a credible account of the kinetic dissolution of the clinker phases as a function of time [24], the oversaturation of the precipitating hydrate phases during the first 12 h of hydration [25] and the release and uptake of alkali metals (K and Na) by the C-S-H gel [26]. To minimise the computing time, all input data were defined in an Excel spreadsheet and transferred directly into the PHREEQC input file.
The above shows how the C-S-H gel’s solubility could be modelled as a series of DSPs, which, here, were derived from the jennite and tobermorite-II end-members provided in the cemdata07 database. However, a solid solution model was not needed to model the OPC hydration, which, in fact, only required portlandite and a suitable C-S-H gel phase of a fixed calcium to silica (Ca/Si) ratio between 1.6 and 1.8 and a water/Si (H/Si) molar ratio between 2.0 and 2.1. In the DSP model presented in [19], these values were closely matched by the CSH(165) phase, which had a Ca/S ratio of 1.65 and H/Si ratio of 2.1167. As shown in Figure 1, the TobJenSS_CS150 DSP was the only one predicting the precipitation of the C-S-H gel, which, with a Ca/Si ratio of 1.50 and H/Si ratio of 1.947, was not suitable to represent the C-S-H gel in the hydrated OPC. The jennite and tobermorite-II model should, therefore, only be used in cement blends where lower C/S ratios are purposefully targeted by the addition of supplementary cementitious materials (SCMs). Going forward, only the TobJenSS_CS150 phase (Table 2) was used in the analysis to represent the C-S-H gel in the PHREEQC model used here.
Solid solution modelling encompassed all known synthetic ranges of C-S-H gels, which, in fact, were only needed if portlandite was lost and the Ca/Si ratio in the C-S-H gel was lowered, either by the addition of siliceous SCM or by chemical degradation in increasingly larger volumes of leachate provided by the ingress of groundwater or seawater.

3. Thermodynamic Modelling of Cement Hydration

This section described how a full cement hydration simulation could be undertaken using PHREEQC after preprocessing/defining the input in Excel and outputting the results in tabular or graphical formats. The input requirements of the spreadsheet included the definition of the cement composition in terms of oxide proportions of SiO2, Al2O3, Fe2O3, CaO, MgO, Na2O, K2O, CaO as free lime, CO2, SO3 (%), the w/c ratio (−), curing temperature (°C), relative humidity (%) and Blaine fineness (m2/kg) as per [22] (Table 3).
The spreadsheet defined the required input for every time step up to 1000 days hydration as a series of 47 individual solutions. The time intervals used here allowed for the simulation to be undertaken in a relatively short time. The output from the full analysis could be given in tabular and/or graphical formats. The current output provided included volumes and masses of phase assemblages, clinker dissolution and degree of hydration, Ca/Si ratios in the C-S-H system, pH, pore solution chemistry and ionic strength after each time step. Equilibrium constants at 20 °C were used to describe the dissolution reactions of solid phases and the formation reactions of aqueous species/complexes in the analysis [7,22].

3.1. OPC Clinker Rate Equations

The dissolution of the four main clinker phases was described with the empirical rate equations proposed by [24] and modified by Lothenbach and coworkers [7], using Equations (3)–(5) for any specified time step. In this paper, the empirical expressions and the constants used in their approach can be found in Table 3, described by Lothenbach et al. [22]. A variable time step was used so that, here, only 47 steps were required to predict the dissolution of the four clinker phases for 1000 days of hydration.
R t = K N 1 α t l n 1 α t 1 N   · A A 0 · e x p E a m R 1 T 1 T 0 · R H 0.55 0.45 4 · f w c
R t = K 1 α t 2 3 1 1 α t 1 3 · e x p E a m R 1 T 1 T 0 · R H 0.55 0.45 4 · f w c
R t = K 1 α t N · e x p E a m R 1 T 1 T 0 · R H 0.55 0.45 4 · f w c
f w c = ( 1 + 3.333 · ( H · w / c α tot ) ) 4 ;   for   α tot   >   H   ·   w / c

3.2. Dissolution of Oxides Dissolved in OPC Clinker

In addition to determining the clinker proportions, the spreadsheet predefined the molar amounts of the oxide components (K2O, Na2O, MgO and SO3) dissolved in the OPC clinker phases (C3S, C2S, C3A and C4AF). These were defined using compositions described by [27] in Table 4. The dissolution of the oxide components was then proportional to the dissolution of the OPC clinker phases, as described in the preceding section.

3.3. Accessory Clinker Phases

The remaining accessory clinker phases, free lime (CaO), calcite (CaCO3), gypsum (CaSO4(H2O)2), periclase (MgO), arcanite (K2SO4) and thenardite (Na2SO4) were allowed to reach equilibrium with the pore solution in the first time step. These minerals were, therefore, immediately available to dissolve and contribute to the formation of hydrate phases. Due to the immediate availability of free lime and periclase, for example, small amounts of portlandite and brucite were precipitated in the first time step. Table 5 shows the modelling approach used for the various clinker phases in the current model, building on the approach used by [28], where the alkalis were not included in the analysis.

3.4. Oversaturation

It has been reported in the literature [25] that solutions are oversaturated with respect to gypsum, portlandite, syngenite and ettringite during the first 12 h of cement hydration. To increase the solubility of these phases during the first 12 h of hydration, and to also include C-S-H and brucite, an oversaturation factor of 0.15(n) was applied, where n is the number of charged species involved in the dissolution reaction (Table 6). Furthermore, as a result, gypsum was inhibited from precipitating, as it would be fully depleted within this 12 h timeframe. In PHREEQC, the oversaturation factor was used as the target saturation index in the EQUILIBRIUM PHASES keyword, which then returned to zero after 12 h of hydration.

3.5. Alkalis Binding to the C-S-H

The distribution of the alkali elements K and Na between the pore solution and the C-S-H was defined within the PHREEQC input file using KINETIC and RATES data blocks, which were solved at every time step. The authors of [7,22,25] used a distribution coefficient (kd, mL/g) of 0.42 for both K and Na based on the C-S-H gel having a Ca:Si ratio = 1.8, following the work of [26]. Here, the same distribution ratio used for both alkalis was 0.42 based on [26].

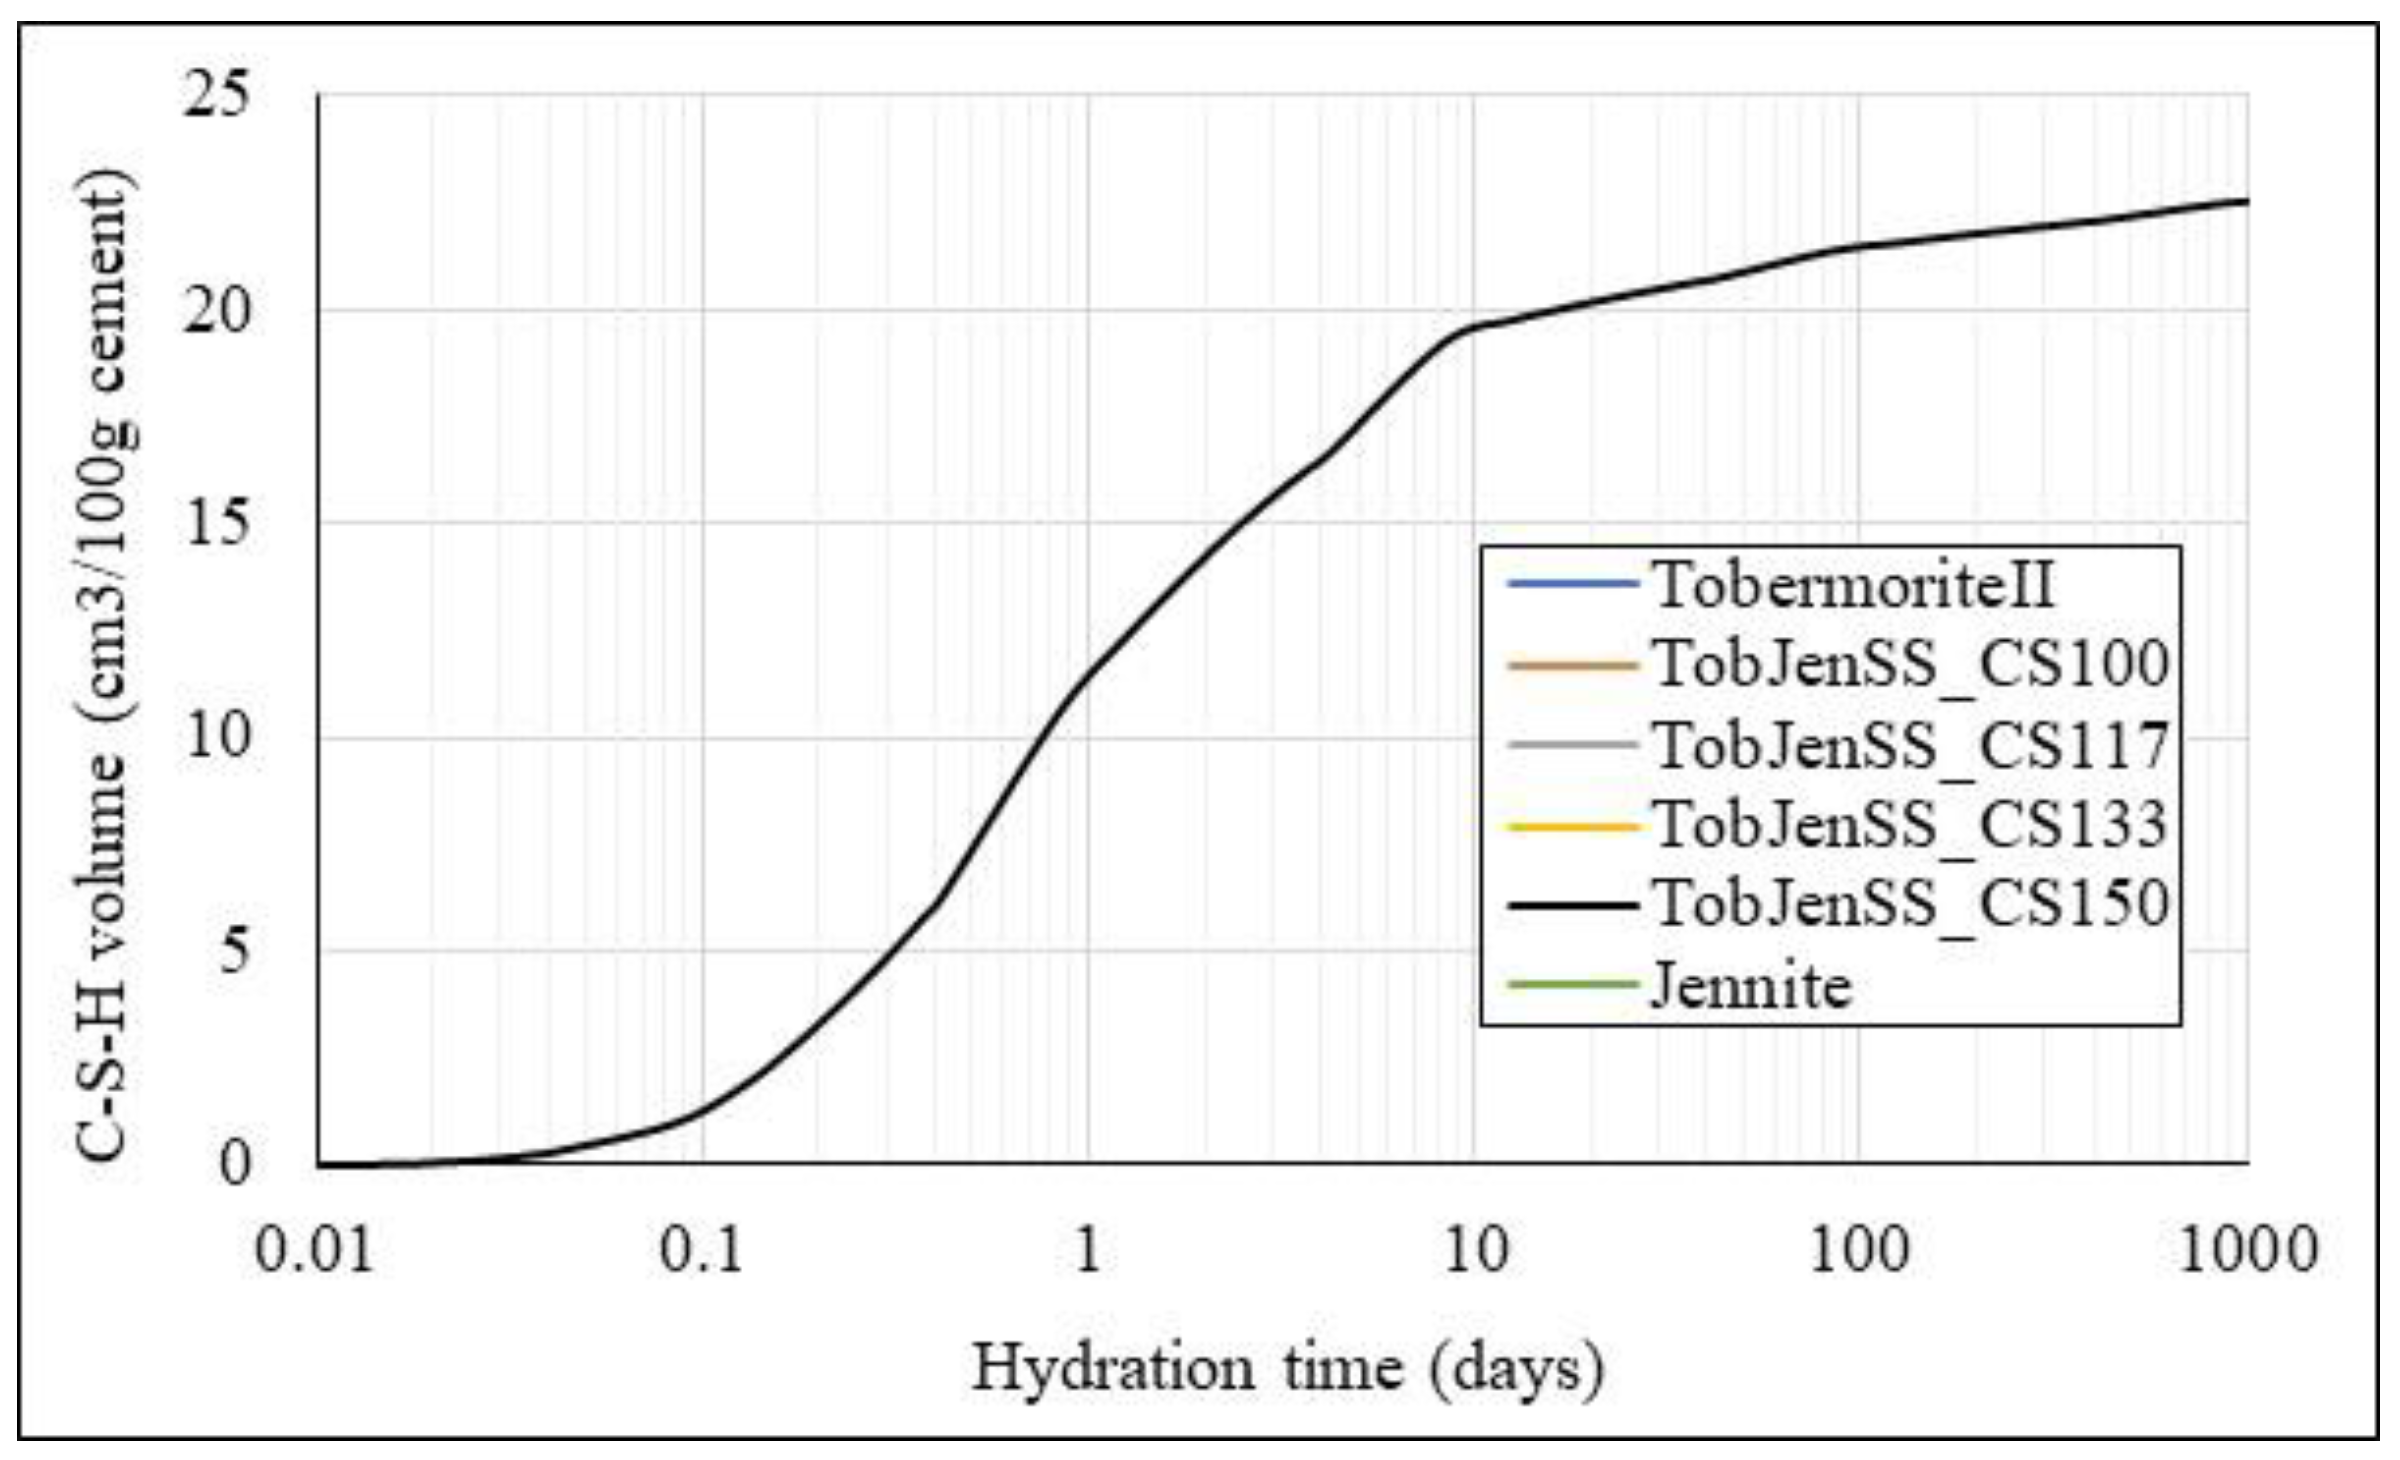
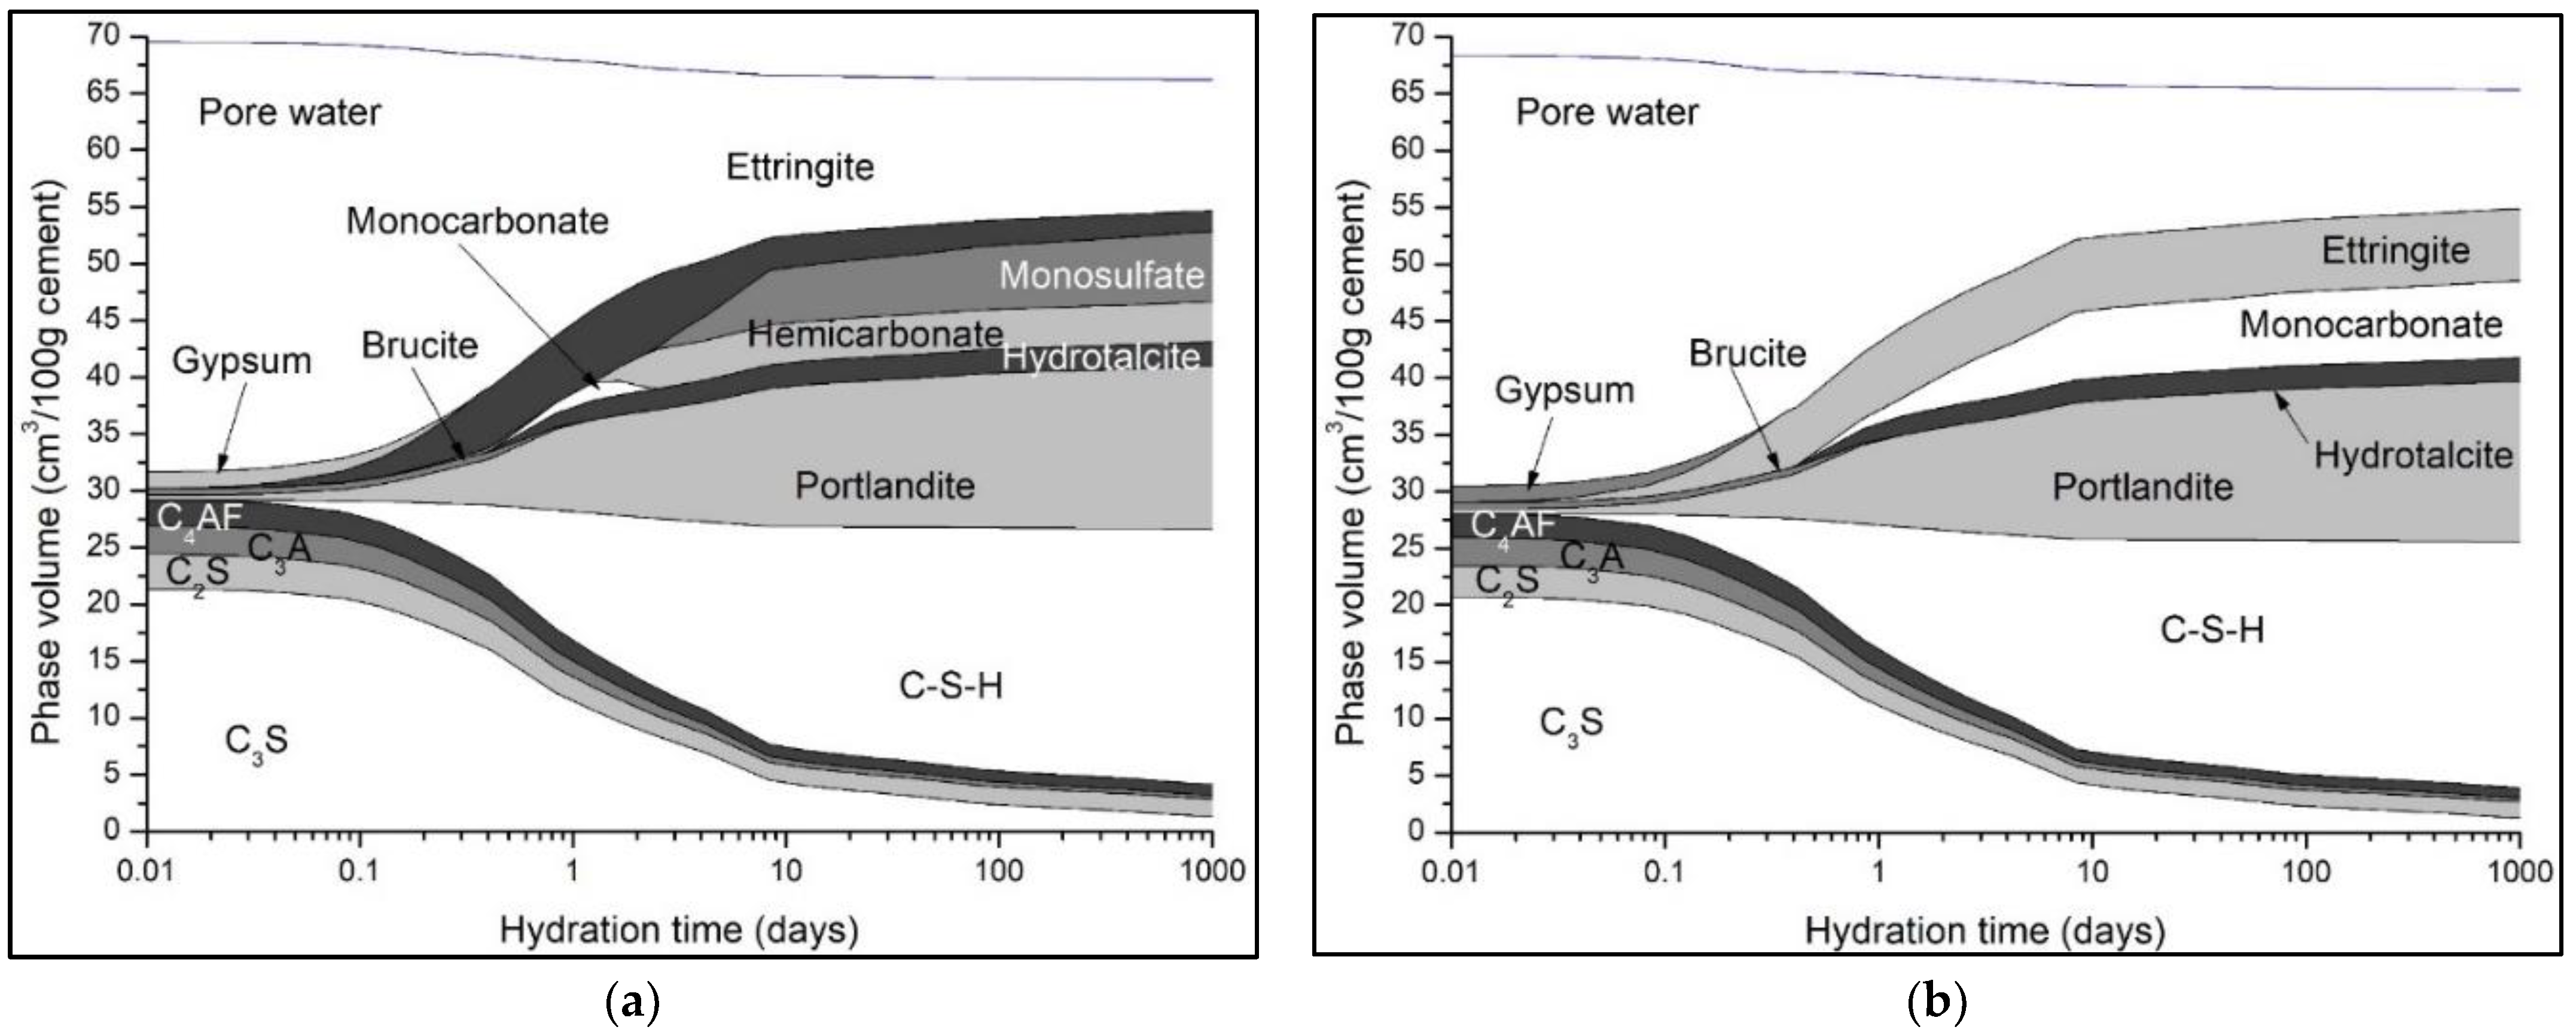
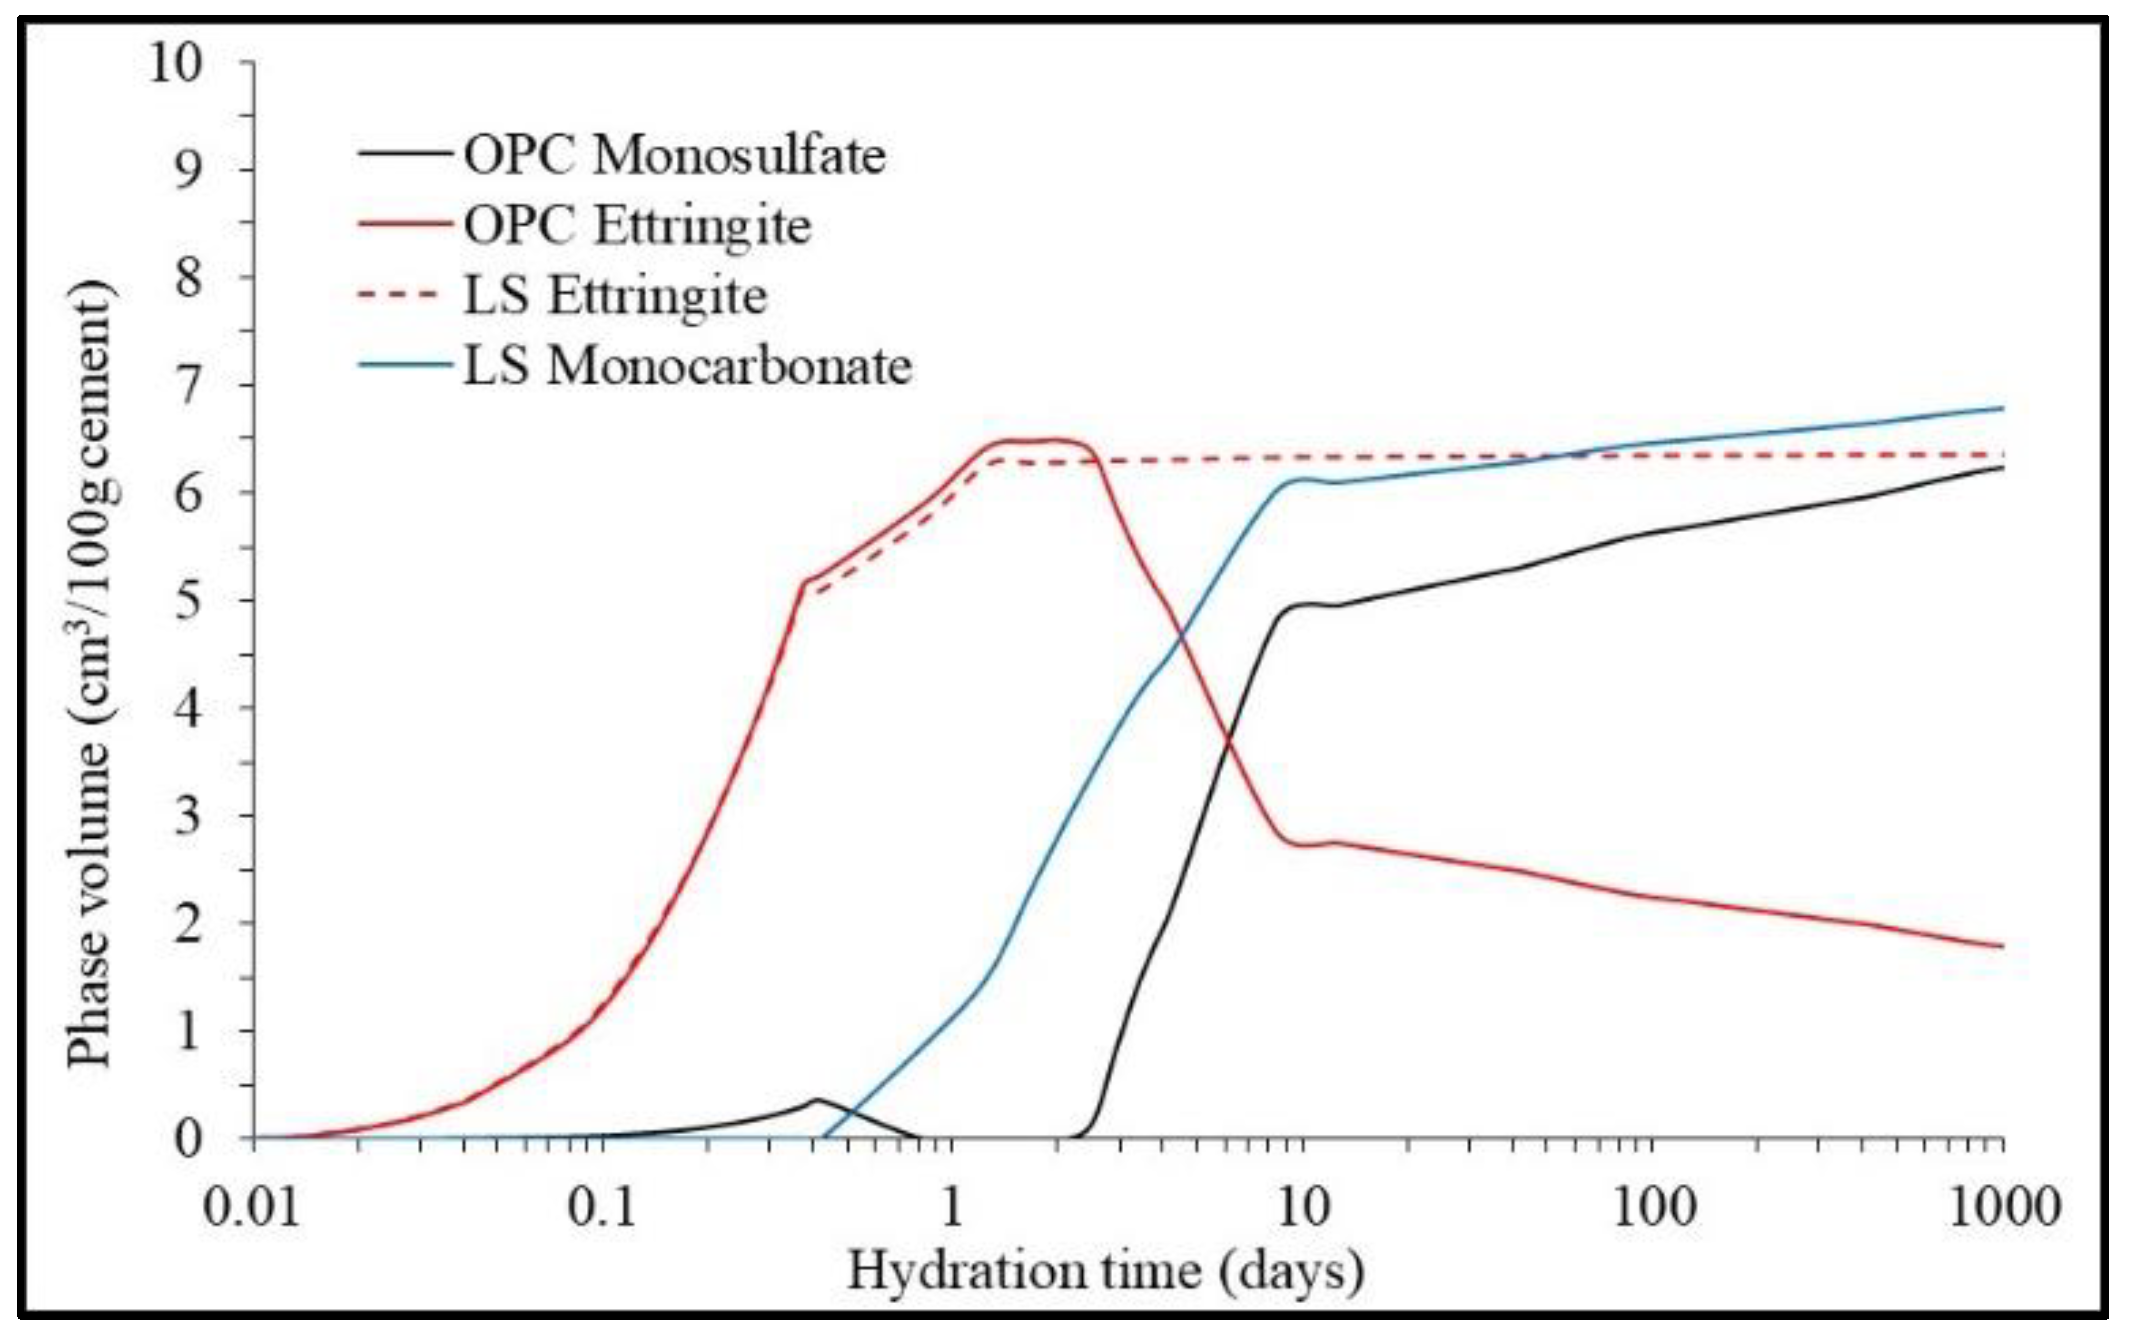
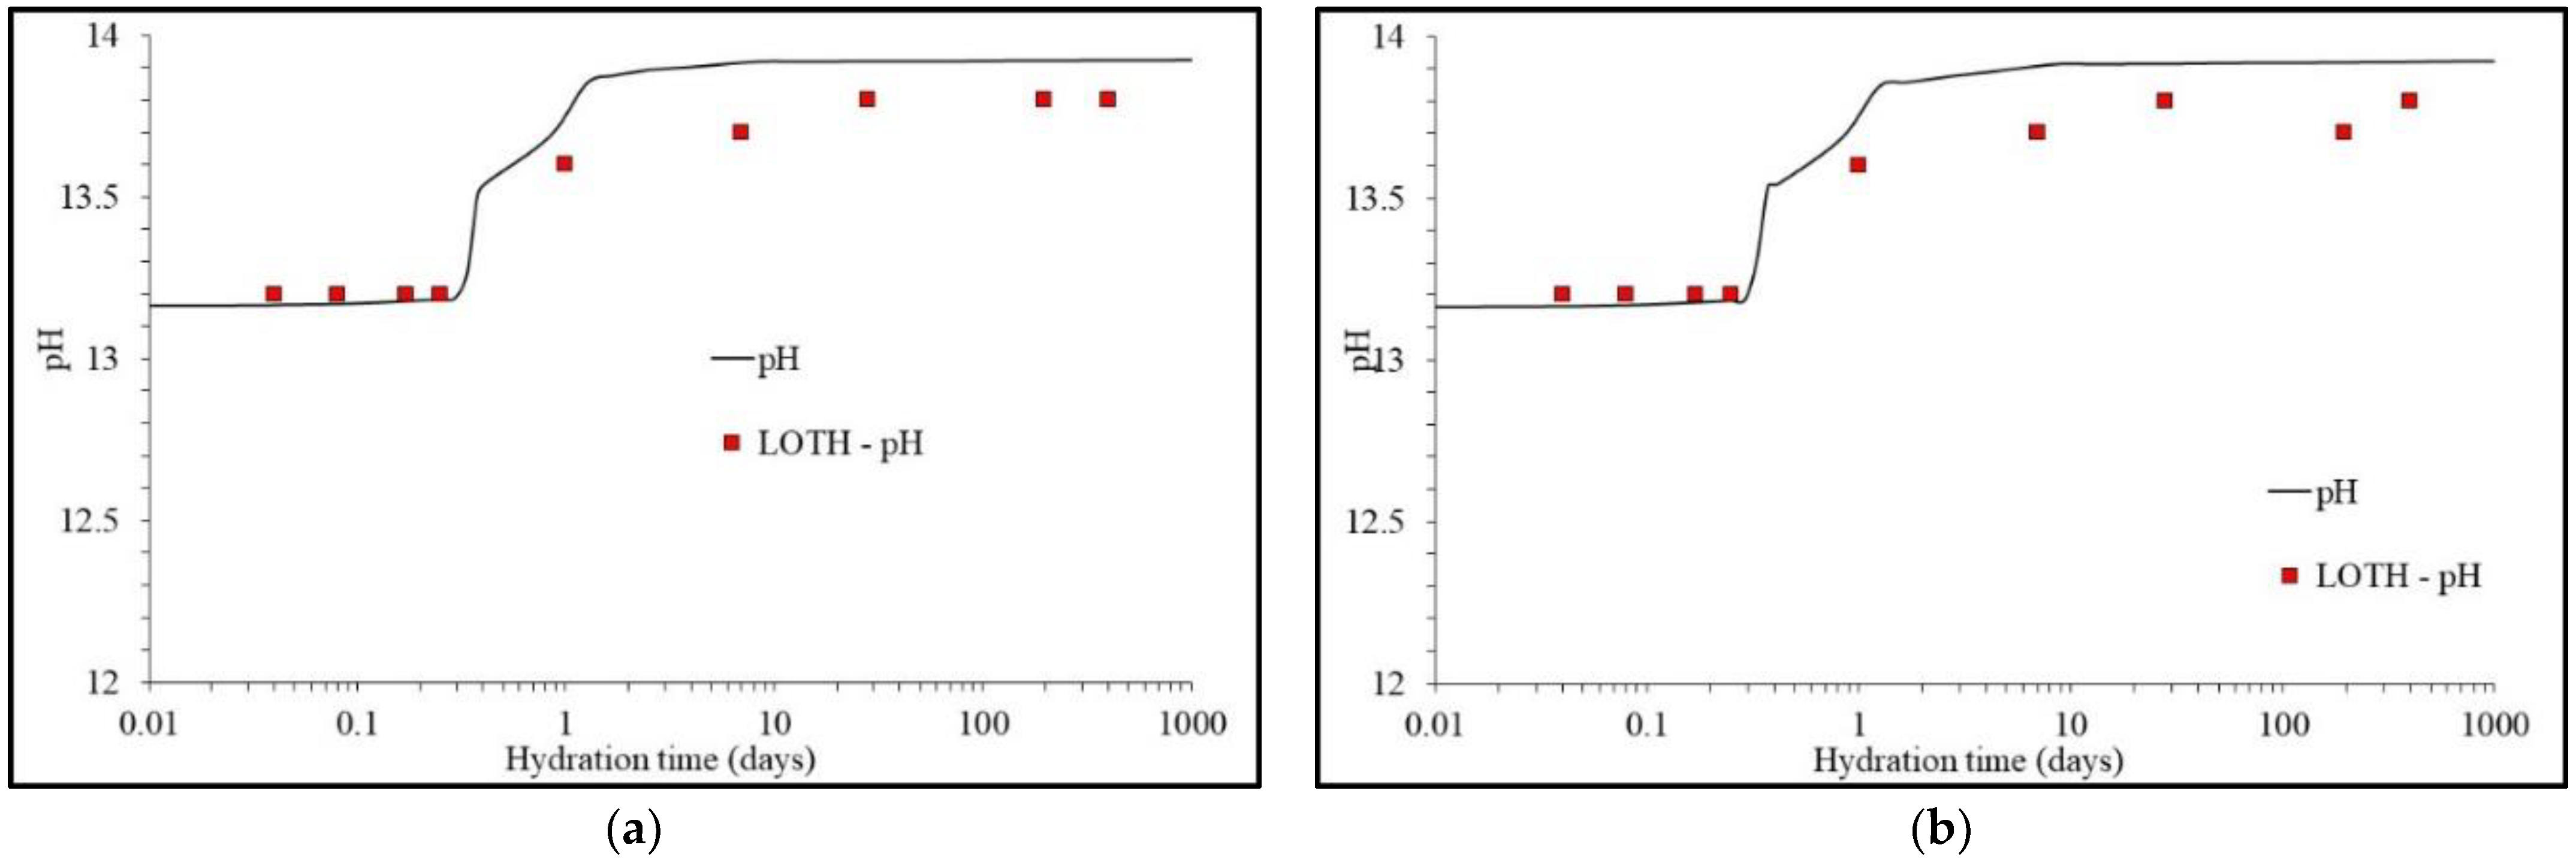
4. Full Hydration Analysis Using Cemdata07

Using a w/c ratio of 0.4, a temperature of 20 °C and the cement described in [20] and Table 3, the predicted phase assemblages from the PHREEQC model using the input above are shown in Figure 2. As can be seen in Figure 3, there was an excellent similarity between it and the phase assemblages from [20] in terms of the clinker and gypsum dissolution and solid hydrate phase formation, which was supported by experimental data in [20]. As can be seen, the AFm phase was predominately monosulphate in the OPC and monocarbonate in the LS, which, along with the amount of sulphates (SO4) available for the reaction, affected the stability of ettringite over time. Previous work [29,30,31] has shown that the formation of monosulphate, ettringite, hemicarbonate, monocarbonate and/or calcite is controlled by the available molar ratios of SO3/Al2O3 and CO2/Al2O3. The differences in the AFt and AFm phase precipitation could be better seen in Figure 4. As discussed, the presence of calcite promoted the formation of monocarbonate and stabilised ettringite, where the precipitation of monosulphate in the OPC caused it to destabilise. A detailed review of the change in solid hydrates within the two cements can be found in [20].
Figure 4 and Figure 5 present the pore solution chemistry including pH over time, respectively, expected for the two cements using PHREEQC and compared with the experimentally determined values in [20]. As expected, there was reasonably good comparisons between the model and the measured values and trends, with minor differences overall. The pH predictions only varied by ±0.15 pH units, which was well within the uncertainty range of very high pH measurements.
Thermodynamics resulted in cement hydration modelling becoming credible due to the pioneering work by Glasser [32,33,34,35,36,37,38] and Lothenbach and coworkers [7,22,25], and this work added another tool to further our understanding of the complex chemical reactions in cementitious systems. Previous work by the authors showed how volume stoichiometries can provide predictions, but failed to include the complex chemical interactions that exist when cement is hydrating, which thermodynamics can reasonably easily incorporate.

5. Conclusions

This work described the derivation of a series of DSPs to describe the incongruent dissolution of C-S-H gel from the jennite and tobermorite-II end-members provided in the cemdata07 database. While solid solution modelling is possible in PHREEQC, it carries an inherent time and computational load. By using the DSP C-S-H gel solubility models, the computational demand and time were significantly lower and were often completed in less than a minute with no loss in accuracy. In the current work, it was demonstrated that only one of the DSPs derived to model the C-S-H gel phase was required as the Ca/Si and H/Si ratios were suitable for the cement blends herein. While the use of solid solutions and the derivation of DSPs was a thermodynamically credible approach to simulate the incongruent solubility behaviour of C-S-H gel, they were only needed for hydrating cements incorporating SCMs or those undergoing chemical attack.
It was shown that PHREEQC could be used to accurately model cement hydration for Portland cement systems with various amounts of limestone. In these simulations, we predicted the governing dissolution/precipitation reactions accounting for oxide components dissolved in the clinker phases and the represented time-dependent oversaturation and alkali binding to C-S-H by defining the input for PHREEQC in a spreadsheet and pasting it into the input file, which was more efficient, giving the user full control.

Author Contributions

Conceptualization, N.H. and M.T.; methodology, N.H.; software, D.K. and N.H.; validation, M.T.; formal analysis, N.H. and D.K.; investigation, N.H.; data curation, N.H.; writing—original draft preparation, N.H.; writing—review and editing, M.T. and D.K. All authors have read and agreed to the published version of the manuscript.

Funding

Funding to publish this work was from a US–Ireland grant trifunded by the National Science Foundation (NSF, 1805818), Science Foundation Ireland (SFI, 17/US/3424) and the Department for the Economy of Northern Ireland (DfE, USI 127).

Institutional Review Board Statement

Not applicable.

Informed Consent Statement

Not applicable.

Data Availability Statement

Not applicable.

Acknowledgments

The authors would like to acknowledge the advice provided by Colin Walker during the production of this paper.

Conflicts of Interest

The authors declare no conflict of interest.

References

  1. Holmes, N.; Tyrer, M.; West, R.P.; Lowe, A.; Kelliher, D. Using PHREEQC to model cement hydration. Constr. Build. Mater. 2022, 319, 126–129. [Google Scholar] [CrossRef]
  2. Parkhurst, D.J.; Appelo, C.A.J. Description of Input and Examples for PHREEQC Version 3—A Computer Program for Speciation, Batch-Reaction, One-Dimensional Transport and Inverse Geochemical Calculations; The U.S. Department of the Interior and the U.S. Geological Survey: Baltimore, MD, USA, 2013.
  3. Elakneswaran, Y.; Ishida, T. Development and Verification of an Integrated Physicochemical and Geochemical Modelling Framework for Performance Assessment of Cement-Based Materials. J. Adv. Concr. Technol. 2014, 12, 111–126. [Google Scholar] [CrossRef] [Green Version]
  4. Maekawa, K.; Ishida, T.; Kishi, T. Multiscale Modeling of Structural Concrete; Taylor & Francis: Abingdon, UK, 2009. [Google Scholar]
  5. Elakneswaran, Y.; Owaki, E.; Miyahara, S.; Ogino, M.; Maruya, T.; Nawa, T. Hydration study of slag-blended cement based on thermodynamic considerations. Constr. Build. Mater. 2016, 124, 615–625. [Google Scholar] [CrossRef] [Green Version]
  6. Charlton, S.R.; Parkhurst, D.L. Modules based on the geochemical model PHREEQC for use in scripting and programming languages. Comput. Geosci. 2011, 37, 1653–1663. [Google Scholar] [CrossRef]
  7. Lothenbach, B.; Matschei, T.; Glasser, G.; Möschner, F. Thermodynamic modelling of the effect of temperature on the hydration and porosity of Portland cement. Cem. Concr. Res. 2008, 38, 1–18. [Google Scholar] [CrossRef] [Green Version]
  8. Elakneswaran, Y.; Owaki, E.; Nawa, T. Modelling Long-Term Durability Performance of Cementitious Materials under Sodium Sulphate Interaction. Appl. Sci. 2018, 8, 2597. [Google Scholar] [CrossRef] [Green Version]
  9. Elakneswaran, Y.; Li, C.; Kajio, T.; Owaki, E.; Ogino, M.; Nawa, T. Durability of slag-blended cement due to U-phase instability in sulphate environment. Mater. Struct. 2020, 53, 146. [Google Scholar] [CrossRef]
  10. Krishnya, S.; Yoda, Y.; Elakneswaran, Y. A two-stage model for the prediction of mechanical properties of cement paste. Cem. Concr. Compos. 2021, 115, 103853. [Google Scholar] [CrossRef]
  11. Walker, C.; Savage, D.; Tyrer, M.; Ragnarsdottir, K. Non-ideal solid solution aqueous solution modeling of synthetic calcium silicate hydrate. Cem. Concr. Res. 2007, 37, 502–511. [Google Scholar] [CrossRef]
  12. Curti, E. Coprecipitation of radionuclides with calcite: Estimation of partition coefficients based on a review of laboratory investigations and geochemical data. Appl. Geochem. 1999, 14, 433–445. [Google Scholar] [CrossRef]
  13. Atkinson, A.; Hearne, J.A.; Knights, C.F. Aqueous chemistry and thermodynamic modelling of CaO-SiO2-H2O gels. J. Chem. Soc. Dalton Trans. 1989, 2371–2379. [Google Scholar]
  14. Aimoz, L.; Kulik, D.A.; Wieland, E.; Curti, E.; Lothenbach, B.; Mader, U. Thermodynamics of AFm-(I2,SO4) solid solution and of its end-members in aqueous media. Appl. Geochem. 2012, 27, 2117–2129. [Google Scholar] [CrossRef]
  15. Dilnesa, B.Z.; Lothenbach, B.; le Saout, G.; Renaudin, G.; Mesbah, A.; Filinchuk, Y.; Wichser, A.; Wieland, E. Iron in carbonate containing AFm phases. Cem. Concr. Res. 2011, 41, 311–323. [Google Scholar] [CrossRef]
  16. Hobbs, M.Y. Solubilities and ion exchange properties of solid solutions between the OH, Cl and CO3 end members of the monocalcium aluminate hydrates. Ph.D. Thesis, University of Waterloo, Waterloo, ON, Canada, 2001; p. 226. [Google Scholar]
  17. Möschner, G.; Lothenbach, B.; Winnefeld, F.; Ulrich, A.; Figi, R.; Kretzschmar, R. Solid solution between Al-ettringite and Fe-ettringite (Ca6[Al1−xFex(OH)6]2(SO4)3·26H2O). Cem. Concr. Res. 2009, 39, 482–489. [Google Scholar] [CrossRef]
  18. Dilnesa, B.Z.; Lothenbach, B.; Renaudin, G.; Wichser, A.; Kulik, D.A. Synthesis and characterization of hydrogarnet Ca3(AlxFe1-x)2(SiO4)y(OH)4(3-y). Cem. Concr. Res. 2014, 59, 96–111. [Google Scholar] [CrossRef]
  19. Walker, C.; Sutou, S.; Oda, C.; Mihara, M.; Honda, A. Calcium silicate hydrate (C-S-H) gel solubility data and a discrete solid phase model at 25 °C based on two binary non-ideal solid solutions. Cem. Concr. Res. 2016, 79, 1–30. [Google Scholar] [CrossRef]
  20. Svenum, I.-H.; Ringdalen, I.G.; Bleken, F.L.; Friis, J.; Höche, D.; Swang, O. Structure, hydration, and chloride ingress in C-S-H: Insight from DFT calculations. Cem. Concr. Res. 2020, 129, 105965. [Google Scholar] [CrossRef]
  21. BWong, M.; Lacina, D.; Nielsen, I.M.B.; Graetz, J.; Allendorf, M.D. Thermochemistry of Alane Complexes for Hydrogen Storage: A Theoretical and Experimental Investigation. J. Phys. Chem. C 2011, 115, 7778–7786. [Google Scholar] [CrossRef]
  22. Lothenbach, B.; le Saout, G.; Gallucci, E.; Scrivener, K. Influence of limestone on the hydration of Portland cements. Cem. Concr. Res. 2008, 38, 848–860. [Google Scholar] [CrossRef]
  23. Lothenbach, B.; Kulik, D.A.; Matschei, T.; Balonis, M.; Baquerizo, L.; Dilnes, B.; Miron, G.D.; Myers, R.J. Cemdata18: A chemical thermodynamic database for hydrated Portland cements and alkali-activated materials. Cem. Concr. Res. 2019, 115, 472–506. [Google Scholar] [CrossRef] [Green Version]
  24. Killoh, L.J.; Parrot, D.C. Prediction of cement hydration. Br. Ceram. Proc. 1984, 35, 41–53. [Google Scholar]
  25. Winnefeld, F.; Lothenbach, B. Thermodynamic modelling of the hydration of Portland Cement. Cem. Concr. Res. 2006, 36, 209–226. [Google Scholar]
  26. Hong, S.Y.; Glasser, F.P. Alkali binding in cement pastes: Part I. The C-S-H phase. Cem. Concr. Res. 1999, 29, 1893–1903. [Google Scholar] [CrossRef]
  27. Taylor, H.F.W. Cement Chemistry; Thomas Telford Publishing: London, UK, 1997. [Google Scholar]
  28. Savage, D.; Soler, J.M.; Yamaguchi, K.; Walker, C.; Honda, A.; Inagaki, M.; Watson, C.; Wilson, J.; Benbow, S.; Gaus, I.; et al. A comparative study of the modelling of cement hydration and cement–rock laboratory experiments. Appl. Geochem. 2011, 26, 1138–1152. [Google Scholar] [CrossRef]
  29. de Weerdt, K.; Haha, M.B.; le Saout, G.; Kjellsen, K.O.; Justnes, H.; Lothenbach, B. Hydration mechanisms of ternary Portland cements containing limestone powder and fly ash. Cem. Concr. Res. 2011, 41, 279–291. [Google Scholar] [CrossRef]
  30. Lothenbach, B.; Damidot, D.; Marchand, T.; Matschei, T. Thermodynamic modelling: State of knowledge and challenges. Adv. Cem. Res. 2010, 22, 211–223. [Google Scholar] [CrossRef]
  31. Matschei, T.; Lothenbach, B.; Glasser, F.P. The role of calcium carbonate in cement hydration. Cem. Concr. Res. 2007, 37, 551–558. [Google Scholar] [CrossRef]
  32. Atkins, M.; Bennett, D.G.; Dawes, A.C.; Glasser, F.P.; Kindness, A.; Read, D. A thermodynamic model for blended cements. Cem. Concr. Res. 1992, 22, 497–502. [Google Scholar] [CrossRef]
  33. Bennett, D.G.; Read, D.; Atkins, M.; Glasser, F.P. A thermodynamic model for blended cements. II: Cement hydrate phases; thermodynamic values and modelling studies. J. Nucl. Mater. 1992, 190, 315–325. [Google Scholar] [CrossRef]
  34. Damidot, D.; Glasser, F.P. Thermodynamic investigation of the CaO Al2O3 CaSO4 H2O system at 50°C and 85 °C. Cem. Concr. Res. 1992, 22, 1179–1191. [Google Scholar] [CrossRef]
  35. Damidot, D.; Glasser, F.P. Thermodynamic investigation of the CaO Al2O3 CaSO4 K2O H2O system at 25 °C. Cem. Concr. Res. 1993, 23, 1195–1204. [Google Scholar] [CrossRef]
  36. Damidot, D.; Glasser, F.P. Thermodynamic investigation of the CaO Al2O3 CaSO4 H2O system at 25 °C and the influence of Na2O. Cem. Concr. Res. 1993, 23, 221–238. [Google Scholar] [CrossRef]
  37. Damidot, D.; Stronach, S.; Kindness, A.; Atkins, M.; Glasser, F.P. Thermodynamic investigation of the CaO_Al2O3_CaCO3-H2O closed system at 25 °C and the influence of Na2O. Cem. Concr. Res. 1994, 24, 563–572. [Google Scholar] [CrossRef]
  38. Atkins, M.; Glasser, F.P.; Kindness, A. Cement hydrate phases: Solubility at 25 °C. Cem. Concr. Res. 1992, 22, 241–246. [Google Scholar] [CrossRef]
Figure 1. Predicted volume of C-S-H precipitated by each DSP.
Applsci 12 10039 g001
Figure 2. Phase assemblage produced by the PHREEQC model using [20] for the two cements. (a) OPC phase assemblage; (b) 4% limestone binder phase assemblage.
Applsci 12 10039 g002
Figure 3. Predicted precipitation of AFt and AFm phases in the two cements described in Table 3.
Applsci 12 10039 g003
Figure 4. pH predictions for (a) OPC and (b) 4% limestone binder (LOTH represents the measured data from [20]). (a) OPC pH; (b) 4% limestone pH.
Applsci 12 10039 g004
Figure 5. Pore solution chemistry produced by the PHREEQC model using [20] for (a) OPC and (b) 4% limestone binder (LOTH represents the measured data from [20]). (a) OPC pore chemistry; (b) 4% limestone pore chemistry.
Applsci 12 10039 g005
Table 1. Thermodynamic properties of tobermorite-II and jennite as taken from the cemdata07 database [7]. Letters assigned to each end-member are shown in parentheses.
ComponentG iH iS iiCp ii
Tobermorite-II−1,744,356−1,915,813.380132.372
Jennite−2,480,808−2,723,484.3140210.805
Ca+2−552,790−543,069−56.483997−30.922515
SiO2(aq)−833,411−887,856.1741.33800144.465416
H2O−237,183−285,88169.92375.3605
H+0000
i J/mol. ii J/mol/K. Molar volumes for tobermorite-II and jennite taken as 59 cm3/mol and 78 cm3/mol, respectively.
Table 2. End-members and DSP for the CSH model.
PhaseMole
Fraction
DSP Dissolution Reactions Log   K
(25 °C)
Analytical Expression Parameters
(Equation (1))
Vol (cm3/mol)
XiXjaCd
Tobermorite II10(CaO)0.8333(SiO2)1.0000(H2O)1.3330 + 1.6666 H+ = 0.8333 Ca+2 + 2.1663 H2O + 1.0000 SiO211.1373−13.910623.064440 × 1035.96296559
TobJenSS CS1000.80.2(CaO)1.0000(SiO2)1.0000(H2O)1.4864 + 2.0000 H+ = 1.0000 Ca+2 + 2.4864 H2O + 1.0000 SiO214.5527−15.225464.186636 × 1036.35763862.8
TobJenSS CS1170.60.4(CaO)1.1667(SiO2)1.0000(H2O)1.6398 + 2.3334 H+ = 1.1667 Ca+2 + 2.8065 H2O + 1.0000 SiO218.1104−16.397945.308832 × 1036.75231166.6
TobJenSS CS1330.40.6(CaO)1.3333(SiO2)1.0000(H2O)1.7932 + 2.6666 H+ = 1.3333 Ca+2 + 3.1265 H2O + 1.0000 SiO221.7431−17.493976.426629 × 1037.14645070.4
TobJenSS CS1500.20.8(CaO)1.5000(SiO2)1.0000(H2O)1.9466 + 3.0000 H+ = 1.5000 Ca+2 + 3.4466 H2O + 1.0000 SiO225.4508−18.516527.548825 × 1037.54112374.2
Jennite01(CaO)1.6667(SiO2)1.0000(H2O)2.1000 + 3.3334 H+ = 1.6667 Ca+2 + 3.7667 H2O + 1.0000 SiO229.3008−19.396718.671021 × 1037.93579678
Table 3. Cement oxide proportions (taken from [20]).
Oxide Proportions (g/100 g Cement)Phase Compositions (g/100 g Cement)
OPCLimestoneOPCLimestone
SiO220.2SiO0.8C3S66.5C3S64.60
Al2O34.9Al2O30.3C2S10.30C2S9.30
Fe2O33.2Fe2O30.3C3A7.50C3A7.40
CaO63.9CaO55C4AF8.50C4AF7.80
MgO1.8MgO1.8CaO_free0.93CaO-free0.89
Na2O0.42Na2O<0.01Calcite0.60Calcite4.60
K2O0.78K2O<0.01Gypsum3.10Gypsum3.00
CaO-free0.93CaO-free<0.01Periclase0.90Periclase0.90
CO20.26CO242.5K2SO41.30K2SO41.30
SO32.29SO30.05Na2SO40.21Na2SO40.20
Periclase0.9Periclase0.9Alkali
Blaine fineness (m2/kg)K2O0.05K2O0.05
413429Na2O0.33Na2O0.31
Ignition lossMgO0.94MgO0.87
0.3743.4SO30.11SO30.11
Table 4. Composition and percentages of oxides dissolved in cement clinker phases [20].
Clinker
Phase
Oxide
K2ONa2OMgOSO3K2O (wt.%)Na2O (wt.%)MgO (wt.%)SO3 (wt.%)
C3S0.10.11.10.15.267.6918.3333.33
C2S0.90.10.50.247.377.698.3367.67
C3A0.71.01.4036.8476.9223.330
C4AF0.20.13.0010.537.6950.00
Total1.91.36.00.3100100100100
Table 5. Modelling approach for the hydration behaviour of the clinker phases.
Clinker PhaseModel Approach
C3SKinetic
C2SKinetic
C3AKinetic
C4AFKinetic
K2OKinetic (dissolved in C3S, C2S, C3A and C4AF)
Na2OKinetic (dissolved in C3S, C2S, C3A and C4AF)
MgOKinetic (dissolved in C3S, C2S, C3A and C4AF)
SO3Kinetic (dissolved in C3S and C2S)
Na2SO4Equilibrium—immediately dissolved during step one
K2SO4Equilibrium—immediately dissolved during step one
LimeEquilibrium—immediately dissolved during step one
CalciteEquilibrium—reacting instantaneous equilibrium
GypsumEquilibrium—reacting instantaneous equilibrium
PericlaseEquilibrium—immediately dissolved during step one
Table 6. Number of charged species (n) involved in the dissolution reaction of brucite, TobJenSS_CS150, ettringite, gypsum, portlandite and syngenite phases to account for oversaturation (S.I. = 0.15 · n) during the first 12 h of OPC hydration.
PhasenS.I. < 12 h
Brucite30.45
TobJenSS_CS1504.500.68
Ettringite152.25
Gypsum20.30
Portlandite30.45
Syngenite50.75
Publisher’s Note: MDPI stays neutral with regard to jurisdictional claims in published maps and institutional affiliations.

