Article

Proposed New Analytical Method of Tower Load in Large-Span Arch Bridge Cable Lifting Construction

1
School of Highway, Chang’an University, Xi’an 710064, China
2
China Railway 20th Bureau Group Co., Ltd., Xi’an 710016, China
*
Author to whom correspondence should be addressed.
Appl. Sci. 2022, 12(18), 9373; https://doi.org/10.3390/app12189373
Submission received: 30 August 2022 / Revised: 14 September 2022 / Accepted: 16 September 2022 / Published: 19 September 2022
(This article belongs to the Special Issue Advanced Technologies for Bridge Design and Construction)

Abstract

:

Featured Application

The practical calculation method of tower load in arch bridge cable lifting construction proposed in this paper, including its engineering application on the analysis of tower mechanical properties, has the characteristics of high calculation efficiency and operability, and may be widely applied to the analysis of cable lifting construction of large-span arch bridges.

Abstract

The cable lifting construction method is the most widely used construction method for large-span arch bridges. The correct calculation and analysis of cable lifting construction is essential to ensure the safety and linearity in the construction of arch bridges. The existing research mainly focuses on the construction scheme and finite element analysis of cable lifting for large-span arch bridges. There is relatively little research on calculation theory, and there is no analytical method for cable lifting construction of arch bridges. To calculate and analyze cable lifting construction more quickly and accurately, based on the deformation coordination principle and suspension cable theory, a practical calculation method is proposed to calculate the load of the tower acting by a cable system in the cable lifting construction of arch bridges. A large-span arch bridge under construction was used as a case study, and the correctness of the calculation method was verified by measuring the displacements of the tower top. A brief description of the structure, verification method, and verification process is presented. The displacement results are calculated by the numerical calculation software SAP2000, the actual measured displacement data are discussed and comparatively analyzed, and the correctness and calculation accuracy of the proposed calculation method are also evaluated. The results show that the calculation method has sufficient accuracy. The tower load calculation is mainly undertaken to prepare for the analysis of the tower mechanical properties; therefore, the calculation method is applied to towers of the case engineering, and the stability, load carrying capacity, and deformation of the tower are analyzed to verify whether its mechanical properties meet the engineering requirements. The results show that steel pipe columns of the buckle tower are prone to twisting instability. The normal stress of the tower’s part of the pressurized rod or pressurized bending rod is larger. Wind cable load calculation models and tower design-related recommendations are presented in this tower analysis. The tower load calculation method and tower mechanics analysis method in this study can provide guidance for the calculation and analysis of the cable lifting construction of large-span arch bridges.

1. Introduction

The cable lifting construction method is widely used in the construction of large-span arch bridges because of its advantages of great lifting weight, strong environmental adaptability, and advanced technology [1,2,3,4]. A large number of engineering examples [5,6,7,8,9] show that it is relatively reasonable and economical for large-span arch bridges to take the cable lifting construction method. At the same time, the cable lifting construction method has high adaptability to the terrain on which bridges are located [10]. Most existing large-span arch bridges and shaped-arch bridges with novel structures are constructed by cable lifting methods, such as the Pingnan Third Bridge [11] with a span of 575 m and the Jinghe Bridge [12] with a span of 284 m, which is a main and secondary arch collaborative Y-shaped steel box arch bridge. Figure 1a [13] and Figure 1b show the cable lifting construction of the Pingnan Third Bridge and the Jinghe Bridge, respectively. The internal structure of the cable lifting system [14] is quite complicated, in which the main load carrying structure is a tower [15] that bears loads transferred from the cable system. Therefore, the correct calculation of the load acting on the tower by the cable system is crucial to the tower mechanical analysis.
To be able to design and calculate arch bridge cable lifting construction more accurately and quickly, researchers have conducted a lot of theoretical [16,17,18] and practical engineering [19,20,21] studies. Deng et al. [22] established a method for correcting tower deflection, proposed an active control theory, and thoroughly studied the active control technology of tower deflection for the cable lifting construction of large-span arch bridges. Liu et al. [23] studied the method of controlling the arch ring shape during the cable lifting construction of a concrete arch bridge by using buckle cables. Li et al. [24] analyzed the strength and stability of the arch ribs and towers during the rotation construction of a steel pipe concrete arch bridge and evaluated construction safety. Yu et al. [25] innovatively applied a cable lifting system to the girder installation of cable-stayed bridges for the first time. Wang et al. [26] described in detail the cable lifting construction method of the Ningbo Mingzhou Bridge and analyzed and controlled the stress and deformation of the arch ribs during its construction process. Yu et al. [27] proposed a new method for the mechanical analysis of the main cable of a cable lifting system, verified the new method by two examples, and finally applied the new method to the construction of the longest steel-truss cable-stayed bridge in the world. Zhang et al. [28] analyzed and optimized the lifting towers while constructing dendrite structures. Li et al. [29] presented the challenges encountered in the construction of the world’s first double-deck high-speed railway arch bridge using the cable lifting method. Zhao et al. [30] proposed a finite element method for the mechanical analysis of the main cable in an arch bridge construction using the cable lifting method, which has a higher accuracy.
In summary, scholars at home and abroad have achieved fruitful results in the cable lifting construction of arch bridges, but the research is mainly focused on construction schemes and the finite element analysis of the cable lifting of large-span arch bridges. There are relatively few studies on calculation theory, which mainly concentrates on the more basic suspension-cable calculation theory, and there is no set of calculation theories and analysis methods for arch bridge cable lifting construction. Therefore, it is necessary to propose simple and practical calculation methods for how to calculate and analyze more quickly and accurately for arch bridges with increasingly large spans, increasingly high towers, and more complicated cable systems. This paper presents the calculation method of the load acting on the tower by a cable system in the cable lifting construction of arch bridges and gives an example of applying it to the refinement analysis of a tower. The method is fast, accurate, and easy to operate and can be widely accepted by relevant practitioners.
The main innovations of this article are as follows:
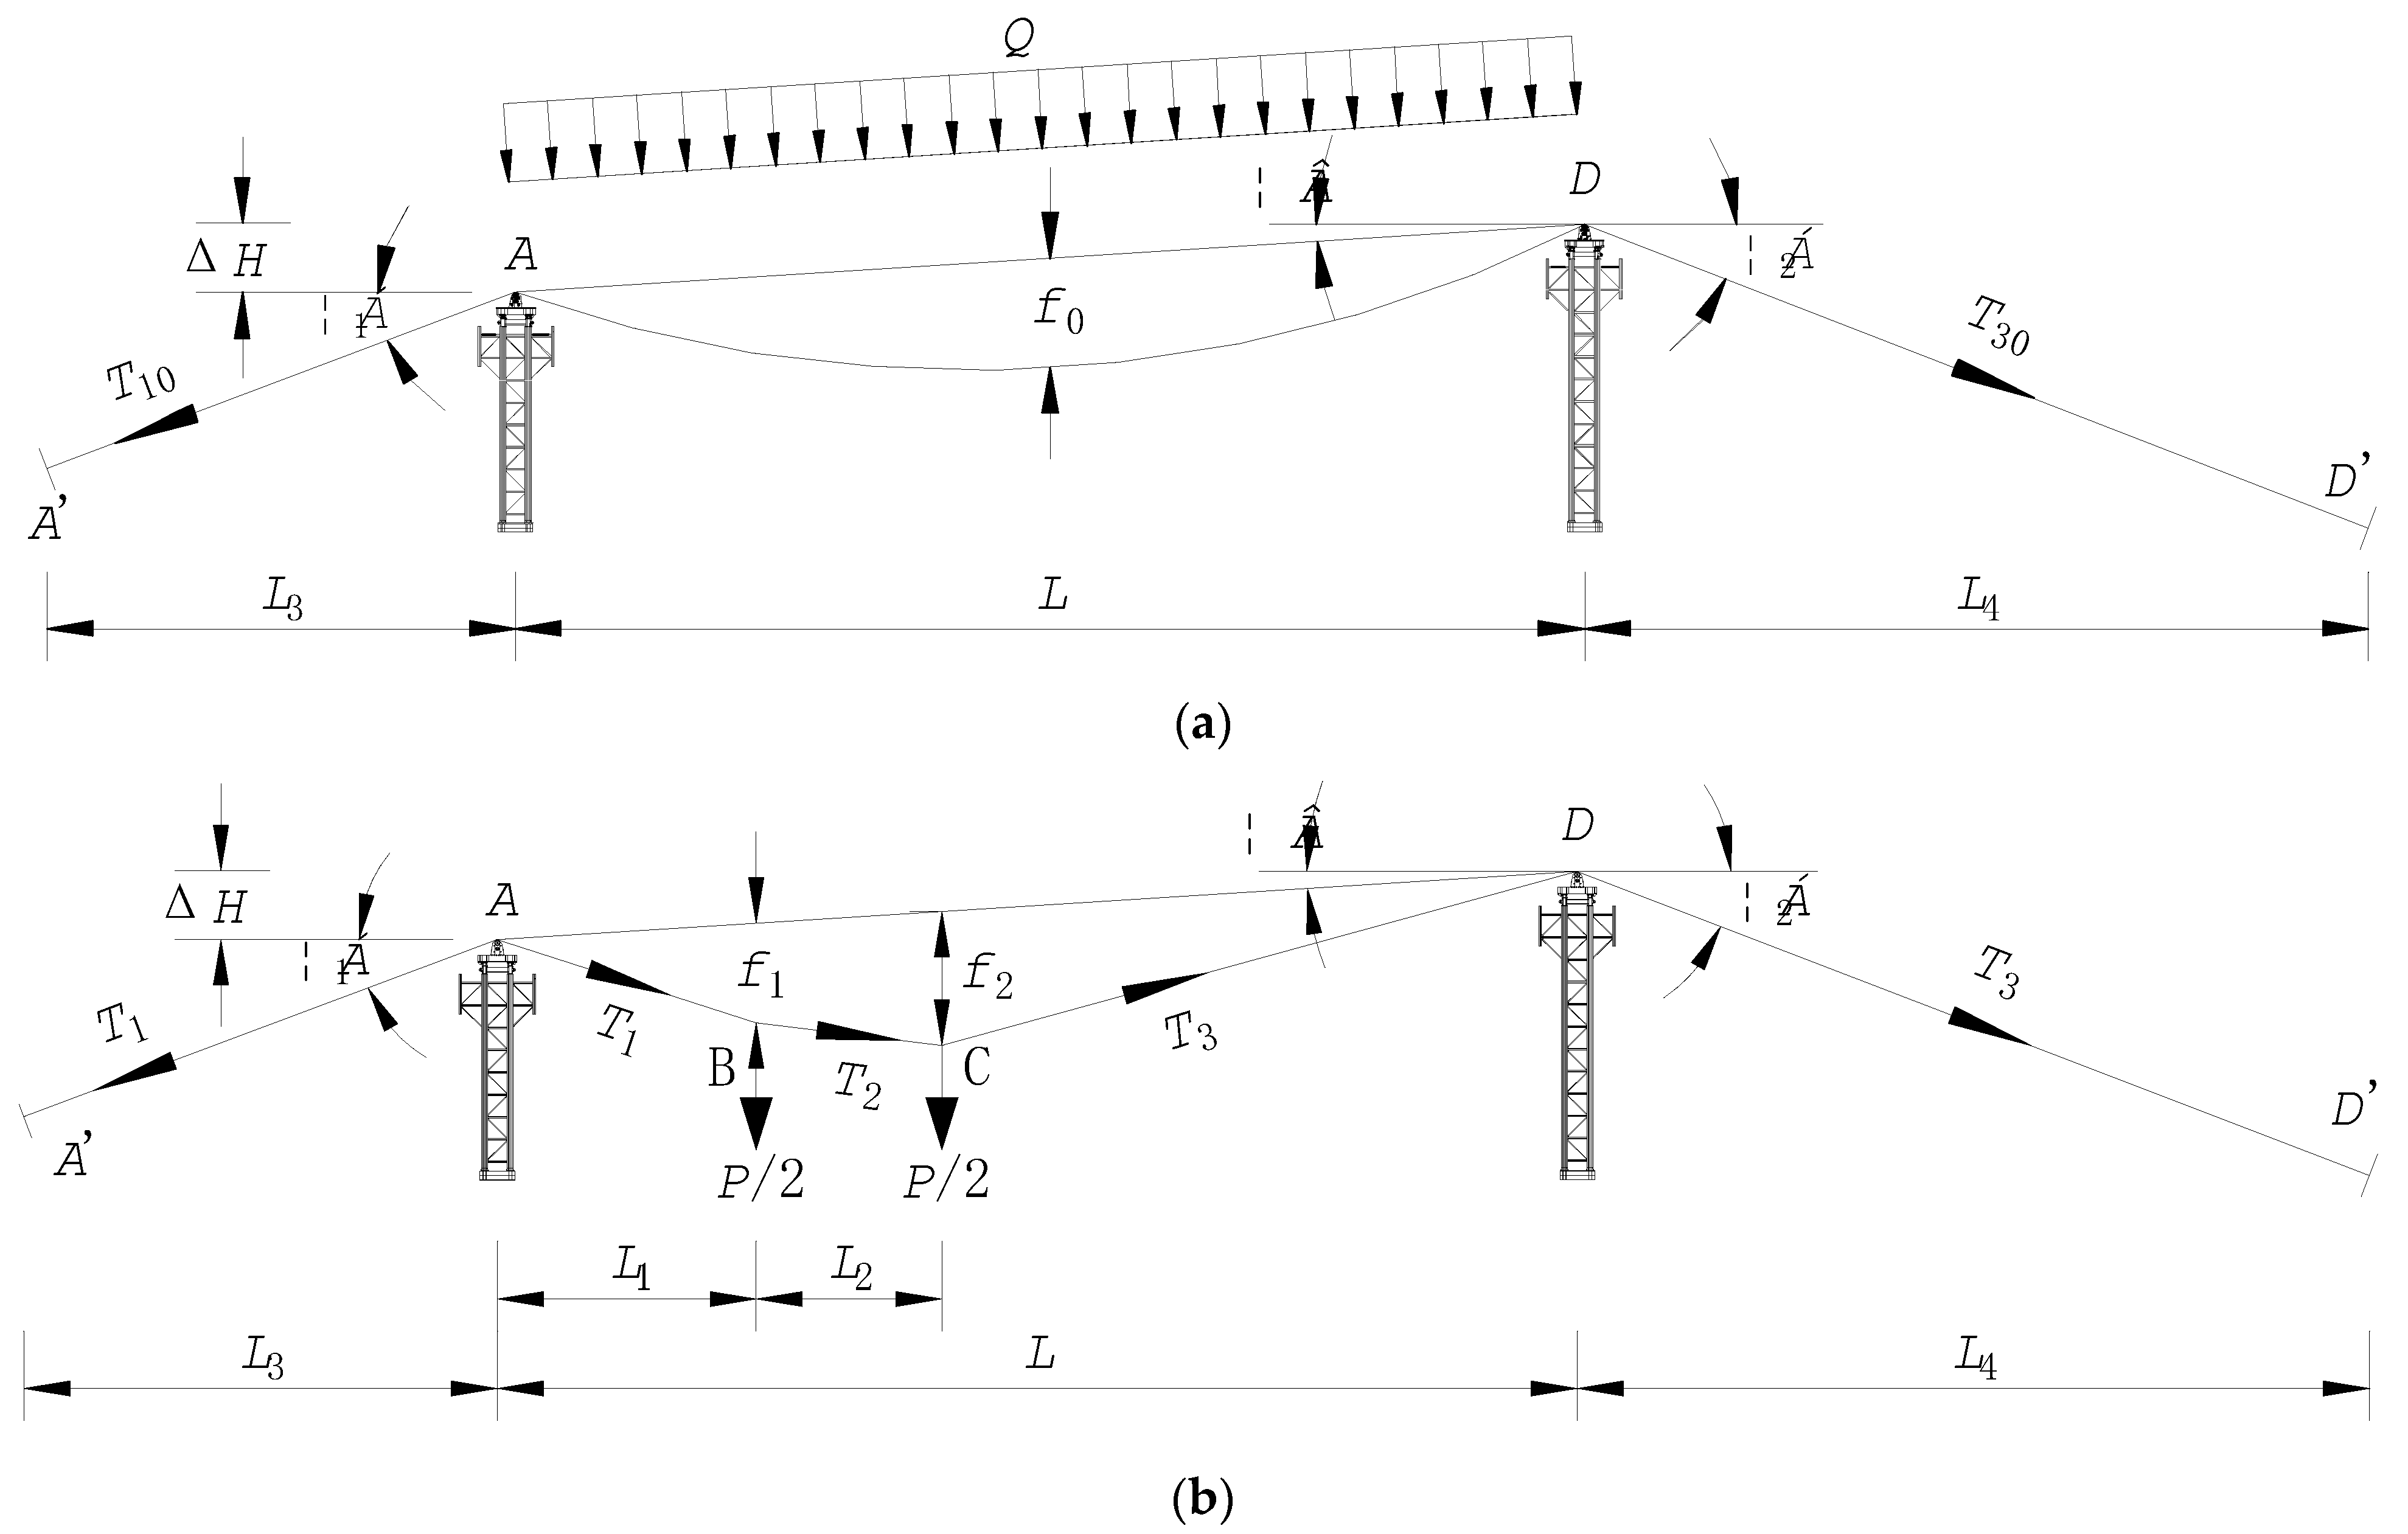
  • Based on the deformation coordination principle and suspension cable theory, the calculation method of the forces acting on a tower by a cable system when the rated load is lifted and moved on the main cable during the construction of an arch bridge is proposed.
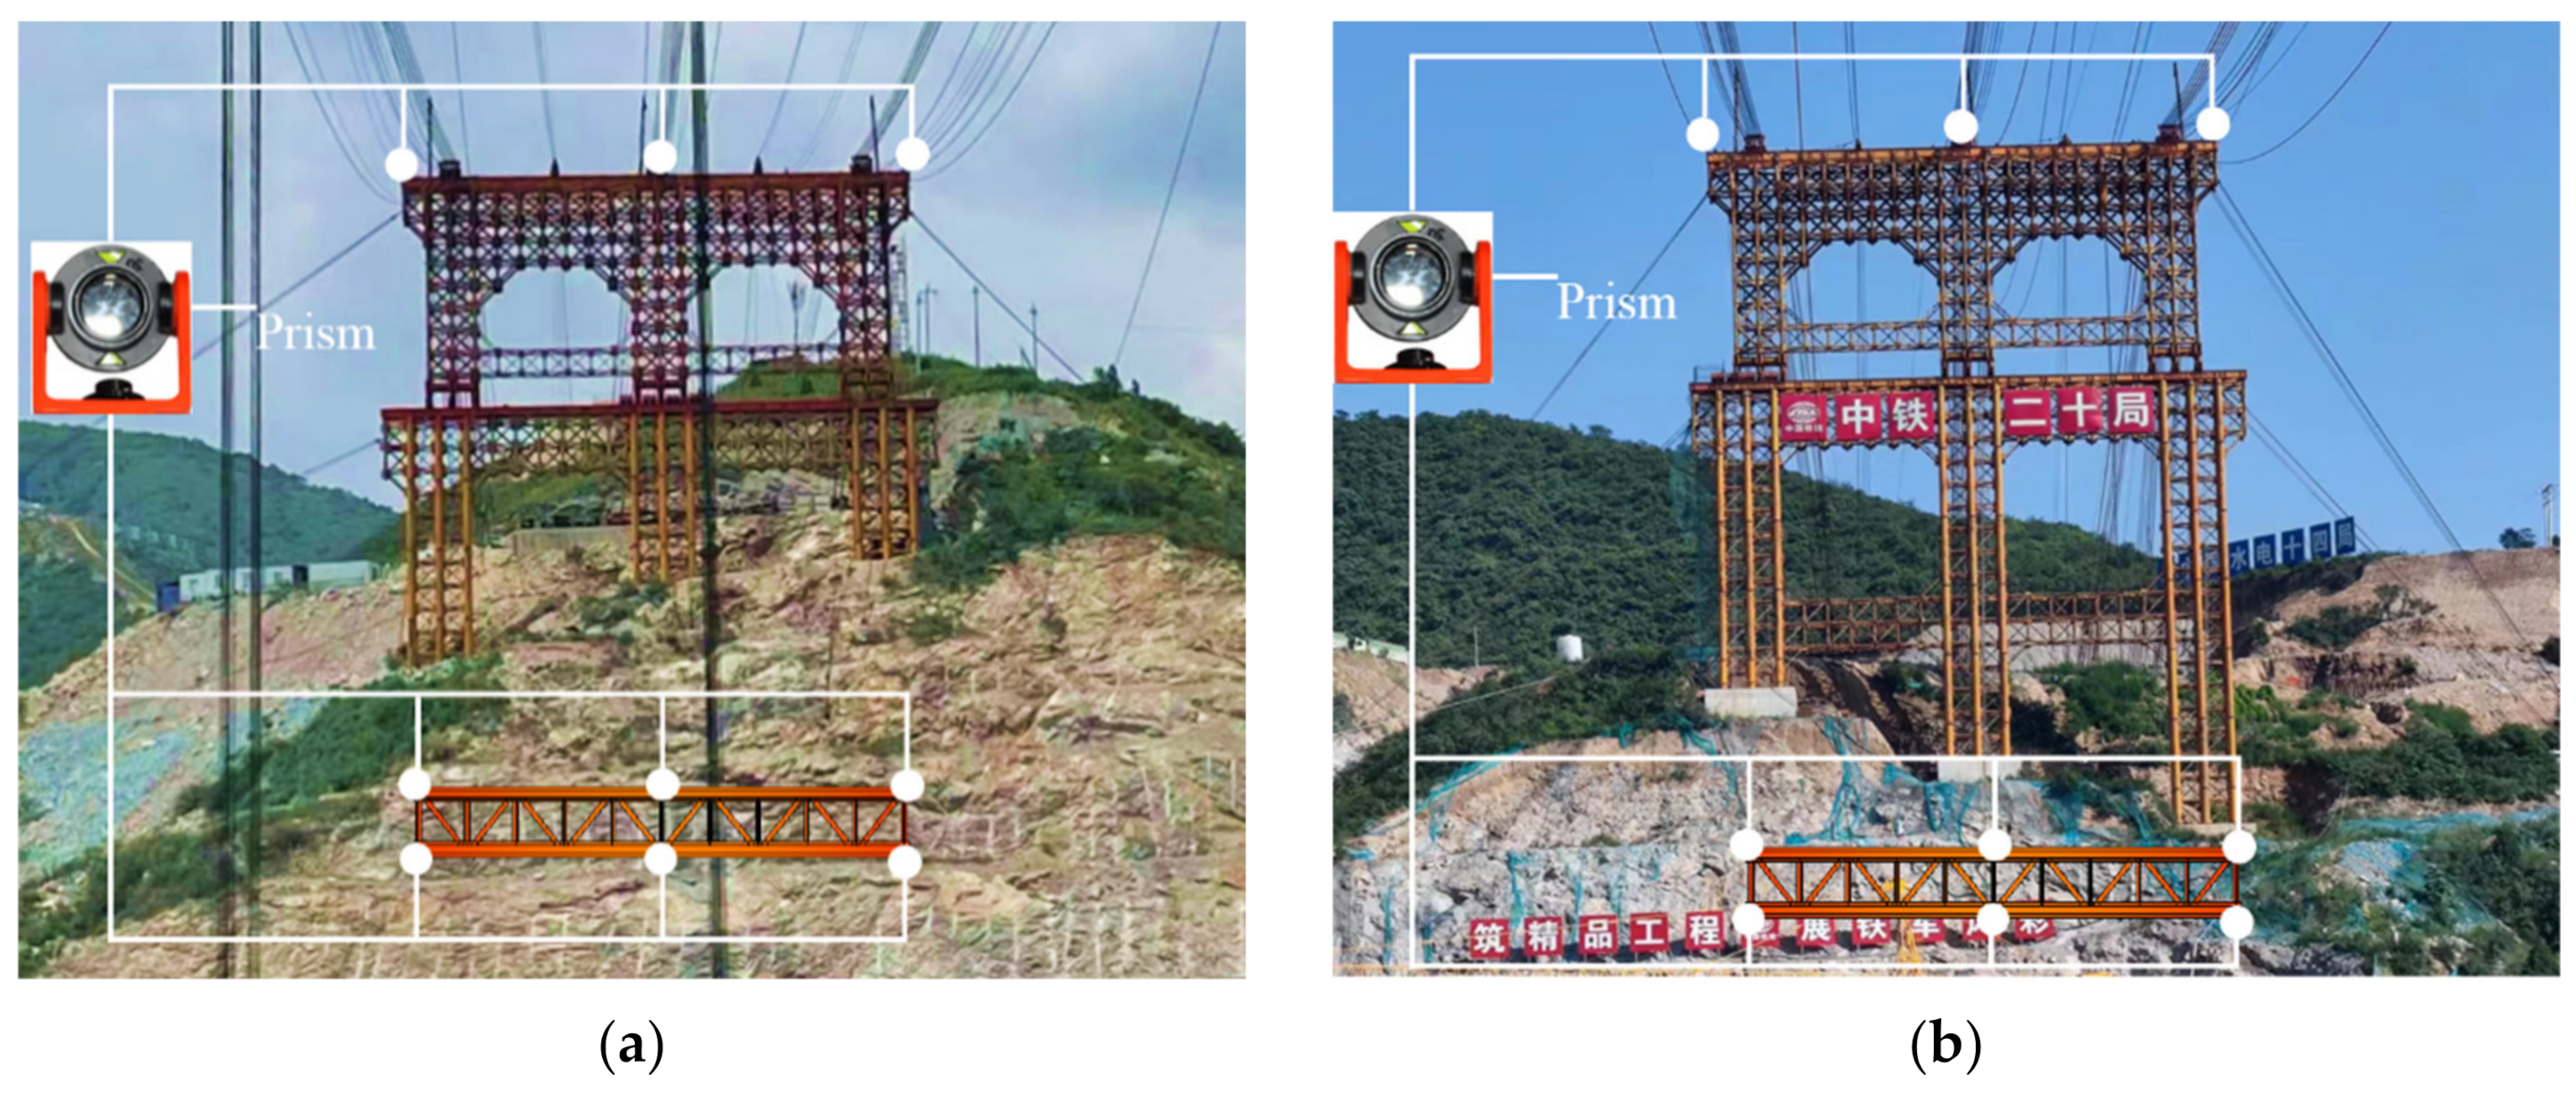
  • The correctness of the calculation method was verified by measuring the displacements of the tower tops.
  • The calculation method is applied to tower analysis, and the method and example of tower refinement analysis is presented.
This research is conducted according to the following organizational structure. First, based on the deformation coordination principle and suspension theory, a practical calculation method is proposed to calculate tower loads acting by a steel-cable system in arch bridge cable lifting construction. Second, the correctness of the calculation method is verified by measuring the displacement at the tower top using a large-span arch bridge under construction as an example. A brief description of structure, validation method, and validation process is given. Third, the calculation method is applied to towers of the case project, and its stability, load capacity, and deformation are analyzed to verify whether its mechanical properties meet the engineering requirements. Finally, some useful conclusions and recommendations are given.

2. Proposed Calculation Method

The proposed calculation methods are usually based on certain assumptions and existing theories. The actual cable lifting system is simplified to a calculable structural frame by omitting the secondary structures. The calculation methods and formulas of the main cable, lifting cable, and towing cable loads acting on the tower are given respectively.

2.1. Simplification of Calculation Model and Basic Assumptions

The load on the tower before lifting is mainly provided by the main cable, towing cable, and lifting cable. Figure 2 shows the simplified cable lifting system that is used for calculation. The role of the main cable is to transfer all of the load to the tower by a cable saddle. At the same time, the sliding trolley transports arch ribs on the main cable, so it is also a track cable. The role of the lifting cable is to lift the arch rib in a vertical direction. The role of the towing cable is to tow the sliding trolley in a horizontal movement. The role of the sliding trolley is to run and lift arch rib segments on the main cable and then transport them to their target positions. The tower is the major load-bearing structure, which is the key part in cable lifting and is related to the smoothness and safety of construction. The anchor is the device to fix the cable system; its main role is to fix the cable, wind cable and winch, etc.
The calculation method is based on the following basic assumptions:
  • It is assumed that the cable is flexible and can only bear tension;
  • The stress–strain curve of the cable varies linearly, which means that it conforms to the generalized Hooke’s law;
  • The cross-sectional area of the cable does not change when the cable is under force;
  • The self-weight load of the cable is uniformly distributed along the span length;
  • The cable is absolutely flexible and cannot be used to bear bending moments in any section.

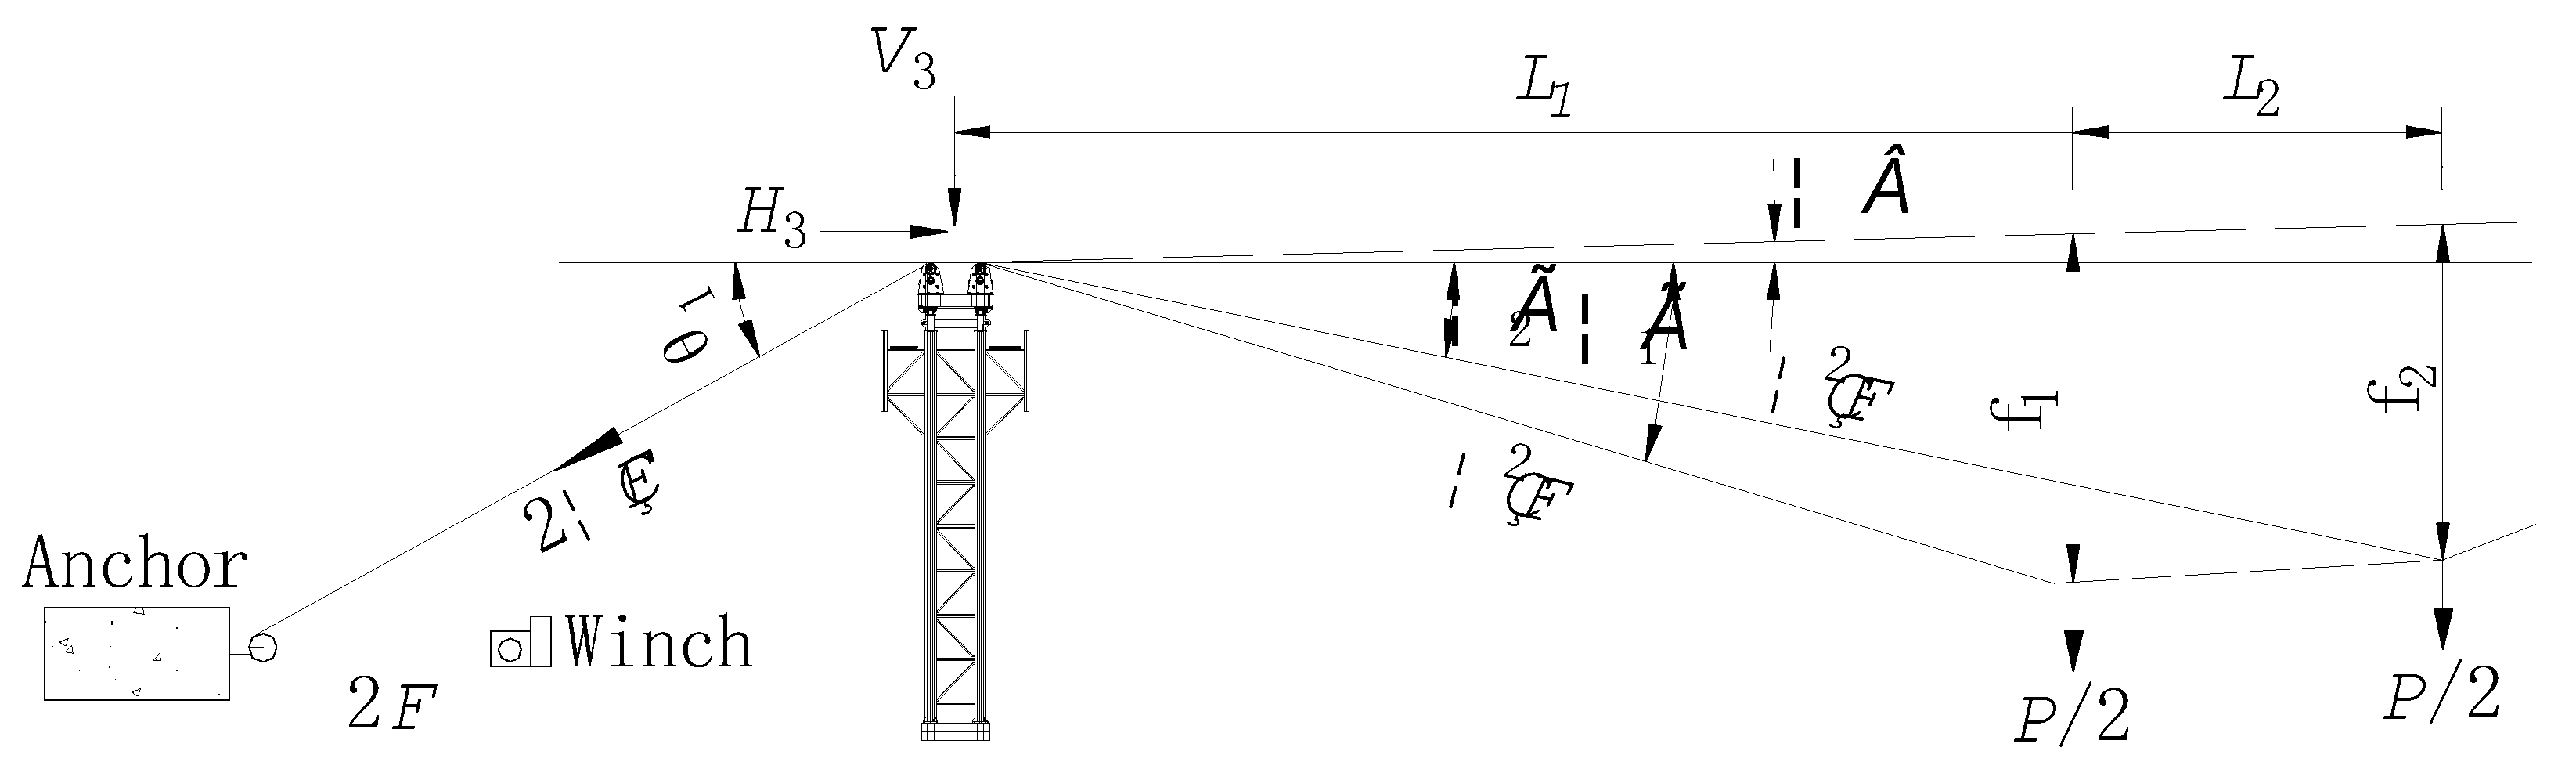
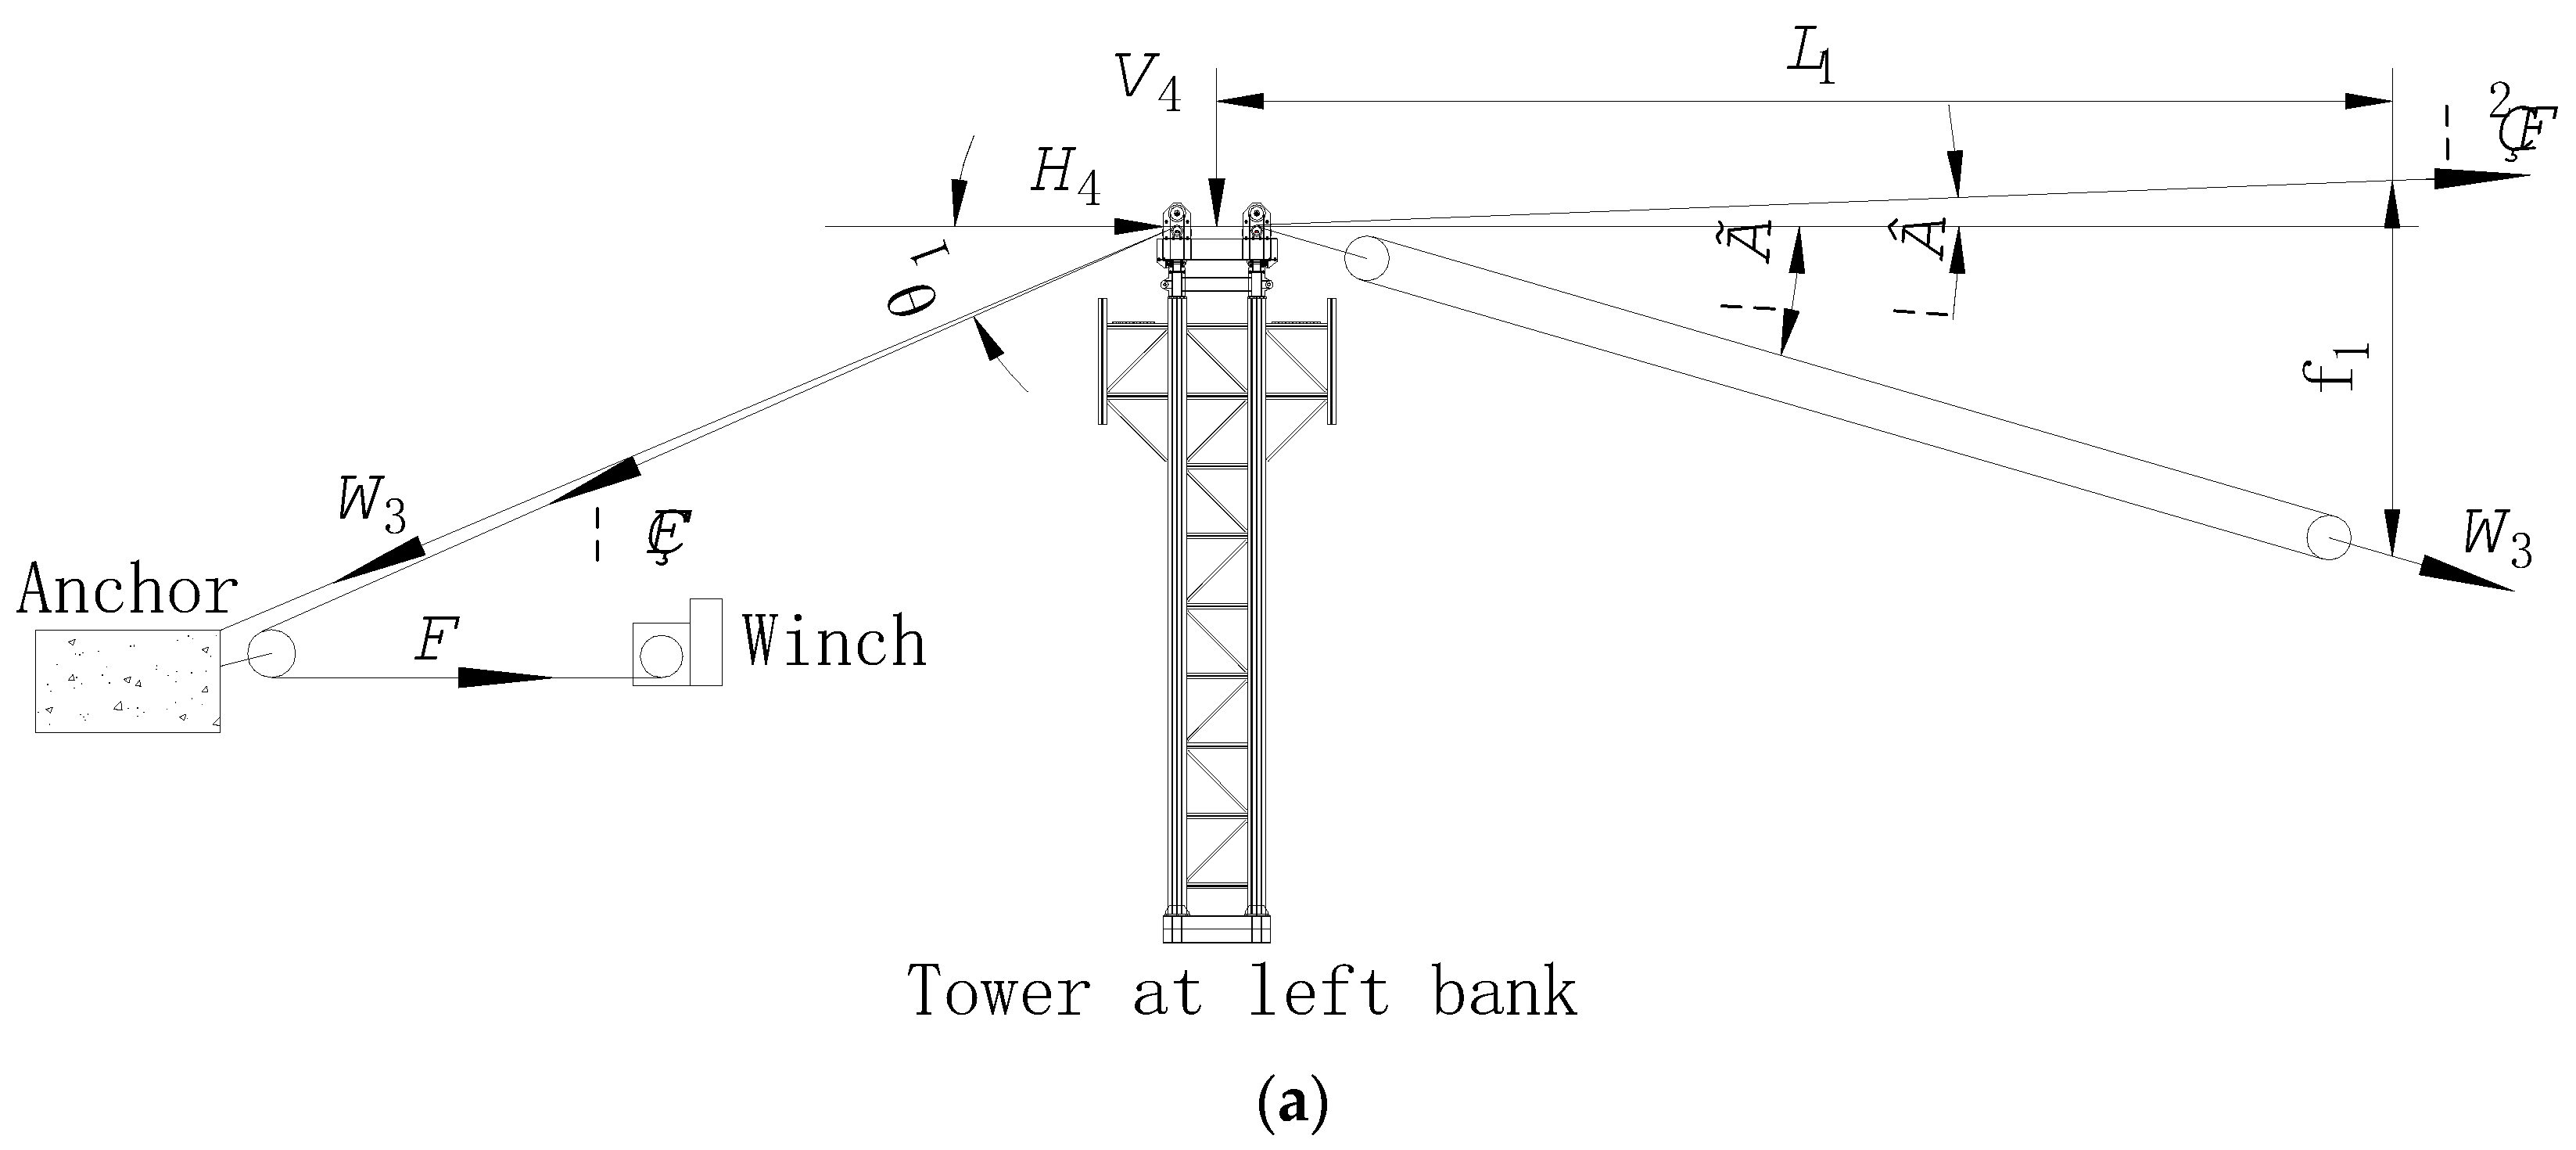
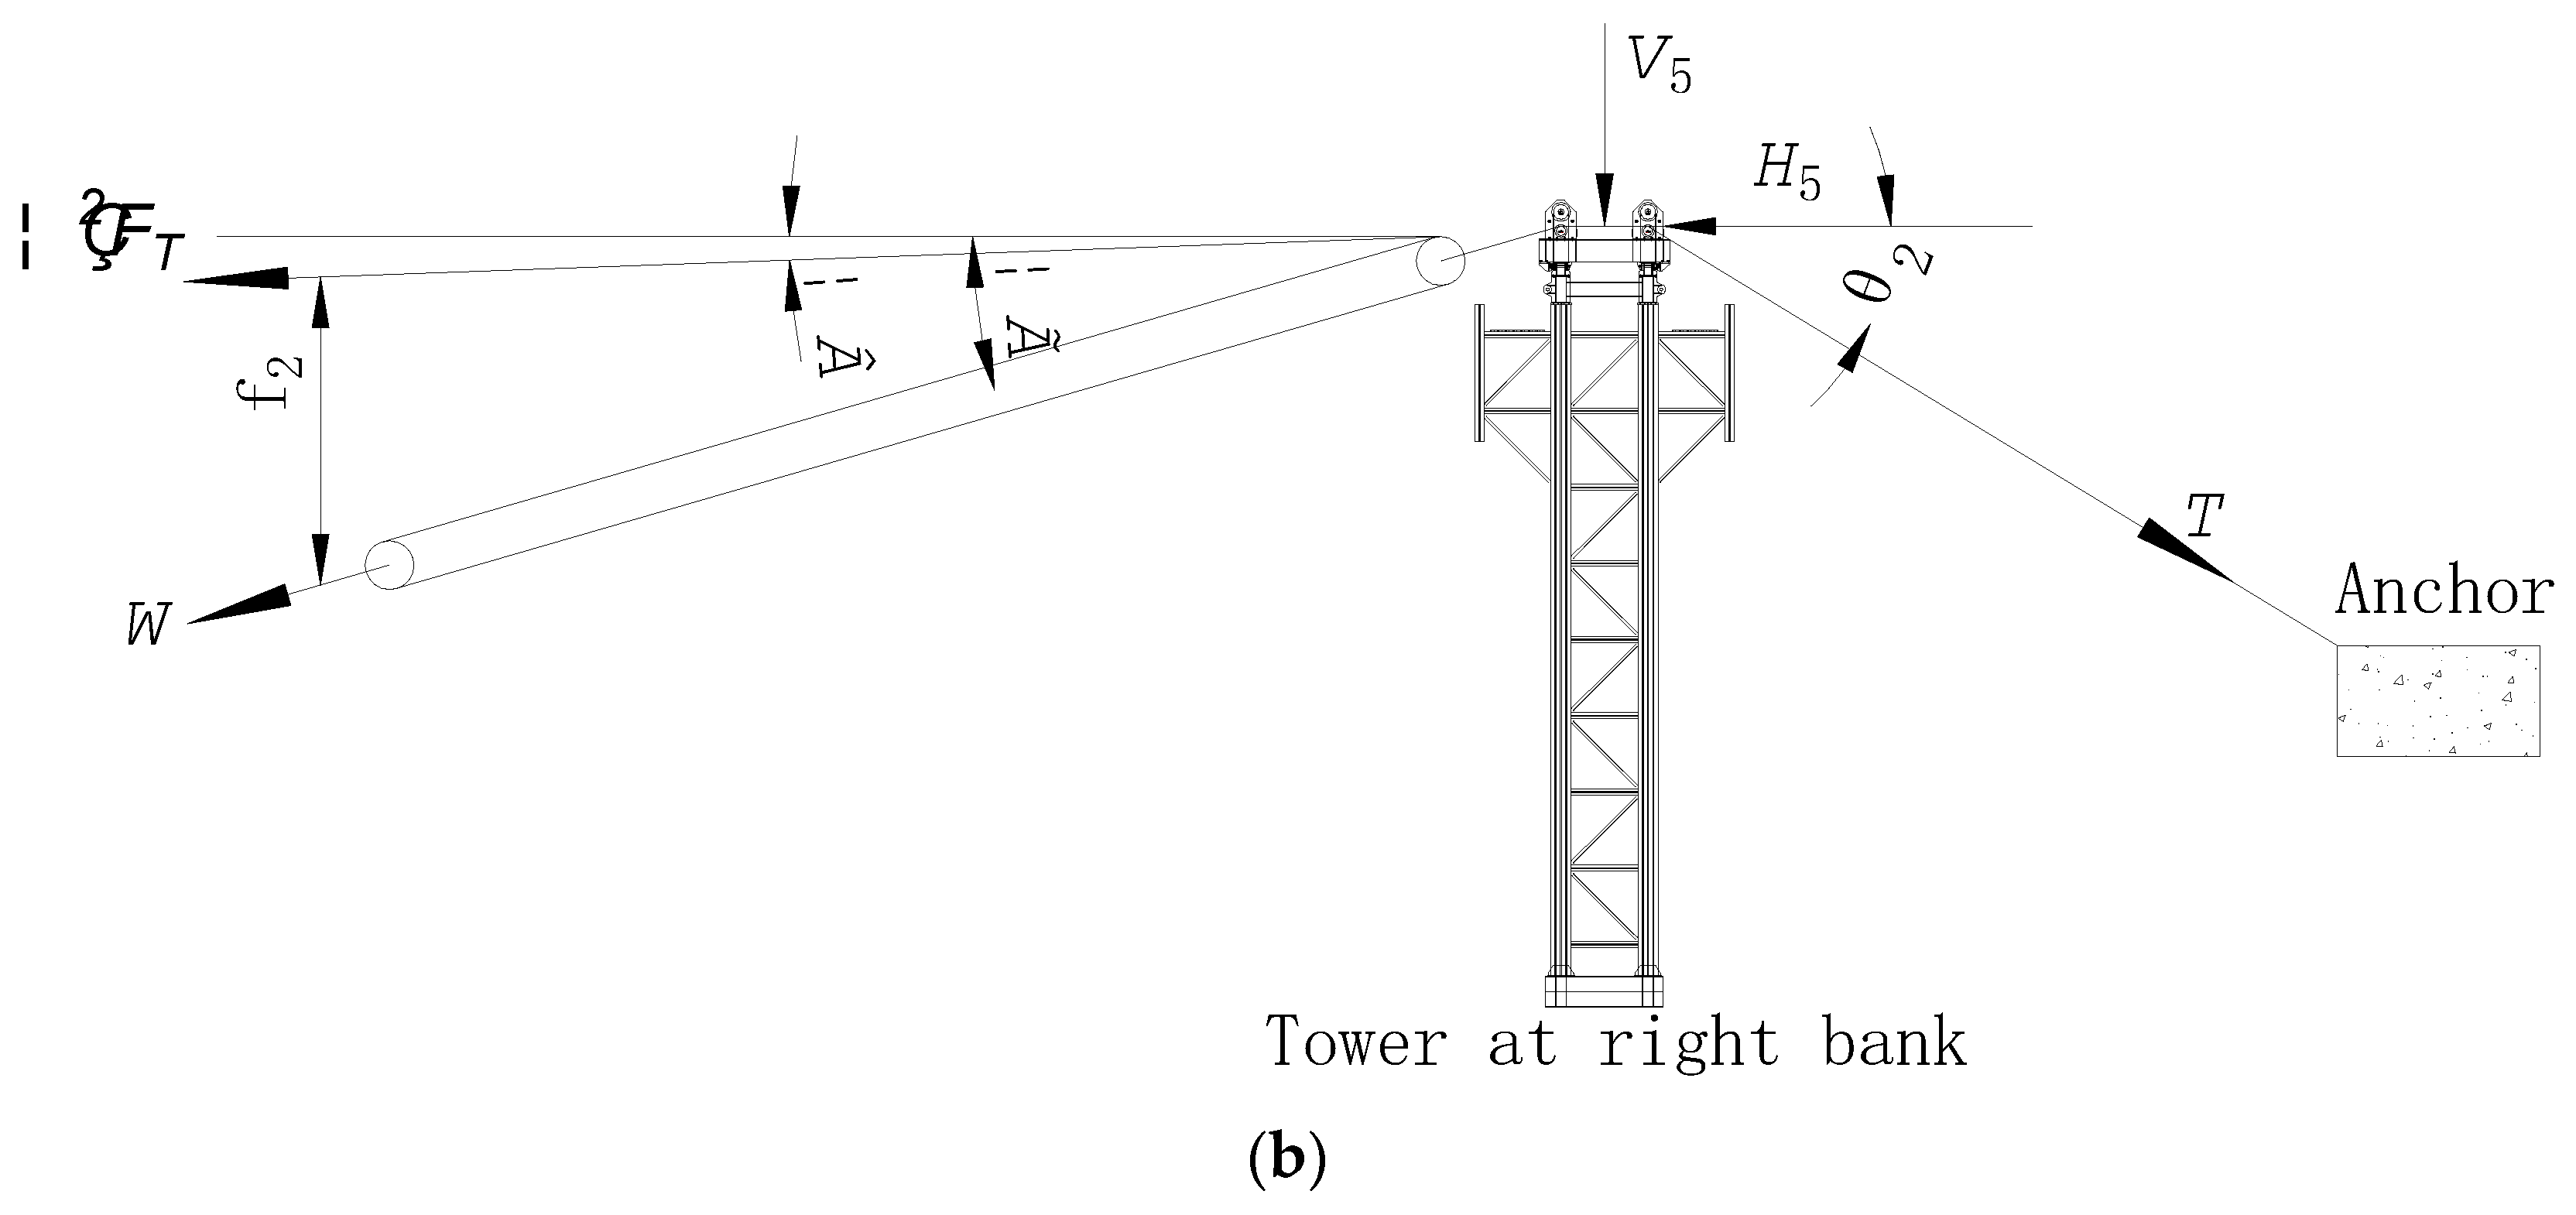
2.2. The Acting Force of Main Cable to Tower

Figure 3 [31] is a calculation schematic diagram of the forces acting on the tower from the main cable. A steel cable is arranged at the top of the tower as the main transport cable, which is supported on the tops of the towers at the left bank and right bank, the ends of which are fixed to the anchor, forming a three-span continuous structure. Generally, two sliding trolleys are rolling along the main cable, and their wheels act on the main cable with concentrated load P/2.
When the cable lifting construction scheme is determined, see Figure 3a, the installation sag in mid-span of the main cable is known and the corresponding moment ML/2 in mid-span of the simply supported beam can be formulated as:
M L / 2 = 1 8 Q L 2 c o s β = Q L L 2 + Δ H 2 8
where Q represents the unit weight of the main rope (kN/m); L represents the lifting span (m); and ΔH represents the height gap between the tower tops at both banks (m).
The horizontal tension H0 between the span of empty cable can be formulated as:
H 0 = M L / 2 f 0 = Q L L   2 + Δ H 2 8 f 0
where f0 represents the installation sag in mid-span of the main cable (m).
The vertical forces acting on the towers at the left and right banks by the empty cable during the span are R10 and R20, respectively, which can be formulated as:
R 10 = 1 2 Q L c o s β H 0 t a n β = Q L   2 + Δ H 2 2 H 0 Δ H L = Q L   2 + Δ H 2 2 Q L L   2 + Δ H 2 Δ H 8 f 0 L
R 20 = 1 2 Q L c o s β H 0 t a n β = Q L   2 + Δ H 2 2 H 0 Δ H L = Q L   2 + Δ H 2 2 Q L L   2 + Δ H 2 Δ H 8 f 0 L
The tension of the main cable located behind the towers at the left and right banks is T10 and T30, respectively, which can be formulated as:
T 10 = R 10 2 + H 0 2
T 30 = R 20 2 + H 0 2
Taking Equations (2)–(4) into Equations (5) and (6), T 10 and T 30 can be calculated.
The horizontal and vertical forces on the tower tops at the left and right bank for the case of an empty cable are H10, H20, V10, and V20, respectively, which can be formulated as:
H 10 = H 0 T 10 c o s α 1 = Q L L   2 + Δ H 2 8 f 0 R 10 2 + H 0 2 c o s α 1 s
H 20 = H 0 T 30 c o s α 2 = Q L L   2 + Δ H 2 8 f 0 R 20 2 + H 0 2 c o s α 2
V 10 = R 10 T 10 s i n α 1 = Q L   2 + Δ H 2 2 Q L L   2 + Δ H 2 Δ H 8 f 0 L R 10 2 + H 0 2 s i n α 1
V 20 = R 20 T 30 s i n α 2 = Q L   2 + Δ H 2 2 Q L L   2 + Δ H 2 Δ H 8 f 0 L R 20 2 + H 0 2 s i n α 2
Taking H0, R10, and R20 from Equations (2)–(4) into Equations (7)–(10), H10, H20, V10, and V20 can be calculated.
When the rated load is transported by the main cable, see Figure 3b, set the sag of the cable carrying load at the front lifting point as f2, then the bending moment at the front and rear lifting points of the corresponding simply supported beam are M1 and M2, respectively, which can be formulated as:
M 1 = P L 1 1 L 1 + L 2 / 2 L + 1 2 Q L 1 ( 1 L 1 / L ) L 2 + Δ H 2
M 2 = P ( L L 1 L 2 ) L 1 + L 2 / 2 L + Q L 1 + L 2 1 L 1 + L 2 L L 2 + Δ H 2 2
Because the load is vertical, the horizontal force H along the length of the main cable (between spans) is a constant, which can be formulated as:
H = M 1 f 1 = M 2 f 2
Thus:
F 1 = M 2 f 2 M 1
where f1 represents sag at the back lifting point of the main cable carrying load (m); f2 represents sag at the front lifting point of the main cable carrying load (m).
The vertical forces acting on the towers at the left and right banks by the main cable carrying load during a span are R1 and R2, respectively, which can be formulated as:
R 1 = P 1 2 L 1 + L 2 2 L + Q L   2 + Δ H 2 2 Δ H L
R 2 = P L 1 + L 2 / 2 L + Q L   2 + Δ H 2 2 + H Δ H L
The tension of the main cable carrying load located behind the towers at the left and right banks is T1 and T3, respectively, which can be formulated as:
T 1 = R 1 2 + H 2
T 3 = R 2 2 + H 2
The horizontal and vertical forces on the tower tops at the left and right banks for the case of a cable carrying load are H1, H2, V1, and V2, respectively, which can be formulated as:
H 1 = H T 1 c o s α 1 = H R 1 2 + H 2 c o s α 1
H 2 = H T 3 c o s α 2 = H R 2 2 + H 2 c o s α 2
V 1 = R 1 + T 1 s i n α 1 = P 1 2 L 1 + L 2 2 L + Q L   2 + Δ H 2 2 Δ H L + R 1 2 + H 2 s i n α 1
V 2 = R 2 T 3 s i n α 2 = P L 1 + L 2 / 2 L + Q L   2 + Δ H 2 2 + H Δ H L R 2 2 + H 2 s i n α 2
Taking H, R1, and R2 from Equations (13)–(16) into Equations (19)–(22), H1, H2, V1, and V2 can be calculated.

2.3. The Acting Force of Lifting Cable to Tower

The lifting winch is arranged at the rear of the tower, and the moving head of the lifting cable enters into the lifting winch after passing a guide wheel at the tower top and anchor, and the fixed head is anchored on the fixed sliding trolley, so the lifting cable only produces force on the tower and anchor at the left bank. Figure 4 shows the calculation diagram of the acting force of the lifting cable on the tower.
The horizontal and vertical forces on a tower top from the lifting cable are H3 and V3, respectively, which can be formulated as:
H 3 = η 2 F cos γ 1 + cos γ 2 2 η F cos θ
V 3 = η 2 F sin γ 1 + sin γ 2 + 2 η F sin θ
where F represents the running head traction force; η represents the efficiency coefficient of the lifting pulley; γ 1 and γ 2 respectively represent the forward tilt angle of the lifting running head before and after the lifting point, and its calculation formulae are Equations (23) and (24).
γ 1 = t a n 1 f 1 L 1 Δ H / L L 1
γ 2 = t a n 1 f 2 ( L 1 + L 2 ) Δ H / L L 1 + L 2

2.4. The Acting Force of Towing Cable to Tower

Figure 5 shows the schematic diagram of calculating the forces acting on the tower from the towing cable. The role of the towing cable is to tow a trolley for transportation on the main cable. The towing winch is set at the left bank, and the geometrical layout of the towing cable is shown in Figure 5.
The horizontal and vertical forces on the tower tops at the left and right banks from the towing cable are H4, V4, H5, and V5, respectively, which can be formulated as:
H 4 = η 2 F T c o s β + W 3 c o s γ ( η F T + W 3 ) × c o s θ 1
V 4 = η 2 F T s i n β + W 3 s i n γ + ( η F T + W 3 ) s i n θ 1
H 5 = η 2 F T c o s β + W c o s γ + η 2 F T c o s β + W c o s γ 2 + η 2 F T c o s β + W s i n γ 2 c o s θ 2
V 5 = η 2 F T c o s β + W s i n γ + η 2 F T c o s β + W c o s γ 2 + η 2 F T c o s β + W s i n γ 2 s i n θ 2
where W represents towing force (kN), F T represents running head force (kN), γ represents towing rise angle (°), and W3 represents post-traction relaxation tension (kN), which can be formulated as:
W = G ( s i n γ + μ c o s γ ) + 2 η 2 F + q L 5 2 8 f q
W 3 = q L 5 2 8 f q
F T = W η n
γ = t a n 1 f 1 L 1 Δ H / L + L 3 + L 4 L 1
where μ represents the resistance coefficient of the sliding trolley running, q represents the weight per unit length of the towing cable (kN/m), f q represents the towing droop (m), L 5 represents the post-traction length (m), and n represents the number of pulleys.

3. Accuracy Verification of Calculation Method

The correctness of the calculation method is verified by measuring the displacements of the tower tops. A representative bridge is selected as an engineering case for validation. The numerical calculation model of the tower is established and, using the calculation method proposed above, the cable system load on the tower when the main cable transports a rated load to mid-span is calculated and applied to the numerical model of the tower, from which the displacement of the tower can be calculated under the action of an only cable system load. The displacement of the tower top is monitored during the test operation of the cable lifting system. The measured displacements at the tower tops are compared with the values calculated by a finite element method. The size of discrepancy of the displacement at the tower top obtained by two methods can indicate the correctness of the calculation method and the accuracy of the calculation. The smaller the displacement discrepancy value, the higher the accuracy of the calculation method, and the larger the displacement discrepancy value, the lower the accuracy of the calculation method. The detailed method and procedures of verification are presented in the following using a specific engineering project.

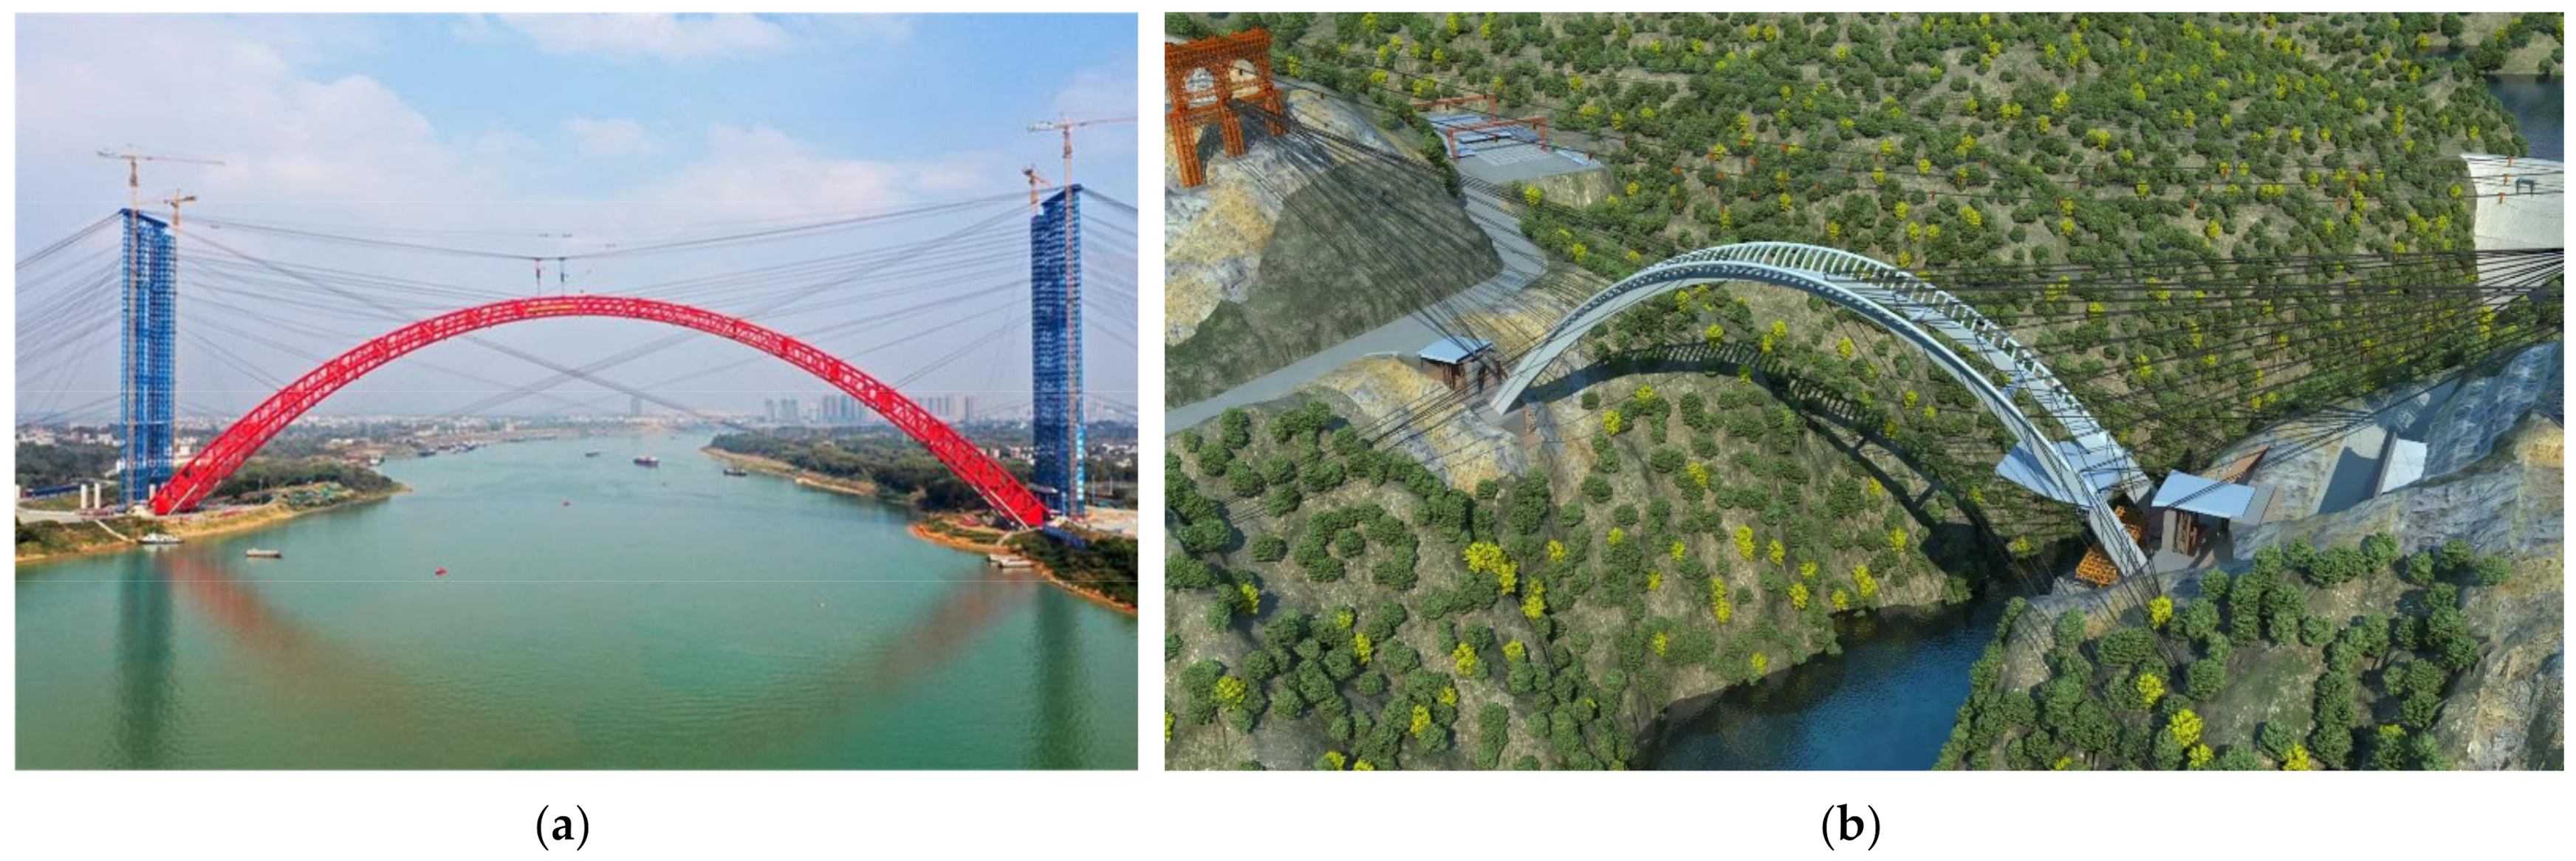
3.1. Engineering Overview

The engineering case is a special Y-shaped arch bridge cable lifting construction [32], which uses an extra-wide tower with three main cables and can provide a reference for many large-span arch bridge constructions. Figure 6 shows the overall arrangement of the cable lifting system for the engineering case. The cable lifting system is mainly composed of a main cable, lifting cable, towing cable, wind cable, sliding trolley, cable saddle, tower, anchor, winch, etc. The main cable span of the cable lifting system in the engineering case is 430 m. The main anchor and buckle anchor are set at the same location on both banks, with the main anchor on the right bank 65 m in distance from the tower and the main anchor on the left bank 68 m in distance from the tower, as shown in Figure 6.
The cable lifting system is set up with three sets of main cables with a rated lifting capacity of 135 tons, which are located upstream from the bridge axis at a distance of 18 m, downstream from the bridge axis at a distance of 18 m, and on the bridge axis. Each group of main cables does not carry a rated load at the same time. Each group of main ropes is set up with two lifting points at both front and back, and the rated lifting capacity of a single lifting point is 67.5 tons. The main cable span is arranged as (68 + 430 + 65) m. The angle between the back cable of the main cable on the left bank and horizontal plane is 23.0°, and the angle between the back cable of the main cable on the right bank and horizontal plane is 34.1°. The parameters of the cable system when carrying to mid-span are listed in Table 1.
The longitudinal displacement of the tower is restrained by the rear wind cable and inter-span wind cable. The cable towers are set up with six wind cables at front and rear and two cross-wind cables on each side; the front wind cable is an inter-span wind cable, anchored at the top of the cable towers on both banks, and the rear wind cable is anchored on the main anchor. Each group of inter-span wind cables adopts a 1φ56 mm steel wire rope (6 × 37S + FC 1670 Mpa), and each group of rear wind cables adopts a 6φ32 mm steel wire rope (6 × 37S + IWR 1670 Mpa). Each group of side wind cables adopts a 6φ22 mm steel wire rope (6 × 37S + FC 1670 Mpa), which is arranged at an angle of 40° with the horizontal plane.

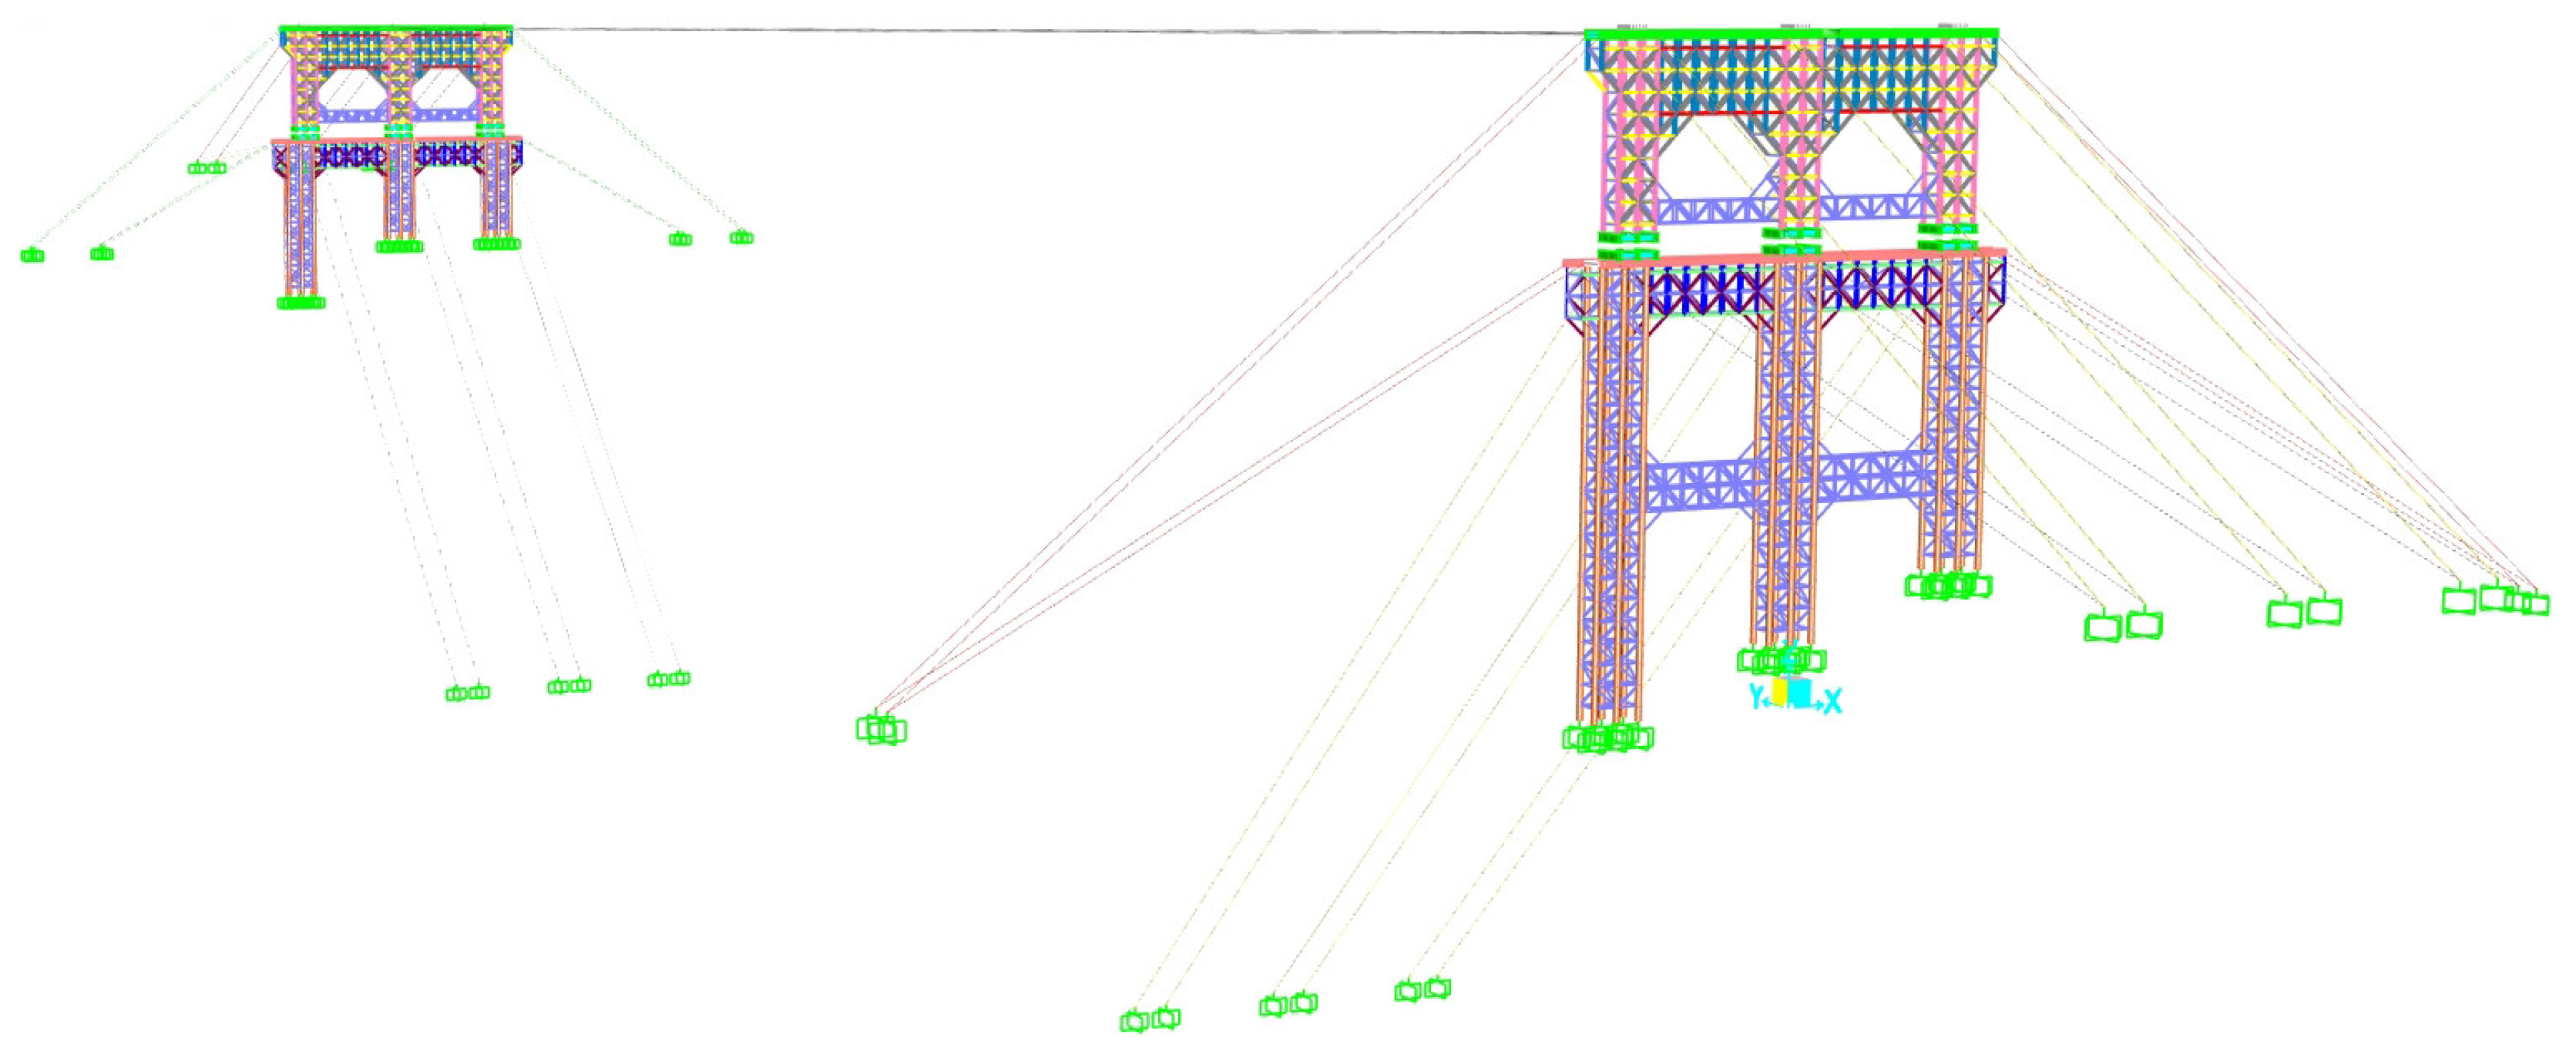
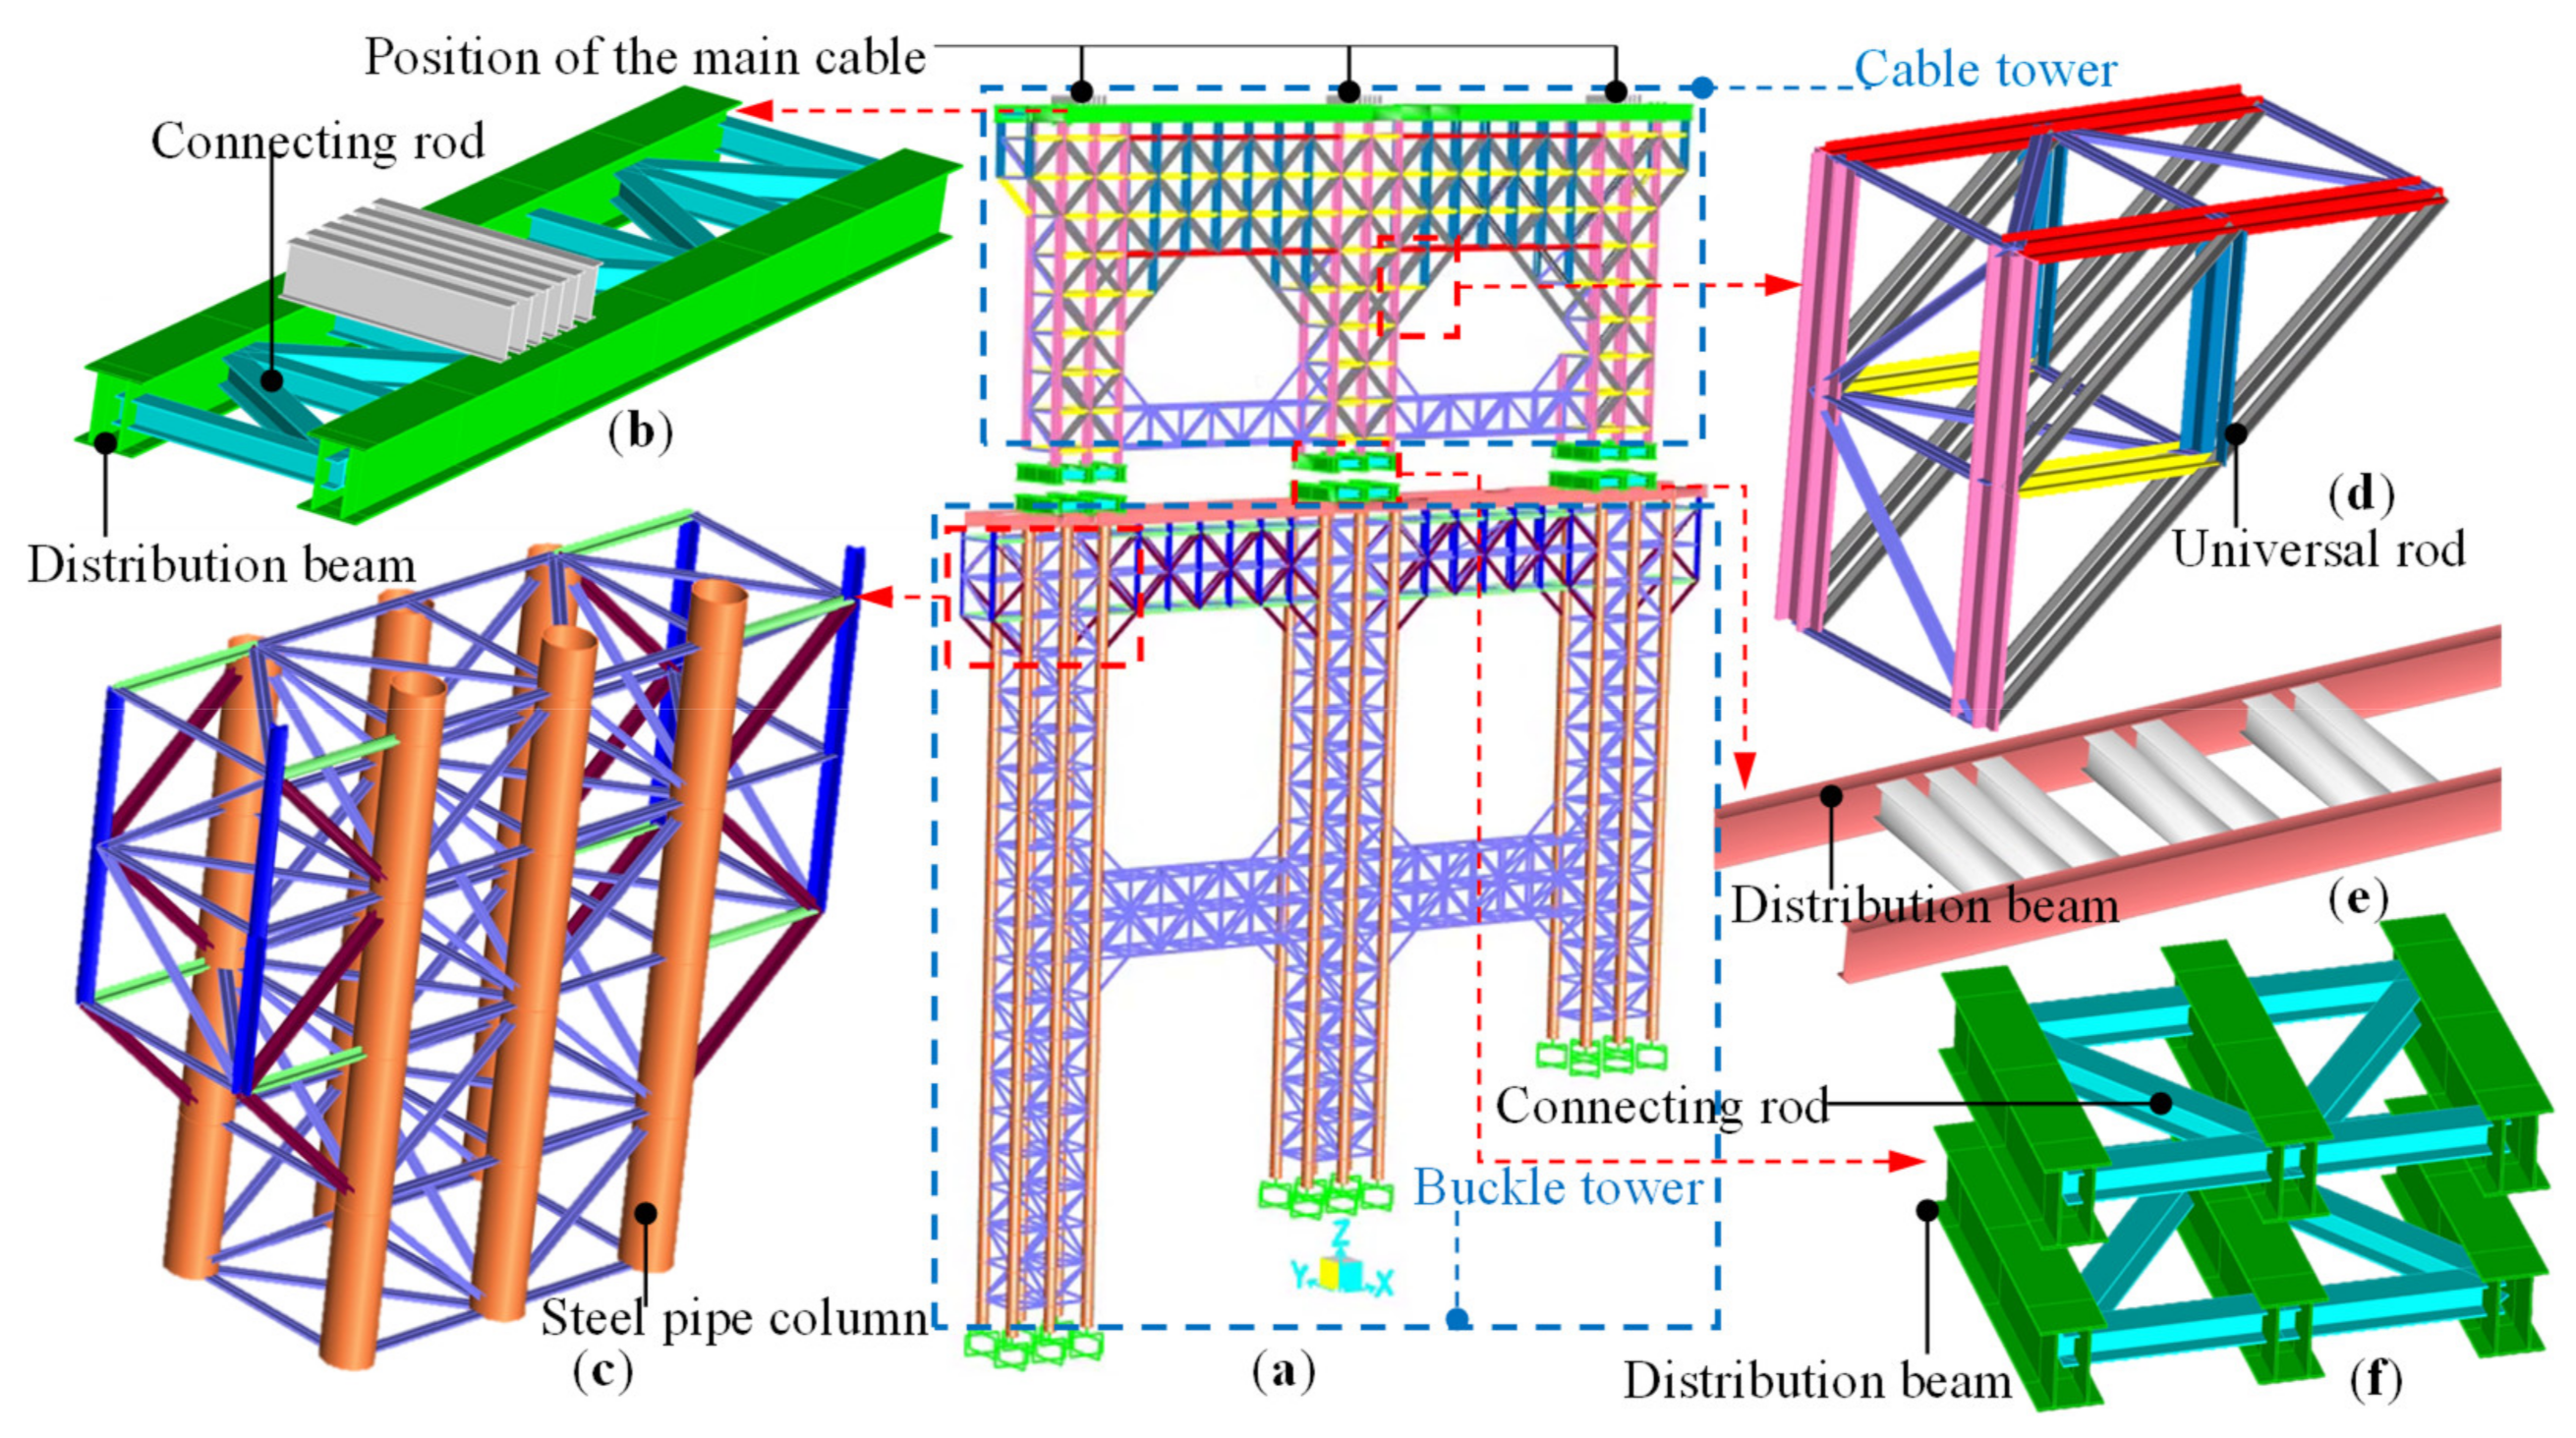
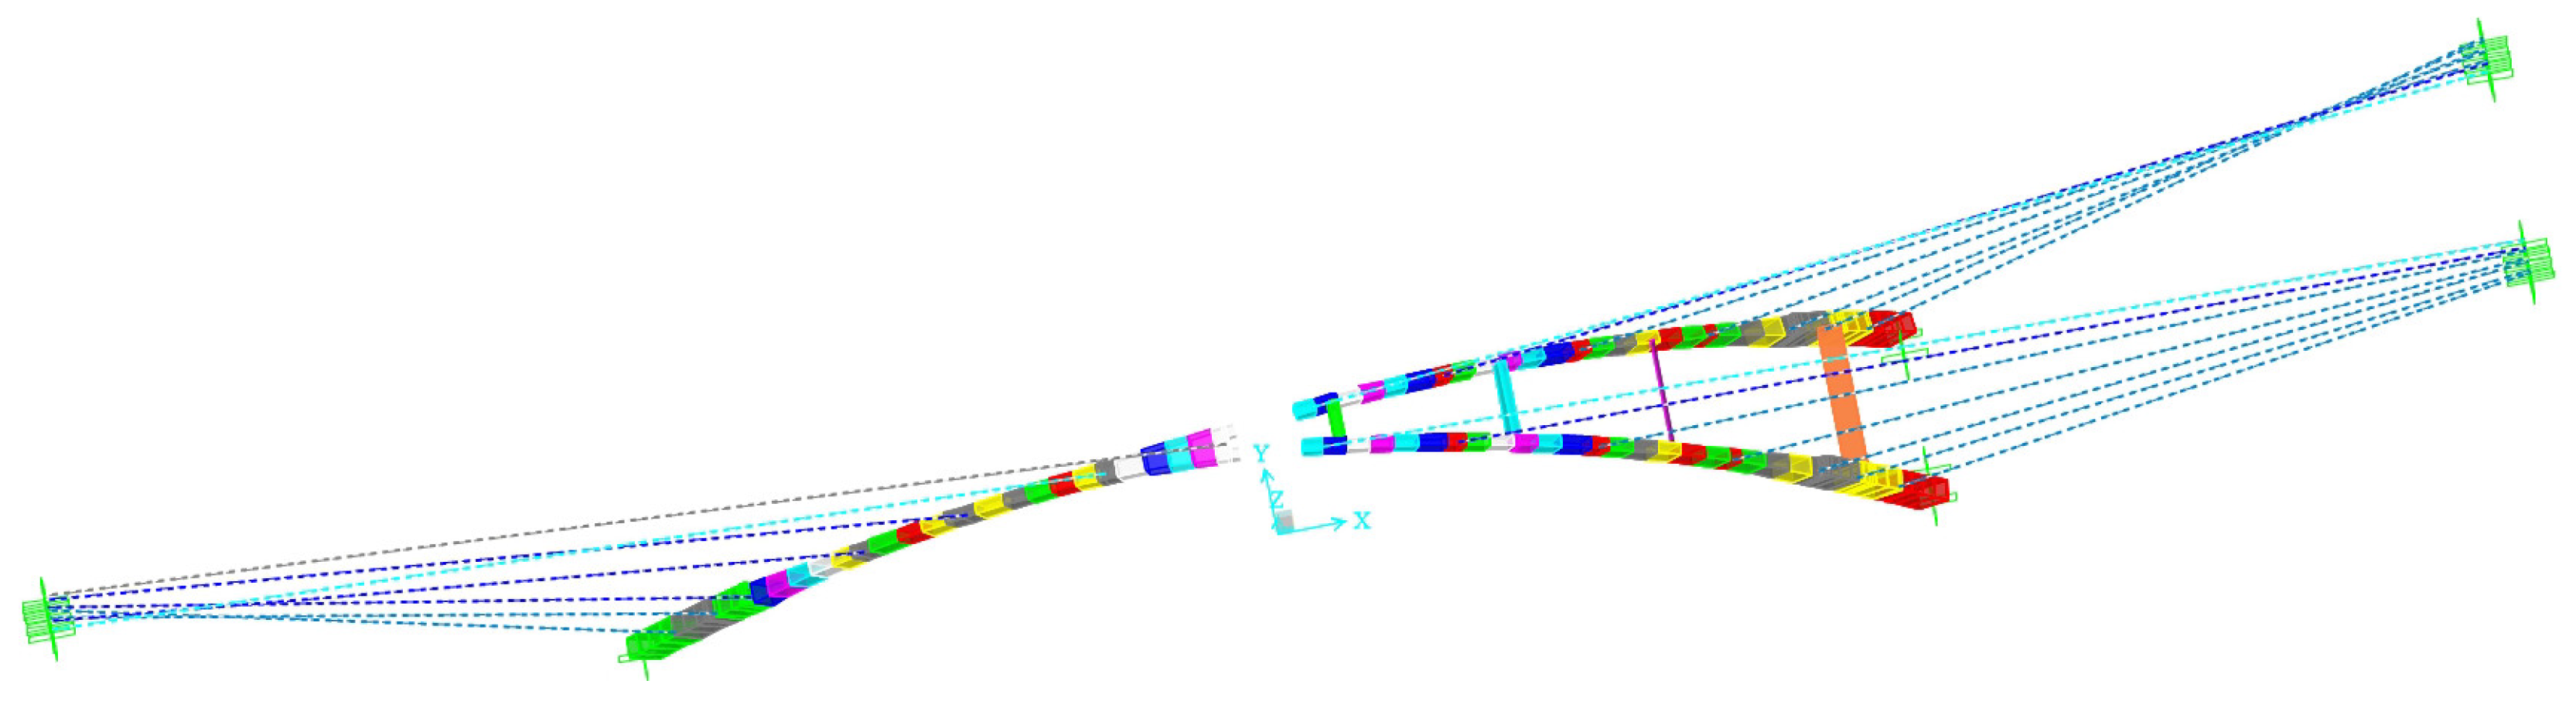
3.2. Numerical Model

3.2.1. Establishment of Numerical Model

Wind cables and towers are simulated by a spatial rod-frame structure using the general-purpose finite-element analysis software SAP2000. Figure 7 shows the overall numerical calculation model. The overall coordinate system of the numerical model takes the cross-bridge direction as the X axis, the along-bridge direction as the Y axis, and the vertical direction as the Z axis. The wind cable is considered as the cable element in the calculation model, and its constraints are simulated as hinged at both ends; the connection with the Earth is a fixed hinge, and its initial tension is added according to strain load. The individual component parts of the tower are simulated using a frame element. The connection between the tower column and the Earth is simulated by a fixed hinge. The connections between the universal rods are simulated as hinged at both ends. The foot of the cable tower is hinged to the top of the buckle tower. The foot of the buckle tower is fixed to the Earth. The size of the tower element is 0.5 m and the size of the wind cable element is 1 m. The whole numerical model has 2212 nodes and 6214 frame elements.
Figure 8 shows the numerical model of the right bank tower and its component members. The structures of the towers on both banks are basically the same; both are in the form of a cable tower and buckle tower combined into one (see Figure 8a). The height of cable tower is 21.6 m, the transverse width of the top is 44 m, and the transverse width of the tower foot is 40 m. The cable tower is assembled into a truss structure using M-type universal rods. The main column adopts double columns with a single column size of 4 m × 2.56 m in plan (see Figure 8d). A steel-box distribution beam is set at the top of the tower to support the main cable and cable saddles and to distribute loads transferred from the suspension cable system to each node at the top of the tower (see Figure 8b). The cable tower bottom is hinged with the buckle tower top; the cable tower bottom hinge seat distribution beam adopts a steel box beam (see Figure 8f). Each column of the buckle tower is made of 6∅630 × 14 mm steel pipes and connected by a ring flange to ensure the strength and stiffness of the buckle tower. Diagonal rods adopt universal rods and connect with the welded plate on the column steel pipe through bolts (see Figure 8c). The full width of the buckle tower top is 47.6 m, and an H-type distribution beam is set at the top of the buckle tower (see Figure 8e).
The universal rods of the tower are made of Q235 steel, and the steel pipe columns, H-beams, and distribution beams are made of Q345 steel. The material physical and mechanical characteristic parameters are shown in Table 2.

3.2.2. Loads in Analysis

The main purpose of setting the initial tension of the wind cable is to reduce the influence of nonlinear factors such as sag. Since the wind cable has a larger initial tension, it can be regarded as an elastic unit that can bear tensile pressure when the tension is greater than zero, and the tension decreases when it is under pressure. The initial tension of the wind cable is approximately simulated by the initial strain load. The strain value corresponding to the initial tension of wind cable is calculated as:
ε 0 i = T 0 i E i × A i
where T 0 i represents the initial tension of wind cable (kN), E i represents elastic modulus of steel cable (kN/mm2), and A i represents the cross-sectional area of wind cable (mm2). The elastic modulus of the steel-core steel cable is 105 kN/mm2 and of the fiber-core steel cable is 75.6 kN/mm2. The initial strain values of the wind cable calculated by Equation (35) are shown in Table 3.
Three load conditions are taken for verification of the calculation method’s correctness, which are as follows: (1) the upstream main cable transports the rated load to mid-span while the remaining two groups of main cables are unloaded; (2) the middle main cable transports the rated load to mid-span while the remaining two groups of main cables are unloaded; and (3) the downstream main cable transports the rated load to mid-span while the remaining two groups of main cables are unloaded. The main loads are self-weight, wind cable initial tension, and cable system load. The self-weight is automatically realized by the numerical calculation software according to the material density. The forces acting on the tower tops obtained by the calculation method when transporting the rated load of a single main cable to the middle of the span are listed in Table 4.

3.3. Measurement of Engineering Actual Data

The prisms are installed on both sides of the tower top, and the displacements of towers are measured and read directly by using the total station, which is set on the longitudinal and transverse axis of the tower. Nine measurement points are set on the top of each tower. Figure 9 shows the tower and the installation position of prisms in the engineering case.
The maximum actual measured values of the displacements of the towers under each load condition are shown in Table 5. According to existing engineering experience, in the lifting process of the cable tower and buckle tower combined into one structure, if the displacement of the tower top is more than 200 mm this will produce a greater impact on the arch rib shape, so it is necessary to control the tower deflection as much as possible in the construction. How to control it will be given in Section 3.4.

3.4. Discussion and Analysis of Data

Figure 10 shows the overall deformation of the tower at the right bank under the load of only the cable system. The overall deformation is mainly contributed to by the longitudinal deformation, and the transversal deformation and vertical deformation are smaller. Since the maximum displacement of the tower top occurs on the right bank, the deformation of the tower at the left bank is smaller, so the numerical simulation diagram of tower deformation at the left bank need not be given.
The maximum deformation of the tower top under the action of load condition 1 occurs at the edge of the tower top that is near the upstream side, and the maximum longitudinal displacement is 197.1 mm. The maximum deformation of the tower top under the action of load condition 2 occurs at the center of the tower top, and the maximum longitudinal displacement is 138.7 mm. The maximum deformation of the tower top under the action of load condition 3 occurs at the edge of the tower top that is near the downstream side, and the maximum longitudinal displacement is 199.4 mm. Table 6 shows the numerical calculation results of the maximum displacement of the tower top under the three load conditions.
The error of the maximum displacement of the tower top is the absolute value, which is the actual measured value subtracted by the numerical calculated value. Table 7 lists the error values of the maximum displacement of the tower top. The maximum longitudinal displacement error is within 5.2 mm, the maximum transversal displacement error is within 1.4 mm, and the maximum vertical displacement error is within 2.3 mm for the towers under each load condition. The smaller errors may be caused by numerical simulations or engineering measurements but are within tolerable limits. The errors within the tolerance range prove the correctness of the calculation method and have sufficient accuracy to meet the requirements of engineering applications. The validation method also proves the correctness of the numerical calculation.
According to the calculation results listed in Table 6, the maximum displacement of the tower at the left bank toward the river is 45.3 mm, and the maximum displacement of the tower at the right bank toward the river is 199.4 mm. To achieve the purpose of making the maximum forward and maximum backward displacement of towers tend to be close, it is possible to pre-deflect backward 100 mm of the installation displacement of the tower at the right bank by initial tension of the wind cable. To reduce the nonlinear effect of the wind cable sag and increase the restraint effect of the wind cable on the towers, all wind cables are set with a certain initial tension. The initial tension of a wind cable is imposed after the installation of the cable tower is completed, before the installation of the cable, and to control the cable tower top at right bank toward the back (anchor direction) a pre-deflection of 100 mm is set. A pre-deflection value is not set for the cable tower at the left bank or for the buckle towers at both banks.
As a result, under the premise of a backward pre-deflection of 100 mm of the tower installed at the right bank, the maximum forward longitudinal displacement of the tower at the right bank is 99.4 mm under the action of load condition 3. The tower at the left bank is not pre-deflected, and when the rated load is transported to the mid-span, the maximum longitudinal displacement of the tower at the left bank from its center to the river is 45.3 mm. The height of the cable tower is 21.5 m, which meets the specification requirement of maximum allowable longitudinal displacement at the top of a mast-type tower, so it also proves that the parameters of the cable system are taken reasonably.

4. Application in Tower Analysis

The calculation method of the force of the cable system to the tower is verified by the engineering case to be completely correct and the accuracy meets the engineering requirements. Such a practical calculation method is mainly used to prepare for the analysis of the mechanical properties of a tower in construction. The following sections will specifically analyze the towers in the engineering case to provide a demonstration of the calculation method for practical engineering application.
The mechanical analysis of a tower needs to consider not only the cable system load, but also the combined effect of wind load and buckle cable load. The operational state of the cable lifting system is calculated according to level six wind, and the non-operational state is calculated according to level ten wind. The wind speed is 13.8 m/s at level six and 26.5 m/s at level ten. Wind loads are calculated by referring to the current specification [33]. The acting force of the arch rib is calculated according to the maximum cantilever state before closing. The left bank acts on the middle of the tower, and the right bank acts on both sides of the tower, and the action position is shown in Figure 11.
The nine loads imposed on the towers are combined according to different occurrences to obtain 11 load combinations, which were listed in Table 8. These nine loads are: (1) self-weight and wind cable initial tension load; (2) buckle cable load; (3) the load of the cable system when the upstream main cable transports the rated load to the middle of the span while the other two groups of main cables are unloaded; (4) the load of the cable system when the main cable at the bridge axle transports the rated load to the middle of the span while the other two groups of main cables are unloaded; (5) the load of the cable system when the downstream main cable transports the rated load to the middle of the span while the other two groups of main cables are unloaded; (6) a wind of level six blows toward the left bank; (7) a wind of level ten blows toward the left bank; (8) a wind of level six blows toward the right bank; and (9) a wind of level ten blows toward the right bank.

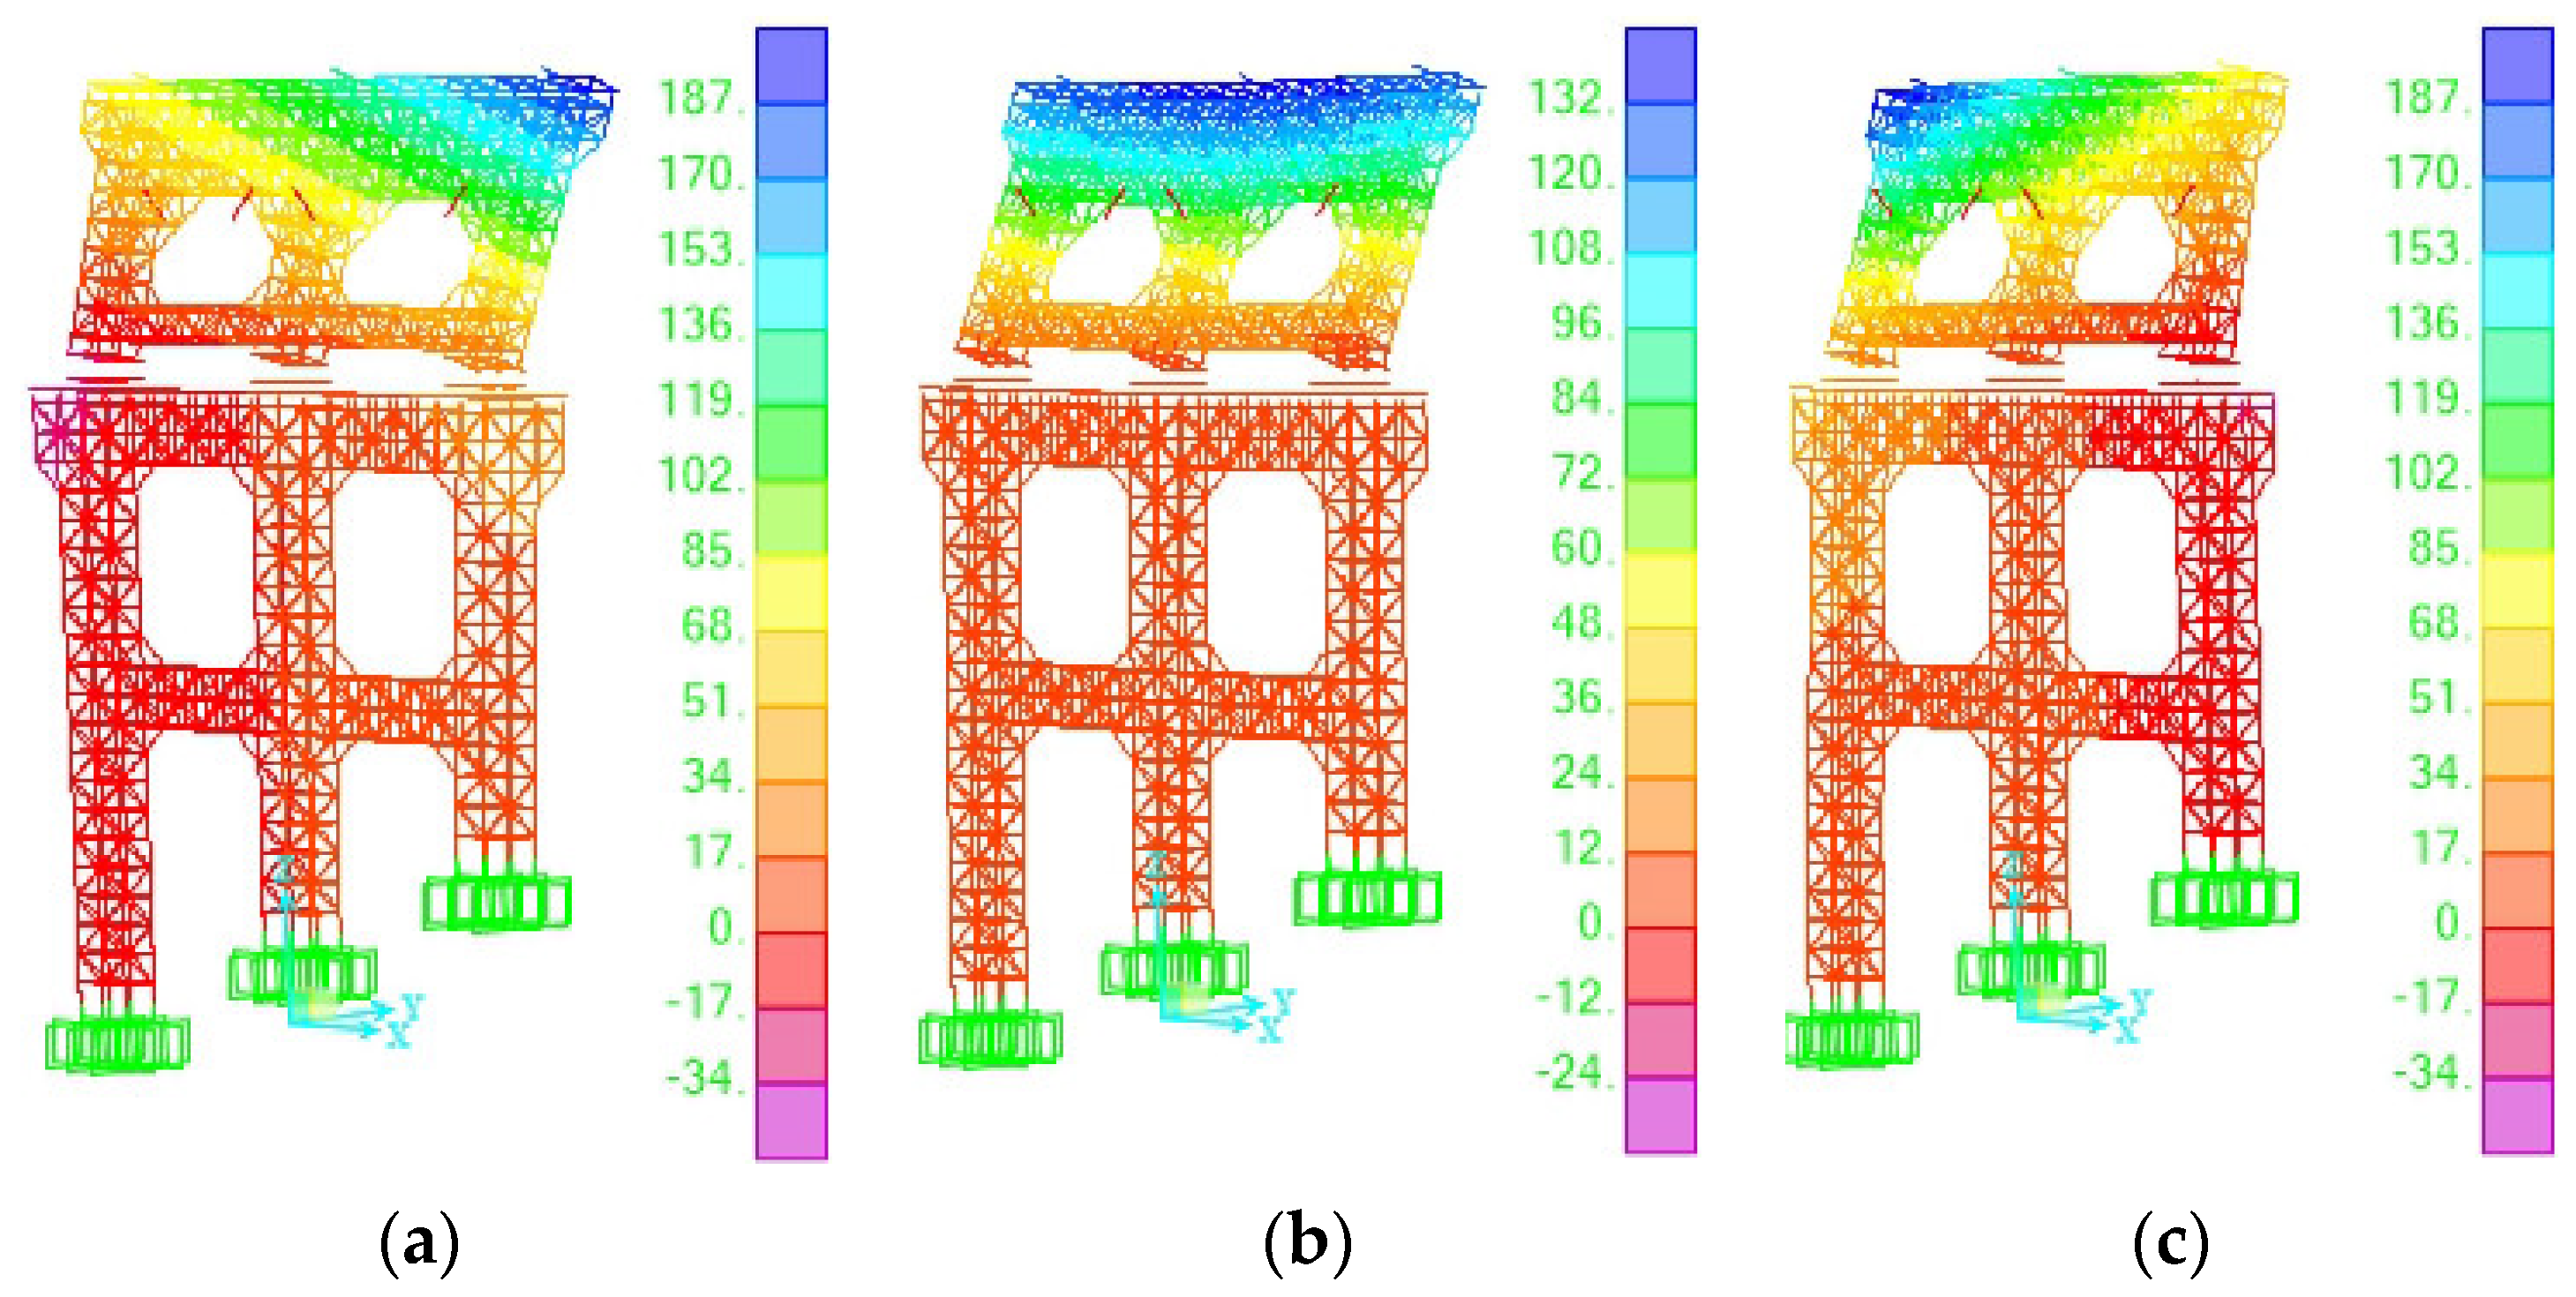
4.1. Stability Analysis

The restraining action of the wind cable on the tower is considered as the elastic support. Stability analysis is performed focusing mainly on the upstream, midstream, and downstream main cable lifting rated loads at the mid-span position. A total of eight load conditions were calculated for the buckling analysis, and their specific load combinations are shown in Table 8 for conditions 1 to 8.
Considering all the loads that may occur in the arch rib lifting, the first six orders of buckling modes are calculated for each load condition. The calculation takes into account geometrical nonlinear influences, including a P-Delta effect and large displacement effect.
Table 9 lists the first-order buckling factor for each load condition of the towers. From Table 9, it can be seen that the first-order buckling factor of the tower under the action of load condition 5 is the smallest. Since the calculated load is the actual load, the buckling factor is the safety factor, and the minimum stability safety factor 7.52 is greater than the critical value 4, and the safety factor for the other load conditions is greater. The cable lifting system is carried in a level ten wind load in the maximum cantilever state before the arch rib is closed, which has a stability safety factor of 22.91. This shows that the overall stability of the towers is safe at all stages of the arch rib installation process.
The first-order instability mode of the towers in each load condition is the overall longitudinal overturning instability of the cable towers. Figure 12 shows the first six orders of the buckling mode of the towers under the action of load condition 5. The first-order buckling mode is the longitudinal overall instability of the cable tower at the right bank (see Figure 12a). The second-order buckling mode is the longitudinal overall instability of the cable tower at the left bank (see Figure 12b). The third-order buckling mode is the twisted instability of the tower at right bank (see Figure 12c). The fourth- and fifth-order buckling modes are bending instability under compression of the steel pipe column of the tower at the right bank (see Figure 12d,e). The sixth-order buckling mode is the lateral moving instability of the right bank tower (see Figure 12f). The most likely instability of the towers is still through overall overturning. To improve the overall stability performance of a tower, the stability coefficient of the tower can be improved by setting the wind cable and adjusting the wind cable force.

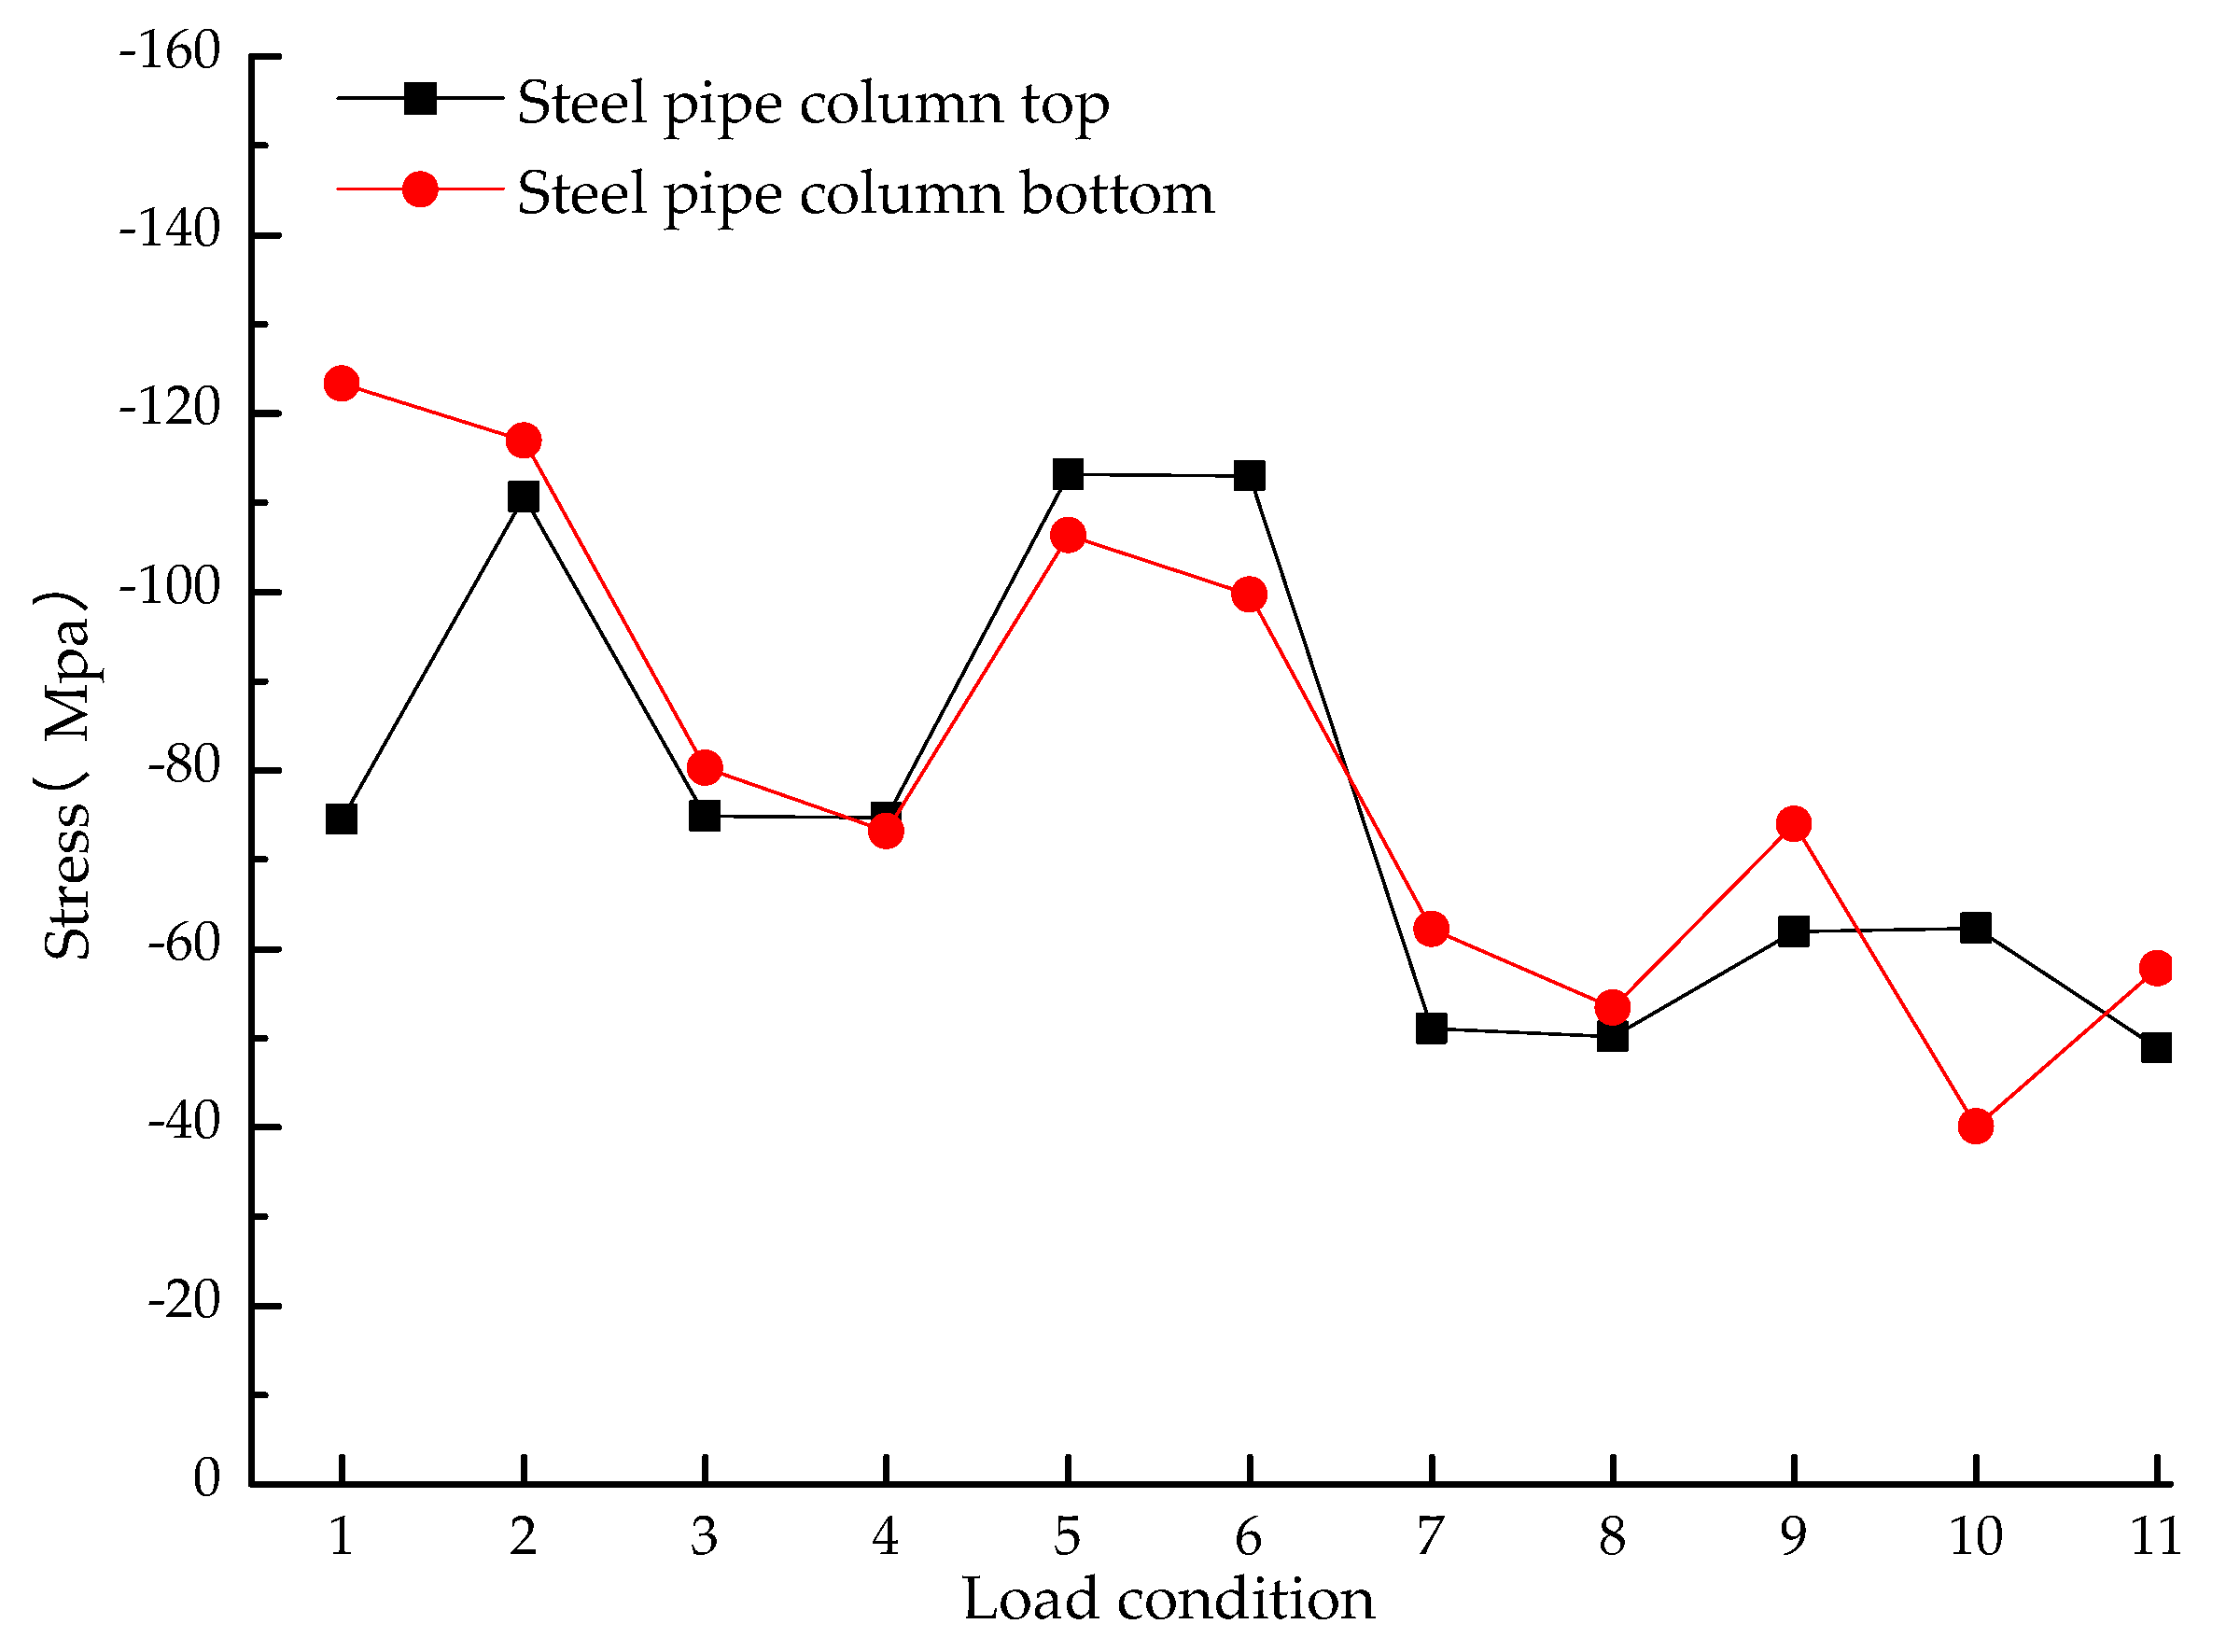
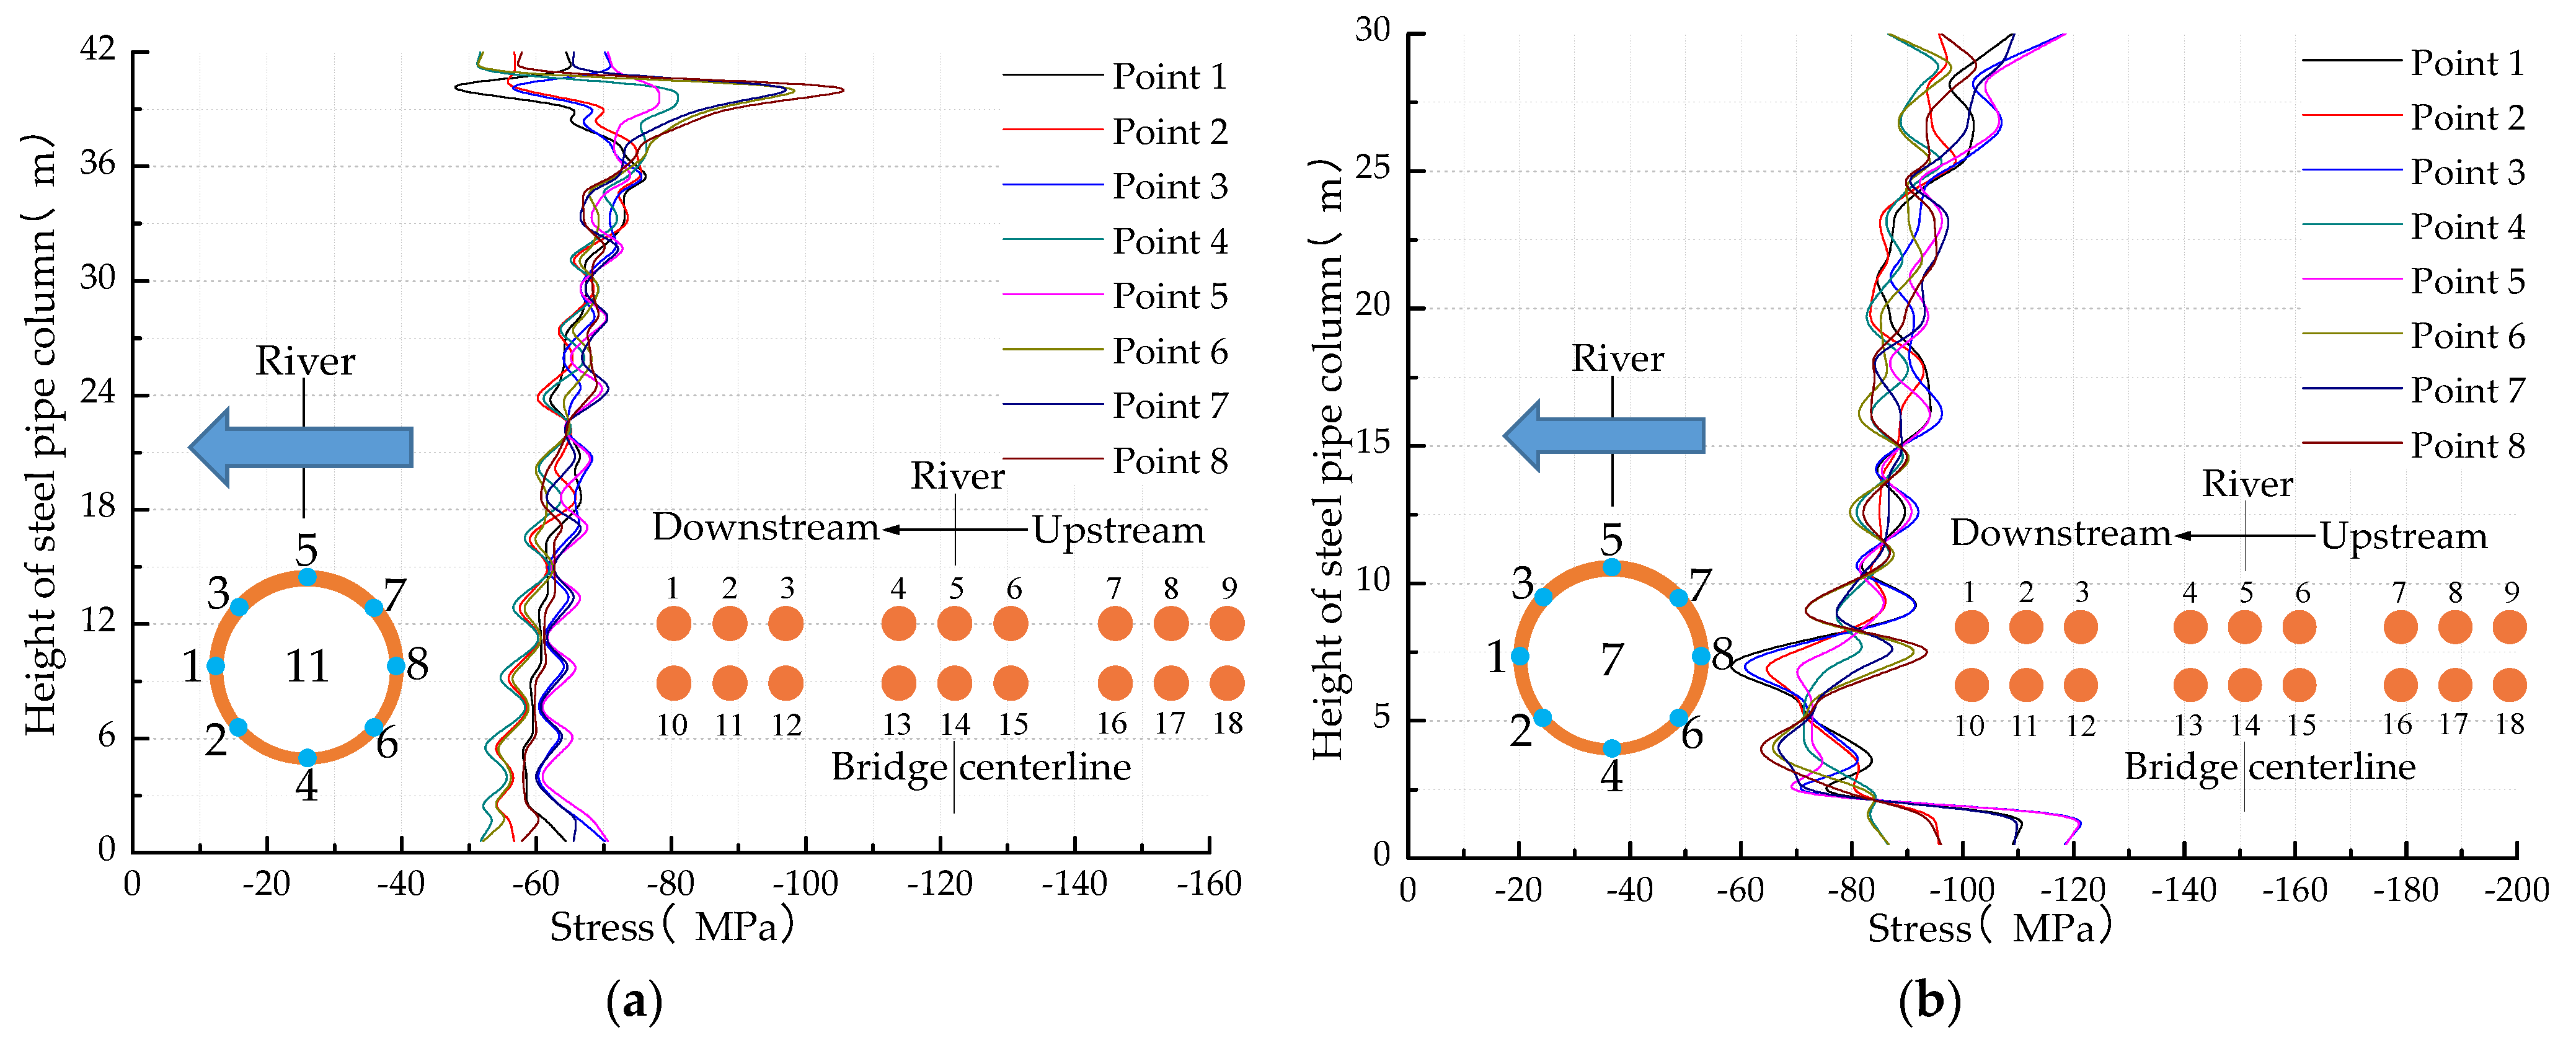
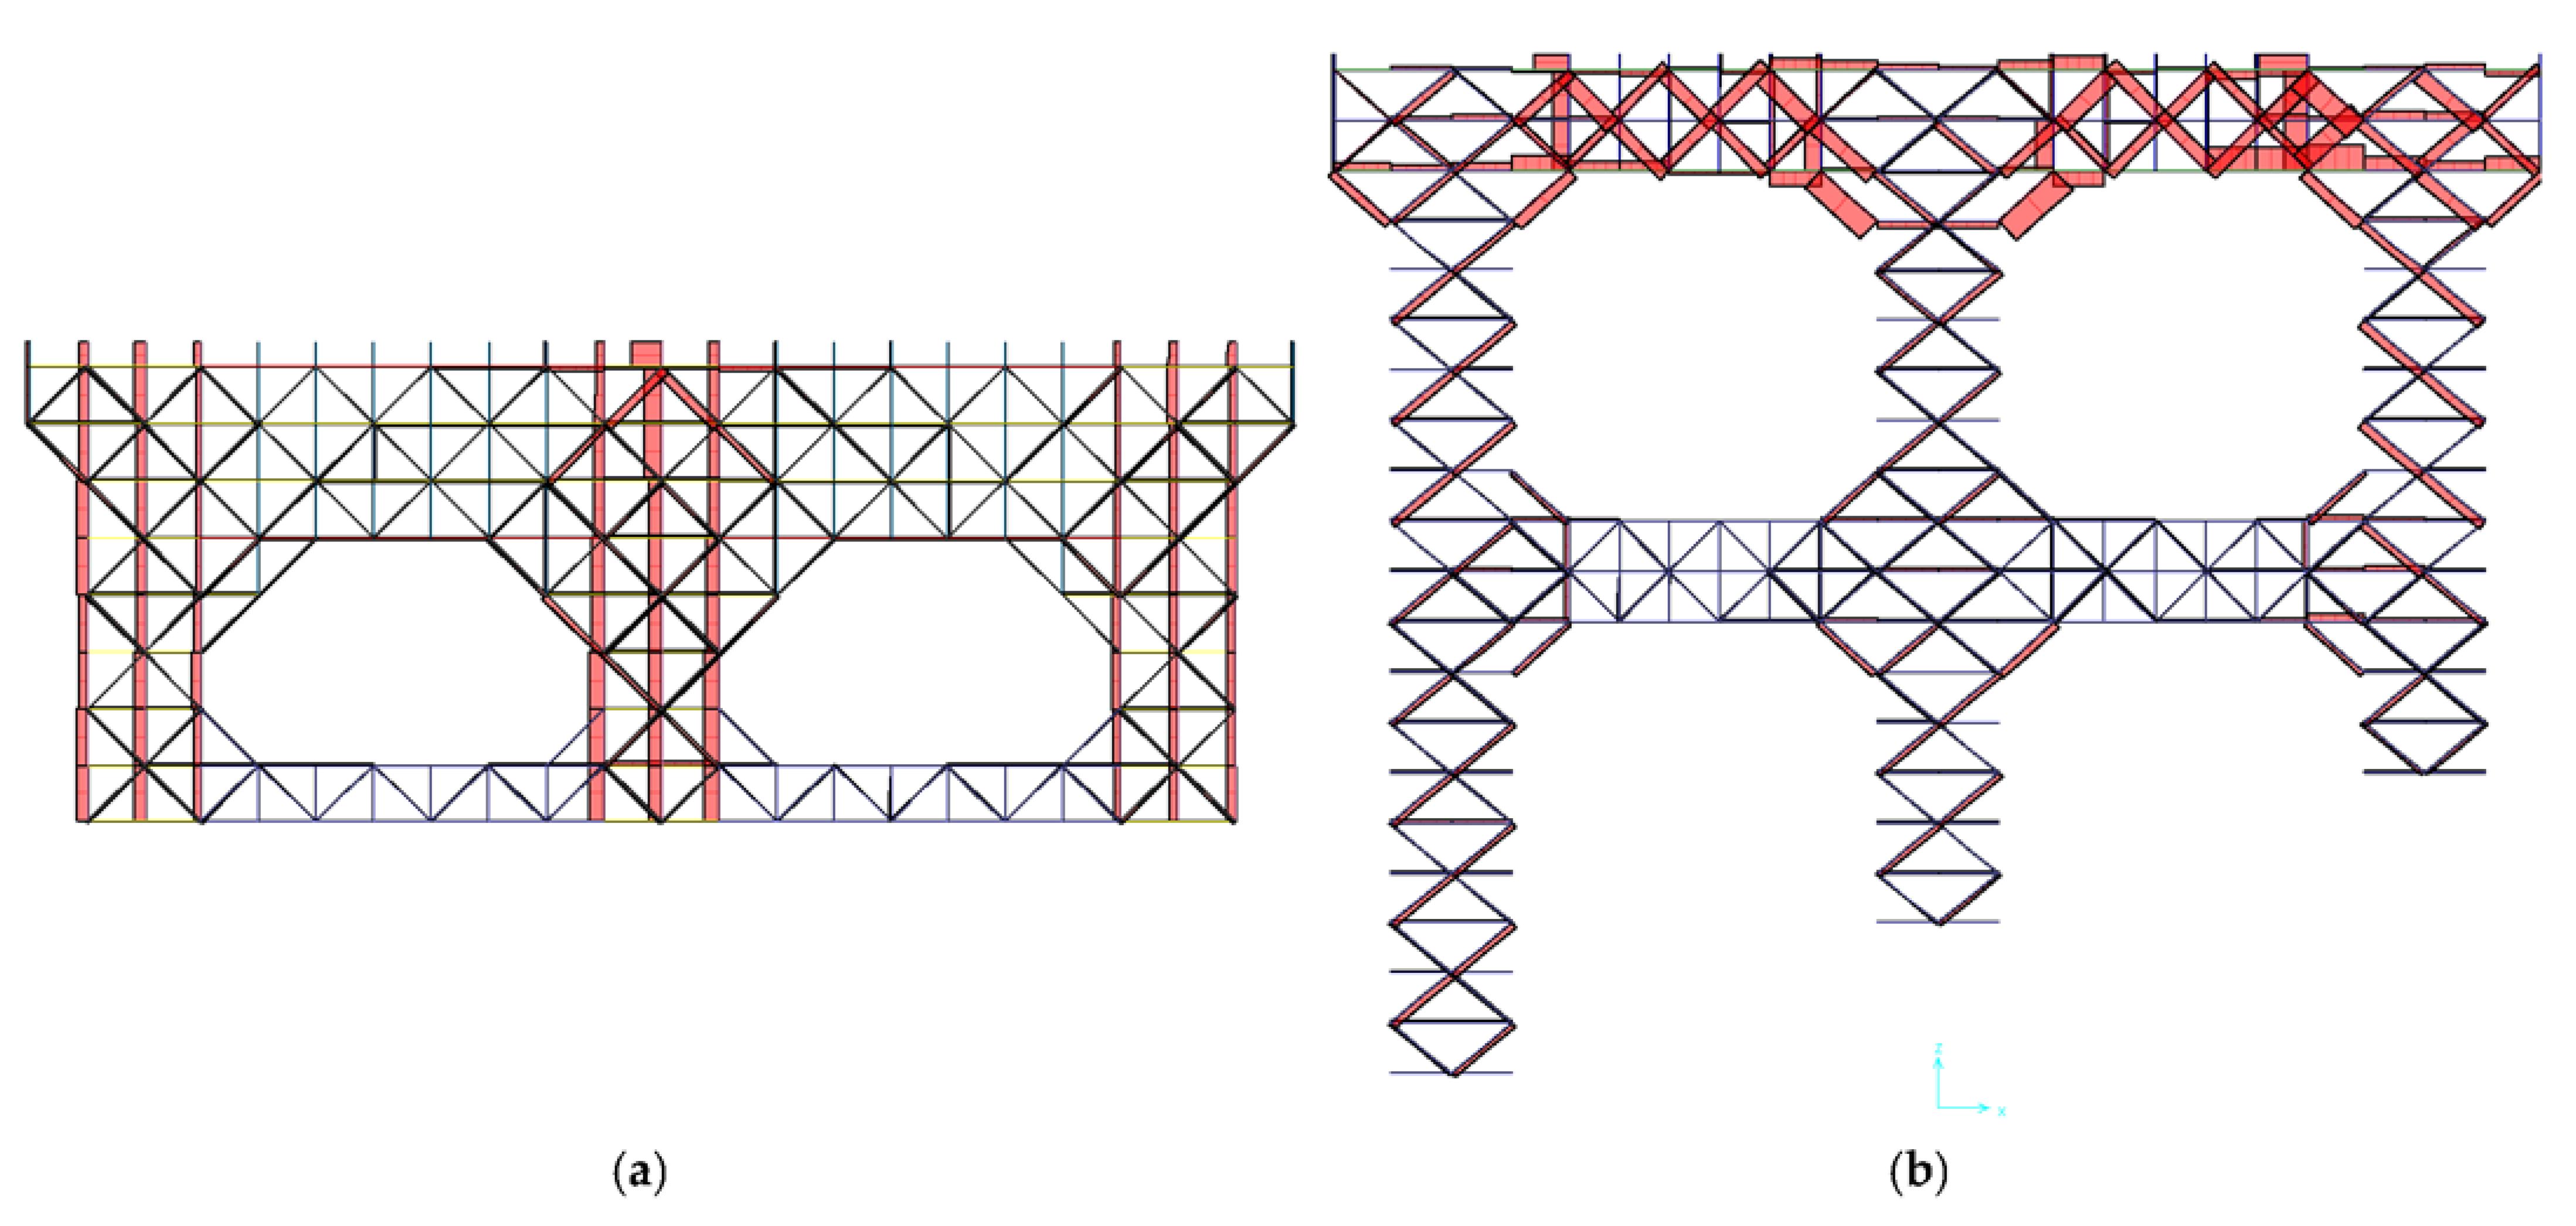
4.2. Load-Carrying Capacity

The tower is a structure under pressure and bending in the whole, and the load-carrying capacity of each member of the tower is worthy of attention. Due to the complex structural composition of the internal components of the integrated system of a cable tower and buckle tower, strength analysis of the main components is required. Figure 8 shows the main components of a tower. The tower is mainly made of universal rods that are connected by bolts. Figure 13 shows the maximum axial force diagram of the universal rods of a cable tower and the buckle tower located on the right bank. The maximum axial force of the universal rods of the cable tower occurs under the action of load condition 4, and the maximum axial force of the universal rods of the buckle tower occurs under the action of load condition 2. Figure 13a shows that the maximum axial force in the universal rods of the cable tower occurs in the vertical rods located at the left-center-right positions. The axial force of the universal rods in the middle of the cable tower is the largest, which is because under the action of load condition 4 the middle main cable bears the rated load and transfers the vertical pressure to the vertical universal rods in the center of the cable tower. Figure 13b shows that the universal rods with higher axial force in the buckle tower are diagonal rods, and the maximum axial force occurs in the diagonal rods at the top of the buckle tower. Due to the relatively dense arrangement of the diagonal rods between the steel pipe columns, the axial force of the universal rods located in this area is relatively small. The maximum axial forces of the tower’s universal rods are listed in Table 10.
As can be seen from Table 10, the axial force of all types of universal rods in the cable tower is greater than that of the buckle tower. The maximum axial force of the vertical rod of the cable tower is −2362.262 kN, and its allowable axial force is −2660 kN, which is not a high degree of safety redundancy. The difference between the axial force of the diagonal and horizontal rods of the cable tower is not large, and their safety redundancy is not high. Therefore, in the process of tower design, engineers should strive to find a balance between increasing the safety redundancy and reducing the self-weight of the structure. The axial force of all types of universal rods in a buckle tower is relatively small compared to a cable tower, and the safety redundancy is larger. This is because the vertical load transferred by the hinge seat distribution beam is mainly shared by the steel pipe column of the buckle tower, while the universal rod shares less. The maximum axial force of the universal rods of the buckle tower occurs mainly in the diagonal rods, where the maximum axial force is −523.017 kN.
The main components of the tower, in addition to the universal rods, include the cable tower distribution beam, see Figure 8b, the cable tower distribution beam connecting rods, see Figure 8b, the buckle tower distribution beam, see Figure 8e, the hinge seat distribution beam, see Figure 8f, and the steel pipe column, see Figure 8c. Table 11 shows the stresses in the main components of the tower. In the whole tower, the normal stresses of the cable tower distribution beam and steel pipe column are the largest, which are −119.372 MPa and −123.368 MPa, respectively, and they both meet the allowable normal stress. The shear stress of the main components is relatively small, and the shear stress of the buckle tower distribution beam is the largest, with the maximum value of 49.878 Mpa, which meets the allowable shear stress.
Steel pipe columns play a vital role in the load-carrying capacity of the tower. Due to the influence of the topography on the right bank, the position of the anchor cannot be moved back, and the angle between the main cable and the horizontal plane is 34.1°, which is relatively large, and the cable system produces a large horizontal thrust to the tower at the right bank, so the analysis is mainly aimed at the tower at the right bank. To study the load-carrying capacity of the steel pipe column of the tower at the right bank, the steel pipe columns need to be numbered. There are 18 steel pipe columns of the tower at the right bank, numbered as shown in Figure 14.
Figure 15 shows the maximum normal stress of the steel pipe columns of the tower at the right bank under each load condition. The maximum normal stresses in the steel pipe columns occur at the top and bottom of the columns. The maximum normal stress at the top of the column occurs under the action of load condition 5, and the maximum normal stress is −113.209 Mpa, which appears at the top of No. 11 steel pipe column. The maximum normal stress at the bottom of the column occurs under the action of load condition 1, and the maximum normal stress is −123.321 Mpa, which appears at the bottom of No. 7 steel tube column. Due to the larger cross-sectional diameter of the steel pipe column, the normal stress at different locations of the cross-section is not the same. Figure 16 shows the normal stress with height for steel pipe columns No. 11 and No. 7.
Eight feature points are marked on the steel pipe column cross-section, and the normal stresses at these eight feature points are studied. From Figure 16, it can be seen that the stresses at points 1 and 8 are basically equal, while the stresses at points 3, 5, and 7 show basically symmetric distribution with those at points 2, 4, and 6. The normal stress at points 3, 5, and 7 is slightly greater than that at points 2, 4, and 6, which is due to the bending of the steel column; the normal stress on the tensile side is reduced while that on the compressive side is increased. The sudden change of normal stress in the top and bottom positions of the steel pipe column is due to the constraining effect of the steel pipe column ends. The normal stress at the top of No. 11 steel pipe column is the smallest, and from the bottom to the top, the normal stress gradually increases with the increase in height, and the normal stress at the top of the column changes suddenly. The normal stress at the bottom of No. 7 steel pipe column is the largest and shows a sudden increase. From the bottom to the top, the stress gradually increases with the increase in height.

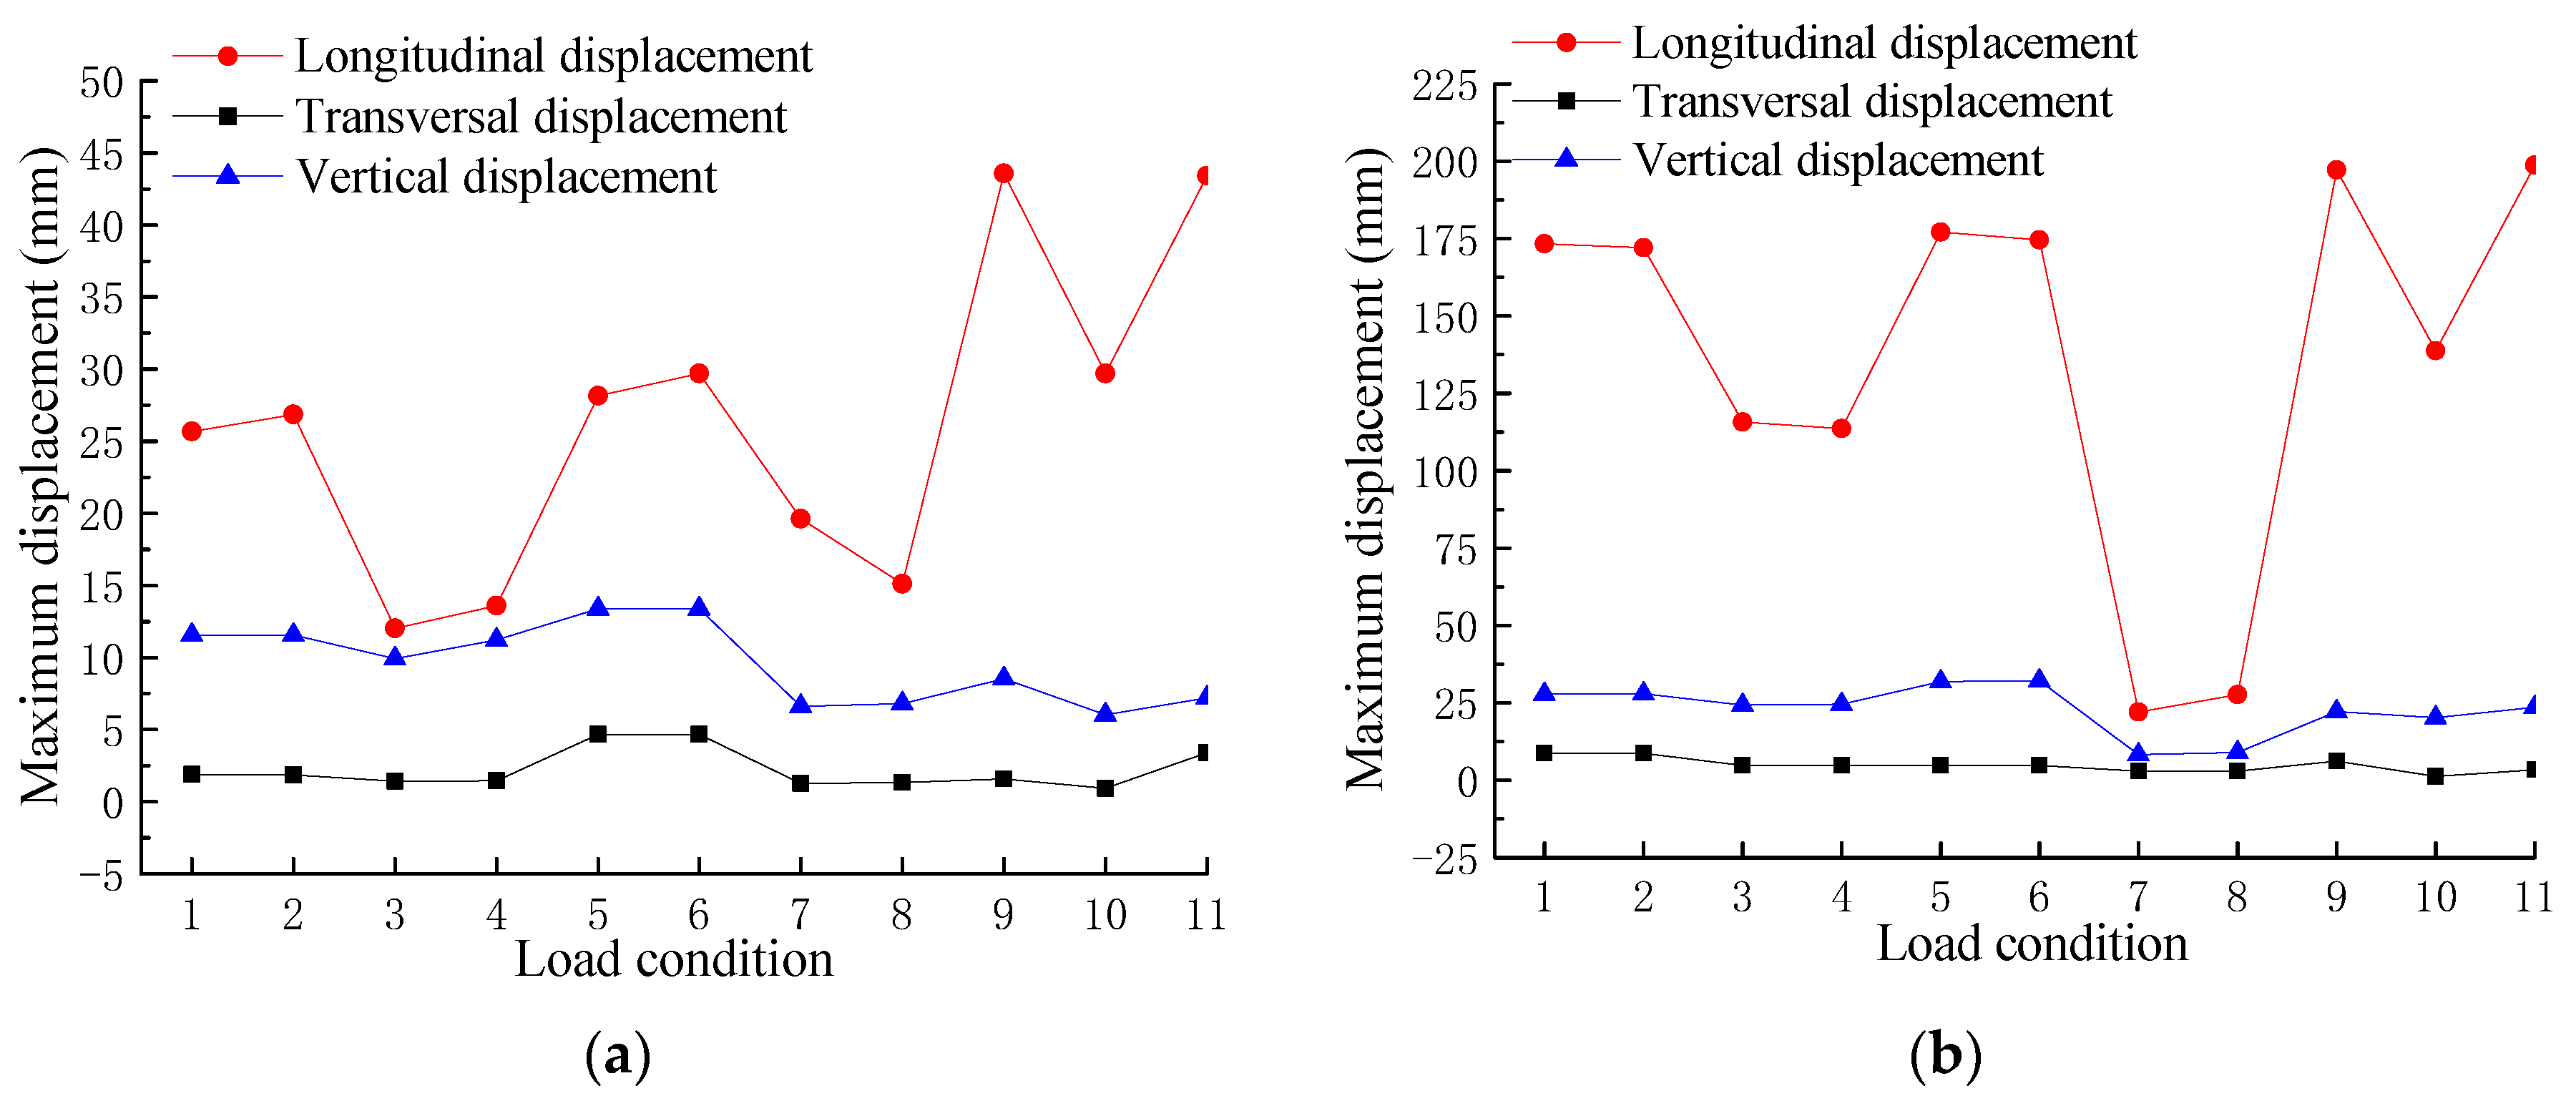
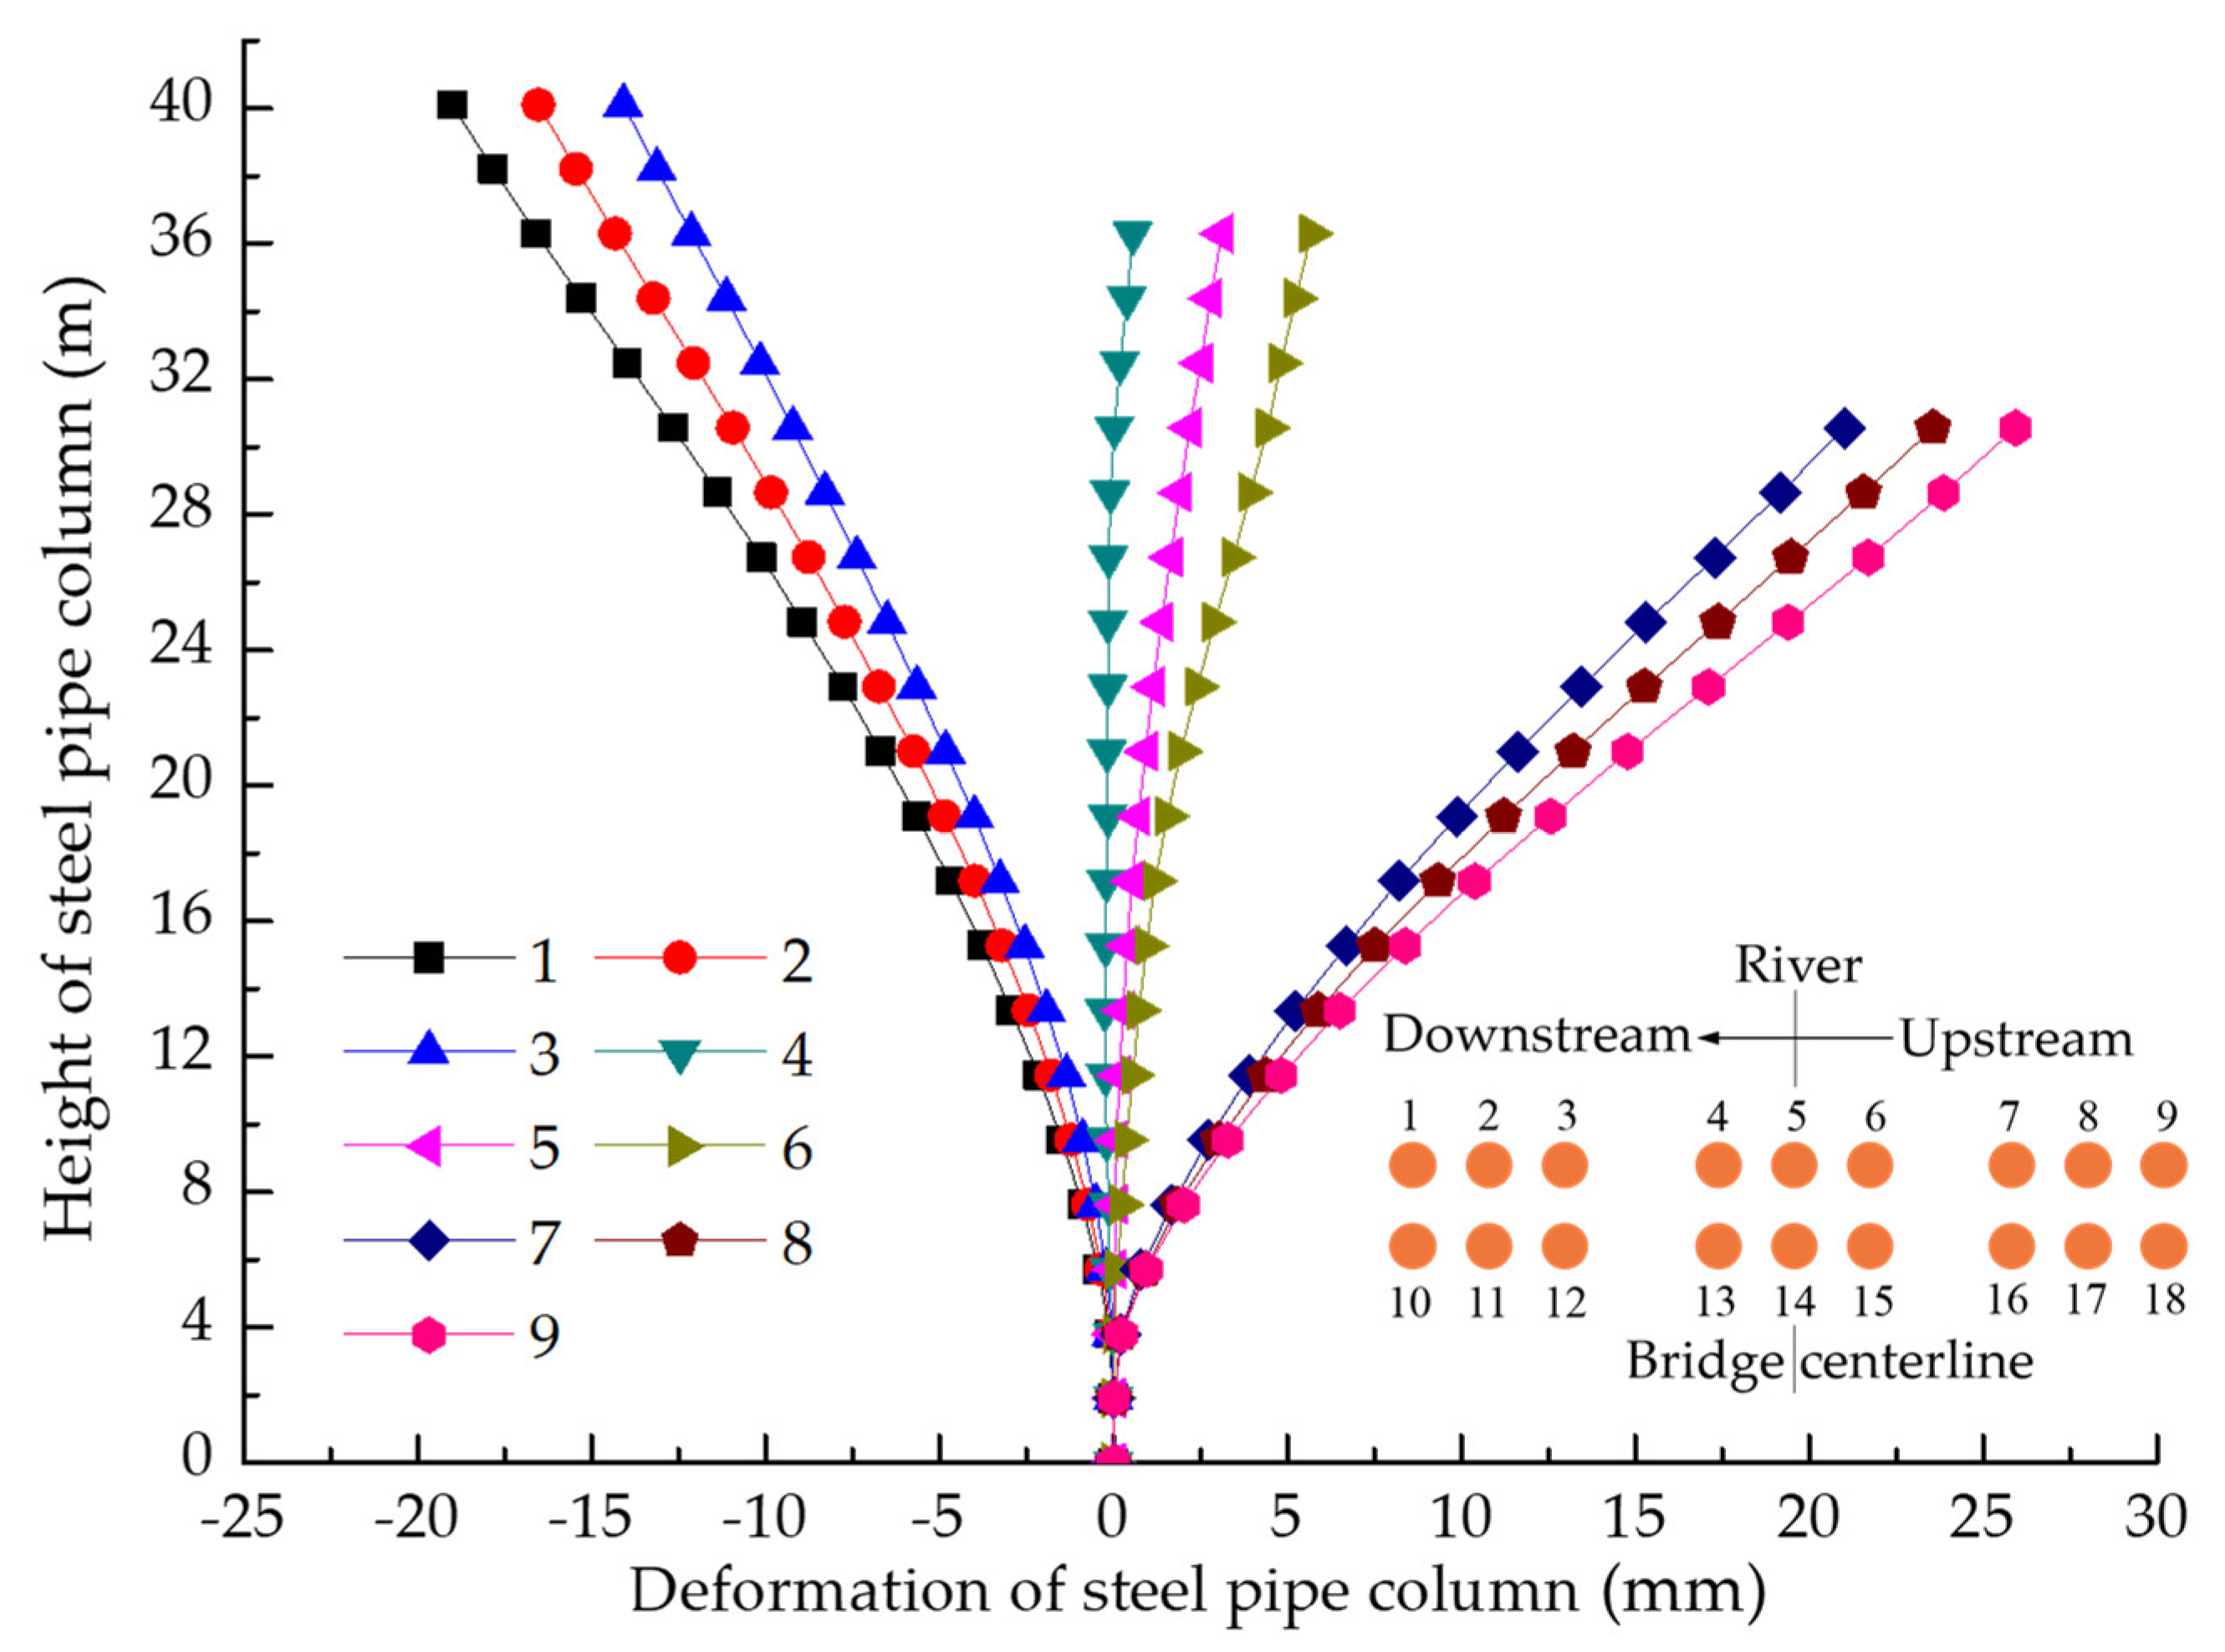
4.3. Deformation Analysis

Figure 17 shows the maximum displacement of the tower tops on the left bank and right bank for each load condition, respectively. As can be seen from Figure 17, the maximum transversal, longitudinal, and vertical displacement trends of the two towers on the left bank and the right bank are basically the same.
The transversal and vertical displacements of the towers on both banks are relatively smaller and the difference in values is not significant, but the maximum longitudinal displacement on the right bank is significantly larger than that on the left bank. The maximum longitudinal displacement of the tower at the right bank is about 150 mm more than that at the left bank because the angle between the main cable behind tower and the horizontal plane is 34.1°, which is relatively large, and the cable system generates a larger horizontal thrust to the tower. The maximum longitudinal displacement of both banks occurs under the action of load condition 9; when the initial tension of wind cable, buckle cable load, and wind load are taken into account, the maximum longitudinal displacement of towers on both banks will be reduced about 20 mm, which indicates that the reasonable setting of the buckle cable plays an essential role in reducing the deformation of the towers. The minimum longitudinal displacement of the two banks occurs under the action of load condition 8, when the cable system is in non-operating condition, even if there is a 10-level wind load, the maximum longitudinal displacement of the towers at both banks is relatively smaller than other conditions; the minimum value is 14 mm, which means the towers are safer under the action of a 10-level wind load.
The deformation of the steel pipe column of the buckle tower affects the stability of the whole buckle tower. In addition to analyzing the deformation of the tower top, it is crucial to analyze the deformation of the steel pipe column of the buckle tower. Since the maximum deformation of the tower top occurs in load conditions 9 and 11, which are symmetrical loading, only the deformation of the tower column under the action of load condition 9 needs to be analyzed. Since the deformation of the double rows of tower columns is almost the same, only the deformation of the steel pipe tower columns near the river side will be analyzed. Figure 18 shows the deformation of the steel pipe columns along the longitudinal direction of the bridge. Positive values of the deformation represent the steel pipe columns bending toward the river, and negative values represent the steel pipe columns bending away from the river.
The deformation of steel pipe column 5 is close to zero, and the deformation value of steel pipe columns 1–4 is positive, while the deformation value of steel pipe columns 6–9 is negative, which shows the opposite deformation trend, indicating that the tower is under the action of unbalance loading, and the tower has a torsional deformation, which leads to steel pipe columns 1–4 bending away from the river, and steel pipe columns 6–9 bending toward the river. The deformation of the steel pipe columns decreases in order from both sides to the middle of the tower. The deformation of steel pipe columns 1 and 9 on both sides of the tower is the largest; the top deformation of steel pipe column 1 is 20.1 mm, the top deformation of steel pipe column 9 is 25.9 mm, and the height of steel pipe column 9 is 17 m, and its deformation meets the engineering requirements.

5. Conclusions

In this study, to make the analysis of cable lifting construction of large-span arch bridges simple and efficient, a more accurate method of calculating tower loads was proposed and applied to the elaborated analysis of a tower. Meaningful conclusions were obtained as follows:
  • Based on the principle of deformation coordination and some assumptions, a method of calculating the loads acting on towers caused by the cable system when the arch bridge is constructed by a cable lifting method is proposed. The method has the characteristics of high calculation accuracy and easy operation, which is conducive to the rapid analysis of cable lifting construction by engineers.
  • A new Y-shaped arch bridge with a cable suspension construction was used as the research case to verify the correctness and accuracy of the calculation method by comparing the actual measured and calculated values of displacement at the top of the tower, and a detailed verification method and process were given.
  • The purpose of the calculation method is to calculate and analyze the mechanical properties of the towers in cable lifting construction, so the calculation method is specifically applied to the engineering case using the formula method and finite element method to analyze the overall stability, carrying capacity, and deformation of the tower, and give some suggestions about the design of arch bridge cable lifting.
  • The deformation of the tower will directly affect the linearity of the arch rib. To reduce the nonlinear effect of the wind cable sag and increase the restraining effect of the wind cable to the tower, the wind cable should be set with a certain initial tension. Use the means of pre-deflection of the installation displacement of the tower under the action of initial tension of wind cable, which can achieve the purpose of allowing the maximum forward and maximum backward displacement of the tower to tend to be close.
  • The tower is the main carrying structure, and the cable tower is prone to longitudinal overall overturning instability, and the steel pipe columns of the buckle tower are prone to twisting instability. Therefore, in the process of designing the tower, efforts should be made to find a balance between increasing the stability safety redundancy and reducing the self-weight of the structure.
  • The normal stress of the tower’s part of the pressurized rod or pressurized bending rod is larger, which is mainly diagonal rods for the universal rod, due to its length–width ratio being relatively large. During design, to ensure structural safety, the allowable stress should be increased 30% under the combined load of the temporary structure.
  • The steel pipe columns of towers are prone to compression bending instability, so their load-carrying capacity and deformation are analyzed in detail. The normal stresses on the top and bottom of the steel pipe columns will increase suddenly and should be given attention during design. The deformation analysis results of the tower show that the deformation trend on both sides of the tower is opposite and antisymmetric by the center line, which is consistent with the torsional instability results. Since the tower has relatively higher redundancy of compressive load-carrying capacity and smaller deformation safety reserve, therefore, the design can reduce the angle between the main cable behind the tower and the horizontal plane so as to reduce the horizontal thrust of the cable system to the tower, and then reduce the displacement of the tower by the thrust.
In this paper, the research on tower load analysis in arch bridge cable lifting construction has achieved stage achievements, and the calculation method can effectively analyze the actual engineering problems, but there are still some places that need to be considered and improved. In the future, the analysis method of mechanical properties of a tower needs to be studied, which can introduce the stability theory to discuss the formula calculation method of tower’s stability.

Author Contributions

Conceptualization, Q.H. and X.W.; methodology, Q.H.; software, Q.H.; validation, Q.H., X.W. and Y.Z.; formal analysis, Q.H. and X.W.; data curation, Q.H., Y.Z. and M.M.; writing—original draft preparation, Q.H.; writing—review and editing, Q.H. and X.W.; project administration, X.W.; funding acquisition, Y.Z. and M.M. All authors have read and agreed to the published version of the manuscript.

Funding

This research was funded by Shaanxi Provincial Department of Transport Scientific Research Project (No. 21–62 K).

Institutional Review Board Statement

Not applicable.

Informed Consent Statement

Not applicable.

Data Availability Statement

The analysis data used to support the findings of this study are included within the article.

Conflicts of Interest

The authors declare no conflict of interest.

References

  1. Chen, B.C.; Liu, J.P. Review of construction and technology development of arch bridges in the world. J. Traffic Transp. Eng. 2020, 20, 27–41. (In Chinese) [Google Scholar] [CrossRef]
  2. Zheng, J.L.; Wang, J.J. Concrete-Filled Steel Tube Arch Bridges in China. Engineering 2018, 4, 143–155. [Google Scholar] [CrossRef]
  3. Kang, C.J.; Schneider, S.; Wenner, M.; Marx, S. Development of design and construction of high-speed railway bridges in Germany. Eng. Struct. 2018, 163, 184–196. [Google Scholar] [CrossRef]
  4. Liu, J.P.; Chen, B.C.; Li, C.; Zhang, M.J.; Mou, T.M.; Tabatabai, H. Recent Application of and Research on Concrete Arch Bridges in China. Struct. Eng. Int. 2022, 5, 1–5. [Google Scholar] [CrossRef]
  5. Zheng, J.L.; Du, H.L.; Mu, T.M.; Liu, J.P.; Qin, D.Y.; Mei, G.X.; Tu, B. Innovations in Design, Construction, and Management of Pingnan Third Bridge-The Largest-Span Arch Bridge in the World. Struct. Eng. Int. 2022, 32, 134–141. [Google Scholar] [CrossRef]
  6. Li, Y.Z. Key Construction Techniques for Main Bridge of Yachi River Bridge on Chengdu-Guiyang Railway. Bridge Constr. 2020, 50, 16–21. (In Chinese) [Google Scholar] [CrossRef]
  7. Zhou, Z.X.; Fan, L.; Wang, S.R.; Liao, X.F. Chongqing Wansheng Zaodu Bridge-Steel Box-Concrete Composite Arch Bridge. Struct. Eng. Int. 2013, 23, 71–74. [Google Scholar] [CrossRef]
  8. Lei, J.H.; He, X.H. Green construction technology of a deck-arch railway bridge with concrete-filled steel-tube ribs in canyon area. J. Railw. Sci. Eng. 2020, 17, 3104–3110. (In Chinese) [Google Scholar] [CrossRef]
  9. Tang, M.C.; Ren, G.L. Design and Construction of the Main Spans of the Chongqing Caiyuanba Bridge, China. Struct. Eng. Int. 2010, 20, 296–298. [Google Scholar] [CrossRef]
  10. Wang, R. Key Construction Techniques for Long-Span Railway Arch Bridge in Mountainous Region of Plateau. Bridge Constr. 2020, 50, 105–110. (In Chinese) [Google Scholar] [CrossRef]
  11. Xie, K.Z.; Wang, H.W.; Guo, X.; Zhou, J.X. Study on the safety of the concrete pouring process for the main truss arch structure in a long-span concrete-filled steel tube arch bridge. Mech. Adv. Mater. Struct. 2021, 28, 731–740. [Google Scholar] [CrossRef]
  12. Huang, Q.; Wu, X.; Wei, H.; Chen, Q. Innovative Design of Novel Main and Secondary Arch Collaborative Y-Shaped Arch Bridge and Research on Shear Lag Effect of Its Unconventional Thin-Walled Steel Box Arch Ribs. Appl. Sci. 2022, 12, 8370. [Google Scholar] [CrossRef]
  13. Zhou, J.X. Research on Cable Force Calculation Method of Cable-Stayed Fastening Hanging Methods of Long Span Concrete Filled Steel Tube Arch Bridge. Master’s Thesis, Guangxi University, Nanning, China, June 2022. (In Chinese). [Google Scholar] [CrossRef]
  14. Pan, Q.; Yi, Z.P.; Zeng, Y.Y.; Yan, D.H.; Yang, S.J. Research on the Free Vibration of the Arch Bridge During Cable Hoisting or Rotation Erection Using an Analytical Modeling. J. Vib. Eng. Technol. 2022, 10, 1021–1035. [Google Scholar] [CrossRef]
  15. Han, Y.; Yang, Z.F.; Qin, D.Y.; Zheng, J. Key Technologies and Innovations in the Construction of Matan Hongshui River Super-Large Bridge. In Proceedings of the ARCH 2019 9th International Conference on Arch Bridges, Structural Integrity (STIN 11), Porto, Portugal, 2–4 October 2019; Springer: Cham, Switzerland, 2020; pp. 578–585. [Google Scholar] [CrossRef]
  16. Drag, L. Application of dynamic optimisation to the trajectory of a cable-suspended load. Nonlinear Dyn. 2016, 84, 1637–1653. [Google Scholar] [CrossRef]
  17. Bao, J.H.; Zhang, P.; Zhu, C.M. Dynamic Analysis of Flexible Hoisting Rope with Time-Varying Length. Int. Appl. Mech. 2015, 51, 710–720. [Google Scholar] [CrossRef]
  18. Chen, Z.H.; Sun, H.X.; Zhou, S.X.; Chen, Z.S.; Xue, X.Y.; Peng, Y.J. A Hybrid Algorithm for Cable Force Calculation of CFST Arch Brides During Construction. Int. J. Robot. Autom. 2022, 37, 192–199. [Google Scholar] [CrossRef]
  19. Xiong, S.H.; Chen, W.; Wang, F. Calculating Method of Arch Rib Installation Alignment of Large Span Cable Hoisting Arch Bridge. In Proceedings of the International Conference on Smart Transportation and City Engineering, Chongqing, China, 26–28 June October 2021; Spie: Bellingham, WA, USA, 2021. [Google Scholar] [CrossRef]
  20. Zhou, Q.; Zhou, J.T.; Ma, H.; Li, X.G.; Zhang, L. Improved algorithm of cable force for one-time cable tensioning on steel tube arch ribs with segmental hoisting. J. Traffic Transp. Eng. 2020, 20, 92–101. (In Chinese) [Google Scholar] [CrossRef]
  21. Wu, Y.H.; Liang, S.; Zhao, W.D. Design and Application of Bidirectional Moving Cable Crane of Tuoba Bridge. Bridge Constr. 2017, 47, 117–121. (In Chinese) [Google Scholar] [CrossRef]
  22. Deng, N.C.; Yu, M.S.; Yao, X.Y. Intelligent Active Correction Technology and Application of Tower Displacement in Arch Bridge Cable Lifting Construction. Appl. Sci. 2021, 11, 17. [Google Scholar] [CrossRef]
  23. Liu, Z.W.; Zhou, J.T.; Wu, Y.X.; You, X.; Qu, Y.H. Linear Control Method for Arch Ring of Oblique-Stayed Buckle Cantilever Pouring Reinforced Concrete Arch Bridge. Adv. Civ. Eng. 2021, 2021, 14. [Google Scholar] [CrossRef]
  24. Li, J.; Du, G.P.; Liang, Y.; He, Z.; Yan, X.; Feng, Y.L. Construction Analysis and Monitoring of the Vertical Rotation of Steel Tube Arch Ribs. Struct. Eng. Int. 2021, 31, 45–50. [Google Scholar] [CrossRef]
  25. Yu, X.M.; Chen, D.W. Innovative Method for the Construction of Cable-Stayed Bridges by Cable Crane. Struct. Eng. Int. 2018, 28, 498–505. [Google Scholar] [CrossRef]
  26. Wang, Y.; Wei, Y.H.; Hu, G.F. Construction Control Technology of Cable Hoisting System for the Arch Rib of Steel Box Bridge. In Proceedings of the 4th International Conference on Structures and Building Materials (ICSBM), Guangzhou, China, 15–16 March 2014; Trans Tech Publications Ltd.: Wollerau, Switzerland, 2014. [Google Scholar] [CrossRef]
  27. Yu, X.M.; Chen, D.W.; Bai, Z.Z. A New Method for Analysis of Sliding Cable Structures in Bridge Engineering. KSCE J. Civ. Eng. 2018, 22, 4483–4489. [Google Scholar] [CrossRef]
  28. Zhang, W.Y.; Yu, S.L.; Zhang, X.W.; Yan, J.S.; Chen, X.X. Construction Process Simulation and In Situ Monitoring of Dendritic Structure on Nanjing Niushou Mountain. Shock Vib. 2019, 2019, 13. [Google Scholar] [CrossRef]
  29. Li, Y.Z.; Li, H.H.; Xu, B.A. Jinsha River Bridge, China: The world’s first double-deck road and high-speed railway arch bridge. Proc. Inst. Civ. Eng.-Bridge Eng. 2020, 173, 179–189. [Google Scholar] [CrossRef]
  30. Zhao, C.Y.; Yang, W.S.; Li, C.X.; Tan, L.X. Study on static analysis and working performance of the main cable system in the cable-hoisting system. J. Guangxi Univ. 2010, 35, 615–620. (In Chinese) [Google Scholar] [CrossRef]
  31. Li, P. Discussion of Medium-Bearing Space Y-shaped Steel Box Arch Bridge Cable Suspension Main Cable Load-Bearing Safety Analysis. Sichuan Cement. 2021, 4, 335–337. (In Chinese) [Google Scholar]
  32. Huang, Q.; Wu, X.G.; Hu, K.J.; Xu, N. Design of Cable Suspension System for Spatial Y-shaped Steel Box Arch Bridge in V-shaped Canyon Area. In Proceedings of the World Forum on Transport Engineering and Technology (WTC2021), Xi’an, China, 16–18 June 2021. (In Chinese). [Google Scholar] [CrossRef]
  33. JTG D60-2015; Industry Standard of the People’s Republic of China; General Specifications for Design of Highway Bridges and Culverts. Industry Standard of the People’s Republic of China: Beijing, China, 2015.
Figure 1. Cable lifting construction of large-span arch bridges: (a) Pingnan Third Bridge; (b) Jinghe Bridge.
Applsci 12 09373 g001
Figure 2. Simplified model of cable lifting system.
Applsci 12 09373 g002
Figure 3. Schematic diagram for calculating the forces acting on the towers from the main cable: (a) empty cable; (b) cable carrying load.
Applsci 12 09373 g003
Figure 4. Calculation diagram of the acting force of lifting cable on tower.
Applsci 12 09373 g004
Figure 5. Schematic diagram of calculating the forces acting on a tower from a towing cable: (a) left bank; (b) right bank.
Applsci 12 09373 g005aApplsci 12 09373 g005b
Figure 6. Overall layout of cable lifting system.
Applsci 12 09373 g006
Figure 7. Overall numerical calculation model.
Applsci 12 09373 g007
Figure 8. Numerical calculation model of tower: (a) tower; (b) distribution beam at top of cable tower; (c) steel pipe column and universal rods; (d) universal rods; (e) distribution beam at top of buckle tower; (f) hinge seat distribution beam.
Applsci 12 09373 g008
Figure 9. Tower and measurement point layouts for engineering case: (a) left bank; (b) right bank.
Applsci 12 09373 g009
Figure 10. Deformation of tower at right bank (unit: mm): (a) Load 1; (b) Load 2; (c) Load 3.
Applsci 12 09373 g010
Figure 11. Buckle cables acting on the tower.
Applsci 12 09373 g011
Figure 12. First six orders of buckling mode characteristics of towers: (a) buckling mode 1; (b) buckling mode 2; (c) buckling mode 3; (d) buckling mode 4; (e) buckling mode 5; and (f) buckling mode 6.
Applsci 12 09373 g012
Figure 13. Maximum axial force diagram of the universal rods of the tower located on the right bank: (a) cable tower; (b) buckle tower.
Applsci 12 09373 g013
Figure 14. Location and number of steel pipe columns of the tower at the right bank.
Applsci 12 09373 g014
Figure 15. Normal stress of steel pipe column under each load condition.
Applsci 12 09373 g015
Figure 16. The changing tendency of normal stress with height for steel pipe columns: (a) No. 11 steel pipe column; (b) No. 7 steel pipe column.
Applsci 12 09373 g016
Figure 17. Maximum displacement of the tower top under each load condition: (a) left bank; (b) right bank.
Applsci 12 09373 g017
Figure 18. Deformation of the steel pipe columns along the longitudinal direction of the bridge.
Applsci 12 09373 g018
Table 1. Parameters of the cable system when carrying to mid-span.
Q
(kN/m)
Δ H
(m)
L
(m)
L 1
(m)
L 2
(m)
L 3
(m)
L 4
(m)
L 5
(m)
α 1
(°)
α 1
(°)
f 0
(m)
1.3462.5430207.515686536023.034.120.5
f 1
(m)
f 2
(m)
F
(kN)
β
(°)
η
θ 1
(°)
θ 2
(°)
P
(ton)
μ
q
(kN/m)
f q
(m)
18.921.371.70.330.9822.634.367.50.0120.19624
Note: The meanings of parameters have been given in Section 2.
Table 2. Physical and mechanical property parameters of steel.
BrandDensity (kg/m3)Elastic Modulus (MPa)Poisson’s RatioYield Strength
(MPa)
Ultimate Strength (MPa)
Q2357850206,000.000.30235370
Q3457850205,000.000.30345470
Table 3. Initial tension and initial strain of wind cable on tower.
Bank SiteDesignation of Wind CableSpecification of Steel CableAi (mm2)T0i (kN) ε 0 i
LeftInter-span wind cable for cable tower1φ56 mm Fiber-core steel cable
(6 × 37S + FC 1670 Mpa)
1233.8400.0004.288 × 10−3
Wind cable behind cable tower6φ32 mm Steel-core steel cable
(6 × 37S + IWR 1670 Mpa)
2807.2433.2171.470 × 10−3
Cross-wind cable for cable tower6φ22 mm Fiber-core steel cable
(6 × 37S + FC 1670 Mpa)
1142.5391.6224.534 × 10−3
Wind cable before sling tower1142.5416.9094.827 × 10−3
Wind cable behind sling tower1142.5301.4333.490 × 10−3
Cross-wind cable for sling tower1142.5346.4104.011 × 10−3
RightInter-span wind cable for cable tower1φ56 mm Fiber-core steel cable
(6 × 37S + FC 1670 Mpa)
1233.8400.0004.288 × 10−3
Wind cable behind cable tower6φ32 mm Steel-core steel cable
(6 × 37S + IWR 1670 Mpa)
2807.2484.2041.643 × 10−3
Cross-wind cable for cable tower6φ22 mm Fiber-core steel cable
(6 × 37S + FC 1670 Mpa)
1142.5391.6224.534 × 10−3
Wind cable before sling tower1142.5422.7184.894 × 10−3
Wind cable behind sling tower1142.5318.0193.682 × 10−3
Cross-wind cable for sling tower1142.5346.4104.011 × 10−3
Note: The φ in the table represents the diameter of a steel cable section.
Table 4. The forces acting on the tower tops when the main cable transports a rated load to the middle of the span (unit: kN).
Tower SiteLoad CategoryMain CableTowing CableLifting CableSum
Empty CableLoaded Cable
Left bank H 157.294462.2587.3896.628633.569
V 1396.3524037.22555.91973.2445562.74
Right bank H 398.0771163.23443.800 1605.111
V 1880.2045445.233185.026 7510.463
Table 5. Maximum measured displacement at tower top (unit: mm).
Load ConditionTower SiteLongitudinal
Displacement
Transversal
Displacement
Vertical
Displacement
1Left bank−41.207.7
Right bank192.1−5.7−20.5
2Left bank−28.40−7.0
Right bank134.40−18.3
3Left bank−43.10−8.9
Right bank194.22.5−22.1
Note: Negative values of longitudinal displacement indicate displacement toward the right bank, and positive values indicate displacement toward the left bank. Negative values of transversal displacement indicate displacement toward the downstream; positive values indicate displacement toward the upstream. A negative value of vertical displacement indicates that the displacement is downward.
Table 6. Maximum numerical displacements at tower top (unit: mm).
Load ConditionTower SiteLongitudinal
Displacement
Transversal
Displacement
Vertical
Displacement
1Left bank−43.60.4−8.8
Right bank197.1−6.2−22.8
2Left bank−29.7−0.5−7.6
Right bank138.7−1.2−20.0
3Left bank−45.3−1.4−9.7
Right bank199.43.4−24.2
Note: Negative values of longitudinal displacement indicate displacement toward the right bank, and positive values indicate displacement toward the left bank. Negative values of transversal displacement indicate displacement toward the downstream; positive values indicate displacement toward the upstream. A negative value of vertical displacement indicates that the displacement is downward.
Table 7. Maximum displacement error at tower top (unit: mm).
Load ConditionTower SiteLongitudinal
Displacement
Transversal
Displacement
Vertical
Displacement
1Left bank2.40.41.1
Right bank5.00.52.3
2Left bank1.30.50.6
Right bank4.31.21.7
3Left bank2.21.40.8
Right bank5.20.92.1
Table 8. Load conditions and load combinations.
Load ConditionLoad CombinationLoad ConditionLoad CombinationLoad ConditionLoad Combination
1(1) + (2) + (3) + (6)5(1) + (2) + (5) + (6)9(3)
2(1) + (2) + (3) + (8)6(1) + (2) + (5) + (8)10(4)
3(1) + (2) + (4) + (6)7(1) + (2) + (7)11(5)
4(1) + (2) + (4) + (8)8(1) + (2) + (9)
Table 9. First-order buckling factor of the towers for each load condition.
Load ConditionBuckling FactorLoad ConditionBuckling Factor
18.0157.52
28.0267.53
38.15722.91
48.16823.13
Table 10. Axial force of universal rods of tower (unit: kN).
Name of ComponentMaximum
Axial Force
Allowable Axial ForceName of ComponentMaximum
Axial Force
Allowable Axial Force
Cable tower vertical rod−2362.262−2660Buckle tower vertical rod−523.017−1330
Cable tower diagonal rod−693.515±756Buckle tower diagonal rod−498.708±756
Cable tower horizontal rod−570.826±852Buckle tower horizontal rod−246.033±426
Note: negative values in the table represent pressure and positive values represent tension.
Table 11. Stress of main components of tower (unit: MPa).
Name of ComponentMaximum Normal StressAllowable Normal StressMaximum Shear StressAllowable Shear Stress
Cable tower distribution beam−119.372±21019.243120
Cable tower distribution beam connecting rod68.064±145
Buckle tower distribution beam−78.310±14549.87885
Hinged seat distribution beam136.212±21048.221120
Steel pipe column−123.368±210
Note: negative values in the table represent pressure and positive values represent tension.
Publisher’s Note: MDPI stays neutral with regard to jurisdictional claims in published maps and institutional affiliations.

