Article

Comparison of Methods to Identify and Monitor Mold Damages in Buildings

by
Pedro Maria Martin-Sanchez
1,2,*,
Maria Nunez
3,
Eva Lena Fjeld Estensmo
1,3,
Inger Skrede
1 and
Håvard Kauserud
1
1
Department of Biosciences, University of Oslo, P.O. Box 1066 Blindern, 0316 Oslo, Norway
2
Instituto de Recursos Naturales y Agrobiologia (IRNAS-CSIC), 41012 Seville, Spain
3
Mycoteam AS, P.O. Box 5 Blindern, 0313 Oslo, Norway
*
Author to whom correspondence should be addressed.
Appl. Sci. 2022, 12(18), 9372; https://doi.org/10.3390/app12189372
Submission received: 27 June 2022 / Revised: 14 September 2022 / Accepted: 15 September 2022 / Published: 19 September 2022
(This article belongs to the Special Issue Fungi Associated with Indoor Environments and Materials)

Abstract

:

Featured Application

This comparative work provides relevant insights about the potential of different methods for the assessment of mold damages in buildings, with a special focus on the DNA analyses of dust samples.

Abstract

Molds thrive in indoor environments, challenging the stability of building materials and occupants’ health. Diverse sampling and analytical techniques can be applied in the microbiology of buildings, with specific benefits and drawbacks. We evaluated the use of two methods, the microscopy of visible mold growth (hereinafter “mold” samples) (tape lifts) and the DNA metabarcoding of mold and dust samples (swabs), for mapping mold-damage indicator fungi in residential buildings in Oslo. Overall, both methods provided consistent results for the mold samples, where nearly 80% of the microscopy-identified taxa were confirmed by DNA analyses. Aspergillus was the most abundant genus colonizing all materials, while some taxa were associated with certain substrates: Acremonium with gypsum board, Chaetomium with chipboard, Stachybotrys with gypsum board and wood, and Trichoderma with wood. Based on the DNA data, the community composition was clearly different between the mold and the dust, with a much higher alpha diversity in the dust. Most genera identified in the mold were also detected with a low abundance in the dust from the same apartments. Their spatial distribution indicated some local spread from the mold growth to other areas, but there was no clear correlation between the relative abundances and the distance to the damages. To study mold damages, different microbiological analyses (microscopy, cultivation, DNA, and chemistry) should be combined with a thorough inspection of buildings. The interpretation of such datasets requires the collaboration of skilled mycologists and building consultants.

1. Introduction

Increased humidity in building materials leads to fungal growth in both visible and hidden structures. In addition to the deterioration of the colonized materials, mold growth has been associated with adverse effects on human health [1,2,3]. Previous studies have correlated certain fungal taxa to different building materials [4,5,6,7,8,9], as well as to specific building structures and moisture problems (e.g., condensation in thermal bridges and water leakage) [10,11,12]. This knowledge is crucial to select suitable moisture-damage indicator species that are able to grow on building materials. They should be discriminated from occasional species, unable to grow in the indoor environment, as is the case for plant and/or animal parasites, or mycorrhizal fungi [12,13]. Using indicator species during the monitoring of buildings allows the efficient detection of moisture problems, relevant for both buildings and occupants’ health. In addition, such important information is also necessary to investigate and promote the use of materials less prone to microbial colonization.
Various methods have been used in the microbiology of the built environment, i.e., microscopy, particle counting, culturing, and DNA and chemical analyses [6,14,15,16]. The sampling of residential buildings is carried out either from the air, dust, building materials and surfaces, or directly from microbial growth when evident [17]. The selection of methods, including the sampling strategy and analytical techniques, implies inevitable biases for all studies. The main limitation of culture-based methods is that the cultivable fraction of the microbiota is minor. In particular, Wu et al. [18] estimated that cultivable fungi are only about 11% (ratio uncultivable/cultivable = 8.8) of the total fungi present in a given environmental sample. In addition, few researchers are familiar with the taxonomy and ecology of the fungi occurring in buildings. Thus, a gradual shift toward DNA-based methods has taken place in the last decades. Among them, the real-time quantitative PCR (qPCR) has been widely used in research to detect and quantify many fungal species, genera, or higher taxa in indoor dust [19]. DNA metabarcoding, based on the high-throughput sequencing of an amplified DNA marker, has become a key tool for surveying environmental microbial communities in the last decades. In several studies, the mycobiota of the built environment have been surveyed through DNA metabarcoding analyses of the internal transcribed spacer (ITS) of the nuclear rRNA operon [20,21,22,23]. However, DNA analyses are not able to distinguish between live and dead fungi or identify specifically those that are capable of growing on building materials. In this regard, the direct microscopy of mold growth, obtained by tape lifts, may be a simple and quick alternative to identify biologically active indicator fungi [12]. Unfortunately, microscopy examinations have a relatively low sensitivity, limited to the small surface area sampled, and require the presence of identifiable structures and highly skilled fungal taxonomists. Thus, certain groups, such as yeasts and sterile mycelia, are generally underestimated by microscopy.
Despite the high potential of DNA techniques and their increased application in research, their practical use by building practitioners/consultants is still limited. In addition to the required skills in DNA analyses, their scarce use may be in part due to the lack of taxonomic and ecological knowledge about the vast amount of operational taxonomic units (OTUs) that can be detected in the built environment. In the last years, some building consultant companies have expanded their services, using qPCR assays on dust samples as a monitoring tool-kit for the early detection of moisture/mold problems. Nevertheless, there is still little scientific evidence demonstrating the validity of qPCR approaches to detect hidden mold damages from dust samples, as it may be difficult to distinguish the moisture indicator fungi from the baseline fungi [13]. Only a few HTS studies have coupled the analysis of mold-damaged materials and dust in the same buildings [24,25,26]; thus, this combined approach should be further explored in order to detect indicator taxa, as stated by Jayaprakash et al. [27].
Considering the mentioned knowledge gaps, the overarching aim of this study was to evaluate the use of two methodological approaches, the direct microscopy of visible mold growth and the DNA metabarcoding of both mold and dust samples, for identifying and monitoring the fungi associated with mold-damaged residential buildings in Oslo, Norway. Furthermore, by analyzing dust samples from different rooms, this study assessed the potential of DNA metabarcoding for detecting the spreading of indicator fungi from the colonized materials (possible sources) to other building areas.

2. Materials and Methods
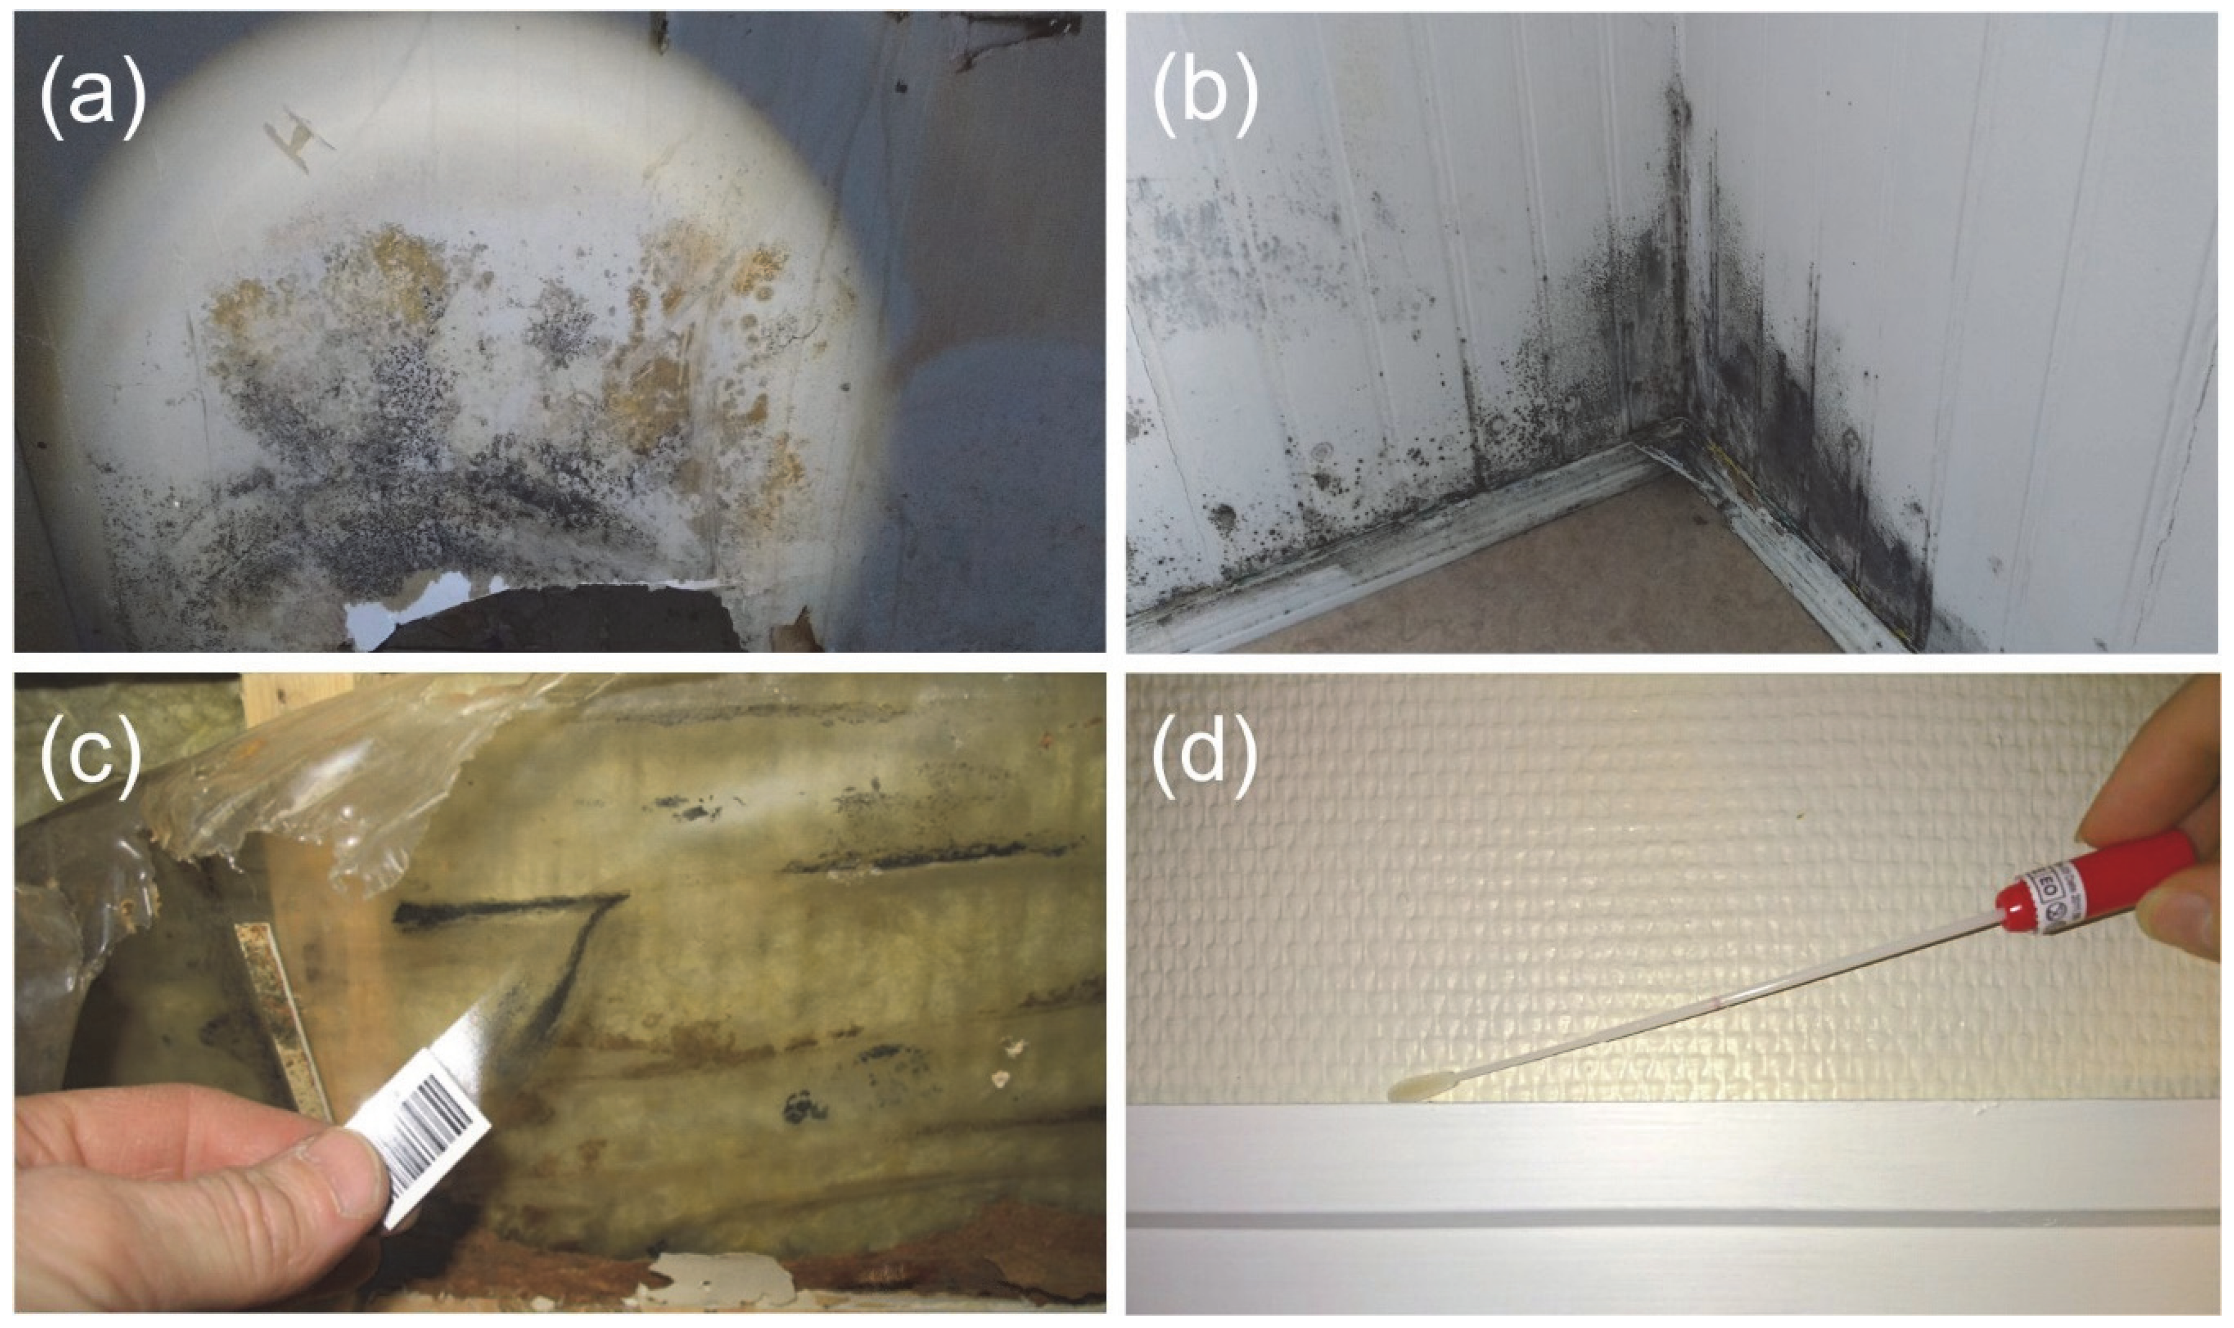
2.1. Sampling

A total of 32 apartments with moisture problems, located in 23 buildings in Oslo (construction years ranged from 1861 to 2022; mean = 1952), were studied from June 2018 to February 2019. During their inspections, 48 surface samples were collected from mold-damaged materials (hereinafter “mold” samples), including gypsum board (19), chipboard (4), wood (12), medium-density fiberboard—MDF (3), building paper (3), wallpaper (4), concrete (1), paint (1), and plastic (1) (Figure 1). Mold samples were taken directly from the discolored substrates using both 12 cm long adhesive tapes (Mycotape, Mycoteam AS) and sterile swabs (FLOQSwabs in tubes, Copan Italia spa; whose flocked tip is coated with perpendicularly sprayed on Nylon® fibers) for microcopy and DNA metabarcoding, respectively. To evaluate the dispersion of the material-colonizing fungi, 42 dust samples were swabbed from upper doorframes at two different locations: damaged rooms (same as mold samples, in 25 of 32 apartments) and central rooms (more distant to mold growth, in 11 of 32 apartments). Dust samples were exclusively analyzed by DNA metabarcoding.

2.2. Morphological Identification of Material-Colonizing Fungi

As described in a previous study [12], tape lifts taken on mold-contaminated building materials were cut in the laboratory into 6 cm long pieces and observed under the microscope (Olympus BX45) at 400–1000 magnification. One drop of lactophenol blue solution (Merck) was added to a microscope slide, and the tape was used as cover. Sporulating structures of each taxon indicating in situ growth were identified following Gams [28] and de Hoog et al. [29].

2.3. Fungal DNA Metabarcoding

The fungal communities present in mold and dust samples were characterized following the DNA metabarcoding workflow described by Martin-Sanchez et al. [22]. In brief, this protocol included six key steps: (i) DNA extraction from the swabs using chloroform and the EZNA Soil DNA Kit (Omega Bio-tek); (ii) PCR amplification of the ITS2 region using the primers gITS7 [30] and ITS4 [31], both primers including sample specific tags at the 5′-end; (iii) DNA purification and normalization using a SequalPrep Normalization Plate Kit (Applied Biosystems); (iv) pooling of the 96 samples, including: 48 mold samples, 42 dust samples—3 of them duplicated as technical replicates, an extraction blank, a PCR negative, and a mock community; (v) additional purification using Agencourt AMPure XP magnetic beads (Beckman Coulter); and (vi) library preparation and 250 bp paired-end MiSeq v3 sequencing (Illumina) carried out at Fasteris SA, Plan-les-Ouates (Switzerland).
The resulting raw sequencing data contained 12,234,449 paired reads and are available at the European Nucleotide Archive (ENA), EMBL-EBI, under accession no. PRJEB50946 (https://www.ebi.ac.uk/ena/browser/view/PRJEB50946, accessed on 14 September 2022).

2.4. Bioinformatics Analyses

The sequence data were processed using the bioinformatics pipeline described in Martin-Sanchez et al. [22], which consists of seven steps: (i) quality checking using fastqc; (ii) demultiplexing of samples using cutadapt; (iii) quality filtering, trimming, dereplication, denoising, merging in contigs, removal of chimeras, and creating the amplicon sequence variants (ASV) table, all of them by using dada2; (iv) clustering of ASVs into operational taxonomic units (OTUs) at 98% similarity using vsearch; (v) curation of OTU table by lulu; and (vi) taxonomic assignment of OTUs against the UNITE database.
The included control samples revealed that: (1) there was no sequence in the PCR negative; (2) four OTUs were detected in the extraction blank, with high numbers of sequences, but almost absent in the study samples, and therefore, these OTUs were removed from the dataset; and (3) the sequences representing the species in the mock community were exclusively detected in the mock sample, confirming that tag switching was negligible in this study, as previously reported when we used the same approach, including library preparation and sequencing [22]. In addition, the technical replicates showed similar community profiles, confirming the reproducibility of the DNA metabarcoding workflow. Control samples and the technical replicates with lower number of reads were removed.
In the final dataset, only OTUs including more than 10 reads, and with at least 70% identity in the taxonomic assignment to a member of the kingdom Fungi, were included. In addition to the automatic taxonomic annotation, the taxonomic affiliation of the top-200 most abundant OTUs with uncertain taxonomic affiliation were controlled by manually Blast search against both UNITE and the International Nucleotide Sequence Database Collaboration (INSDC) databases.

2.5. Statistical Analyses

Statistical analyses were conducted in R v 3.5.2 [32] through RStudio v 2021.09.0. Tidyverse v 1.2.1 [33] and the vegan v 2.5-6 [34] R packages were used for data manipulation and plotting, and ecological analyses, respectively. Initially, the OTU table was rarefied (×10 times resampling with the median value taken per OTU) to 7,978 reads per sample using the function rrarefy. Three final datasets were established: (i) all fungi, (ii) mold samples, and (iii) dust samples.
Differences in alpha diversity, fungal richness (number of OTUs), and the Shannon index were evaluated by analysis of variance (ANOVA) tests. Beta diversity patterns were assessed through non-metric multidimensional scaling (NMDS) ordination of both samples and OTUs, applying metaMDS and Bray–Curtis dissimilarity index on the Hellinger-transformed rarefied OTU tables. To evaluate the correlation between relevant factors (building, apartment, room, material, building structure) and the observed variance in fungal community composition, permutational multivariate analysis of variance (PERMANOVA; 999 permutations) was performed individually on each factor using adonis2. To assess the overlap between mold and dust mycobiota, we compared the OTUs detected in the different types of samples and rooms (damaged and central rooms) using two different estimates: numbers/percentages of OTUs across overall data and mean percentages of OTUs per apartment.
To evaluate the two fungal identification approaches (microscopy and DNA metabarcoding), the taxa reported by microcopy were compared to the most abundant genera (>1% of the total number of rarefied reads) provided by the DNA metabarcoding. Considering the well-known limitations of species identification based on short DNA fragments, the results from the taxonomic assignment of OTUs are mainly shown and discussed at the genus level. It is well-known that species in some abundant mold genera, such as Penicillium, Aspergillus, and Cladosporium, can hardly be separated by the ITS marker. To monitor the spread of the major genera identified in the mold samples, their presence/absence and relative abundances (RA, as total percentages of sequences) were tracked in the dust samples collected from the same apartment.

3. Results

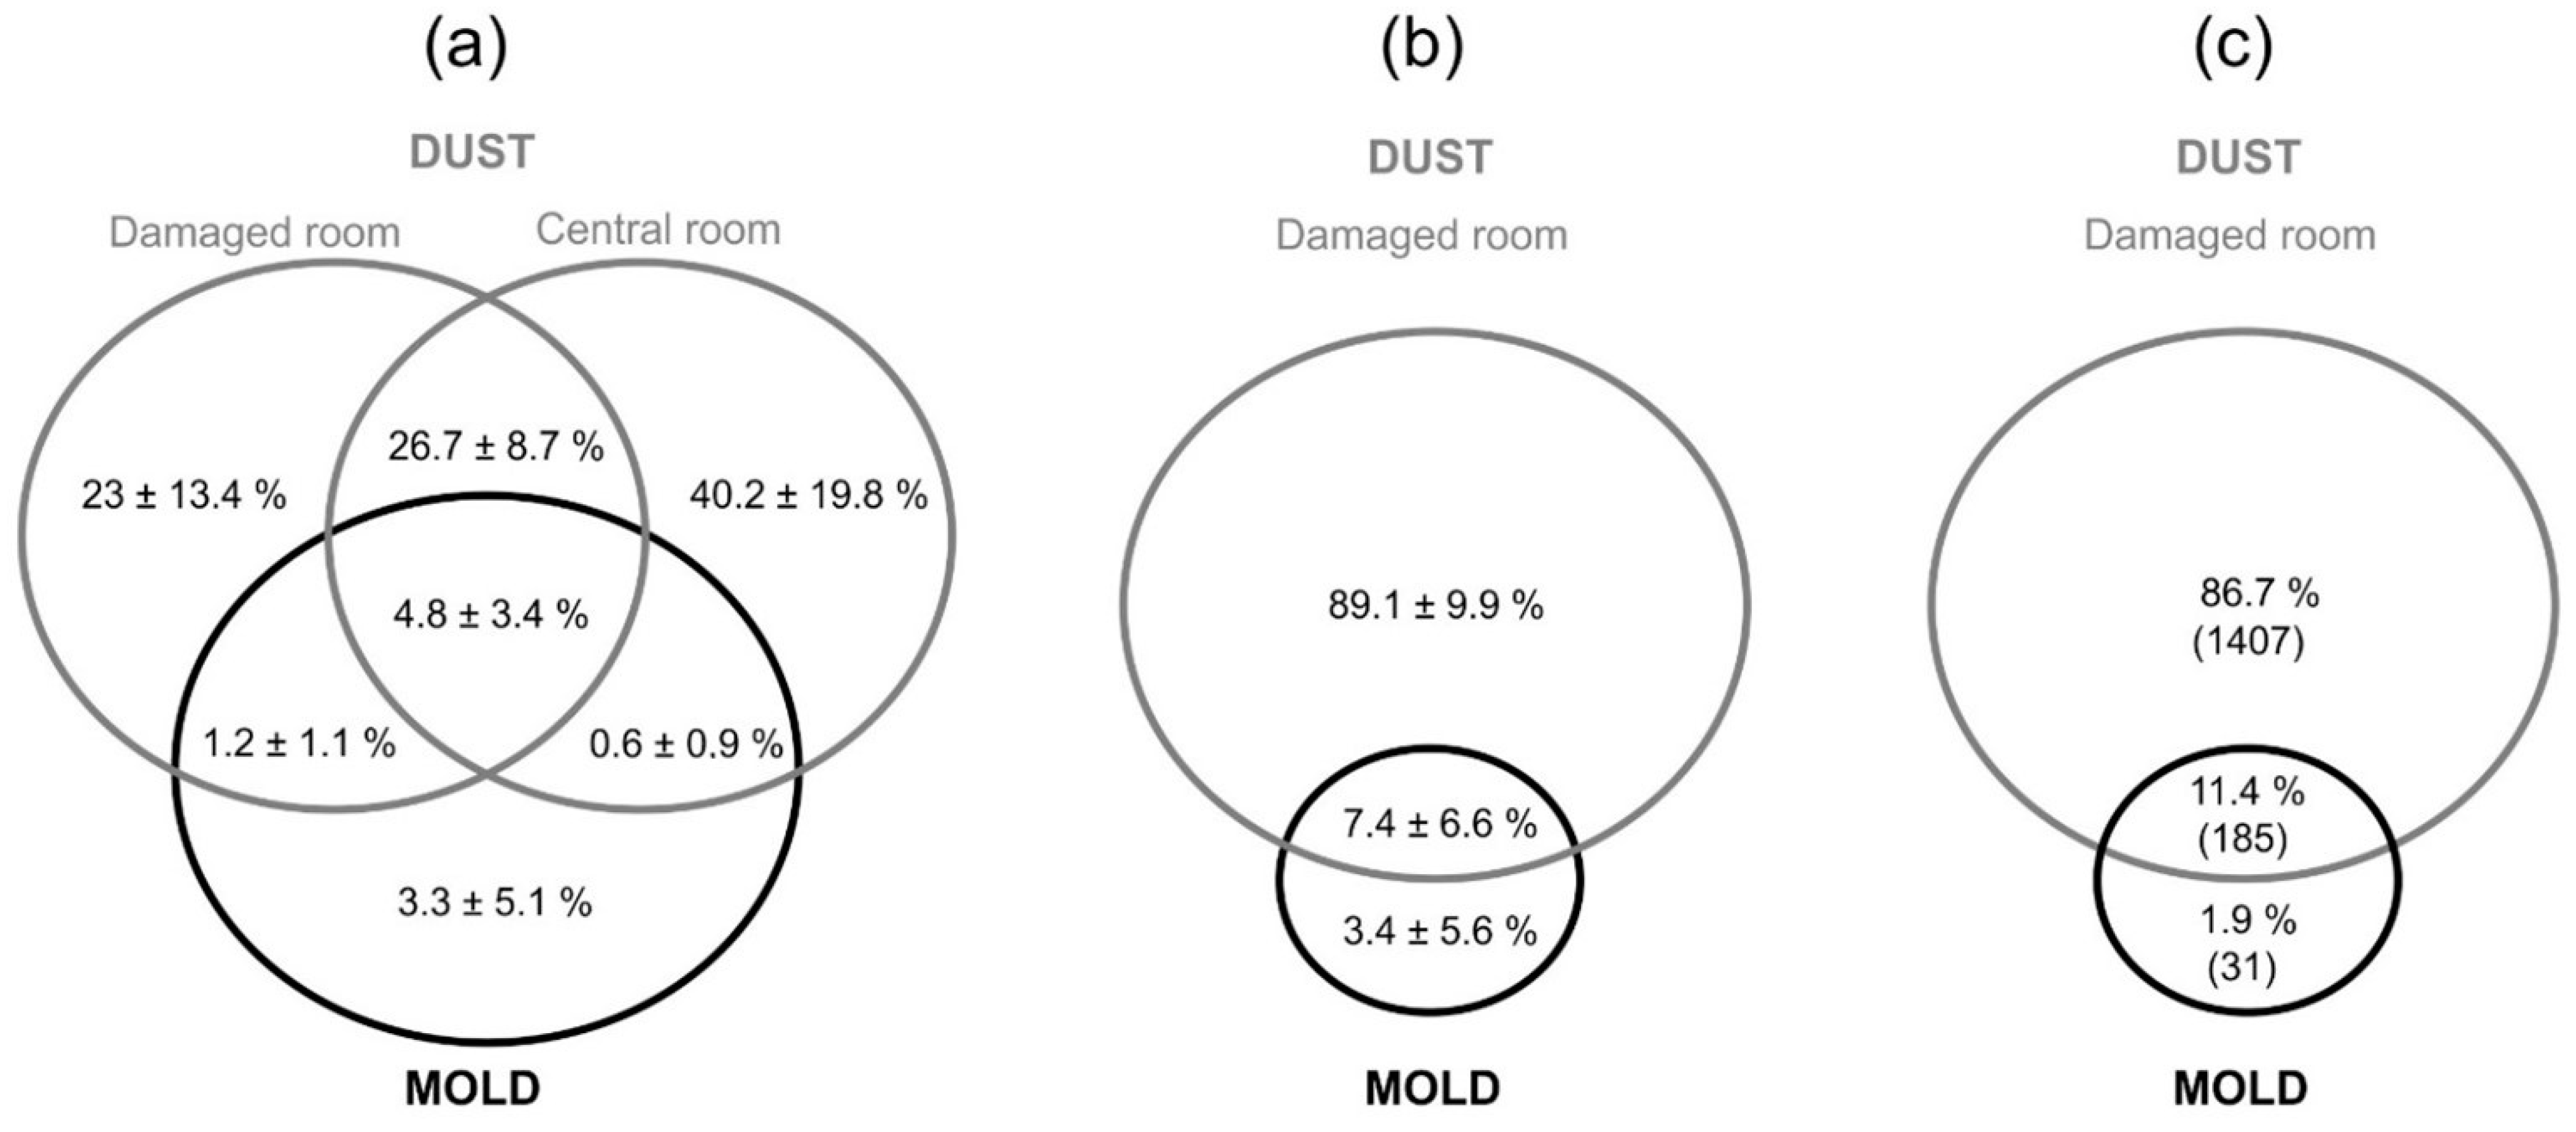
3.1. Mold vs. Dust Mycobiota by DNA Metabarcoding

The fungal community composition was clearly different between the two sample types, the mold and dust samples, as shown by the NMDS ordination of the full dataset (Figure 2a). According to the PERMANOVA, there was a significant (p < 0.001) difference between the community composition of the two sample types, accounting for 12.3% of the overall variance. The similarity among the dust samples was clearly higher than among the mold samples. As expected, the dust samples showed a significantly higher alpha diversity compared to the mold samples (Figure 2b). The number of observed OTUs per sample (richness) ranged from 44 to 424 (mean = 211.9) among the dust samples and from 2 to 65 (mean = 16.6) among the mold samples.
Among the 1829 OTUs detected in the overall dataset, 1562 (85.4%) were only present among the dust samples, while 38 (2%) were uniquely present in the mold samples. Altogether, 229 OTUs (12.5%) were detected in both substrates. Considering the most abundant genera, those represented by >2% of the total number of sequences, we observed some marked trends in the two types of samples (Figure 2c): Acremonium, Aspergillus, Chaetomium, Derbaryomyces, Stachybotrys, and Trichoderma were more abundant in the mold samples, while Cladosporium, Fomitopsis, Penicillium, Rhodotorula, Saccharomyces, Serpula (initially misidentified as Austropaxillus), and Thekopsora were dominant in the dust samples. The details about the 200 most abundant OTUs in the complete dataset are reported in Supplementary Table S1.
When we analyzed the mold samples separately, we observed that the type of building material accounted for 22.05% (p < 0.002) of the compositional variance (Figure 3a). Despite the low number of samples analyzed for some materials, we detected some specific associations between certain fungal genera and types of materials (Figure 3b): Acremonium on gypsum board; Alternaria on wood; Chaetomium on gypsum board, chipboard, and MDF; Derbaryomyces, Monicillium, and Mucor on wall paper; Naganishia on chipboard; Penicillium on MDF, building paper, and wall paper; Rhodotorula on chipboard; Stachybotrys on gypsum board, wood, and building paper; Trichoderma on wood; and Wallemia on wall paper.

3.2. Fungi Growing on Building Materials Identified by Microscopy

The most abundant species colonizing the different building materials, as revealed by direct microscopy, were Chaetomium globosum, Stachybotrys chartarum, and species of the genera Cladosporium, Acremonium, Trichoderma, Penicillium, Aspergillus, Ulocladium, and Niesslia (Table 1). In addition, the growth of Actinobacteria was observed in several samples.
The comparisons of the microscopy results with those obtained by DNA metabarcoding in a sample-by-sample basis are shown in three different tables: Table 2 for the apartments that include two dust samples (damaged and central rooms), Supplementary Table S2 for those with only one dust sample (damaged room), and Supplementary Table S3 for those without any dust samples. In general, both approaches were able to identify the dominant colonizing species, showing the matching taxonomic assignments to some extent. As much as 79.2% of the microscopy-based identifications were confirmed by the DNA analyses at the genus level, where 66.6% of them were included in the list of the most abundant genera (>1% of sequences; Table 2, Tables S2 and S3). In contrast, only 36.7% of the DNA-based identifications as major genera (>1%) could be detected by microscopy. This percentage dropped drastically when the whole list of the genera reported by DNA metabarcoding was included.

3.3. Dispersal of Fungi in the Apartments as Assesed by DNA Metabarcoding

A low proportion of the OTUs (proxy of species), about 7%, were detected in both the mold and dust samples when calculated on an apartment-by-apartment basis (Figure 4a,b). This overlap increases up to 11.4% in an overall comparison of the mold and dust data in all the buildings combined (25 apartments; Figure 4c). In agreement with the species richness data (Figure 1c), the great majority of the OTUs (>96%) were found in the dust samples, while only 3.3% of the OTUs were on average uniquely detected in the mold samples. The overlaps between the mold and dust samples were slightly different (not significant; p = 0.14), depending on the room where the dust was collected, being to some extent higher in the damaged rooms (1.25%) compared to the central ones (0.57%) (Figure 4a).
In addition, we assessed the spread of the molds by comparing the most abundant genera present in the mold samples, with their prevalence in the dust samples collected from the different rooms (Table 2 and Table S2). We here observed that (i) the majority of the genera identified in the mold samples were also detected in the dust from the same apartments, but sometimes with very low relative abundances, and (ii) there was no clear connection between their relative abundances in the dust and the distance to the mold damages (the potential sources of these species).

4. Discussion

4.1. Moisture-Damage Indicator Fungi

Moisture requirements and substrate preferences of several indicator taxa were compiled in Nunez et al. [11], based on a comprehensive dataset (1132 records) of fungi identified in damp buildings in Norway during the years 2001–2006. Despite the limited number of samples in the present survey (48), the dominant indicator fungi and their prevalence in certain materials were, to a large extent, in agreement with previous reports [4,5,11,13]. Aspergillus was the most abundant genus in the mold samples and widely distributed in all the materials, which is not surprising considering its well-known generalist trait [15]. In contrast, some specialist taxa were associated with different substrates: Acremonium with gypsum board, Chaetomium with chipboard, Stachybotrys with gypsum board and wood, and Trichoderma with wood.
In building ecology, a challenging task is to differentiate between moisture-damage indicator fungi that can colonize building materials, and grow under indoor conditions, from those widespread airborne fungi more related to outdoor air, vegetation, and the household food [13], whose distribution indoors is largely driven by stochastic processes. Previous studies have demonstrated that the indoor dust mycobiota is mainly composed of spores and hyphal fragments coming from both outdoor and indoor sources [22,23,35,36,37]. Our study has also reflected this dual origin of the dust fungi. Taxa clearly related to the outdoor environment, such as the plant-associated Thekopsora and Fomitopsis, were found, as well as taxa that can be related to secondary indoor sources: Saccharomyces, which is often found in the occupants’ skin [23], or Chaetomium, Aspergillus, and Serpula which can grow and produce millions of spores on different damaged materials [11]. The ecology of the genera Cladosporium and Saccharomyces is very diverse, being widely distributed in both outdoor (e.g., soil and phyllosphere) and indoor environments. However, previous studies on dust have demonstrated that the proportion of Cladosporium is often higher in outdoor samples, while Saccharomyces is higher in indoor samples [22,23,35]. These multiple inputs led to a high fungal diversity in the dust samples, which showed a much higher richness than the mold samples. Fungal communities in building areas with visible mold growth are characterized by a limited diversity with a few dominant taxa that are growing on the material surface [24,25,26,38].

4.2. Pros and Cons of Different Methods: Microscopy vs. DNA Metabarcoding

All fungal detection techniques have specific benefits and drawbacks, providing a fragmented picture of the mycobiota present in a given sample. This has been demonstrated by diverse comparative studies on indoor dust and/or material samples, especially focused on the comparison between culture-dependent and -independent methods [39,40,41]. In the present study, we compared two contrasting techniques (microscopy vs. DNA metabarcoding) for the characterization of indoor surfaces with visible mold growth.
The microscopy of tape lifts is a very simple and cheap method to document which fungi are actively growing on building materials, as its results are based on the observation of fungal reproductive structures [12]. Similar to the morphological identification of cultivated isolates, this microscopy technique sometimes reaches taxonomic identification down to the species level, when the key structures are present and the observer is skilled enough to classify them. However, microscopy is not able to identify many of the spores and hyphal fragments that settle on the sampled areas, which are especially abundant in dust samples collected from dry surfaces. Based on the microscopy results, we were able to identify the main indicator fungi associated with the studied mold damages, where 39.6% of the morphological identifications were at the species level. Many identifications could only reach the genus level, e.g., species of Aspergillus, Penicillium, Cladosporium, Acremonium, and Trichoderma, due to the lack of the species-specific features on the tapes. Species identification within these genera often requires further analyses, such as cultivation using special media and incubation conditions, metabolic characterization, and/or the DNA sequencing of multiple markers [29,42]. Our microscopy results also showed some uncertainty at the genus level. For example, Ulocladium sp. was found growing in four mold samples (M4, M24, M37, and M60; Tables S2 and S3) where the DNA-based relative abundances of Alternaria were considerably high. In view of the morphological similarity between these two taxa, whose only distinctive feature is the type of spore ontogenesis on the conidiophore [29], both of them most likely correspond to the same indicator fungus. It is difficult to determine the most accurate identification for this fungus because these contradictory results may be due to (i) the arguable taxonomic weight of this morphological trait and/or (ii) the difficulty of distinguishing between the genera Alternaria and Ulocladium based on the ITS2 sequence divergence. For instance, the representative ITS2 sequence of the most abundant OTU assigned to Alternaria showed 100% similarity against members of both genera. Previous DNA-based studies revealed multiple non-monophyletic genera, including Alternaria and Ulocladium, within the so-called Alternaria complex [43].
The main advantages of DNA metabarcoding are (i) the high sensitivity based on both the PCR and HTS and (ii) the quantitative potential providing relative abundances of comprehensive lists of taxa [21,41]. In contrast, the microscopy of tape lifts can only detect a few dominant taxa with some qualitative information about how abundant they are growing on the studied surface area. In this study, considering the small tape area observed and the lack of homogeneity between the samples of these qualitative data, we decided to exclude them from the analyses. Comparing the richness in the mold samples, the DNA metabarcoding reported a mean of 16 OTUs per sample, while the microscopy of the tape lifts only identified two taxa per sample on average. It is worthwhile to mention that DNA metabarcoding is a semi-quantitative technique, as relative quantities are not always correlated to absolute measurements. Xu et al. [44] implemented different methods (microscopy cell counting, flow cytometry, and DNA metabarcoding) to monitor the microbial growth on materials and demonstrated that small changes in relative abundance often resulted from large changes in absolute abundance.
As mentioned before, an important weakness of DNA-based methods is that it is impossible to distinguish between viable and non-viable organisms. Due to the longevity of the relic DNA (extracellular or from dead cells), DNA techniques may, after the reparation of water damage, detect the presence of senescent indicator fungi. A recent study showed that relic DNA accounted for about 40% of the ITS sequences recovered from soil samples [45]. This highlights the importance of knowing the building history in order to draw sound conclusions [13]. Interestingly, abundant DNA from the dry-rot fungus (Serpula lacrymans) was detected in dust samples from apartment 15 (85–93% of sequences) despite the lack of dry-rot signs in the corresponding mold sample (M36; Table 2). This result agrees with the visual inspection of this apartment, where S. lacrymans was pinpointed in other parts of the apartment (Mycoteam AS’ communication) and on surfaces which were not sampled in this study. This finding illustrates the sensitivity of dust DNA metabarcoding to detect and monitor fungal attacks in buildings but also the need for a proper sampling design based on the previous knowledge about the building structure and its history.
Like for microscopy, the taxonomic assignment based on DNA sequences is a challenging task due to several well-known constraints [21]. Two of them are the limited accuracy of incomplete reference sequence databases and the insufficient intraspecific sequence variation in barcodes (including ITS1 and ITS2) to resolve the taxonomy at the species level, as discussed above for some common mold genera, such as Penicillium, Cladosporium, Aspegillus, and Alternaria. In this study, the percentages of non-identified OTUs were similar to those observed in other DNA metabarcoding studies [22,23], increasing considerably from the phylum (4.5%) to order (10.8%), genus (28.5%), and species (47.7%) levels. Therefore, the identity and ecology of a significant proportion of the fungi detected by DNA sequencing remain unknown. In order to overcome the less reliable identification at the species level, we decided to focus on the most abundant genera, those with a total RA > 1% of sequences after merging all the OTUs affiliated to the same genus. This conversion allowed us to compare two datasets characterized by very different resolutions (microscopy vs. DNA metabarcoding) but also added an additional bias to our results.
Even when focusing on the genus level, the taxonomic annotation was not exempt of errors, as demonstrated by the automatic identification of Austropaxillus among the most abundant genera detected. This ectomycorrhizal-forming genus has exclusively been reported in the temperate Southern Hemisphere, and its phylogenetic position is close to the genus Serpula [46]. We double-checked the two OTUs that were initially identified as Austropaxillus squarrosus, by an additional manual BLAST search against both the UNITE and INSDC databases, and we were able to correct their affiliation to the species Serpula lacrymans (100% in both sequence similarity and coverage). These problems (errors and low precision) during the taxonomic assignment make it highly recommended to include a further semi-automated or manual curation of results, at least for the major OTUs, which often leads to a refined taxonomic resolution [21].

4.3. Contribution of Dust DNA Analyses for Assessment of Indoor Moisture Problems

Previous studies have revealed that moisture problems and subsequent mold growth, i.e., an additional indoor fungal source, significantly modify the overall composition of fungal spores in indoor dust samples [24,25,26]. In contrast, other studies have suggested that the effects of moisture damage are less evident. The response to moisture damage may be observed as changes in the relative abundance of a few less common taxa rather than in the overall community structure [27]. Hegarty et al. [25] demonstrated that a specific mold growth significantly influenced the richness and ecology of airborne fungi in distant parts of the same building, where the relative abundances of mold-damage indicator taxa were inversely correlated to the distance to the mold growth. In our study, the genera detected in the mold samples were largely present in the dust with scarce abundance. Interestingly, the overlap of the OTUs between the sample types (mold and dust) was slightly higher in the damaged rooms than in the central rooms, which indicated some local spread of moisture indicator fungi in the study apartments. However, this difference was not statistically significant, and there was no clear association between their relative abundances in the dust and the distance to the mold growth. As anticipated by Hegarty at al. [25], multi-building studies with such a limited number of samples as ours may not be the appropriate approach to identify these spatial patterns due to the inherent factors affecting each individual building.
Fungal species growing directly on moist building materials (i.e., moisture-damage indicator fungi) should not be considered as part of the baseline fungi in healthy indoor environments, as the presence of moist structures is an abnormal condition in buildings [12,13]. Therefore, in the assessment of moisture problems, identifying the characteristic baseline fungi of the study region is as important as the identification of moisture indicator fungi. These kinds of studies should also account for the temporal variability of indoor mycobiota because the outdoor seasonality has been recognized as a key driving factor [37]. Diverse dust DNA analyses have been proposed for the detection and monitoring of mold damages in buildings, including various qPCR-based environmental relative moldiness indices (ERMI and its Finnish adaptation FERMI) [47,48] as well as a DNA metabarcoding approach [26]. The latter study, based on the ITS metabarcodes from dust samples, detected significant differences in the community composition between moldy vs. no mold houses in three different climatic regions in the USA. They proposed a combined use of an HTS and machine learning modeling for an accurate classification of buildings according to the potential presence of mold growth [26].

4.4. Concluding Remarks

This study, combining two complementary methods (microscopy and DNA metabarcoding), achieved relatively consistent results of the mycobiota associated with visible mold growth in buildings, where as much as 79.2% of the microscopy-identified taxa were confirmed by DNA analysis at the genus level. In addition, the dust DNA metabarcoding provided comprehensive lists of airborne taxa that were present in the apartments as both viable and non-viable forms, whose interpretation is challenging. Our data indicate some local spread of moisture indicator fungi from moldy materials to other rooms. However, further DNA studies including the intensive sampling in different rooms of single moldy buildings are needed to conclude such a statement. Collecting more variables related to the materials and environmental conditions (e.g., water content, temperature, and RH) will better characterize the ecological niches studied (fungal traits), facilitating the identification of moisture indicator fungi. In addition, conducting these studies in different geographic regions will improve the knowledge about their most common indoor airborne fungi.
In summary, to assess mold damages, different microbiological methods, such as microscopy, culturing, and DNA and chemical analyses, should be combined together in a thorough inspection of buildings, collecting the relevant metadata. This multifaceted approach will, to a large extent, overcome the limitations of each method. The expected valuable datasets need to be interpreted by skilled mycologists and building consultants with knowledge about indoor fungal ecology, building structures, and environmental conditions, among others.

Supplementary Materials

The following are available online at www.mdpi.com/article/10.3390/app12189372/s1, Table S1: Data of the top-200 most abundant OTUs, including relative abundances, curated taxonomic assignment as well as their representative ITS2 sequences, Table S2: Comparison of fungi detected in different substrates by using microscopy (mold samples) and DNA metabarcoding (both mold and dust samples from the same damaged room)—data from fourteen apartments that only include dust samples from the damaged rooms, Table S3: Comparison of fungi detected in mold samples by using both microscopy and DNA metabarcoding—data from eight apartments that only include mold samples.

Author Contributions

Conceptualization, P.M.M.-S. and M.N., with contributions from H.K., I.S., and E.L.F.E.; methodology and investigation, P.M.M.-S. and M.N.; formal analysis, visualization, data curation, and writing—original draft preparation, P.M.M.-S.; writing—review and editing, all authors; supervision, H.K.; funding acquisition and project administration, P.M.M.-S. and H.K. All authors have read and agreed to the published version of the manuscript.

Funding

This study received funding from the EUROPEAN UNION’S HORIZON 2020 research and innovation programme through a Marie Skłodowska-Curie Individual Fellowship to P.M.M.-S., under the grant agreement MycoIndoor No 741332.

Institutional Review Board Statement

Not applicable.

Informed Consent Statement

Not applicable.

Data Availability Statement

All datasets needed to reproduce this study are available on Zenodo (https://doi.org/10.5281/zenodo.6670343), including metadata, the quality-filtered fungal rarefied OTU table, and taxonomic assignment. To protect the personal data of the owners of the study apartments, their addresses and geographic coordinates were omitted from the metadata. R scripts used for statistical analyses will be available upon request.

Acknowledgments

All Mycoteam’s inspectors who provided samples and data of the study apartments are acknowledged for their essential contributions.

Conflicts of Interest

The authors declare no conflict of interest. The funders had no role in the design of the study; in the collection, analyses, or interpretation of data; in the writing of the manuscript; or in the decision to publish the results.

References

  1. World Health Organization, Regional Office for Europe. WHO Guidelines for Indoor Air Quality: Dampness and Mould; WHO, Regional Office for Europe: Copenhagen, Denmark, 2009; Available online: https://apps.who.int/iris/handle/10665/164348 (accessed on 14 September 2022).
  2. Mendell, M.J.; Mirer, A.G.; Cheung, K.; Tong, M.; Douwes, J. Respiratory and allergic health effects of dampness, mold, and dampness-related agents: A review of the epidemiologic evidence. Environ. Health Perspect. 2011, 119, 748–756. [Google Scholar] [CrossRef] [PubMed]
  3. National Academies of Sciences, Engineering, and Medicine. Microbiomes of the Built Environment: A Research Agenda for Indoor Microbiology, Human Health, and Buildings; The National Academies Press: Washington, DC, USA, 2017. [Google Scholar] [CrossRef]
  4. Hyvärinen, A.; Meklin, T.; Vepsäläinen, A.; Nevalainen, A. Fungi and actinobacteria in moisture-damaged building materials: Concentrations and diversity. Int. Biodeterior. Biodegrad. 2002, 49, 27–37. [Google Scholar] [CrossRef]
  5. Andersen, B.; Frisvad, J.C.; Søndergaard, I.; Rasmussen, I.S.; Larsen, L.S. Associations between fungal species and water-damaged building materials. Appl. Environ. Microbiol. 2011, 77, 4180–4188. [Google Scholar] [CrossRef]
  6. Verdier, T.; Coutand, M.; Bertron, A.; Roques, C. A review of indoor microbial growth across building materials and sampling and analysis methods. Build. Environ. 2014, 80, 136–149. [Google Scholar] [CrossRef]
  7. Dedesko, S.; Siegel, J.A. Moisture parameters and fungal communities associated with gypsum drywall in buildings. Microbiome 2015, 3, 71. [Google Scholar] [CrossRef] [PubMed]
  8. Coombs, K.; Vesper, S.; Green, B.J.; Yermakov, M.; Reponen, T. Fungal microbiomes associated with green and non-green building materials. Int. Biodeterior. Biodegrad. 2017, 125, 251–257. [Google Scholar] [CrossRef]
  9. Horisawa, S.; Yoshida, M.; Umezawa, K.; Wada, T.; Abe, H.; Doi, S.; Samejima, M.; Momohara, I. Diversity and community structure of wood-inhabiting fungi found in Japanese wooden houses analyzed by the next-generation sequencing. J. Wood Sci. 2017, 63, 369–378. [Google Scholar] [CrossRef]
  10. Viitanen, H. Moisture and bio-deterioration risk of building materials and structures. In Mass Transfer-Advanced Aspects; Nakajima, H., Ed.; InTech Europe: Rijeka, Croatia, 2011; pp. 579–594. [Google Scholar] [CrossRef]
  11. Nunez, M.; Sivertsen, M.A.; Mattsson, J. Growth preferences on substrate, construction, and room location for indoor moulds and Actinomycetes. In Proceedings of the 10th International Conference on Healthy Buildings 2012, Brisbane, Australia, 5–12 July 2012; Morawska, L., Ed.; ISIAQ: Santa Cruz, CA, USA; Volume 1, 5H.3. p. 1312. [Google Scholar]
  12. Nunez, M.; Hammer, H. Microbial specialists in below-grade foundation walls in Scandinavia. Indoor Air 2014, 24, 543–551. [Google Scholar] [CrossRef] [Green Version]
  13. Andersen, B.; Frisvad, J.C.; Dunn, R.R.; Thrane, U. A pilot study on baseline fungi and moisture indicator fungi in Danish homes. J. Fungi 2021, 7, 71. [Google Scholar] [CrossRef]
  14. Prezant, B.; Miller, D.; Weekes, D. Recognition, Evaluation, and Control of Indoor Air Mold; American Industrial Hygiene Association: Falls Church, VA, USA, 2008. [Google Scholar]
  15. Flannigan, B.; Samson, R.A.; Miller, J.D. Microorganisms in Home and Indoor Work Environments: Diversity, Health Impacts, Investigation and Control; CRC Press: London, UK, 2011. [Google Scholar]
  16. Mensah-Attipoe, J.; Täubel, M. Analysis Approaches for Fungi in Indoor Environmental Assessments. In Exposure to Microbiological Agents in Indoor and Occupational Environments; Viegas, C., Viegas, S., Gomes, A., Täubel, M., Sabino, R., Eds.; Springer: Cham, Switzerland, 2017; pp. 109–127. [Google Scholar] [CrossRef]
  17. Reponen, T. Sampling for Microbial Determinations. In Exposure to Microbiological Agents in Indoor and Occupational Environments; Viegas, C., Viegas, S., Gomes, A., Täubel, M., Sabino, R., Eds.; Springer: Cham, Switzerland, 2017; pp. 85–96. [Google Scholar] [CrossRef]
  18. Wu, B.; Hussain, M.; Zhang, W.; Stadler, M.; Liu, X.; Xiang, M. Current insights into fungal species diversity and perspective on naming the environmental DNA sequences of fungi. Mycology 2019, 10, 127–140. [Google Scholar] [CrossRef]
  19. Haugland, R.A.; Vesper, S.J. Identification and Quantification of Specific Fungi and Bacteria. U.S. Patent 6,387,652, 14 May 2002. [Google Scholar]
  20. Gilbert, J.A.; Stephens, B. Microbiology of the built environment. Nat. Rev. Microbiol. 2018, 16, 661–670. [Google Scholar] [CrossRef] [PubMed]
  21. Nilsson, R.H.; Anslan, S.; Bahram, M.; Wurzbacher, C.; Baldrian, P.; Tedersoo, L. Mycobiome diversity: High-throughput sequencing and identification of fungi. Nat. Rev. Microbiol. 2019, 17, 95–109. [Google Scholar] [CrossRef] [PubMed]
  22. Martin-Sanchez, P.M.; Estensmo, E.L.F.; Morgado, L.N.; Maurice, S.; Engh, I.B.; Skrede, I.; Kauserud, H. Analysing indoor mycobiomes through a large-scale citizen science study in Norway. Mol. Ecol. 2021, 30, 2689–2705. [Google Scholar] [CrossRef] [PubMed]
  23. Estensmo, E.L.F.; Botnen, S.S.; Maurice, S.; Martin-Sanchez, P.M.; Morgado, L.; Engh, I.B.; Høiland, K.; Skrede, I.; Kauserud, H. The indoor mycobiome of daycare centers is affected by occupancy and climate. Appl. Environ. Microbiol. 2022, 88, e0211321. [Google Scholar] [CrossRef]
  24. Sylvain, I.A.; Adams, R.I.; Taylor, J.W. A different suite: The assemblage of distinct fungal communities in water-damaged units of a poorly-maintained public housing building. PLoS ONE 2019, 14, e0213355. [Google Scholar] [CrossRef]
  25. Hegarty, B.; Haverinen-Shaughnessy, U.; Shaughnessy, R.J.; Peccia, J. Spatial gradients of fungal abundance and ecology throughout a damp building. Environ. Sci. Technol. Lett. 2019, 6, 329–333. [Google Scholar] [CrossRef]
  26. Hegarty, B.; Pan, A.; Haverinen-Shaughnessy, U.; Shaughnessy, R.; Peccia, J. DNA sequence-based approach for classifying the mold status of buildings. Environ. Sci. Technol. 2020, 54, 15968–15975. [Google Scholar] [CrossRef]
  27. Jayaprakash, B.; Adams, R.I.; Kirjavainen, P.; Karvonen, A.; Vepsäläinen, A.; Valkonen, M.; Järvi, K.; Sulyok, M.; Pekkanen, J.; Hyvärinen, A.; et al. Indoor microbiota in severely moisture damaged homes and the impact of interventions. Microbiome 2017, 5, 138. [Google Scholar] [CrossRef]
  28. Gams, W. The analysis of communities of saprophytic microfungi with special reference to soil fungi. Handb. Veg. Sci. 1992, 19, 182–223. [Google Scholar]
  29. de Hoog, G.S.; Guarro, J.; Gené, J.; Figueras, M.J. Atlas of Clinical Fungi, 2nd ed.; Centraalbureau voor Schimmelcultures: Baarn, The Netherlands; Universitat di Rovira i Virgili: Reus, Spain, 2000. [Google Scholar]
  30. Ihrmark, K.; Bödeker, I.T.M.; Cruz-Martinez, K.; Friberg, H.; Kubartova, A.; Schenck, J.; Strid, Y.; Stenlid, J.; Brandström-Durling, M.; Clemmensen, K.E.; et al. New primers to amplify the fungal ITS2 region—Evaluation by 454-sequencing of artificial and natural communities. FEMS Microbiol. Ecol. 2012, 82, 666–677. [Google Scholar] [CrossRef] [PubMed]
  31. White, T.J.; Bruns, T.D.; Lee, S.B.; Taylor, J.W. Amplification and direct sequencing of fungal ribosomal RNA genes for phylogenetics. In PCR–Protocols and Applications–A Laboratory Manual; Innis, M.A., Gelfand, D.H., Sninsky, J.J., White, T.J., Eds.; Academic Press: New York, NY, USA, 1990; pp. 315–322. [Google Scholar]
  32. R Core Team. R: A Language and Environment for Statistical Computing; R Foundation for Statistical Computing: Vienna, Austria, 2018; Available online: https://www.R-project.org/ (accessed on 14 September 2022).
  33. Wickham, H. Tidyverse: Easily Install and Load the ‘Tidyverse’ R Package Version 1.2.1. 2017. Available online: https://CRAN.R-project.org/package=tidyverse (accessed on 14 September 2022).
  34. Oksanen, J.; Simpson, G.L.; Blanchet, F.G.; Kindt, R.; Legendre, P.; Minchin, P.R.; O’hara, R.B.; Solymos, P.; Stevens, M.H.H.; Szoecs, E.; et al. Vegan: Community Ecology Package. R Package Version 2.5-6. 2019. Available online: https://CRAN.R-project.org/package=vegan (accessed on 14 September 2022).
  35. Adams, R.I.; Miletto, M.; Taylor, J.W.; Bruns, T.D. Dispersal in microbes: Fungi in indoor air are dominated by outdoor air and show dispersal limitation at short distances. ISME J. 2013, 7, 1262–1273. [Google Scholar] [CrossRef] [PubMed]
  36. Barberán, A.; Dunn, R.R.; Reich, B.J.; Pacifici, K.; Laber, E.B.; Menninger, H.L.; Morton, J.M.; Henley, J.B.; Leff, J.W.; Miller, S.L.; et al. The ecology of microscopic life in household dust. Proc. R. Soc. B Boil. Sci. 2015, 282, 20151139. [Google Scholar] [CrossRef] [PubMed]
  37. Estensmo, E.; Morgado, L.; Maurice, S.; Martin-Sanchez, P.M.; Engh, I.B.; Mattsson, J.; Kauserud, H.; Skrede, I. Spatiotemporal variation of the indoor mycobiome in daycare centers. Microbiome 2021, 9, 220. [Google Scholar] [CrossRef] [PubMed]
  38. An, C.; Yamamoto, N. Fungal compositions and diversities on indoor surfaces with visible mold growths in residential buildings in the Seoul Capital Area of South Korea. Indoor Air 2016, 26, 714–723. [Google Scholar] [CrossRef]
  39. Pitkäranta, M.; Meklin, T.; Hyvärinen, A.; Nevalainen, A.; Paulin, L.; Auvinen, P.; Lignell, U.; Rintala, H. Molecular profiling of fungal communities in moisture damaged buildings before and after remediation—A comparison of culture-dependent and culture-independent methods. BMC Microbiol. 2011, 11, 235. [Google Scholar] [CrossRef]
  40. Mensah-Attipoe, J.; Reponen, T.; Veijalainen, A.M.; Rintala, H.; Täubel, M.; Rantakokko, P.; Ying, J.; Hyvärinen, A.; Pasanen, P. Comparison of methods for assessing temporal variation of growth of fungi on building materials. Microbiology 2016, 162, 1895–1903. [Google Scholar] [CrossRef]
  41. Shinohara, N.; Woo, C.; Yamamoto, N.; Hashimoto, K.; Yoshida-Ohuchi, H.; Kawakami, Y. Comparison of DNA sequencing and morphological identification techniques to characterize environmental fungal communities. Sci. Rep. 2021, 11, 2633. [Google Scholar] [CrossRef]
  42. Visagie, C.M.; Hirooka, Y.; Tanney, J.B.; Whitfield, E.; Mwange, K.; Meijer, M.; Amend, A.S.; Seifert, K.A.; Samson, R.A. Aspergillus, Penicillium and Talaromyces isolated from house dust samples collected around the world. Stud. Mycol. 2014, 78, 63–139. [Google Scholar] [CrossRef]
  43. Woudenberg, J.H.; Groenewald, J.Z.; Binder, M.; Crous, P.W. Alternaria redefined. Stud. Mycol. 2013, 75, 171–212. [Google Scholar] [CrossRef]
  44. Xu, Y.; Tandon, R.; Ancheta, C.; Arroyo, P.; Gilbert, J.A.; Stephens, B.; Kelley, S.T. Quantitative profiling of built environment bacterial and fungal communities reveals dynamic material dependent growth patterns and microbial interactions. Indoor Air 2021, 31, 188–205. [Google Scholar] [CrossRef]
  45. Carini, P.; Marsden, P.J.; Leff, J.W.; Morgan, E.E.; Strickland, M.S.; Fierer, N. Relic DNA is abundant in soil and obscures estimates of soil microbial diversity. Nat. Microbiol. 2016, 2, 16242. [Google Scholar] [CrossRef] [PubMed]
  46. Skrede, I.; Engh, I.B.; Binder, M.; Carlsen, T.; Kauserud, H.; Bendiksby, M. Evolutionary history of Serpulaceae (Basidiomycota): Molecular phylogeny, historical biogeography and evidence for a single transition of nutritional mode. BMC Evol. Biol. 2011, 11, 230. [Google Scholar] [CrossRef] [PubMed]
  47. Vesper, S.; McKinstry, C.; Haugland, R.; Wymer, L.; Bradham, K.; Ashley, P.; Cox, D.; Dewalt, G.; Friedman, W. Development of an Environmental Relative Moldiness index for US homes. J. Occup. Environ. Med. 2007, 49, 829–833. [Google Scholar] [CrossRef] [PubMed]
  48. Täubel, M.; Karvonen, A.M.; Reponen, T.; Hyvärinen, A.; Vesper, S.; Pekkanen, J. Application of the Environmental Relative Moldiness index in Finland. Appl. Environ. Microbiol. 2015, 82, 578–584. [Google Scholar] [CrossRef] [Green Version]
Figure 1. Sampling of mold and dust in this study. (a) Mold-damaged gypsum board where M62-M64 samples were collected; (b) mold growing on wood, sample M65; (c) tape lifts taken directly on discoloration of building materials; (d) dust sample collected by swabbing the upper doorframe, picture extracted from Martin-Sanchez et al. [22].
Applsci 12 09372 g001
Figure 2. Comparison of dust and mold mycobiota, as revealed by DNA metabarcoding: (a) NMDS plot showing the differences in the fungal community composition of 42 dust samples and 48 mold samples; (b) variation of the alpha diversity indices; (c) the most abundant fungal genera (RA ≥ 2%) identified in each sample type. Note that the genus Serpula was initially misidentified as Austropaxillus in the first automatic taxonomic assignment (*).
Applsci 12 09372 g002
Figure 3. Mold mycobiota, as revealed by DNA metabarcoding: (a) NMDS plot comparing the fungal community composition in 48 mold samples collected from different materials; (b) the most abundant fungal genera (RA ≥ 5%) identified in the mold samples collected from different materials, excluding those materials represented by a single sample, i.e., concrete, paint, and plastic.
Applsci 12 09372 g003
Figure 4. Venn diagrams showing the overlap in distribution of OTUs across sample types (dust and mold). (a) Mean percentage of overlapping and unique OTUs (with standard deviations), calculated on an apartment-by-apartment basis for the 11 apartments that included dust samples from both damaged and central rooms; (b) the same kind of data as “a” but calculated for the 25 apartments that only include dust from the damaged rooms; (c) overall percentages and number of OTUs (in parenthesis) for the same 25 apartments as “b”, without separated calculations by apartment.
Applsci 12 09372 g004
Table 1. Prevalence (% of samples) of fungal taxa reported by direct microscopy of tape lifts collected from mold-contaminated building materials.
Materials 1 (n)
TaxaGypsum Board (19)Chipboard (4)Wood
(12)
MDF
(3)
Building Paper (3)Wall
Paper (4)
Chaetomium15.82516.6
Chaetomium globosum47.425 66.6 25
Stachybotrys chartarum36.8 8.3 25
Stachybotrys echinata5.3
Cladosporium31.62525 25
Penicillium31.6502533.3 75
Acremonium26.325
Acremonium ovobatum 8.3
Aspergillus15.82516.6
Aspergillus versicolor21 33.3
Aspergillus niger 8.3
Aspergillus penicillioides 8.3
Aspergillus glaucus 33.3
Ulocladium15.8 8.3
Ascotricha erinacea10.5
Rhizopus10.5
Pseudoallescheria5.3 8.3
Scopulariopsis brevicaulis5.3
Tritirachium5.325
Sepedonium5.3
Monodictys 25
Trichoderma 16.6
Coniophora puteana 16.6
Wallemia sebi 25
Bjerkandera adusta 8.3
Phoma glomerata 8.3
Niesslia heterophora 33.3
Black fungi5.3 8.3
Actinobacteria 210.5 8.3 100
1 MDF: medium-density fiberboard. Materials represented by a unique sample (concrete, paint, and plastic) were excluded. 2 Actinobacteria were also included because of their abundant growth in some of the samples.
Table 2. Comparison of fungi detected by microscopy (mold samples) and DNA metabarcoding (both mold and dust samples) in different substrates. Data from eleven apartments that include dust samples from two different rooms (damaged and central).
Microscopy ResultsFungal DNA Metabarcoding Data (Genus Level)
Mold SampleApartmentMaterial;
Visual Aspect
Major Fungi in Mold Sample
(RA > 1%)
RA
(%)
Presence in Dust
Damaged Room (%)
Presence in Dust
Central Room (%)
M11Building paper;
yellowish growth
Penicillium66.610.64
Aspergillus12.321.522
Diplospora6.9
Malassezia4.70.130.12
Niesslia heterophoraMonocillium (=Niesslia)4
Pachnocybe1.3
Acrostalagmus1.1
Cladosporium121.712.7
M21Building paper;
yellowish growth
Aspergillus68.9
Penicillium25.310.64
Monocillium1.9
Acrostalagmus1.3
M31Gypsum board;
black mold
Stachybotrys echinata
Stachybotrys chartarum
Stachybotrys85.2
Aspergillus8.121.522
Exophiala50.010.06
M93Wall paper;
dark mold
Penicillium sp.Penicillium69.843.114.9
Monocillium22.8
M103Wall paper;
dark mold
Mucor81.40.20.01
Penicillium sp.Penicillium17.72014.9
M113Floor wood;
dark stains
Trichoderma sp.Trichoderma98.4nd1.6
Coniochaeta1.1nd
M123Floor wood;
dark stains
Coniochaeta37.5nd
Penicillium15.2nd14.9
Unidentified
Ascomycetes
M248Painted concrete wall Acremonium94.20.3
Capronia5.60.06
Unidentified molds
M258Wall wood
panel
Aspergillus penicillioidesAspergillus100403.2
M3013Gypsum board Penicillium33.12.213.5
Cladosporium sp.Cladosporium32.64.718.1
Monocillium17.5
Sarocladium10.90.01
Trichoderma1.3 0.1
Acremonium sp.Acremonium1.20.006
Aspergillus1.16.25
Ulocladium sp.
M3615 1Floor woodPenicillium sp.Penicillium36.35.10.8
Talaromyces27.50.01
Fusarium26.90.05
Pyrenochaeta5.4
Aspergillus sp.Aspergillus3.57.52.1
Acremonium ovobatum
85% Serpula
lacrymans 1
93% Serpula
lacrymans 1
M51 223Gypsum board NA 256.6
Acremonium40.70.2
Penicillium2.50.60.6
Cladosporium sp. 3<1% 3
M52 223Gypsum board NA 245
Acremonium31.80.2
Pyrenochaeta14.7
Talaromyces6.90.07
Cladosporium sp.
M5324Wood Stachybotrys440.420
Fusarium23
Penicillium13.646.522.1
Acremonium13.27.65
Chaetomium sp.Chaetomium5.815.918.4
M6129Gypsum board;
black mold
Chaetomium globosum
Chaetomium murorum
Chaetomium95.64.74.8
Mucor1.55.47
Aspergillus sp.<1% 3
Pseudoallescheria sp.
M6230Gypsum board;
dark reddish mold
Chaetomium globosumChaetomium66.714.73.6
Aspergillus versicolorAspergillus16.610.919.6
Penicillium6.81319.9
Mucor4.86.416.2
Monodictys2.612.20.3
Stachybotrys chartarum3<1% 3
Tritirachium sp.
M6330Gypsum board;
black mold
Chaetomium globosumChaetomium85.314.73.6
Aspergillus versicolorAspergillus5.710.919.6
Stachybotrys chartarumStachybotrys5.60.090.05
Mucor26.416.2
M6430Chipboard;
black mold
Chaetomium sp.Chaetomium51.114.73.6
Monodictys sp.Monodictys28.712.20.3
Aspergillus19.510.919.6
Penicillium sp. 3<1% 3
M6530Wood;
black mold
Debaryomyces44.937.60.9
Acremonium29.80.1
Cladosporium sp.Cladosporium25.61.37.5
M6731Gypsum board;
Dark green mold
Chaetomium sp.Chaetomium56.91.29.9
Aspergillus versicolorAspergillus42.44.37.1
M6832Gypsum board;
black mold
Mucor50.214.32.8
Chaetomium globosumChaetomium28.20.70.09
Penicillium sp.Penicillium12.610.71.5
Rhodotorula3.243.60.6
Fusarium2.42.40.006
Cladosporium sp.Cladosporium1.43.65.7
Rhizopus sp.
1 The dust samples from apartment 15 showed very high relative abundance of the dry-rot fungus (Serpula lacrymans; 85–93%), which reflected the diagnosis of this species in that building. This species was misidentified as Austropaxillus squarrosus in the first automatic taxonomic assignment. 2 High percentages of non-assigned (NA) genera (45–57%) were reported for the mold samples from apartment 23 (M51 and M52), compared to the rest of samples (5.9% of NA genera for mold samples on average). 3 Genera detected in mold samples by DNA metabarcoding with RA < 1%. nd: not determined.
Publisher’s Note: MDPI stays neutral with regard to jurisdictional claims in published maps and institutional affiliations.

