Article

Snapshot-Based Visible-Near Infrared Multispectral Imaging for Early Screening of Heat Injury during Growth of Chinese Cabbage

1
Department of Bio-Industrial Machinery Engineering, College of Agriculture and Life Science, Gyeongsang National University, 501 Jinju-daero, Jinju-si 52828, Korea
2
Institute of Smart Farm, Gyeongsang National University, 501 Jinju-daero, Jinju-si 52828, Korea
3
Department of Biosystems Engineering, College of Agriculture, Life & Environment Science, Chungbuk National University, Chungdae-ro, Seowon-gu, Cheongju 28644, Korea
4
Vegetable Research Division, National Institute of Horticultural & Herbal Science, Wanju 55365, Korea
5
Department of Biosystems Machinery Engineering, College of Agricultural and Life Science, Chungnam National University, 99 Daehak-ro, Yuseoung-gu, Daejeon 305-764, Korea
*
Author to whom correspondence should be addressed.
Appl. Sci. 2022, 12(18), 9340; https://doi.org/10.3390/app12189340
Submission received: 19 August 2022 / Revised: 9 September 2022 / Accepted: 10 September 2022 / Published: 18 September 2022
(This article belongs to the Special Issue Applications of Remote Image Capture Systems in Agriculture Ⅱ)

Abstract

:
Heat stress in particular can damage physiological processes, adaptation, cellular homeostasis, and yield of higher plants. Early detection of heat stress in leafy crops is critical for preventing extensive loss of crop productivity for global food security. Thus, this study aimed to evaluate the potential of a snapshot-based visible-near infrared multispectral imaging system for detecting the early stage of heat injury during the growth of Chinese cabbage. Two classification models based on partial least squares-discriminant analysis (PLS-DA) and least-squares support vector machine (LS-SVM) were developed to identify heat stress. Various vegetation indices (VIs), including the normalized difference vegetation index (NDVI), red-edge ratio (RE/R), and photochemical reflectance index (PRI), which are closely related to plant heat stress, were acquired from sample images, and their values were compared with the developed models for the evaluation of their discriminant performance of developed models. The highest classification accuracies for LS-SVM, PLS-DA, NDVI, RE/R, and PRI were 93.6%, 92.4%, 72.5%, 69.6%, and 58.1%, respectively, without false-positive errors. Among these methods for identifying plant heat stress, the developed LS-SVM and PLS-DA models showed more reliable discriminant performance than the traditional VIs. This clearly demonstrates that the developed models are much more effective and efficient predictive tools for detecting heat stress in Chinese cabbage in the early stages compared to conventional methods. The developed technique shows promise as an accurate and cost-effective screening tool for rapid identification of heat stress in Chinese cabbage.

1. Introduction

With global warming, the global mean annual temperature will increase up to 0.3–4.8 °C by 2100, and the temperature in numerous regions is likely to be warmer than the global average temperature [1]. High temperatures are becoming more common and cause heat stress, which has the potential to decrease the yield of leafy vegetables in the near future [2]. Chinese cabbage is vulnerable to high temperatures. It grows best in cold (16–25 °C) and humid climates [3]. High temperatures often affect the formation of narrow and uneven leaves, reduce yields, delay the formation of heading, and cause an increase in sensitivity to contagious diseases, which leads to serious declines in the productivity and quality of Chinese cabbage [3,4]. Therefore, studies on heat-tolerant genotypes have been performed for cabbage breeding based on microRNAs, long noncoding RNAs, and RNA sequencing technologies [4,5,6]. Phenotypic analyses have also been conducted for heat tolerance in Chinese cabbage [7,8]. Despite these efforts, some Asian countries, such as the Republic of Korea, Japan, and China, still suffer from heat stress during summer, resulting in economic loss, lower yields, and even death [9,10,11]. The development of rapid non-destructive evaluation (NDE) techniques for heat stress screening of Chinese cabbage (Brassicaceae family) has attracted substantial attention in the fields of food quality and safety [12,13,14,15].
In this study, we suggested an early screening technique for NDE of heat stress during the growth of Chinese cabbage using the snapshot-based multispectral imaging (SMI) method within the visible-near infrared (Vis/NIR) region because early screening methods of heat stress can prevent potential damage to leaves, productivity, and economic loss. Spectral imaging (i.e., hyperspectral and multispectral imaging) within the Vis/NIR region is a relatively new method for nondestructive inspection of various food and agricultural products [16], because in the Vis/NIR region, chemical bonds such as C–H, O–H, and N–H functional groups have relatively high absorbance peaks in specific frequencies, which reflects the stretching vibration of the overtones involved [17]. Combining conventional imaging with spectroscopy techniques can provide both spatial and spectral information from a target specimen [18,19,20]. Multispectral imaging can be used to obtain Vis/NIR spectra for all pixels of a target sample with 3–20 bands and hyperspectral imaging uses narrow bands (hundreds or thousands of bands, 10–20 nm) [21]. Due to this feature, spectral imagery can be used for the rapid identification and detection of a target.
Spectral imaging is primarily conducted using scanning and snapshot imagers. Scanning spectral imagers employ point-scanning (wisk-broom) or line-scanning (push-broom), which acquire continuous one-dimensional (1D) or 2D measurements to produce 3D spectral data cubes [22,23]. However, its image acquisition can be slow because the scanning imagers are mechanically controlled [23].
In contrast, snapshot spectral imagers can create a spectral data cube in a single detector integration time by acquiring spatial and spectral data with one detector [24]. In addition, its structure is simpler than that of a spectral imager, because mechanical moving components are not installed internally. Moreover, the data acquisition speed and spatial resolution are relatively higher than those of spectral imaging. Although snapshot imaging provides high spatial resolution with high imaging speed, its spectral resolution and signal-to-noise ratio are lower than those of spectral imaging [25].
To overcome the limitations of snapshot imaging and improve system accuracy, partial least squares-discriminant analysis (PLS-DA) and least-squares support-vector machine (LS-SVM) models have been utilized in the field of plant disease monitoring and food quality and safety [21,26]. PLS-DA is a useful machine learning method for feature selection and data classification [27]. LS-SVM is a supervised learning method for recognizing patterns and quantitative predictions [28]. These methods enable to reveal the characteristic bands that represent the different chemical components in plants and select the feature wavelengths to design a robust and simple multispectral imaging system [29]. In addition, online monitoring applications for food quality can also be achieved using PLS-DA and LS-SVM techniques [21]. Therefore, PLS-DA and LS-SVM were selected to predict heat injury of Chinese cabbage.
Thus, PLS-DA and LS-SVM models for NDE of heat-stressed Chinese cabbage were verified in the present study, and their performance was evaluated by comparing vegetation indices (VIs) derived from SMI data. The VIs used were the normalized difference vegetation index (NDVI), red-edge ratio (RE/R), and photochemical reflectance index (PRI), because the productivity and vegetation vigor of heat-stressed leafy crops are directly related to the values of these indices [30,31,32]. Therefore, the major objective of this study was to investigate the potential of the Vis/NIR SMI system for heat stress screening during the growth of Chinese cabbage. The detailed objectives of this study were as follows:
  • Establish a Vis/NIR SMI system for spectral data (including hyper cubes) of Chinese cabbage under normal and heat stress conditions.
  • Identify growth parameters of Chinese cabbage grown under different temperature levels and acquire their spectral and VIs (NDVI, RE/R, and PRI) information.
  • Develop PLS-DA and LS-SVM models for distinguishing heat-stressed areas from Chinese cabbage leaves and compare their discriminant performance with obtained VIs to verify the developed model performance.
  • Provide pixel-based chemical images of heat-stress distribution in Chinese cabbage leaves using the newly developed models with an increase in heat stress intensity.

2. Materials and Methods

2.1. Sample Preparation

Chinese cabbage cultivar Chunkwang (Sakada Korea Seed Co., Seoul, Korea) were germinated in a plug tray (35 mL/cell), and the tray was filled with commercial soil (BioMedia, Seoul, Hungnong Seed Co.). After sowing, Chinese cabbages were transplanted into soil bins (1000 mm (length) × 620 mm (width) × 700 mm (height)) in a glasshouse at the National Institute of Horticultural and Herbal Science, Republic of Korea (35°16′ N, 127°02′ E, and 32 m altitude) and grown for 38 days (heading formation). The nutrient solution (Daeyu Co., Seoul, Korea) for cabbage seedlings was supplied every 3–4 days, and full irrigation was applied every day. Nitrogen, phosphorus pentoxide, and potassium oxide fertilizers were used in accordance with regional recommendations (0.0361 kg/m2 for N, 0.0263 kg/m2 for P2O5, and 0.009 kg/m2 for K2O) [33].
After transplantation, heat stress was applied to Chinese cabbages using an extreme-weather growth chamber (Modified Controlled Environment Extreme Weather Simulator, EGC Co., OH, USA) for 4 and 8 days. Slight leaf wilting of the Chinese cabbage appeared after 1 h of exposure at 38 °C, and this became more prominent after 6 to 12 h. There is no heat stress effect under 20 °C [34]. Therefore, although the initial heat stress began at approximately 38 °C, the temperature levels of the used chamber were set to 20 °C, 28 °C, and 36 °C for the development of the early screening technique. The 24 Chinese cabbage samples were used for each temperature level (20 °C, 28 °C, and 36 °C), respectively; the total number of measured Chinese cabbage samples was 72. The exposure period (4 and 8 h) of heat stress was also determined for the above reason. Hence, the three temperature levels were 20 °C/16°C, 28 °C/24 °C, and 36 °C/32 °C, respectively (12 h/12 h, day/night). The entire growth environment was controlled automatically using a commercial chamber. Finally, multispectral snapshot images and spectral data were acquired. After heat stress treatment, the growth parameters of Chinese cabbages grown at different temperatures (fresh weight, dry weight, leaf length, leaf width, number of leaves, and leaf area) were measured for heat stress evaluation.

2.2. Growth and Photosynthetic Parameters

To analyze the heat stress effects, the parameters and photosynthetic parameters obtained from Chinese cabbages grown at different temperature levels were shown in Table 1 and Table 2. The growth parameters are the average values of each sample group. And, the photosynthetic parameters of Chinese cabbage samples during heat stress are maximum Rubisco carboxylation efficiency, electron transport for the given light intensity, and maximum rate of trios phosphate use. The Bonferroni correction test was conducted to identify the differences of growth parameters among each temperature group.

2.3. Vis/NIR SMI System

The major components of the newly developed SMI system were an SMI camera (OCI-D2000; Bayspec Inc., San Jose, CA, USA) with 38 wavelengths, a spectral range of 462–870 nm with a full width at half maximum spectral resolution between 12–15 nm, an objective lens (focal length 35 mm), 10 halogen light bulbs (41,870 WFL 12 V 50 W MR16; Osram, Munich, Germany) for illumination, and commercial software provided by Bayspec Inc., which is intended for pixel image acquisition. The SMI camera consists of two cameras, one camera can measure a wavelength range of 462 nm–623 nm, and the other camera can measure a wavelength range of 631 nm–870 nm. The system is illustrated in Figure 1.
The total number of image pixels in the SMI camera was 2048 × 1088 pixels. Halogen lamps were selected because they emit a continuous spectrum of light from near-ultraviolet to deep infrared. Cooling fans were installed at the end of the halogen lamps for ventilation because of the high radiant energy produced by the illumination during the imaging process. When taking the sample images, the exposure time was optimized using the auto exposure time function provided by commercial software (BaySpec SpecFrabber; BaySpec Inc., CA, USA) to avoid saturation of the pixel intensity. The commercial software acquired the spectral data of sample images in the form of a 3D spectral data cube consisting of two spatial dimensions (x- and y-directions) and a single spectral (λ) dimension. The dimensions of the spectral data cube were 400 pixels in the x-direction, 200 pixels in the y-direction, and 38 bands (wavelength) in the λ-direction. The number of visible and NIR bands used was 16 and 22, respectively. In addition, sample images were acquired every four days to analyze the heat stress damage during growth.

2.4. VI Selection

The measured Vis/NIR spectral reflectance data from leafy vegetables can be used as VIs [35]. In the Vis/NIR region, because photosynthetic pigments of leafy plants, such as chlorophyll a, b, and carotenoids, convert light energy to chemical energy in the blue and red regions (450–470 nm and 660 nm), they are known as crucial indicators representing vegetation vigor and growth of agricultural crops [36,37]. The main multispectral bands used for VI analysis of agricultural crops are blue (450–510 nm), green (510–580 nm), red (630–690 nm), and NIR (770–895 nm) [38]. Therefore, VIs created using Vis/NIR spectral and/or imaging data can provide valuable phenotyping features and vegetation properties, such as the spatial distribution of vegetation [39], drought and water stress monitoring [30], forecasting crop yield [30], and precision farming applications [40].
Among the various VIs, NDVI, RE/R, and PRI were calculated from sample images. As the reflective spectra of leafy crops vary with environmental conditions, NDVI, RE/R, and PRI are the major indicators representing the productivity and vegetation vigor of agricultural crops [30,31,32].
NDVI is primarily used to quantify vegetation greenness and retrieve the biophysical characteristics of vegetation by measuring the difference between NIR (which vegetation strongly reflects) and red regions (which vegetation absorbs) [41]. RE/R, which includes data from the red edge and red bands (700–740 nm), is also an effective indicator of the chlorophyll content in agricultural crops [32] and is known to increase the sensitivity of biomass estimation in moderate to high vegetation [32]. Moreover, RE/R values can be affected by moisture deficit stress, heat stress, and changes in various environmental factors [42,43]. The PRI has been widely used as an indicator of photosynthetic efficiency in leafy plants [31].
Therefore, these calculated VIs were used to analyze the discriminant performance of the newly developed PLS-DA and LS-SVM models. To accomplish this, multiple comparison analysis (MCA) and Bonferroni correction were used based on the spectral information obtained from Chinese cabbage grown at different temperatures. These methods allow comparison of the calculated values of VIs with PLS-DA results and correct errors that may occur in multiple comparisons. For detailed information about the MCA and Bonferroni correction, readers can refer to the following articles [44,45].

2.5. Chemometric Models

In this study, two chemometric models (PLS-DA and LS-SVM) were developed for the NDE of heat-stress in Chinese cabbage. PLS-DA can resolve the multicollinearity problem [17].
It has been extensively used for the assessment of various food quality attributes owing to its simplicity and high accuracy and has been proven to be a predictive and descriptive modeling method for the feature classification of agricultural food [20,46,47]. Therefore, in this study, a PLS-DA model was built to evaluate the heat-stressed areas of Chinese cabbage.
To construct the PLS-DA model, the obtained SMI spectral data from heat-stressed Chinese cabbage samples were arranged in the independent variable matrices, while the dependent variable matrices were categorized and composed of given artificial values of “1” for 20 °C heat-stressed Chinese cabbage, “2” for 28 °C heat-stressed Chinese cabbage, and “3” for 36 °C heat-stressed Chinese cabbage samples. To classify each group of kernels into its assigned value, threshold values of “2” and “3” were set among three groups to classify them from each other. To accomplish this, the entire spectral data (3000 spectra) obtained from 72 Chinese cabbage samples (12 samples for three heat-stress levels on days 4 and 8) were divided into two subsets: calibration group (2100 spectra, containing 70% of the total data) and validation group (900 spectra, containing 30% of the total data). The calibration group was used to develop the PLS-DA model, and the validation group was used to verify the actual predictive performance of the developed model. The full cross-validation method was applied in this study to avoid overfitting.
The LS-SVM method can perform nonlinear discrimination and quantitative predictions by optimizing the separation of spectral matrices, which minimizes the misclassification rate for different groups [17,48]. In addition, this method has been utilized for NDE in food quality and safety monitoring [17,21,49]. This study aimed to analyze the feasibility of both models to derive accurate and robust calibration models for the prediction of heat-stressed leaves of Chinese cabbage during its growth. Unlike the PLS-DA model, the LS-SVM method can solve non-linear problems and optimize the separation of hyperspectral matrices to minimize the misclassification problems in each group [48,50]. By comparing the performance of both models, the linear and non-linear features of each heat-stress level can be compared and analyzed.

2.6. Evaluation of Classification Models

The classification performances of the PLS-DA and LS-SVM models were evaluated by comparing various VIs in terms of prediction accuracy and model robustness. Before the classification, the Chinese cabbage samples were coded as belonging to one of six groups based different temperature levels on days 4 and 8:24 samples grown at 20 °C and 28 °C on day 4 (Group A); 24 samples grown at 28 °C and 36 °C on day 4 (Group B); 24 samples grown at 20 °C and 36 °C on day 4 (Group C); 24 samples grown at 20 °C and 28 °C on day 8 (Group D); 24 samples grown at 28 °C and 36 °C on day 8 (Group E); and 24 samples grown at 20 °C and 36 °C on day 8 (Group F). The classification accuracies of each group were obtained from the spectral data. The total number of spectra used was 500 for each temperature level from 38 wavelengths. This was derived using the following equation [51].
Accuracy   ( % ) = Correctly   classified   samples Total   samples   × 100

2.7. Spectral Calibration

Before analyzing the obtained multispectral images, spectral calibration was performed to assign wavelengths to the spectral information pixels to obtain the relative reflectance of the sample images. To accomplish this, dark and white reference images were used to remove the dark current noise generated by the charged-coupled device sensor of the camera and to prevent light saturation with high intensity [52]. This step can enhance the reliability and acceptability of the spectral data of multispectral image information and its systems [53].
A dark reference image (0% reflectance) was acquired by covering the opaque cap, and a white Teflon plate was used to acquire the white reference image (99% reflectance) [49]. The reflectance values were calculated based on the raw reference data according to the following equation [54].
I R = I r I b I w I b
where IR is the relative reflectance image and Ir, Iw, and Ib are the scanned Chinese cabbage images, white reference images, and black reference images, respectively. The spatial step size was set to 0.3 s and 0.5 mm.

2.8. Visualization of Heat Stress

Spectral imaging can produce pixel-based chemical images based on the spatial distribution of the chemical components in a target sample [20,53]. To obtain the final image after the spectral calibration process, a region of interest (ROI) selection step was performed to identify the target by removing unnecessary background pixels from the calibrated images.
Because of the leaf geometry, intensity variation of diffusely reflected radiation in ROI was produced by the following factors: (a) the difference in distance between the leaf surface and the used camera focal plane, (b) irregular illumination intensity across the surface of the leaf, and (c) the angular orientation of the leaf surface concerning the lens axis [55]. Among these factors, factor (b) could be considered negligible by using a stable light source and referencing the ROI pixel intensity of Chinese cabbage from white reference material. Hence, the intensity variation in ROI was mainly affected by the factor (a) and (c). To reduce this shading effect, both factors (a) and (c) can be resolved by spectral normalization and simplification by considering a three-dimensional target as a flattened object. In the current study, spectral normalization was conducted. Nevertheless, the resultant spectra was not statistically significant with the raw ROI data. Therefore, the target sample pixels and spectra of the ROI were then obtained and analyzed [56]. Visualization was then performed on the calibrated images by applying both models.
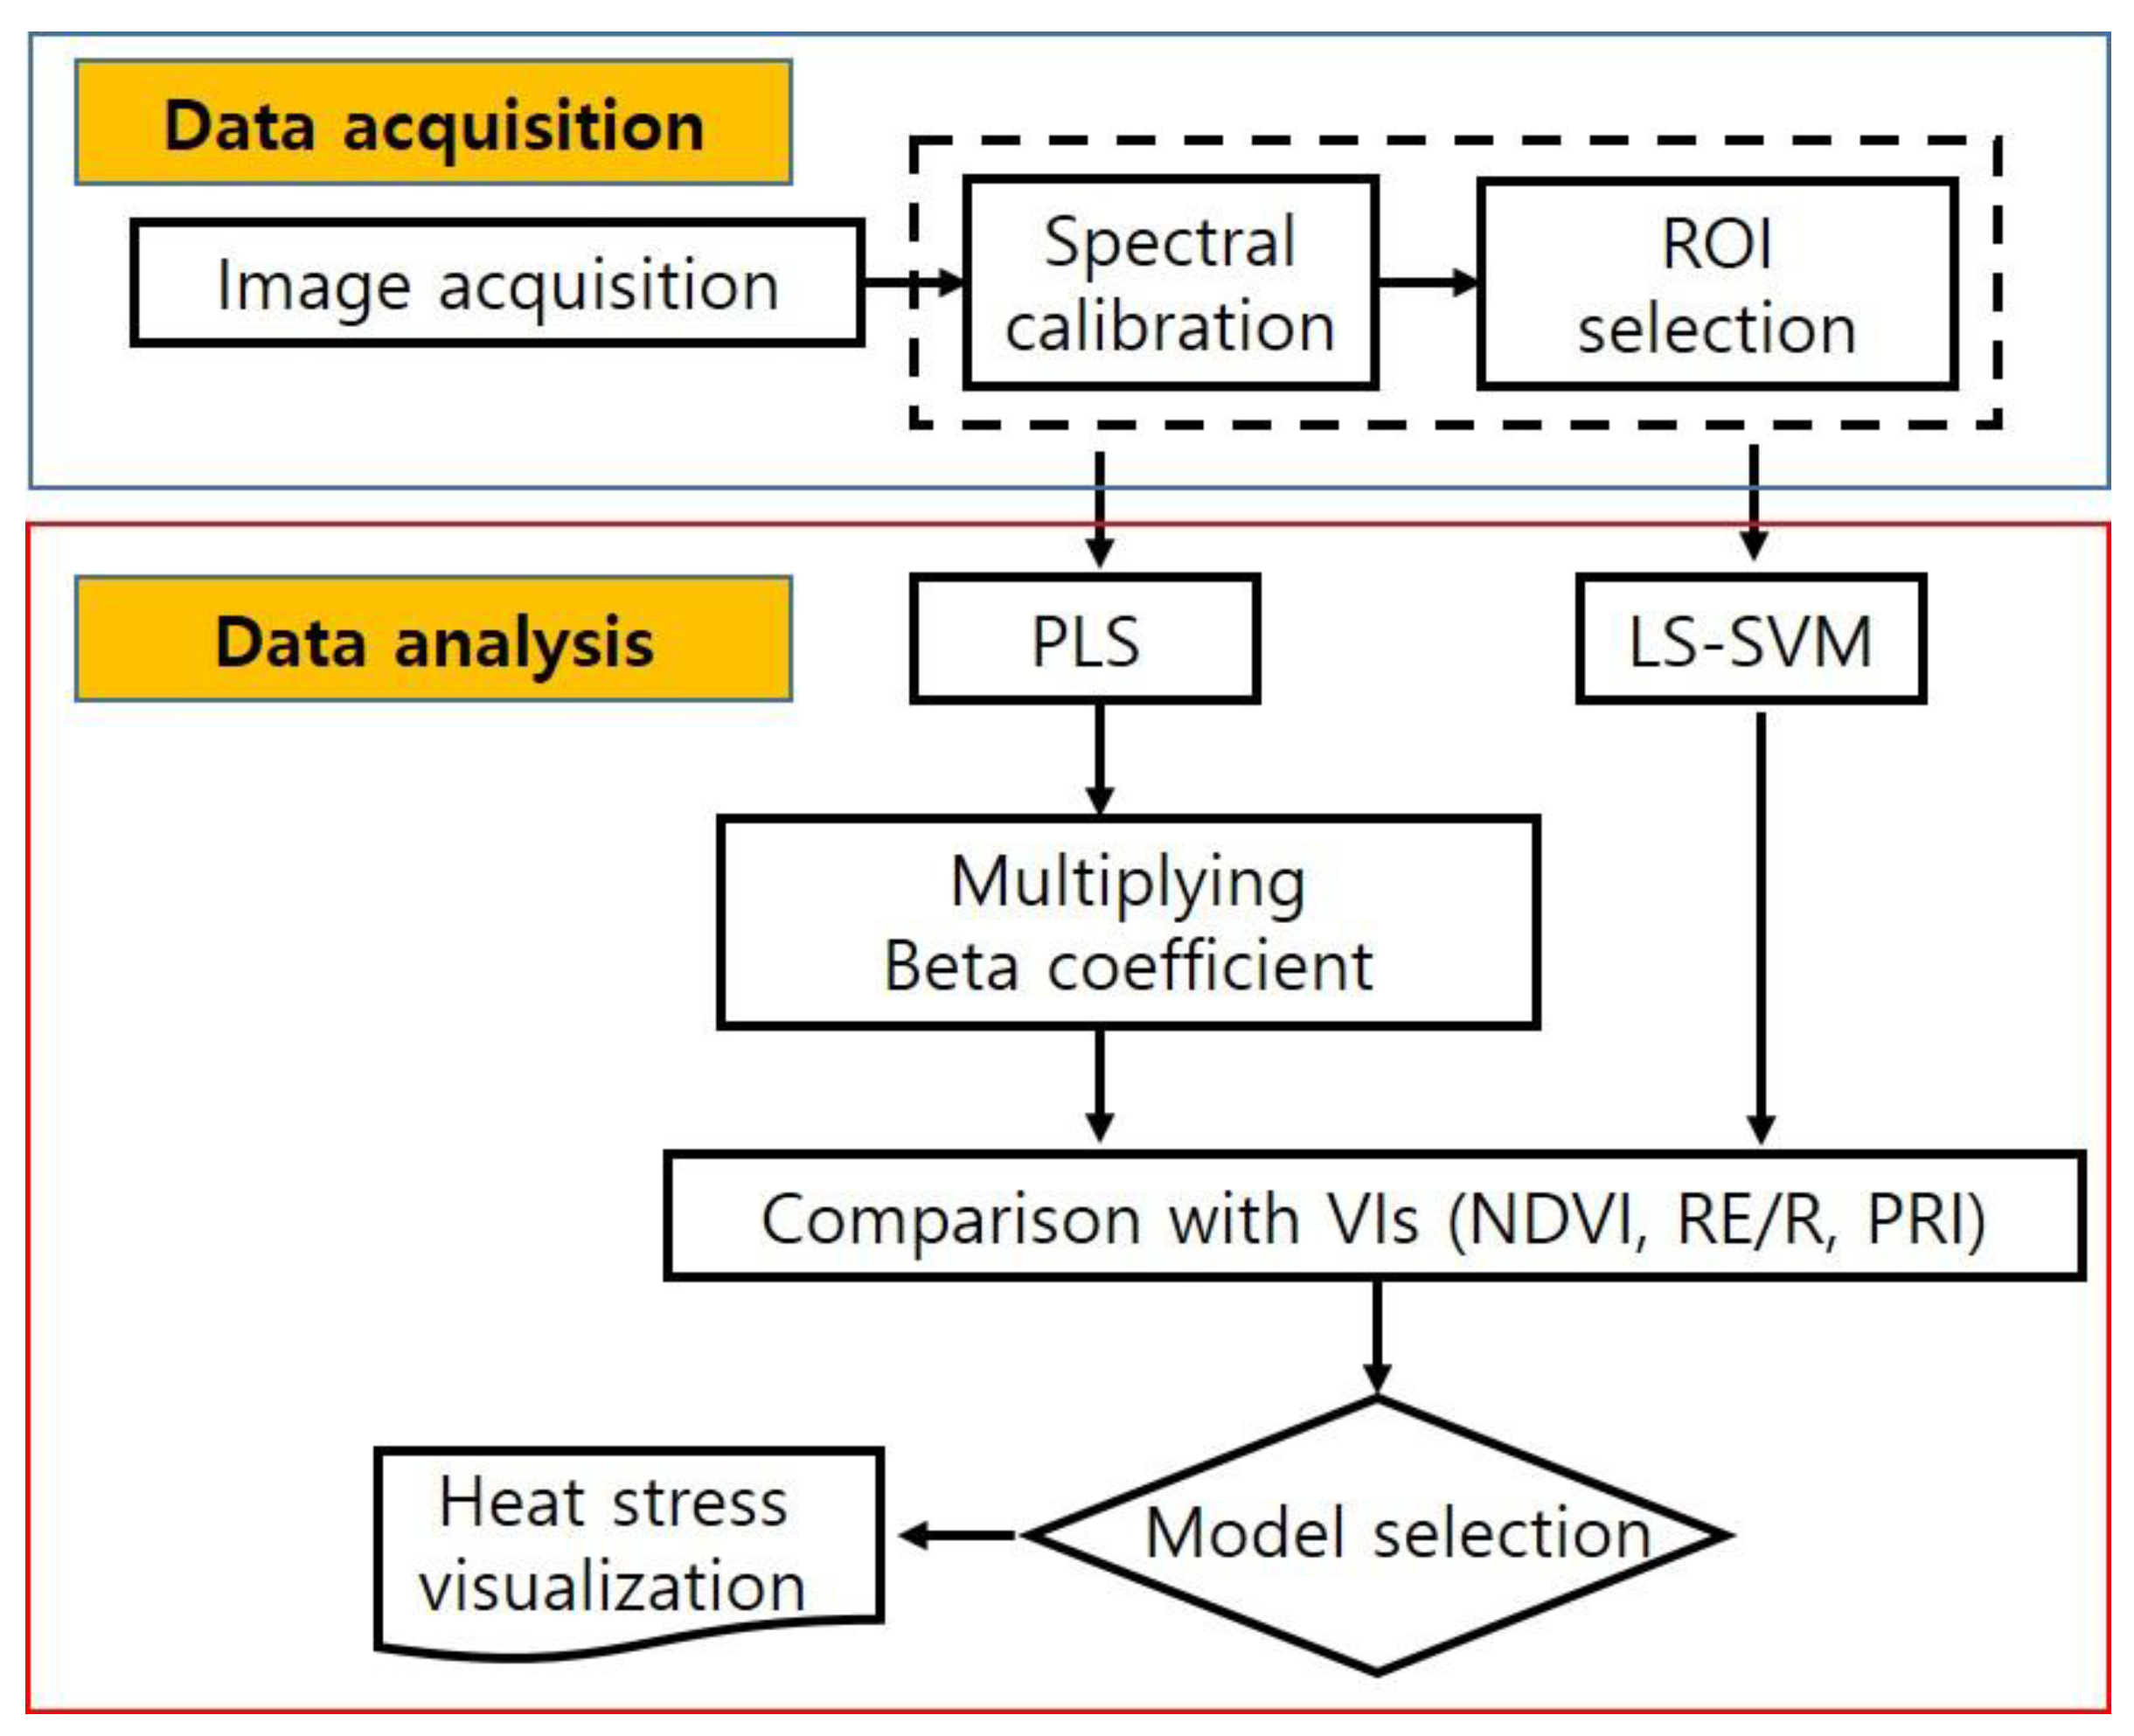
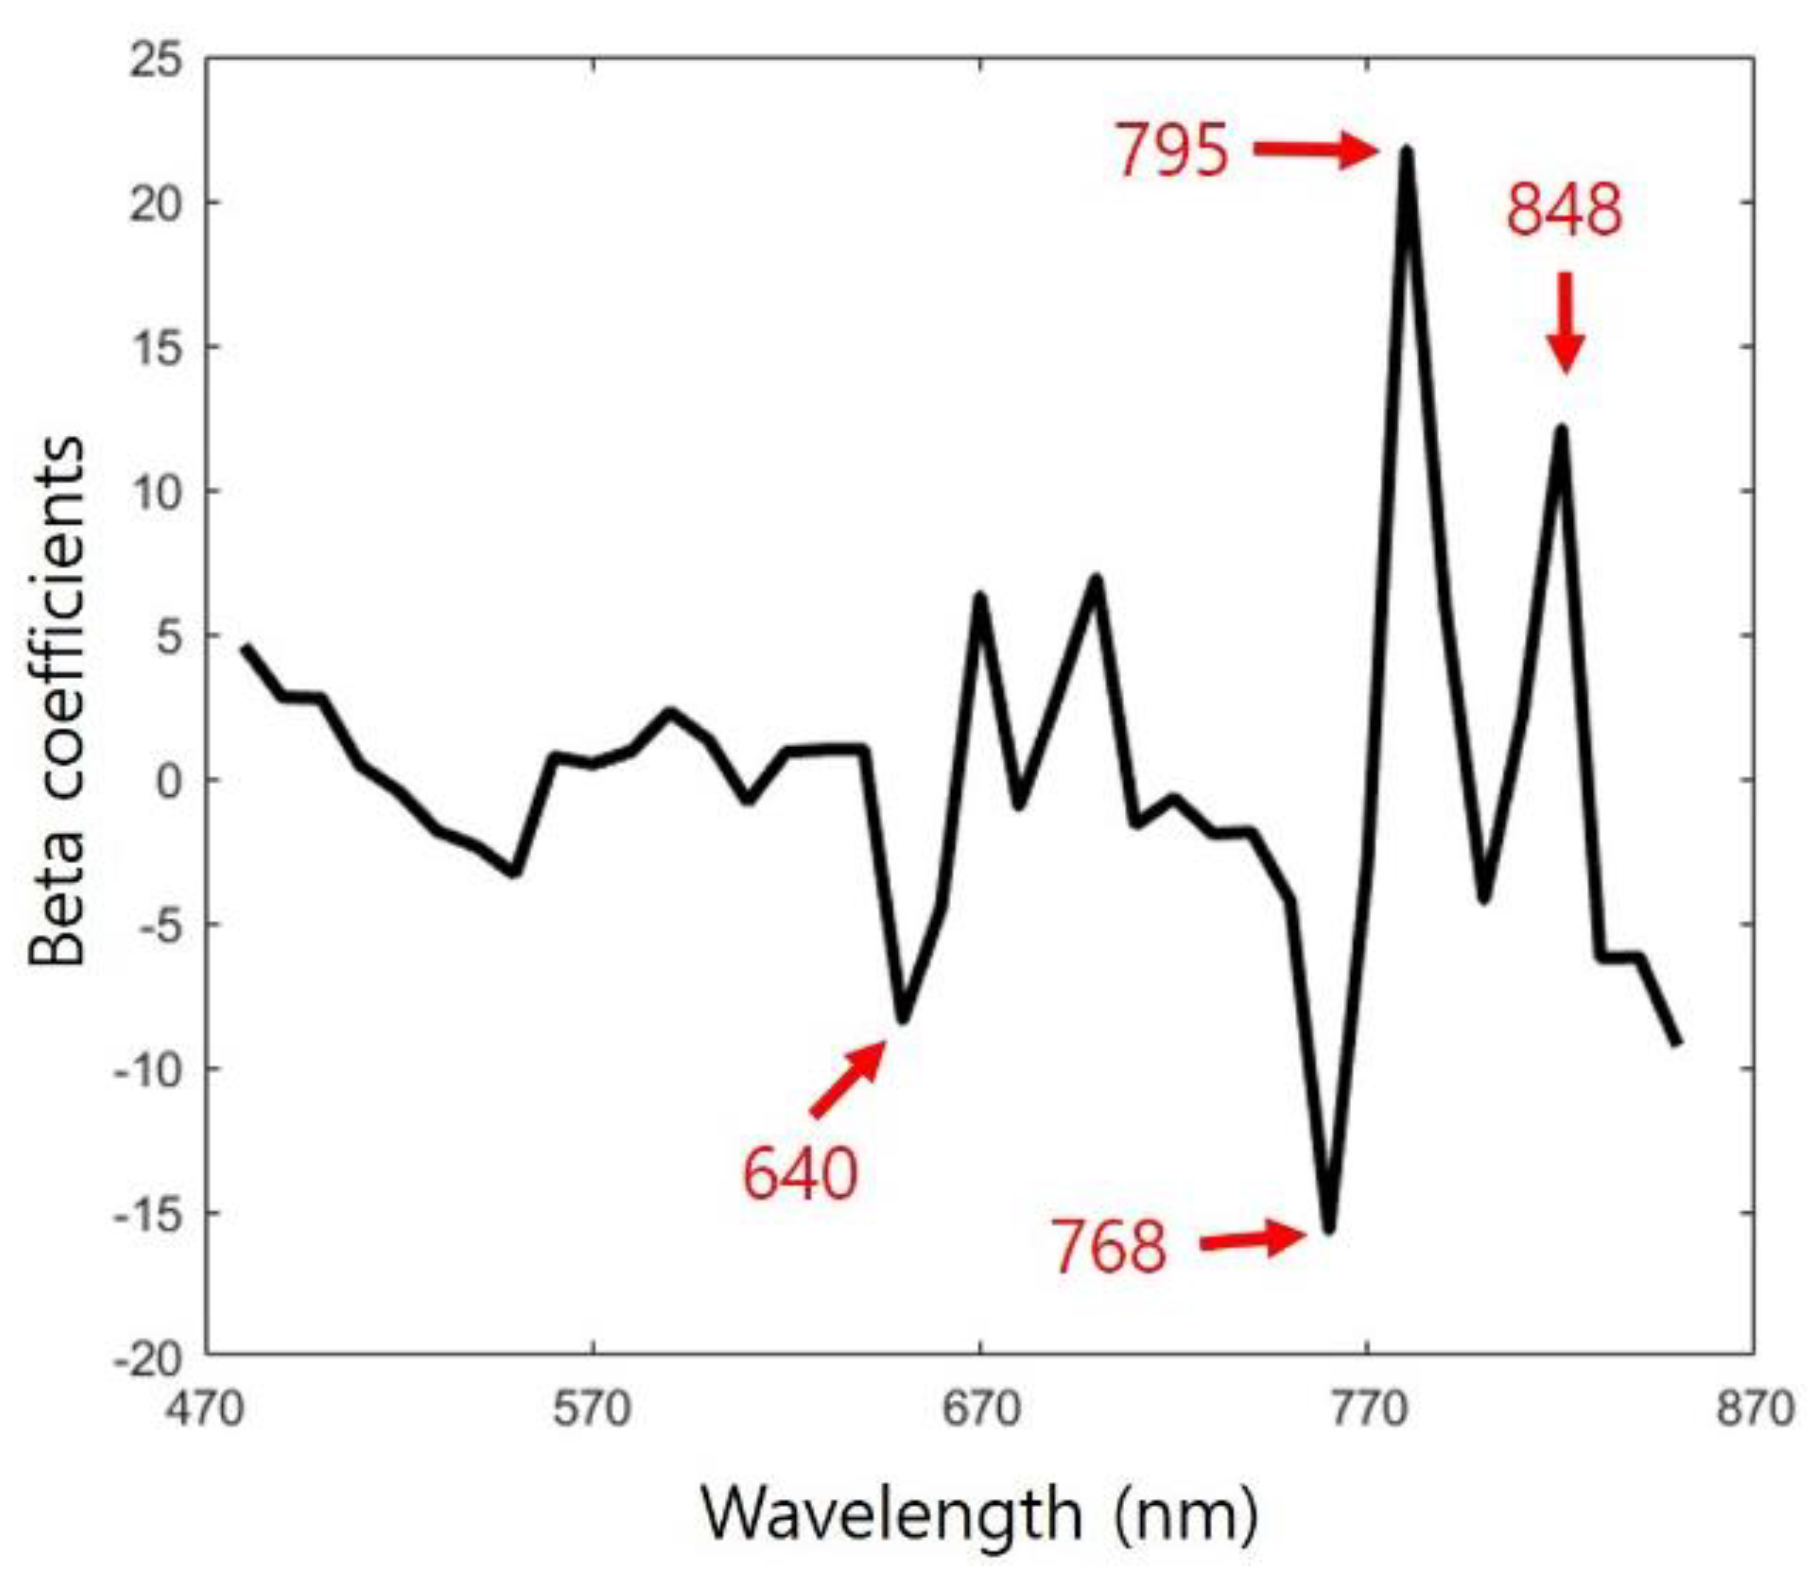
The PLS-DA model includes an additional step in creating the resultant images. The beta coefficient can explain the direction of the relationship between the predictor and criterion variables. It measures the extent to which each predictor variable affects the dependent variables [20]. The higher the peaks of the absolute beta coefficient values of the PLS-DA model, the greater the effect on model performance [19]. Therefore, visualization mapping of the sample images was accomplished by multiplying the beta coefficients on each pixel of the calibrated images. Spectral calibration, pixel mapping, data analysis, camera control, and model development were performed using Matlab software (R2021a; MathWorks Inc., Natick, MA, USA). Figure 2 shows a conceptual diagram of the SMI data-processing workflow used in this study.

3. Results

3.1. Acquried Spectra

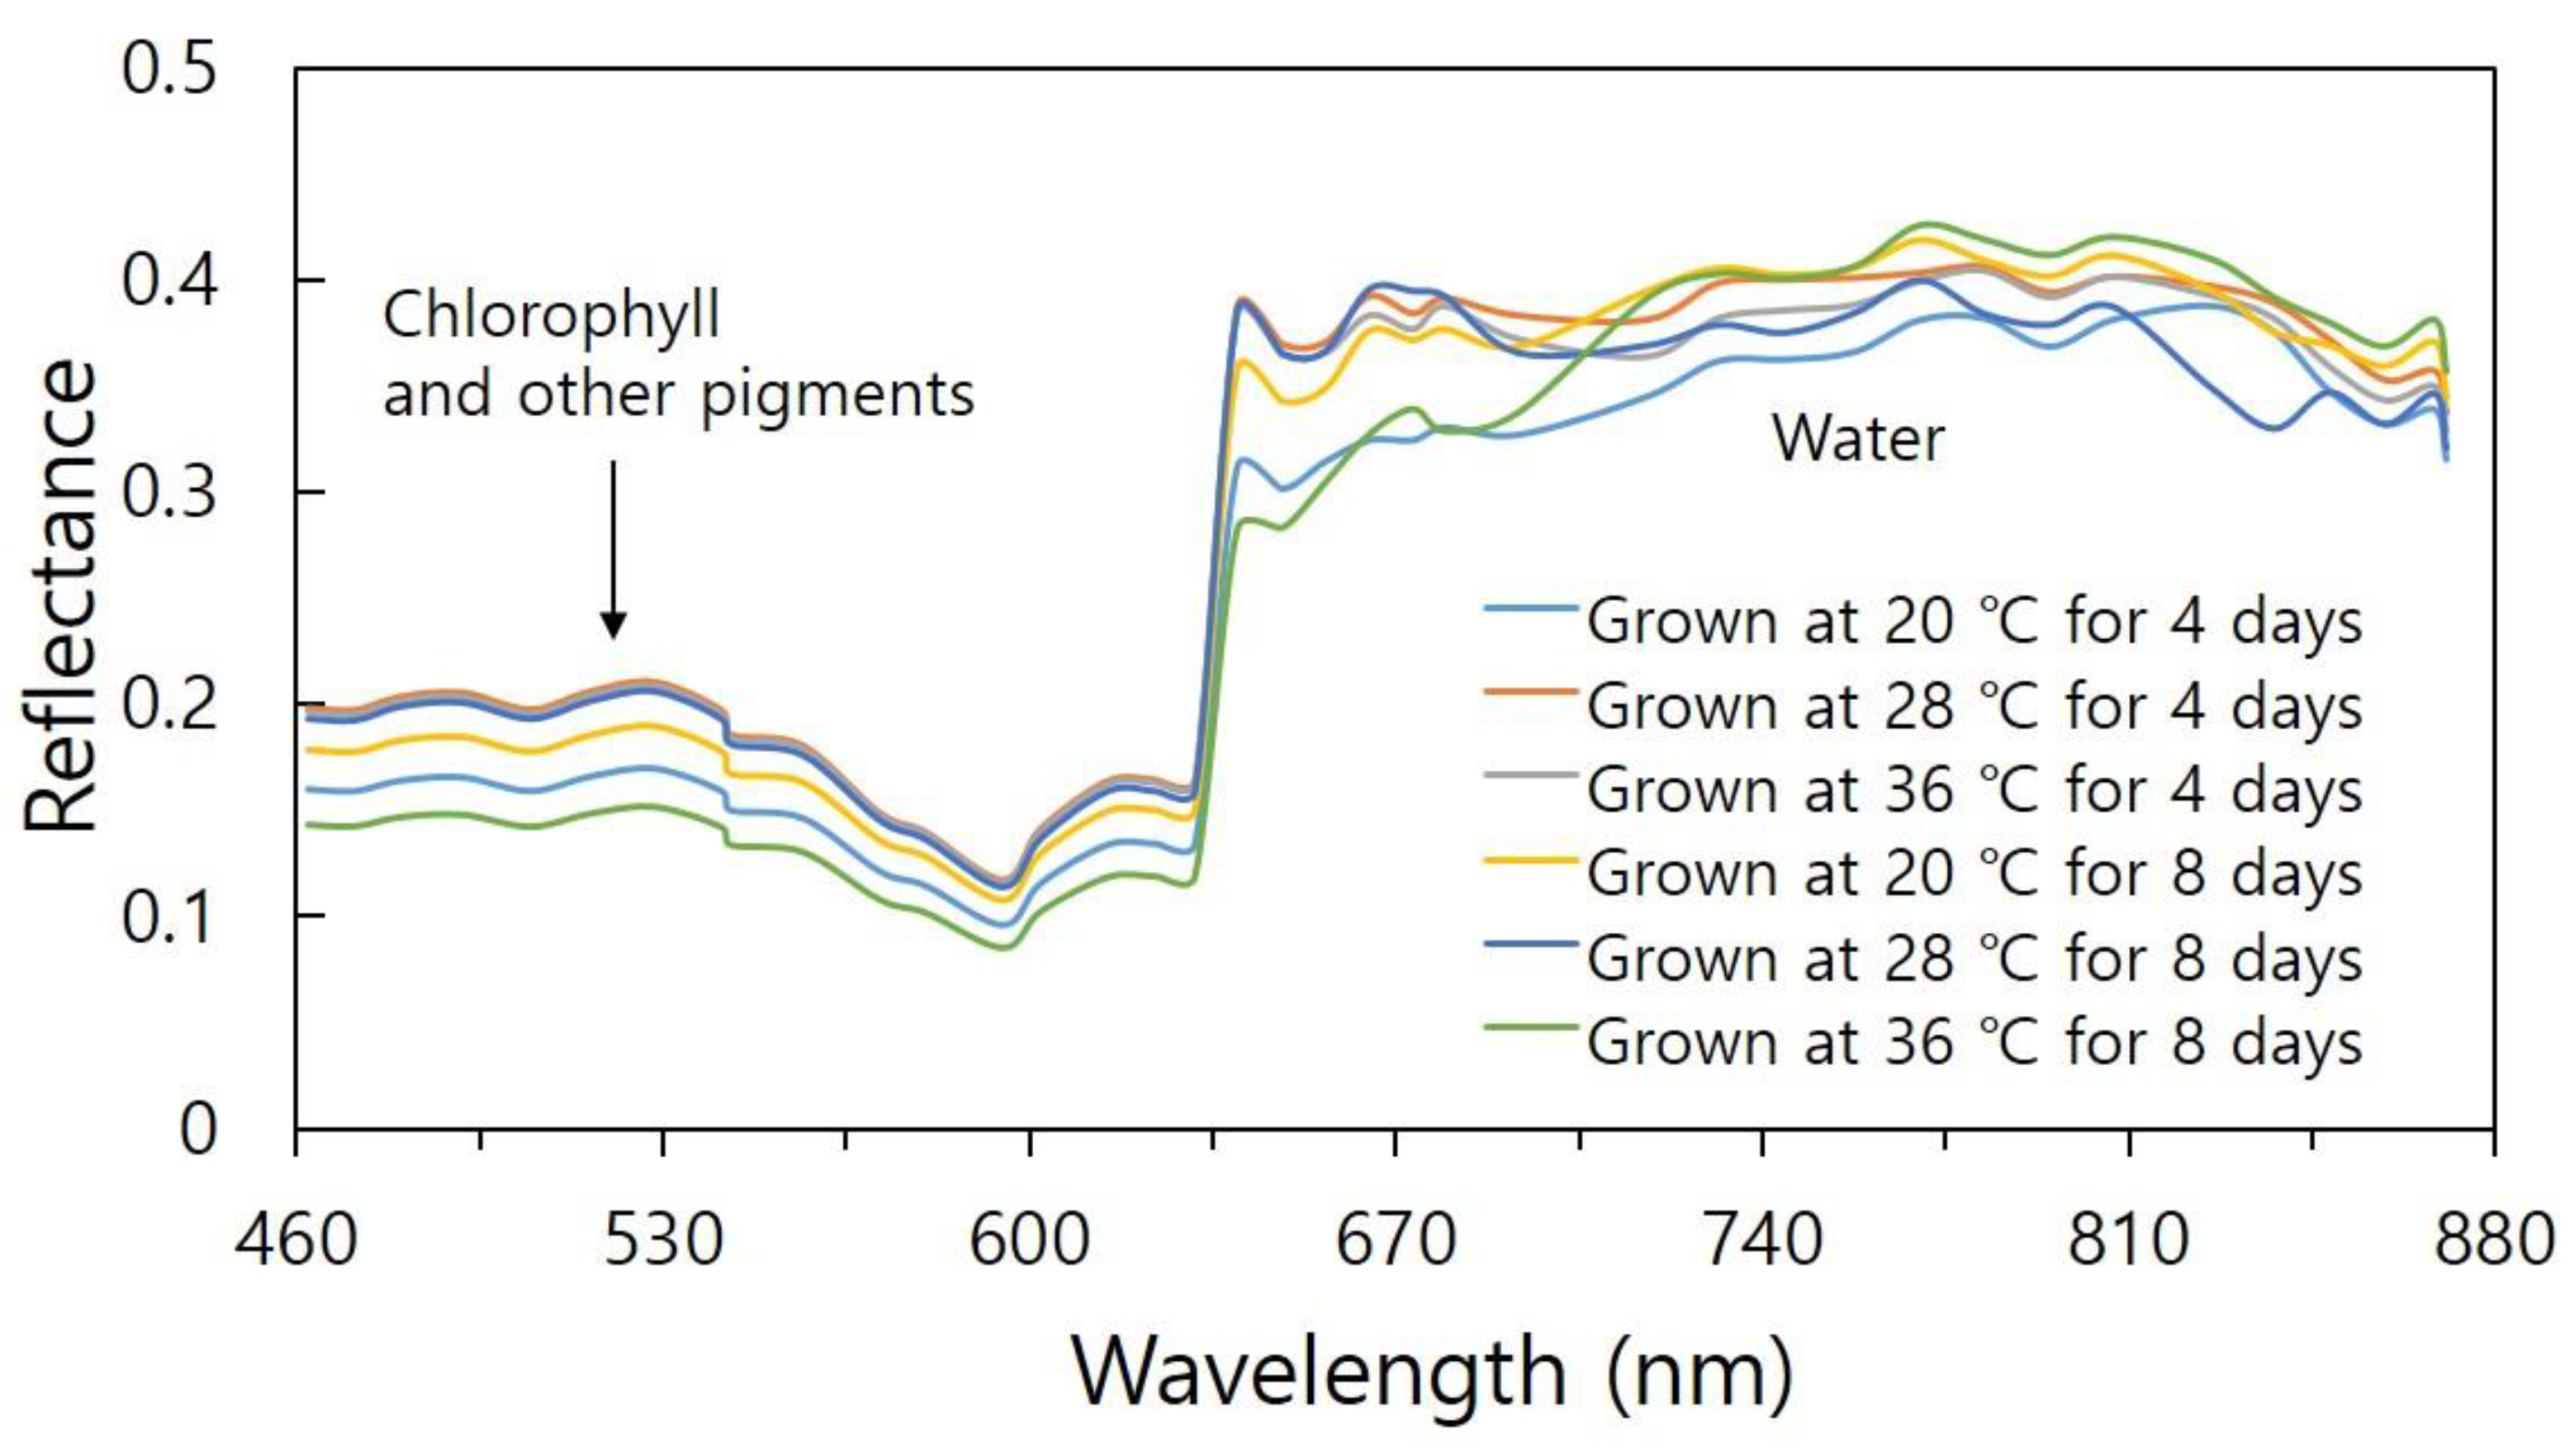
Figure 3 shows the Vis/NIR reflectance spectra acquired from the sample images of Chinese cabbage samples under the different heat stress levels (20, 28, and 36 °C) during 4 and 8 days. Based on the spectral information extracted from Vis/NIR spectral images, it was difficult to find significant changes in Chinese cabbage grown under different temperature conditions using specific wavelengths.

3.2. Discriminant Performance of VIs

The calculated NDVI, RE/R, and PRI values on days 4 and 8 are shown in Table 3. MCA values were used to distinguish each temperature level. The average, standard deviation, and MCA results of the NDVI acquired from Chinese cabbage were obtained at the different temperature levels (20 °C, 28 °C, and 36 °C). On day 4, the NDVI values in Group 1 differed from those in Groups 2 and 3, and Group 2 showed larger deviation values than those of the other groups. In the MCA results, Group 2 was clearly distinguished from the other two groups.
In the RE/R values on day 4, based on the MCA results, Groups 1 and 2 were distinguished from Group 3, and the standard deviation values of Group 1 were much larger than those of the others. This indicates that the absorption efficiency of the chlorophyll content of Groups 1 and 2 was better than that of Group 3. Group 3 had the highest RE/R value on day 4. However, on day 8, there was no difference in the RE/R values, and none of the groups could be classified by the MCA outcome.
The PRI values on days 4 and 8 were almost the same, and their deviations were also almost the same (approximately 0.1). This is different from the NDVI and RE/R outcomes. In addition, the temperature levels could not be classified on days 4 and 8.

3.3. Discriminant Performance of All Models

The spectral data of the different temperature levels were used to evaluate the discriminant accuracy of the developed PLS-DA, LS-SVM, and VI models. Table 4 highlights the classification accuracy of NDVI, RE/R, PRI, PLS-DA, and LS-SVM based on spectral data acquired from the different sample groups. In Table 4, among the five models, the LS-SVM model showed the highest accuracy on both days 4 and 8.

3.4. Heat Stress Visualization

Pixel-based chemical images with increasing temperature were acquired to visualize the spatial distribution of heat stress in Chinese cabbage samples. As mentioned above, using the spectral data acquired from the Chinese cabbages grown for four and eight days under different temperature levels, the beta coefficients of the developed PLS model were obtained and are shown in Figure 4.
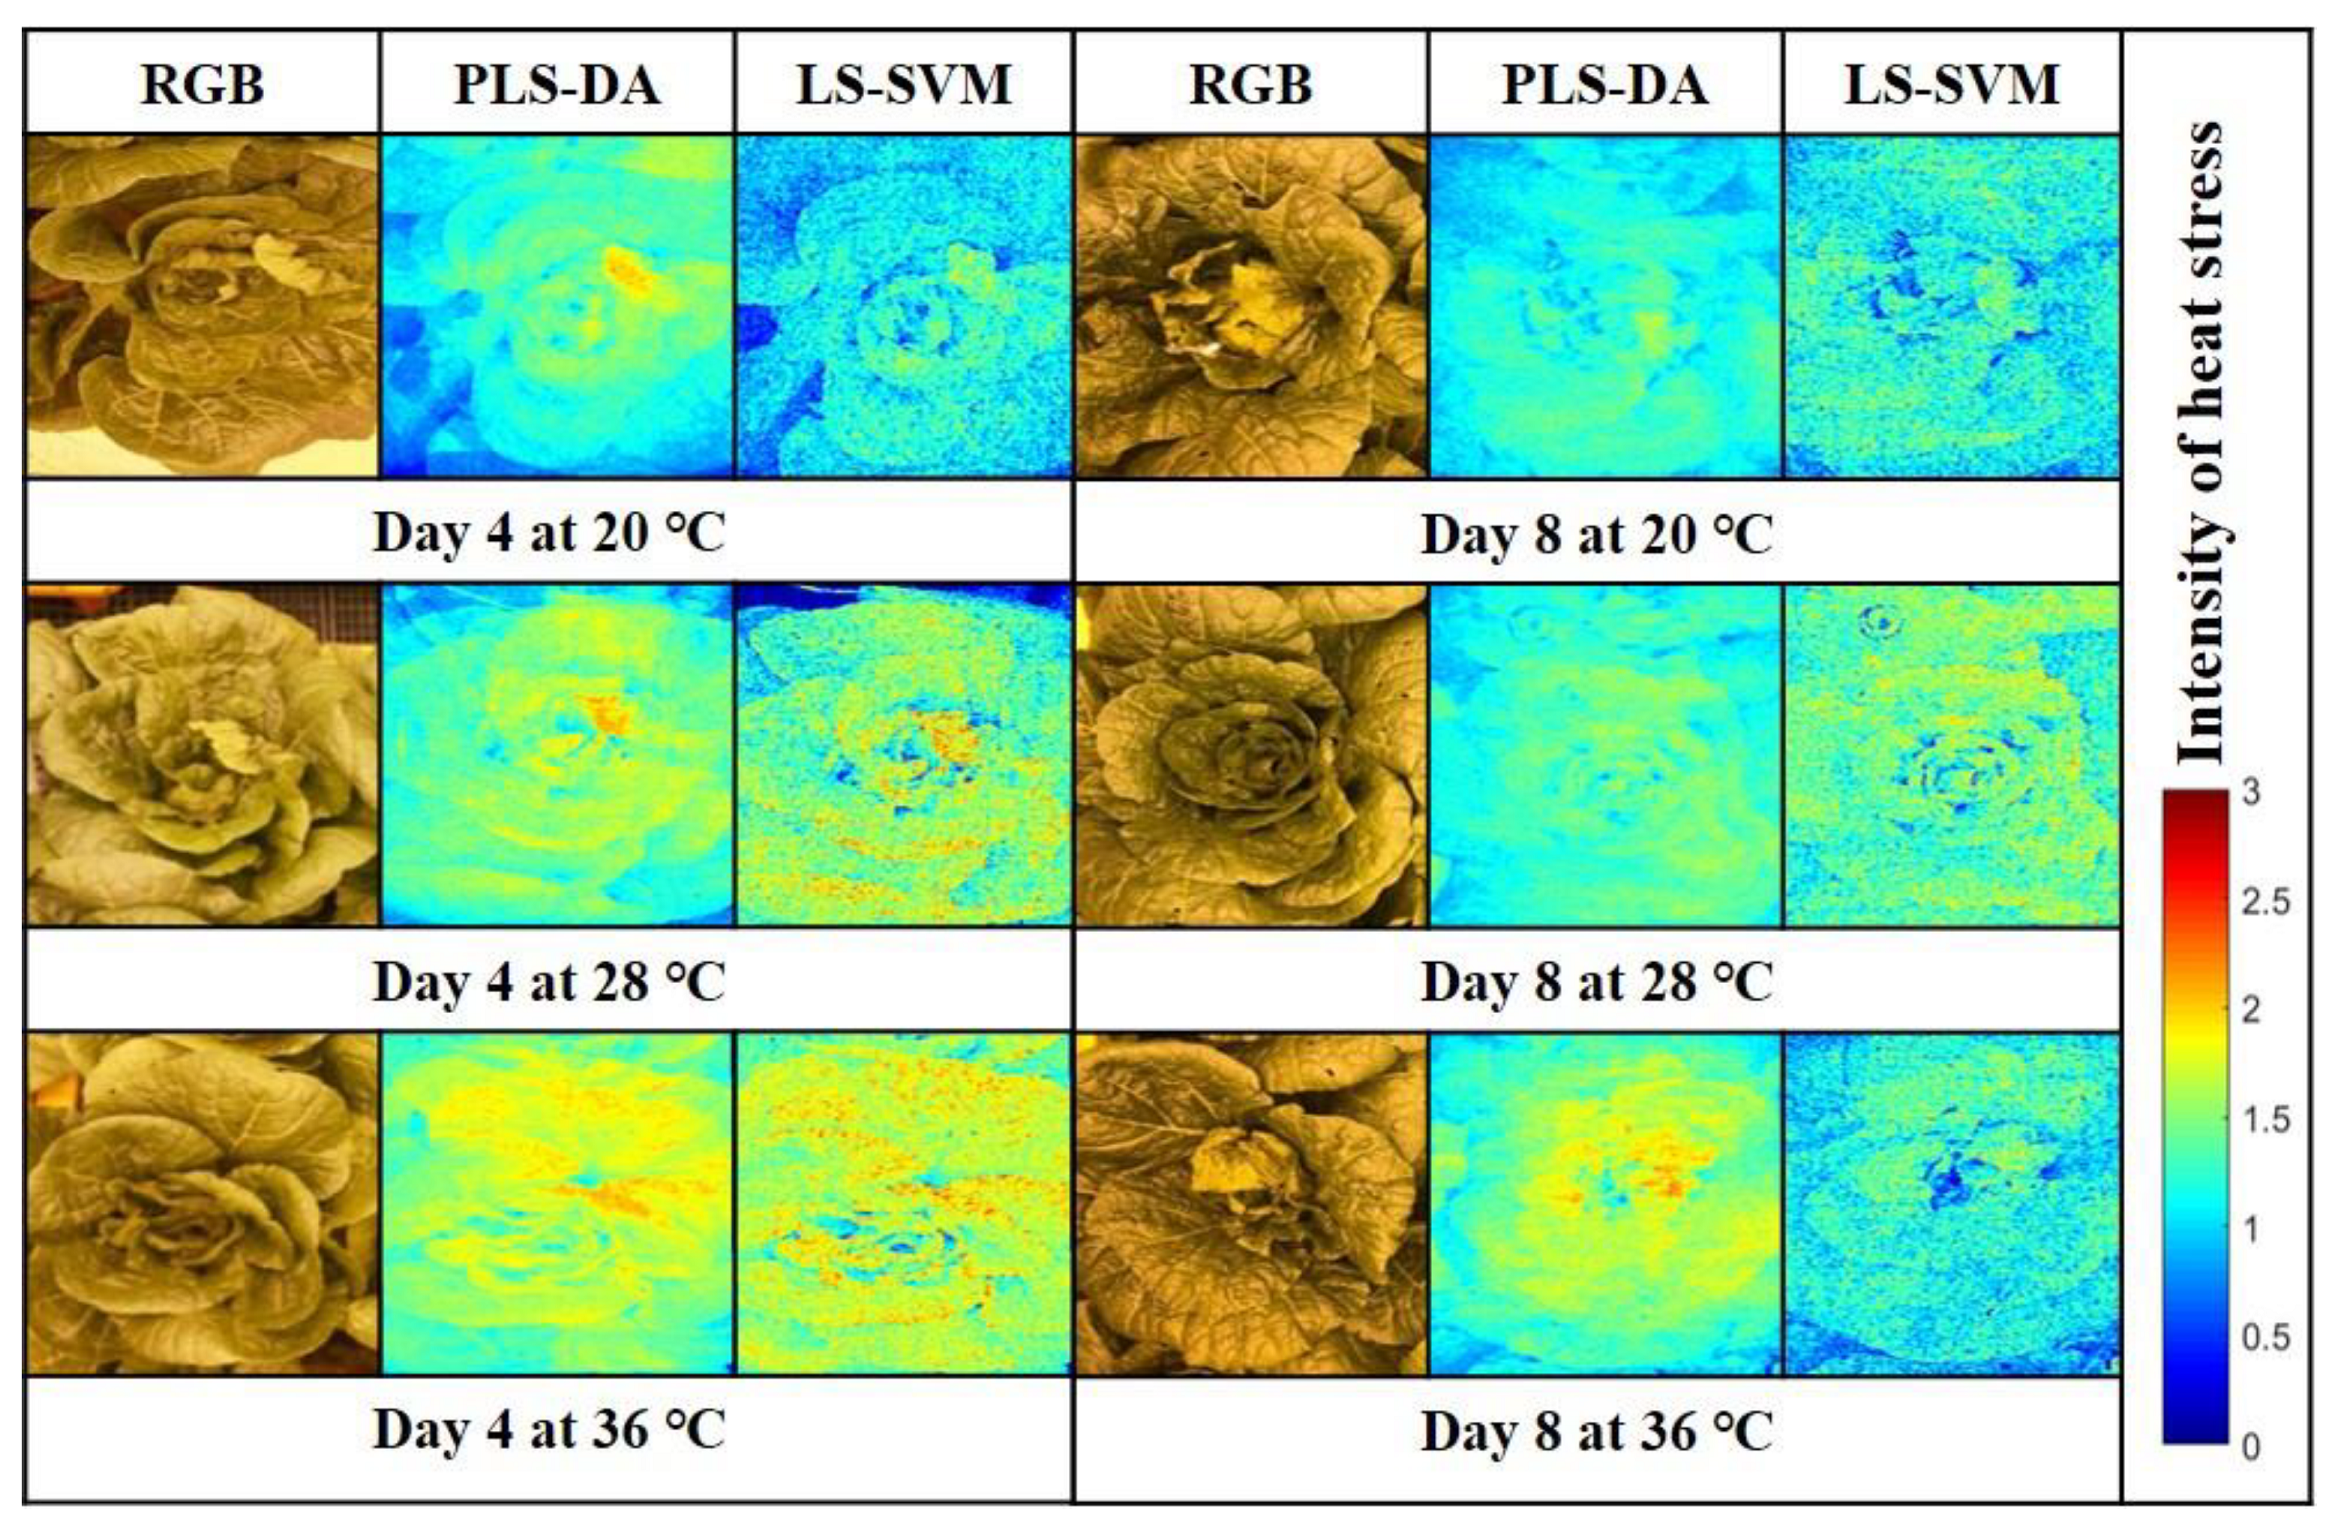
Figure 5 shows the red, green, and blue (RGB), PLS-DA, and LS-SVM images of the Chinese cabbage samples grown at 20 °C, 28 °C, and 36 °C for four and eight days. The total pixel number of the PLS-DA and LS-SVM models was 400 × 200 pixels in size. With increasing temperature, more pixels gradually changed from blue to red, and the color change index is described in the color bar.

4. Discussion

4.1. Spectral Analysis

Spectral analysis can provide material information related to the chemical composition and physical properties. The Vis/NIR reflectance of plants is mainly characterized by the absorption (or reflection) of leaf pigments, such as chlorophyll, carotenoids, water, proteins, starches, waxes, and structural biochemical molecules [57]. The spectral plot in Figure 3 shows a typical reflectance of plants [58]. Hence, in the current study, to distinguish Chinese cabbages grown at different temperatures, it was necessary to develop VI, PLS-DA, and LS-SVM models.

4.2. Growth Parameter Analysis

As shown in Table 1, all growth parameters decreased with an increase in temperature. And, both the fresh and dry weights were reduced by approximately 10%. The number of the leaves also shows statistically significant results. In Table 2, the values of Vcmax, Jmax, and TPU gradually decreased during the heat stress. These values describe the photosynthetic characteristics of the Chinese cabbage samples. Moreover, based on the Bonferroni correction test, they could be distinguished into different groups each other. This indicates that the photosynthetic efficiency of Chinese cabbage decreased by heat stress. Therefore, heat treatment affects plant growth, heading formation, and development.
The outcomes indicate that, although the NDVI values were not able to classify the two heat-stressed groups, the MCA method could distinguish Group 1 from the other groups. The NDVI values on day 8 were similar to those on day 4. As cited above, leaf wilting appears at 38 °C. The wilting leaves fade to yellow, brown, and even die. As spectral imaging is based on pixel information, the NDVI values are affected by leaf color. However, the MCA values of Group 6 were significantly different from those of the other groups. Under various environmental stresses, including heat stress, plants constantly survive by changing their metabolism [59]. Therefore, the Chinese cabbages grown at 20 °C and 28 °C might have adapted to the new environment.
In the RE/R result, most VIs have no direct relationship with photosynthetic function beyond their sensitivity to pigment concentration changes, and some VIs are not sensitive to drastic changes in plant photosynthetic status caused by common environmental stressors [39]. Therefore, the used RE/R might be relatively less sensitive to the early stage of heat stress, or Chinese cabbages might adapt to the high-temperature environment.
From the PRI outcome, the heat stress can damage the photosynthetic machinery, causing plants to produce stress signals that protect them. Heat-induced photosynthetic reactions in leafy crops can be the outcome of intricate interactions between photosynthetic damage, plant signal processes, and adaptive changes [60]. Based on the above report, PRI values can be a useful tool for revealing plant photosynthetic changes (stress change). However, their efficiency is closely related to other environmental conditions. Modified PRIs have been applied in heat stress analysis to reveal photosynthetic changes in plants [61]. Therefore, the PRI used was not effective in identifying the early stages of heat-stressed Chinese cabbage.

4.3. Discriminant Performance Analysis

The result demonstrates that classification performance using a nonlinear hyperplane was more effective for spectral analysis of Chinese cabbage than using NDVI, RE/R, PRI, and PLS-DA. In addition, the classification accuracy of Group B was higher than that of Group A, and the classification accuracy of Group C was higher than that of Group B. This phenomenon suggests that, as the temperature increases, the discriminant performance of the LS-SVM might increase. In contrast, the NDVI, RE/R, and PRI results showed much lower accuracy than the PLS-DA and LS-SVM models.
The above analysis can also be applied to the results of day 8. The outcome of the model discrimination performance on day 8 was similar to that on day 4. This is because all wavelengths (a total of 38) were used to develop the PLS-DA and LS-SVM models, while only two or three wavelengths were used for the VI models [56,62]. Based on the above analysis, it seems that the classification accuracy of the chemometric models might be much higher than that of the VI models for the early screening of heat stress during the growth of Chinese cabbage.

4.4. Heat Stress Visualization

As shown in Figure 5, it is difficult to recognize the heat-stressed parts in the RGB images. However, the heat-stressed area could be visualized in both the model images. As the discriminant accuracies of the two models were almost the same, their color distribution patterns were also similar. Despite the above outcome (similarity), the model images clearly demonstrated that the resultant images allow improved interpretation of the chemical dynamics and distribution patterns for early detection of heat stress.
To improve model performance and remove unwanted random noise generated from electrical instruments, various preprocessing methods such as the standard normal variate, normalization, smoothing, multiplicative scatter correction, and Savitzky–Golay first and second derivative can be applied to PLS-DA and LS-SVM models [17,19]. In the current study, although preprocessing methods were not used for the two models, their classification accuracy was acceptable (over 92%). Hence, applying and finding appropriate preprocessing methods is suggested to establish more accurate and robust models in the future.
Despite the significant advantages of HSI technologies for agricultural NDE, there are still some difficulties with its field application due to its high cost, complexity, and inability to perform a continuous inspection [63]. To apply the developed methods to field application, a type of miniaturized handheld imager, which is an emerging technology for a field-adaptable purpose, seems to be a promising tool for snapshot-based multispectral technology because it can provide rapid, on-site scanning and convenient handling [64,65]. Moreover, control software, including the developed classification algorithm, should be installed on electronic devices such as laptop computers, Android- and iOS-based mobile appliances as external monitoring devices for viewing chemical distribution images [66].

5. Conclusions

An SMI technique for the early screening of heat stress during the growth of Chinese cabbage within the Vis/NIR region was investigated, and an SMI system and VI, PLS-DA, and LS-SVM models were constructed and analyzed. Then, the determinant accuracy of VIs and the two models was calculated with an increase in temperature (heat stress intensity) and compared with each other for the evaluation of their classification performance. As the temperature increased, classification performance increased. The accuracy of the VIs was much lower than that of the developed models because the PLS-DA and LS-SVM models used more wavelengths than the VI models for their model development. Among them, the LS-SVM showed the highest accuracy. Therefore, the distribution patterns of heat-stressed areas in Chinese cabbage samples were obtained using PLS-DA and LS-SVM models with an increase in temperature. Subsequently, they were compared with their RGB images for performance assessment. It was difficult to recognize the significant differences between the heat-stressed and sound parts in the RGB pixels with the naked eye. However, the dynamic changes in the heat-stressed area of the sample image were clearly distinguished using the distribution maps visualized using the PLS-DA and LS-SVM models. Hence, the developed SMI technique may constitute an alternative method for a rapid, accurate, and early screening system for real-time heat stress evaluation to prevent excessive heat stress in Chinese cabbage. This approach introduces a promising research avenue for the development of snapshot-based multispectral imaging systems for various cultivars of Brassica oleracea.

Author Contributions

H.L. conceived the overall contents and structure for this article. G.K. and B.-K.C. wrote and reviewed successive drafts. G.K. and H.L. led the data analysis drafted tables and figures. H.L. and S.H.W. analyzed growth information of Chinese cabbages. All authors have read and agreed to the published version of the manuscript.

Funding

This work was carried out with the support of “Cooperative Research Program for Agriculture Science & Technology Development (Project No. PJ01501904)” Rural Development Administration, Republic of Korea.

Institutional Review Board Statement

Not applicable.

Informed Consent Statement

Not applicable.

Conflicts of Interest

The authors declare no conflict of interest.

References

  1. Pachauri, R.K.; Meyer, L.A. Contribution of Working Groups I, II and III to the Fifth Assessment Report of the Intergovernmental Panel on Climate Change; IPCC: Geneva, Switzerland, 2014. [Google Scholar]
  2. Battisti, D.S.; Naylor, R.L. Historical Warnings of Future Food Insecurity with Unprecedented Seasonal Heat. Science 2009, 323, 240–244. [Google Scholar] [CrossRef] [PubMed]
  3. Lin, K.H.; Huang, H.C.; Lin, C.Y. Cloning, Expression and Physiological Analysis of Broccoli Catalase Gene and Chinese Cabbage Ascorbate Peroxidase Gene under Heat Stress. Plant Cell Rep. 2010, 29, 575–593. [Google Scholar] [CrossRef] [PubMed]
  4. Song, X.; Hu, J.; Wu, T.; Yang, Q.; Feng, X.; Lin, H.; Feng, S.; Cui, C.; Yu, Y.; Zhou, R.; et al. Comparative Analysis of Long Noncoding RNAs in Angiosperms and Characterization of Long Noncoding RNAs in Response to Heat Stress in Chinese Cabbage. Hortic. Res. 2021, 8, 48. [Google Scholar] [CrossRef] [PubMed]
  5. Lee, S.S.; Jung, W.Y.; Park, H.J.; Lee, A.; Kwon, S.-Y.; Kim, H.-S.; Cho, H.S. Genome-Wide Analysis of Alternative Splicing in An Inbred Cabbage (Brassica oleracea L.) Line ‘HO’ in Response to Heat Stress. Curr. Genom. 2017, 19, 12–20. [Google Scholar] [CrossRef]
  6. Ahmed, W.; Li, R.; Xia, Y.; Bai, G.; Siddique, K.H.M.; Zhang, H.; Zheng, Y.; Yang, X.; Guo, P. Comparative Analysis of MiRNA Expression Profiles between Heat-Tolerant and Heat-Sensitive Genotypes of Flowering Chinese Cabbage Under Heat Stress Using High-Throughput Sequencing. Genes 2020, 11, 264. [Google Scholar] [CrossRef] [PubMed]
  7. Yu, J.G.; Lee, G.H.; Lee, S.C.; Park, Y.D. Gene Expression and Phenotypic Analyses of Transgenic Chinese Cabbage Over-Expressing the Cold Tolerance Gene, BrCSR. Hortic. Environ. Biotechnol. 2014, 55, 415–422. [Google Scholar] [CrossRef]
  8. Yarra, R.; Xue, Y. Ectopic Expression of Nucleolar DEAD-Box RNA Helicase OsTOGR1 Confers Improved Heat Stress Tolerance in Transgenic Chinese Cabbage. Plant Cell Rep. 2020, 39, 1803–1814. [Google Scholar] [CrossRef]
  9. Park, H.J.; Jung, W.Y.; Lee, S.S.; Song, J.H.; Kwon, S.Y.; Kim, H.; Kim, C.; Ahn, J.C.; Cho, H.S. Use of Heat Stress Responsive Gene Expression Levels for Early Selection of Heat Tolerant Cabbage (Brassica oleracea L.). Int. J. Mol. Sci. 2013, 14, 11871–11894. [Google Scholar] [CrossRef]
  10. Chen, J.; Li, R.; Xia, Y.; Bai, G.; Guo, P.; Wang, Z.; Zhang, H.; Siddique, K.H.M. Development of EST-SSR Markers in Flowering Chinese Cabbage (Brassica campestris L. Ssp. Chinensis Var. Utilis Tsen et Lee) Based on de Novo Transcriptomic Assemblies. PLoS ONE 2017, 12, e0184736. [Google Scholar] [CrossRef]
  11. Seiki, S.; Norio, K.; Sumio, I.; Manabu, H. Effect of Low Temperature Pretreatment of Buds or Inflorescence on Isolated Microspore Culture in Brassica Rapa (Syn. B. Campestris). Breed. Sci. 2002, 52, 23–26. [Google Scholar] [CrossRef] [Green Version]
  12. Kramchote, S.; Nakano, K.; Kanlayanarat, S.; Ohashi, S.; Takizawa, K.; Bai, G. Rapid Determination of Cabbage Quality Using Visible and Near-Infrared Spectroscopy. LWT—Food Sci. Technol. 2014, 59, 695–700. [Google Scholar] [CrossRef]
  13. Nakajima, S.; Genkawa, T.; Miyamoto, A.; Ikehata, A. Useful Tissues in Cabbage Head for Freshness Evaluation with Visible and near Infrared Spectroscopy. Food Chem. 2021, 339, 128058. [Google Scholar] [CrossRef]
  14. Min, M.; Lee, W.S.; Kim, Y.H.; Bucklin, R.A. Nondestructive Detection of Nitrogen in Chinese Cabbage Leaves Using VIS-NIR Spectroscopy. HortScience 2006, 41, 162–166. [Google Scholar] [CrossRef]
  15. Liu, Q.; Chen, S.; Zhou, D.; Ding, C.; Wang, J.; Zhou, H.; Tu, K.; Pan, L.; Li, P. Nondestructive Detection of Weight Loss Rate, Surface Color, Vitamin c Content, and Firmness in Mini-Chinese Cabbage with Nanopackaging by Fourier Transform-near Infrared Spectroscopy. Foods 2021, 10, 2309. [Google Scholar] [CrossRef] [PubMed]
  16. Qin, J.; Chao, K.; Kim, M.S.; Lu, R.; Burks, T.F. Hyperspectral and Multispectral Imaging for Evaluating Food Safety and Quality. J. Food Eng. 2013, 118, 157–171. [Google Scholar] [CrossRef]
  17. Kim, G.; Lee, H.; Cho, B.-K.; Baek, I.; Kim, M.S. Quantitative Evaluation of Food-Waste Components in Organic Fertilizer Using Visible–Near-Infrared Hyperspectral Imaging. Appl. Sci. 2021, 11, 8201. [Google Scholar] [CrossRef]
  18. Kim, G.; Baek, I.; Stocker, M.D.; Smith, J.E.; Van Tassell, A.L.; Qin, J.; Chan, D.E.; Pachepsky, Y.; Kim, M.S. Hyperspectral Imaging from a Multipurpose Floating Platform to Estimate Chlorophyll-a Concentrations in Irrigation Pond Water. Remote Sens. 2020, 12, 2070. [Google Scholar] [CrossRef]
  19. Kim, G.; Lee, H.; Baek, I.; Cho, B.-K.; Kim, M.S. Quantitative Detection of Benzoyl Peroxide in Wheat Flour Using Line-Scan Short-Wave Infrared Hyperspectral Imaging. Sens. Actuators B Chem. 2022, 352, 130997. [Google Scholar] [CrossRef]
  20. Baek, I.; Kusumaningrum, D.; Kandpal, L.M.; Lohumi, S.; Mo, C.; Kim, M.S.; Cho, B.K. Rapid Measurement of Soybean Seed Viability Using Kernel-Based Multispectral Image Analysis. Sensors 2019, 19, 271. [Google Scholar] [CrossRef]
  21. Su, W.H.; Sun, D.W. Multispectral Imaging for Plant Food Quality Analysis and Visualization. Compr. Rev. Food Sci. Food Saf. 2018, 17, 220–239. [Google Scholar] [CrossRef] [Green Version]
  22. Irons, J.R.; Dwyer, J.L.; Barsi, J.A. The next Landsat Satellite: The Landsat Data Continuity Mission. Remote Sens. Environ. 2012, 122, 11–21. [Google Scholar] [CrossRef]
  23. Mouroulis, P.; Green, R.O.; Chrien, T.G. Design of Pushbroom Imaging Spectrometers for Optimum Recovery of Spectroscopic and Spatial Information. Appl. Opt. 2000, 39, 2210. [Google Scholar] [CrossRef] [PubMed]
  24. McClung, A.; Samudrala, S.; Torfeh, M.; Mansouree, M.; Arbabi, A. Snapshot Spectral Imaging with Parallel Metasystems. Sci. Adv. 2020, 6, eabc7646. [Google Scholar] [CrossRef] [PubMed]
  25. Hagen, N.; Kudenov, M.W. Review of Snapshot Spectral Imaging Technologies. Opt. Eng. 2013, 52, 090901. [Google Scholar] [CrossRef]
  26. Lowe, A.; Harrison, N.; French, A.P. Hyperspectral Image Analysis Techniques for the Detection and Classification of the Early Onset of Plant Disease and Stress. Plant Methods 2017, 13, 80. [Google Scholar] [CrossRef]
  27. Park, E.; Kim, Y.S.; Omari, M.K.; Suh, H.K.; Faqeerzada, M.A.; Kim, M.S.; Baek, I.; Cho, B.K. High-Throughput Phenotyping Approach for the Evaluation of Heat Stress in Korean Ginseng (Panax Ginseng Meyer) Using a Hyperspectral Reflectance Image. Sensors 2021, 21, 5634. [Google Scholar] [CrossRef]
  28. Chauchard, F.; Cogdill, R.; Roussel, S.; Roger, J.M.; Bellon-Maurel, V. Application of LS-SVM to Non-Linear Phenomena in NIR Spectroscopy: Development of a Robust and Portable Sensor for Acidity Prediction in Grapes. Chemom. Intell. Lab. Syst. 2004, 71, 141–150. [Google Scholar] [CrossRef]
  29. Pu, H.; Kamruzzaman, M.; Sun, D.W. Selection of Feature Wavelengths for Developing Multispectral Imaging Systems for Quality, Safety and Authenticity of Muscle Foods—A Review. Trends Food Sci. Technol. 2015, 45, 86–104. [Google Scholar] [CrossRef]
  30. Peters, A.J.; Walter-Shea, E.A.; Ji, L.; Viña, A.; Hayes, M.; Svoboda, M.D. Drought Monitoring with NDVI-Based Standardized Vegetation Index. Photogramm. Eng. Remote Sens. 2002, 68, 71–75. [Google Scholar]
  31. Garbulsky, M.F.; Peñuelas, J.; Gamon, J.; Inoue, Y.; Filella, I. The Photochemical Reflectance Index (PRI) and the Remote Sensing of Leaf, Canopy and Ecosystem Radiation Use Efficiencies. A Review and Meta-Analysis. Remote Sens. Environ. 2011, 115, 281–297. [Google Scholar] [CrossRef]
  32. Chang, J.; Shoshany, M. Red-Edge Ratio Normalized Vegetation Index for Remote Estimation of Green Biomass. In Proceedings of the 2016 IEEE International Geoscience and Remote Sensing Symposium (IGARSS), Beijing, China, 10–15 July 2016; IEEE: Beijing, China; pp. 1337–1339. [Google Scholar]
  33. Wi, S.H.; Lee, H.J.; An, S.; Kim, S.K. Evaluating Growth and Photosynthesis of Kimchi Cabbage According to Extreme Weather Conditions. Agronomy 2020, 10, 1846. [Google Scholar] [CrossRef]
  34. Ahmed, W.; Xia, Y.; Zhang, H.; Li, R.; Bai, G.; Siddique, K.H.M.; Guo, P. Identification of Conserved and Novel MiRNAs Responsive to Heat Stress in Flowering Chinese Cabbage Using High-Throughput Sequencing. Sci. Rep. 2019, 9, 14922. [Google Scholar] [CrossRef]
  35. Myneni, R.B.; Hall, F.G.; Sellers, P.J.; Marshak, A.L. Interpretation of Spectral Vegetation Indexes. IEEE Trans. Geosci. Remote Sens. 1995, 33, 481–486. [Google Scholar] [CrossRef]
  36. Guo, Y.; Wang, H.; Wu, Z.; Wang, S.; Sun, H.; Senthilnath, J.; Wang, J.; Bryant, C.R.; Fu, Y. Modified Red Blue Vegetation Index for Chlorophyll Estimation and Yield Prediction of Maize from Visible Images Captured by Uav. Sensors 2020, 20, 5055. [Google Scholar] [CrossRef] [PubMed]
  37. Han, L.; Yang, G.; Dai, H.; Xu, B.; Yang, H.; Feng, H.; Li, Z.; Yang, X. Modeling Maize Above-Ground Biomass Based on Machine Learning Approaches Using UAV Remote-Sensing Data. Plant Methods 2019, 15, 10. [Google Scholar] [CrossRef] [PubMed]
  38. Xue, J.; Su, B. Significant Remote Sensing Vegetation Indices: A Review of Developments and Applications. J. Sens. 2017, 2017, 1353691. [Google Scholar] [CrossRef]
  39. Dobrowski, S.Z.; Pushnik, J.C.; Zarco-Tejada, P.J.; Ustin, S.L. Simple Reflectance Indices Track Heat and Water Stress-Induced Changes in Steady-State Chlorophyll Fluorescence at the Canopy Scale. Remote Sens. Environ. 2005, 97, 403–414. [Google Scholar] [CrossRef]
  40. Candiago, S.; Remondino, F.; De Giglio, M.; Dubbini, M.; Gattelli, M. Evaluating Multispectral Images and Vegetation Indices for Precision Farming Applications from UAV Images. Remote Sens. 2015, 7, 4026–4047. [Google Scholar] [CrossRef]
  41. Robinson, N.A.; Sheedy, J.G.; MacDonald, B.J.; Owen, K.J.; Thompson, J.P. Tolerance of Wheat Cultivars to Root-lesion Nematode (Pratylenchus thornei) Assessed by Normalised Difference Vegetation Index Is Predictive of Grain Yield. Ann. Appl. Biol. 2019, 174, 388–401. [Google Scholar] [CrossRef]
  42. Merton, R. Monitoring Community Hysteresis Red-Edge Vegetation Stress Index Calculating Red-Edge Inflection from Second-Derivative Spectra Red-Edge Vegetation Stress Index. In Proceedings of the Seventh Annual JPL Airborne Earth Science Workshop, Pasadena, CA, USA, 12 January 1998; pp. 12–16. [Google Scholar]
  43. Zhang, F.; Zhou, G. Estimation of Canopy Water Content by Means of Hyperspectral Indices Based on Drought Stress Gradient Experiments of Maize in the North Plain China. Remote Sens. 2015, 7, 15203–15223. [Google Scholar] [CrossRef]
  44. Armstrong, R.A. When to Use the Bonferroni Correction. Ophthalmic Physiol. Opt. 2014, 34, 502–508. [Google Scholar] [CrossRef] [PubMed]
  45. Trawinski, B.; Smetek, M.; Telec, Z.; Lasota, T. Nonparametric Statistical Analysis for Multiple Comparison of Machine Learning Regression Algorithms. Int. J. Appl. Math. Comput. Sci. 2012, 22, 867–881. [Google Scholar] [CrossRef]
  46. Seo, Y.; Lee, H.; Mo, C.; Kim, M.S.; Baek, I.; Lee, J.; Cho, B.-K. Multispectral Fluorescence Imaging Technique for On-Line Inspection of Fecal Residues on Poultry Carcasses. Sensors 2019, 19, 3483. [Google Scholar] [CrossRef] [PubMed]
  47. Mukasa, P.; Wakholi, C.; Akbar Faqeerzada, M.; Amanah, H.Z.; Kim, H.; Joshi, R.; Suh, H.-K.; Kim, G.; Lee, H.; Kim, M.S.; et al. Nondestructive Discrimination of Seedless from Seeded Watermelon Seeds by Using Multivariate and Deep Learning Image Analysis. Comput. Electron. Agric. 2022, 194, 106799. [Google Scholar] [CrossRef]
  48. Lee, H.; Kim, M.S.; Lee, W.-H.; Cho, B.-K. Determination of the Total Volatile Basic Nitrogen (TVB-N) Content in Pork Meat Using Hyperspectral Fluorescence Imaging. Sens. Actuators B Chem. 2018, 259, 532–539. [Google Scholar] [CrossRef]
  49. Pu, H.; Sun, D.W.; Ma, J.; Liu, D.; Cheng, J. hu Using Wavelet Textural Features of Visible and Near Infrared Hyperspectral Image to Differentiate Between Fresh and Frozen–Thawed Pork. Food Bioprocess Technol. 2014, 7, 3088–3099. [Google Scholar] [CrossRef]
  50. Christopher, J.C. Burgers A Tutorial on Support Vector Machines for Pattern Recognition. Data Min. Knowl. Discov. 1998, 2, 121–167. [Google Scholar] [CrossRef]
  51. Kim, Y.-K.; Baek, I.; Lee, K.-M.; Qin, J.; Kim, G.; Shin, B.K.; Chan, D.E.; Herrman, T.J.; Cho, S.; Kim, M.S. Investigation of Reflectance, Fluorescence, and Raman Hyperspectral Imaging Techniques for Rapid Detection of Aflatoxins in Ground Maize. Food Control 2022, 132, 108479. [Google Scholar] [CrossRef]
  52. Kim, M.S.; Chen, Y.R.; Mehl, P.M. Hyperspectral reflectance and fluorescence imaging system for food quality and safety. Trans. ASAE 2001, 44, 721–729. [Google Scholar] [CrossRef]
  53. Faqeerzada, M.A.; Perez, M.; Lohumi, S.; Lee, H.; Kim, G.; Wakholi, C.; Joshi, R.; Cho, B.-K. Online Application of a Hyperspectral Imaging System for the Sorting of Adulterated Almonds. Appl. Sci. 2020, 10, 6569. [Google Scholar] [CrossRef]
  54. Faqeerzada, M.A.; Lohumi, S.; Kim, G.; Joshi, R.; Lee, H.; Kim, M.S.; Cho, B.-K. Hyperspectral Shortwave Infrared Image Analysis for Detection of Adulterants in Almond Powder with One-Class Classification Method. Sensors 2020, 20, 5855. [Google Scholar] [CrossRef] [PubMed]
  55. Delwiche, S.R.; Baek, I.; Kim, M.S. Does Spatial Region of Interest (ROI) Matter in Multispectral and Hyperspectral Imaging of Segmented Wheat Kernels? Biosyst. Eng. 2021, 212, 106–114. [Google Scholar] [CrossRef]
  56. Lee, H.; Kim, M.S.; Song, Y.-R.; Oh, C.-S.; Lim, H.-S.; Lee, W.-H.; Kang, J.-S.; Cho, B.-K. Non-Destructive Evaluation of Bacteria-Infected Watermelon Seeds Using Visible/near-Infrared Hyperspectral Imaging. J. Sci. Food Agric. 2017, 97, 1084–1092. [Google Scholar] [CrossRef] [PubMed]
  57. Kokaly, R.F.; Despain, D.G.; Clark, R.N.; Livo, K.E. Mapping Vegetation in Yellowstone National Park Using Spectral Feature Analysis of AVIRIS Data. Remote Sens. Environ. 2003, 84, 437–456. [Google Scholar] [CrossRef]
  58. Kuska, M.T.; Behmann, J.; Mahlein, A.K. Potential of Hyperspectral Imaging to Detect and Identify the Impact of Chemical Warfare Compounds on Plant Tissue. Pure Appl. Chem. 2018, 90, 1615–1624. [Google Scholar] [CrossRef]
  59. Hasanuzzaman, M.; Nahar, K.; Alam, M.M.; Roychowdhury, R.; Fujita, M. Physiological, Biochemical, and Molecular Mechanisms of Heat Stress Tolerance in Plants. Int. J. Mol. Sci. 2013, 14, 9643–9684. [Google Scholar] [CrossRef]
  60. Sukhov, V.; Gaspirovich, V.; Mysyagin, S.; Vodeneev, V. High-Temperature Tolerance of Photosynthesis Can Be Linked to Local Electrical Responses in Leaves of Pea. Front. Physiol. 2017, 8, 763. [Google Scholar] [CrossRef]
  61. Sukhova, E.; Yudina, L.; Kior, A.; Kior, D.; Popova, A.; Zolin, Y.; Gromova, E.; Sukhov, V. Modified Photochemical Reflectance Indices as New Tool for Revealing Influence of Drought and Heat on Pea and Wheat Plants. Plants 2022, 11, 1308. [Google Scholar] [CrossRef]
  62. Melandri, G.; Thorp, K.R.; Broeckling, C.; Thompson, A.L.; Hinze, L.; Pauli, D. Assessing Drought and Heat Stress-Induced Changes in the Cotton Leaf Metabolome and Their Relationship with Hyperspectral Reflectance. Front. Plant Sci. 2021, 12, 751868. [Google Scholar] [CrossRef]
  63. Wang, N.-N.; Sun, D.-W.; Yang, Y.-C.; Pu, H.; Zhu, Z. Recent Advances in the Application of Hyperspectral Imaging for Evaluating Fruit Quality. Food Anal. Methods 2016, 9, 178–191. [Google Scholar] [CrossRef]
  64. Lu, Y.; Saeys, W.; Kim, M.; Peng, Y.; Lu, R. Hyperspectral Imaging Technology for Quality and Safety Evaluation of Horticultural Products: A Review and Celebration of the Past 20-Year Progress. Postharvest Biol. Technol. 2020, 170, 111318. [Google Scholar] [CrossRef]
  65. Saari, H.; Aallos, V.-V.; Holmlund, C.; Malinen, J.; Mäkynen, J. Handheld Hyperspectral Imager. Next-Gener. Spectrosc. Technol. III 2010, 7680, 76800D. [Google Scholar] [CrossRef]
  66. Lee, H.; Kim, M.S.; Chao, K.; Lefcourt, A.M.; Chan, D.E. Development of Fluorescence Based Handheld Imaging Devices for Food Safety Inspection. In Proceedings of the International Society for Optical Engineering (SPIE), Baltimore, MD, USA, 29 May 2013; p. 872109. [Google Scholar]
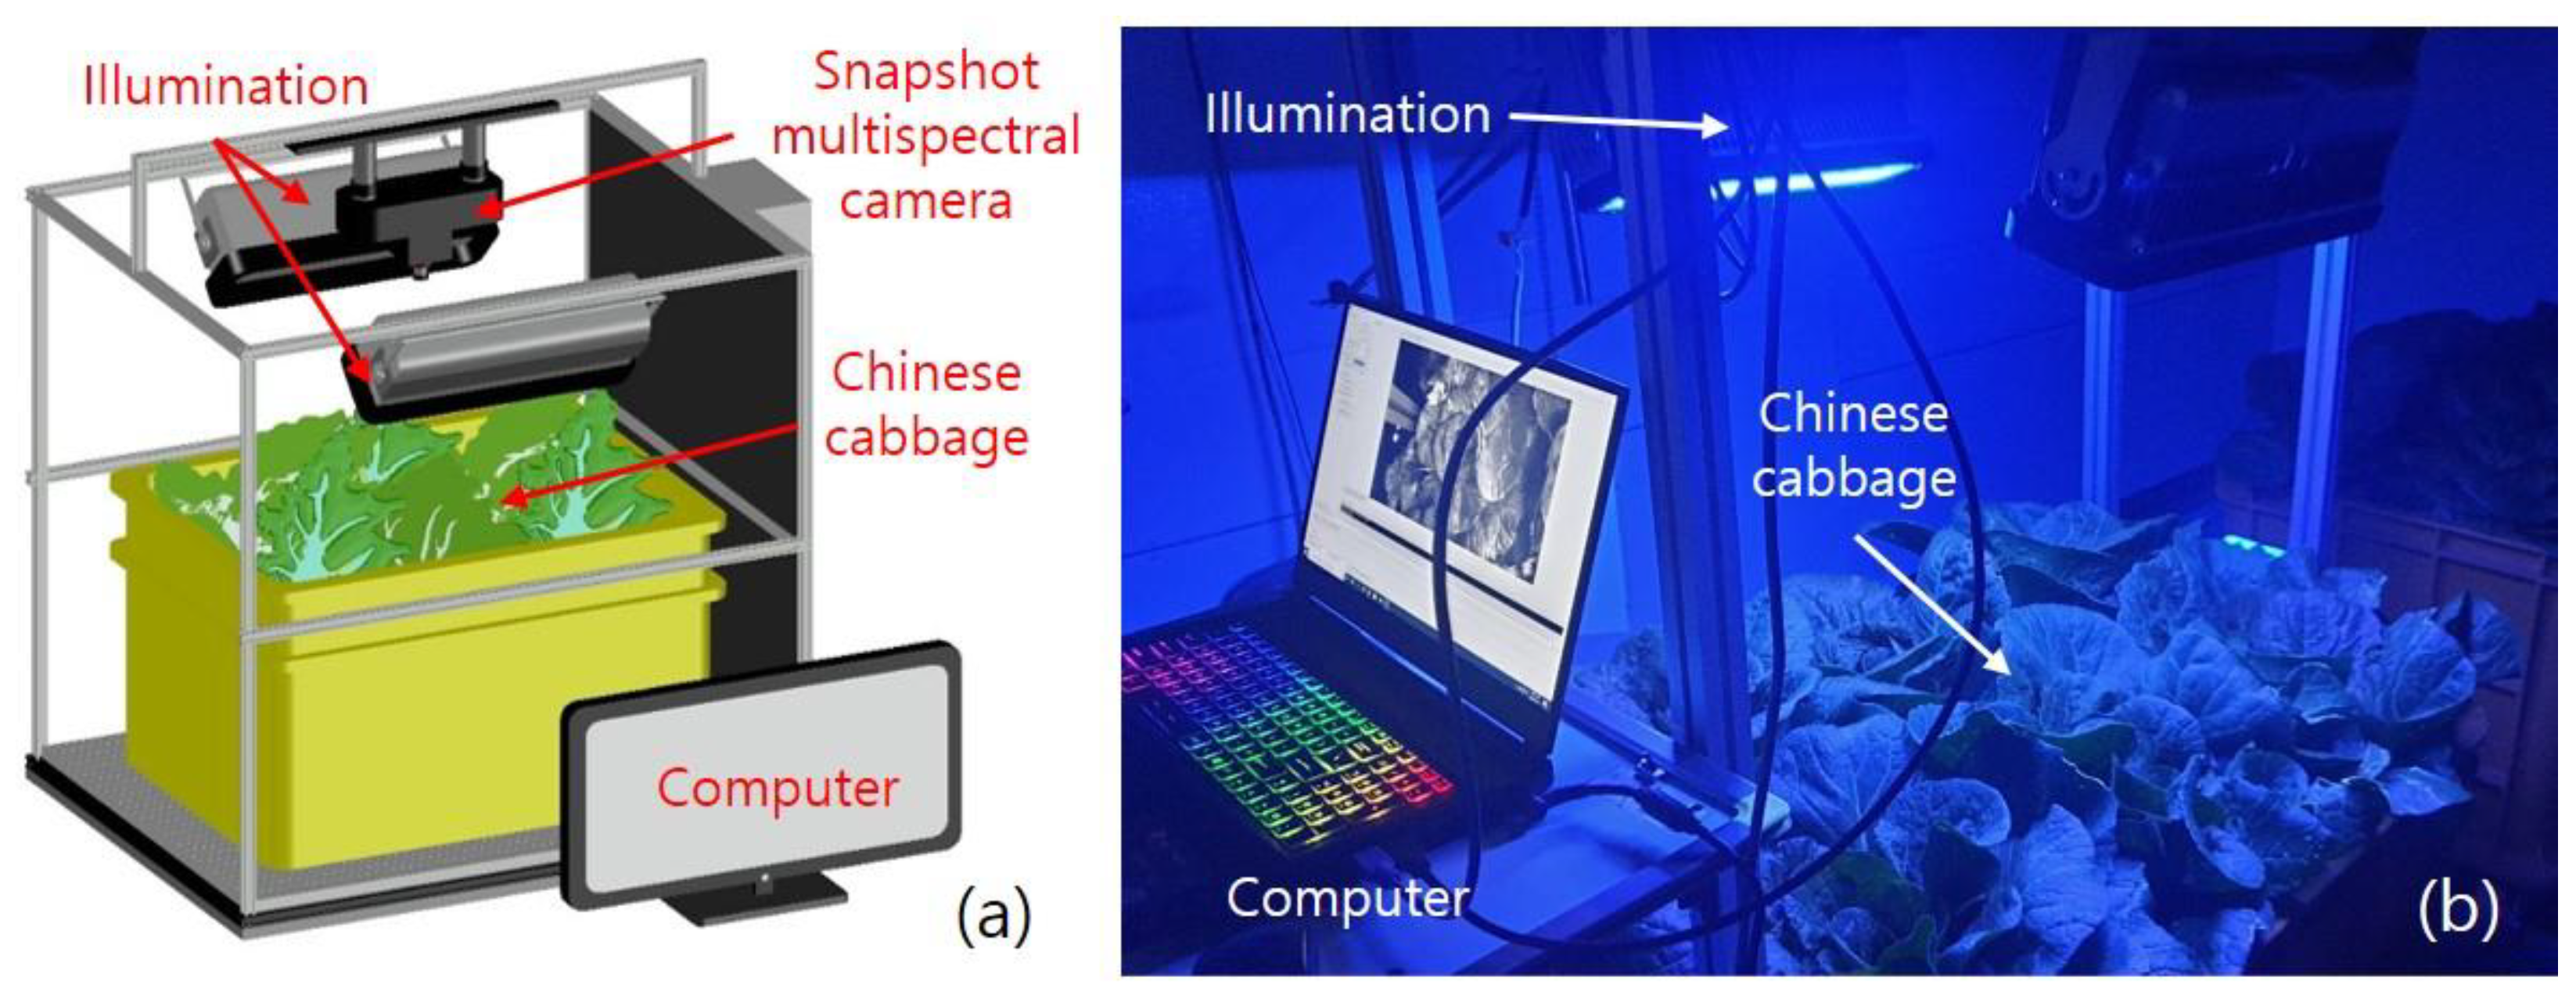
Figure 1. (a) Conceptual diagram of the newly developed visible-near infrared snapshot-based multispectral imaging system and (b) a photo of the experimental setup.
Applsci 12 09340 g001
Figure 2. Workflow of the image processing process for heat stress visualization. ROI, region of interest; PLS, partial-least squares; LS-SVM, least-squares support vector machine; VI, vegetation index; NDVI, normalized difference vegetation index; RE/R, red-edge ratio; PRI, photochemical reflectance index.
Applsci 12 09340 g002
Figure 3. Average reflectance spectra of heat-stressed samples from 460–860 nm; reflectance spectra under different temperatures (20 °C, 28 °C, and 36 °C on days 4 and 8.
Applsci 12 09340 g003
Figure 4. Beta-coefficient plot of the partial-least squares model acquired from snapshot-based multispectral images of Chinese cabbages grown for 4 and 8 days.
Applsci 12 09340 g004
Figure 5. Red, green, and blue (RGB), partial least squares-discriminant analysis (PLS-DA), and least-squares support vector machine (LS-SVM) model images of Chinese cabbage samples grown at 20 °C, 28 °C, and 36 °C for 4 and 8 days.
Applsci 12 09340 g005
Table 1. Average values of major growth parameters of Chinese cabbage grown at 20 °C, 28 °C, and 36 °C for eight days.
Temp.
(°C)
Fresh Weight (g/Plant)Dry Weight (g/Plant)Number of Leaves (/Plant)Leaf Area (cm2/Plant)Leaf Length (cm/Plant)Leaf Width (cm/Plant)
20/16334.2 NS14.8 NS47.0 a2974 NS32.9 NS19.0 NS
28/24317.7 NS14.7 NS42.3 ab2925 NS32.8 NS19.3 NS
36/32300.5 NS12.7 NS40.7 b2857 NS32.6 NS18.0 NS
(NS) Not statistically significant (not distinguished each other); (a–b) Letters showing statistically significant differences among different groups (Bonferroni correction test).
Table 2. Photosynthetic characteristics of Chinese cabbage grown at 20 °C, 28 °C, and 36 °C for eight days.
Temp.
(°C)
Vcmax
(µmol/m2/s)
Jmax
(µmol/m2/s)
TPU
(µmol/m2/s)
20/16181.5 a176.0 a87.8 b
28/24221.5 a211.5 a155.9 b
36/3215.4 a14.7 a11.3 b
(a–b) Letters showing statistically significant differences among different groups (Bonferroni correction test); Vcmax, maximum Rubisco carboxylation efficiency; Jmax, electron transport for the given light intensity; TPU, maximum rate of trios phosphate use.
Table 3. Calculated normalized difference vegetation index (NDVI), red-edge ratio (RE/R), and photochemical reflectance index (PRI) and the corresponding multiple comparison analysis values of Chinese cabbage grown at 20 °C, 28 °C, and 36 °C for 4 and 8 days.
GroupDayTemp.
(°C)
NDVIRE/RPRISTD 1 of NDVISTD 1 of RE/RSTD 1 of PRI
1 d4200.333 a0.382 a0.901 a0.133 0.042 0.043
2 e280.306 b0.378 a0.916 a0.037 0.027 0.037
3 f360.306 b0.359 b0.899 a0.034 0.019 0.032
4 g8200.244 a0.499 a0.906 a0.064 0.076 0.081
5 h280.250 a0.498 a0.909 a0.058 0.055 0.075
6 i360.304 b0.501 a0.897 a0.077 0.060 0.087
(a–b) Letters showing statistically significant differences among different groups (multiple comparison analysis, Bonferroni correction test); (d–f) Group 1 to 3: Chinese cabbages grown at 20 °C during 4 days, Chinese cabbages grown at 28 °C during 4 days, and Chinese cabbages grown at 36 °C during 4 days; (g–i) Group 4 to 6: Standard deviation: Chinese cabbages grown at 20 °C during 4 days, Chinese cabbages grown at 28 °C during 4 days, and Chinese cabbages grown at 36 °C during 4 days; (1) STD: Standard deviation.
Table 4. Classification accuracy of normalized vegetation index (NDVI), red-edge ratio (RE/R), photochemical reflectance index (PRI), partial least squares-discriminant analysis (PLS-DA), and least-squares support vector machine (LS-SVM) models.
GroupDayTemperature
(°C)
Model Accuracy (%)
NDVIRE/RPRIPLS-DALS-SVM
A 1420 vs 2865.342.858.17085.2
B 228 vs 3672.562.448.175.287.2
C 320 vs 3657.269.656.292.493.6
D 4820 vs 2842.147.052.755.571.2
E 528 vs 3671.455.051.175.182.8
F 620 vs 3663.552.253.884.592.4
(1–3) Group A, B, and C: Chinese cabbages grown at 20 °C and 28 °C during 4 days, Chinese cabbages grown at 28 °C and 36 °C during 4 days, and Chinese cabbages grown at 20 °C and 36 °C during 4 days; (4–6) Group D, E, and F: Chinese cabbages grown at 20 °C and 28 °C during 8 days, Chinese cabbages grown at 28 °C and 36 °C during 8 days, and Chinese cabbages grown at 20 °C and 36 °C during 8 days.
Publisher’s Note: MDPI stays neutral with regard to jurisdictional claims in published maps and institutional affiliations.