Article

Fused Deposition Modeling with Induced Vibrations: A Study on the Mechanical Characteristics of Printed Parts

1
Mechanical Engineering Department, San Jose State University, San Jose, CA 95192, USA
2
Department of Chemical and Materials Engineering, San Jose State University, San Jose, CA 95192, USA
*
Author to whom correspondence should be addressed.
Appl. Sci. 2022, 12(18), 9327; https://doi.org/10.3390/app12189327
Submission received: 27 July 2022 / Revised: 28 August 2022 / Accepted: 13 September 2022 / Published: 17 September 2022
(This article belongs to the Special Issue Recent Trends on the Mechanical Properties of Additive Manufacturing)

Abstract

:
The recent development of RepRap style 3D printers has made additive manufacturing technology available to the public at a low cost. While these 3D printers are being used for a variety of purposes, one of the main applications is prototyping in design projects. The quality of the 3D-printed parts has been a concern in such cases. Many variables within these printers’ operation can be varied to obtain optimum print quality. This study explores a setup that uses externally induced mechanical vibrations to the nozzle tip as a potential method to improve the quality of 3D-printed parts. Induced vibration is expected to decrease the porosity of printed parts and enhance the cohesion between print beads, ultimately improving their mechanical properties. The objective is to understand the prints’ positional accuracy, porosity, and mechanical properties with the added vibration and then to determine the optimum vibration level to achieve the best quality prints. While previous studies have explored the role of induced vibration on the mechanical properties of printed parts, the novelty of this work lies in the determination of the positional accuracy of those parts and the determination of optimum vibration levels to achieve desired properties. For positional accuracy, the extruder filament is replaced with a pointed-tip pen that can mark the exact location where the printer delivers the material. A comparison between the locations marked by the pen with and without vibrations shows that the errors induced by the added vibration are not significantly different from those caused by the uncertainties of the printer itself. Based on the tensile tests of the printed specimens, it is concluded that the parts printed with induced vibrations have improved mechanical properties. The printed parts’ porosity is reduced significantly due to the induced vibrations. Further, this study also explores the optimum motor speeds to achieve a uniform distribution of material. It determines medium motor speeds that provide a maximum vibration amplitude, which is more desirable for a consistent infill.

1. Introduction

Over the past decade or two, additive manufacturing technology has improved significantly and has played a crucial role in various engineering- and technology-related disciplines, e.g., [1,2,3]. The reduction in operating temperatures has allowed for additive manufacturing to be feasible outside of controlled facilities and has reduced the cost of 3D printers by a considerable margin [4]. The market for desktop-style 3D printers has more than doubled in the past five years [5]. These printers cannot be compared to their commercial variants in print quality, but several display fair accuracy [6]. The applications of these 3D printers have been ranging from art to creating parts of sophisticated machinery for lab experiments [7,8,9]. Despite the popularity of these machines, the quality of the printed parts remains a concern. In higher education, students often use desktop 3D printers to create their prototypes without realizing the compromise to the part strength and other mechanical properties.
In recent years, researchers have been trying to improve the quality of desktop 3D printers without significantly increasing the equipment’s cost. For example, Turner et al. [10] discussed how printer component properties (stepper motor power, for instance) and print settings could alter part mechanical properties. Vapor smoothing can be used to improve the surface quality and hardness of parts printed using acrylonitrile butadiene styrene (ABS) [11,12] without affecting the dimensions of a part [13].
Our research aims to design and characterize an inexpensive add-on arrangement for desktop 3D printers that can print parts with superior quality using induced vibrations to the nozzle tip of the printer. Vibration can help distribute material more evenly, improving the deposited beads’ cohesion. Adding a vibration setup can be achieved using a simple motor, and most users can achieve this without specialized tools. Using an experimental study, this paper further explores the improvement in the mechanical properties of parts printed with such an add-on setup.

2. Background

2.1. Fused Deposition Modeling (FDM)

Fused Deposition Modeling (FDM) is the most popular additive manufacturing technique in desktop 3D printers. In FDM, the mechanical properties of resulting printed parts depend on the bonding between layers [14]. Recent studies have also shown several factors influencing the adhesion and mechanical properties. These include the raster angle, raster-to-raster gap, infill density, layer thickness, and print orientation.
Parts printed using the FDM process are weaker in the build direction, primarily due to the anisotropic nature of the parts [4,15,16,17,18]. The most feasible technique to reduce anisotropy is increasing the bond strength of each bead with the neighboring ones. A large nozzle diameter to layer height ratio is a possible method to improve cohesion [18].
A study by Gibson et al. [19] shows that higher operating temperatures of the printer can lead to better cohesion between deposited beads. However, this is not a recommended technique. Higher temperatures can cause the polymer to degrade, thereby weakening the part. This can also cause a residue in the melt channel. If the temperature of an already deposited layer increases past the glass transition temperature, it can adversely affect the cohesion. Small temperature gradients between subsequent layers are better for improving cohesion.
While depositing a molten bead, it assumes an oblong shape. The final shape of the bead is dependent on the viscosity and surface energy of the bead. The oblong shape of the deposited material causes voids within the layers. These voids also affect the cohesion and adversely affect the part’s mechanical properties. The final bead width and the contact area between beads also define the resolution achieved in an FDM process [10].
The five parameters that create voids resulting from the toolpath are bead width, raster angle, percent overlap, bead height, and build orientation [20]. Voids can be classified into three groups: corner voids, edge voids, and contour center voids. Larger bead widths will create larger corner voids. Ravi et al. [21] showed that nozzle temperature and nozzle–bead distance have a statistically significant effect on bead width. As temperature increases, viscosity decreases, resulting in a larger bead width. A smaller nozzle-to-bed distance “sandwiches” the material to the print bead, causing the material to spread transversely, resulting in larger bead widths. Edge voids depend upon raster angle, bead width, and percentage overlap [22]. Gaps between beads of parallel tool paths are usually constant on one layer. Multiple gaps between path segments may bring overfill/underfill in some areas [23].
Porosity or the percentage of open space (voids) relative to the printed part varies considerably with different print settings. In Song et al. [24], solid blocks of PLA were printed using various print settings and tested for porosity using SEM microscopy. The blocks ranged in porosity from 1.46% to 13.54% volume pores depending on the layer height, extrusion temperature, and extruder speed. Larger layer heights were shown to produce more porous parts.
Bond strength is explored in Coogan et al. [25]. According to this research, stronger 3D-printed parts correlate to faster print speeds because each layer gets deposited on top of the previous one before it cools off completely. This higher initial interface temperature might lead to more diffusion between layers. However, this work also cautions against extremely high print speeds, which might result in thinner extrusions and thereby reduce the printed parts’ strength.
Another prior work related to this study was done by Turner et al. [10]. This work deals with the relationship between voids within the extrusion and the dimensional accuracy. A negative air gap indicates that the distance between adjacent bead centers is smaller than the bead width. While a negative air gap can diminish the number of voids found in parts (increasing bond strength), it can also lead to distortion of the physical dimension of the part. Air gaps were further explored by Sood et al. [17]. Small air gaps help create strong bonds between rasters but can also restrict heat dissipation, increasing the chance of stress accumulation. A positive air gap allows for the material to flow between layers, which increases the bonding surface. Defining zero air gap in the software does not guarantee zero gaps in the part. Shojib et al. [26] demonstrated that gaps between deposited rasters could be eliminated by visually inspecting the size of air gaps in parts and adjusting print settings accordingly. However, visual inspection is required for each layer, and this is an impractical approach for large and complex parts.
Boschetto et al. [27] studied the effect of deposition angles on dimensional accuracy. They explored various deposition angles from 0° to 180°. This work showed that parts experienced less deviation from the intended dimensions when the deposition angles were between 500 and 1350. This paper also proposed a model to predict the dimensional tolerances of FDM parts.

2.2. Open Source 3D Printers

In this study, we use an open-source 3D printer. Hence, it is essential to explore the various parameters that influence the print performances of such printers. The calibration of such printers also depends on the specific model. Tymrak et al. [4] show that even when the temperature in the software is set to be the same, the extrusion temperatures of the two printers will be different. The behavior of the parts printed using these two printers also might differ due to the heterogeneous properties of the material, mainly resulting from the slip experienced by the filament over the hobbed pulley [28]. In other words, the individual components and their assembly can influence the performance of such a printer [28]. With this understanding, each component and its assembly are carefully tested for the printer before the experiment is conducted.
Several prior studies have explored the dimensional accuracy of FDM parts. One of the studies that compared the printed dimensions with the dimensions of the CAD model [29] showed that the length varied by 0.51%, width by 1.71%, and thickness by 6.05% on average. Another study [30] showed that several models of desktop 3D printers are less likely to undersize parts (less than 5%) but likely to oversize them by at least 5%. Alafaghani et al. [31] showed that three print parameters affect dimensional accuracy the most: extrusion temperature, layer height, and build direction. They showed that lower extrusion temperatures are preferable for better dimensional accuracy. At the same time, higher temperatures are preferable for better mechanical properties.
Another study by Lanzotti et al. [32] investigated the effects of infill orientation, layer thickness, and the number of shell perimeters on the mechanical strength of parts 3D printed with desktop printers. The study found a positive correlation between mechanical strength and layer thickness. A similar positive correlation was observed between strength and the number of perimeters.

2.3. Effects of Induced Vibration on Printed Parts

Hybrid processes for additive manufacturing currently exist [33], i.e., combining additive manufacturing with a material removal or re-melting process. However, there is limited research on the benefits of adding vibration to additive manufacturing. One such study by Wu et al. [34] explored the effect of induced ultrasonic vibrations on the mechanical properties of ABS samples created using the FDM process. The authors observed an improvement in the bending properties of the parts printed using vibration-assisted FDM. They observed that as the energy spent for vibrations went up, the defects started to vanish, providing a more uniform material distribution.
Keles et al. [35] studied the mechanical properties of ABS reinforced with carbon fiber printed with induced vibrations. In their work, vibrations were generated using a dc motor and an offset weight. The induced vibrations helped in reducing porosity by around 3% while increasing the Weibull modulus from 25 to 57.

2.4. Objective of the Study

As described in the previous sub-sections, inducing vibrations to the nozzle tip of an FDM printer might help reduce porosity and improve the strength of FDM parts. However, the effect on the dimensional accuracy of 3D-printed parts has not been explored. In this paper, we explore the impact of induced vibrations on an FDM printer’s nozzle tip on the mechanical characteristics and dimensional accuracy of printed parts.

2.5. Previous Work

The authors have explored the feasibility of this work by conducting a pilot study, the results of which are included in their previous work [36]. The prior work describes the evolution of the experimental setup and the measurement of the anticipated accuracy of printed parts with the help of a pen attachment. This paper builds on the prior work by including the measurements on actual printed lines and samples and includes the measurement of strength and porosity of the printed samples.

3. Materials and Methods

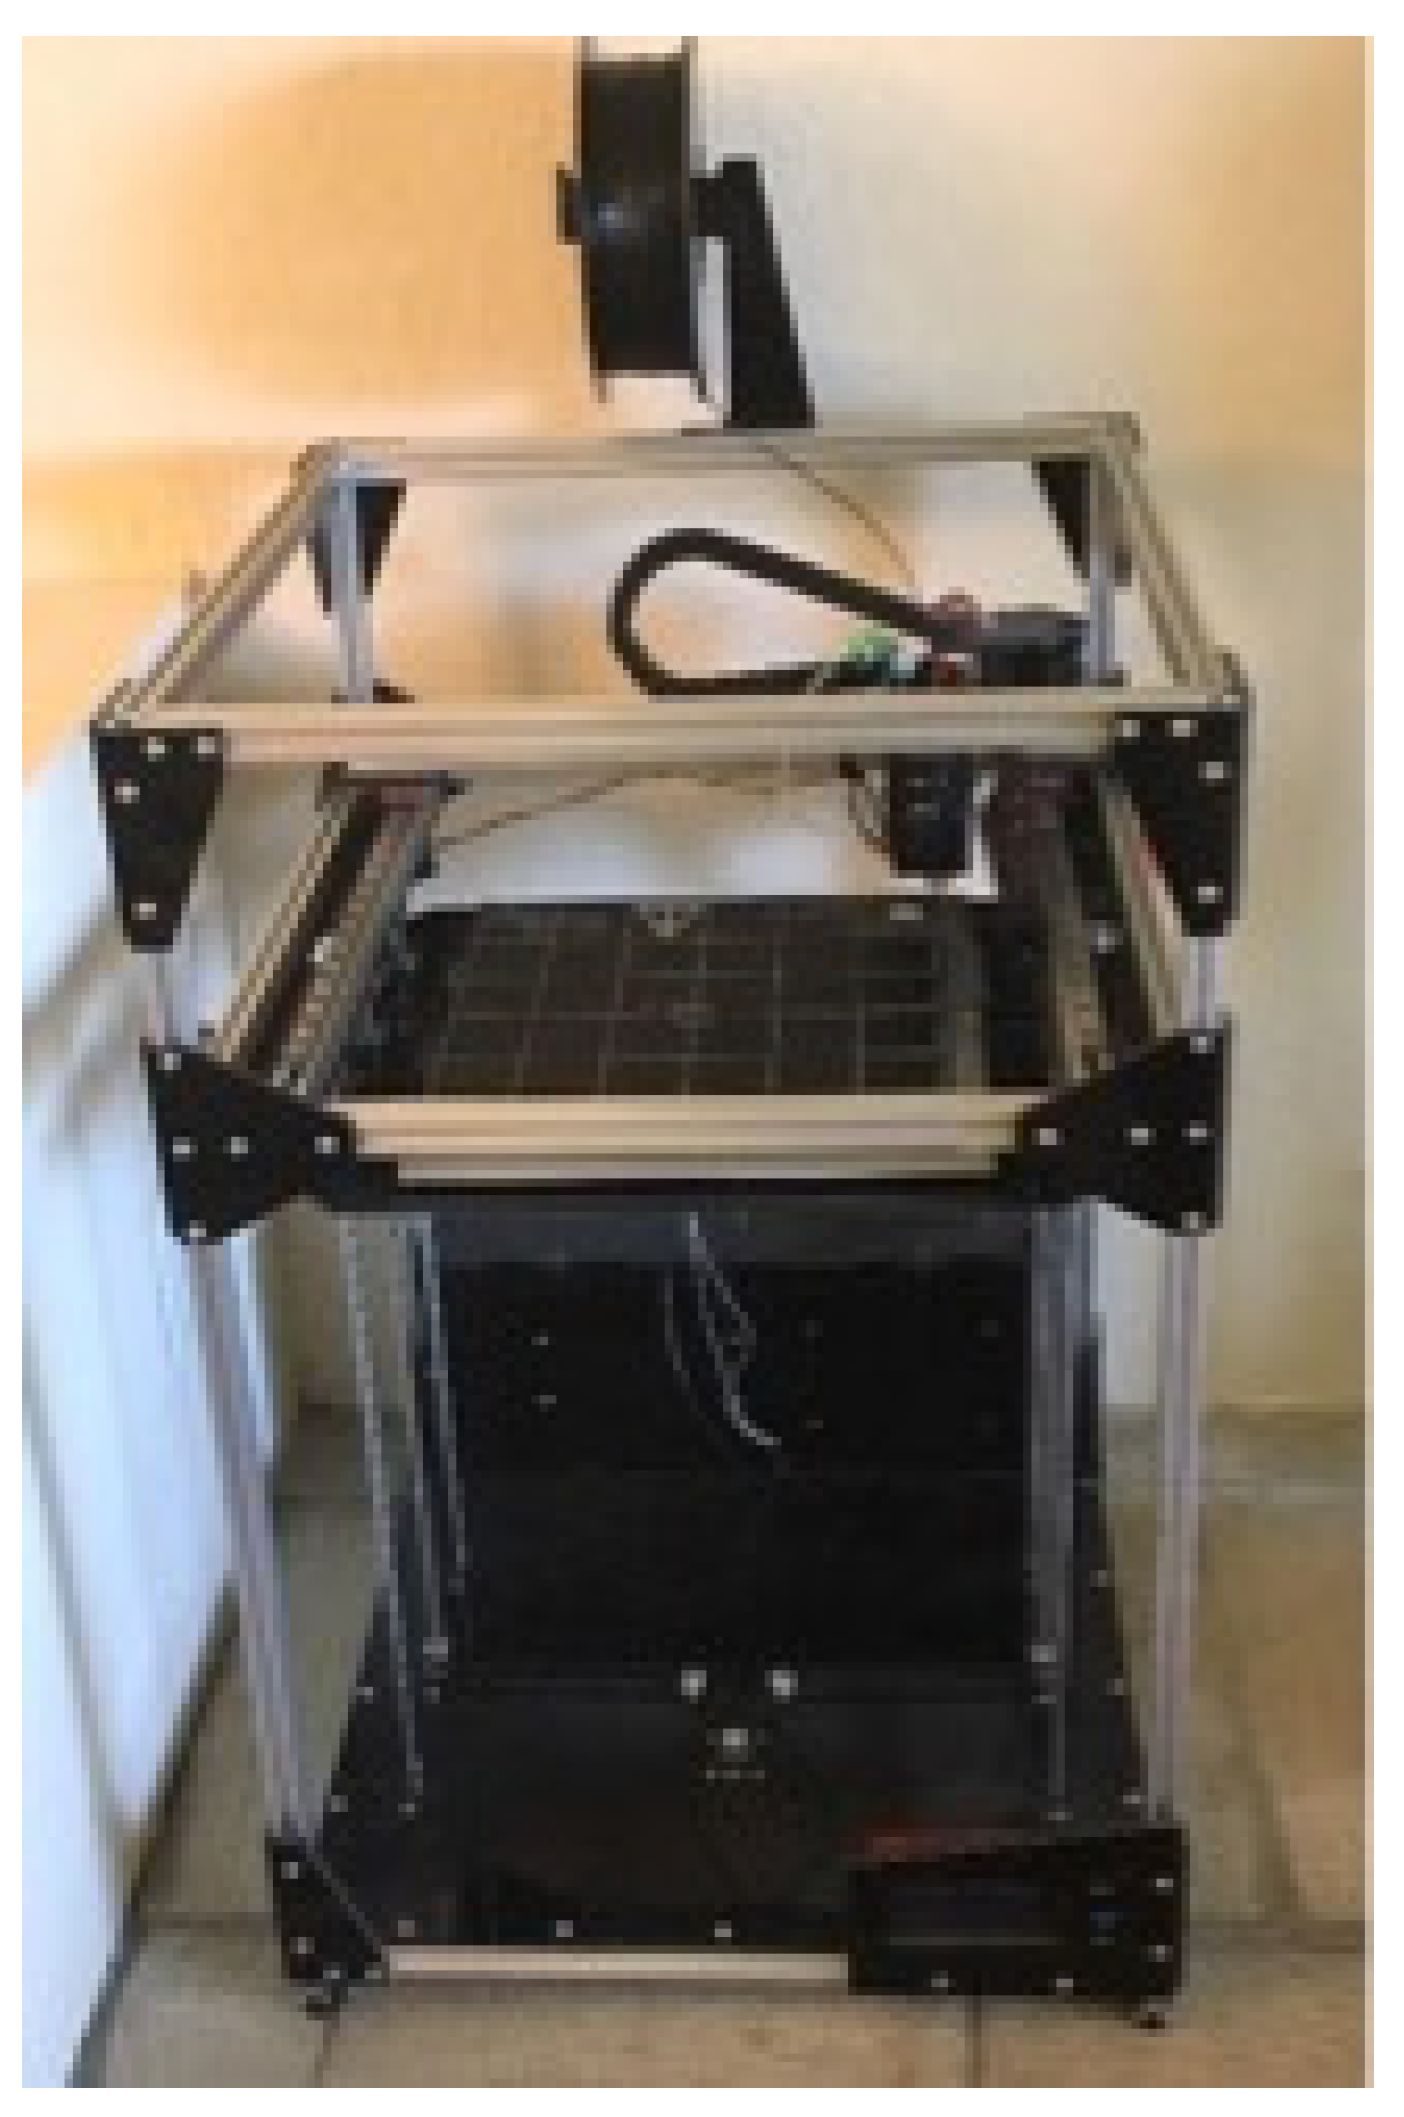
3.1. Printer and Print Settings

The FDM printer used for this study is a Folger Tech FT-5 R2 (Figure 1). This printer has a maximum extruder temperature of 245 °C, a 300 × 300 × 400 mm build area, and a maximum bed temperature of 120 °C. The printer features an MKS Gen 1.4 microcontroller and 480 W 24 V power supply. A 1.75 mm PLA spool is used as the printer material. Simplify3D is the slicer program, allowing the user to change the G-code. To program the microcontroller, Marlin is used as the firmware. A custom-made bracket is used for mounting the motor that induces vibrations to the nozzle.
A 1 mm diameter nozzle tip is used for printing all the samples in this study. The layer height for all the prints is kept constant at 0.2 mm. A raster width of 1.2 mm and a bed temperature of 55 °C were also used. The final print settings used are listed in Table 1.
Parts were printed as 3.6 mm × 13 mm × 165 mm rectangular specimens. Two separate print experiments were conducted. The first experiment consisted of varying four different print parameters, the values of which are displayed in Table 2.
In the second experiment, four different levels of vibration were used: no vibration, S16, S19, and S22. Print settings were the same as those listed in Table 1, except for layer height, which was increased to 0.35 to exaggerate the presence of voids.

3.2. Vibration Setup

In this study, vibration is induced to the nozzle tip of the printer using a Precision Microdrives Model # 334-401 motor, rated at 12 V and 6800 rpm. It also features an offset weight attached to its shaft to produce vibrations as it rotates. The motor is connected to the printer’s controller using the wiring for the cooling fan. The fan’s operation is controlled using the G-code M106 SXXX, where XXX represents the speed of the motor and ranges from 0 to 225. Based on the pilot experiment, the motor begins rotating at a minimum speed of S15; hence, S16 is chosen as the minimum operating speed, and S225 is designated as the maximum speed. The motor is attached to the printer using a 3D-printed bracket, as shown in Figure 2a,b, which shows the electrical schematic used for inducing vibrations to the nozzle tip.
For the parts printed with induced vibrations, the motor producing the vibrations is turned off for the first and last two layers. The G-code is modified to achieve this print setting. Similarly, the motor is turned off while printing the outermost layers of the sample. This ensures the dimensional accuracy of the printed parts. This setting allows us to confirm that vibration-assisted printing is performed only for the infill of the sample. The nozzle is also programmed to delay printing for 0.5 s so that the vibration motor can reach its full speed by then. This dwell time ensures that the vibration is at its peak when the printing begins, and the whole sample gets a uniform vibration. Several of these parameters are adjusted based on the results from our preliminary studies so that optimum print quality can be achieved.

3.3. Pen Attachment

The first task in the experiment is to understand the positional accuracy of the nozzle with induced vibrations. To help with this, we replaced the nozzle with a pen attachment using a UNI brand 0.28 mm precision tip, as shown in Figure 2 and Figure 3. Since the tip of the pen is very sharp, the marking it makes on paper represents the accurate position of the center of the nozzle in an actual printing process. This will also enable us to visualize the exact path followed by the tip of the nozzle.

3.4. Measurement of Position

To see where and how the materials are deposited in the 3D-printed parts, a micro-metrology station with a high-precision microscope is utilized. This is a device developed in-house at San Jose State University. The machine can measure position within an error margin of ±1.5 microns and take high-quality images of the inner details of the printed part.

3.5. Tensile Testing

For tensile testing, an Instron 5969 [37] with a 50 kN load cell was used in conjunction with an extensometer. The extensometer was used to obtain the true strain specimens experienced. Specimens that broke within the grips could not be considered for fracture characteristics, as their failure was not tensile dominated. However, these samples could still be evaluated for tensile strength, strain at tensile strength, and elastic modulus.

4. Results and Discussion

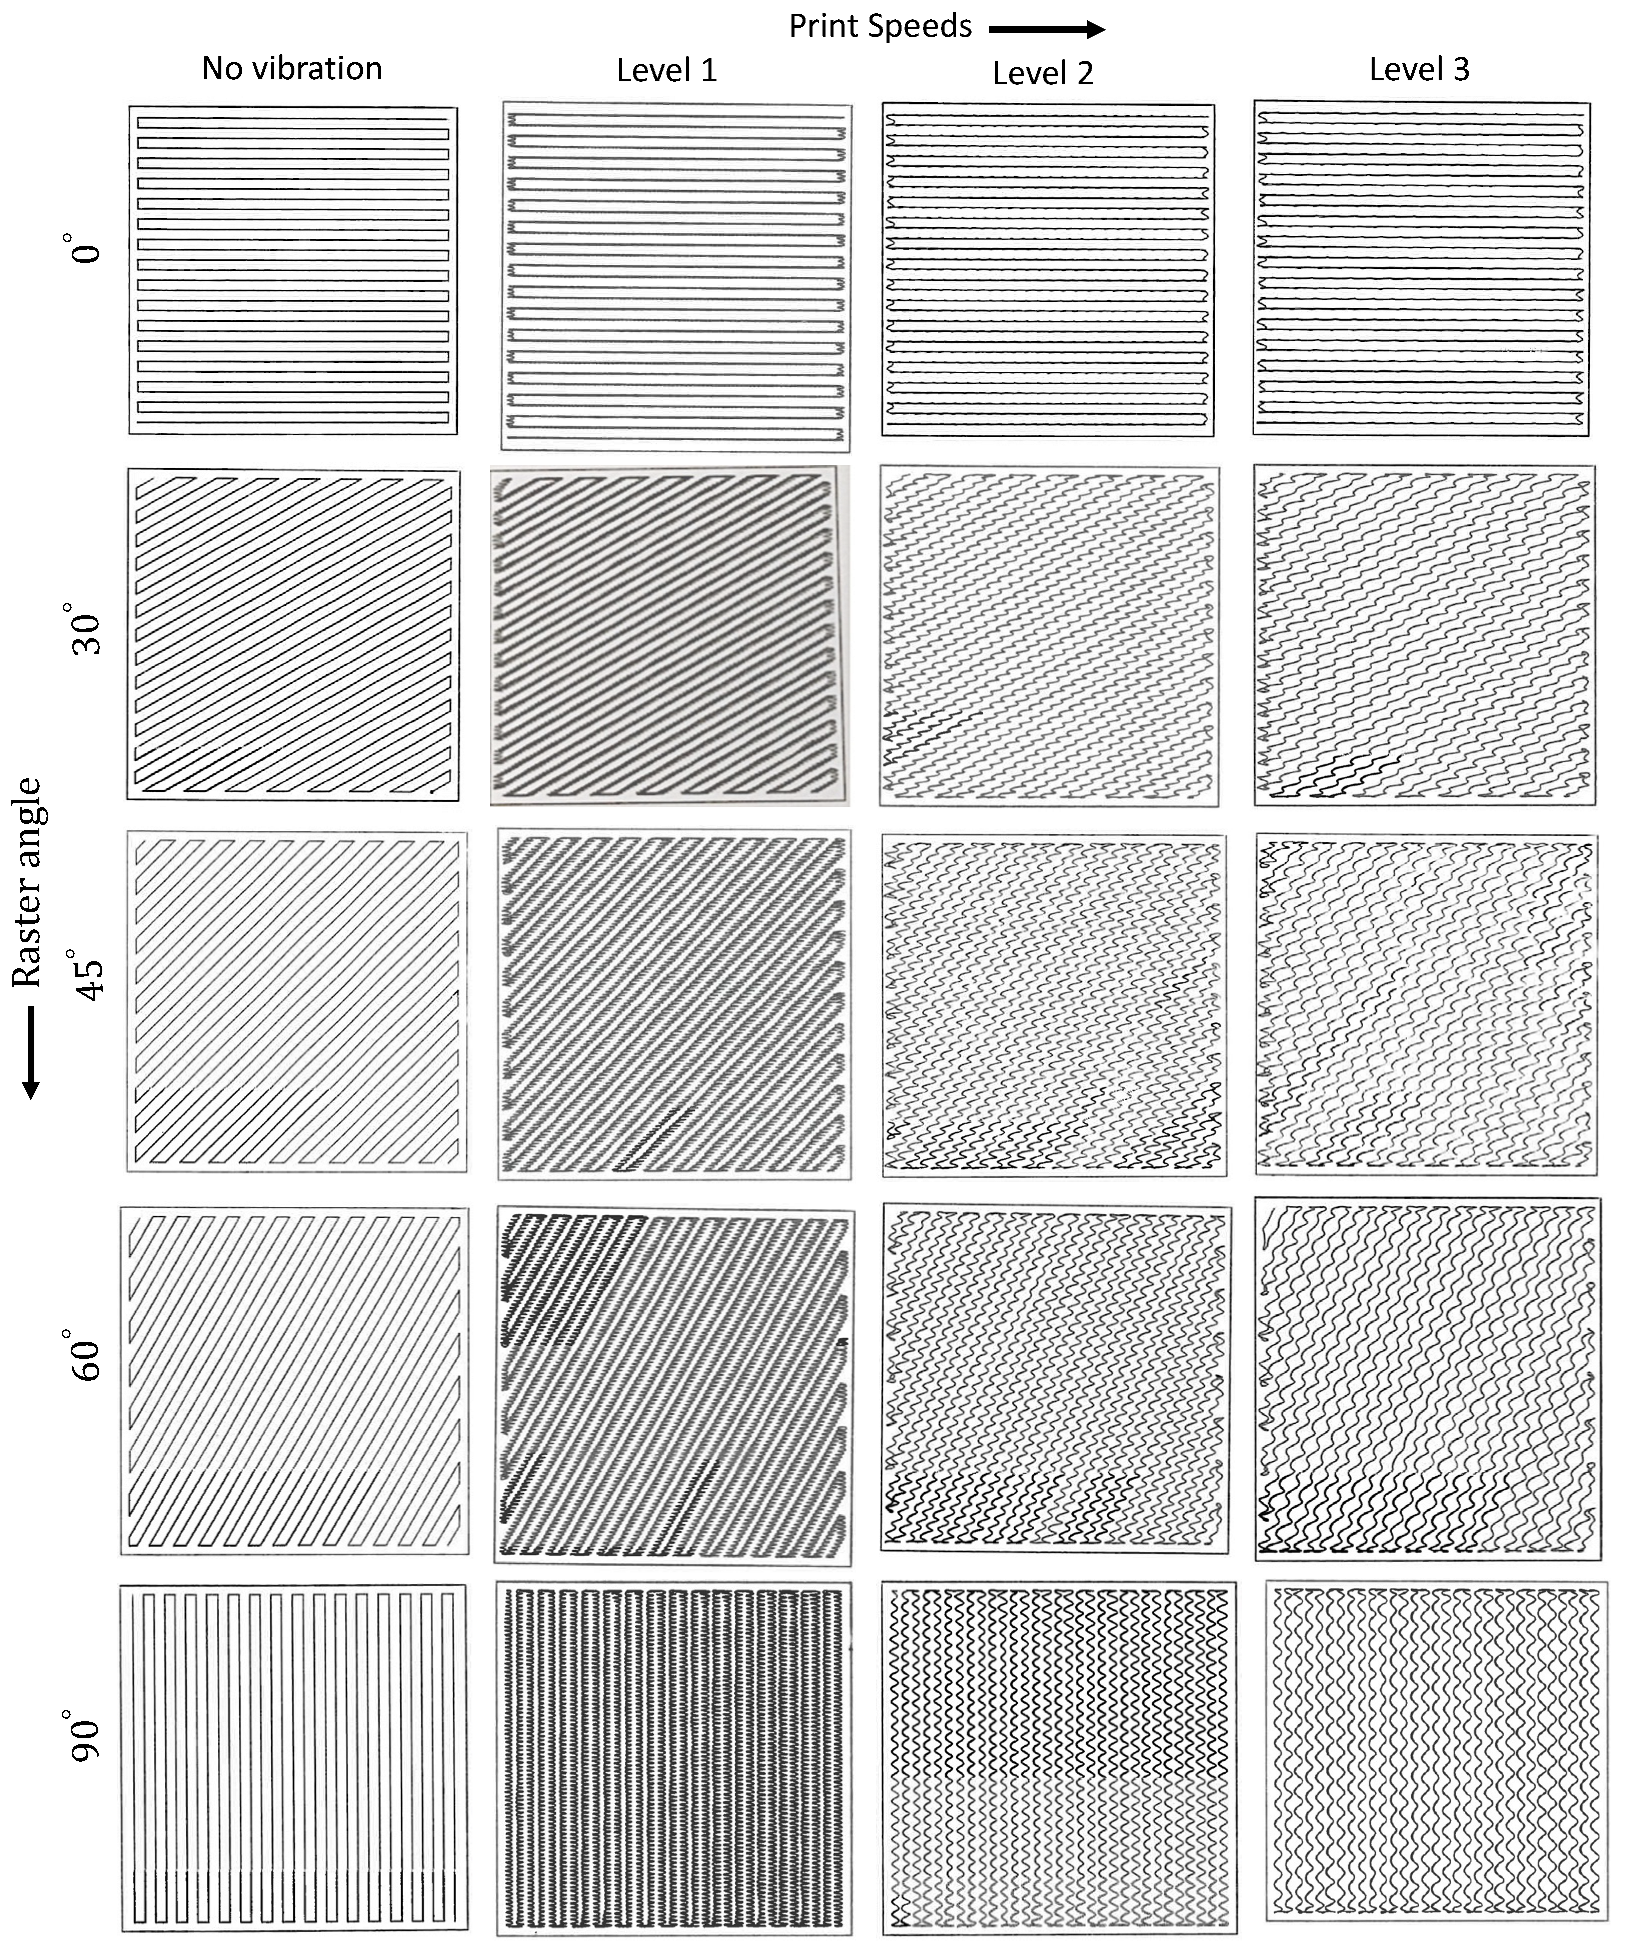
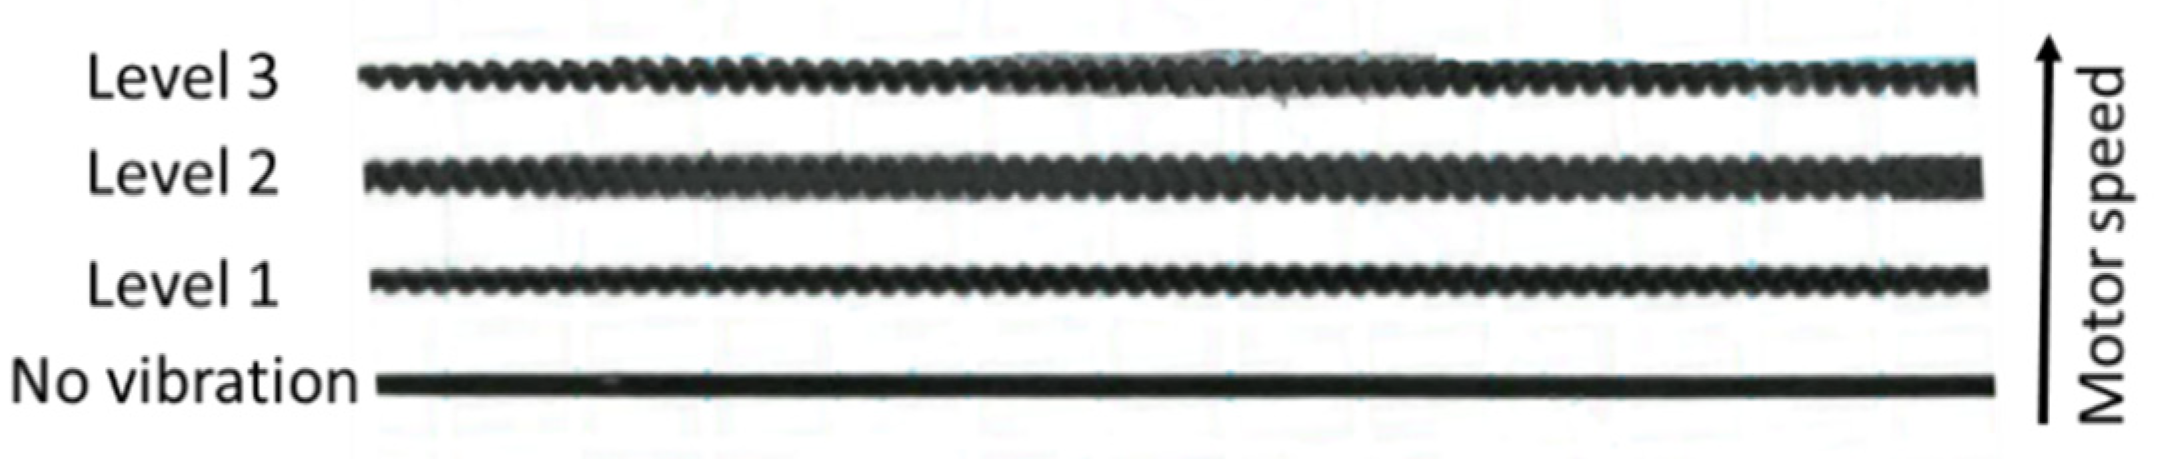
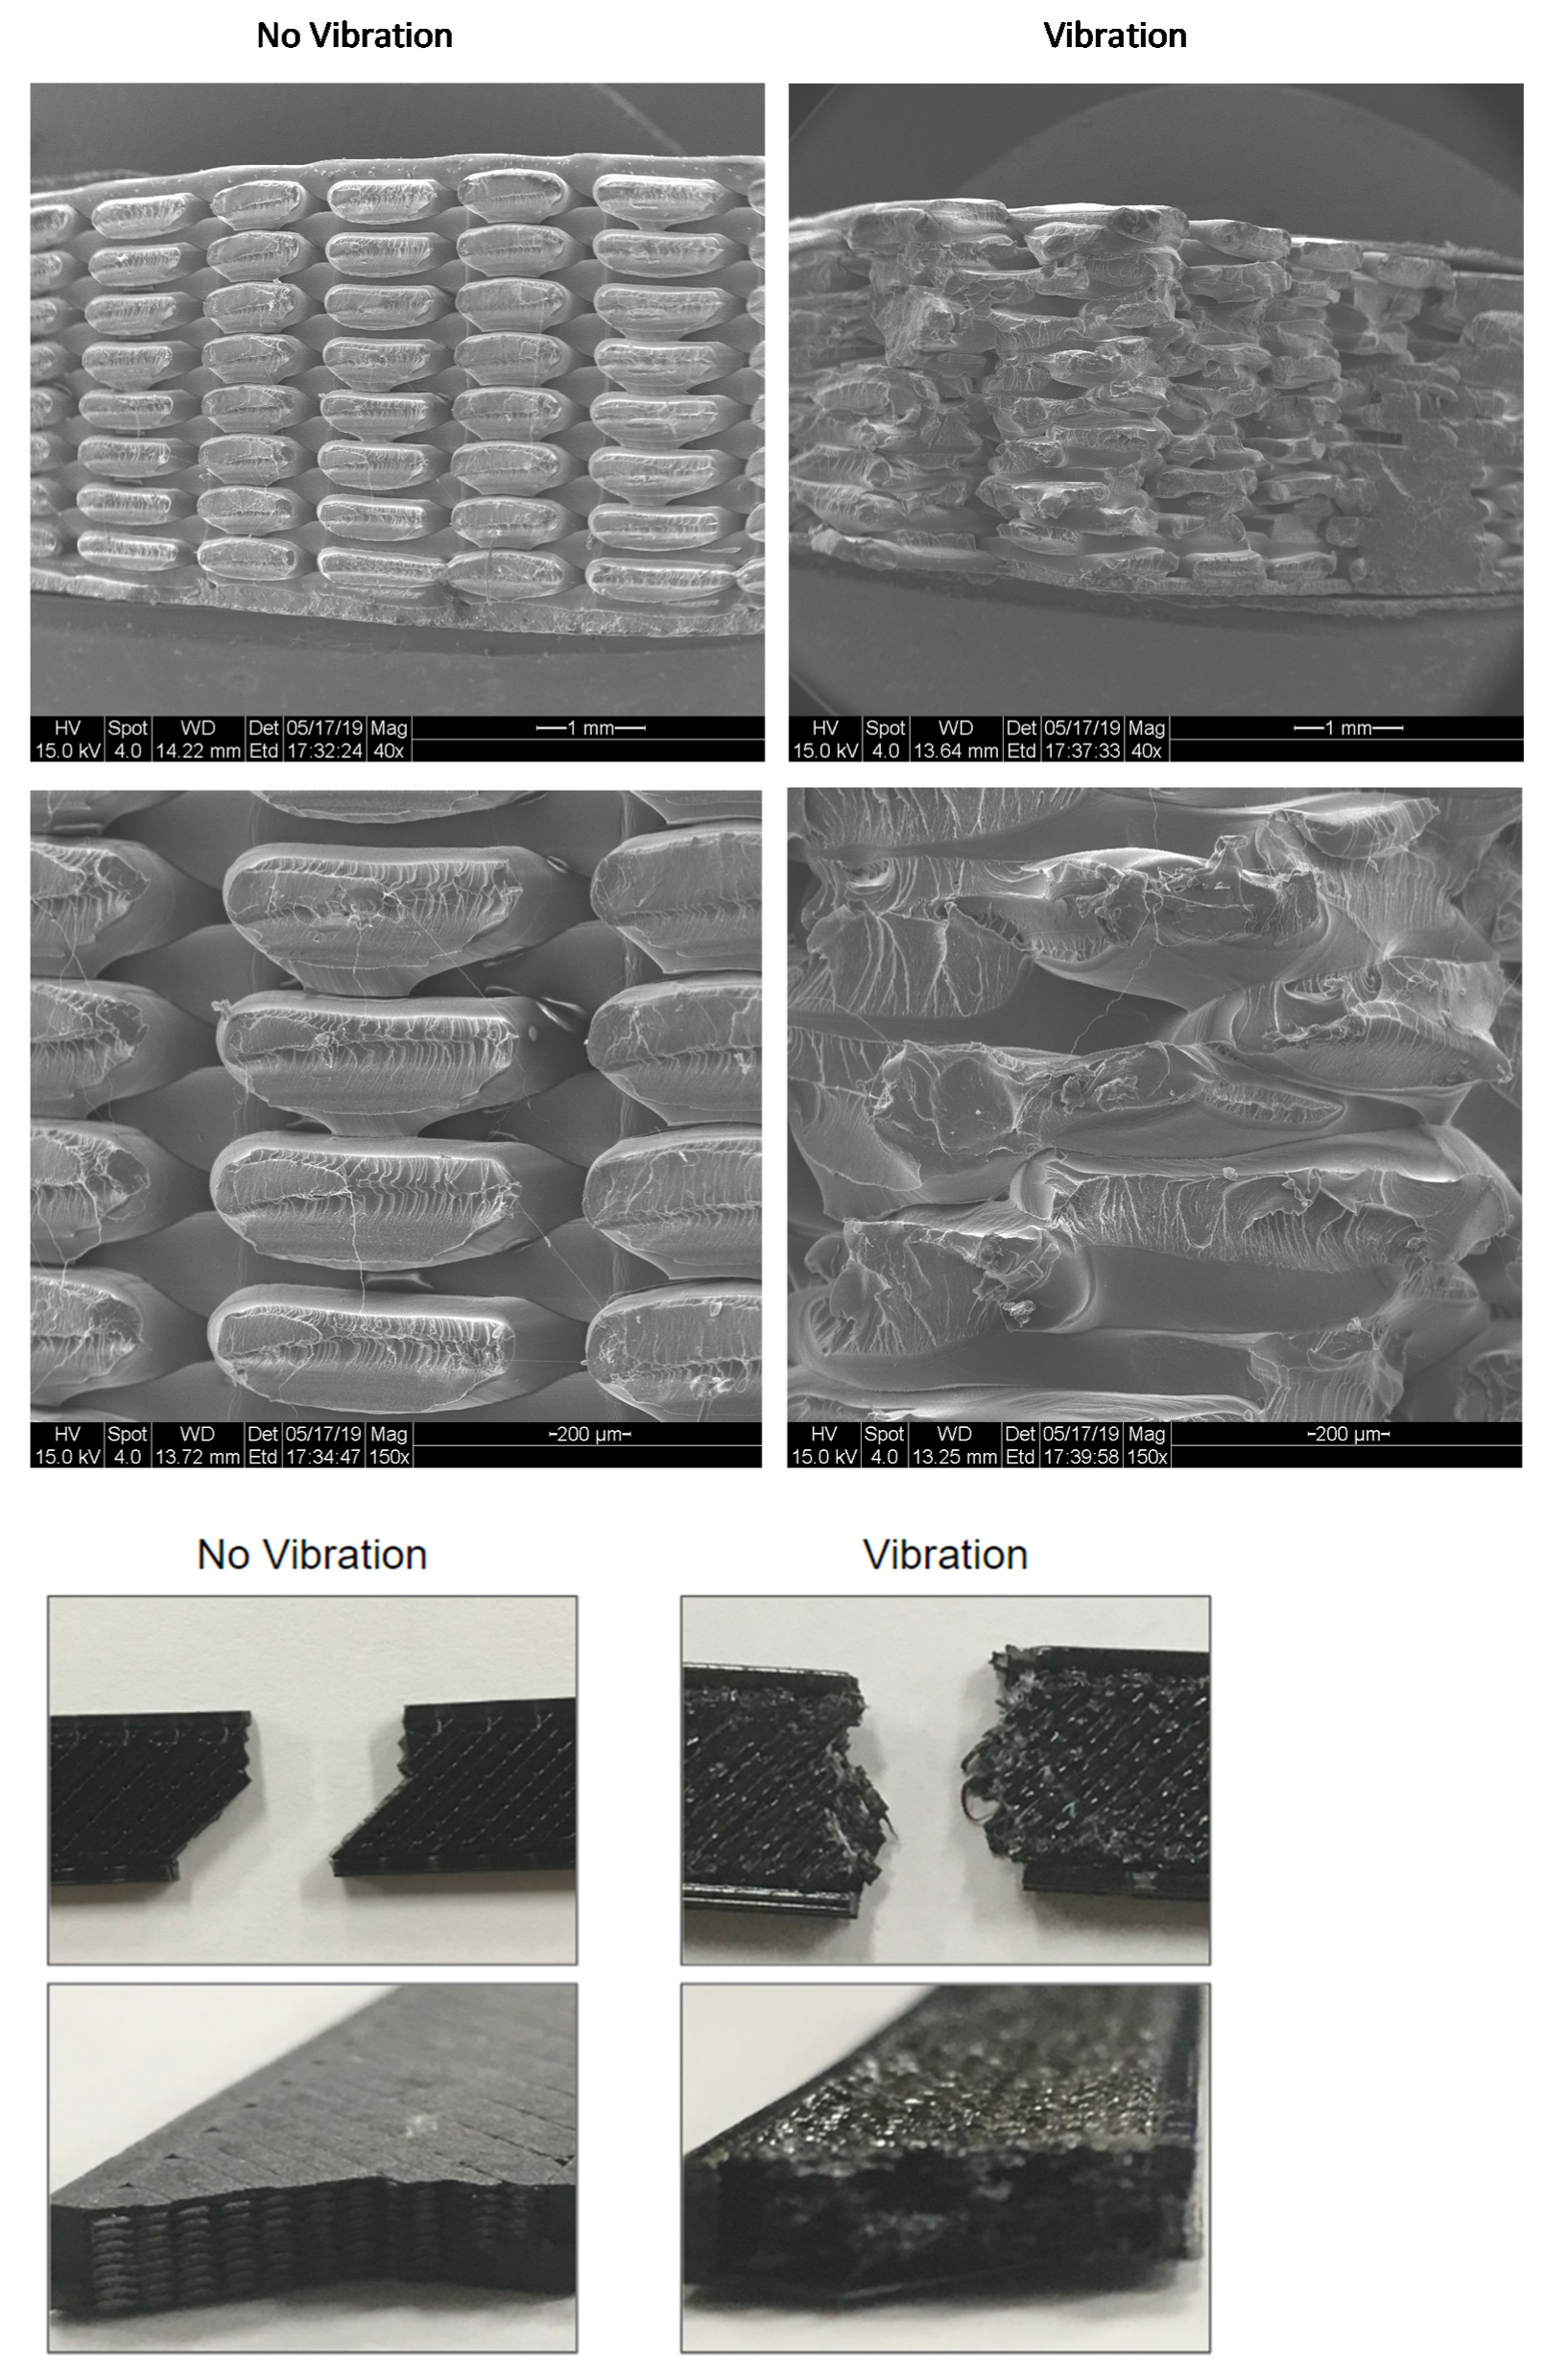
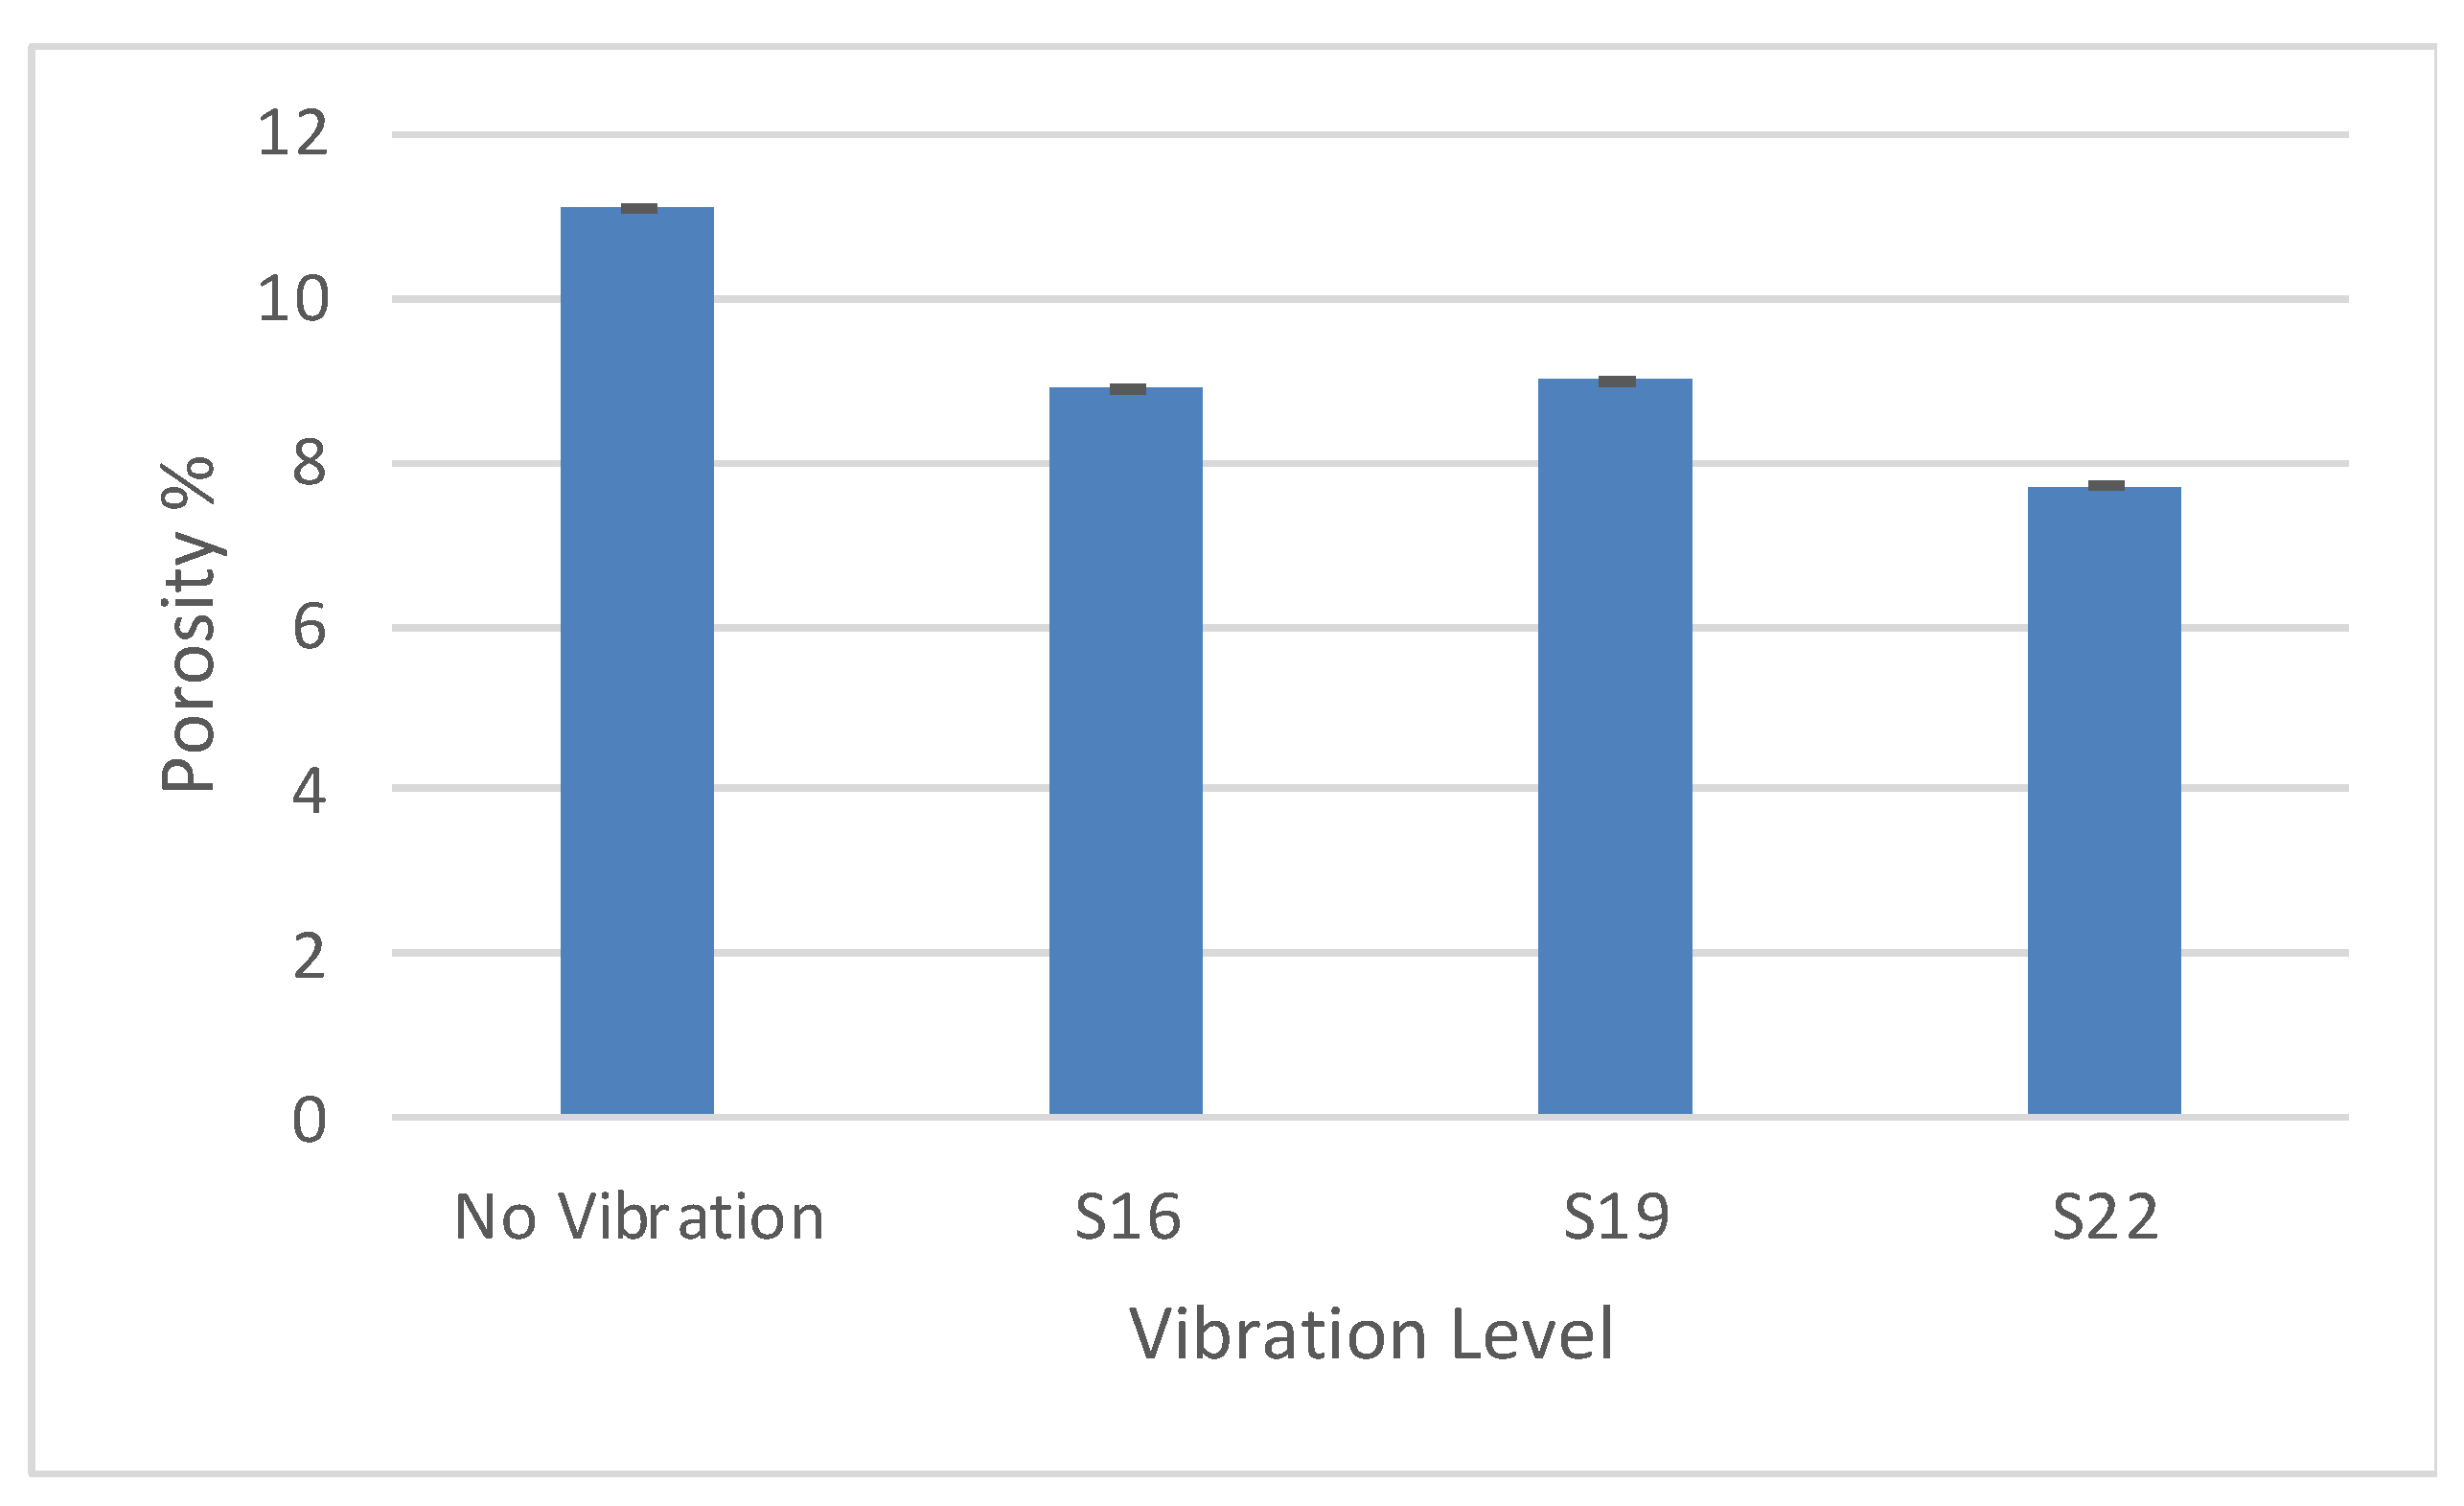
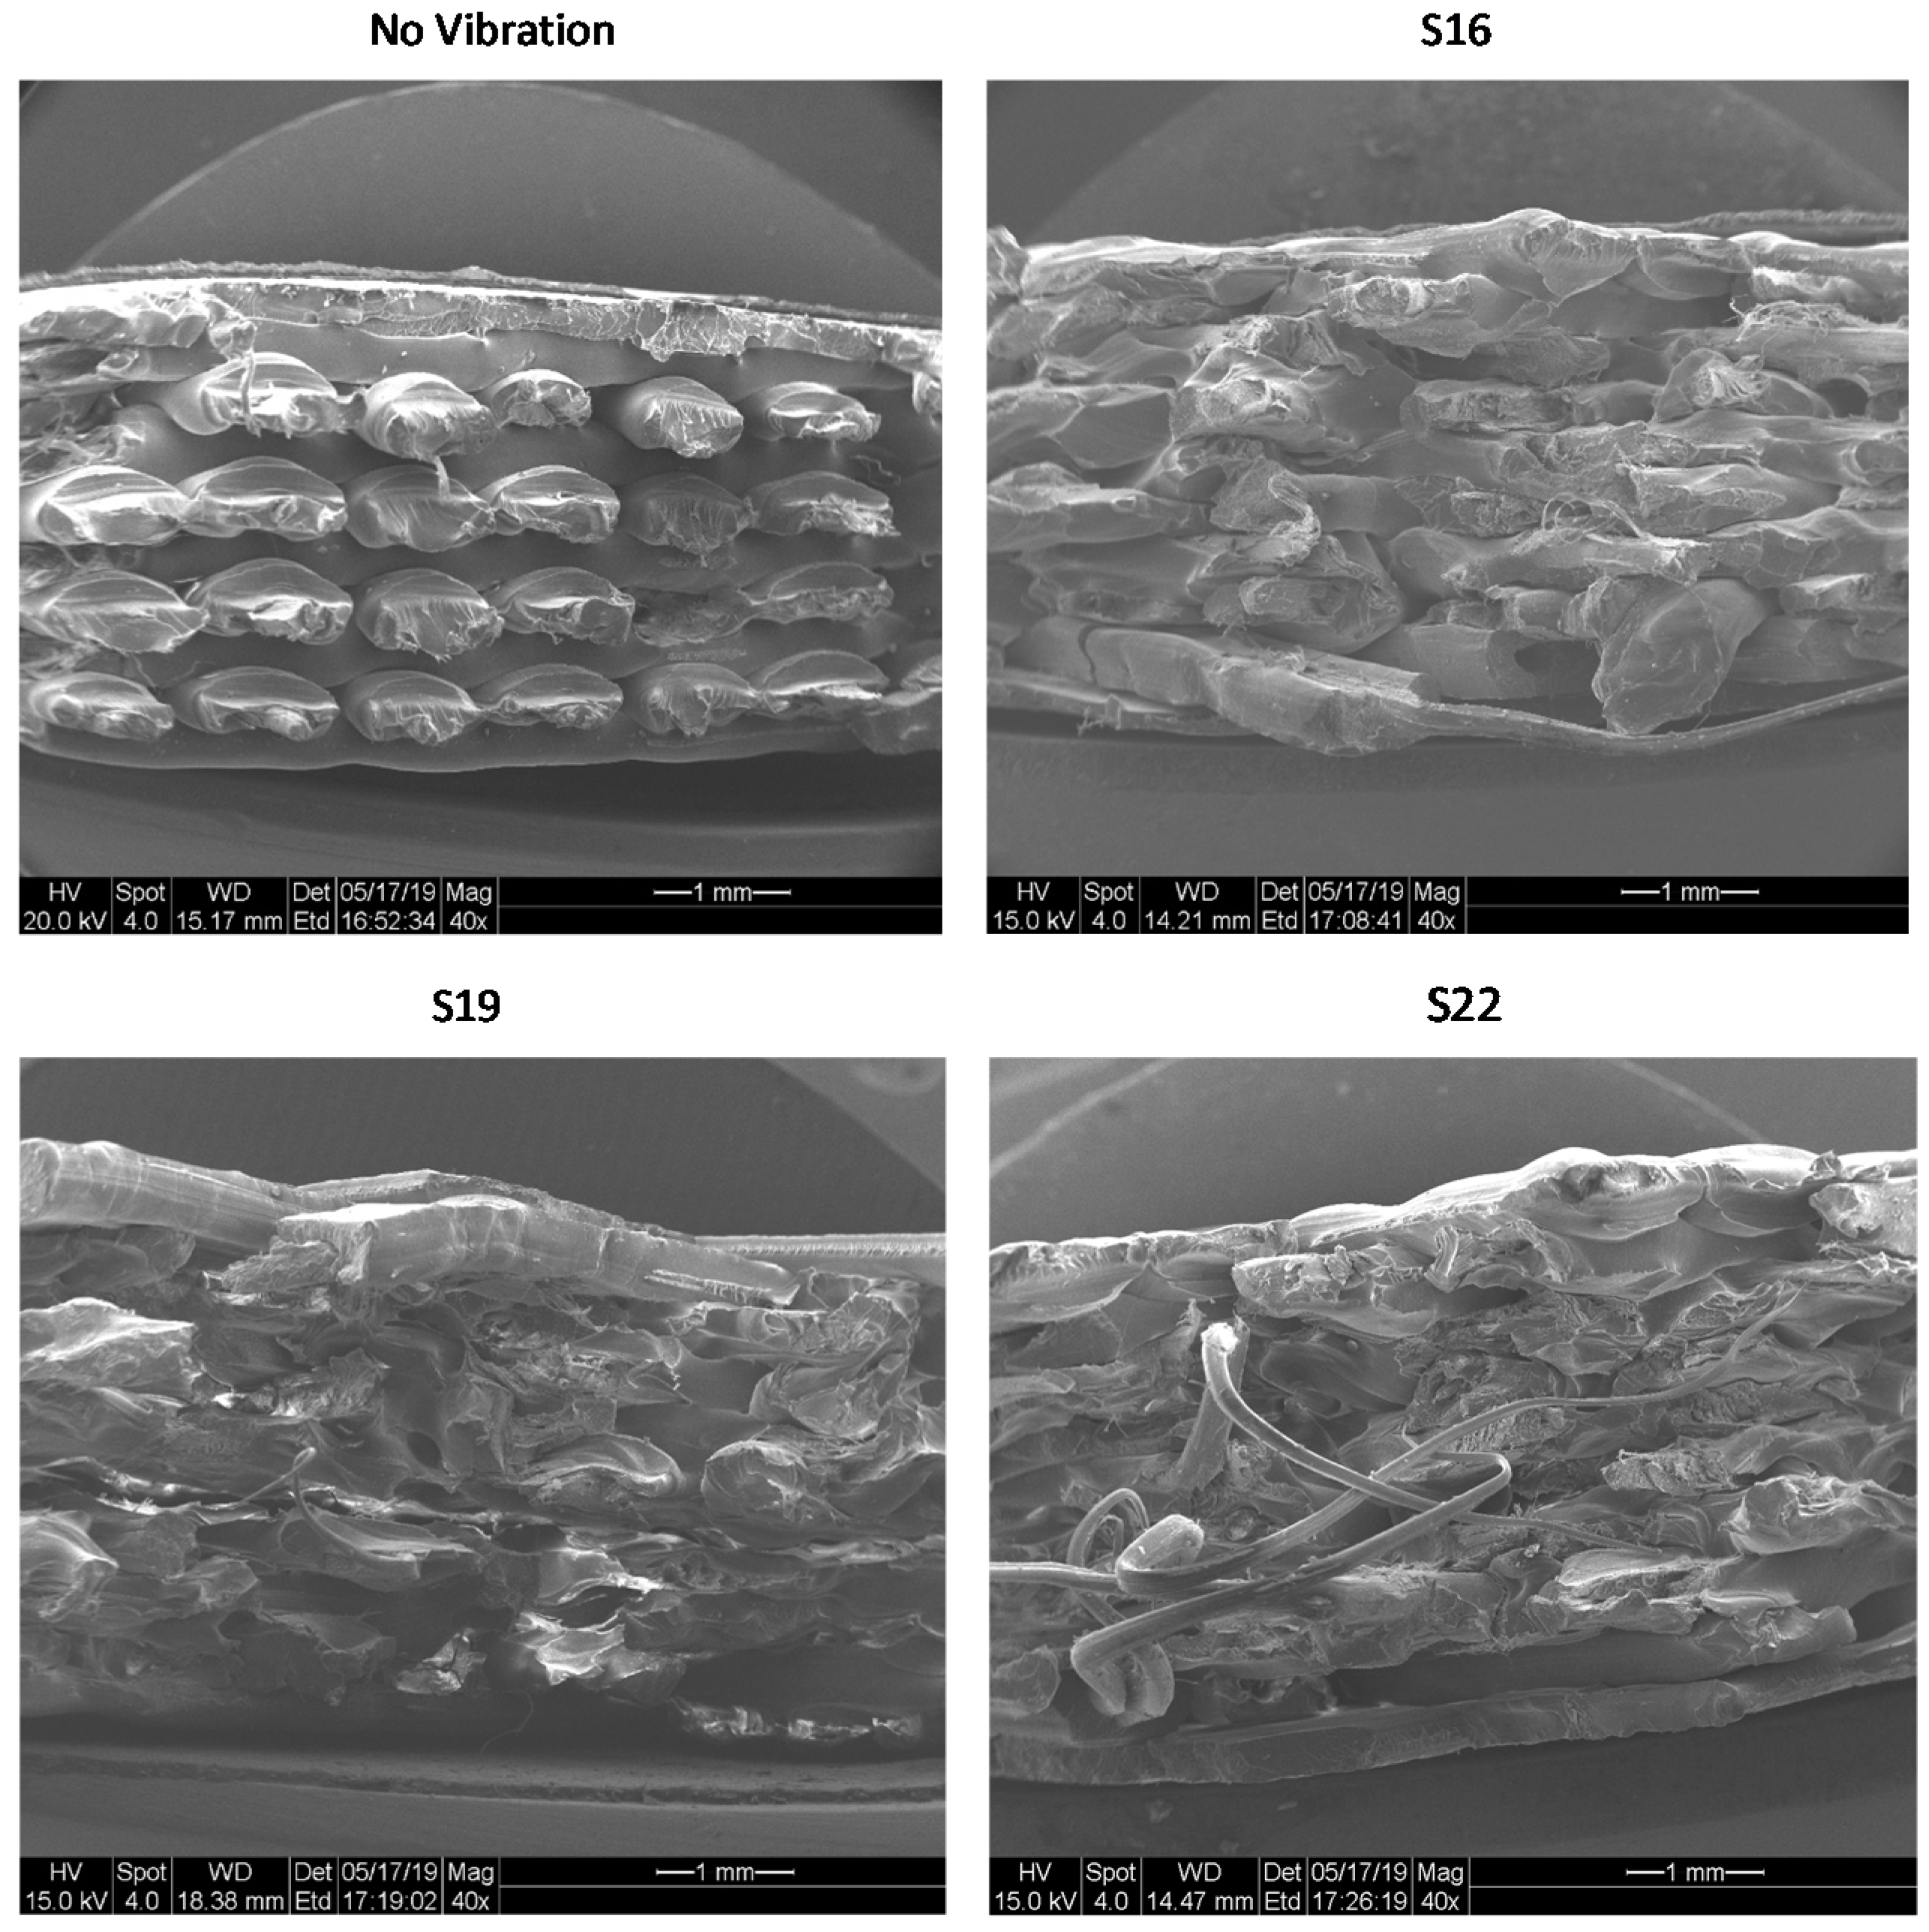
4.1. Material Distribution with Induced Vibrations

A visual comparison is made between parts printed with and without induced vibrations. The images taken at the micro-metrology station are used for this comparison (Figure 4). The two photos in Figure 4 are taken at the same magnification level of two different samples—one with and one without vibration. The images clearly show the pores in the parts printed without vibration. When vibrations are introduced, materials are redistributed, resulting in a reduction in the size of the pores.

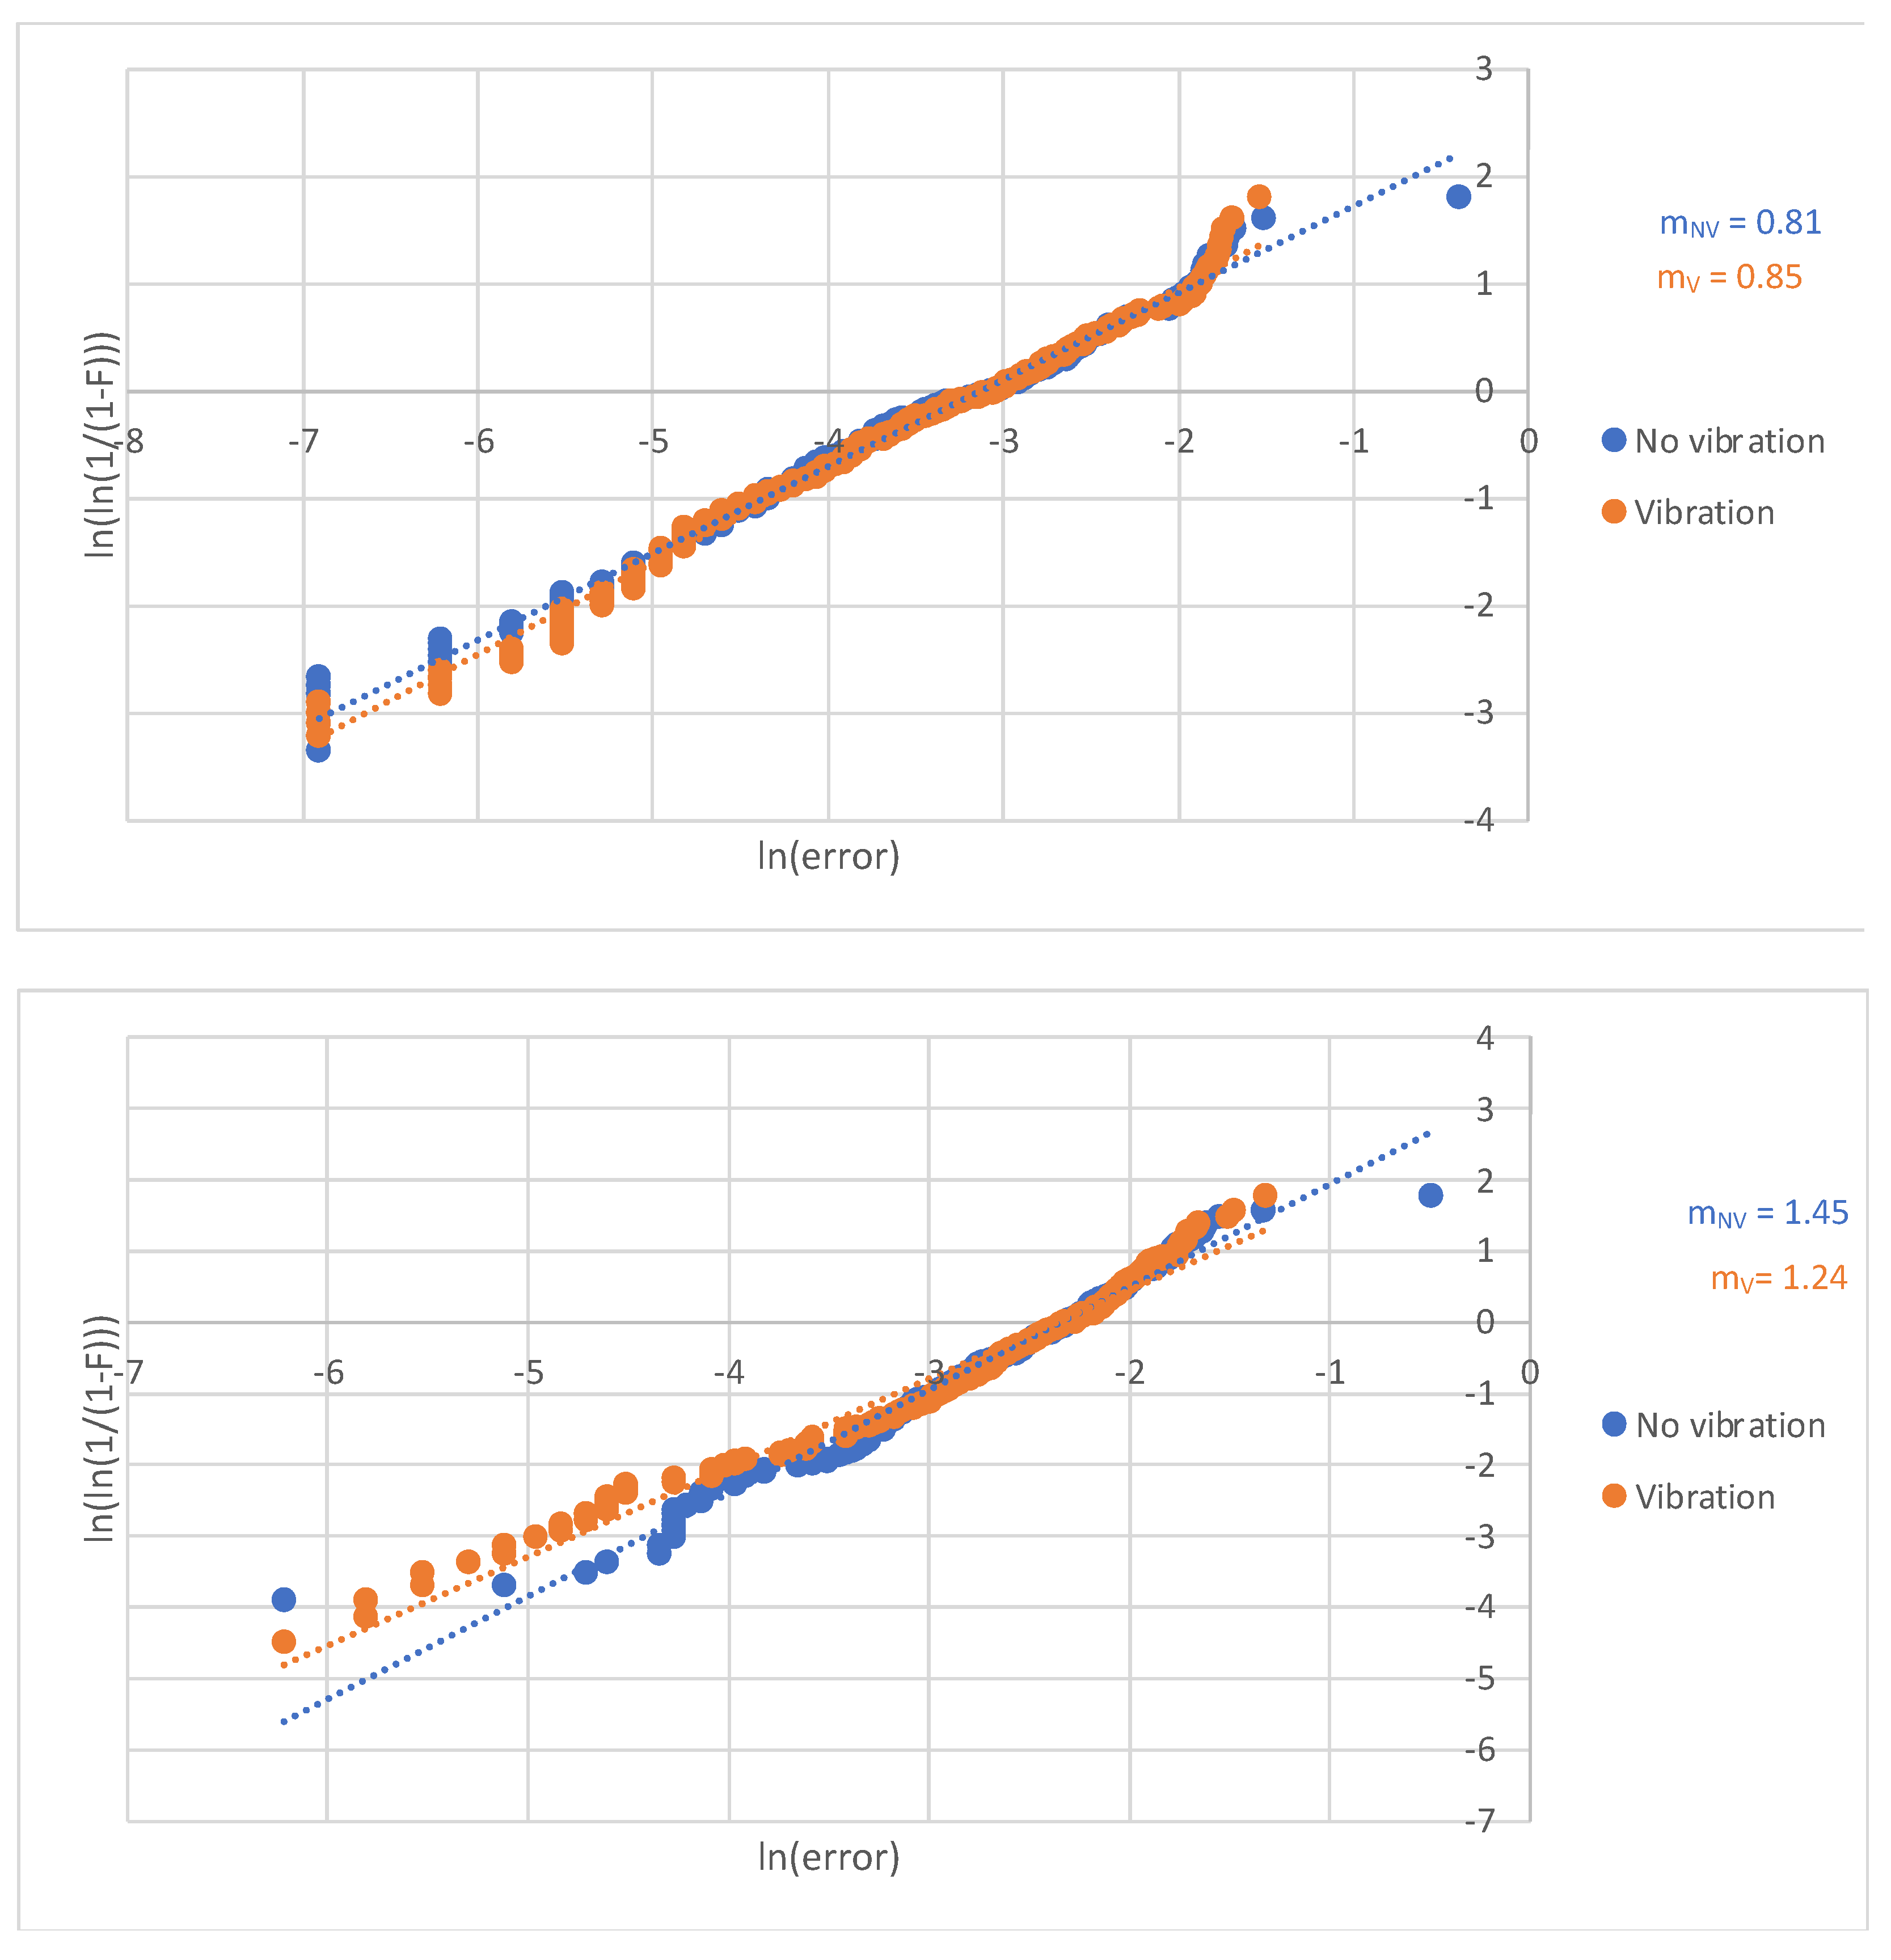
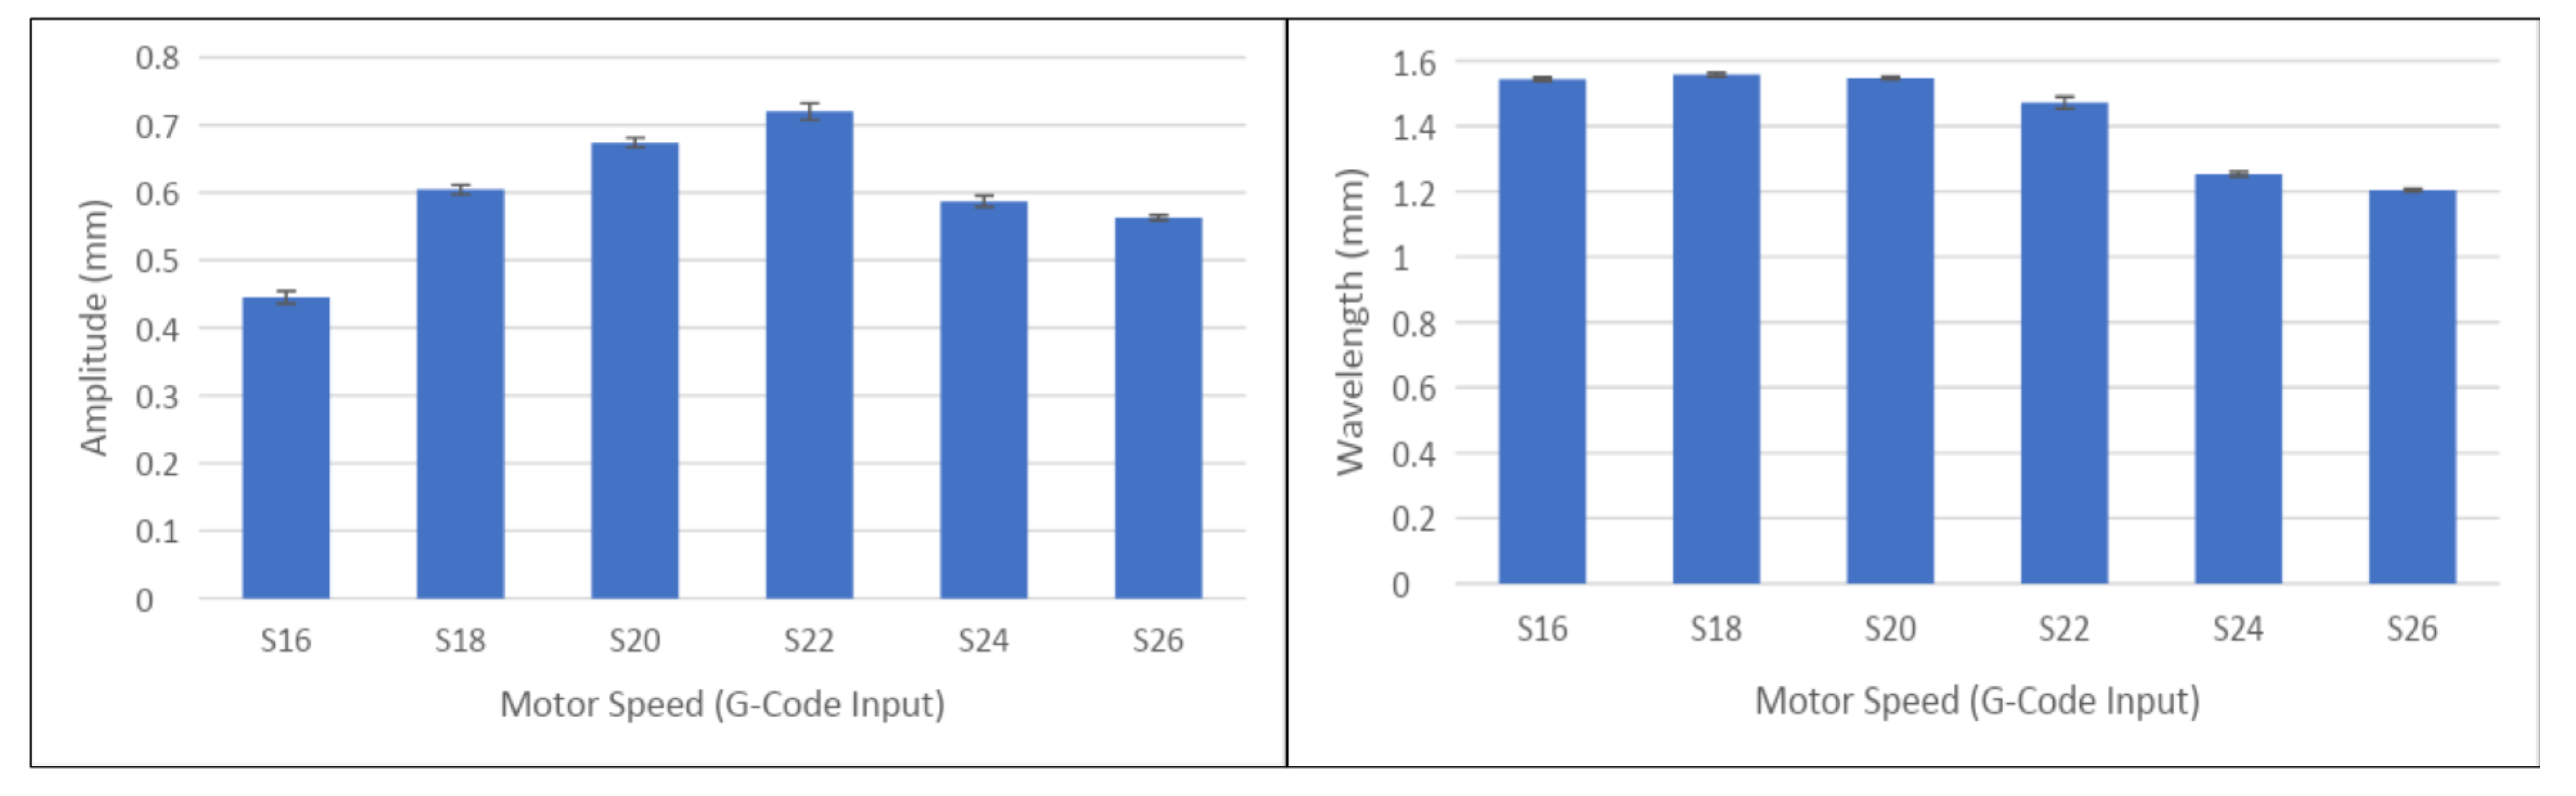
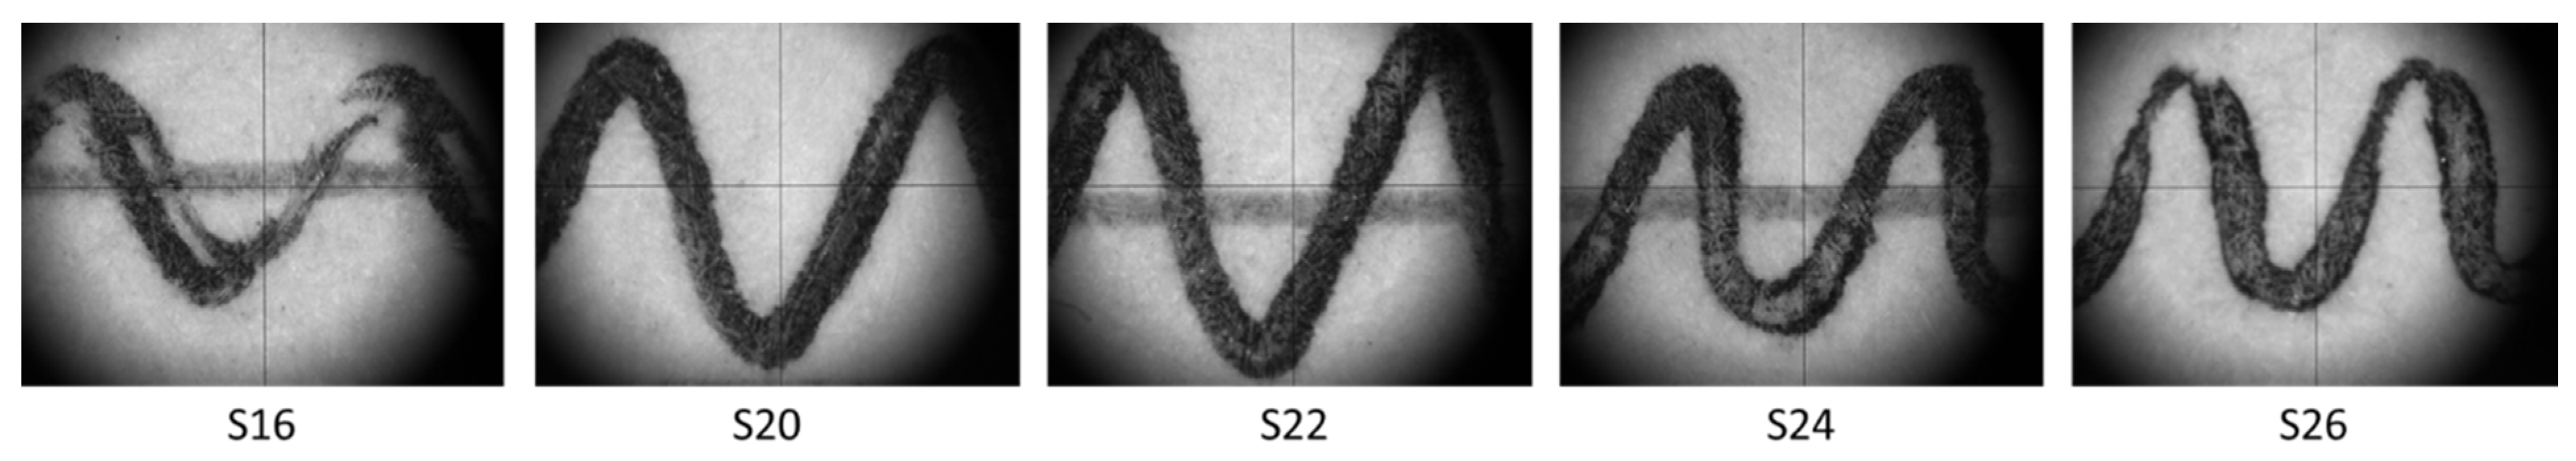
4.2. Positional Accuracy with and without Vibrations

The next task is to identify the amount of positional error caused by the induced vibrations while the material is deposited at a specific point. To determine this, the nozzle is replaced with the pen attachment. The G-code is modified to put single dots at prescribed points instead of continuous material deposition. After the printer’s calibration, graph paper is attached to the printer bed and is aligned with the printer’s axes. Without vibrations, the printer is expected to make marks on the graph paper at accurate locations where the nozzle will typically deposit material. Hence, these points were used as a reference for marks made with induced vibrations. The error is measured as the distance between points made by the pen attachment when the vibration is on and off.
Figure 5 shows a set of marks made by the pen attachment. The left dot represents the reference made without the vibration, and the right represents the mark made with the vibration. The dot printed with vibration is given a deliberate offset of 0.5 mm so that the two marks can be distinguished under the microscope. The pen creates a clear circular indentation upon touching the graph paper, and all measurements are performed at the centers of these circles.
Eighty-one dots are printed on each graph paper without turning the vibration motor on. These dots span the entire printer bed (180 × 180 mm). The nozzle head travels from one dot to the next at a speed of 2400 mm/min, and each dot is printed 30 mm away from the previous one. Then 0.5 mm is added, and another set of 81 dots is printed with induced vibrations at S225 (maximum) speed. This process is repeated for two more sheets of paper. The pairs of resulting dots are similar to the ones shown in Figure 5. Using the micro-metrology station, the error in the dot’s position printed with vibration is measured for each pair. The error in x- and y-directions are counted separately to ensure a consistent measuring technique. This resulted in 243 error measurements, and Figure 6 shows the average error in each direction as measured. The results show that the average error in position is 0.02 mm or less, which is less than the printer’s resolution (0.05 mm as advertised). It is also observed that the error in the y-direction is more significant than that in the x-direction, likely due to the lower stiffness of the mounting bracket in the y-direction.
To understand if the induced vibrations lead to an error significantly different from the standard printing conditions of the printer, a Weibull analysis is performed on the data. Figure 7 shows the studies performed on the x- and y-directions separately. These analyses show that the distribution of errors does not vary significantly between the two experimental conditions—with and without induced vibrations. Any significant differences in the Weibull moduli in a reliability analysis typically indicate a difference in the behavior between the conditions being compared. In this study, the Weibull moduli for these conditions are very similar. This suggests that the induced vibrations do not cause significantly more positional errors than normal printing conditions. In other words, the induced vibrations do not cause a significant deviation from the positional accuracy of the prints.

4.3. Determination of the Optimum Characteristics

The next step in the study is to understand the optimum amplitude and wavelength of the induced vibrations to provide the most optimum infill of material in the printed parts. The printer is instructed to print one inner layer on a sheet of paper to achieve this. Instead of the filament, the pen attachment is also used in this process. Figure 8 shows the variation in the infill as the extruder head speed increases at the S16 vibration level for the most commonly used raster angles. The frequency of vibration varies by changing the print head’s speeds while keeping the vibration level constant. It is observed that the lines are filling more space within the boundary as the print speed slows down, except in the case of the 0° raster angle. Due to the design of the vibration attachment on the cartridge, the vibrations are predominant in the y-direction, while its effect is minimum in the x-direction. This is the reason for the lack of change of material distribution at the 0° raster angle.
As a next step, the pen attachment is replaced with the material filament, and a line is printed in the y-direction at varying amplitudes. The y-direction is chosen as the vibration affects this direction the most. Figure 9 shows the lines printed with no vibration and then with three different speeds of the motor. It is observed that as the motor’s speed increases, the printed lines’ amplitude goes up, but this does not happen when the speed nears the maximum. The amplitude of vibrations reduces as the motor speed increases from level 2 to level 3. This causes lower reach for the material dispensed by the nozzle and thus a non-uniform material distribution.
To explore this further, the filament is again replaced with the pen attachment, and lines are printed on paper at varying speeds of the motor. The rates are varied from S16 to S26 at intervals of two. The resulting lines are put under the micro-metrology station to measure the amplitude and wavelength of each line (Figure 10). At each speed, five 100 mm lines were drawn in the middle of the print bed, spaced at 10 mm intervals. Each line is measured at five different locations. The results are shown in Figure 11. It is observed that as the motor speed increases, the wavelength decreases. The amplitude initially increases with the motor speed but begins to decrease at S24 and S26. This may result from the pen tip rubbing too much against the print bed. If the pen tip is too close to the bed, the vibration wave begins to collapse, as seen in Figure 12. In Figure 12, the vibrated line started to rip the paper due to being too close to the print bed. As the paper rips, the wave collapses into a straight line. This is consistent with higher motor speeds decreasing in amplitude because these amplitudes likely push the pen tip too close to the bed. These amplitudes are likely greater than the pen drawings may show. Proper pen height adjustment is important to ensure that proximity to the print bed does not affect the vibration profile. The pen tip was lowered until it was ~1 mm above the print bed. It was then lowered in increments of 0.1 mm until solid lines could be drawn. This resulted in a pen tip that was roughly 0.1 mm depressed into the piece of paper. Two sheets of paper were used in this experiment, with one sitting directly on top of the other. This allowed for the pen tip to depress the second piece of paper slightly, reducing the chance of the paper ripping. Figure 13 shows magnified images of the same lines in Figure 9. Different vibration levels cause the nozzle to smear material along the width of the print bead. This smearing allows for more excellent adhesion to neighboring beads, as shown in Figure 4.
In summary, higher motor speeds do not lead to greater extents of induced vibrations and hence may not result in the uniform distribution of material as anticipated. For the particular setup used in this study, S22 is likely to be the optimum motor speed for the best quality of the prints. The level of vibration will likely vary from printer to printer.

4.4. Material Properties

For each set of print settings 9 specimens were produced, totaling 154 specimens. Out of the 154, tensile data could only be collected for 142 specimens. Out of these 142 specimens, only 64 failed within the grips. Therefore, fracture characteristics could only be gathered for 64 specimens. For each data point, nine specimens were prepared to eliminate experimental error. Table 3 displays the results for every set of parameters. Column 8 in Table 3 shows the final number of samples with usable test data.
The most significant improvement in mechanical properties came from adding induced vibration for specimens printed in the lower right area of the print bed, with 3600 mm/min print speed and 205 °C extrusion temperature. This increased tensile strength from 36.7 MPa to 39.6 MPa, and elastic modulus from 2933 MPa to 3095 MPa. The two specimens (vibration and no vibration) with the highest tensile strength from this set are shown in Figure 14. The average mechanical property values are listed in Table 4.
Induced vibration did not produce any change in dimensional accuracy. No vibration specimens were on average 3.57 mm thick and 13.12 mm wide, while vibrated specimens were 3.58 mm thick and 13.12 mm wide. Specimens were too long to measure length by micrometer, so they were measured by caliper. Due to the resolution of the calipers, they were not included as a metric for judging dimensional accuracy, and a standard length of 168.5 mm was used to calculate the volume of each specimen. Each specimen was within ±0.2 mm of 168.5 mm lengthwise.
Porosity is defined as the volume of pores in the specimen divided by the volume of the specimen itself:
%   P o r o s i t y = V p V s
Vp can also be expressed as the volume of the specimen minus the volume of water displaced (VsVd):
%   P o r o s i t y = 1 V d V s
Specimens subjected to induced vibrations had lower values of porosity. Values for porosity were smaller than those reported in Song et al. [24]. This is due to the size of the nozzle and bead width used in combination with layer height. The bead width used was five times larger than the layer height used, producing relatively flat beads. Rounder beads result in more porosity, since the corners of these beads will be empty space, while rectangular beads with have more material at these interfaces. Specimens without induced vibration had an average porosity of 4.0% volume, while those subjected to induced vibration had 3.2% porosity on average, as shown in Figure 15.
Inducing vibration appeared to alter the shape of the rasters. Inducing vibration is also shown to cause fusing between rasters, making it difficult to identify individual beads. The fusion present in the induced vibration specimen gives it the appearance of more homogenous material. While this fusion likely increased mechanical properties by decreasing porosity and increasing bead adhesion, it also made rasters thinner at certain sections, creating weak points susceptible to fracture. This may be why specimens with induced vibration had lower strain at fracture than specimens without induced vibration. While the air gap was defined as 0% in the software, it is clear that the air gap in the part is positive. While this gap can be reduced by carefully adjusting print parameters, it is difficult to eliminate completely. Induced vibration can compensate for this by pushing material into open gaps. The images of the broken cross-section are shown in Figure 16. In the figure, the gaps between some layers are visible, indicating a lack of bonding between the layers. The samples with vibration show a better distribution of material between the layers—this may likely lead to better bonding between them.
The results for the second print experiment are shown in Figure 17 and listed in Table 5. This experiment employed the same set of print parameters as experiment 1, but used a layer height of 0.35 mm. A larger layer height was used to maximize the presence of voids [24], which was expected to increase the effect of vibration. As vibration increased, so did tensile strength, elastic modulus, and fracture strength. However, as vibration level increased, strain at tensile strength and strain at fracture strength decreased.
S16 and S19 had very similar mechanical properties, suggesting that using these motor speeds will yield similar results. S22 had the greatest effect on the mechanical properties of the part, increasing each metric except strain at fracture strength. As vibration increases, mechanical properties will improve, but the fracture characteristics become less desirable. Figure 18 shows the fracture surfaces for different levels of vibration. No vibration specimens tended to fail along the rasters, while specimens with vibration had relatively flat fracture surfaces. Specimens with vibration had saw tooth patterns along their fracture surface, oriented in line with the alternating 45° rasters. It should be noted that the samples in Figure 18 do not show their final two layers. For the final layers of printing, the vibration is typically turned off to obtain a smoother surface finish. In order to visualize the pores, the printing was discontinued before the final layers are printed.
The vibration did not have a significant effect on dimensional accuracy. The length was also measured like in the first print experiment but not included as a metric for judging dimensional accuracy. Lengths were within ±0.2 mm of 168.5 mm. As vibration increased, the dimensions increased slightly, but enough to be notable. The largest deviation occurs between the no vibration and the S22 vibration level. Vibration at this speed increased width and thickness by only 0.2%, as indicated in Table 6.
Figure 19 shows porosity for different levels of vibration. As the vibration level increased, porosity decreased. Print experiment 2 featured a relatively large layer height (0.35 mm), which is why the no vibration specimens had large porosity (11.1% volume pores). As the vibration level increased, filament was pushed into the gaps between rasters, decreasing porosity. S16 and S19 had the same porosity at 8.9% and 9.0%, respectively, while S22 had the lowest volume of pores at 7.7%.
Figure 20 shows the SEM images for specimens at different levels of vibration. The cross-sections of no vibration beads are rounder than those in the first print experiment. The larger layer height used in print experiment 2 produced a smaller layer height to bead width ratio, resulting in oval-shaped beads. S16 in this experiment produced a similar cross-section to that in print experiment 1. At this vibration level, rasters are starting to fuse, but are still distinguishable. Each layer is still different as well. However, as vibration increased, the rasters became increasingly fused, and the infill approached a homogenous consistency.

5. Conclusions

Considering the increasing popularity of cheap desktop 3D printers for various tasks, including prototyping, this study explores a potential method to improve the quality of the printed material. The setup developed in this study induced vibrations to the extrusion nozzle of an FT-5 R2 3D printer to increase inter-bead and inter-layer adhesion throughout the printed parts. The study explores the positional accuracy of resulting prints by replacing the extruder with a pointed-tip pen. With induced vibrations, dots are printed at specific points on paper that is placed on the printer bed. The positional accuracy of these points is measured against the dots printed without vibration. The results show that the induced vibrations do not cause a significant departure in a position that would already occur in the printer naturally. Further, investigation on printed lines and samples also show that there is no significant variation from the anticipated accuracy of the parts. The mechanical properties and porosity of the printed parts have improved with induced vibrations.
Further, using printed lines, it is determined that a high amplitude is desirable to obtain the maximum distribution of the material. However, it is also observed that high motor speeds do not necessarily guarantee a high amplitude. A medium speed of the motor is found to be desirable to obtain the optimum amount of vibration. In summary, the designed setup is a very effective way to improve the quality of printed PLA parts. While the improvement in mechanical properties of printed parts with vibration has been proved by prior works, the contribution of this work lies in the evidence that the added vibrations do not cause a significant variation in the dimensional accuracy of printed parts.

6. Limitations of the Study

The FT5-R2 printers, along with many other RepRap style printers, use small screws to fasten their parts (~M3). For added vibration to be effective, the parts that make up the printer must be sufficiently torqued. Since many 3D printer parts use small hardware, screws are prone to stripping before reaching an adequate amount of torque. If screws are not properly torqued, they are prone to loosening. This was apparent in our printer, as vibration loosened the set screws in the pulleys that drove the z- and y-axis. We recommend using larger hardware where possible and to secure critical hardware with low strength thread locker. The FT5-R2 is a large printer compared to many other desktop printers. It is made up of thick aluminum extrusions, making it capable of withstanding greater levels of vibration. Different printers using the same vibration motor will likely experience other vibration characteristics. Further research is needed to determine how significant these differences are. We recommend using a vibration motor with a smaller offset weight for smaller printers.
This experiment treats the vibration level (S16–S26) as the independent variable for studying the porosity and strength of the printed part. Vibration amplitude is the factor influencing the actual material distribution, and in an ideal setting, the amplitude should be used as the variable factor. The variation of amplitude does not change linearly with the motor setting. We plan to conduct follow-up experiments with vibration amplitude as the independent variable.

7. Future Work

One of the key focuses of our study is the positional accuracy of printed parts. However, 3D printing is a process that often takes a significant amount of time for complicated geometries. The effect of inducing vibrations for such long periods of time has not been explored in the current study. The possibility of permanent offset due to very long printing times (>8 h) will be explored in future work.
The porosity and strength of printed parts are considered independent parameters in this study. However, the porosity does influence the strength. This dependency also should be explored in future work.

Author Contributions

Conceptualization, O.K. and V.V.; methodology, O.K. and J.D.R.; software, V.V.; validation, O.K. and V.V.; formal analysis, J.D.R.; investigation, J.D.R.; resources, V.V.; data curation, J.D.R.; writing—original draft preparation, J.D.R. and V.V.; writing—review and editing, V.V. and O.K.; visualization, J.D.R. and V.V.; supervision, V.V.; project administration, V.V. All authors have read and agreed to the published version of the manuscript.

Funding

This research received no external funding.

Institutional Review Board Statement

Not applicable.

Informed Consent Statement

Not applicable.

Data Availability Statement

All the data associated with this study are available in this paper.

Acknowledgments

This work is completed as a part of the Master’s project of the first author, and submitted to the Mechanical Engineering Department at San Jose State University. Part of this work has been published in the proceedings of ASME’s 2019 International Mechanical Engineering Congress and Exposition (IMECE 2019) [37]. The IMECE 2019 paper featured limited data, and the authors have added significantly more data to this paper. The authors have added significantly more content to this journal version.

Conflicts of Interest

The authors declare no conflict of interest.

References

  1. Mueller, B. Additive Manufacturing Technologies—Rapid Prototyping to Direct Digital Manufacturing. Assem. Autom. 2012, 32. [Google Scholar] [CrossRef]
  2. Petrovic, V.; Gonzalez, J.V.H.; Ferrando, O.J.; Gordillo, J.D.; Puchades, J.R.B.; Griñan, L.P. Additive layered manufacturing: Sectors of industrial application shown through case studies. Int. J. Prod. Res. 2010, 49, 1061–1079. [Google Scholar] [CrossRef]
  3. Upcraft, S.; Fletcher, R. The Rapid Prototyping Technologies. Assem. Autom. 2003, 23, 318–330. [Google Scholar] [CrossRef]
  4. Tymrak, B.M.; Kreiger, M.; Pearce, J.M. Mechanical properties of components fabricated with open-source 3-D printers under realistic environmental conditions. Mater. Des. 2014, 58, 242–246. [Google Scholar] [CrossRef]
  5. Adams, S. Half Million 3d Printers Sold in 2017—On Track for 100m Sold in 2030. 2018. Available online: https://3dprintingindustry.com/news/half-million-3d-printers-sold-2017-track-100m-sold-2030-131642/ (accessed on 5 May 2018).
  6. Jones, R.; Haufe, P.; Sells, E.; Iravani, P.; Olliver, V.; Palmer, C.; Bowyer, A. Reprap–the Replicating Rapid Prototyper. Robotica 2011, 29, 177–191. [Google Scholar] [CrossRef]
  7. Pearce, J.M. Building Research Equipment with Free, Open-Source Hardware. Science 2012, 337, 1303–1304. [Google Scholar] [CrossRef]
  8. Pearce, J.M. Open-Source Lab: How to Build Your Own Hardware and Reduce Research Costs; Newnes; Elsevier: Amsterdam, The Netherlands, 2013. [Google Scholar]
  9. Pearce, J.M.; Blair, C.M.; Laciak, K.J.; Andrews, R.; Nosrat, A.; Zelenika-Zovko, I. 3-D Printing of Open Source Appropriate Technologies for Self-Directed Sustainable Development. J. Sustain. Dev. 2010, 3, 17. [Google Scholar] [CrossRef]
  10. Turner, B.; Strong, R.; Gold, S. A Review of Melt Extrusion Additive Manufacturing Processes: I. Process Design and Modeling. Rapid Prototyp. J. 2014, 20, 192–204. [Google Scholar] [CrossRef]
  11. Neff, C.; Trapuzzano, M.; Crane, N.B. Impact of vapor polishing on surface quality and mechanical properties of extruded ABS. Rapid Prototyp. J. 2018, 24, 501–508. [Google Scholar] [CrossRef]
  12. Singh, R.; Singh, S.; Singh, I.P. Effect of Hot Vapor Smoothing Process on Surface Hardness of Fused Deposition Modeling Parts. 3D Print. Addit. Manuf. 2016, 3, 128–133. [Google Scholar] [CrossRef]
  13. Espalin, D.; Medina, F.; Arcaute, K.; Zinniel, B.; Hoppe, T.; Wicker, R. Effects of Vapor Smoothing on Abs Part Dimensions. In Proceedings of the Proceedings from Rapid 2009 Conference & Exposition, Schaumburg, IL, USA, 26–27 May 2009. [Google Scholar]
  14. Popescu, D.; Zapciu, A.; Amza, C.; Baciu, F.; Marinescu, R. Fdm Process Parameters Influence over the Mechanical Properties of Polymer Specimens: A Review. Polym. Test. 2018, 69, 157–166. [Google Scholar] [CrossRef]
  15. Tanikella, N.G.; Wittbrodt, B.; Pearce, J.M. Tensile strength of commercial polymer materials for fused filament fabrication 3D printing. Addit. Manuf. 2017, 15, 40–47. [Google Scholar] [CrossRef]
  16. Chacón, J.; Caminero, M.Á.; García-Plaza, E.; Núñez, P.J. Additive Manufacturing of Pla Structures Using Fused Deposition Modelling: Effect of Process Parameters on Mechanical Properties and Their Optimal Selection. Mater. Des. 2017, 124, 143–157. [Google Scholar] [CrossRef]
  17. Sood, A.K.; Ohdar, R.; Mahapatra, S. Parametric appraisal of mechanical property of fused deposition modelling processed parts. Mater. Des. 2010, 31, 287–295. [Google Scholar] [CrossRef]
  18. Kuznetsov, V.E.; Solonin, A.N.; Urzhumtsev, O.D.; Schilling, R.; Tavitov, A.G. Strength of PLA Components Fabricated with Fused Deposition Technology Using a Desktop 3D Printer as a Function of Geometrical Parameters of the Process. Polymers 2018, 10, 313. [Google Scholar] [CrossRef]
  19. Gibson, I.; Rosen, D.W.; Stucker, B. Additive Manufacturing Technologies; Springer: Berlin/Heidelberg, Germany, 2014. [Google Scholar]
  20. Eiliat, H.; Urbanic, J. Determining the relationships between the build orientation, process parameters and voids in additive manufacturing material extrusion processes. Int. J. Adv. Manuf. Technol. 2018, 100, 683–705. [Google Scholar] [CrossRef]
  21. Ravi, P.; Shiakolas, P.S.; Thorat, A.D. Analyzing the Effects of Temperature, Nozzle-Bed Distance, and Their Interactions on the Width of Fused Deposition Modeled Struts Using Statistical Techniques toward Precision Scaffold Fabrication. J. Manuf. Sci. Eng. 2017, 139, 071007. [Google Scholar] [CrossRef]
  22. Eiliat, H.; Urbanic, J. Visualizing, Analyzing, and Managing Voids in the Material Extrusion Process. Int. J. Adv. Manuf. Technol. 2018, 96, 4095–4109. [Google Scholar] [CrossRef]
  23. Jin, Y.-A.; He, Y.; Xue, G.-H.; Fu, J.-Z. A parallel-based path generation method for fused deposition modeling. Int. J. Adv. Manuf. Technol. 2015, 77, 927–937. [Google Scholar] [CrossRef]
  24. Song, Y.; Li, Y.; Song, W.; Yee, K.; Lee, K.-Y.; Tagarielli, V. Measurements of the Mechanical Response of Unidirectional 3d-Printed Pla. Mater. Des. 2017, 123, 154–164. [Google Scholar] [CrossRef]
  25. Coogan, T.J.; Kazmer, D.O. Bond and part strength in fused deposition modeling. Rapid Prototyp. J. 2017, 23, 414–422. [Google Scholar] [CrossRef]
  26. Hossain, M.S.; Espalin, D.; Ramos, J.; Perez, M.; Wicker, R. Improved Mechanical Properties of Fused Deposition Modeling-Manufactured Parts Through Build Parameter Modifications. J. Manuf. Sci. Eng. 2014, 136, 061002. [Google Scholar] [CrossRef]
  27. Boschetto, A.; Bottini, L. Accuracy Prediction in Fused Deposition Modeling. Int. J. Adv. Manuf. Technol. 2014, 73, 913–928. [Google Scholar] [CrossRef]
  28. Santana, L.; Ahrens, C.H.; da Costa Sabino Netto, A.; Bonin, C. Evaluating the deposition quality of parts produced by an open-source 3D printer. Rapid Prototyp. J. 2017, 23, 796–803. [Google Scholar] [CrossRef]
  29. Melenka, G.; Schofield, J.S.; Dawson, M.; Carey, J. Evaluation of dimensional accuracy and material properties of the MakerBot 3D desktop printer. Rapid Prototyp. J. 2015, 21, 618–627. [Google Scholar] [CrossRef]
  30. Roberson, D.; Espalin, D.; Wicker, R. 3D printer selection: A decision-making evaluation and ranking model. Virtual Phys. Prototyp. 2013, 8, 201–212. [Google Scholar] [CrossRef]
  31. Alafaghani, A.; Qattawi, A.; Alrawi, B.; Guzman, A. Experimental Optimization of Fused Deposition Modelling Processing Parameters: A Design-for-Manufacturing Approach. Procedia Manuf. 2017, 10, 791–803. [Google Scholar] [CrossRef]
  32. Lanzotti, A.; Grasso, M.; Staiano, G.; Martorelli, M. The impact of process parameters on mechanical properties of parts fabricated in PLA with an open-source 3-D printer. Rapid Prototyp. J. 2015, 21, 604–617. [Google Scholar] [CrossRef]
  33. Sealy, M.P.; Madireddy, G.; Williams, R.E.; Rao, P.; Toursangsaraki, M. Hybrid Processes in Additive Manufacturing. J. Manuf. Sci. Eng. 2018, 140, 060801. [Google Scholar] [CrossRef]
  34. Wu, W.; Jiang, J.; Jiang, H.; Liu, W.; Li, G.; Wang, B.; Tang, M.; Zhao, J. Improving Bending and Dynamic Mechanics Performance of 3d Printing through Ultrasonic Strengthening. Mater. Lett. 2018, 220, 317–320. [Google Scholar] [CrossRef]
  35. Keleş, Ö.; Anderson, E.H.; Huynh, J. Mechanical reliability of short carbon fiber reinforced ABS produced via vibration assisted fused deposition modeling. Rapid Prototyp. J. 2018, 24, 1572–1578. [Google Scholar] [CrossRef]
  36. Dei Rossi, J.; Keleş, Ö.; Viswanathan, V. Fused Deposition Modeling with Added Vibrations: A Parametric Study on the Accuracy of the Printed Parts. In Proceedings of the ASME International Mechanical Engineering Congress and Exposition (IMECE 2019), Salt Lake City, UT, USA, 11–14 November 2019. [Google Scholar]
  37. Instron. Instron 5960 Series Universal Testing Systems. 2019. Available online: https://www.instron.us/products/testing-systems/universal-testing-systems/electromechanical/5900-series/5960-dual-column (accessed on 23 September 2019).
Figure 1. Folger Tech FT-5 R2 printer was used for the experiment.
Applsci 12 09327 g001
Figure 2. (a) Vibration and pen mounts as attached to the cartridge of the printer; (b) the schematic diagram for the motor connection.
Applsci 12 09327 g002
Figure 3. The adapter used for attaching the pen to the cartridge.
Applsci 12 09327 g003
Figure 4. Material distribution within the 3D-printed samples with and without induced vibrations—both images are taken at the same magnification and the scale is as shown. For the samples shown, the pore sizes are measured at 0.6 mm for the sample without vibration and 0.25 mm for the one with vibration.
Applsci 12 09327 g004
Figure 5. Sample vibration and offset non-vibration dots printed as observed through the microscope.
Applsci 12 09327 g005
Figure 6. Error in position induced by vibration. The standard error is too small to show in the figure.
Applsci 12 09327 g006
Figure 7. Weibull plots for the errors observed in the two experimental conditions: x-direction (above) and y-direction (below).
Applsci 12 09327 g007
Figure 8. Variation in the infill of the printed parts with increasing print speeds for different standard raster angles.
Applsci 12 09327 g008
Figure 9. Lines made with the pen-attachment in the y-direction with increasing amplitudes of induced vibration.
Applsci 12 09327 g009
Figure 10. 3D-printed lines in the y-direction with increasing amplitudes of induced vibration.
Applsci 12 09327 g010
Figure 11. Variation in the amplitude and wavelength of vibrations with varying motor speeds. Error bars represent (±) 1 S.E.
Applsci 12 09327 g011
Figure 12. A line was drawn at S26, before and after the collapse, likely due to the pen rubbing on the paper.
Applsci 12 09327 g012
Figure 13. Lines drawn at different motor speeds as viewed through the microscope.
Applsci 12 09327 g013
Figure 14. Stress–strain curve for lower right region of print bed, with 3600 mm/min print speed and 205 °C extrusion temperature.
Applsci 12 09327 g014
Figure 15. Porosity of specimens with and without induced vibration.
Applsci 12 09327 g015
Figure 16. Microscopic images of the cross-sections at the break.
Applsci 12 09327 g016
Figure 17. Stress–strain curve for 0.35 mm print layer thickness with varying levels of vibration.
Applsci 12 09327 g017
Figure 18. Cross-sections of the specimens at the fracture.
Applsci 12 09327 g018
Figure 19. Porosity at various levels of induced vibration. All error bars show (±1) S.E.
Applsci 12 09327 g019
Figure 20. SEM images of samples at varying levels of vibration.
Applsci 12 09327 g020
Table 1. Printer settings were used for the study.
Raster AngleExtrusion MultiplierExtrusion WidthLayer HeightPerimeter LayersFill PercentageBed TemperatureNozzle Diameter
−45°/45°0.901.2 mm0.2 mm1100%55 °C1 mm
Table 2. Print parameters varied during the experiment.
Area of Print BedVibration LevelPrint Head SpeedExtruder Temperature
Upper LeftOff2400 mm/min195 °C
Lower RightOn3600 mm/min205 °C
Table 3. Results from the tensile test of the printed samples.
Print Speed (mm/min)No VibrationWith Vibration (S16)
Number of samples2400511
36002227
Average tensile strength (Mpa)240035.537.7
360033.536.5
Average strain at failure (%)24001.82.0
36001.82.1
Average elastic modulus24002933.82969.8
36002799.02862.3
Average fracture strength (Mpa)240031.533.7
360028.433.5
Average strain at fracture (%)24003.22.7
36003.32.8
Extrusion temperature = 200 °C
Table 4. Average mechanical property values for each category of printed parts.
Tensile Strength
(MPa)
Strain at Tensile Strength
(%)
Elastic Modulus
(MPa)
Fracture Strength
(MPa)
Strain at Fracture Strength
(%)
No Vibration34.51.8285928.73.2
Vibration37.12.0291433.32.7
Table 5. Results from the second experiment with a layer height of 0.35 mm.
Tensile Strength
(MPa)
Strain at Tensile Strength
(%)
Elastic Modulus
(MPa)
Fracture Strength
(MPa)
Strain at Fracture Strength
(%)
No Vibration26.82.09242719.33.5
S1629.22.00254521.03.2
S1929.12.0254821.33.2
S2229.61.97259024.43.0
Table 6. Effect of vibration on the print thickness.
Thickness
(mm)
Width
(mm)
S.E. Thickness
(mm)
S.E. Width
(mm)
No Vibration3.58213.1300.0100.012
S163.57613.1400.0020.003
S193.59013.1390.0030.004
S223.59013.1560.0040.003
Publisher’s Note: MDPI stays neutral with regard to jurisdictional claims in published maps and institutional affiliations.

