Article

The High-Precision Detection Method for Insulators’ Self-Explosion Defect Based on the Unmanned Aerial Vehicle with Improved Lightweight ECA-YOLOX-Tiny Model

School of Mechanical Engineering, Tianjin University of Technology and Education, Tianjin 300222, China
*
Authors to whom correspondence should be addressed.
Appl. Sci. 2022, 12(18), 9314; https://doi.org/10.3390/app12189314
Submission received: 6 August 2022 / Revised: 5 September 2022 / Accepted: 14 September 2022 / Published: 16 September 2022

Abstract

:
Aiming at the application of the overhead transmission line insulator patrol inspection requirements based on the unmanned aerial vehicle (UAV), a lightweight ECA-YOLOX-Tiny model is proposed by embedding the efficient channel attention (ECA) module into the lightweight YOLOX-Tiny model. Some measures of data augmentation, input image resolution improvement and adaptive cosine annealing learning rate are used to improve the target detection accuracy. The data of the standard China power line insulator dataset (CPLID) are used to train and verify the model. Through a longitudinal comparison before and after the model improved, and a cross-sectional comparison with other similar models, the advantages of the proposed model are verified in terms of multi-target identification for normal insulators, localization for small target defect areas, and the parameters required for calculation. Finally, the comparative analysis between the proposed ECA-YOLOX-Tiny model and YOLOV4-Tiny model is given by introducing the visualization method of class activation mapping (CAM). The comparative results show that the ECA-YOLOX-Tiny model is more accurate in locating the self-explosion areas of defective insulators, and has a higher response rate for decision areas and some special backgrounds, such as the overlapping small target insulators, the insulators obscured by tower poles, or the insulators with high-similarity backgrounds.

1. Introduction

Insulators are the essential insulation safety devices in overhead transmission lines. Under the effects of long-term climate change, chemical corrosion, strong electrical field and excessive mechanical load, the insulators are very prone to self-explosion failure, and damage the safe operation of the whole line. Therefore, it is necessary to regularly inspect the insulators of overhead transmission lines. At present, UAV is the main way to inspect overhead transmission lines due to its advantages of small size, low inspection difficulty and cost, high efficiency and safety, and the ability to adapt to bad weather and natural disaster conditions [1,2,3,4].
The key technologies of UAV regular inspection for overhead transmission lines lie in two aspects of the working performance of UAV and the automatic detection and identification of defects. With the development of UAV technologies, the basic technologies in terms of lightweight structure, continuous working ability, path planning and navigation, and integrated control, etc., are mature and meet the requirements of overhead transmission line inspection. What is more, a large number of deep learning algorithms for target detection are emerging and the proper application effect in the field of object detection are achieved in recent years.
The deep learning target detection algorithms can be divided into two-stage algorithms and one-stage algorithms according to their characteristics. Based on the principle of two-stage algorithms, some candidate boxes are generated first, and their feature information is extracted, and then the position boxes are generated and the corresponding categories are predicted. The high detection precision and low detection speed are two difficult balancing characteristics of two-stage algorithms. The representative models of two-stage algorithms include R-CNN [5], spatial pyramid pooling networks (SPPNet) [6], fast R-CNN [7], and faster R-CNN [8], etc. On the contrary, the classification and regression localization are performed directly during the candidate boxes generated in the one-stage algorithms, and the low detection precision and high detection speed are two difficult balancing characteristics of one-stage algorithms. The representative models of one-stage algorithms include You Only Look Once (YOLO, V1–V5 versions) [9,10,11,12,13] and single shot multibox detector (SSD) [14], etc. The related applications are given as follows: the CME-CNN was used firstly by Wen et al. to eliminate complex background information and then the Exact R-CNN was used to detect insulator defects [15]. The faster R-CNN and SSD-MobileNet were used by Ghoury et al. to identify grapes as well as grape leaves diseases [16]. The improved YOLOV5 was used by Yan et al. to conduct real-time detection for robot apple-picking [17].
Based on the application requirements and continuous development of deep learning, a number of lightweight models are emerging, the lightweight classification models include SqueezeNet [18], ShuffleNet [19], MobileNet, and MnasNet, etc., and the lightweight target detection models include YOLOV3-Tiny [20] and YOLOV4-Tiny, etc. The related applications are given as follows: the lightweight MnasNet was used to replace the feature extraction network of SSD by Liu et al. and the improved ISSD network was used to detect insulators and spacers [21]. The lightweight MobileNet was adopted to improve the YOLOV4 model by Qiu et al. and the defect of insulator images after Laplace sharpening was detected [22]. The lightweight YOLOV4-Tiny was used by Qiu et al. to detect birds associated with transmission line faults [23]. In 2021, the YOLOX algorithm was proposed by Ge et al. which improved the detection accuracy and reduced the model size compared with other similar algorithms in the YOLO family [24].
In practical applications, the computational capability of UAV is a limiting factor. The main reasons are listed as follows: the perfect and spectacular results that can be achieved by deep convolution neural networks (DCNN) rely on expensive computing resources, which hinders the neural network models which can be applied in small mobile devices such as UAV. In addition, it is difficult to embed the DCNN into mobile devices due to the large scale and complex structure of current target detection models. Based on the above analysis, a high-precision and real-time lightweight ECA-YOLOX-Tiny model is proposed in this paper and used to detect the self-explosion defect of insulators by UAV. The flow chart of insulator defect detection based on UAV is shown in Figure 1.

2. The Construction of ECA-YOLOX-Tiny Network Model

2.1. The Lightweight Attention Module Introduction

Multiple versions of YOLO target detection algorithms have been proposed after continuous optimization, and a good balance between detection accuracy and speed has been achieved. YOLOX-Tiny is a lightweight model of YOLOX, compared with other versions of YOLOX, the structure size of YOLOX-Tiny is smaller, the required parameters are fewer, and the requirements for hardware conditions are lower. Therefore, YOLOX-Tiny is more suitable for UAV with limited calculative ability.
The model’s detection performance will usually be decreased after the network is lightened. In recent years, the attention mechanism has been widely adopted in deep learning target detection networks to improve the model performance. The more complex network structures are designed in attention modules Squeeze and Excitation (SE) [25] and Convolutional Block Attention Module (CBAM) [26] to improve the performance of the model. The fully connected layers are adopted in SE and CBAM, which substantially increases the number of parameters, the complexity of structure and the cost of computation. The Efficient Channel Attention (ECA) [27] is a lightweight improvement module based on SE. In the ECA module, the two fully connected layers of the SE module are replaced by a kind of 1D convolution with adaptive kernel size, which improves the attention of the original model and only adds a small number of parameters, and the contradiction between model performance and structure complexity is commendably solved. The structures of SE and ECA are respectively shown in Figure 2a,b.
In Figure 2, χ R W × H × C is the output of the convolution module. W, H, and C are the width, height, and channel dimension of feature maps, respectively. The kernel size k of 1D convolution represents the coverage of cross-channel interaction, which indicates how many neighboring channels are involved in the attention prediction of a channel. The kernel size k is proportional to the channel dimension C and can be determined adaptively by a nonlinear mapping of channel dimensions. r is the down-scaling rate, and σ is the sigmoid function, represents the element-wise product.
In ECA, the global average pooling (GAP) without channel dimension decline is used to polymerize the global features of images, the 1D convolution is used to learn directly, and then the weight coefficients of the channels are fixed between 0 and 1 by one-time calculation of the sigmoid function. Finally, the weighted multiplication between these coefficients and input features is carried out to increase the interest of important features and suppress the interest of unimportant features.
Compared with SE, ECA uses 1D convolution to replace fully connected layers to avoid significantly increasing the model parameters and thereby improving the nonlinear capability of the model. The negative impact of dimension decline on the model performance is avoided and the local cross-channel information interaction strategy is used to improve the performance of the ECA model.
Based on the above analysis, an efficient channel attention module is embedded into the YOLOX-Tiny to enhance the model learning capability and improve the defect detection accuracy for insulators.

2.2. Adjustment of Input Image Resolution

In general, a lot of detailed information on small targets can be retained in high-resolution images. In order to further improve the detection accuracy of the YOLOX-Tiny model for small target defect areas of insulators and multi-scale multi-target insulators, the input image resolution of the YOLOX-Tiny model is adjusted appropriately. The input image resolution of the original YOLOX-Tiny model is reshaped from 416 × 416 to 640 × 640.

2.3. Optimization of the YOLOX-Tiny Model

The YOLOX-Tiny model mainly consists of a backbone feature extraction network (Backbone), an enhanced feature extraction network (Neck) and a prediction module (Precision). The ECA-YOLOX-Tiny model with ECA attention mechanism and high input image resolution is shown in Figure 3. The ECA module is added into three different scales of preliminary effective feature output layers from the YOLOX-Tiny backbone network, meanwhile, the ECA module is also added into the second down-sampling results of the Neck module.
In Figure 3, Cls is the object category contained in the determine feature point (H × W × C), Reg is the regression parameters of the determine feature point (H × W × 4), and Obj is used to judge whether the object is contained in feature point (H × W × 1). CBS is the combination of convolution layer (Conv2D), batch normalization (BN) layer and SiLU activation function.
The detailed description of the model from the backbone feature extraction network to the prediction section is provided in Appendix A.

3. The Construction of the Dataset

The standard China power line insulator dataset (CPLID) [3] is used for model training and testing in the paper. CPLID includes 248 images of self-explosion insulators and 600 images of normal insulators with 1152 × 864 image resolution. If the insulator sample is insufficient, the characteristic information of the insulators cannot be fully learned by the network model, and the detection accuracy of the model for small target defect areas and multi-target insulators at different scales is low. Based on the original images of CPLID, the methods of mirroring, rotation, cropping and scaling, contrast adjustment and brightness adjustment are used to enhance the sample data according to the flight shooting conditions of UAV (such as shooting location, angle, weather conditions, light intensity, distance, etc.). Through the data augmentation methods, 2232 images of self-explosion insulators and 3600 images of normal insulators are obtained. The data augmentation effect is shown in Figure 4.
The Labelimg annotation tool is used to annotate the dataset, and 90% of the dataset is randomly selected as the training set (4723 images), 10% of the dataset is randomly selected as the testing set (525 images), and then 10% of the training set is randomly selected as the validation set (584 images).

4. Case Verification and Analysis

4.1. Running Environment and Parameter Settings

At present, small mobile devices such as UAV mostly employ CPU processors. In order to simulate the hardware environment of UAV, the case analysis in the paper is carried out on the PC terminal, and the hardware configuration and software development environment are shown in Table 1.
The network training parameters are set out in Table 2.
The descriptions of the adaptive cosine annealing learning rate (ACLR) and freeze training are given below.
The learning rate (LR) is a very important hyperparameter at the model training stage, which directly controls the pace of the parameters’ updating process. The gradient descent algorithm is usually used to optimize objective function, the learning rate should become smaller so as to make the model as close as possible to the minimum when the loss value is nearing the global minimum. According to this principle, the learning rate can be reduced by the cosine function of the cosine annealing method, and a good effect can be obtained by combining this descent pattern with the learning rate [28]. The adaptive learning rate training method can monitor and adaptively adjust the learning rate according to the change of a certain parameter (batch size). Therefore, on the basis of the cosine annealing learning rate, the model training method of adaptive learning rate is introduced, and the learning rate is adjusted adaptively according to the batch size (batch size/64 × LR). The learning rate updates will be adjusted at a high pace when the batch size is large (freeze training), and the learning rate updates will be adjusted at a low pace when the batch size is small (unfreeze training).
At the model training stage, the input image size is large and the large parameters need to be updated, so the freeze training method is adopted to improve the training speed of the ECA-YOLOX-Tiny model. At the freeze training stage, the first 125 layers of the backbone feature extraction network are frozen, and the weights are unchanged, but the later 142 layers are not frozen and the weights are optimized iteratively. Therefore, the number of parameter variations is small, and the hardware requirements are low at the freeze training stage. At the unfreeze stage, the whole network is fine-tuned and the whole network parameters are changed, so the hardware requirements are high and the training time is long. The freeze training method avoids the too-random phenomenon of network weights initialization in the case of small sample insulator datasets, which significantly improves the training efficiency of the model, and accelerates the model convergence speed and shortens the training time.

4.2. The Evaluation Index

The indexes of mean average precision (mAP), precision (Pr), recall (Re) and F1 score, and frames per second (FPS) are adopted to evaluated the performance of the ECA-YOLOX-Tiny model. Pr represents the proportion of correct predictions among all targets predicted by the model, Re represents the proportion of correct predictions among all real targets, F1 score is the harmonic average of Pr and Re. The formulas of Pr, Re and F1 score are shown in (1), (2) and (3), respectively. In (1) and (2), TP is the number of samples whose ground truth and prediction value are positive, FP is the number of samples whose ground truth is negative and prediction value is positive, FN is the number of samples whose ground truth is positive and prediction value is negative.
P r = T P T P + F P
R e = T P T P + F N
F 1 = 2 P r × R e P r + R e
The average precision (AP) is the contained area under the PR curve. The mAP is the average value of all categories AP for multi-target detection. The formula of mAP is shown in (4). In (4), C represents the number of insulator categories, N represents the number of IoU thresholds (T), and P(x) and R(x) represent the precision and recall, respectively.
m A P = 1 C T = i N P ( x ) × R ( x )
In order to compare the detection speed of different models and reflect the real-time detection ability of models, FPS is introduced as an evaluation index. FPS value is greatly influenced by the performance of the computer device, so FPS is only used for comparative analysis between different models on the same computer condition.

4.3. Training Model

The training loss curve of the ECA-YOLOX-Tiny model is shown in Figure 5. In the first 50 epochs of the freeze training phase, the training loss and validation loss both decrease rapidly, and the model converges quickly, and the loss value decreases rapidly as the number of training iterations increases. In the second 50 epochs of the unfreeze training, the training loss and the validation loss both decrease slowly, and the loss value on the validation set is smaller than that of the training set. Finally, the loss curve tends to be smooth and reaches a better convergence state, which indicates that the model is well trained.
The precision–recall (PR) curves and AP values of defective insulators and normal insulators are shown in Figure 6. The PR curve can be used to judge the performance of the model, and the model performance will be better when the PR curve is closer to the upper right corner. In Figure 6a,b, the blue shaded area below the curve represents the AP value of the defective insulators and normal insulators, and the larger area means the larger AP value of the model. It can be seen from the test results that the AP value of defective insulators is 100% and AP value of normal insulators is 99.87%. The higher AP value means higher recognition accuracy and the better performance of the model. After introducing multiple methods of data augmentation, lightweight attention module (ECA), input image resolution expansion and multi-scale feature fusion, etc., excellent detection results have been achieved by the ECA-YOLOX-Tiny model, and the problem of low accuracy in the classification and localization of small target defective insulators due to the lack of defect insulators training samples is overcome.
The recall curves of defective insulators and normal insulators are shown in Figure 7. Figure 7 indicates that the recall curves of insulators tend to decrease slightly with the increase in score threshold. The recall curve of defective insulators decreases tempestuously when the score threshold reaches 0.9, and the recall curve of normal insulators decreases significantly when the score threshold reaches 0.8. The recall of defective insulators is 100% and the recall of normal insulators is 99.26% when the score threshold is 0.5, which reflects the fact that the ECA-YOLOX-Tiny network has a high prediction accuracy.
The F1 scores of defective insulators and normal insulators are shown in Figure 8. It can be seen from the figure that the F1 scores display a dramatically rising trend when the score threshold approaches 0. With the increase in score threshold, F1 scores tend to be stable, and the decreasing trend of F1 scores is obvious when the score threshold reaches 0.9. When the score threshold is 0.5, the F1 score of defective insulators is 100% and the F1 score of normal insulators is 99%, which indicates that the accuracy and recall of the ECA-YOLOX-Tiny algorithm are high for both defective and normal insulators.

4.4. The Analysis of Detection Effect before and after the Model Improved

The original YOLOX-Tiny model with an input image resolution of 416 × 416 is denoted as YOLOX-Tiny_416, the YOLOX-Tiny model with 640 × 640 image resolution is denoted as YOLOX-Tiny_640, the model with 640 × 640 image resolution and embedded ECA lightweight attention module is denoted as ECA-YOLOX-Tiny, and the ECA-YOLOX-Tiny model with adaptive cosine annealing learning rate is denoted as ECA-YOLOX-Tiny (ACLR). The training results of different models are shown in Table 3, where TT represents the training time of the model.
It can be seen from Table 3 that the accuracy indexes (mAP, Pr, Re and F1 score) of low input image resolution are lower than those of high input image resolution, but the speed indexes (TT, FPS) of low input image resolution is better than those of high input image resolution. Compared with YOLOX-Tiny_640, the mAP can be improved and obtained equivalent detection values of Pr, Re and F1 score with the introduction of the lightweight ECA module. The training pattern of decaying learning rate with equal intervals of “step” is adopted in YOLOX-Tiny_416, YOLOX-Tiny_640 and ECA-YOLOX-Tiny, and the training strategy of adaptive cosine annealing learning rate is employed in ECA-YOLOX-Tiny (ACLR). Comparing the two training methods, the accuracy indexes (mAP, Pr, Re and F1 score) of ECA-YOLOX-Tiny (ACLR) have been improved by different degrees, and the speed indexes (TT, FPS) of ECA-YOLOX-Tiny (ACLR) can be accepted for UAV detection application although these indexes decreased at a certain level.
The pictures in Table 4 show the detection effect of the three models in different weather environments, backgrounds, brightness and angles, respectively. It can be seen from the pictures in Table 4 that the ECA-YOLOX-Tiny model shows a much better detection accuracy for small target defect areas in different weather, backgrounds, brightness and angle conditions, and the model generalization ability and robustness are good.
The pictures in Table 5 show the detection effect of the three models for multi-scale and multi-target normal insulators in different backgrounds. The following conclusions can be obtained by comparative analysis: the detection accuracy for multi-scale insulators in all of the three models is high when the insulators occupy a larger proportion in an image, and the detection accuracy is low in the inverse conditions. Compared with the other two models, the overall performance of the ECA-YOLOX-Tiny model is the best and achieves the highest comprehensive detection accuracy, a perfect goodness-of-fit between the predicted bounding boxes and insulators, and almost no missed detection. The ECA-YOLOX-Tiny shows powerful target recognition and localization ability.

4.5. The Analysis of Detection Effect before and after the Model Improved

To further verify the advantages of lightweight ECA-YOLOX-Tiny, the similar models of lightweight YOLOV4-Tiny and SSD-MobileNet are selected for comparative analysis, and the parameter settings of the three models are kept consistent. The training results of the three models are shown in Table 6. It can be seen from Table 6 that the indexes of mAP, Re and F1 of ECA-YOLOX-Tiny are significantly improved compared with YOLOV4-Tiny and SSD-MobileNet, the Pr of ECA-YOLOX-Tiny is higher than YOLOV4-Tiny but lower than SSD-MobileNet, the number of parameters in ECA-YOLOX-Tiny is the lowest. In terms of detection accuracy and parameter number indexes, ECA-YOLOX-Tiny has the obvious advantage. In addition, caused by the high resolution of input images, the training time and FPS of ECA-YOLOX-Tiny is lower than the other two models. The model training is carried out offline and has no effect on the real-time UAV defect detection, and the training time problem can be solved by improving the hardware condition of training device. In practical application, the detection speed of 2.10 FPS meets the real-time requirements of the UAV defect detection for insulators.
Table 7 provides the detection results of the three models on the test set. Compared with the other two models, the detection accuracy (Acc) of the ECA-YOLOX-Tiny model is obviously higher than the other two models, and the number of missed detections and false detections is the lowest. The cost of the detection accuracy improvement, however, is the long testing time.
The detection effect pictures of three models for defective insulators with different complex backgrounds are shown in Table 8. In terms of insulator defect detection, ECA-YOLOX-Tiny has the highest detection accuracy, although the accuracy is only slightly lower than YOLOV4-Tiny, the final predicted bounding boxes of ECA-YOLOX-Tiny are more consistent with the real insulator boundaries and the location of the predicted bounding boxes for insulator defect are more accurate. Compared with SSD-MobileNet, the ECA-YOLOX-Tiny model has almost no missed or false detection for insulator defects in different complex backgrounds, while SSD-MobileNet has missed detections for insulator defects with background interference and images rotated 180°. The powerful location and identification abilities of ECA-YOLOX-Tiny for small target defective insulators were verified by analyzing the pictures in Table 8.
The detection effect pictures of three models for normal insulators with different complex backgrounds are shown in Table 9. Comparative analysis shows that ECA-YOLOX-Tiny maintains high detection accuracy, and a high coincidence degree between the predicted bounding boxes and insulators. ECA-YOLOX-Tiny still has good positioning and recognition ability for overlapping insulators, small target insulators, insulators with high color similarity to the land and insulators shielded by tower poles, etc. On the contrary, different degrees of missed detection and predicted bounding box mismatches emerge in YOLOV4-Tiny and SSD-MobileNet in different complex backgrounds.

4.6. Visual Analysis of Model Decision Areas

Generally, convolution neural network (CNN) is a kind of dark box technique, the global optimal solution is constantly approximated through theoretical derivation and gradient propagation methods. In order to visualize the learning progress of CNN, Zhou et al. proposed a class activation mapping (CAM) [29,30,31] visualization tool, which introduces a kind of CNN to generate heatmaps of input images. Using the visualization tool, the high-activation areas, which have significant impact on the classification and localization results, are shown, and it is possible to visualize whether the high-response areas of the model lie in the core of the target. Taking insulators as an example, the image class activation mapping process is shown in Figure 9.
According to Figure 9, the insulator image is input to the CNN and many feature maps are extracted through multiple convolution layers (Conv). The last convolution layer is connected to the global average pooling (GAP) layer and the visual CAM heatmaps of insulators are generated by weighting and summing the feature maps. The softmax layer is used to output results.
Combined with corresponding network models, insulator images can be input into the detection model, and then the CAM heatmaps are adopted to visualize and analyze the decision areas of each model. Based on the above process, the internal representation learned by the CNN can be visualized to identify the largest activation areas in the images for target localization. In the CAM heatmaps, the darker color areas have a greater influence on the network determination results. The reliability of the defect detection model can be evaluated by comparing the output results of the high-response decision areas with the actual boundary situation of the insulator defect areas and the multi-target insulators.
The YOLOV4-Tiny model is compared with ECA-YOLOX-Tiny, and the CAM heatmaps of two models are shown in Table 10 (for defective insulators) and Table 11 (for normal insulators). Comparing the pictures of YOLOV4-Tiny in Table 10, the ECA-YOLOX-Tiny model is more accurate in locating the defect areas of defective insulators, and its decision areas have a higher response level, while the YOLOV4-Tiny model has a certain location offset. It can be seen from the pictures in Table 11 that the high-response areas of classification and localization lie in the core of the insulators in these two models, and the high-response areas are basically consistent with the geometric center of the insulators. Usually, the target response degree is consistent with the model detection results. In comparison, the high-response areas of ECA-YOLOX-Tiny are larger and more responsive than YOLOV4-Tiny, especially for the insulators with small overlapping targets, obscured by tower poles and with high-similarity backgrounds.

5. Conclusions

We took UAV as the carrier to achieve inspection and self-explosion defect detection for overhead transmission line insulators. Based on the lightweight YOLOX-Tiny model, the measures of lightweight attention module, data augmentation, input image resolution improvement, adaptive cosine annealing learning rate, and class activation mapping (CAM) visualization tool are introduced, and the lightweight ECA-YOLOX-Tiny model is proposed in the paper. The actual inspection insulators’ case database is used to comprehensively verify and analyze the model performance, and the following conclusions are drawn.
(1)
Aiming at the problem of insufficient defective samples in the insulator data set, the original data are enhanced by various methods according to the flight shooting conditions of UAV. Through the data enhancement measures, the generalization capability of the network is improved and the characteristic information of the insulators can be fully learned by the model, and then the detection accuracy of the model is improved for small target defective regions and multi-target insulators with different scales.
(2)
The higher resolution images are adopted as the network model inputs, so that the feature information of the insulator defect regions as well as small target insulator strings can be better learned by the network model. The examples prove that the detection accuracy indexes of mAP, Pr, Re and F1 score are improved after the resolution of the input images is improved from 416 × 416 to 640 × 640.
(3)
By introducing the lightweight attention module (ECA) in the ECA-YOLOX-Tiny model, the semantic information of the feature maps is further enhanced, the nonlinear capability of the network is improved, and the redundant information is reduced. Compared with YOLOX-Tiny_640 model, the mAP of the ECA-YOLOX-Tiny model has been improved by 0.11% due to the introduction of the ECA module, and the mAP is further improved by 0.22% when the model training method of equal interval “step” decay learning rate is replaced by the adaptive cosine annealing learning rate. Compared with the similar models YOLOV4-Tiny and SSD-MobileNet, the mAP of ECA-YOLOX-Tiny has been improved by 1.19% and 2.99%, respectively, and the number of parameters of the ECA-YOLOX-Tiny model can be compressed to best meet the hardware conditions of the UAV.
(4)
With the improvement of detection accuracy, the speed indexes of training time and FPS value are certainly decreased, however, it is necessary to improve the model detection accuracy at the cost of less training time and FPS value in the face of high precision detection requirements. The testing results show that the detection speed of the ECA-YOLOX-Tiny model reached 2.10 pictures s−1, which basically meets the requirements of real-time insulator detection.
(5)
In order to further verify the superiority of the ECA-YOLOX-Tiny model, the class activation mapping is introduced to visualize the prediction results of different models. Compared with the YOLOV4-Tiny model, the ECA-YOLOX-Tiny model is more accurate in locating the self-explosion areas of defective insulators and has a higher response degree for decision areas. Moreover, the ECA-YOLOX-Tiny model has a higher response to complex backgrounds of overlapping small target insulators, insulators obscured by tower poles, and high similarity background insulators, etc.

Author Contributions

Conceptualization, C.R. and S.Z.; methodology, C.R. and S.Z.; software, C.Q.; validation, C.R. and S.Z.; formal analysis, Z.Z.; investigation, Z.Z. and C.Q.; resources, S.Z.; data curation, C.R. and S.Z.; writing—original draft preparation, C.R. and S.Z.; writing—review and editing, C.R., S.Z. and C.Q.; supervision, Z.Z.; visualization, C.R.; project administration, S.Z.; funding acquisition, S.Z. All authors have read and agreed to the published version of the manuscript.

Funding

This research was funded by the Tianjin Natural Science Foundation Project (No. 19JCQNJC04200); Tianjin Jinnan District Science and Technology Plan Project (No. 20210101).

Institutional Review Board Statement

Not applicable.

Informed Consent Statement

Not applicable.

Data Availability Statement

Not applicable.

Conflicts of Interest

The authors declare no conflict of interest.

Appendix A

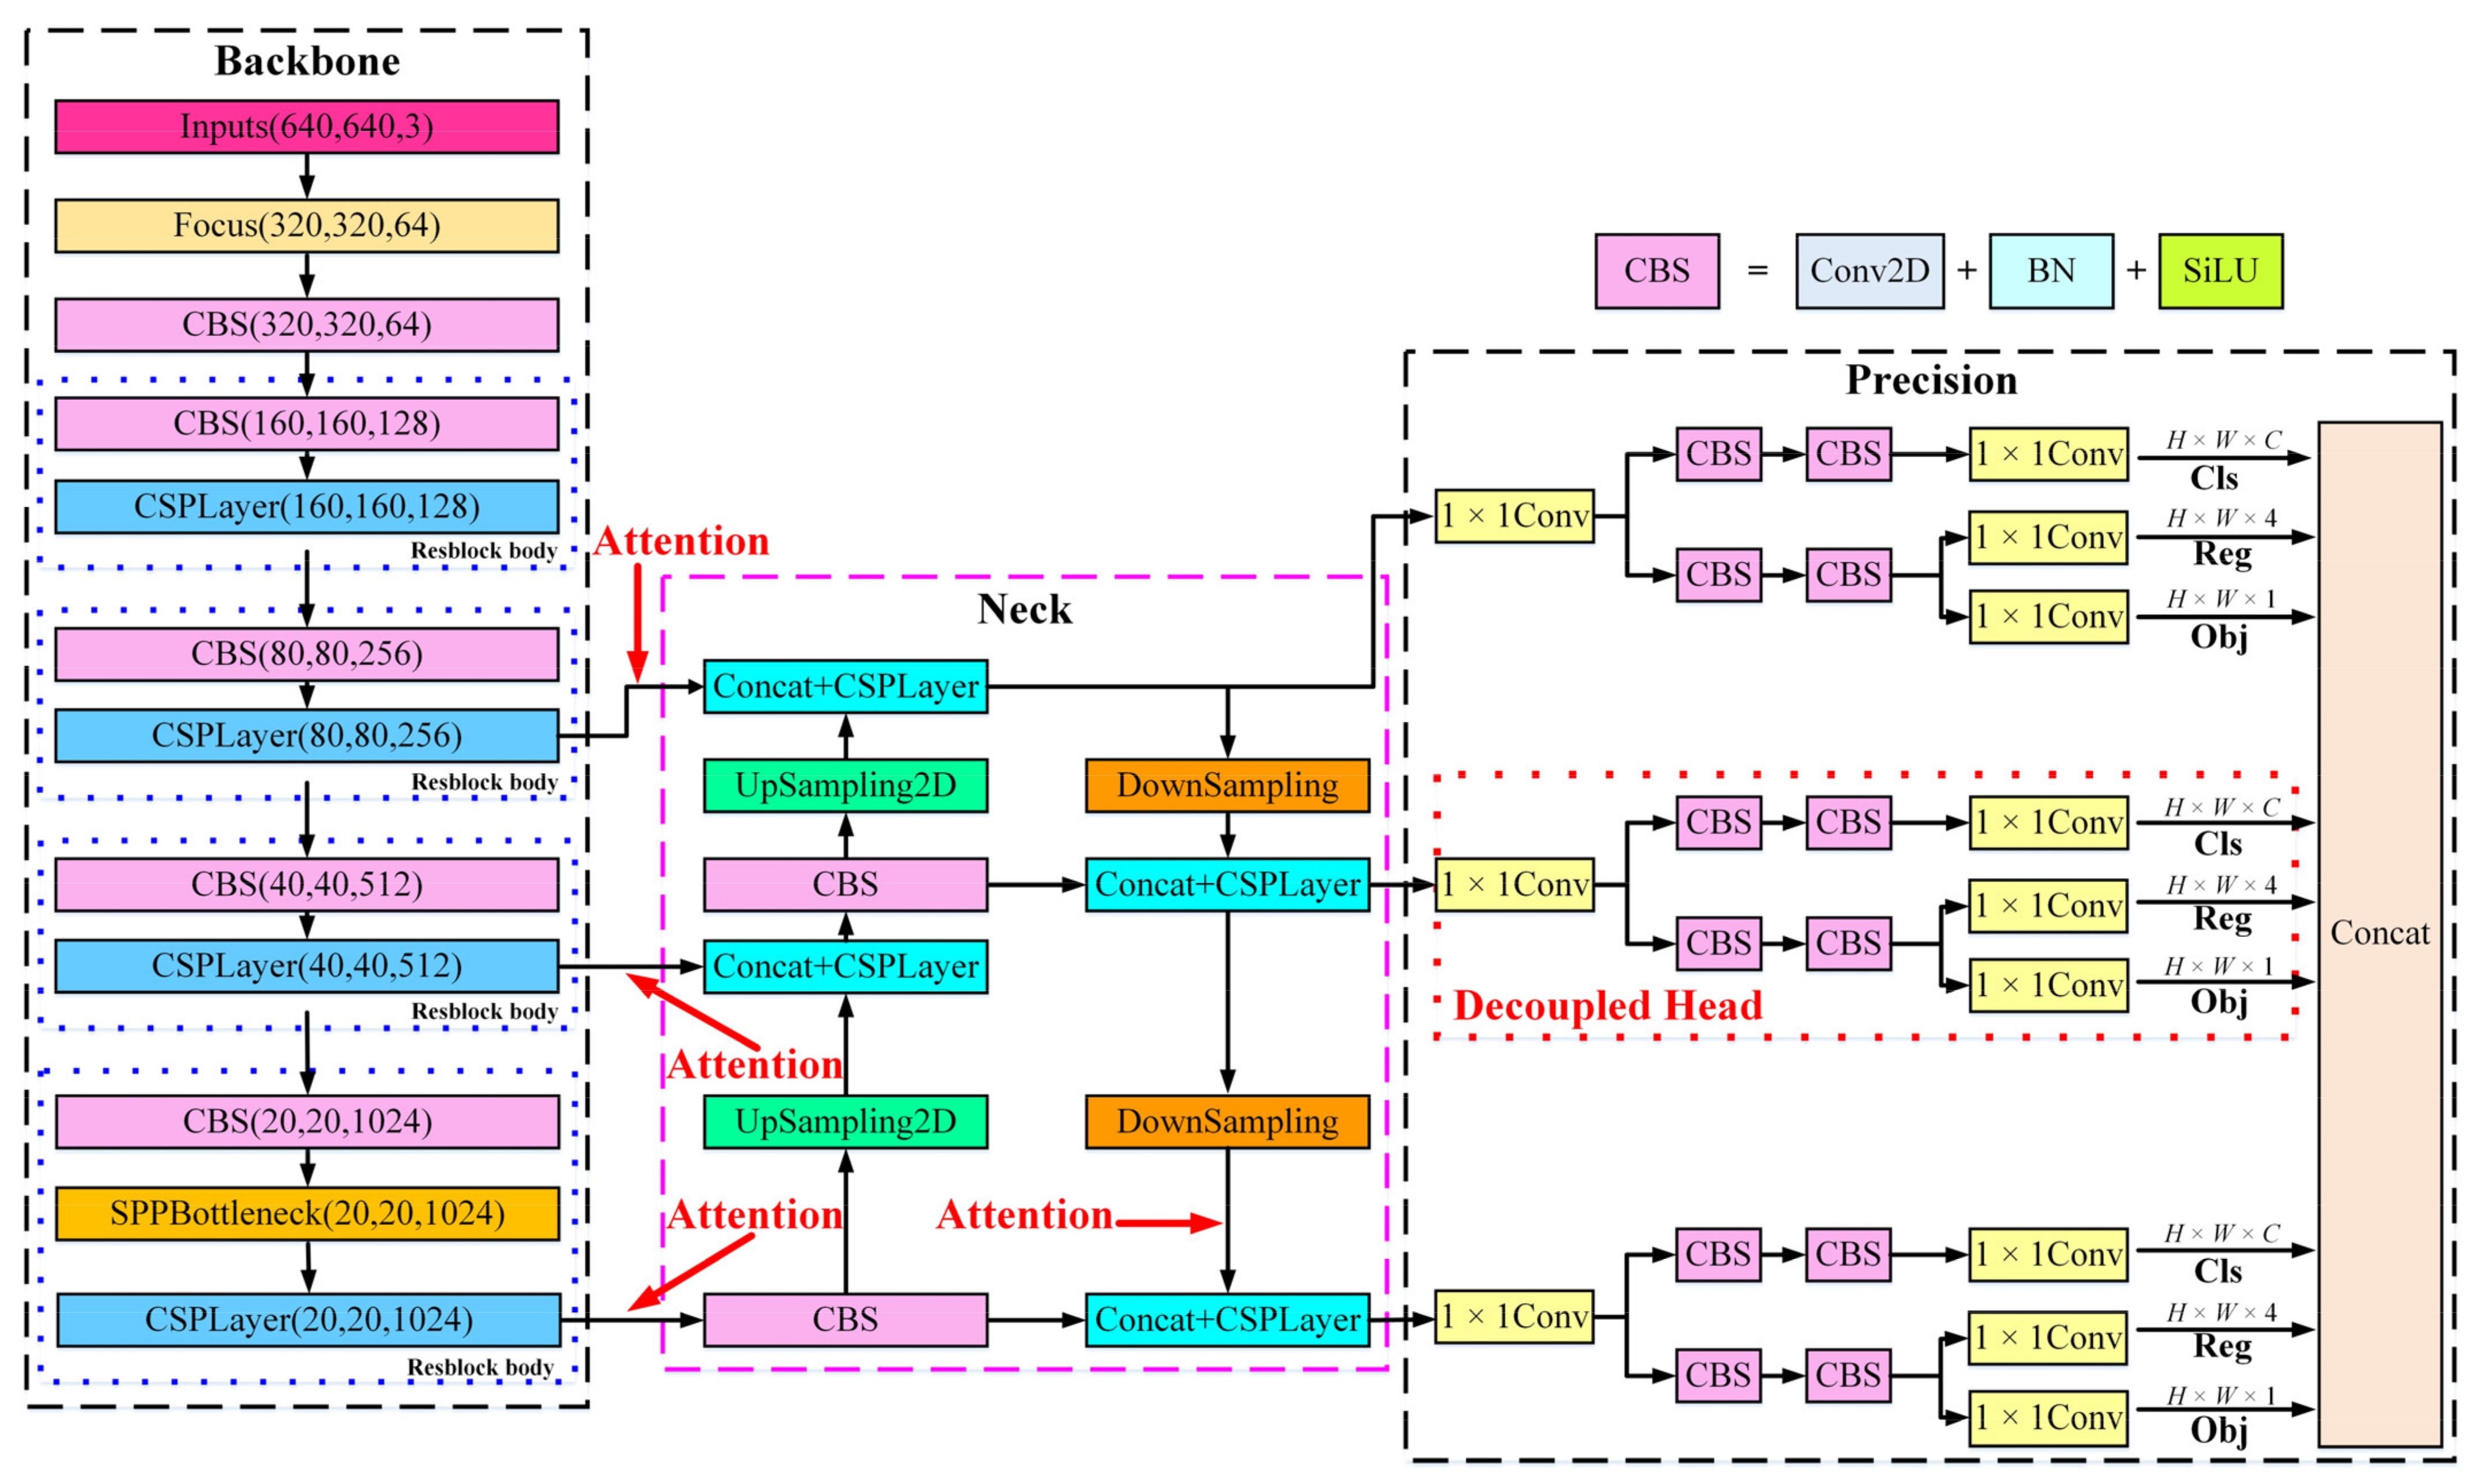
Based on the YOLOX-Tiny model, the key techniques of backbone feature extraction network (Backbone), enhanced feature extraction network (Neck), and prediction sections of ECA-YOLOX-Tiny (decoupled head, anchor-free, and simplified dynamic label matching strategy SimOTA) are described in the following.
  • Backbone Feature Extraction Network (Backbone)
The backbone network is used to preliminarily extract the feature and obtain three initial effective feature layers for multi-scale feature fusion. The backbone network of ECA-YOLOX-Tiny in Figure 3 is CSPDarknet, for which the CSP structure (CSPLayer) of cross-stage partial network (CSPNet) is adopted. A series of small residual units (Res Units) in a stacked structure are adopted in the backbone branch of CSPLayer, and the larger residual edges are built on the side branches. Through the large residual edges, the input and output of the backbone branch are directly connected by the simple channel dimension adjustment method. The main branch of the residual unit is a 1 × 1 convolution connected to a 3 × 3 convolution, and there is no special treatment for residual edges and the direct addition operation between inputs and outputs of the main branch is designed. The structure of the CSPLayer as well as the Res Unit is shown in Figure A1a,b.
Figure A1. The structure diagram of CSPLayer and Res Unit: (a) CSPLayer structure (b) Res Unit.
Applsci 12 09314 g0a1
The abundant gradient combination can be achieved by using cross-stage splitting and merging strategies in the CSPLayer module, and the excessive and repetitive gradient information can be prevented by the method of gradient flow truncation. The CSPLayer module not only has a small amount of calculation and memory consumption, but also enhances the learning ability of the network. In the CSPLayer module, the residual units are easy to optimize, and the shortcut connections are used to improve the feature extraction ability of the model, by which the problems of gradient disappearance, gradient explosion and model degradation caused by the increase in network depth can be alleviated.
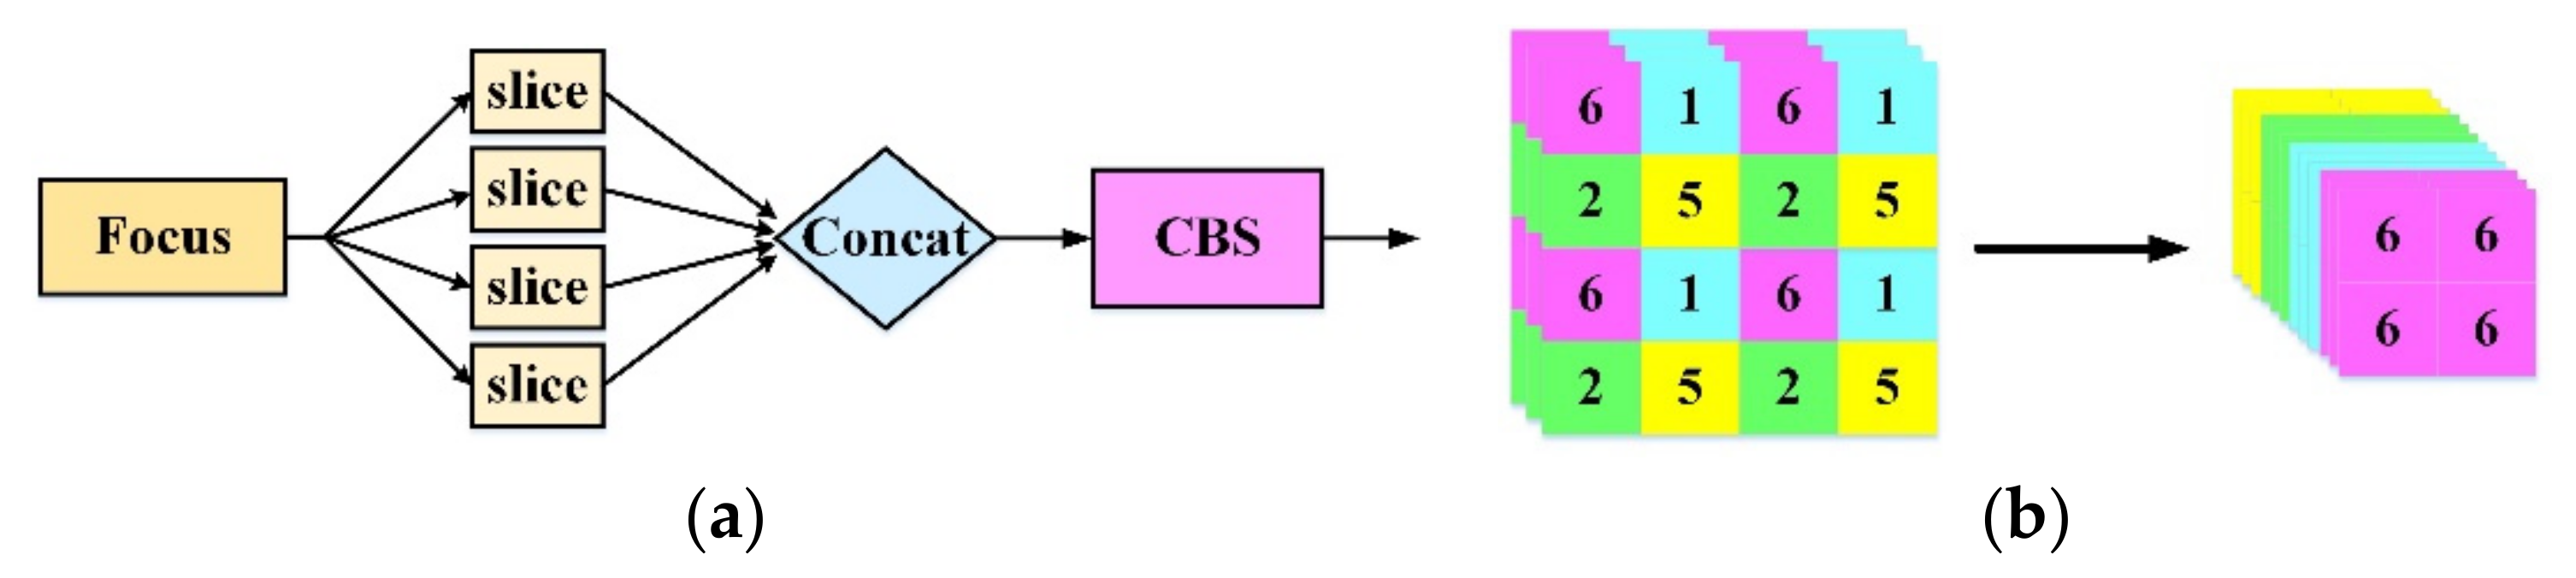
Similar to the neighboring down-sampling, a special down-sampling method (focus network structure) is introduced in YOLOV5, for which four independent low-resolution feature maps are firstly reconstructed from a high-resolution image by taking a value every other pixel, and then four independent feature maps are stacked. Additionally, the number of feature map channels increases four times, the length and width of the feature maps are half that of the original feature maps, the width and height information of the feature points are stacked on the channel space, and the receptive field of the feature points is improved. The problem of information loss caused by down-sampling of the original images can be solved by the special down-sampling method, and two-fold down-sampling feature maps without information loss can finally be obtained. The focus network structure is borrowed in ECA-YOLOX-Tiny to reduce model computation and memory occupation as well as improve model speed. The focus network structure and its corresponding feature map transformations are shown in Figure A2a,b.
Figure A2. The focus network structure and its feature map transformations: (a) focus network structure, (b) the transformation of feature maps.
Applsci 12 09314 g0a2
A new SiLU activation function [32] expressed in (A1) is employed in ECA-YOLOX-Tiny.
S i L U ( x ) = x sigmoid ( x )
where x is the inputs of model.
Compared with ReLU, the smooth output of SiLU is more ergodic, and the sensitivity of model initialization and learning rate is reduced. The non-monotonicity of SiLU increases the model expressiveness and improves the gradient flow, the robustness can be provided in light of the different initialization and learning rate. When the function lies in the saturation region, the training is very slow due to the small gradient, but the loss function saturation condition can be avoided because there is no compression gradient of SiLU.
In ECA-YOLOX-Tiny model, the SPPBottleneck module is applied to the end of the backbone network, and the different scales’ feature information is mixed together through the parallel maximum pooling layers with different kernel sizes. The kernel sizes of four parallel branches are 1 × 1, 5 × 5, 9 × 9 and 13 × 13, respectively. Through the SPPBottleneck module, the information dimension of the feature maps is increased from 1024 to 4096 without changing the size of the feature maps, by which the receptive field of the network is expanded and the global information of the target can be captured more effectively. In addition, the multi-stage pooling operation is more robust, aiming at different sized targets and improving the accuracy of target identification. The structure of SPPBottleneck is shown in Figure A3.
Figure A3. The structure diagram of SPPBottleneck.
Applsci 12 09314 g0a3
2.
Enhanced Feature Extraction Network (Neck)
In practice, the detection effect of small target defect areas is poor through the convolution neural network model, the main reasons are analyzed as follows. Firstly, small targets have the characteristics of low-resolution and small pixel proportion, so the effective information extracted by the target detection network is limited. Secondly, the information loss situation of the small targets is serious after the input images are down-sampled several times. In addition, the large-scale datasets of small target defects are inadequate. At present, the small target detection accuracy can be improved by data augmentation, multi-scale features fusion, and super-resolution techniques, etc.
In the ECA-YOLOX-Tiny model, three enhanced effective feature layers are obtained through enhanced feature extraction of the Neck module. The enhanced feature extraction module is composed of FPN (feature pyramid networks) up-sampling and PAN (path aggregation network) down-sampling. Through FPN up-sampling, the shallow high-resolution information is fused with deep high semantic information features, and the detection accuracy of the model for small target defective insulators can be improved. Through PAN down-sampling, the feature information is extracted repeatedly, and the different scales’ extraction feature information is fully exploited so as to improve the accuracy of model detection. The enhanced feature extraction module fixed by FPN and PAN is shown in Figure A4.
Figure A4. The enhanced feature extraction module fixed by FPN and PAN.
Applsci 12 09314 g0a4
3.
Prediction
In order to classify and regression localize the effective feature layers of three different scales, the original coupled head is discarded in the precision part of ECA-YOLOX-Tiny, meanwhile, the decoupled head, anchor-free mechanism and simplified optimal transport assignment (SimOTA) strategy are introduced innovatively.
(a)
Decoupled Head
In the past YOLO series, the classification and regression are realized by a 1 × 1 convolution layer in the detection head (coupled head). However, there is a difference between classification and regression, the classification problem mainly considers the difference between each target object, and the regression problem mainly considers the characteristics of object contour boundary. Compared with coupled head (shown in Figure A5), the 1 × 1 convolution layer is used to reduce the channel dimension in decoupled head, and two parallel branches are added behind the 1 × 1 convolution layer for classification and regression, respectively, by which the convergence speed and model detection accuracy can be effectively improved at a lower computational cost.
Figure A5. The comparison between coupled head and decoupled head.
Applsci 12 09314 g0a5
(b)
Anchor-free
The target detection networks based on the anchor-free mechanism are at present considered as a new type and friendly networks for industrial applications. Compared with the anchor-based mechanism, the anchor-free mechanism detects targets through key points without anchor boxes, by which the number of model parameters and the computational complexity can be significantly reduced, meanwhile, the work of model training and detection phases is quite simple and the same performance as the anchor-based mechanism is obtained. Therefore, the anchor-free mechanism is adopted in the ECA-YOLOX-Tiny model to reduce the prediction quantity of each position from three (coordinate offset, confidence, and classification) to one (coordinate offset), and the four parameters of predicted bounding boxes (the offsets of the x and y axes, height and width) are directly predicted.
(c)
SimOTA
In the convolution neural network model, the intersection over union (IoU) between the truth bounding boxes and the predicted bounding boxes is used to divide the positive and negative samples. Under the different condition of sizes, shapes and occlusions, etc., the assignment of positive and negative samples needs to be considered globally. Generally, the predicted bounding boxes assignment problem is regarded as an optimal transport problem of linear programming. The optimal transport assignment (OTA) solves the predicted bounding boxes allocation problem from the global perspective so as to match the truth bounding boxes with the predicted bounding boxes at the lowest overall cost. Supposed that there are K truth bounding boxes and M predicted bounding boxes, the cost matrix size is K × M, and the elements in the matrix are the loss values of the truth bounding boxes and predicted bounding boxes. The smaller the loss is, the smaller the cost of selecting the truth bounding boxes and predicted bounding boxes. Based on OTA, the Sinkhorn–Knopp algorithm is eliminated in the dynamic label assignment strategy (SimOTA), which not only reduces the training time of the model and makes the distribution of positive and negative samples more balanced, but also avoids the extra hyperparameters problem brought by the Sinkhorn–Knopp algorithm.

Appendix B

Based on the proposed model in the paper, the missing images are further analyzed and the following typical missing cases are founded.
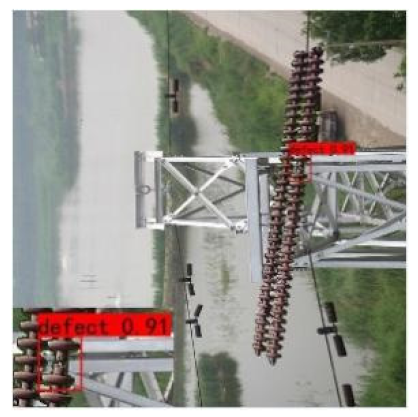
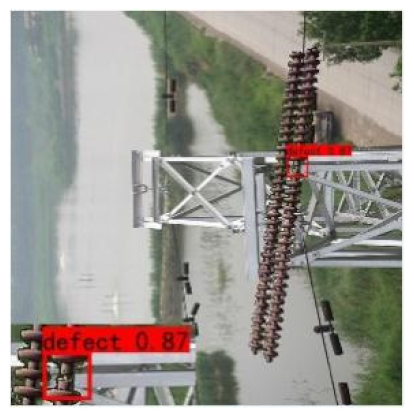
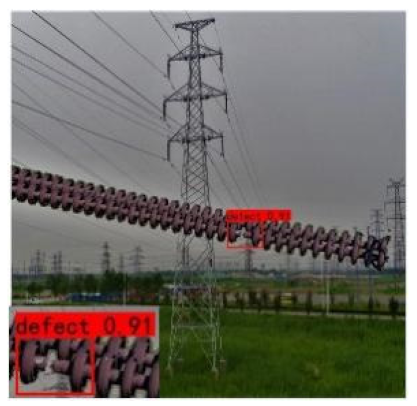
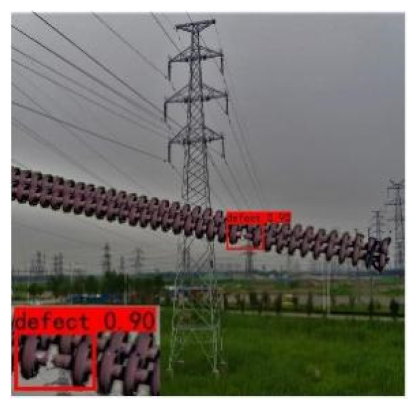
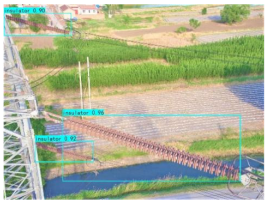
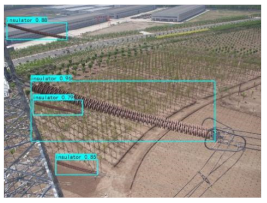
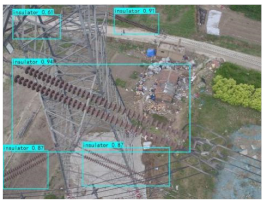
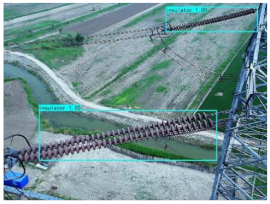
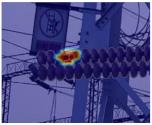
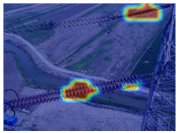
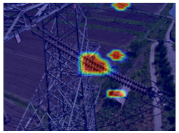
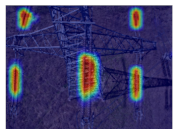
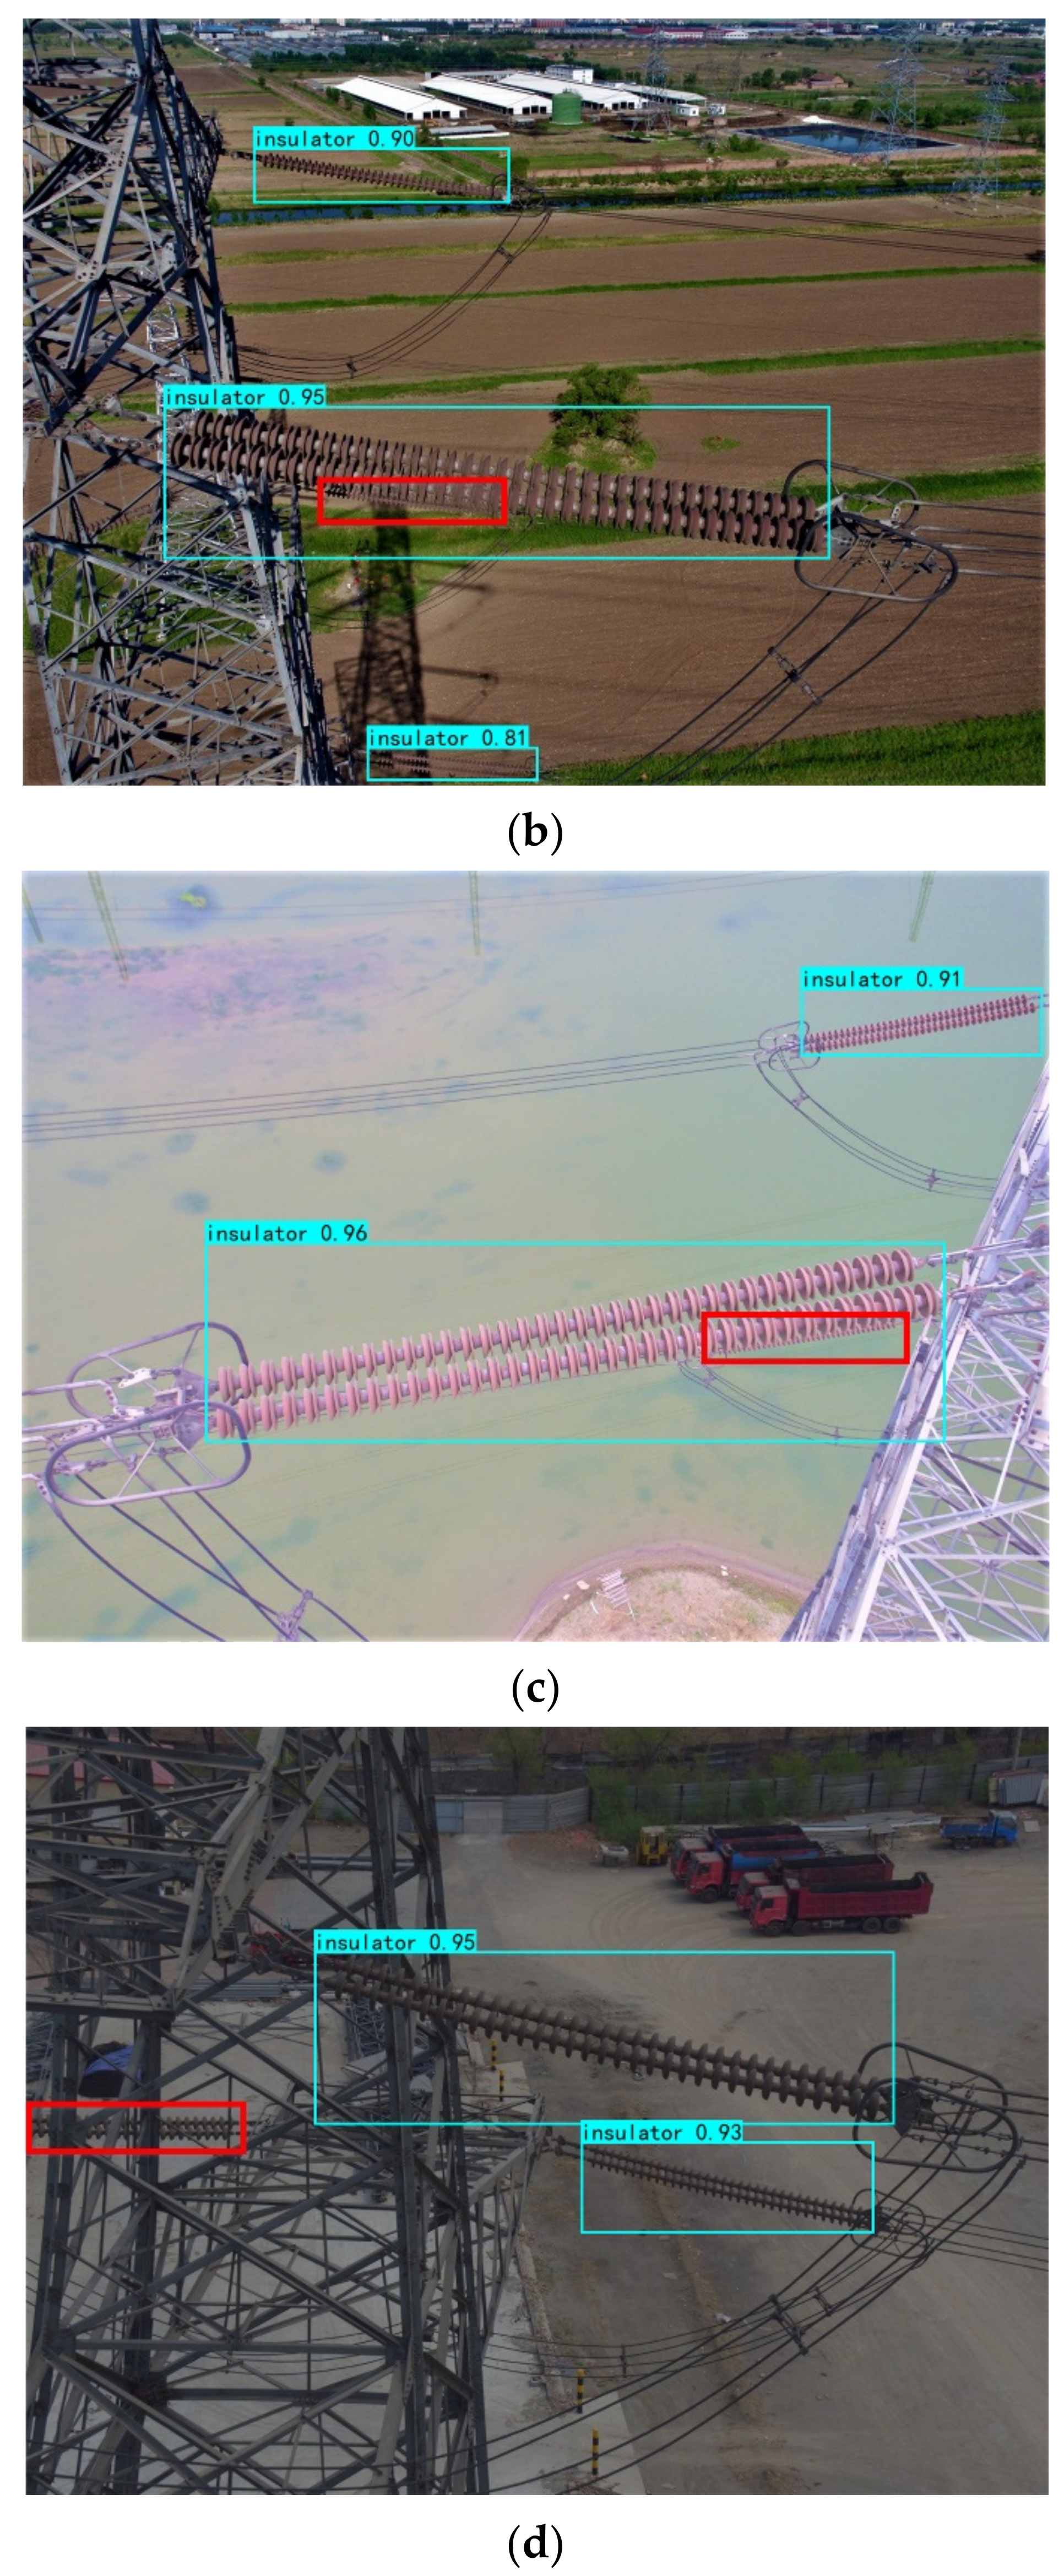
The defective areas of insulators are obscured by stronger and similar background information and leads to detections being missed, as shown in Figure A6a. The missed detections are caused by the too-small insulator targets, excessive overlap, highly similar backgrounds, and darker light, etc., as shown in Figure A6b,c. The missed detections are caused by serious target occlusion as shown in Figure A6d. The above typical missed detection situations are given in Appendix B, and the missed detection targets are marked by red boxes in the figure.
Figure A6. Some detections missed by ECA-YOLOX-Tiny: (a) the missing detection of insulator defect target, (b) The missing detection of overlap small target 1, (c) the missing detection of overlap small target 2, (d) the missing detection of serious occlusion target.
Applsci 12 09314 g0a6aApplsci 12 09314 g0a6b
In order to enable readers to have a clearer understanding of the research on lightweight target detection models, the current mainstream lightweight models and their characteristics are analyzed and summarized in Table A1.
Table A1. Summary of mainstream lightweight models and their characteristics.
ModelsCharacteristicsWho and WhenReferences
SSD-MobileNetV1The accuracy was 59.29%, which was relatively lowGhoury, S. et al. (2019)[16]
SSD-MnasNetThe accuracy was 93.8%, which was high. The model size was 43.73 MB, FPS reached to 36.85 on Server, and the FPS reached to 8.27 on TX2.Liu, X. et al. (2020)[21]
YOLOV3-TinyThe accuracy was 92.10%, the recall rate was 92.20%, and FPS reached 30.Han, J. et al. (2020)[33]
YOLOV4-TinyThe mAP was 92.04%, and FPS reached 40.Qiu, Z. et al. (2021)[23]
YOLOV4-MobileNetV1The mAP was 97.26%, and FPS reached 53.Qiu, Z. et al. (2022)[22]
YOLOV4-MobileNetV3The mAP was 91.3%, and the model size was 116 MB.Wu, J. et al. (2022)[34]

References

  1. Yang, L.; Fan, J.; Liu, Y.; Li, E.; Peng, J.; Liang, Z. A review on state-of-the-art power line inspection techniques. IEEE Trans. Instrum. Meas. 2020, 69, 9350–9365. [Google Scholar] [CrossRef]
  2. Sampedro, C.; Martinez, C.; Chauhan, A.; Campoy, P. A supervised approach to electric tower detection and classification for power line inspection. In Proceedings of the 2014 International Joint Conference on Neural Networks (IJCNN), Beijing, China, 6–11 July 2014; pp. 1970–1977. [Google Scholar] [CrossRef]
  3. Tao, X.; Zhang, D.; Wang, Z.; Liu, X.; Zhang, H.; Xu, D. Detection of power line insulator defects using aerial images analyzed with convolutional neural networks. IEEE Trans. Syst. Man Cybern. Syst. 2018, 50, 1486–1498. [Google Scholar] [CrossRef]
  4. Varghese, A.; Gubbi, J.; Sharma, H.; Balamuralidhar, P. Power infrastructure monitoring and damage detection using drone captured images. In Proceedings of the 2017 International Joint Conference on Neural Networks (IJCNN), Anchorage, AK, USA, 14–19 May 2017; pp. 1681–1687. [Google Scholar] [CrossRef]
  5. Girshick, R.; Donahue, J.; Darrell, T.; Malik, J. Rich feature hierarchies for accurate object detection and semantic segmentation. In Proceedings of the IEEE Conference on Computer Vision and Pattern Recognition (CVPR), Columbus, OH, USA, 23–28 June 2014; pp. 580–587. [Google Scholar]
  6. He, K.; Zhang, X.; Ren, S.; Sun, J. Spatial pyramid pooling in deep convolutional networks for visual recognition. In Proceedings of the IEEE Transactions on Pattern Analysis and Machine Intelligence, Las Vegas, NV, USA, 1 September 2015; pp. 1904–1916. [Google Scholar] [CrossRef]
  7. Girshick, R. Fast r-cnn. In Proceedings of the IEEE international conference on computer vision (ICCV), Santiago, Chile, 7–13 December 2015; pp. 1440–1448. [Google Scholar]
  8. Ren, S.; He, K.; Girshick, R.; Sun, J. Faster R-CNN: Towards Real-Time Object Detection with Region Proposal Networks. In Proceedings of the Advances in Neural Information Processing Systems(NIPS), Montreal, QC, Canada, 7–12 December 2015; pp. 91–99. [Google Scholar]
  9. Redmon, J.; Divvala, S.; Girshick, R.; Farhadi, A. You Only Look Once: Unified, Real-Time Object Detection. In Proceedings of the IEEE Conference on Computer Vision and Pattern Recognition (CVPR), Las Vegas, NV, USA, 26 June–1 July 2016; pp. 779–788. [Google Scholar]
  10. Redmon, J.; Farhadi, A. YOLO9000: Better, faster, stronger. In Proceedings of the IEEE Conference on Computer Vision and Pattern Recognition, Honolulu, HI, USA, 21–26 July 2017; pp. 7263–7271. [Google Scholar]
  11. Redmon, J.; Farhadi, A. YOLOv3: An incremental improvement. arXiv 2018, arXiv:1804.02767. [Google Scholar]
  12. Bochkovskiy, A.; Wang, C.Y.; Liao, H.Y.M. YOLOv4: Optimal speed and accuracy of object detection. arXiv 2020, arXiv:2004.10934. [Google Scholar]
  13. Kasper-Eulaers, M.; Hahn, N.; Berger, S.; Sebulonsen, T.; Myrland, Ø.; Kummervold, P.E. Short Communication: Detecting Heavy Goods Vehicles in Rest Areas in Winter Conditions Using YOLOv5. Algorithms 2021, 14, 114. [Google Scholar] [CrossRef]
  14. Liu, W.; Anguelov, D.; Erhan, D.; Szegedy, C.; Reed, S.; Fu, C.Y.; Berg, A.C. SSD: Single Shot MultiBox Detector. In Proceedings of the European Conference on Computer Vision (ECCV), Amsterdam, The Netherlands, 11–14 October 2016; pp. 21–37. [Google Scholar] [CrossRef]
  15. Wen, Q.; Luo, Z.; Chen, R.; Yang, Y.; Li, G. Deep Learning Approaches on Defect Detection in High Resolution Aerial Images of Insulators. Sensors 2021, 21, 1033. [Google Scholar] [CrossRef] [PubMed]
  16. Ghoury, S.; Sungur, C.; Durdu, A. Real-Time Diseases Detection of Grape and Grape Leaves using Faster R-CNN and SSD-MobileNet Architectures. In Proceedings of the International Conference on Advanced Technologies, Computer Engineering and Science (ICATCES 2019), Alanya, Turkey, 26–28 April 2019; pp. 39–44. [Google Scholar]
  17. Yan, B.; Fan, P.; Lei, X.; Liu, Z.; Yang, F. A Real-Time Apple Targets Detection Method for Picking Robot Based on Improved YOLOv5. Remote Sens. 2021, 13, 1619. [Google Scholar] [CrossRef]
  18. Iandola, F.N.; Han, S.; Moskewicz, M.W.; Ashraf, K.; Dally, W.J.; Keutzer, K. SqueezeNet: AlexNet-level accuracy with 50x fewer parameters and <0.5 MB model size. Computer Vision and Pattern Recognition (CVPR), Artificial Intelligence. arXiv 2016, arXiv:1602.07360. [Google Scholar]
  19. Zhang, X.; Zhou, X.; Lin, M.; Sun, J. ShuffleNet: An Extremely Efficient Convolutional Neural Network for Mobile Devices. In Proceedings of the 2018 IEEE/CVF Conference on Computer Vision and Pattern Recognition (CVPR), Salt Lake City, UT, USA, 18–23 June 2018; pp. 6848–6856. [Google Scholar]
  20. Wang, Y.; Jia, K.; Liu, P. Impolite Pedestrian Detection by Using Enhanced YOLOv3-Tiny. J. Artif. Intell. 2020, 2, 113–124. [Google Scholar] [CrossRef]
  21. Liu, X.; Li, Y.; Shuang, F.; Gao, F.; Zhou, X.; Chen, X.Z. ISSD: Improved SSD for insulator and spacer online detection based on UAV system. Sensors 2020, 20, 6961. [Google Scholar] [CrossRef] [PubMed]
  22. Qiu, Z.; Zhu, X.; Liao, C.; Shi, D.; Qu, W. Detection of Transmission Line Insulator Defects Based on an Improved Lightweight YOLOv4 Model. Appl. Sci. 2022, 12, 1207. [Google Scholar] [CrossRef]
  23. Qiu, Z.; Zhu, X.; Liao, C.; Shi, D.; Kuang, Y.; Li, Y.; Zhang, Y. Detection of bird species related to transmission line faults based on lightweight convolutional neural network. IET Gener. Transm. Distrib. 2021, 16, 869–881. [Google Scholar] [CrossRef]
  24. Ge, Z.; Liu, S.; Wang, F.; Li, Z.; Sun, J. YOLOX: Exceeding YOLO Series in 2021. arXiv 2021, arXiv:2107.08430. [Google Scholar]
  25. Hu, J.; Shen, L.; Sun, G. Squeeze-and-excitation networks. In Proceedings of the IEEE Conference on Computer Vision and Pattern Recognition, Salt Lake City, UT, USA, 18–23 June 2018; pp. 7132–7141. [Google Scholar]
  26. Woo, S.; Park, J.; Lee, J.Y.; Kweon, I.S. CBAM: Convolutional Block Attention Module. In Proceedings of the European conference on computer vision (ECCV), Munich, Germany, 8–14 September 2018; pp. 3–19. [Google Scholar]
  27. Wang, Q.; Wu, B.; Zhu, P.; Li, P.; Zuo, W.; Hu, Q. ECA-Net: Efficient Channel Attention for Deep Convolutional Neural Networks. In Proceedings of the 2020 IEEE/CVF Conference on Computer Vision and Pattern Recognition (CVPR), Seattle, WA, USA, 13–19 June 2020; pp. 11531–11539. [Google Scholar] [CrossRef]
  28. Loshchilov, I.; Hutter, F. SGDR: Stochastic Gradient Descent with Warm Restarts. arXiv 2016, arXiv:1608.03983. [Google Scholar]
  29. Zhou, B.; Khosla, A.; Lapedriza, A.; Oliva, A.; Torralba, A. Learning deep features for discriminative localization. In Proceedings of the 2016 IEEE Conference on Computer Vision and Pattern Recognition (CVPR), Las Vegas, NV, USA, 27–30 June 2016; pp. 2921–2929. [Google Scholar]
  30. Feng, J.; Sun, Y.; Zhang, K.; Zhao, Y.; Ren, Y.; Chen, Y.; Zhuang, H.; Chen, S. Autonomous Detection of Spodoptera frugiperda by Feeding Symptoms Directly from UAV RGB Imagery. Appl. Sci. 2022, 12, 2592. [Google Scholar] [CrossRef]
  31. Chien, J.-C.; Lee, J.-D.; Hu, C.-S.; Wu, C.-T. The Usefulness of Gradient-Weighted CAM in Assisting Medical Diagnoses. Appl. Sci. 2022, 12, 7748. [Google Scholar] [CrossRef]
  32. Elfwing, S.; Uchibe, E.; Doya, K. Sigmoid-weighted linear units for neural network function approximation in reinforcement learning. Neural Netw. 2018, 107, 3–11. [Google Scholar] [CrossRef] [PubMed]
  33. Han, J.; Yang, Z.; Xu, H.; Hu, G.; Zhang, C.; Li, H.; Lai, S.; Zeng, H. Search Like an Eagle: A Cascaded Model for Insulator Missing Faults Detection in Aerial Images. Energies 2020, 13, 713. [Google Scholar] [CrossRef]
  34. Wu, J.; Li, X.; Zhou, Y. An infrared image detection of power equipment based on super-resolution reconstruction and YOLOv4. J. Eng. 2022, 1–11. [Google Scholar] [CrossRef]
Figure 1. The flow chart of insulator defect detection based on UAV.
Applsci 12 09314 g001
Figure 2. The structure diagrams of SE and ECA: (a) SE module (b) ECA module.
Applsci 12 09314 g002aApplsci 12 09314 g002b
Figure 3. The network structure of improved ECA-YOLOX-Tiny.
Applsci 12 09314 g003
Figure 4. Data augmentation: (a) original image, (b) mirroring, (c) rotation 180°, (d) cropping and scaling, (e) adjust contrast, (f) adjust brightness.
Applsci 12 09314 g004
Figure 5. The training loss curve of the ECA-YOLOX-Tiny model.
Applsci 12 09314 g005
Figure 6. The PR curve and AP value of defective and normal insulators: (a) PR curve and AP value of defective insulators (b) PR curve and AP value of normal insulators.
Applsci 12 09314 g006
Figure 7. The recall curve of defective and normal insulators: (a) recall curve of defective insulators, (b) recall curve for normal insulators.
Applsci 12 09314 g007
Figure 8. The F1 score curve of defective and normal insulators: (a) F1 score curve of defective insulators, (b) F1 score curve of normal insulators.
Applsci 12 09314 g008
Figure 9. The class activation mapping process of an insulator image.
Applsci 12 09314 g009
Table 1. The hardware configuration and software development environment.
Hardware ConfigurationVersion or ValueSoftware Development EnvironmentVersion
Operating systemWindows 10–64 bitPyCharm Community Edition2020.3.5
Graphics cardNVIDIA GeForce GTX 1050Anaconda32020.11
ProcessorIntel(R) Core (TM) i5–8300H CPU ≅ 2.30 GHzPythonPython 3.6
Operating memory8 GBKerasKeras 2.2.4
Table 2. The parameters settings for network training.
ParametersValueParametersValue
Input shape640 × 640Momentum0.937
OptimizerAdamFreeze batch size32
Freeze epochs0~50Unfreeze batch size16
Unfreeze epochs50~100Maximum value of learning rate1 × 10−3
Confidence0.5Minimum value of learning rate1 × 10−5
Table 3. The training results of different model.
ModelmAP (%)Pr (%)Re (%)F1 (%)TT (h)FPS (Pictures s−1)
YOLOX-Tiny_41699.5498.52598.698.582.54.89
YOLOX-Tiny_64099.6198.82598.9799.0175.02.17
ECA-YOLOX-Tiny99.7298.8298.89599.0198.52.17
ECA-YOLOX-Tiny (ACLR)99.9498.9899.6399.5215.02.10
Table 4. The detection results of defective insulators before and after the model improved.
ECA-YOLOX-TinyYOLOX-Tiny_640YOLOX-Tiny_416
Applsci 12 09314 i001 Applsci 12 09314 i002 Applsci 12 09314 i003
Applsci 12 09314 i004 Applsci 12 09314 i005 Applsci 12 09314 i006
Applsci 12 09314 i007 Applsci 12 09314 i008 Applsci 12 09314 i009
Applsci 12 09314 i010 Applsci 12 09314 i011 Applsci 12 09314 i012
Table 5. The multi-target detection results of normal insulators before and after the model improved.
ECA-YOLOX-TinyYOLOX-Tiny_640YOLOX-Tiny_416
Applsci 12 09314 i013 Applsci 12 09314 i014 Applsci 12 09314 i015
Applsci 12 09314 i016 Applsci 12 09314 i017 Applsci 12 09314 i018
Applsci 12 09314 i019 Applsci 12 09314 i020 Applsci 12 09314 i021
Applsci 12 09314 i022 Applsci 12 09314 i023 Applsci 12 09314 i024
Table 6. The training results of similar network models.
ModelBackbonemAP (%)Pr (%)Re (%)F1 (%)Parameters
(106)
Training Time (h)FPS (Pictures s−1)
ECA-YOLOX-TinyCSPDarknet99.9498.9899.6399.55.1215.02.10
YOLOV4-TinyCSPDarknet53-Tiny98.7595.9396.1296.05.964.54.87
SSD-MobileNetMobileNetV196.9599.90562.7776.06.452.56.53
Table 7. The detection results of different models on the test set.
ModelTest ImagesSuccessful DetectionMissed DetectionFalse DetectionAcc (%)Test Time (s)
ECA-YOLOX-Tiny5845786098.97418
YOLOV4-Tiny58456118596.06127
SSD-MobileNet584371213063.53122
Table 8. The detection effect of different models for defective insulators with complex backgrounds.
ECA-YOLOX-TinyYOLOV4-TinySSD-MobileNet
Applsci 12 09314 i025 Applsci 12 09314 i026 Applsci 12 09314 i027
Applsci 12 09314 i028 Applsci 12 09314 i029 Applsci 12 09314 i030
Applsci 12 09314 i031 Applsci 12 09314 i032 Applsci 12 09314 i033
Applsci 12 09314 i034 Applsci 12 09314 i035 Applsci 12 09314 i036
Table 9. The detection effect of three models for multi-target normal insulators with different complex backgrounds.
ECA-YOLOX-TinyYOLOV4-TinySSD-MobileNet
Applsci 12 09314 i037 Applsci 12 09314 i038 Applsci 12 09314 i039
Applsci 12 09314 i040 Applsci 12 09314 i041 Applsci 12 09314 i042
Applsci 12 09314 i043 Applsci 12 09314 i044 Applsci 12 09314 i045
Applsci 12 09314 i046 Applsci 12 09314 i047 Applsci 12 09314 i048
Table 10. The heatmap visualization of different models for defective insulators.
ECA-YOLOX-TinyYOLOV4-Tiny
Applsci 12 09314 i049 Applsci 12 09314 i050
Table 11. The heatmap visualization of different models for multi-target normal insulators.
ECA-YOLOX-TinyYOLOV4-Tiny
Applsci 12 09314 i051 Applsci 12 09314 i052
Applsci 12 09314 i053 Applsci 12 09314 i054
Applsci 12 09314 i055 Applsci 12 09314 i056
Applsci 12 09314 i057 Applsci 12 09314 i058
Publisher’s Note: MDPI stays neutral with regard to jurisdictional claims in published maps and institutional affiliations.

