Article

Three-Dimensional Finite Element Analysis for Pressure on Flexible Wall Silos

by
Alhussein Hilal
1,2,*,
Abdel Monem Sanad
1,
Mohamed H. Abdelbarr
2,
Osman M. O. Ramadan
2 and
Hany A. Abdalla
2
1
Department of Construction and Building Engineering, Collage of Engineering and Technology, Arab Academy for Science, Technology and Maritime Transport (AASTMT), 2033 Elhorria, Cairo 11736, Egypt
2
Department of Structural Engineering, Faculty of Engineering, Cairo University, Cairo 12613, Egypt
*
Author to whom correspondence should be addressed.
Appl. Sci. 2022, 12(18), 9251; https://doi.org/10.3390/app12189251
Submission received: 16 August 2022 / Revised: 9 September 2022 / Accepted: 9 September 2022 / Published: 15 September 2022
(This article belongs to the Section Civil Engineering)

Abstract

:
A 3D finite element model (FEM) for predicting the distribution of lateral pressure in a square flexible walled steel silo during the filling phase was analyzed in this study. The numerical approach, developed using Abaqus software, predicts the stress state in bulk solids, as well as the pressures exerted on the silo walls. An elasto-plastic model using the Drucker–Prager criterion was employed to simulate the behavior of the granular materials. The FEM simulates the behavior of the bulk solid and its interaction with the silo’s wall and base using a surface-to-surface discretization model. The model’s predictions were validated by previous experimental measurements. The results revealed good agreement between the FEM predictions and the experimental measurements. The research confirms that the lateral pressure distribution is not uniform at any silo level. This highlights the fact that many available theories and current design codes are not accurate for flexible steel walls. As a result of the wall’s deformability, pressure regimes on the silo wall change significantly in the horizontal direction at any level. The results showed that the horizontal variations of lateral pressure change drastically with regard to wall stiffness. The FEM has been used to investigate the effect of critical parameters on wall pressure distribution, such as properties of bulk solids, wall thickness, and silo type, whether deep or flat.

1. Introduction

1.1. Background

Thin-walled metallic containers have been widely used in agricultural, livestock, and industrial production operations, displacing alternative storage and containment methods in countries that handle huge amounts of granular material every year [1]. As the world’s top wheat importer, Egypt has begun to build large granular handling and storage facilities, with annual wheat imports reaching 13 million tons [2]. Many large-scale silos have been built around the country in the last 10 years. Moreover, some examples of silo collapse have been reported (Minya governorate 2019 [3] and Alexandria governorate 2018 [4]). Thus, deep investigations and a review and validation of current design approaches, which were developed many years ago and have several limitations, are required to identify the causes. Additionally, caution must be exercised in the design process to avoid overstress or buckling of the silo.
Industrial silos are typically composed of steel or concrete, and their behavior varies greatly due to the rigidity of the walls and the friction created between the bulk materials and the walls. Rectangular silos (Figure 1) are generally built of thin metal sections, and, if unstiffened, are flexible as opposed to rigid, as deduced from the Janssen equation, which is most commonly used to forecast the lateral filling pressures of a silo wall. As a result, the purpose of this study is to thoroughly investigate these rectangular silos with thin sections in terms of various silos’ dimensions and wall thicknesses in order to determine the wide range of wall-filling pressures that occur on the flexible wall and to provide designers with suggestions to improve the structural efficiency of the silo.
Straining actions developed in each case are actually different, as measured in many experimental works on both full-scale and pilot-scale silos; however, actual codes do not recognize this large disparity and consider the same actions to be applied in both cases, resulting in an underestimation or overestimation of the real behavior in many cases depending on the silo geometry and bulk material properties. As a result, it is critical to highlight this disparity in behavior by undertaking new research that focuses on the differences in actions taken in each case and their impact on the stability and strength of each type of structure.

1.2. Literature Review

Over the last few decades, significant progress has been made in the computational approaches to granular solids and the design of silos around the world. Many researchers [5,6,7,8,9] have worked on silo design and implemented various principles and suggestions, but only a few have investigated rectangular silos, and even fewer have investigated flexible walled silos compared to the most widely used circular silo due to their thin walls and simplified analysis methods [10]. Rectangular silos have the advantage of the ease of manufacture and rapid construction, justifying their use when manufacturing processes are simplified or construction space is limited [11]. Moreover, more advanced analysis methods for rectangular silos still need to be established, taking into account the stiffness of walls and hoppers, as well as their interactions with the bulk solid.
Current design approaches estimate the horizontal and vertical pressures acting on the wall and hopper, then use the equilibrium equations to calculate the bending moment, shear, and normal forces acting on each structural member. The final results of equilibrium depend on the postulated boundary conditions. A rigid wall boundary condition gives fundamentally different values compared to a very flexible wall. In the latter case, the walls can bend away from the solids, moving the loads from the flexible sections to the rigid sections, and changing the load distribution across the wall.
Because of the huge number of interconnected elements, including the main supporting system, bulk solid/structure interaction, wall deformability, the failure mechanism, and wall imperfection, the silo response becomes more sophisticated to predict. To estimate vertical and horizontal pressures in circular silos, many theories are commonly used.
The majority of classical theories developed by different authors are based on the same model of equilibrium of a horizontal slice of the silo, not distinguishing between them by defining certain parameters such as the angle of internal friction in the stored material, the angle of wall friction, and the ratio of horizontal and vertical pressures [12]. Historically, the wall pressures were considered to be similar to hydrostatic pressures [13]. According to Roberts and Bateman [14], this assumption was not valid, since the wall carries part of the weight of the bulk solid due to the friction between the bulk materials and the walls. Janssen [15] confirmed this phenomenon and developed his widely used method for calculating pressure along a wall’s height. Most codes and standards [16] have adopted the Janssen method, which expressed the wall pressure by Equation (1).
P x = A U ω μ   1 e u A λ μ Z
where P x is the horizontal pressure to the wall; A and U are the area and perimeter of the horizontal section, respectively; ω is the specific weight of the material; μ is the wall friction coefficient; λ is the lateral pressure ratio; and Z is the depth from the free surface.
Airy [17] subsequently proposed another theory to calculate the pressure acting on the circular silo wall. The theory provides the pressure of the grains on the surface of the silo wall; it involves the angle of internal friction of the stored material and the coefficient of wall friction. Recently, Reimbert and Reimbert [18] created other standard theories to estimate horizontal and vertical pressures based on actual data and soil mechanics theories. According to these approaches, the silo wall is rigid, and the pressure in the silo is constant at any level. However, computer models developed in the late 1980s revealed that wall flexibility influences wall pressure distribution [19].

1.3. Limitations of Actual Analysis Method

In circular silos, pressure distributions around the perimeter are uniform at any level due to the condition of the axisymmetric load and geometry. While filling or discharge operations stem from the eccentric point, the distribution of wall pressure will be non-uniform. Recent changes to silo design standards recommend using local loads to account for bending moments caused by non-uniform pressure distribution. Local unsymmetrical low pressures are typically far more destructive than extremely high symmetrical pressures [20].
However, in rectangular planform silos, it is critical to consider the non-uniform pressures that occur around the perimeter as a consequence of the structure’s geometry and wall flexibility (Figure 2). The flexibility of the wall and the boundary conditions have a major effect on the stress state of the stored material. The observed wall pressures were significantly different from those expected by conventional theories and design standards. This is because standard theories were established for circular silos with inflexible walls and neglected the impacts of bulk solids/structure interaction [21]. Additionally, numerical models have demonstrated that wall flexibility affects the values of wall pressure distribution in circular silos, and even more substantially in rectangular planform silos [19,22], when it affects both values and the distribution of wall pressure.
Goodey et al. [11] mentioned that the mean lateral filling pressure may be close to Janssen’s prediction at any height. However, the distribution of such filling pressures is far from uniform over any horizontal section. He also demonstrated that the distribution of lateral wall pressures depends on the relative elastic stiffness of the bulk solids and structural elements, where slight changes in the characteristics of granular materials can have significant effects on the pressure magnitudes and patterns, thus strongly affecting the design of silo structures [16,23].
Since most design codes use the Janssen equation as a reference for the prediction of filling wall pressure, all methods would underestimate the maximum existing pressure at any level, which leads to unsatisfactory design if used without amplification or safety factors. Hence, it is essential to develop an accurate tool to predict the straining actions on the walls of flexible silos and to identify the limitations of the codes.

1.4. Research Objective

The main objective of this research is to accurately estimate the straining actions on flexible wall silos. This study discusses the use of finite element models to predict pressures in silos with considerable wall deformations during the filling stage. The study will define the behavior of bulk solids and the stresses they apply on walls to provide information on:
  • The pressure distributions in square rigid and flexible wall silos.
  • The effect of wall deformability.
  • The validation of the numerical models using experimental data and the comparison with the Janssen equation taking into consideration its assumptions and limitations.

2. Numerical Approach

In this research, a 3D finite element model using commercially verified software Abaqus [24] was developed to simulate the solid bulk behavior and its interaction with the walls. The finite element results were compared and validated using experimental measurements presented by Lahlouh [25]. Figure 3 shows the geometry of the experimental model that was used in the numerical analysis. The developed finite element model was used to understand and study the parameters that affect the actions on the silo wall.
The silo walls used in this study are made of 6 mm thick steel plates and have a 1.5 m square section and 2.5 m depth filled with Leighton Buzzard sand with a density of 1587 kg/m3 [h/d = 1.67]. The finite element model is compared to the experiment results of Lahlouh at various sections along the silo height as defined by the location of load cells, as shown in Figure 2a.

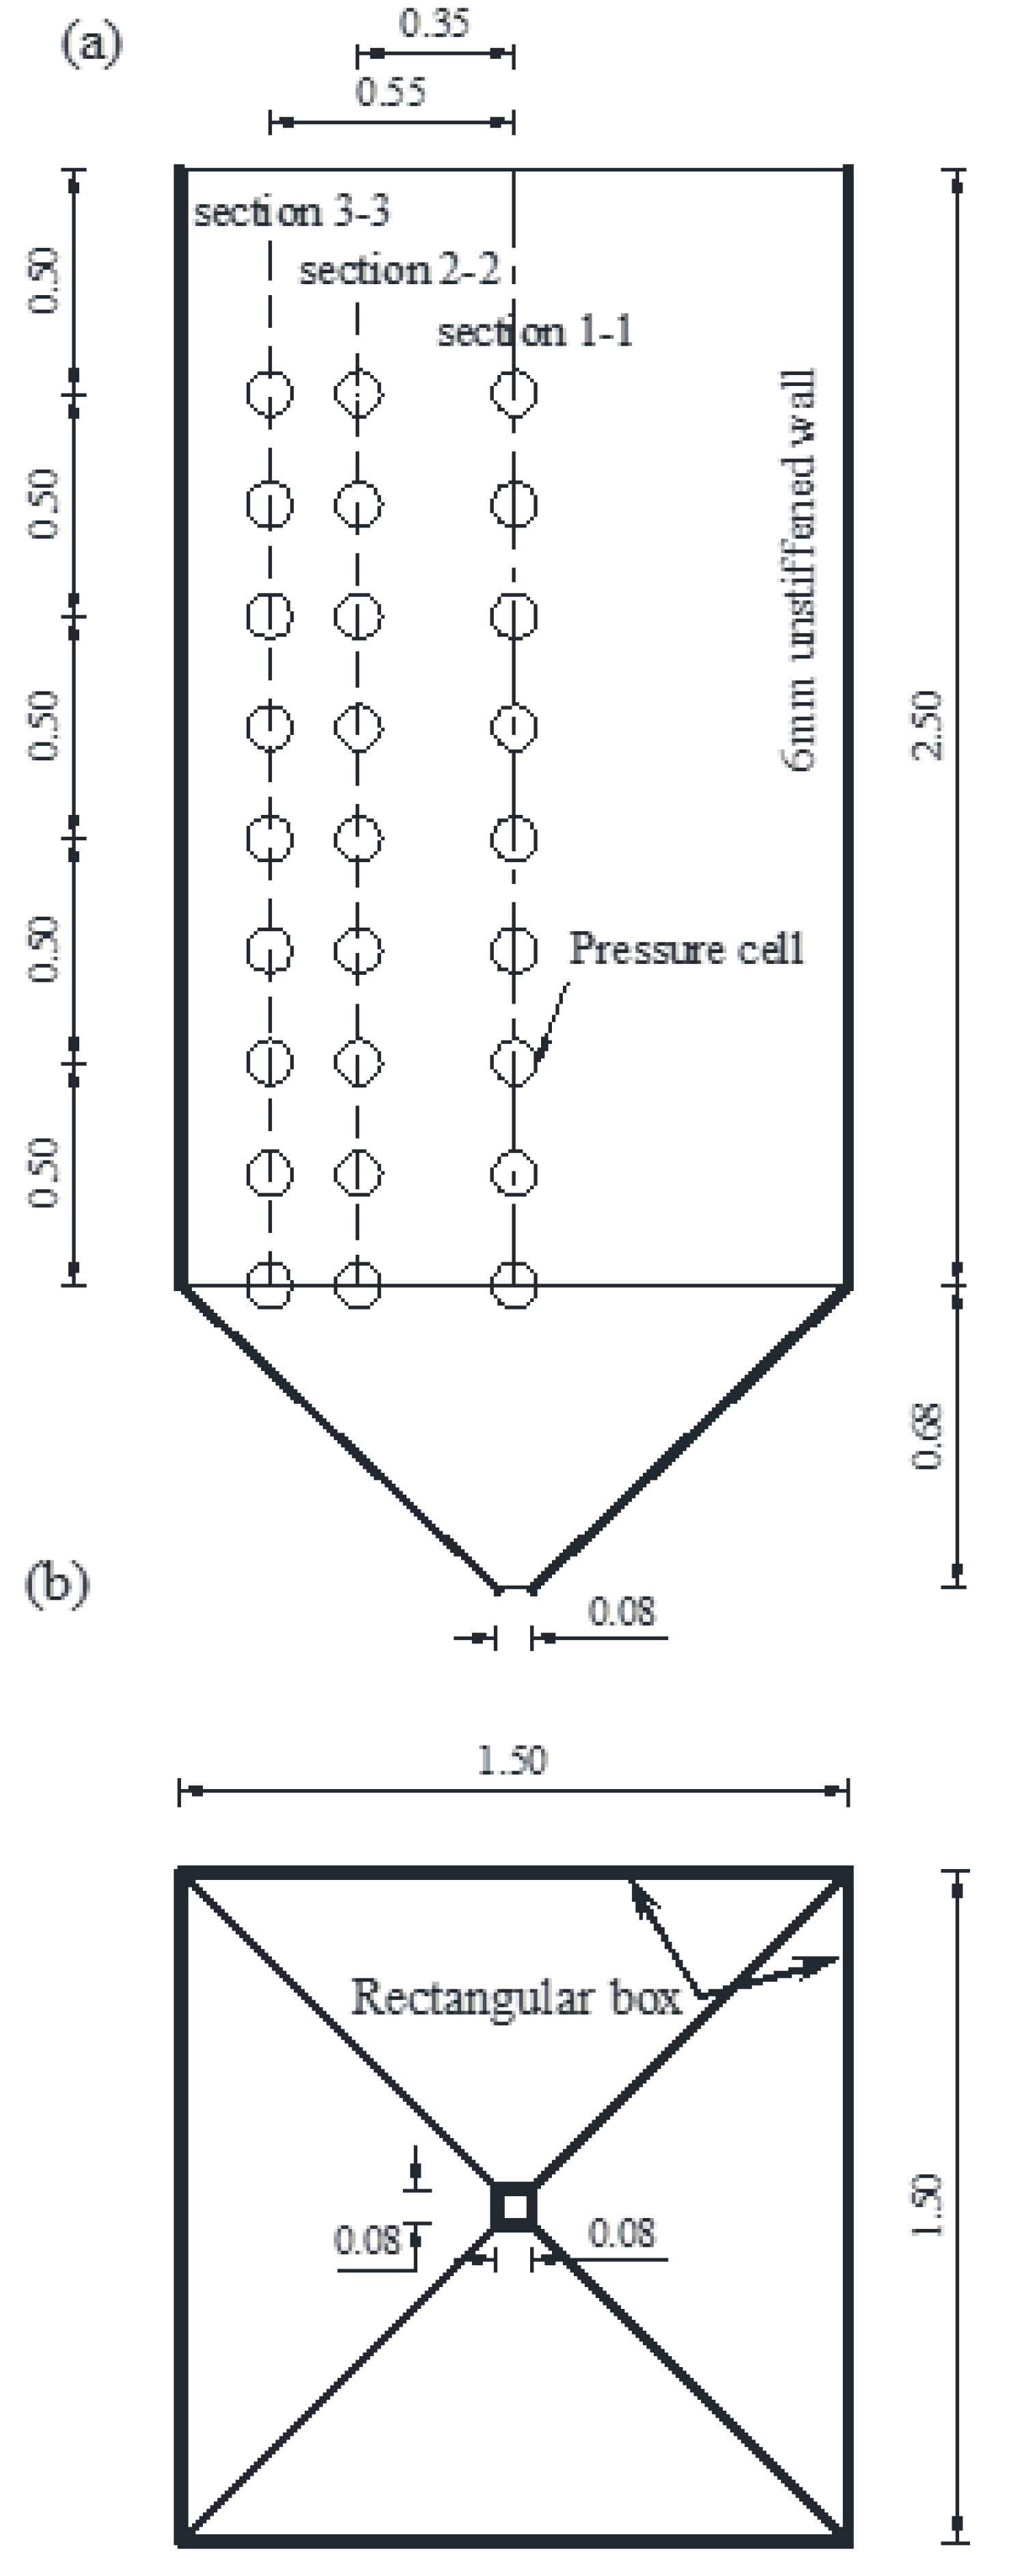
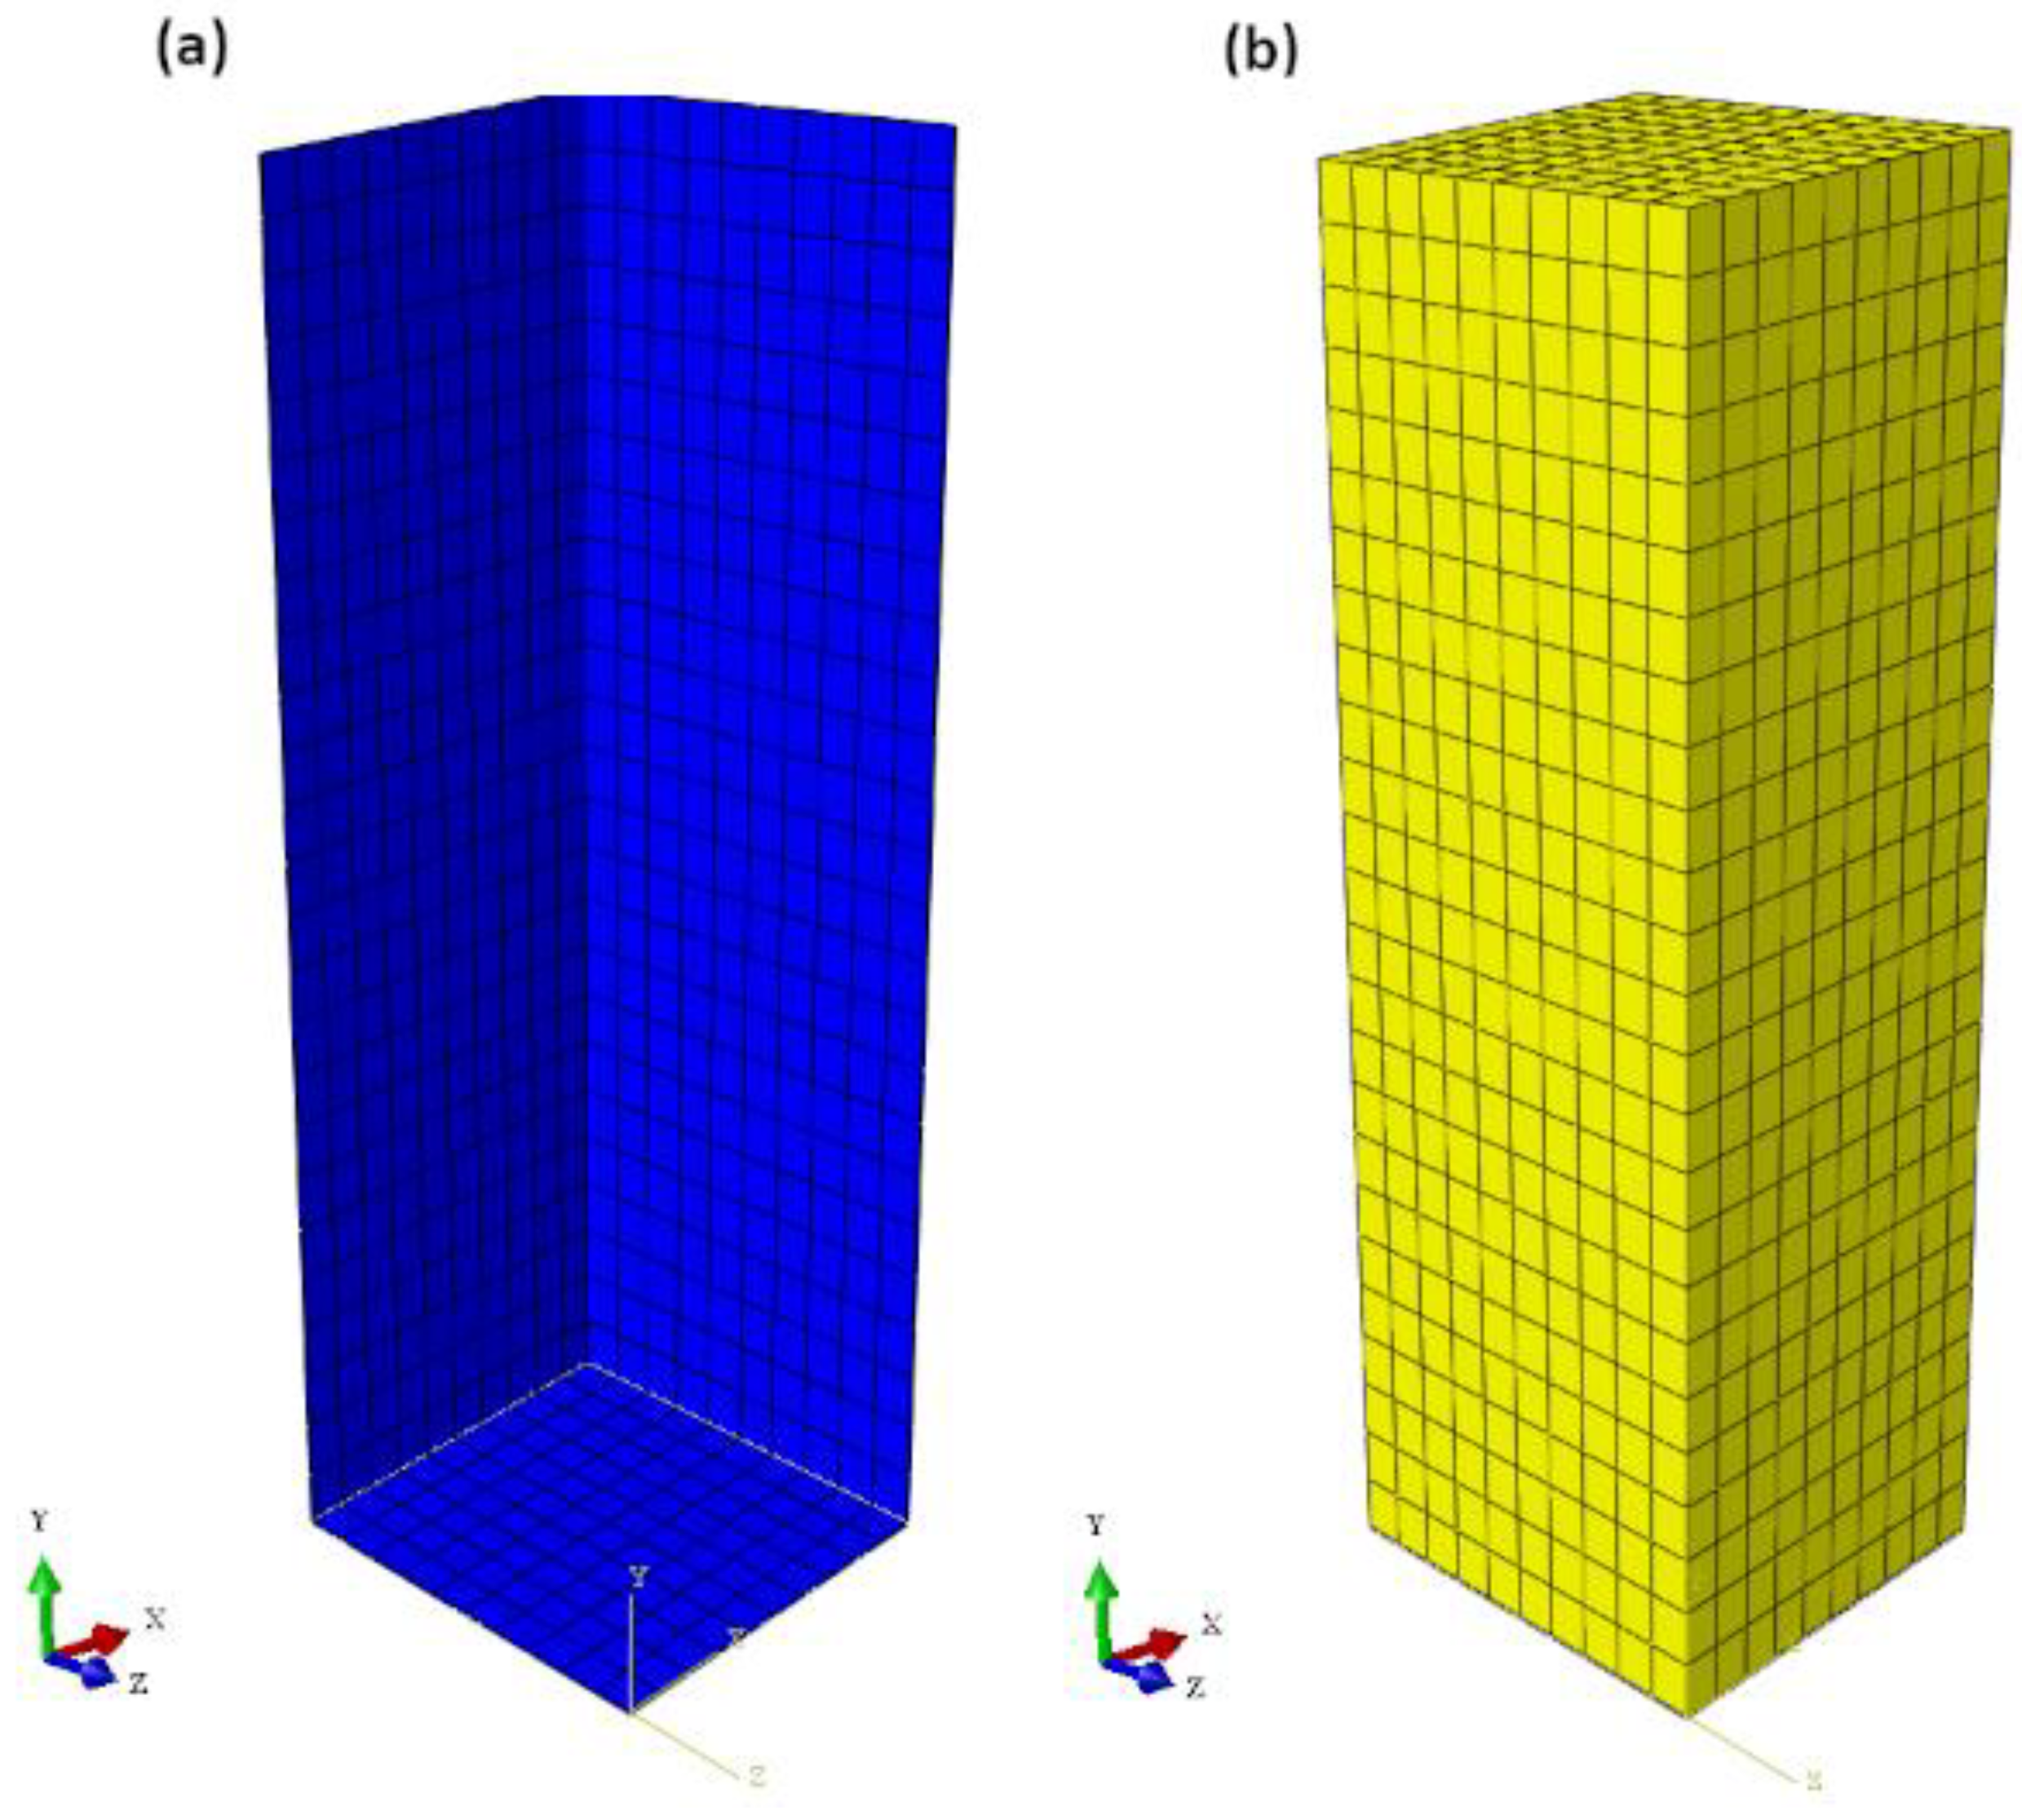
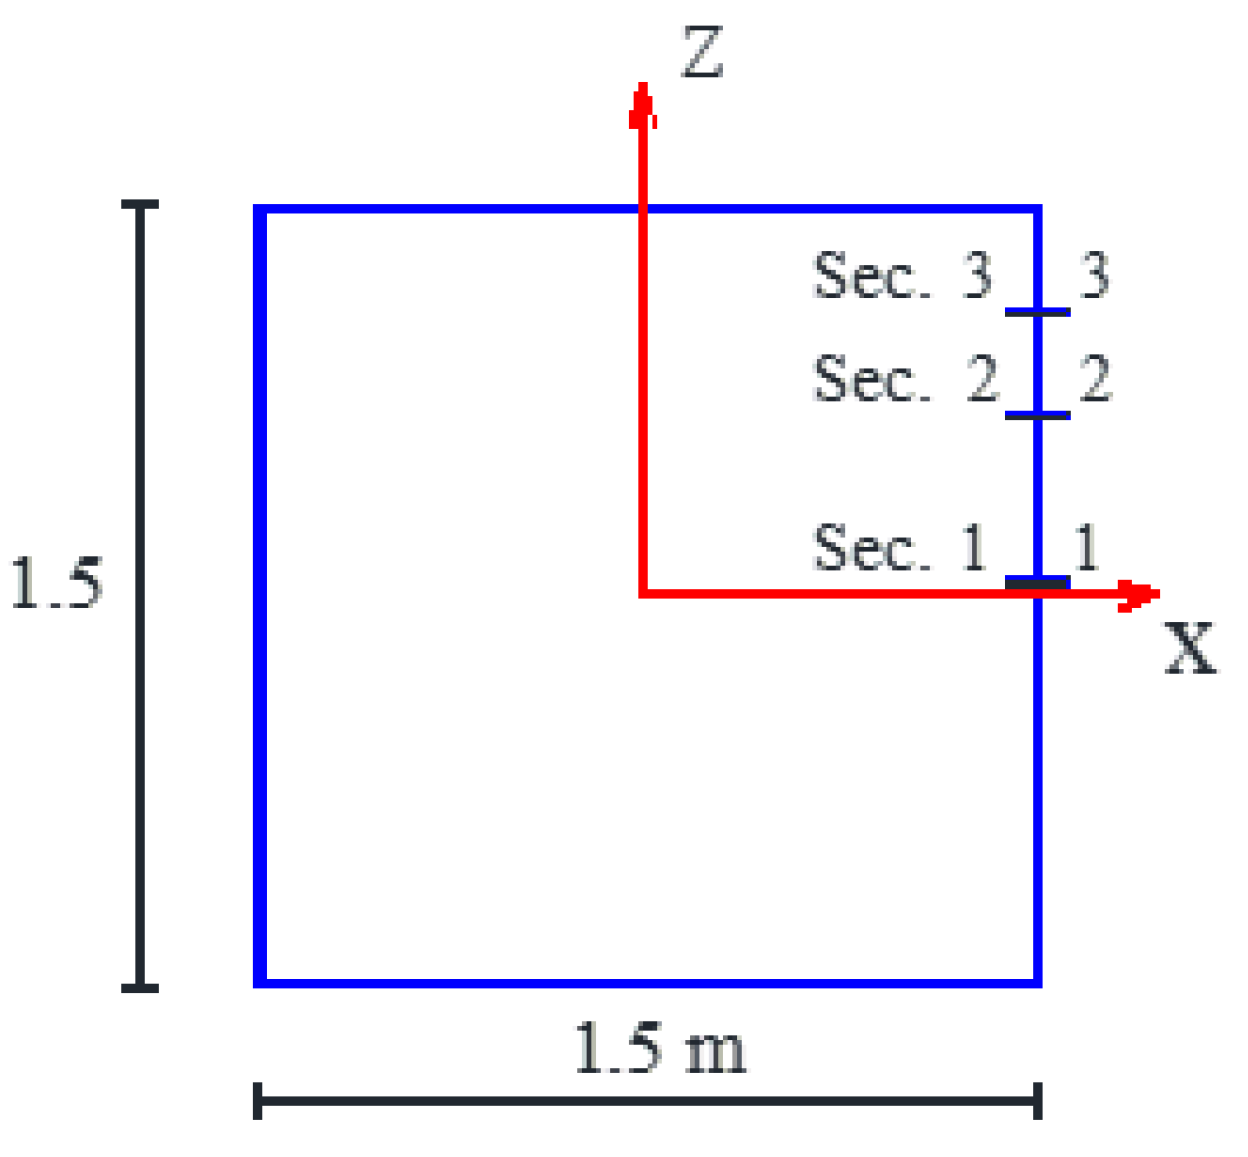
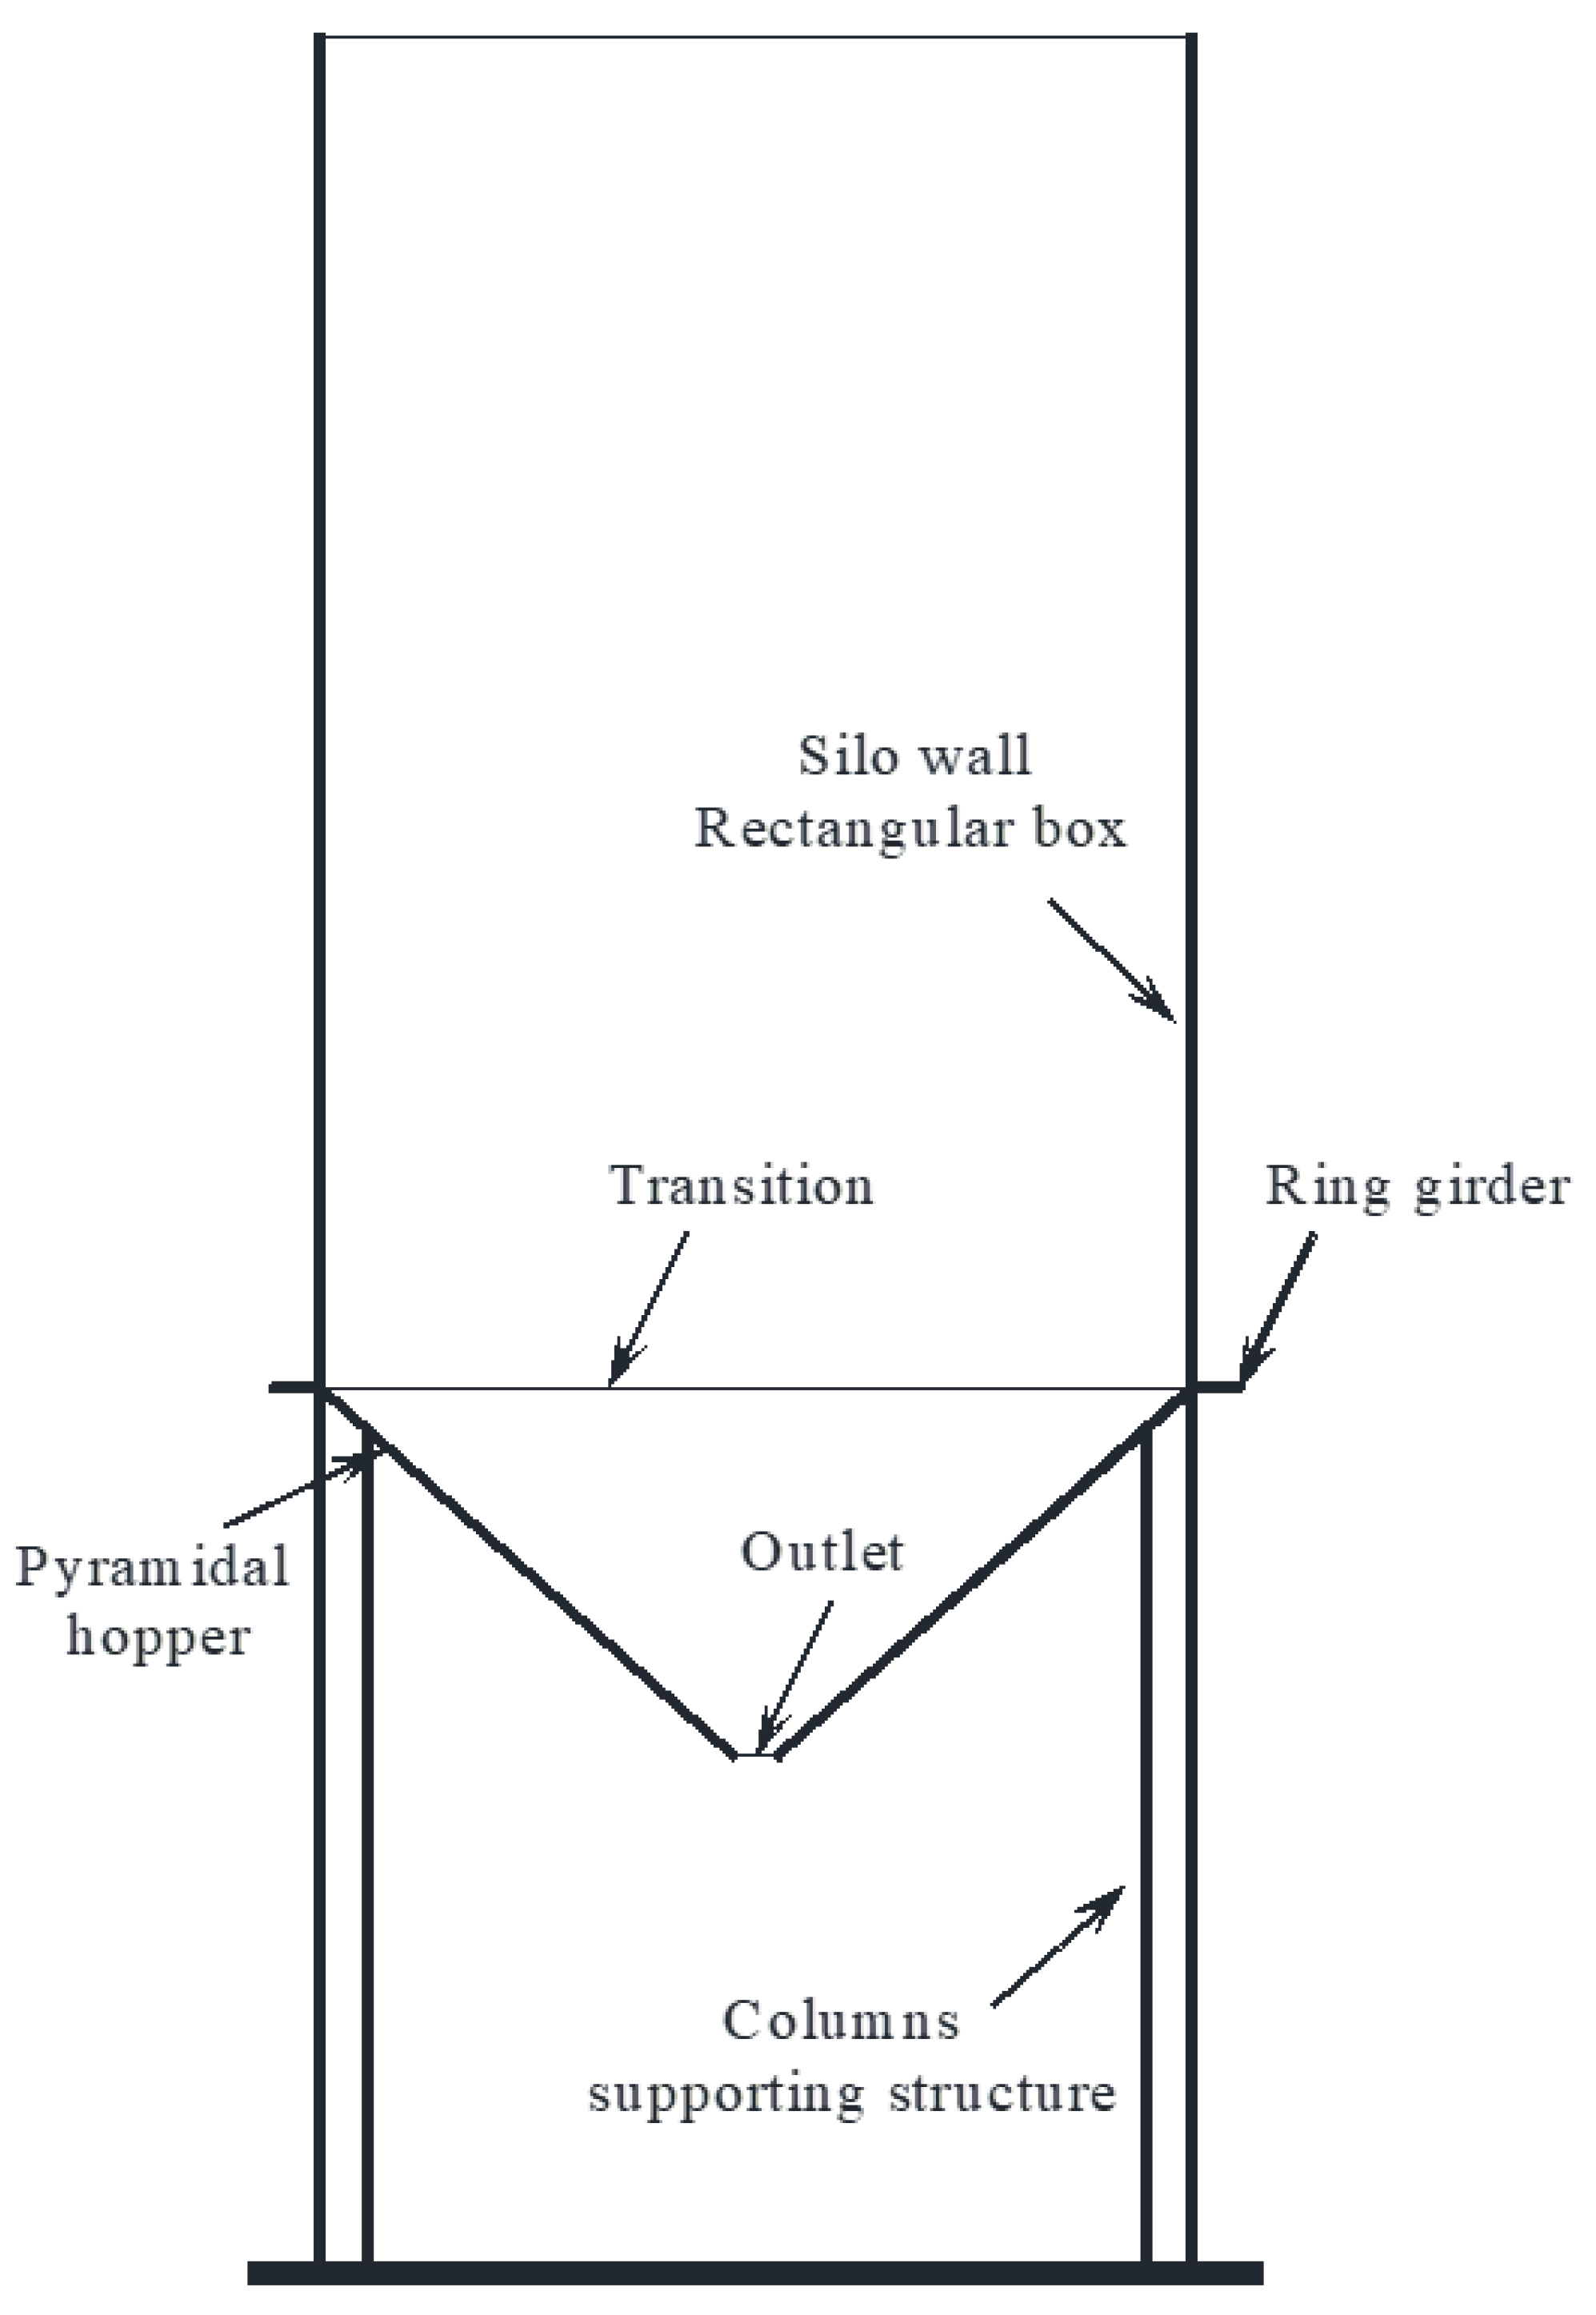
2.1. Model Description

The finite element model was developed using data obtained from the experimental setup carried out by Lahlouh [26]. Only one-quarter of the silo is modelled for the reason of symmetry, as shown in Figure 4, in order to represent both the stored granular materials and the silo structure. The model consists of three parts: the bulk solids, the silo walls, and the base. An elasto-plastic model using the Drucker–Prager criterion is used to simulate the behavior of the bulk materials during filling, while the behavior of steel walls and the base is modelled using Hooke’s law in the elastic zone and plasticity criterion to define the yield and hardening zone of the behavior.
The filling phase is modelled by applying the bulk weight over several numerical steps. At the end of each step of loading, equilibrium is attained before increasing the weight. Previous research [27] showed an insignificant difference in lateral wall pressure in the model between the one-time or progressive filling process, when using the static equilibrium approach. The granular materials, silo walls, and base are discretized using hexahedron finite elements with 8 nodes, as shown in Figure 5 (cubic brick element C3D8R).

2.2. Bulk Solid

The bulk solid used in the experimental work was Leighton Buzzard sand, due to its clearly defined and easily measured properties. The physical and mechanical properties of the granular materials and steel walls were taken from Goodey [11]. Table 1 displays the mechanical properties of the stored granular materials. The behavior of the material was considered isotropic in the numerical model. Table 2 shows the physical and mechanical properties of the steel walls and base in the numerical model.

2.3. Bulk Solid-Wall Interaction

The contact between the walls and bulk material is modelled using a surface-to-surface discretization model option in the Abaqus software [24]. The program provides many methods for defining the contact between two or more surfaces. For defining contact, Abaqus/Standard specifies two kinds of interaction approaches:
  • Contact pair interaction.
  • General contact interaction.
A contact pair is used to simulate the interaction of stored granular materials with the silo wall. The friction coefficient between the granular materials and the silo wall is considered to be constant along the silo height, as given in Table 1. This model applies the Coulomb friction model for frictional interaction, which employs a simple coefficient, µ, to connect shear stress τ x y during sliding to normal stress ( σ x ) , as shown in Equation (2).
τ x y σ x = μ
The constraint enforcement approach used to define the model’s tangential behavior is the penalty friction formulation, which imposes a coefficient of friction between surfaces. The sliding formulation used is finite sliding. It allows for arbitrary contact surface relative separation, sliding, and rotation. Based on the relative tangential motion of the contact surfaces, the connectivity of the presently active contact restrictions is updated.

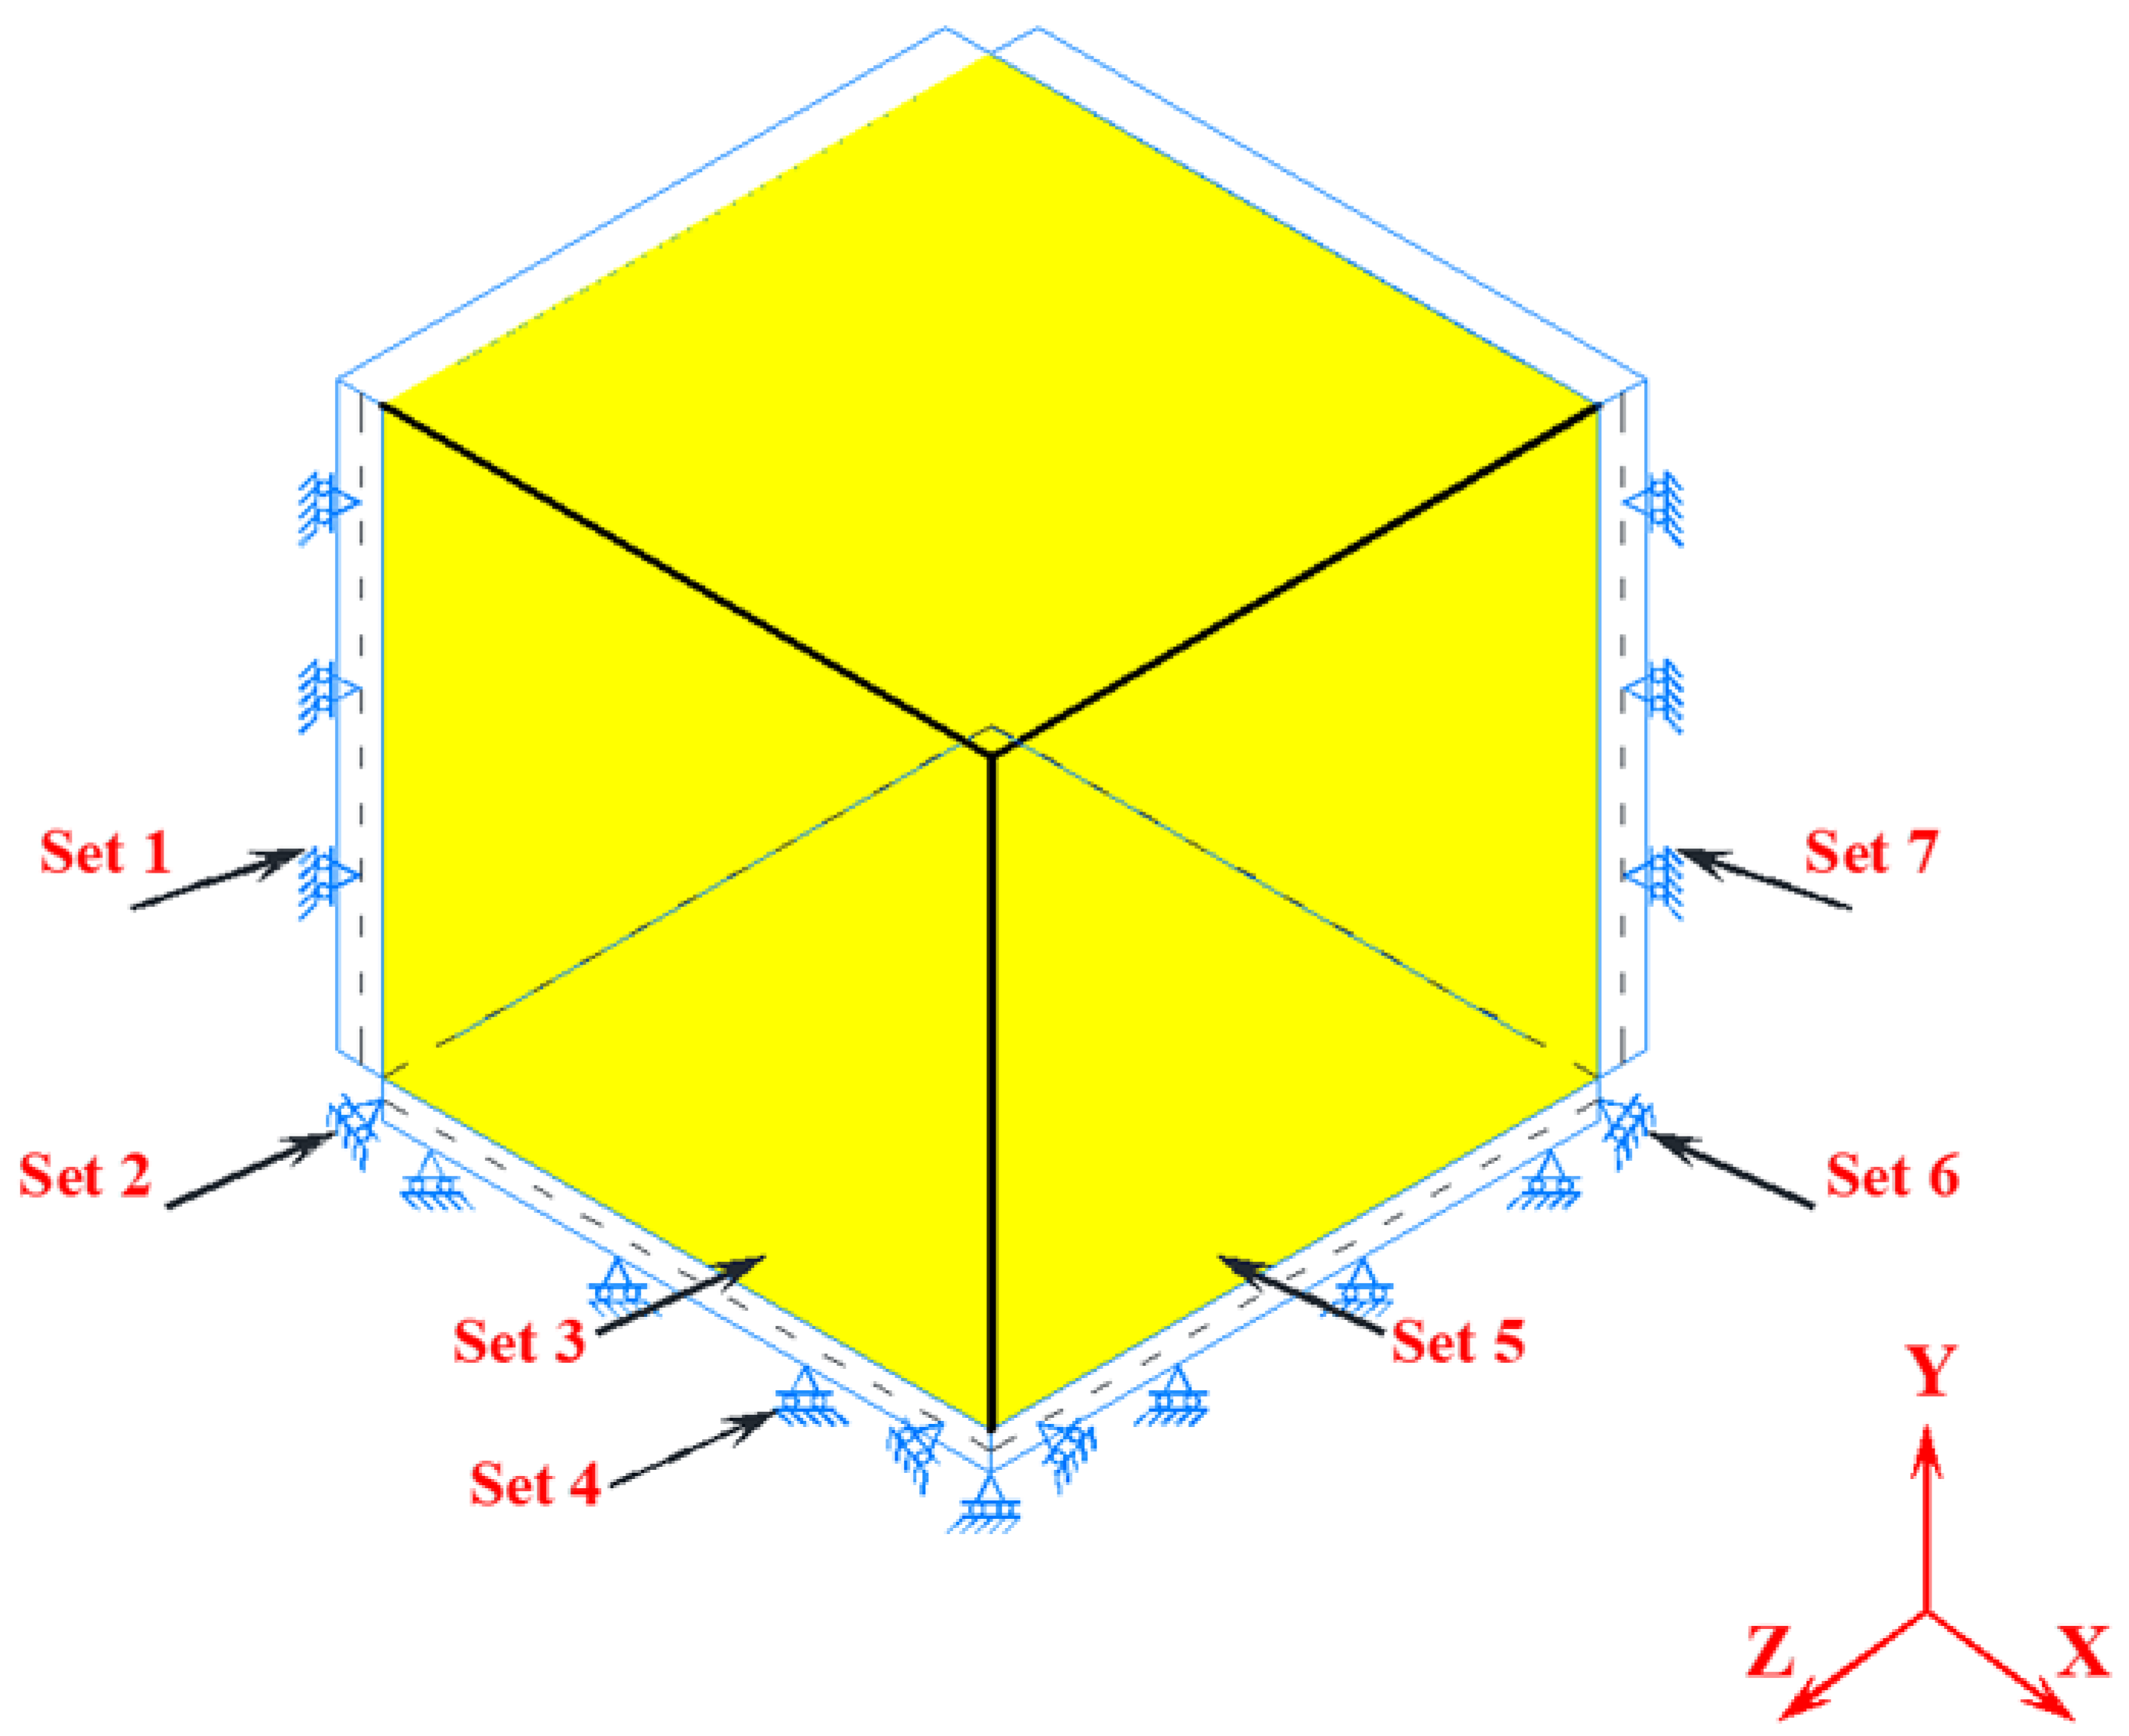
2.4. Boundary Conditions

All models examined so far have a flat bottom, and the structure’s base has been vertically restrained in the Y-direction, as shown in Figure 6. The boundary conditions of the bulk solids and silo walls were set only at the axes of symmetry in the directions of x and z to avoid the normal displacements concerning the symmetry plane. The boundary conditions for the one-quarter silo are described in detail below.
  • Set 1: Prohibit the wall’s lateral movement along the z-axis, U3 = 0.
  • Set 2: Prohibit the base’s lateral movement along the z-axis, U3 = 0.
  • Set 3: Prevent the lateral movement of the bulk solids in ZSYMM, (U3 = UR1 = UR2 = 0).
  • Set 4: Prohibit the base’s movement in the vertical direction in the z-axis, U2 = 0.
  • Set 5: Prevent the lateral movement of the bulk solids in XSYMM, (U1 = UR2 = UR3 = 0).
  • Set 6: Prohibit the base’s lateral movement along the x-axis, U1 = 0.
  • Set 7: Prohibit the wall’s lateral movement along the x-axis, U1 = 0.

2.5. Numerical Result and Validation

The finite element results are compared and validated against experimental results [26] from previous research conducted at Edinburgh University, as well as the Janssen equation [15]. Pressure distribution readings throughout the silo wall are given in the experimental data at various sections.

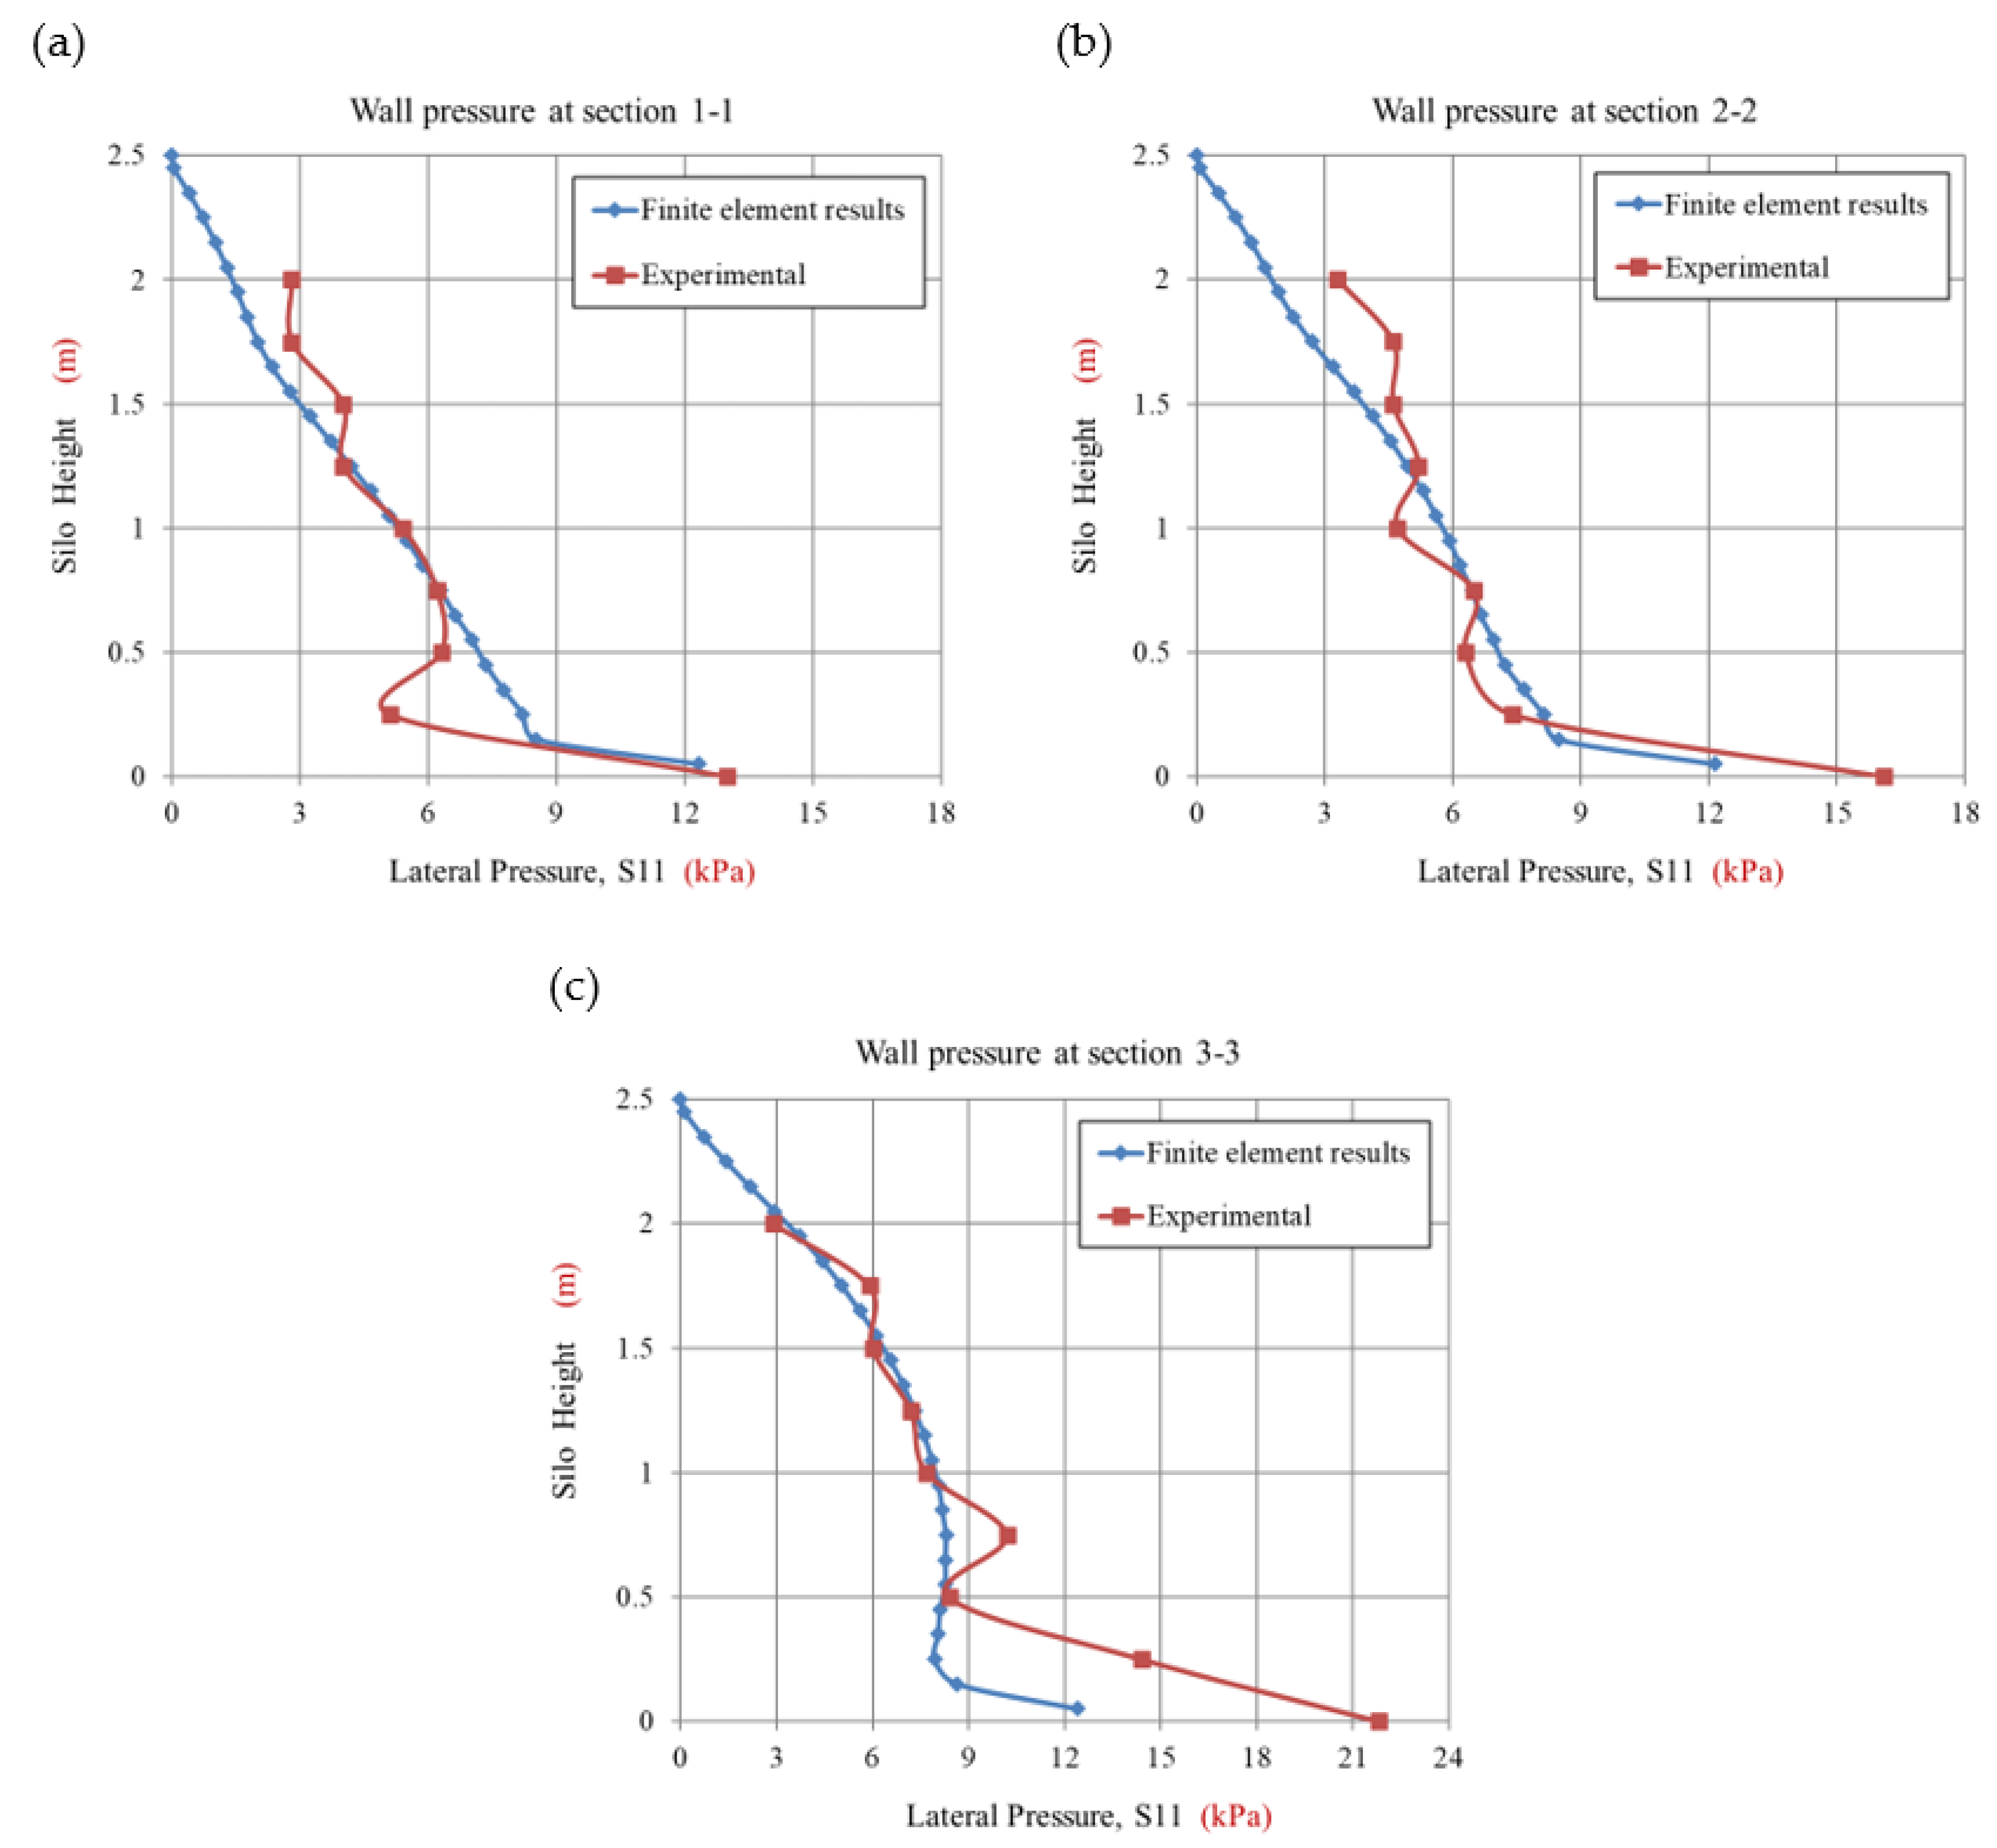
2.5.1. Comparison with Experimental Data (Flexible Wall)

The bulk material is in contact with the wall through the Coulomb friction model. The results of the finite element analysis are then compared to Lahlouh’s experimental data [25].
Due to the extensive readings of wall pressure cells along the silo height in Lahlouh’s experiment, a huge amount of data was obtained. Three vertical sections were generated and used to evaluate the finite element model in this validation to address the change in lateral wall pressure distribution along the silo wall. These three sections are illustrated in Figure 7.
Figure 8 shows a comparison between the finite element results and the experimental measurements for the lateral pressure distribution along the silo height. The bottom of the silo, where the silo wall meets the hopper, is represented by the zero value on the vertical axis of the silo height.
For the vertical sections 2-2 and 3-3, the numerical results relatively match with data from the experimental work, as shown in Figure 8b,c, with some discrepancies around the top of the silo height and near the bottom. These changes become more pronounced as a consequence of the silo corner’s vicinity, which is thought to be a rigid section.
As seen in Figure 8a, the finite element results closely match those of the experimental work. Both trends are in good agreement across the whole silo height with a discrepancy above the base, where the experimental results suddenly decreased to 5.1 kPa, while the finite element model is homogenous with the smooth value of 8.2 kPa. This change might be the consequence of a minor variation of pressure acting on the load cell due to its vicinity to the base.
Based on the results shown in Figure 8, the influence of wall flexibility can be observed clearly in these curves. The lateral wall pressures increase gradually toward the corner section, where the peak value is shown in Figure 8c. These findings demonstrate that the horizontal pressure distribution is not uniform at any depth during the filling phase.
In conclusion, there are qualitative and quantitative agreements between the finite element results and the outcomes of Lahlouh’s work in predicting the lateral pressure distribution for two reasons:
  • The trend of the finite element distribution matches the average of the experimental work over the entire silo height.
  • The finite element lateral wall pressure values are close to those of Lahlouh’s experimental work for all vertical sections, with the coefficient of determination, R2, equaling 0.81, 0.83, and 0.84 for sections 1-1, 2-2, and 3-3, respectively.

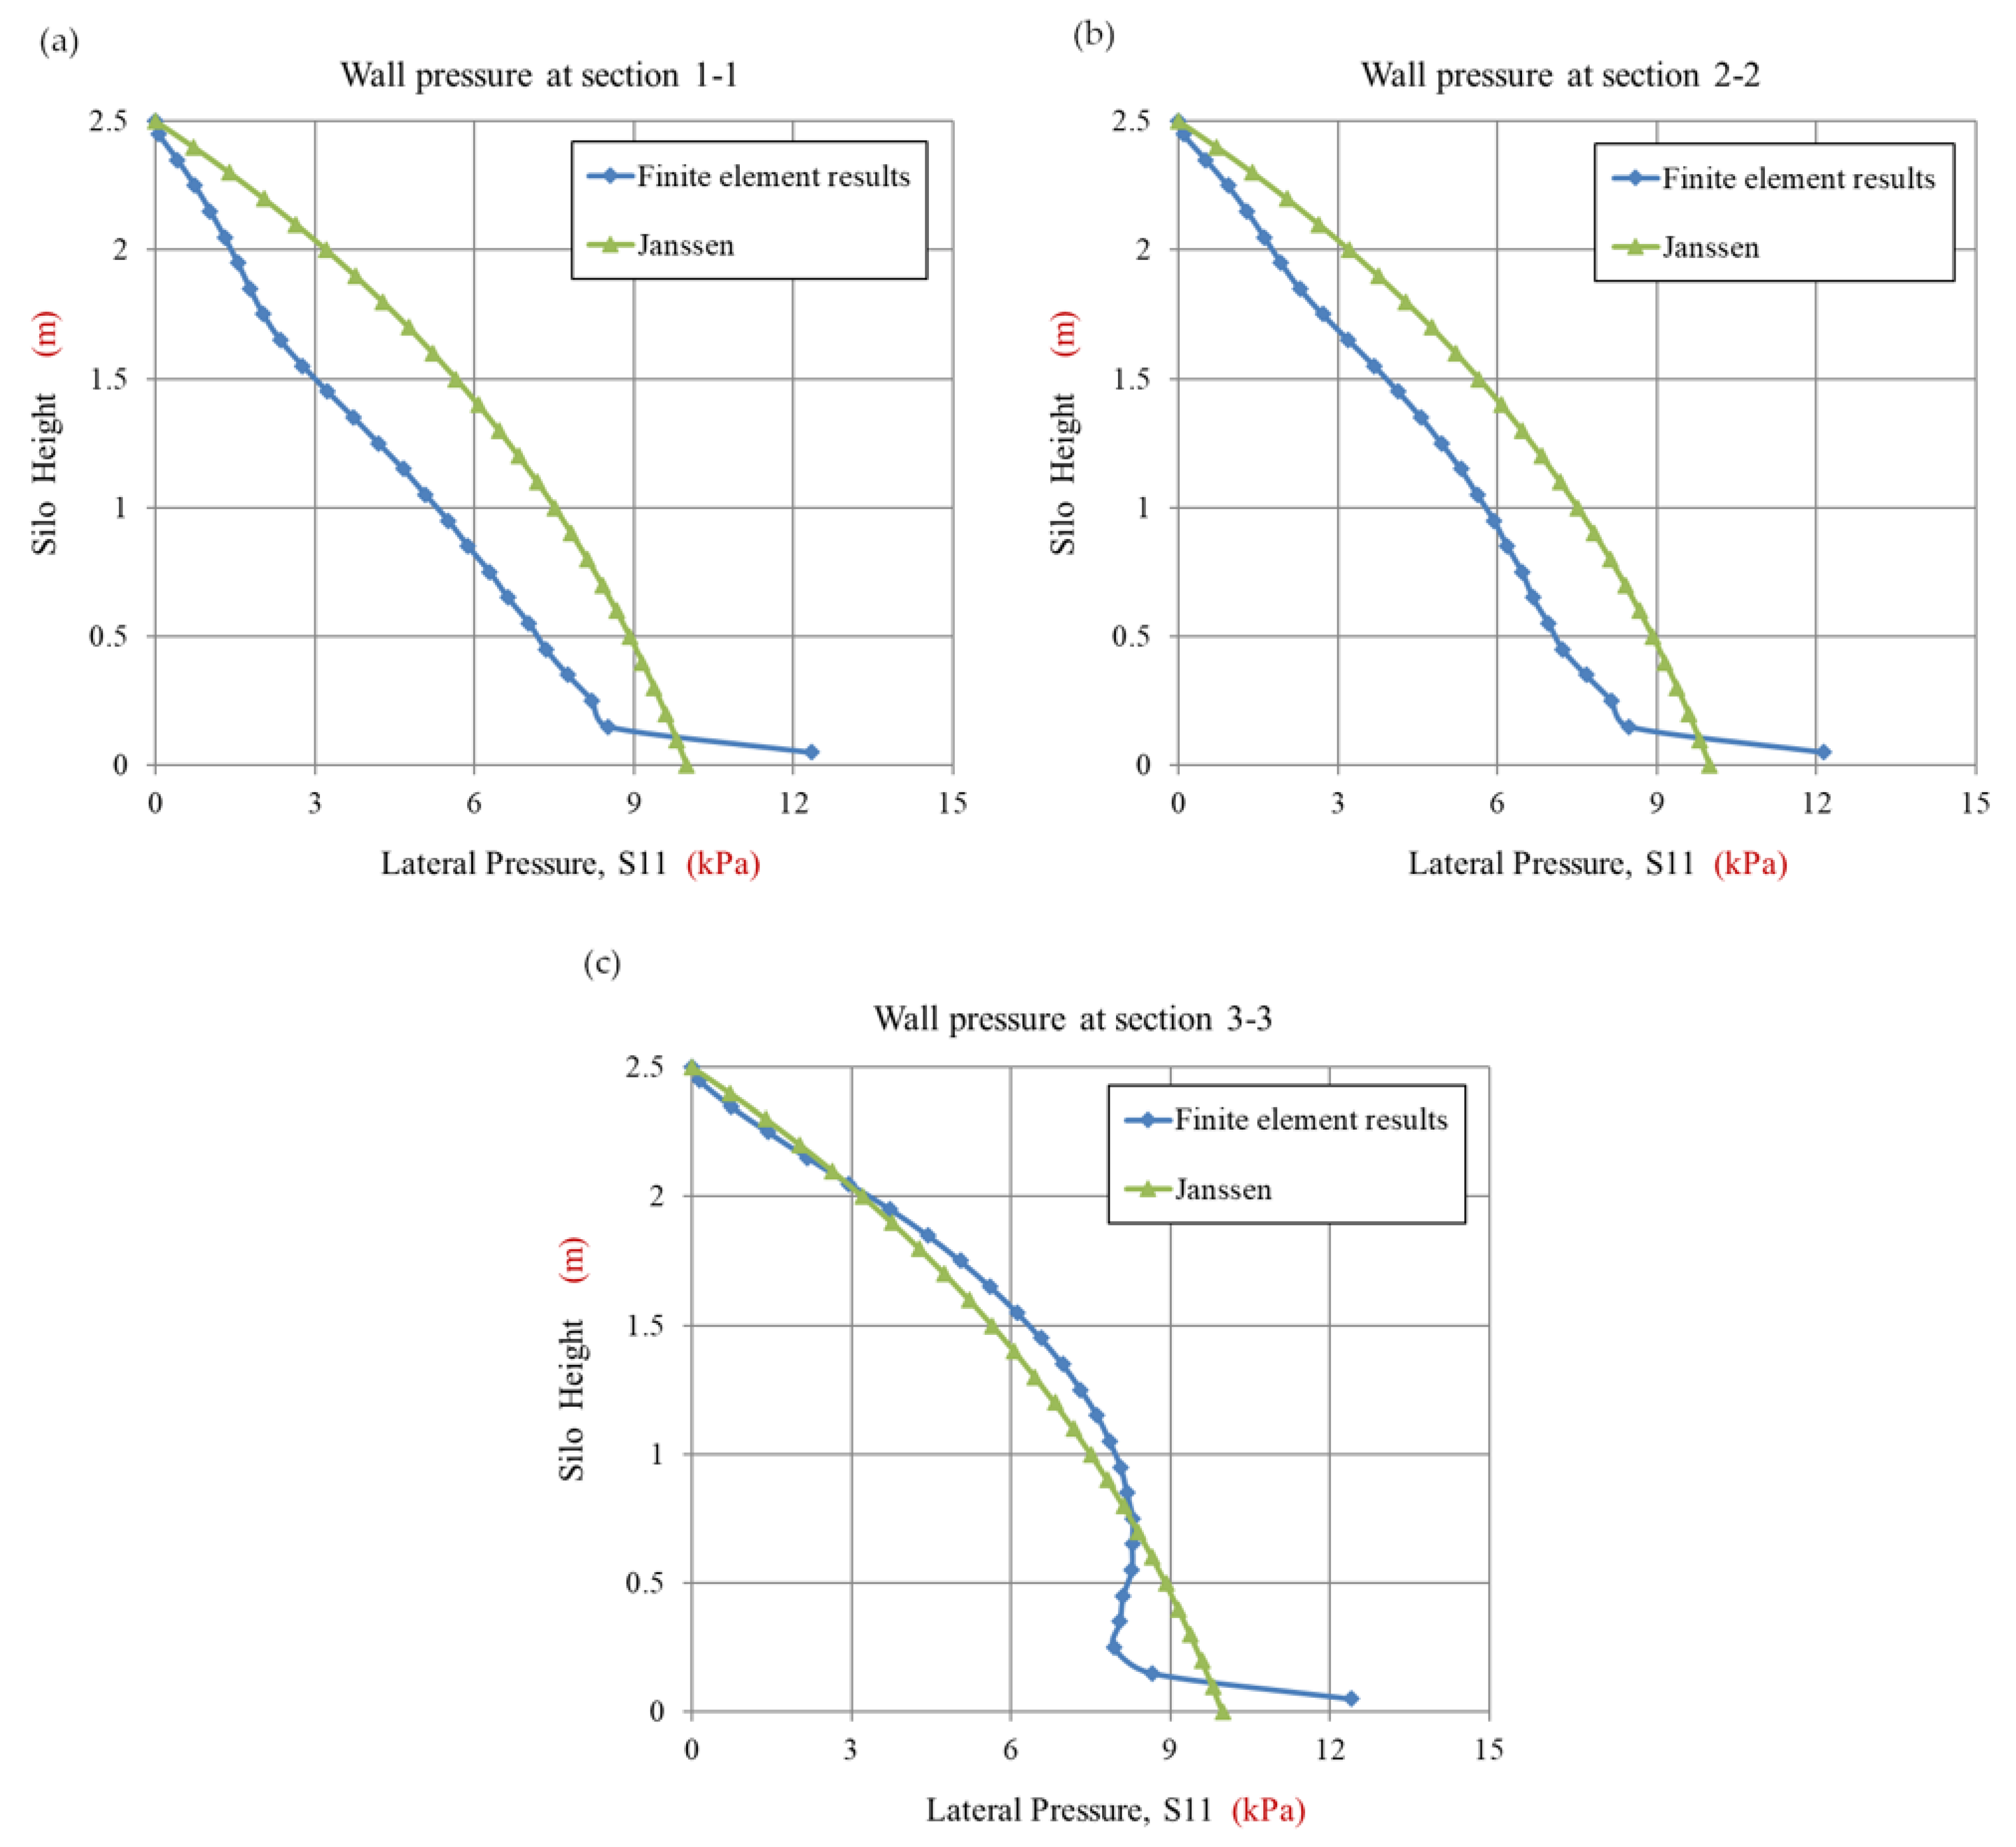
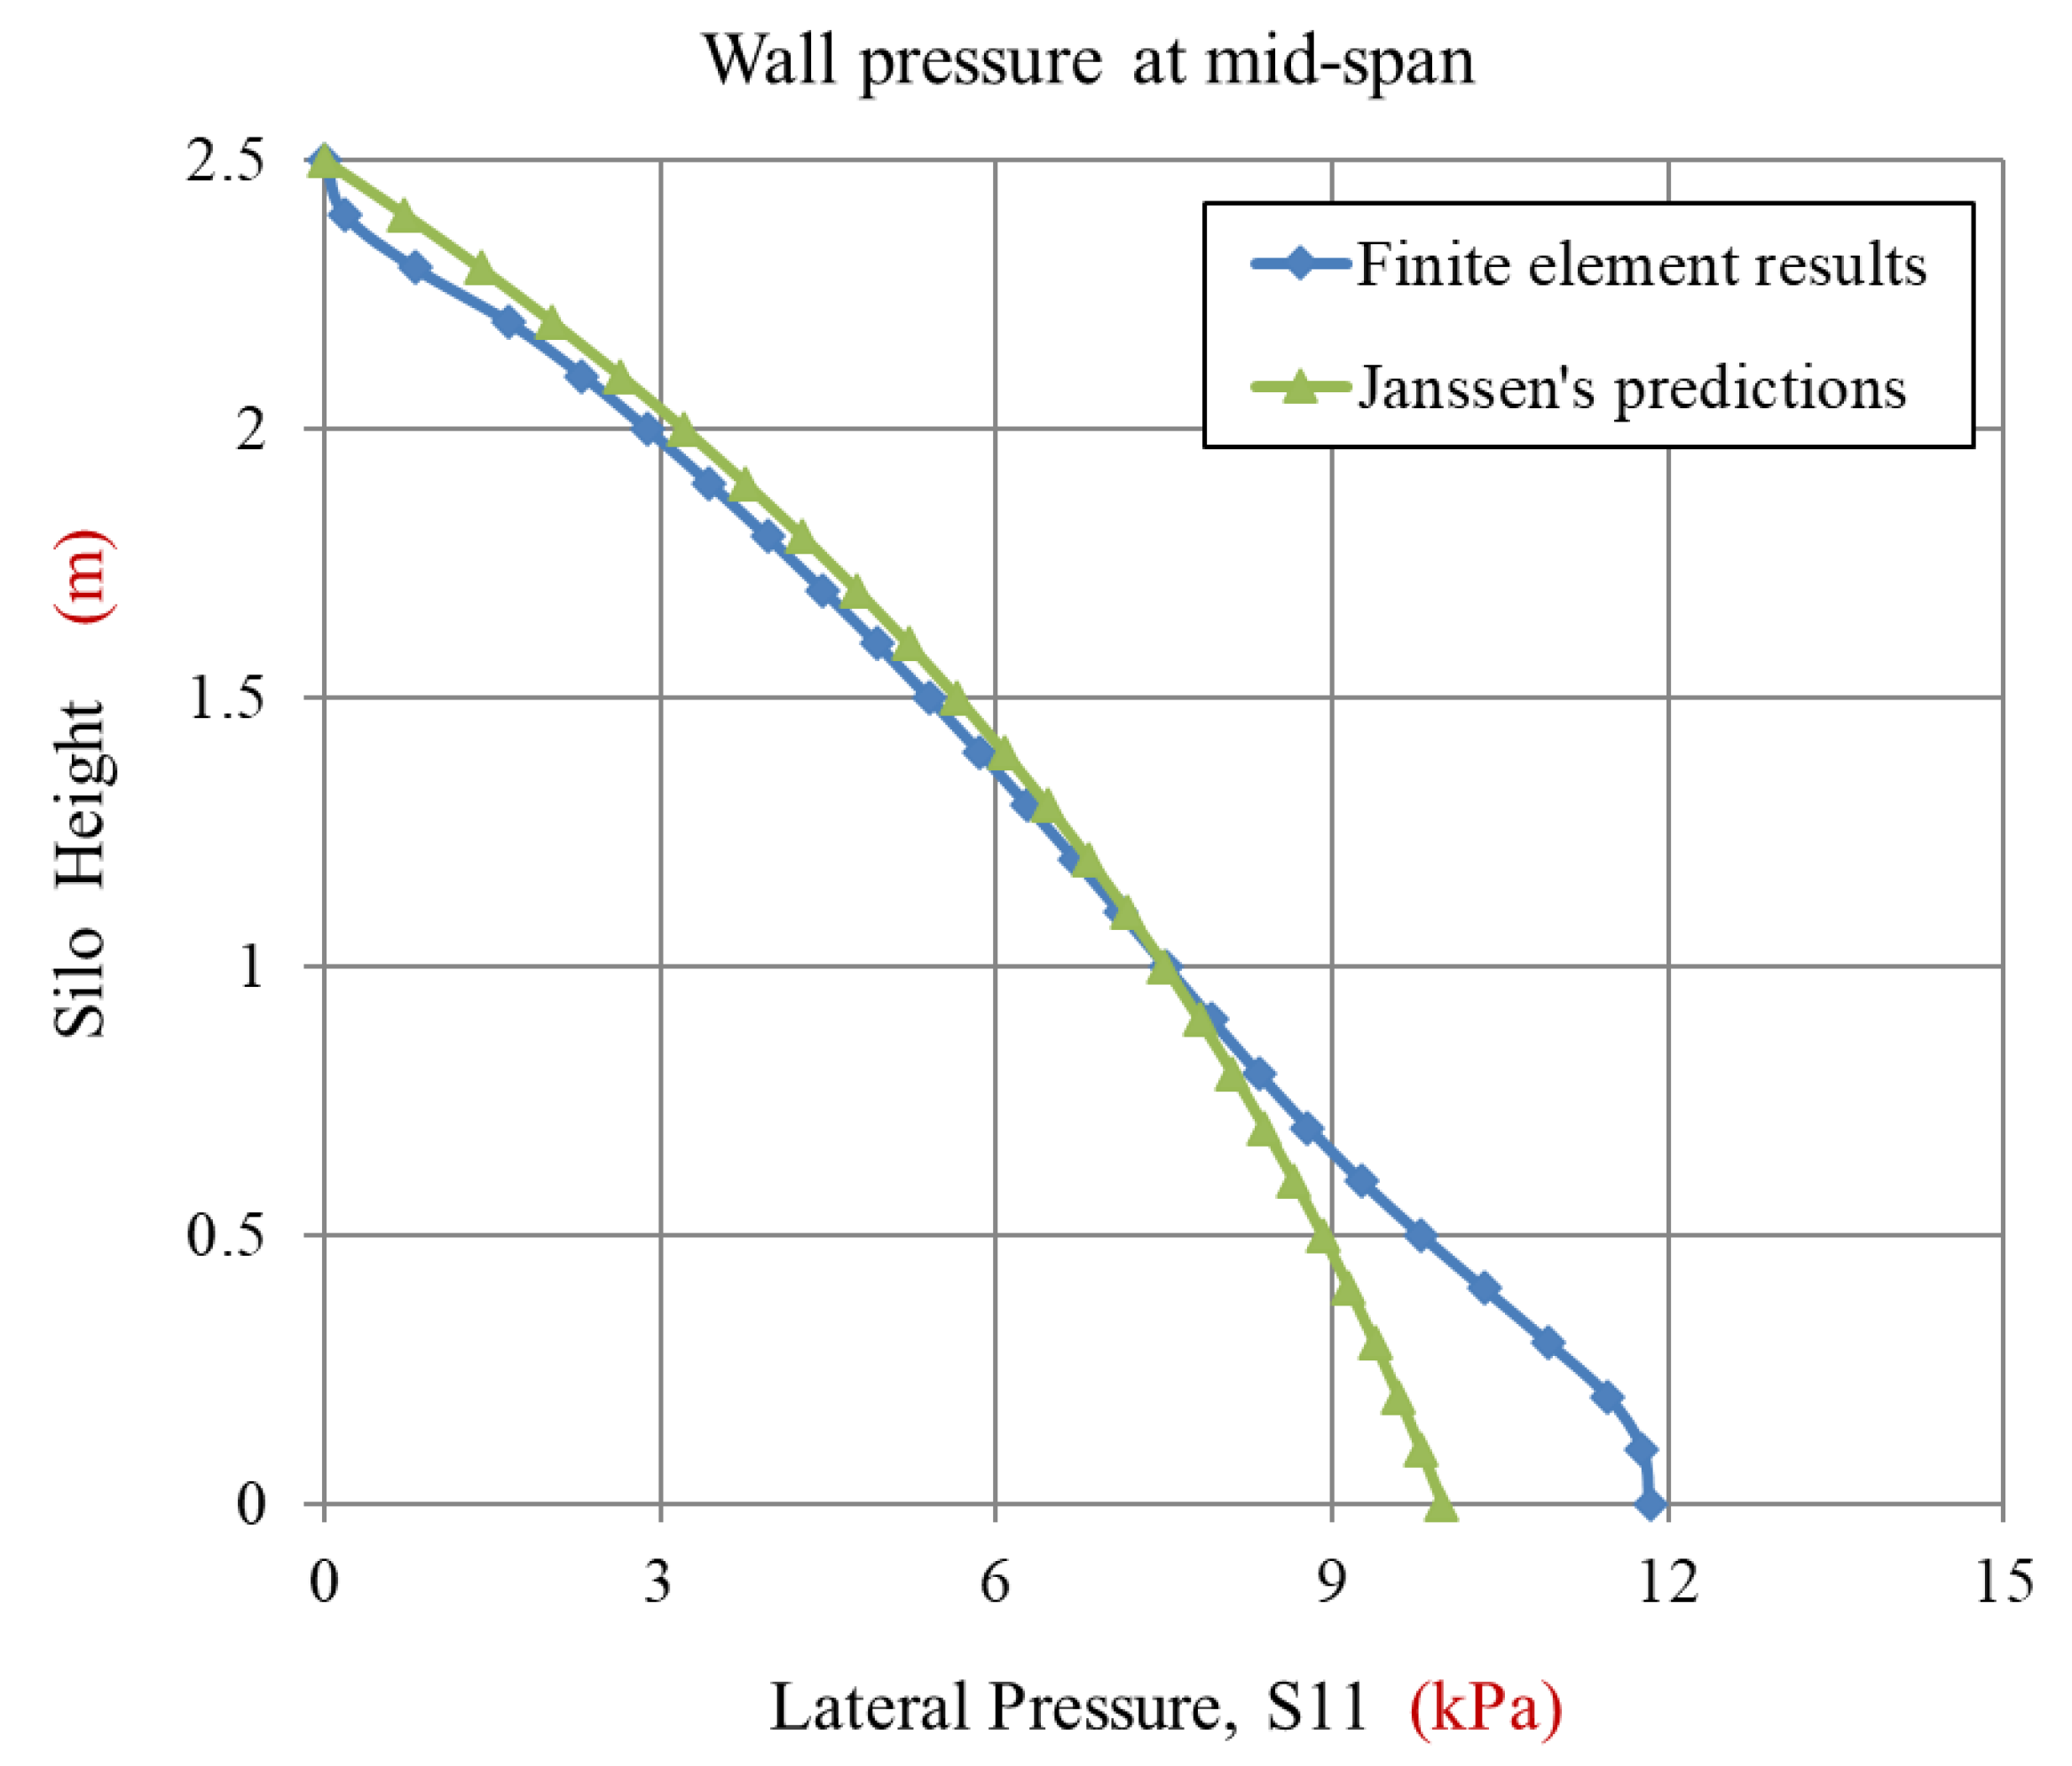
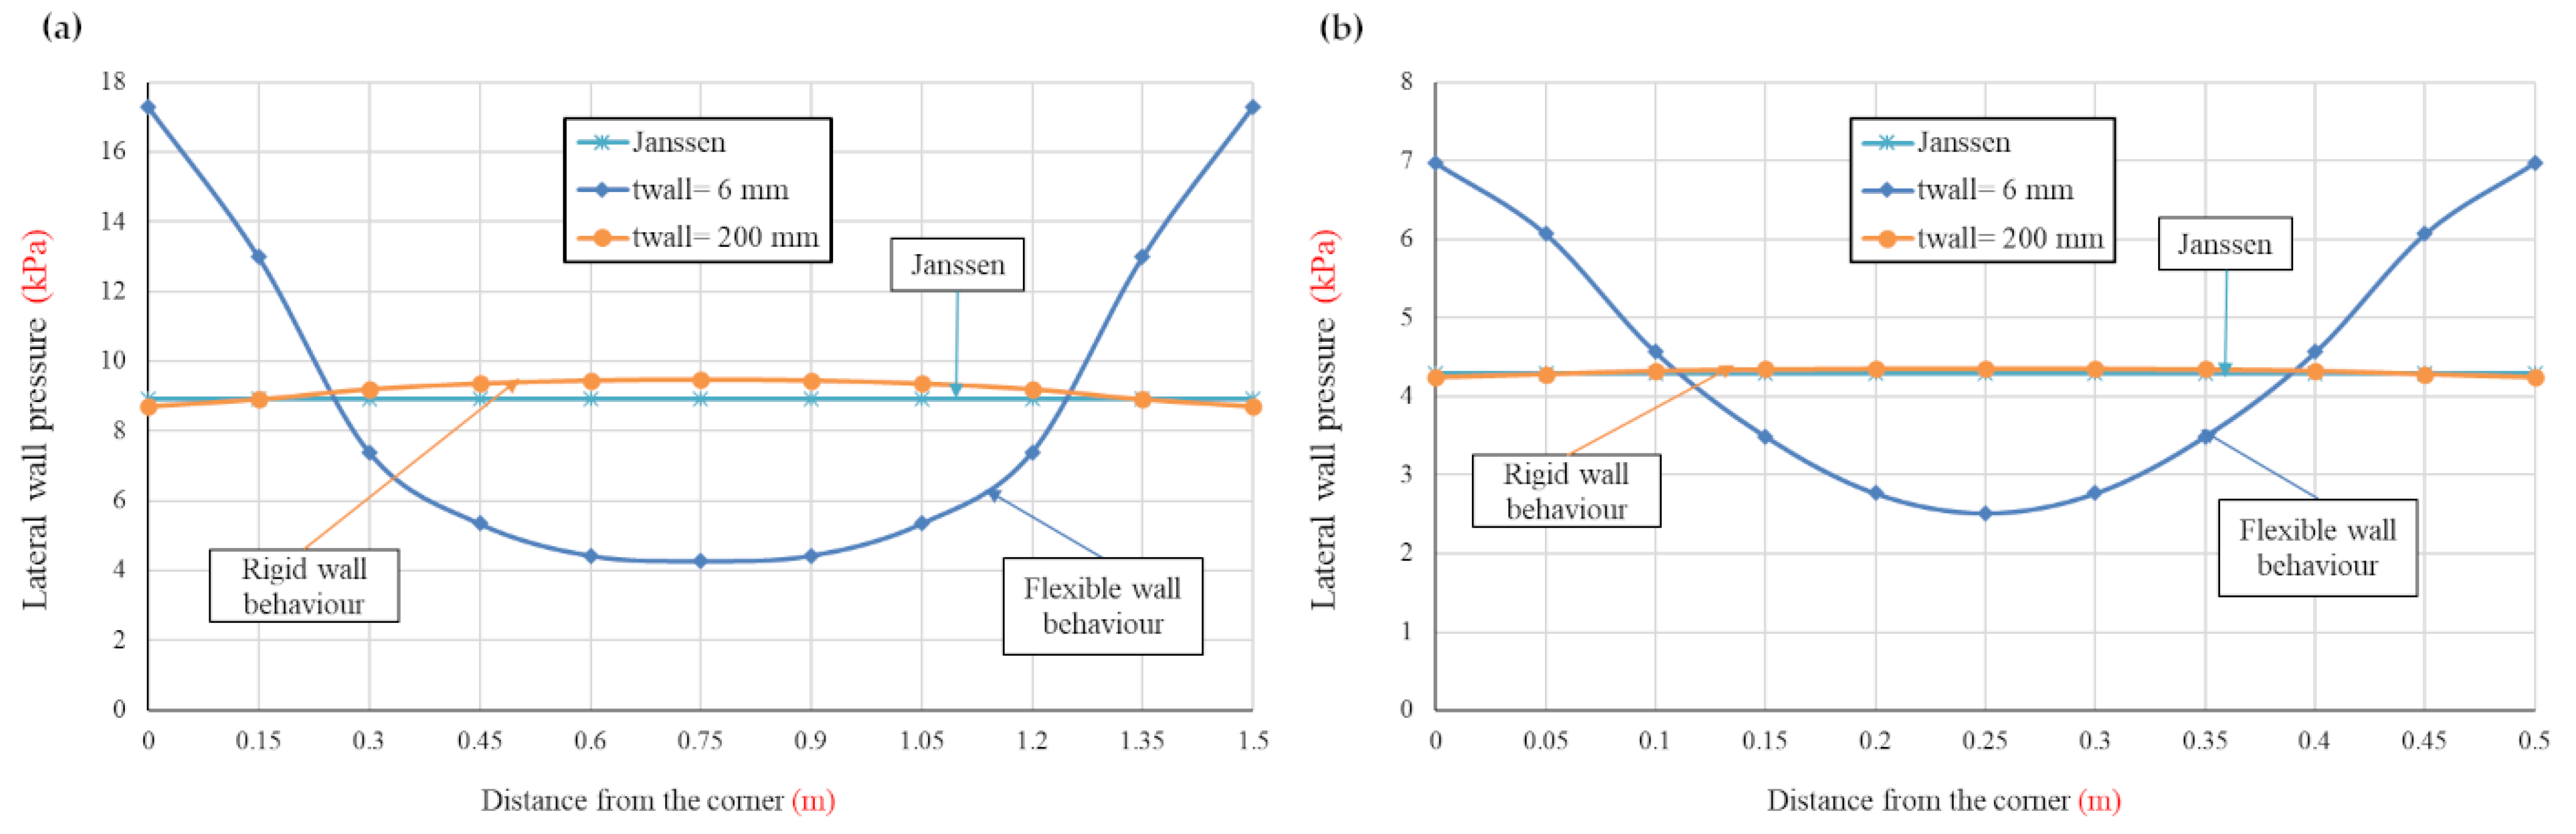
2.5.2. Comparison with Janssen Equation

The Janssen equation is the oldest and most widely used approach in silo design. It was regarded as the first equation in driving the differential equation for the equilibrium of a solid layer in a silo. This equation was derived for an axis-symmetrical layer of the circular silo and assumes a constant lateral pressure ratio.
In fact, most current design codes employ the Janssen method to calculate the pressure acting on silo walls, which has been generalized to cover non-circular silos by considering square silos as equivalent circular silos with the same hydraulic radius [28]. Alternatively, a silo of the same volume may be used to evaluate maximum pressure [12]. It was assumed that the wall pressure at any level on a horizontal section is uniform. In contrast, in the behavior of a flexible wall, the middle section has the lowest value while the corners experience the most lateral pressure, resulting in an arching mechanism inside the bulk materials across the diagonals of the silo [16].
A comparison was made between the finite element findings and Janssen’s equation in the flexible wall silo for the same studied silo (flexible wall with dimensions 1.5 × 1.5 × 2.5 m) and filled with Leighton Buzzard sand, as illustrated in Figure 9.
As shown in Figure 9c, this discrepancy disappears when reaching section 3-3, where the values of the finite element became very close to Janssen’s. The reason for the difference in values between finite elements and Janssen’s is the effect of wall flexibility where the rigid zone of walls (corner) attracts more load and hence produces higher pressure, while the flexible part of the wall (middle) releases its pressure and deflects outward. The full redistribution of load and pressure in the horizontal direction is completely ignored in the Janssen approach, in which the values of Janssen predictions remain constant over the three sections with no wall deformation.
There is another divergence between Janssen’s predictions and finite element calculations towards the bottom of the three sections (1-1, 2-2, and 3-3). This is due to the influence of the base’s connection to the wall and the respective boundary condition. The Janssen equation ignores this effect and does not integrate boundary conditions [29].
The finite element distribution of wall pressure in section 1-1 has a similar trend as the Janssen pressure distribution with smaller values. A difference of 2 kPa can be noticed between the two curves along the full height. Figure 9b confirms the same distribution in section 2-2.
To prove that Janssen’s prediction is close to rigid wall silo outcomes, another rigid wall model was developed for the same silo dimensions (1.5 × 1.5 × 2.5 m) with the same filling granular material (sand), where the walls were prevented from lateral displacements using the proper boundary conditions to fulfill that target.
As illustrated in Figure 10, the finite element results are compared to Janssen’s predictions at the mid-span of the wall (section 1-1). In the case of rigid walls, finite element results show good agreement with Janssen’s calculations. In the lower part, the FE trend exceeds Janssen’s prediction due to the influence of the junction between the bulk and the wall. Many researchers have formerly reported such end effects [16,29].
From the above comparisons, two main conclusions can be drawn:
  • Finite element results are in great agreement with Lahlouh’s experimental data for flexible silo walls.
  • Finite element results closely match Janssen’s predictions for rigid silo walls, where the Janssen method is applicable.

3. Three-Dimensional Analysis of Square Silo

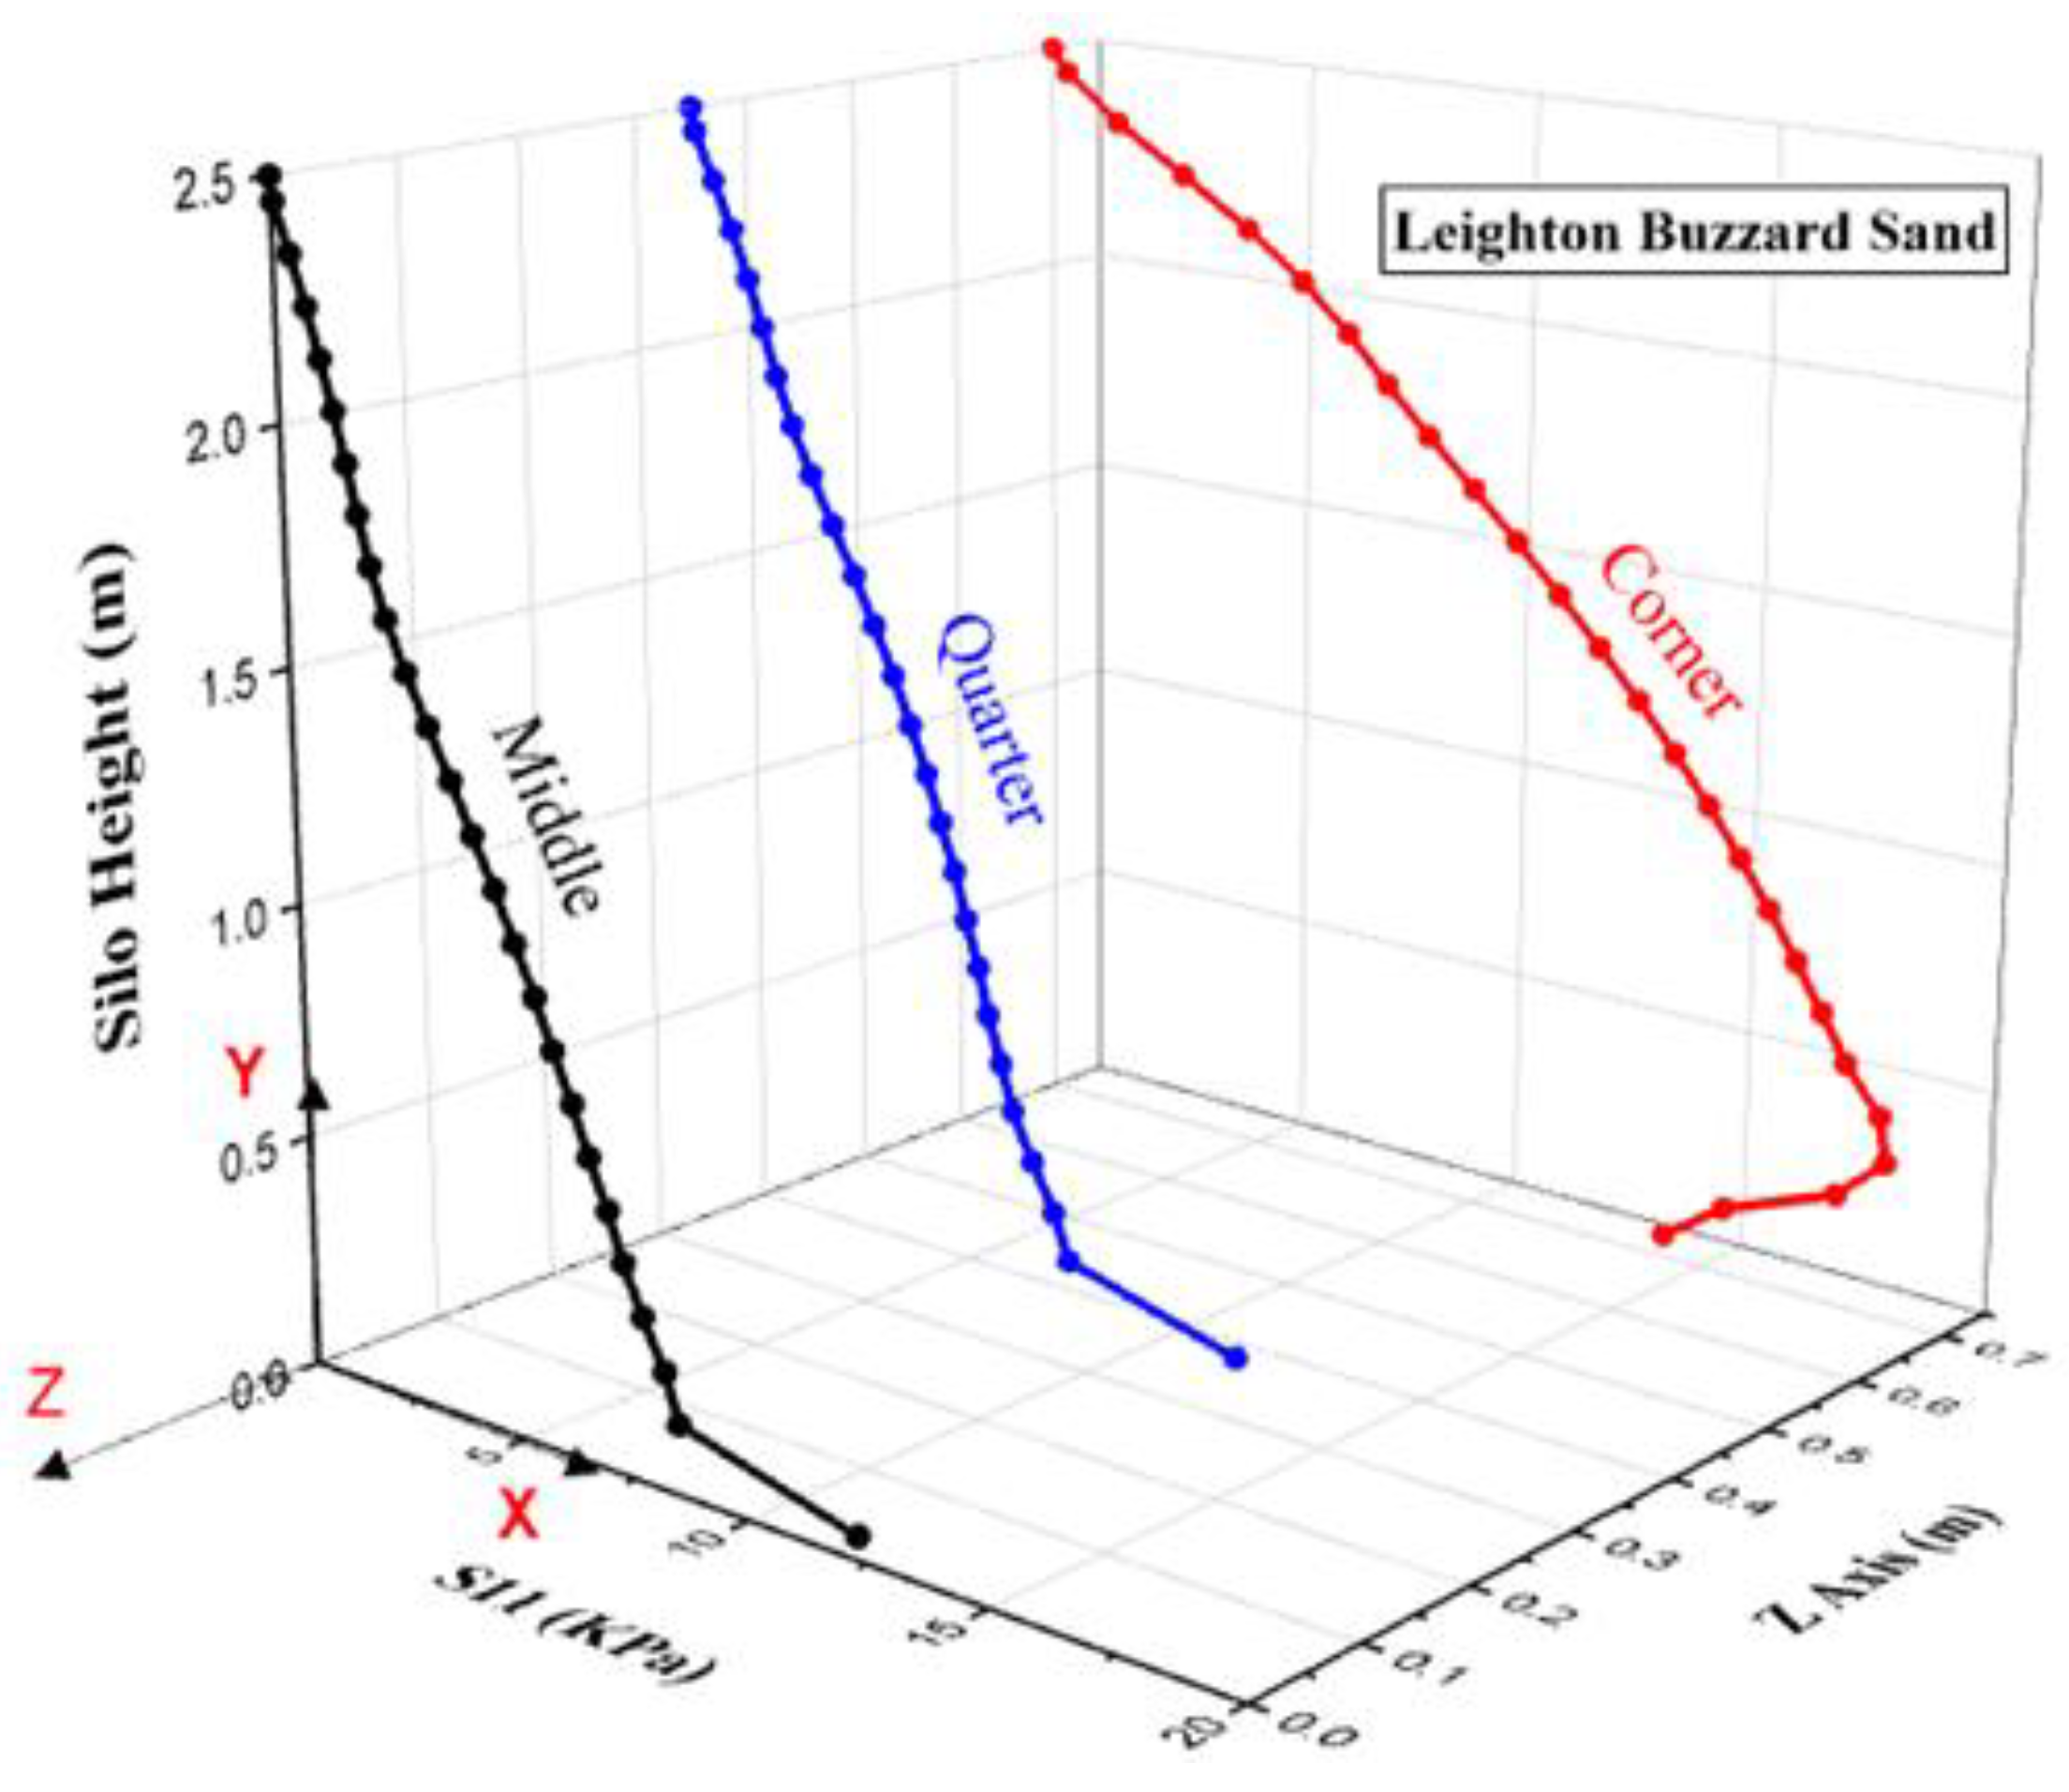
3.1. Pressure in Flexible Wall

A three-dimensional curve for Leighton Buzzard sand, based on the finite element results, was created to show the change in lateral wall pressure distributions across the silo, as shown in Figure 11. The effect of wall flexibility can be seen clearly in these curves by cutting various vertical sections of bulk materials.
As seen in Figure 11, the results show that the horizontal pressure distribution is not uniform at any depth throughout the filling phase. The lateral wall pressures steadily grow as they approach the corner column, reaching their maximum value at that point.
The middle section of bulk solids has the lowest values of lateral wall pressure due to large displacements taking place at the silo’s center. The corner section experiences the most lateral wall pressure as a result of the boundary conditions of the steel column that supported the structure. Thus, flexible wall silos behave differently from rigid wall silos, with pressure governed by the relative stiffness of the granular solid and the wall. Close to the bottom, the wall pressures are influenced by the boundary conditions at the base and the interaction of the ensiled material with it.

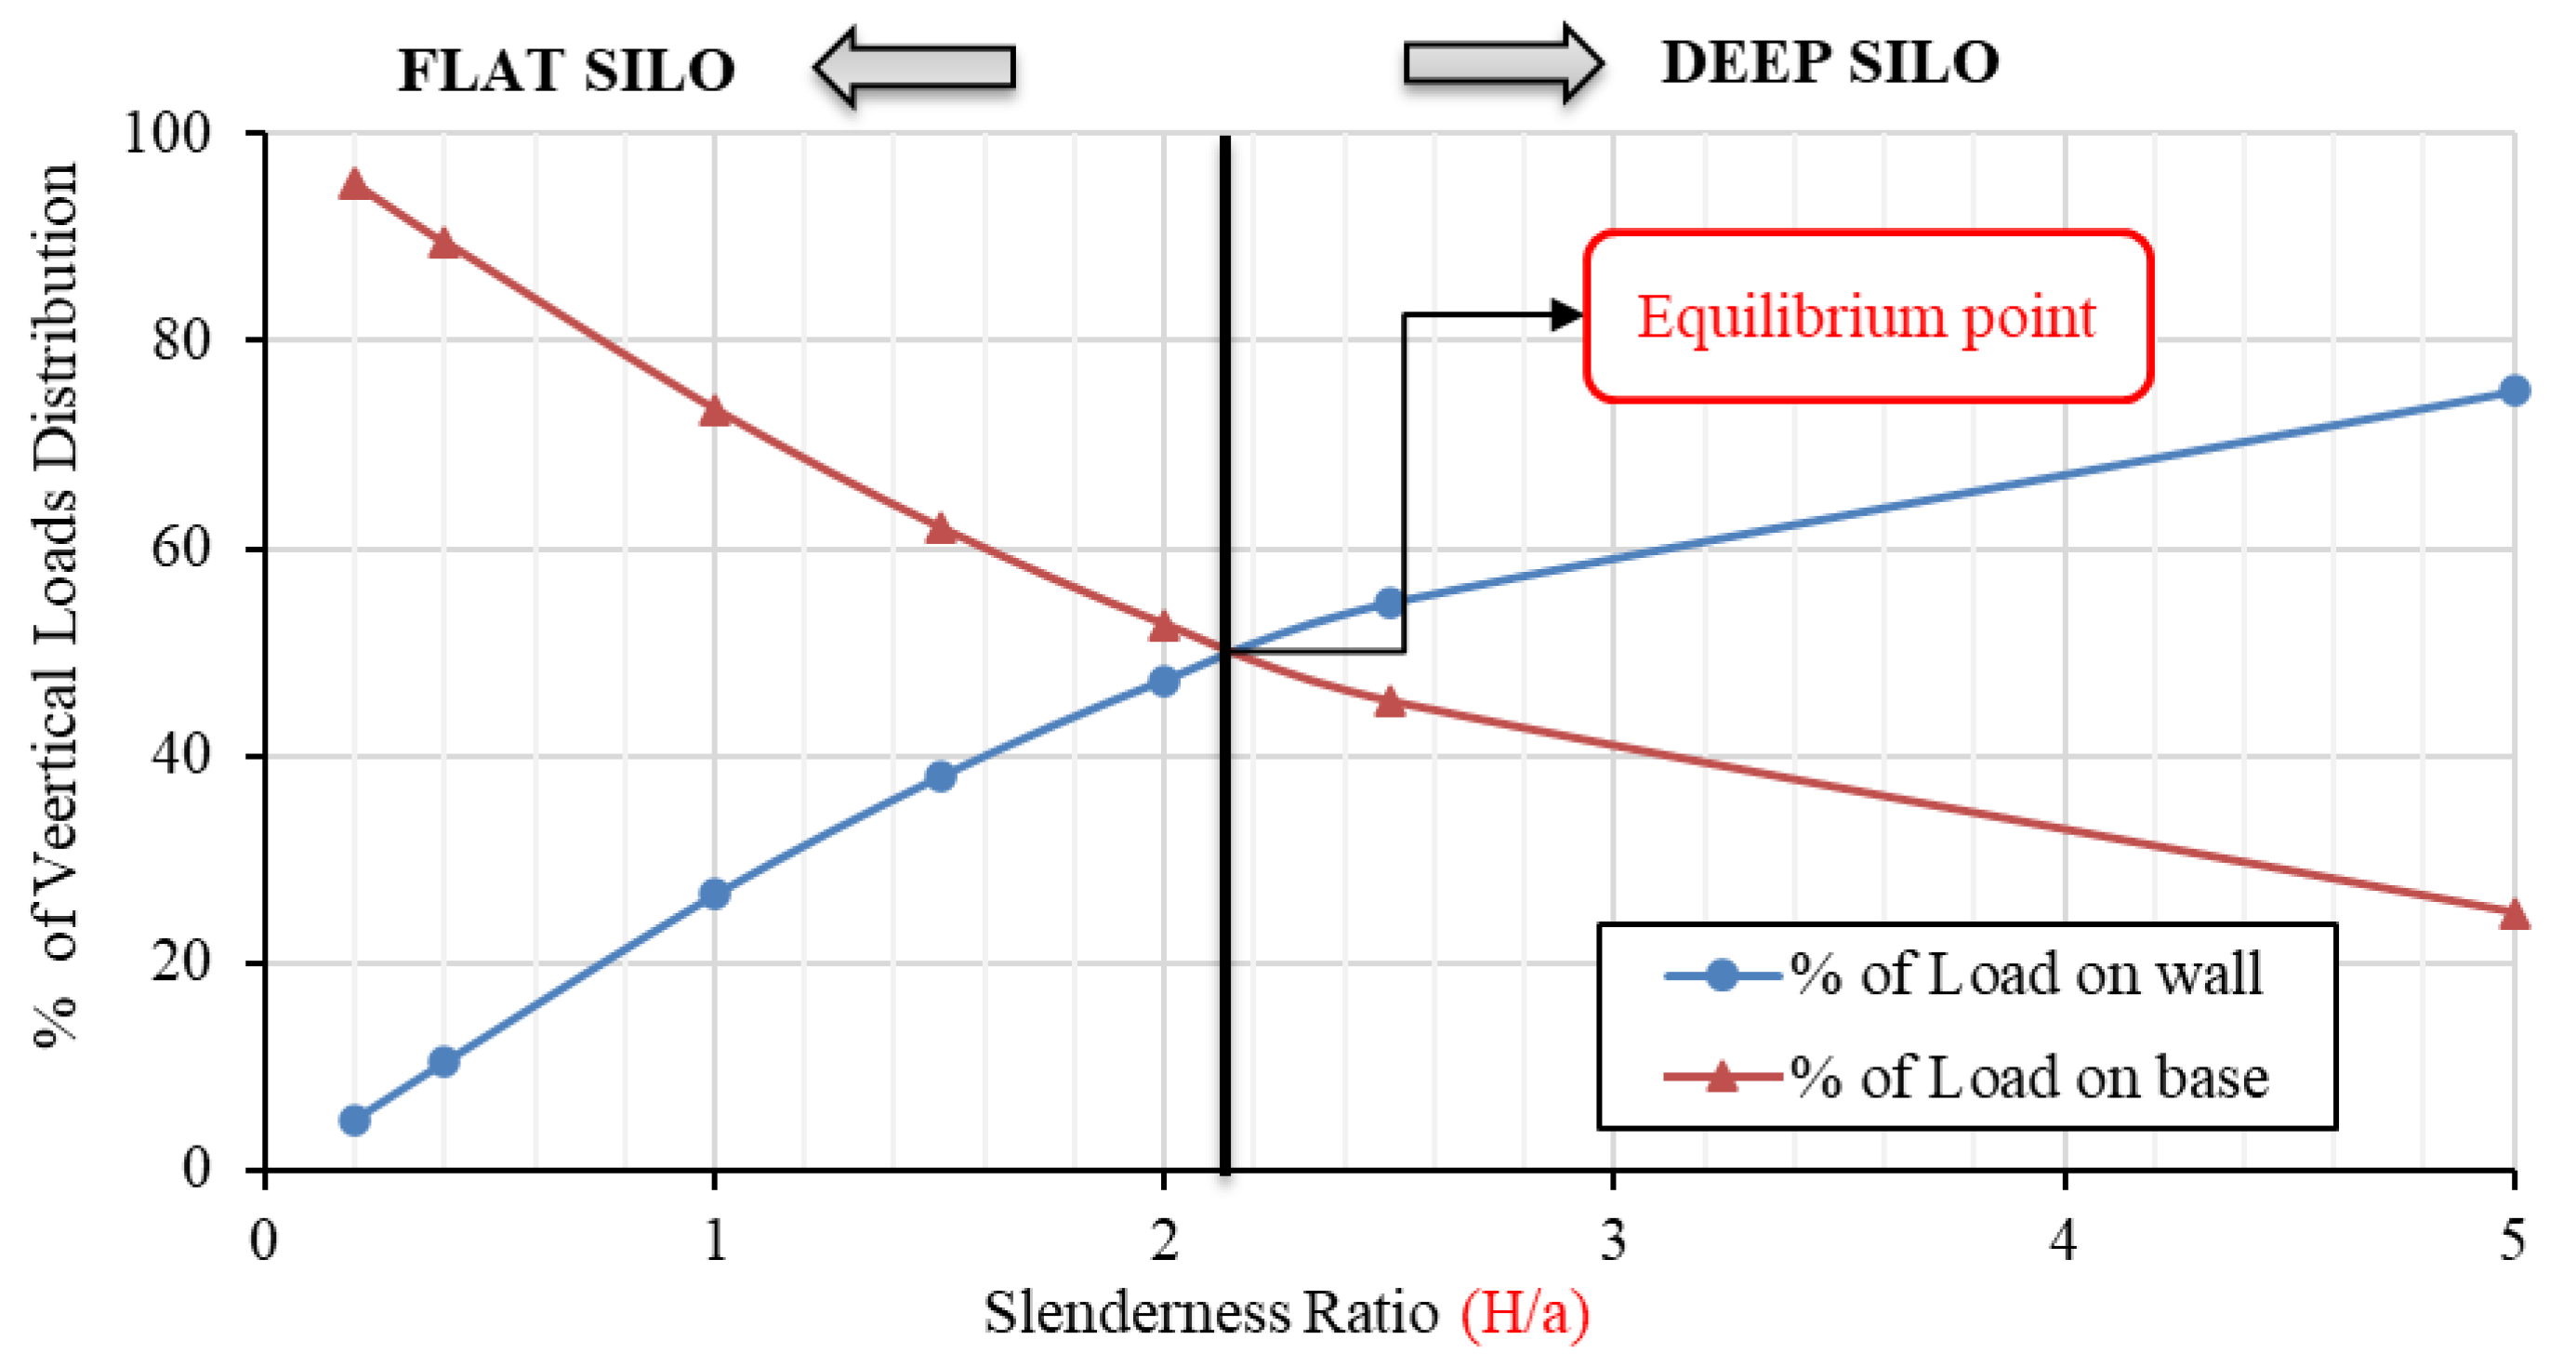
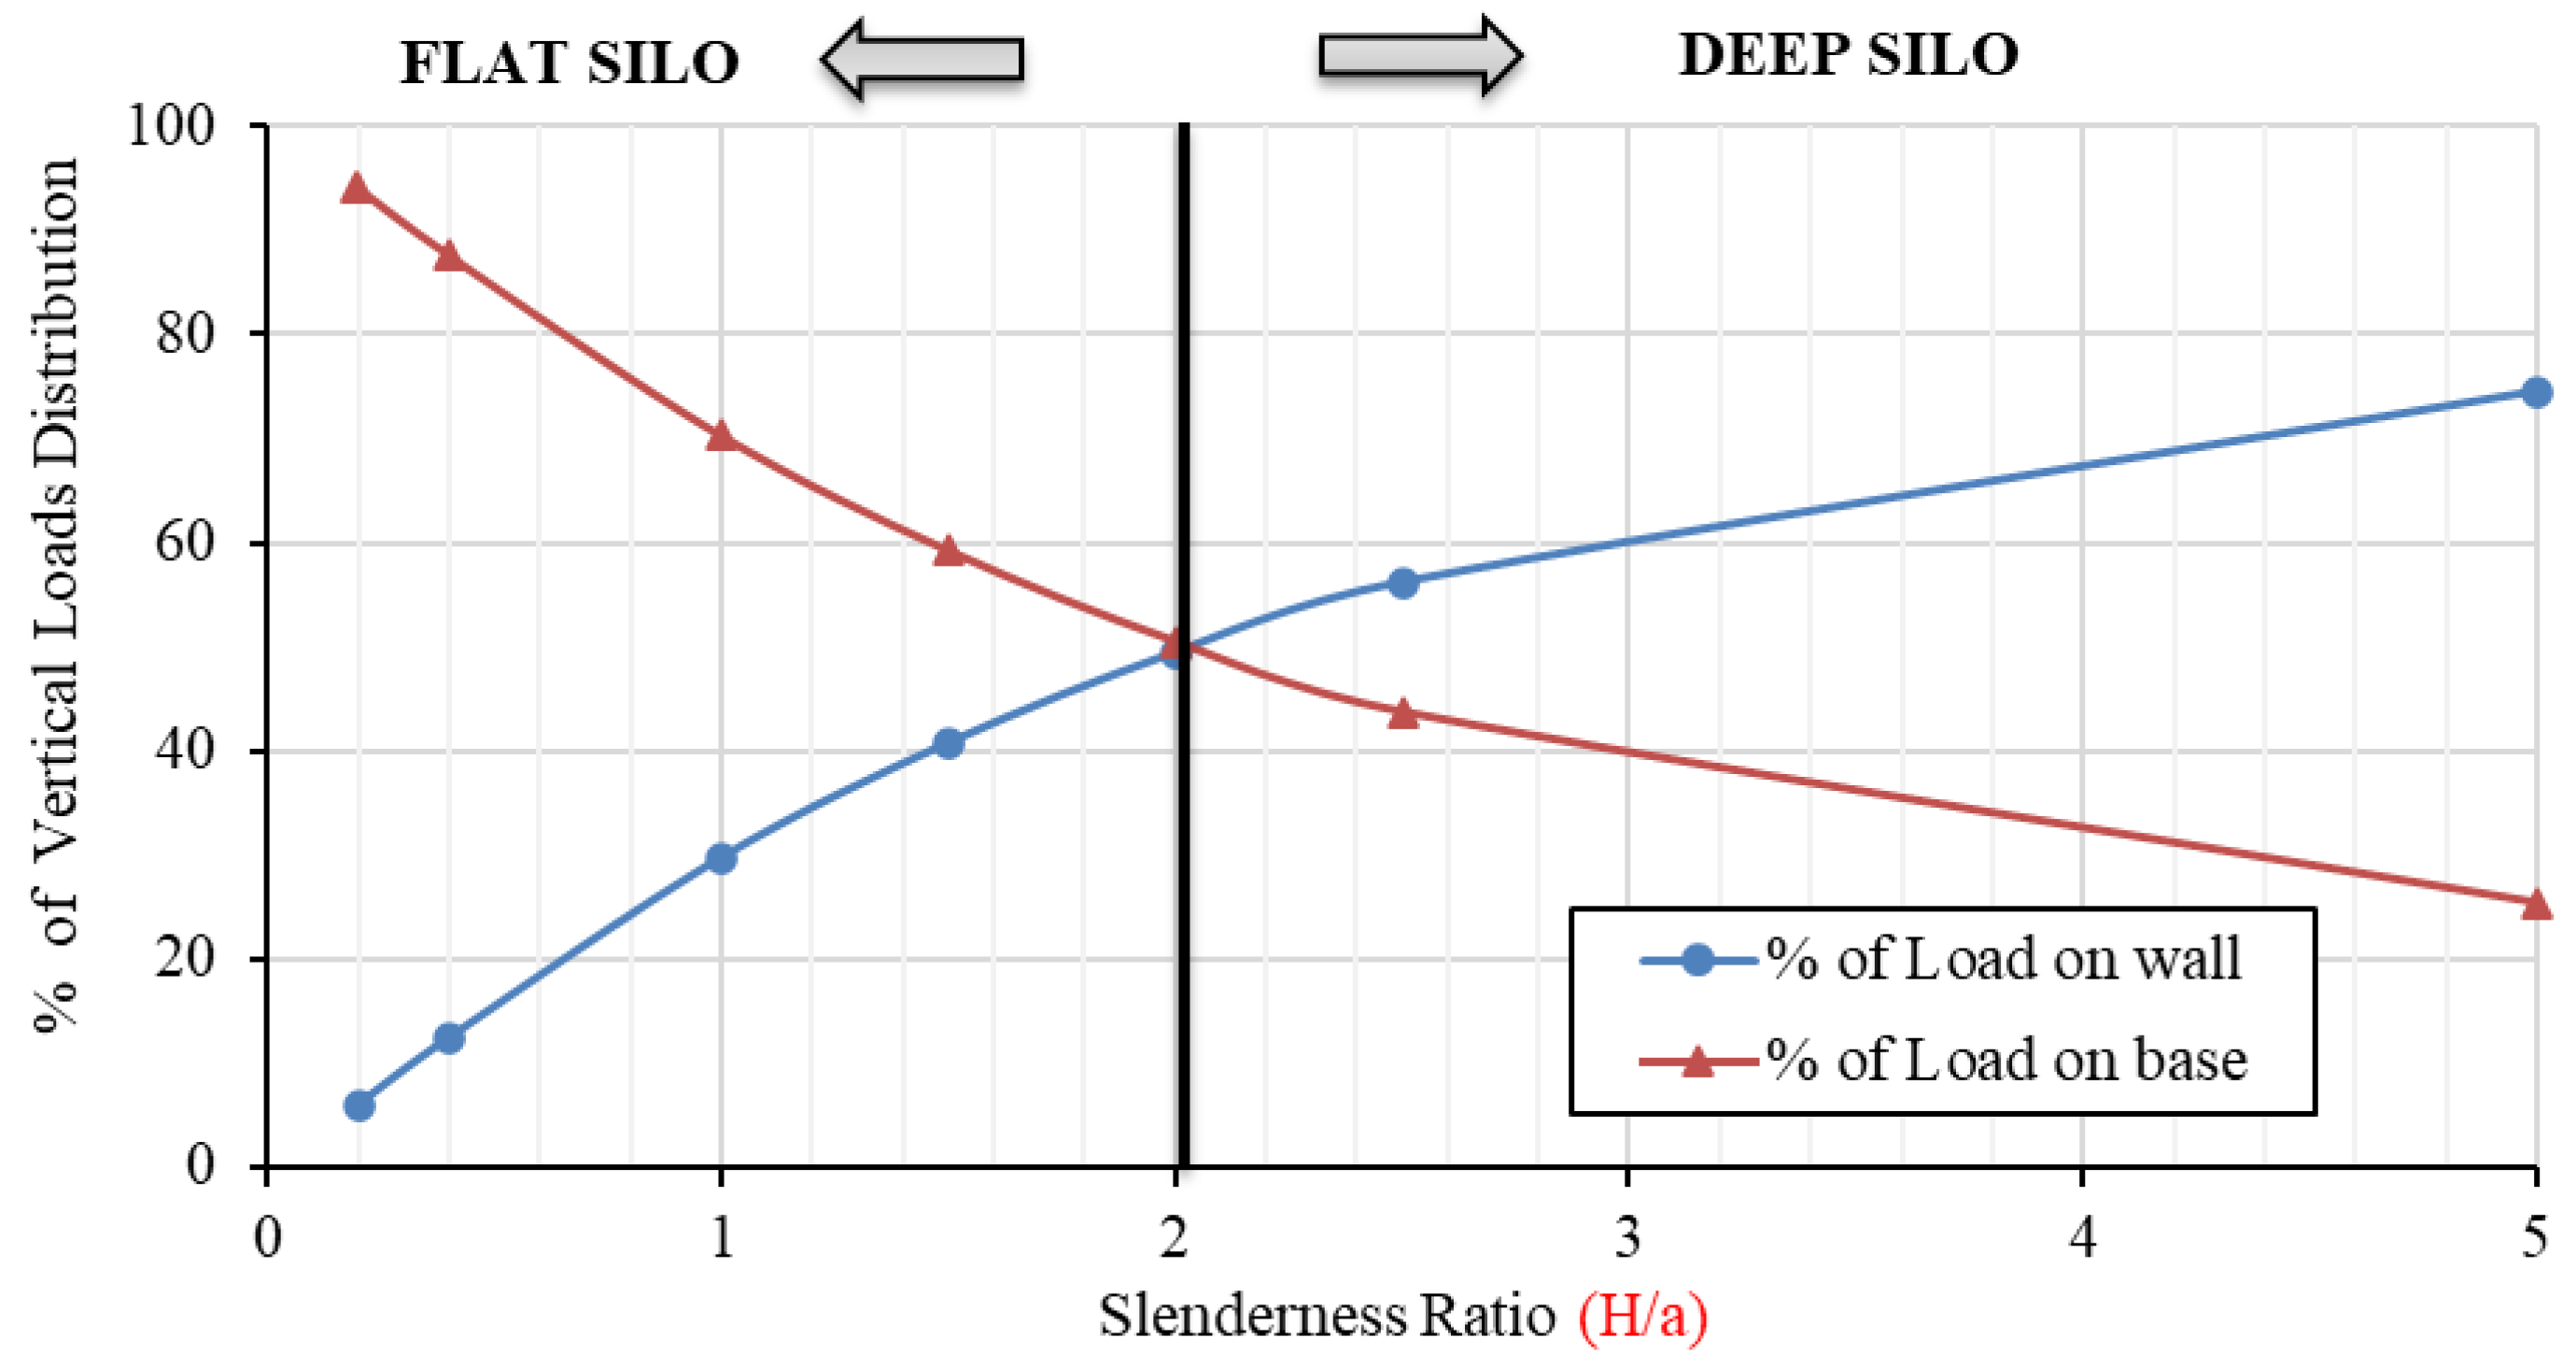
3.2. Flat vs. Deep Flexible Silo

To study the effect of silo cross section dimensions on lateral wall pressure, additional square models with dimensions “a” ranging from (0.5–12.5 m width), as shown in the example, and at a constant height of (2.5 m) were created with the flat-bottomed condition and filled with Leighton Buzzard sand. All other factors were kept unchanged, and the silos’ lateral wall pressures were compared. In section (1-1), in the center of the silo side, lateral wall pressures were measured and compared in Table 3. Table 4 shows the classification of silos according to EN1991-4 [28].
According to Table 4, when H/a ratios are less than 1.0, the silos are considered squat (as specified in EN 1991-4). These silos are covered by the majority of silo codes. Silos that are shallow and/or long will normally be classified as bunkers [13], and pressure projections on the longer wall may be valid using plane strain calculations. This establishes a definite upper limit for stress levels.
Figure 12 illustrates the lateral wall pressure for different flexible silo dimensions (a = 0.5–12.5 m, h = 2.5 m). Lateral pressure on the wall increases as the slenderness ratio decreases. This indicates that lateral wall pressure in a squat silo is greater than that in a slender wall silo. However, with flexible walled silos, the wall pressure is lower at the mid-point of each wall, which is deemed as a structurally flexible zone, and greater at the silo corners, which are considered stiff areas.
Consequently, an arching mechanism begins to develop within the granular materials throughout the diagonals of the silo, distributing vertical loads from the mid-side of the flexible wall to the structurally rigid corners. As a result, the mid-side of the wall is subjected to substantially lower pressures [11].
To clarify the loading process inside the flexible walled silo, the vertical load distribution exerted by bulk materials on the walls and silo base was studied. Several square cross section models [a = 0.5, 1.0, 1.25, 1.67, 2.5, 6.25, 12.5 m] with a constant height [2.5 m] were examined to estimate load distribution percentages. These models have the same flat bottom end condition and are filled with the same granular material to investigate the effect of the slenderness ratio on lateral wall pressure, as shown in Table 5.
Figure 13 indicates that the percentage of vertical distributed load on walls increases as the slenderness ratio increases. The percentage of distributed vertical loads on flexible walls, on the other hand, is around 1% to 17% lower than on rigid walls compared to Figure 14. This decrease occurred as a consequence of wall deformation away from the bulk solids, which affected the contact between the silo wall and the bulk solids. Consequently, the vertical loads supported by the traction force on the walls have been decreased.
Figure 15 shows two curves representing the ratio of vertical load carried by the walls and the base concerning the total weight of bulk solids. It can be seen that when silo slenderness ratios increase, the percentage of load distribution on the base decreases. With a slenderness ratio of 2.2, the vertical loads on the walls and base are equal and reach an equilibrium point. This border may be used to distinguish between flat and deep silo types based on the amount of vertical loads supported by the walls and base. This limit is increased by 10% in the case of flexible walls compared to rigid walls, indicating that the distributed vertical load sustained by the wall is smaller than that of rigid walls with the same slenderness ratio, as shown in Figure 16.
The silo’s base gets the majority of the load when the slenderness ratio is low; when it is high, the silo’s wall receives the majority of the weight. Both figures may be used to predict the vertical load distribution of the wall and base in the case of the rigid and flexible walled silo.

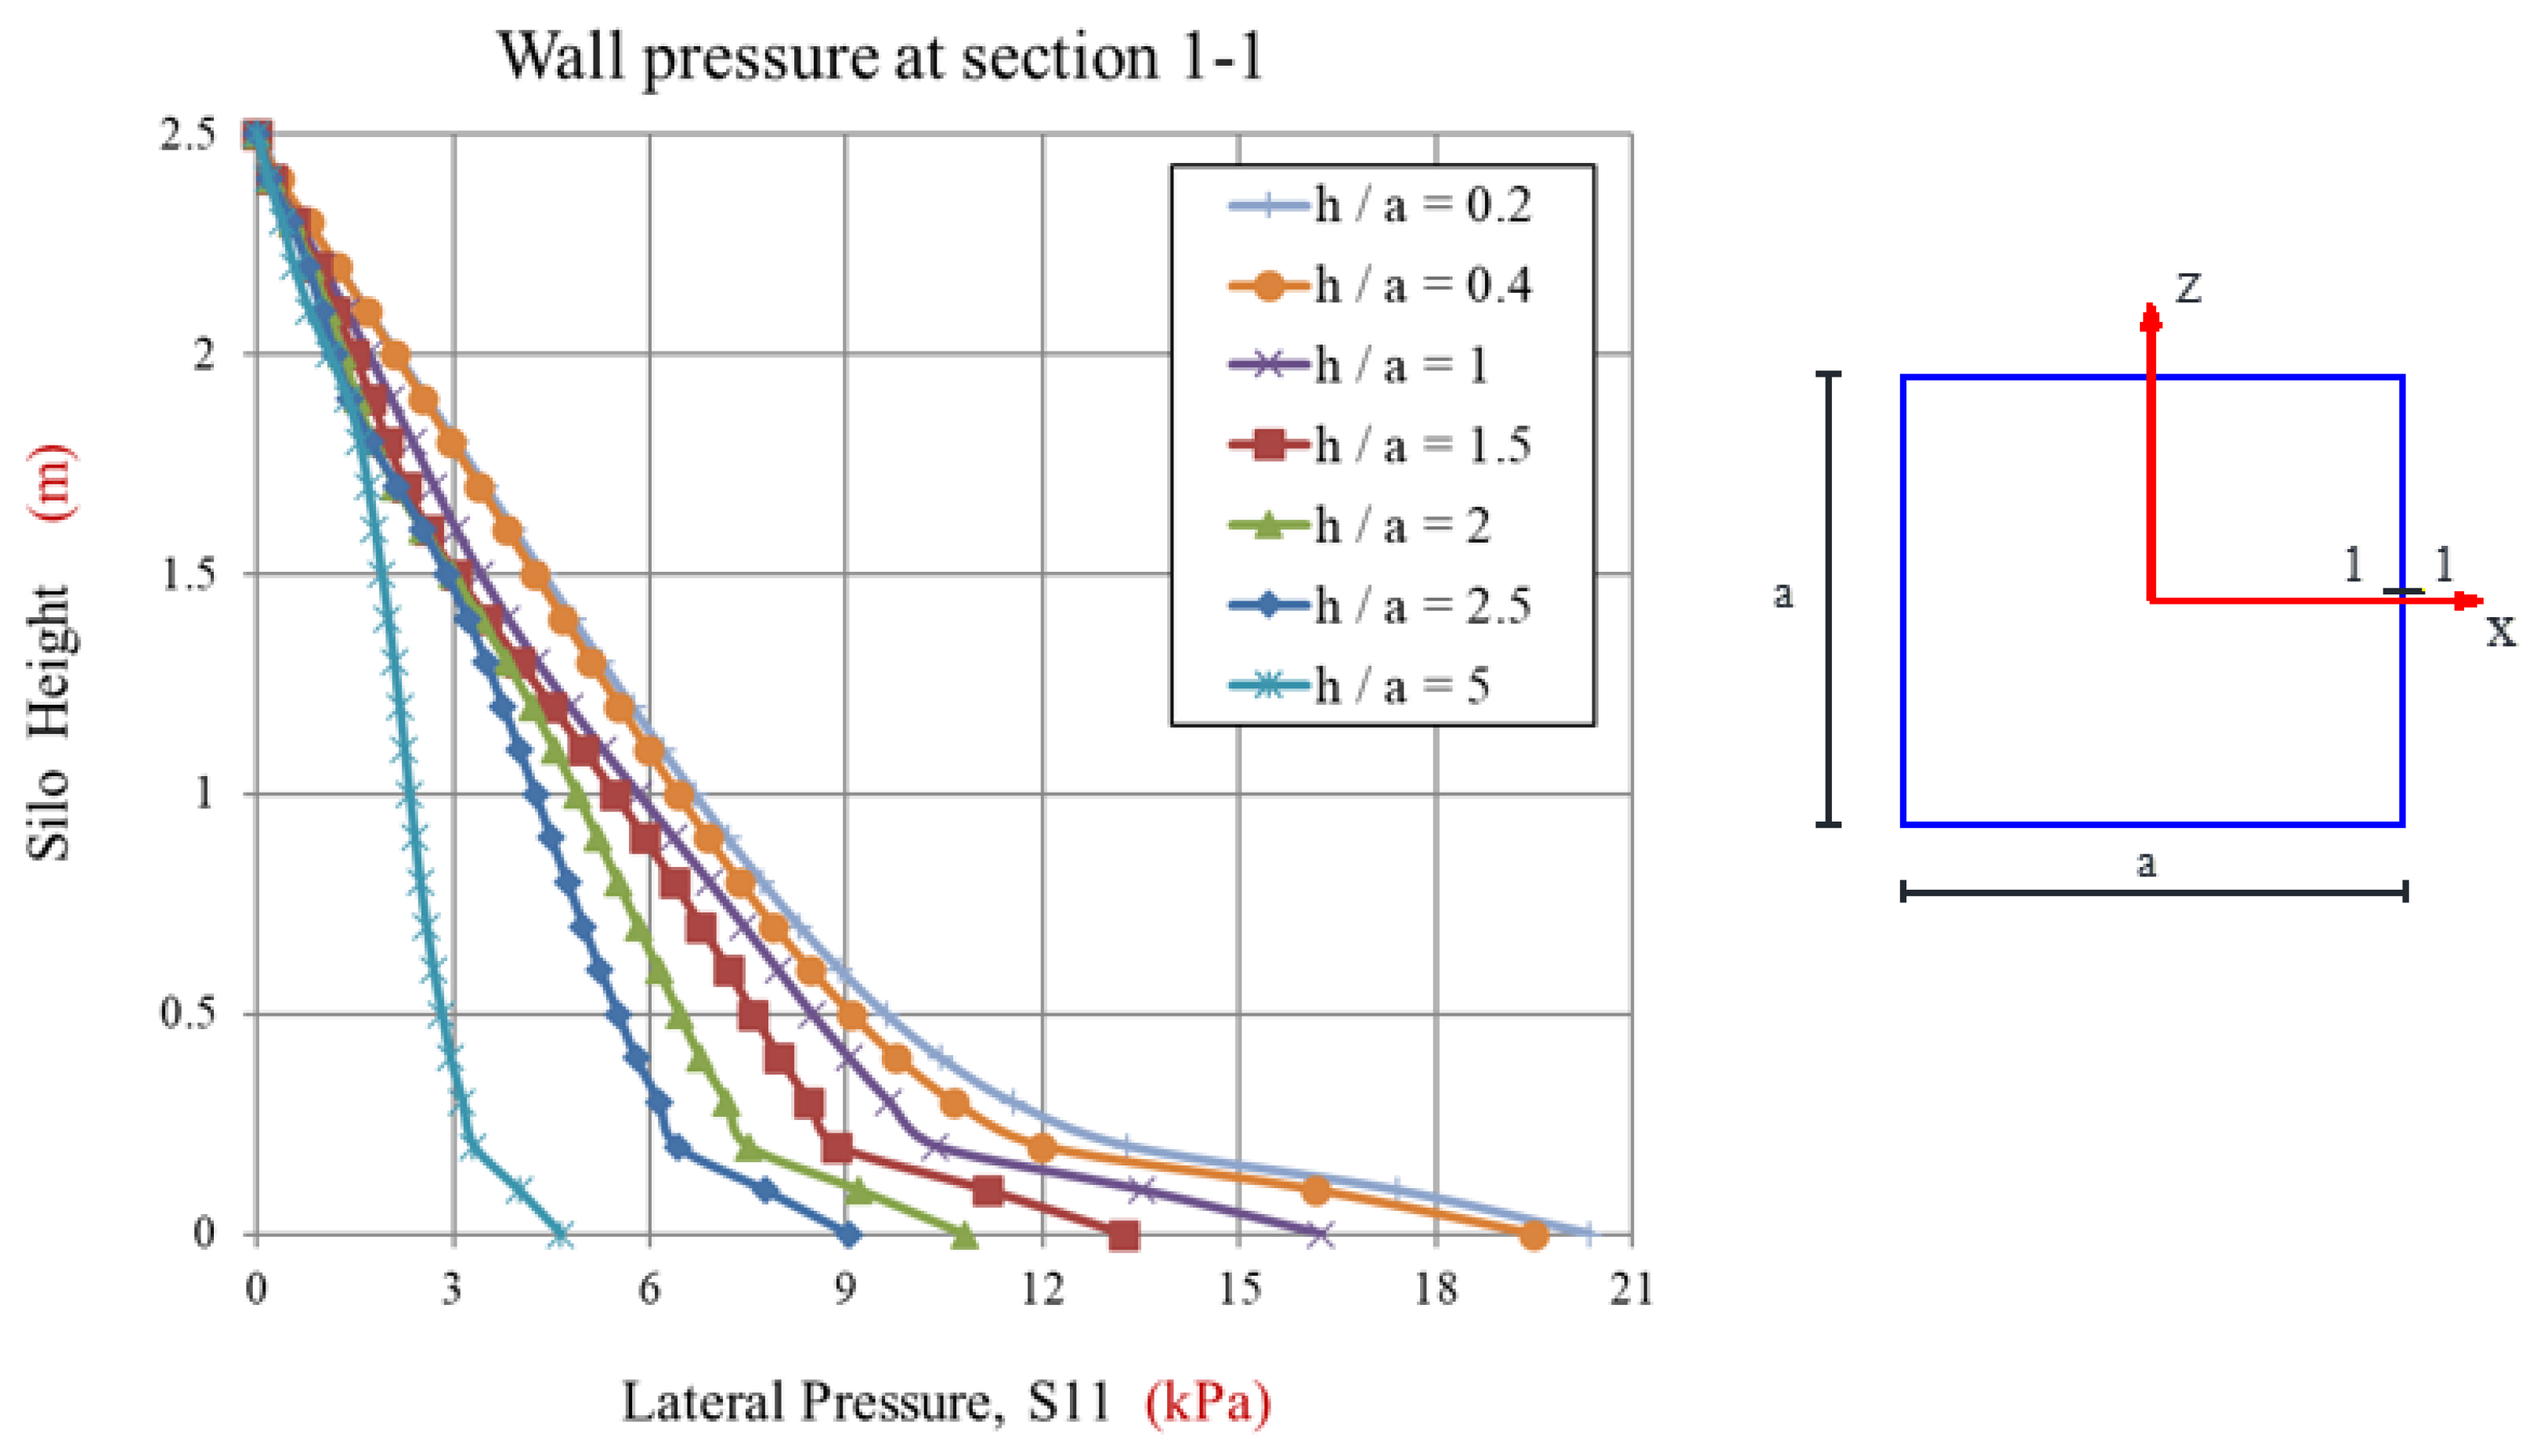
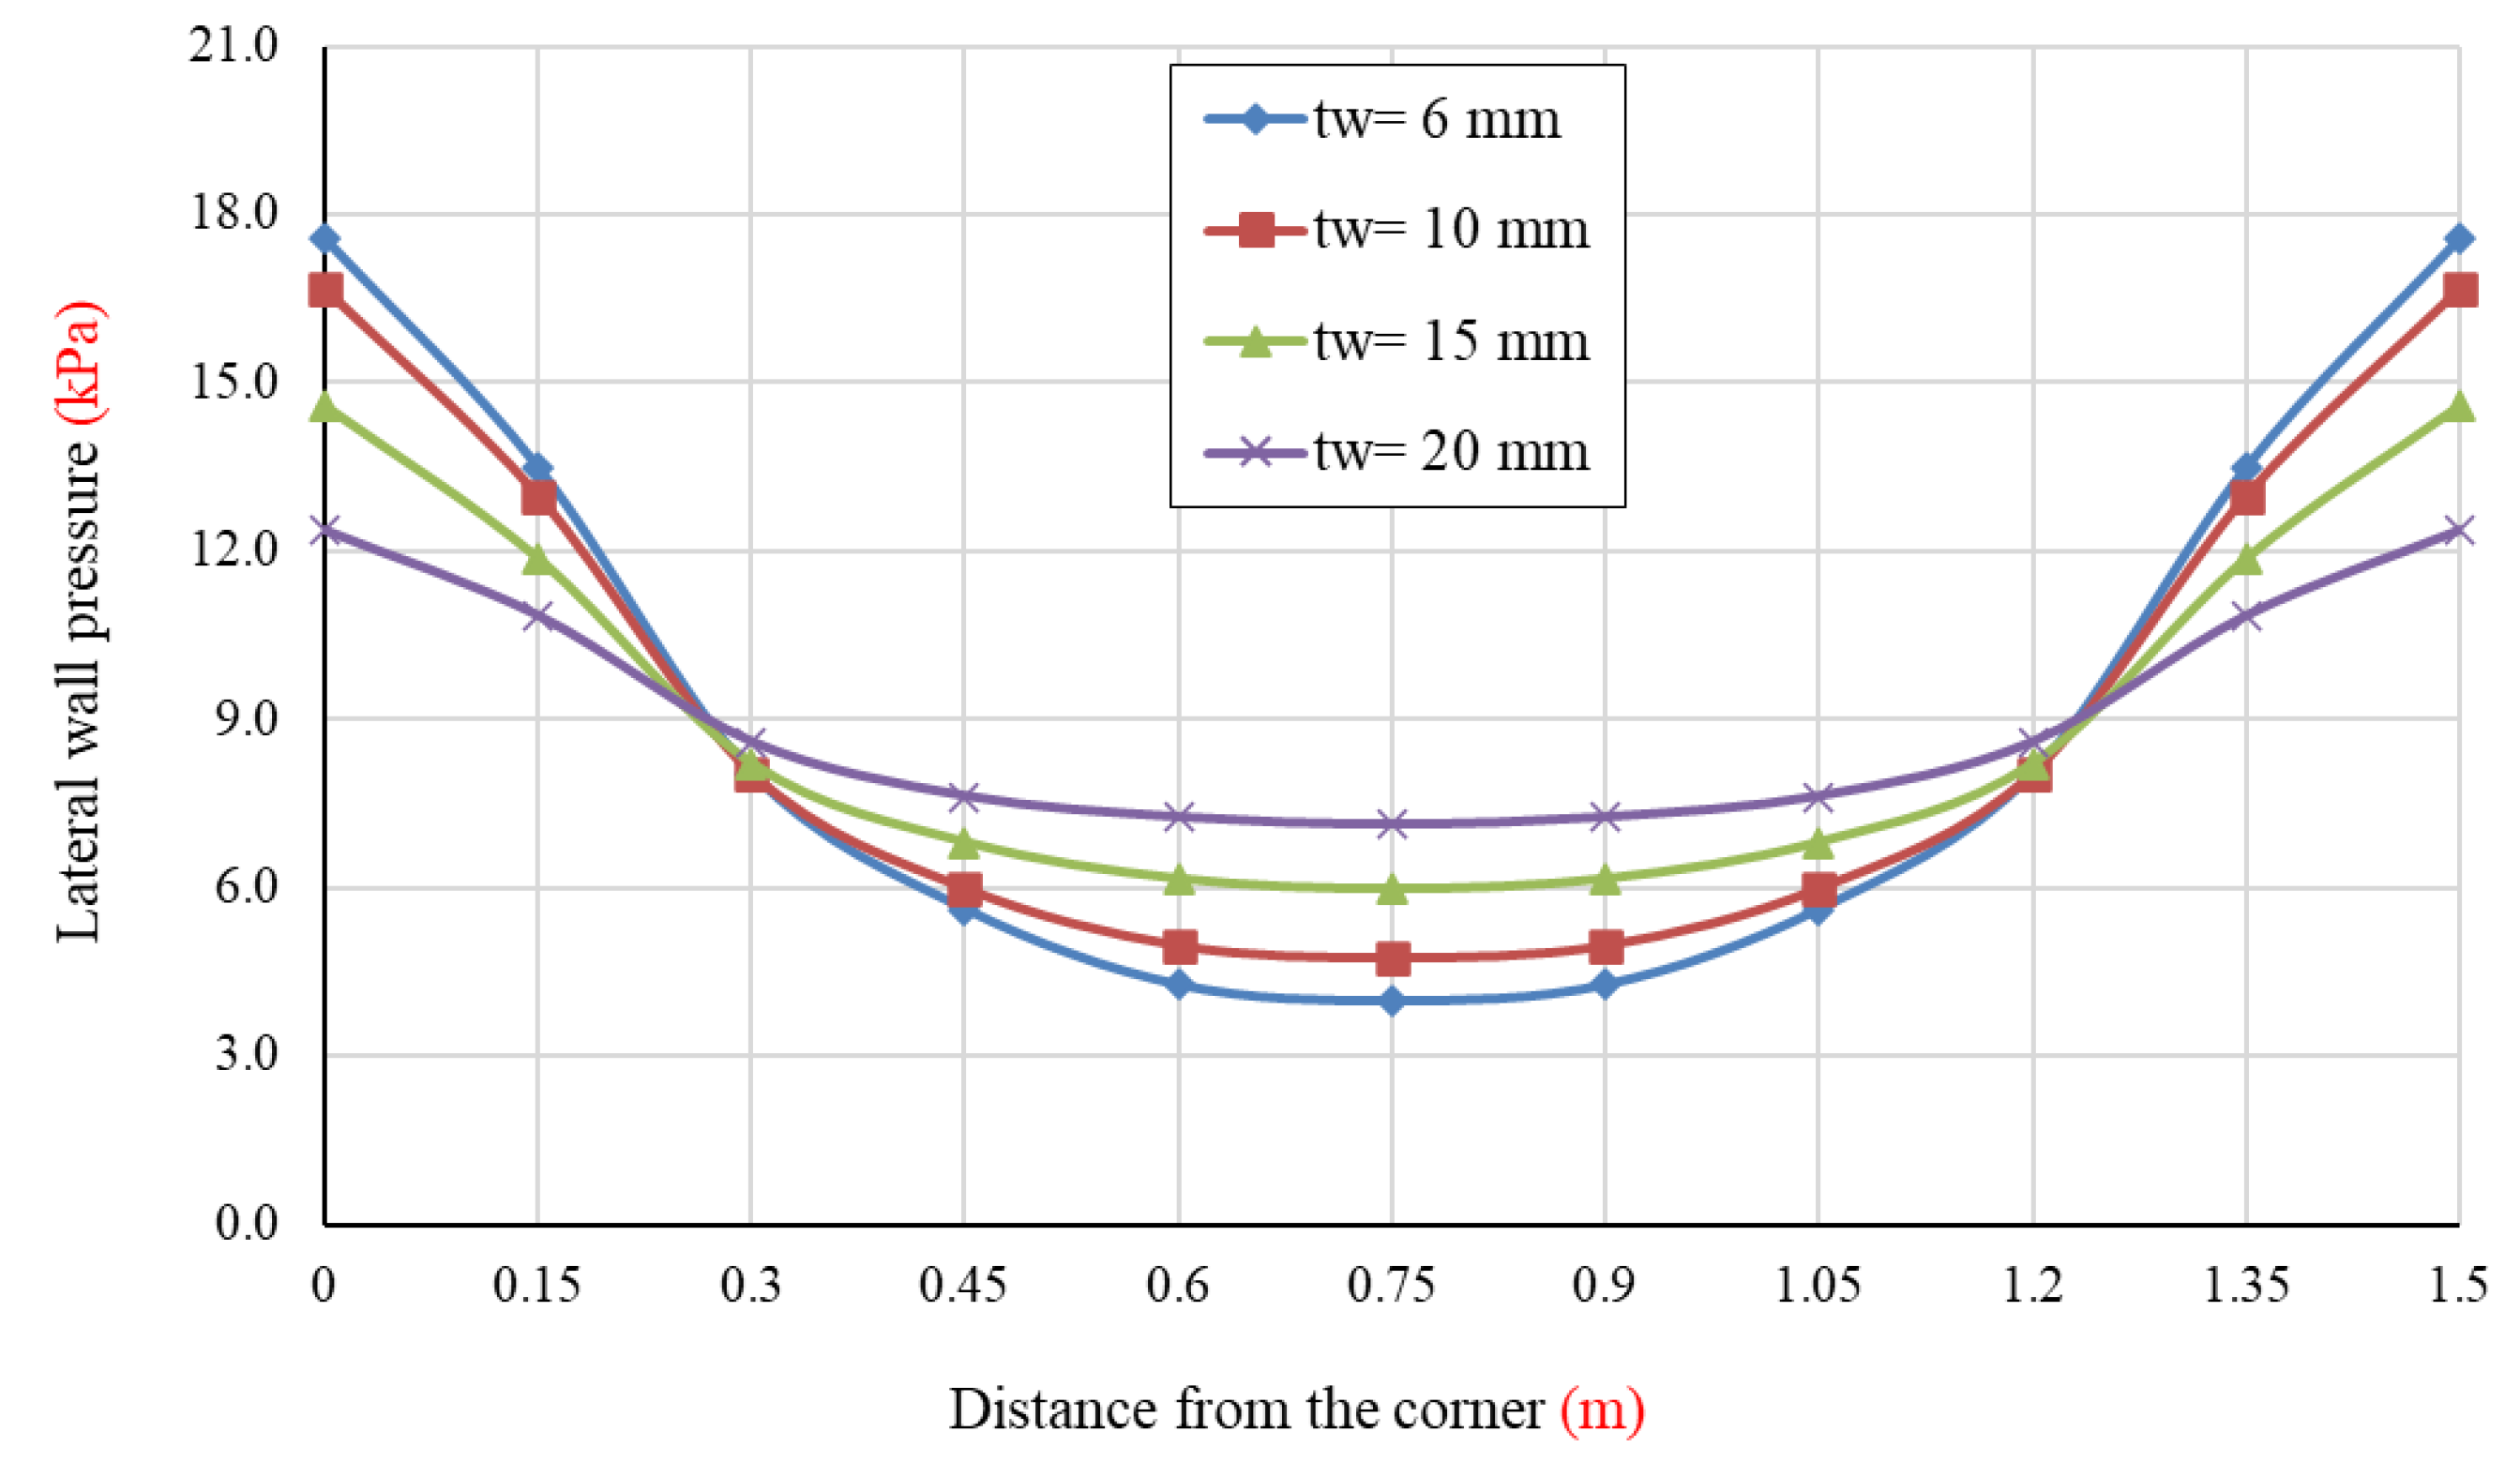
3.3. Effect of Wall Thickness

The objective of modifying the wall thickness is to study the effect of wall flexibility on lateral wall pressure. This study may be conducted in a different manner by adding more stiff structural elements to the wall to enhance its stiffness. Ring beams and stiffeners are the names given to these structural elements. That approach, however, will not be used in this research.
In order to investigate the effect of wall thickness, a series of tests of unstiffened plates were carried out using the Lahlouh silo geometry [25] filled with sand, but with an increased thickness value of t. The model had a 6 mm wall thickness. The model was tested with wall thicknesses of 10, 15, and 20 mm, and the results are illustrated in Figure 17.
The lateral pressure distribution is shown in Figure 17 at 0.5 m above the bottom surface. The distribution of lateral wall pressure has been observed to be substantially dependent on wall thickness. When the wall is extremely stiff (i.e., the wall thickness assumed numerically to be “t” = 200 mm), pressures on the wall tend to be uniform and equal to Janssen values that can be calculated by Equation (1). When the thickness of a wall is decreased, a large transfer of pressure occurs from the center of the silo to its corners in the horizontal direction.
Two silo models were selected to study the influence of wall thickness on lateral wall pressure distribution, as shown in Figure 18. In terms of slenderness ratio, both models vary since the first model is considered flat, while the second is regarded as slender.
Figure 18 illustrates various behaviors for flat and slender silo walls based on thickness. Both models behaved similarly when their wall thickness was varied, and yielded the same result. If the wall thickness is minimal, the wall will acquire flexible behavior, producing a non-uniform lateral pressure distribution. On the other hand, if the wall thickness is thick, it will behave rigidly, resulting in almost uniform lateral pressure distribution. In other words, wall flexibility can have a significant impact on wall pressure regimes and drastically change horizontal pressure distributions throughout the wall. As a result, designers need to give greater attention to wall flexibility during the design phase.

4. Discussion

The Janssen equation is most suited for predicting lateral wall-filling pressure in rigid wall cases, which is applicable to concrete silos, especially circular ones [16]. However, when using square thin steel silos, the Janssen equation predictions do not estimate the real normal pressure, as presented in the results, because it assumes that the lateral wall pressure would be uniform at all levels. However, in a thin-walled silo with a flexible wall, the wall deforms away from the solids, leading to the development of an arching mechanism (solids are transferred from the center to the corners). This will lead to a redistribution of wall pressure inside the silo. This redistribution of wall pressure will be highest in the stiffest areas of the silo (i.e., the corners), and lowest in the flexible middle section.
As demonstrated in the results, the finite element model can effectively predict the lateral filling pressure within the square silo at any level. The model was utilized to determine the vertical load transmission for the wall and base, whether rigid or flexible. The distributed vertical loads on the flexible wall were reduced by up to 17% with varying slenderness ratios. Thus, the majority of vertical loads are directed to the base. Therefore, the steel wall thickness may be decreased for flexible wall behavior, resulting in a reduction in the structure’s weight and enhanced structural efficiency. In this case, wall flexibility will be increased relatively; nevertheless, great care must be taken to ensure that wall deformations remain within codes’ limits. This study’s findings confirm the previous work of Rotter et al. [11], which reported that changes in the lateral filling pressure on the wall can make the wall thickness much thinner. This should be taken into account during the design process.
The results of this study can be utilized by designers to update design codes. Several unstiffened numerical models with varying silo behaviors, aspect ratios, and wall thicknesses have been examined in this work. Further research should be conducted to address the influence of vertical stiffeners or ring beams in numerical models of rectangular silos to clarify their impacts on filling pressure distributions as well as wall deformations, which is beyond the scope of this research.

5. Conclusions

The purpose of this study is to develop a model that informs the state of wall-filling pressure in square flexible walled silos in terms of various silo dimensions and wall thicknesses to improve the structural efficiency of silos. The finite element model was developed and validated in several vertical sections against the experimental data of Lahlouh and Janssen equation results.
The finite element results confirmed that Janssen’s predictions are acceptable for equivalent circular rigid silo cases only because they ignore the effect of wall deformation and the corresponding mechanism. The study demonstrated that the distribution of the lateral wall pressure is not uniform at any level. As a result, another approach for predicting lateral wall pressures in thin flexible walled silos can be applied, where the maximum lateral pressures occur in the rigid corners of the silo and the minimum develops in the flexible midspan of each wall, resulting in diagonal arching stress. The more the wall flexibility increases, the greater the redistribution of pressures from the silo center to its corners. Therefore, this effect must be considered throughout the design process. In a rigid rectangular silo, the opposite effect occurs, with maximum pressure in the center of the wall and minimum pressure at the corners.
The lateral static wall pressure of a square deep or flat silo can be computed with the guidelines presented in this study. The effect of the silo’s slenderness ratio on wall pressure was studied, as well as its impact on the vertical load capacity of a flexible walled silo. The influence of wall thickness on wall pressure was investigated.
Finally, it was shown that flexible walls behave quite differently from rigid walls and circular and rectangular silos in terms of how pressure is distributed on the walls. As a result, the findings of this study can be used to update silo design guidelines for flexible walled silos in order to develop thinner wall thickness. Furthermore, the model helps structural engineers to determine the changes in pressure along the walls and the influence of wall deformability.
The finite element model was developed using the bulk solid and steel properties presented in Table 1 and Table 2, as well as specific geometry for comparison with the experimental work. Further research might include circular or rectangular silos fitted with hopper bases and various granular materials with moisture content to investigate their influence on filling pressures or deformations of flexible walls.

Author Contributions

Conceptualization, A.H. and A.M.S.; methodology, A.H., A.M.S. and H.A.A.; software, A.H., and A.M.S.; validation, A.M.S., O.M.O.R. and H.A.A.; formal analysis, A.H.; investigation, A.H. and A.M.S.; resources, A.H.; data curation, A.M.S.; writing—original draft preparation, A.H.; writing—review and editing, M.H.A., A.M.S., O.M.O.R. and H.A.A.; visualization, M.H.A. and H.A.A.; supervision, M.H.A., A.M.S., O.M.O.R. and H.A.A.; project administration, A.H. and A.M.S.; funding acquisition, A.H. All authors have read and agreed to the published version of the manuscript.

Funding

This research received no external funding.

Institutional Review Board Statement

Not applicable.

Informed Consent Statement

Not applicable.

Data Availability Statement

Not applicable.

Conflicts of Interest

The authors declare no conflict of interest.

References

  1. Juan, A.; Moran, J.M.; Guerra, M.I.; Couto, A.; Ayuga, F.; Aguado, P.J. Establishing Stress State of Cylindrical Metal Silos Using Finite Element Method: Comparison with ENV 1993. Thin-Walled Struct. 2006, 44, 1192–1200. [Google Scholar] [CrossRef]
  2. Ahramonline. Available online: https://english.ahram.org.eg/NewsContent/50/1201/414847/AlAhram-Weekly/Egypt/A-Better-Wheat-Season.aspx (accessed on 20 March 2022).
  3. AyoubMuh. 17 Months Only after Its Inauguration, a 20 Million EP Wheat Silo Collapses! THIS IS EGYPT! Reddit—r/Egypt. 2019. Available online: https://www.reddit.com/r/Egypt/comments/cczzkp/17_months_only_after_its_inauguration_a_20 (accessed on 24 March 2022).
  4. Ahram Online. 3 Killed, 11 Injured in Wheat Silo Collapse in Alexandria. Available online: https://english.ahram.org.eg/NewsPrint/306592.aspx (accessed on 24 March 2022).
  5. Bishara, A.G.; Chandrangsu, K.; Mahmoud, M.H. Finite Element Formulation for Farm Silo Analysis. J. Struct. Div. 1977, 103, 1903–1919. [Google Scholar] [CrossRef]
  6. Ragneau, E.; ARIBERT, J.-M.; Sanad, A.M. Modèle Tri-Dimensionnel Aux Éléments Finis Pour Le Calcul Des Actions Sur Les Parois d’un Silo (Remplissage et Vidange). Constr. Métallique 1994, 2, 3–25. [Google Scholar]
  7. Ooi, J.Y.; Rotter, J.M. Wall Pressures in Squat Steel Silos from Simple Finite Element Analysis. Comput. Struct. 1990, 37, 361–374. [Google Scholar] [CrossRef]
  8. Jayachandran, L.E.; Nitin, B.; Rao, P.S. Simulation of the Stress Regime during Grain Filling in Bamboo Reinforced Concrete Silo. J. Stored Prod. Res. 2019, 83, 123–129. [Google Scholar] [CrossRef]
  9. Sanad, A.M.; Ooi, J.Y.; Holst, J.; Rotter, J.M. Computations of Granular Flow and Pressures in a Flat-Bottomed Silo. J. Eng. Mech. 2001, 127, 1033–1043. [Google Scholar] [CrossRef]
  10. Trahair, N.S.; Abel, A.; Ansourian, P.; Irvine, H.M.; Rotter, J.M. Structural Design of Steel Bins for Bulk Solids. Aust. Inst. Steel Constr. 1983, 4, 163–164. [Google Scholar]
  11. Rotter, J.M.; Goodey, R.J.; Brown, C.J. Towards Design Rules for Rectangular Silo Filling Pressures. Eng. Struct. 2019, 198, 109547. [Google Scholar] [CrossRef]
  12. Sanad, A.M. Analyse Tridimensionnelle Des Actions Aux Parois Des Silos-Modélisation Par Éléments Finis et Méthodes Simplifiées (Remplissage et Vidange). Ph.D. Thesis, INSA, Rennes, France, 1997. [Google Scholar]
  13. Goodey, R.J. Rectangular Silos; Interaction of Structure and Stored Bulk Solid. Ph.D. Thesis, Brunel University, School of Engineering and Design, Uxbridge, UK, 2002. [Google Scholar]
  14. Roberts, I.I. Determination of the Vertical and Lateral Pressures of Granular Substances. Proc. R. Soc. Lond. 1883, 36, 228–231. [Google Scholar] [CrossRef]
  15. Janssen, H.A. Versuche Uber Getreidedruck in Silozellen. Z. Ver. Dtsch. Ing. 1895, 39, 1045–1049. [Google Scholar]
  16. Goodey, R.J.; Brown, C.J.; Rotter, J.M. Rectangular Steel Silos: Finite Element Predictions of Filling Wall Pressures. Eng. Struct. 2017, 132, 61–69. [Google Scholar] [CrossRef]
  17. Airy, W. The Pressure of Grain. (Including Appendixes). Minutes Proc. Inst. Civ. Eng. 1898, 131, 347–358. [Google Scholar] [CrossRef]
  18. Reimbert, M.L.; Reimbert, A.M. Silos: Theory and Practice; Trans Tech Pub.: Bay Village, OH, USA; Clausthal, Germany, 1976. [Google Scholar]
  19. Ooi, J.Y.; Rotter, J.M. The Effect of Wall Flexibility on Pressures in Squat Steel Silos. In Second International Conference on Bulk Materials Storage, Handling and Transportation: 1986; Preprints of Papers: 1986; Preprints of Papers; Institution of Engineers: Barton, Australia, 1986; pp. 115–116. [Google Scholar]
  20. Rotter, J.M. Guide for the Economic Design of Circular Metal Silos; CRC Press: Boca Raton, FL, USA, 2001. [Google Scholar]
  21. Jarrett, N.D. A Study of the Influence of Wall Flexibility on Pressure in Rectangular Silos. Ph.D. Thesis, Brunel University, School of Engineering and Design, Uxbridge, UK, 1991. [Google Scholar]
  22. Ruckenbrod, C.; Eibl, J. Numerical Results to Discharge Processes in Silos. In Proceedings of the International Symposium on Reliable Flow of Particulate Solids, EFChE Publication Series No. 96, Oslo, Norway, 23–25 August 1993; pp. 503–516. [Google Scholar]
  23. Goodey, R.J.; Brown, C.J.; Rotter, J.M. Verification of a 3-Dimensional Model for FIlling Pressures in Square Thin-Walled Silos. Eng. Struct. 2003, 25, 1773–1783. [Google Scholar] [CrossRef]
  24. Simulia, D.S. Abaqus/CAE User’s Manual. 2013. Available online: https://www.yumpu.com/en/document/view/11254708/abaqus-cae-users-manual (accessed on 20 March 2022).
  25. Lahlouh, E.H.; Brown, C.J.; Rotter, J.M. Loads on Rectangular Planform Steel Silos; Research Report; The University of Edinburgh: Edinburgh, UK, 1995. [Google Scholar]
  26. Rotter, J.M.; Brown, C.J.; Lahlouh, E.H. Patterns of Wall Pressure on Filling a Square Planform Steel Silo. Eng. Struct. 2002, 24, 135–150. [Google Scholar] [CrossRef]
  27. Hilal, A. Finite Element Modeling of Steel Containment Structures under Lateral Loads. Master’s Thesis, Ain Shams University, Cairo, Egypt, 2015. [Google Scholar]
  28. EN 1991-4; Eurocode 1-Actions on Structures-Part 4: Silos and Tanks 2006 European Standard. European Committee for Standardization: Brussels, Belgium, 2006.
  29. Ooi, J.Y.; She, K.M. Finite Element Analysis of Wall Pressure in Imperfect Silos. Int. J. Solids Struct. 1997, 34, 2061–2072. [Google Scholar] [CrossRef]
Figure 1. The main components of the rectangular planform silo.
Applsci 12 09251 g001
Figure 2. Comparison of wall-filling pressures in silos. (a) Rectangular; (b) circular silo.
Applsci 12 09251 g002
Figure 3. Dimensions of the model silo. (a) Elevation view of the model showing pressure cell locations; (b) plan view of the model. (All dimensions in meters).
Applsci 12 09251 g003
Figure 4. Abaqus model of a quarter of the silo. (a) Silo walls and base elements t wall/base = 6 mm. (Steel); (b) granular materials elements (Leighton Buzzard sand).
Applsci 12 09251 g004
Figure 5. Cubic brick element (C3D8R).
Applsci 12 09251 g005
Figure 6. Boundary conditions assignment for one-quarter silo.
Applsci 12 09251 g006
Figure 7. Sections of the silo.
Applsci 12 09251 g007
Figure 8. Comparison between lateral filling pressure of the finite element and experimental work along the silo height in the case of the flexible walled silo. (a) section 1-1: at mid-side of the wall; (b) section 2-2: at 0.35 m from silo center; (c) section 3-3: at 0.55 m from silo center.
Applsci 12 09251 g008
Figure 9. Comparison between lateral filling pressure of the finite element and Janssen predictions along the silo height in case of the flexible walled silo. (a) section 1-1: at mid-side of the wall; (b) section 2-2: at 0.35 m from silo center; (c) section 3-3: at 0.55 m from silo center.
Applsci 12 09251 g009
Figure 10. Finite element results and Janssen predictions along the silo height in case of the rigid walled silo.
Applsci 12 09251 g010
Figure 11. 3-D lateral wall pressure in squat flexible wall silo filled with sand.
Applsci 12 09251 g011
Figure 12. Lateral wall pressure for different flexible silo dimensions (a = 0.5–12.5 m, h = 2.5 m).
Applsci 12 09251 g012
Figure 13. Percentage of vertical load distribution on flexible walls for different slenderness ratios.
Applsci 12 09251 g013
Figure 14. Percentage of vertical load distribution on rigid walls for different slenderness ratios.
Applsci 12 09251 g014
Figure 15. Vertical load distributions inside flexible wall silos for various slenderness ratios.
Applsci 12 09251 g015
Figure 16. Vertical load distributions inside rigid wall silos for various slenderness ratios.
Applsci 12 09251 g016
Figure 17. Effect of wall thickness on lateral wall pressure.
Applsci 12 09251 g017
Figure 18. Lateral wall pressure comparison between rigid and flexible walls, as well as Janssen. (a) Flat model silo 1.5 × 1.5 × 2.5 m; (b) slender model silo 0.5 × 0.5 × 2.5 m.
Applsci 12 09251 g018
Table 1. Properties of bulk solids applied in the model.
No.ParameterValue
1Density, ρ (kg/m3)1587
2Poisson’s Ratio, ν0.3164
3Wall/friction coefficient, µ0.445
4Internal angle of friction, β45.1
5Initial void ratio, e00.67
6Logarithmic bulk modulus, λ0.002
7Initial yield stress, σco0.25
8Dilation angle, ψ0
9Elastic tensile limit, Ptel (kPa)0
Table 2. Properties of steel used in the model.
No.ParameterValue
1Density, ρ (kg/m3)7500
2Poisson’s Ratio, ν0.3
3Young’s Modulus (GPa)210
4Yield stress (MPa)240
5Plastic strain0
Table 3. Silos with different planform dimensions.
No.Square Silo Side “a”, MetersHeight “H”, MetersH/a
10.52.55
212.52.5
31.252.52
41.672.51.5
52.52.51
66.252.50.4
712.52.50.2
Table 4. Silo classifications according to EN1991-4 (dc = a, for square silo).
Silo Classificationhc/dc
Slenderhc/dc ≥ 2
Intermediate1 < hc/dc < 2
Squat0.4 < hc/dc ≤ 1
Retaining siloshc/dc ≤ 0.4
Table 5. Percentage of load distribution on walls and base with different slenderness ratios in flexible wall case.
H/a5.02.52.01.51.00.40.2
% of Loads on Wall75.254.747.338.026.610.54.9
% of Loads on Base24.845.352.762.073.489.595.1
Publisher’s Note: MDPI stays neutral with regard to jurisdictional claims in published maps and institutional affiliations.

