Abstract
Every day, mining corporations grow and develop over Egypt’s Eastern Desert in search of gold, silver, and other metals. Mineral resources in Egypt are a powerful tool for increasing national income. In this study, we are interested in mineral exploration, such as gold and porphyry deposits, using aeromagnetic data, applying various processing techniques such as First Vertical Derivative, Total Horizontal Gradient, Analytical Signal, Tilt Derivative, and the center of exploration targeting (CET). The study area is located at the Central Eastern Desert, which includes the Barramiya, Abu Marwa, and Abu Mireiwah regions. The analysis of the delineated structural trends shows that the N–S, NW–SE, and NE–SW are the most effective directions for managing deposits in the investigated area. A minor trend is also shown in the E–W direction and corresponds to the alteration zones reported by geology and prior investigations. Mineralization zones occur most frequently at the contact between ophiolitic serpentinite, sediments, and other rock types. This study intends to add more about the use of the recently developed technology of CET grid analysis for mineral exploration and structural interpretation across the Central Eastern Desert. The CET porphyry analysis map shows locations where several occurrences of porphyry deposits are probable. The newly discovered spots are similar to the area’s usual deposit sites. This study proves that aeromagnetic data are significant in mineral exploration since they are useful for the discovery of the structure and shear zones controlling the mineralization zones.
1. Introduction
From a geographical standpoint, the designated region is located in Egypt (Figure 1). It exists between longitudes 33°37′30″ E and 34°02′30″ E, and latitudes 24°57′30″ N and 25°10′46″ N. The Barramiya gold mine region in the western section of the Barramiya area is one of the numerous landmarks in the Eastern Desert that are characterized by mineralization such as gold and other metals. Aeromagnetic method is the most cost-effective geophysical tool for mineral exploration because it detects alteration zones that may control the mineralization zones. In addition to its applications in mineral studies, other types of geophysical field datasets are widely used to investigate continental-scale crustal characteristics [1], magma chamber geometry, heat flow [2], and for groundwater studies and subsurface geology [3,4].
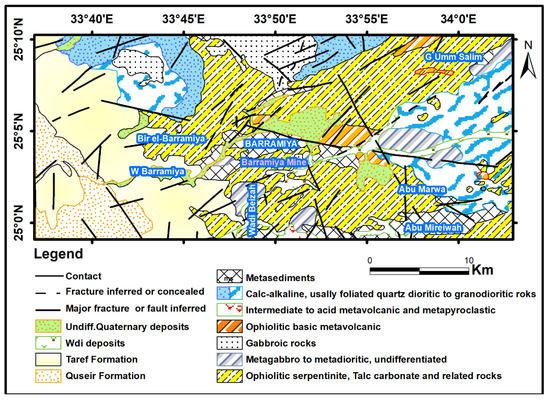
Figure 1.
Geological map of El-Barramiya-Abo Marwa area, Eastern Desert (modified after [13]).
It may be possible to locate the occurrence of comparable deposits elsewhere in the region using the magnetic signature. Many authors worked and studied almost 95 locations of gold mining in Egypt since ancient times, (e.g., [5,6,7,8]). Despite their restricted techniques, the ancient Egyptians were interested in mining and were able to extract gold from gold-bearing quartz veins in open pits and underground mines.
The present study covers the applications and importance of high-resolution aeromagnetic data for delineating the structural (deep-seated and shallow-seated) and tectonic trends that control the mineral occurrence. Therefore, at the Barramiya, Abu Marwa, and Abu Mireiwah sites in Egypt, we have analyzed the aeromagnetic data to delineate the alteration zones, geological structures, geological boundaries, and depth to the rock of conceivable basement mineralization zones that are linked to hydrothermally altered zones. The study area has been subjected to previous geophysical studies, including paleomagnetic studies on some chromite ores [9] and others using aeromagnetic data to create the curie point depth map by means of the spectral analysis technique [10], but it is the first time that the aeromagnetic data has been analysed using the new Centre for Exploration Targeting (CET) grid analysis technique to map out geological structures and highlight the best places to look for minerals.. The edges of the sources were detected by many authors, who introduced the new techniques based on the ratios of gradients of the gravity data, where the edge detection filter was based on the ratio of the derivatives of the THG and called the logistic function of the total horizontal gradient (THG) [11,12] have used a novel filter called Balanced Horizontal Gradient for the magnetic data from central India to improve the subsurface bodies’ edges, which circumvent the restrictions of traditional filters. We applied some techniques to the reduced to pole (RTP) magnetic data such as the first vertical derivative (FVD), analytical signal (AS), tilt derivative (TDR), THG, high pass derivative (HP), low pass (LP), power spectrum, and CET Grid and Porphyry Analyses using the Geosoft program.
2. Geologic Setting
The study region is in Egypt’s central Eastern Desert, and it includes the Barramiya, Abu Marwa, and Umm Miriewah areas, with a concentration on the Barramiya. In the Barramiya District, tectonically deformed metasedimentary and volcano-sedimentary rocks host a neoproterozoic ophiolitic melange of allochthonous serpentinite blocks and clasts, as well as carbonatized/silicified derivatives [14]. According to the Conoco map (Figure 1), the study region has ophiolitic serpentinite rocks, talc carbonate rocks, metagabbro to metadiorite rocks, gabbroic rocks, ophiolitic basic metavolcanic rocks, intermediate-to-acid metavolcanic rocks, calc-alkaline rocks, metasediments, and sedimentary rocks on the top, serpentinite in the Barramiya area run N–SW, and produce lithotectonic terrain dominated by oceanic affinity rocks [15]. They form elongate fault bounded by sheets.
The mountainous El-Barramiya–Um Salatite belt is made up of serpentinites with the remains of hurzburgite, pyroxenite, and subordinate metabasalts. The belt generates folded tabular bodies or sheets that are elongated in the ENE and aligned with the ophiolitic mélange matrix’s major foliation (metasediments and metavolcanics) (Figure 1). Serpentinites come in two types: huge and severely sheared, deformed, and concentrated across the area in close contact with the other mélange components. Because the strength of carbonatization increases near steeply dipping transgressive faults, listvenite rocks in the gold mine area developed from the alteration of tectonized serpentinite, which is represented by talc-actinolite schists and talc-carbonate rocks. Syn-orogenic rocks, like quartz diorite and granodiorite, have intruded the local ophiolitic rocks. At last, unconformity is brought about by sedimentary strata from the western part of the study region, as shown by the Tarif and Quseir formations. The research region is heavily deformed and sheared, with gold, sulphides, and chromite deposits. Shear zones and general faults regulate gold deposition in the area, which is controlled by auriferous quartz veins [16,17]. In the northern part of the El-Barramiya area, syn-orogenic quartz diorite and granodiorite intrusions subsequently intruded the ophiolitic mélange phase. The Barramiya’s structural setting illustrates the Eastern Desert’s complicated deformational history. The study of structural fabrics revealed that the El-Barramiya region was overprinted by syn- and post-accretion deformation periods (D1–D3) [18].
3. Methodology
These aeromagnetic maps were compiled by the Aero Service Division at the Western Geophysical Company of America, USA, in 1983 for the Egyptian Geophysical Survey [19]. It undertook an aeromagnetic survey in Egypt’s Eastern Desert, which took nearly three years to complete. At a scale of 1:50,000, the resulting magnetic data were compressed, collated, and eventually presented in contour and composite profile maps. These data was prepared for further processing by digitizing the map with the Didger program, then correcting for IGRF with an inclination of 34.95, a declination of 1.90, and a magnetic field strength of 40,902.54 nT. Exporting into the (x, y, z) form and gridding were then carried out. It was finally ready for processing and analysis using various geophysical techniques.
To locate the anomalies above their causative bodies, the total magnetic intensity map was first reduced to the RTP grid, which was then subjected to a variety of filters and techniques such as FVD, THG, TDR, LP, HP, and CET techniques [20].
3.1. Regional–Residual Separation
The spectral analysis technique is used to isolate the regional and residual components from the RTP map (Radial Average Power Spectrum Technique). The use of this approach on the RTP map is to separate the regional and residual maps [21]. The Fast Fourier transformation is used in this procedure.
3.2. First Vertical Derivative (FVD) Method
The FVD map is critical for detecting near-surface magnetic characteristics associated with geological formations; it resembles the upward continuation map and is used to enhance local anomalies, while attenuating regional anomalies because it is sensitive to shallow magnetic sources. Long wave forms caused by magnetic causative bodies were removed using the first vertical derivative [22]. The zero-contour line on the FVD map helps to clarify the structural and lithological components.
3.3. Total Horizontal Gradient (THG) Method
The THG method is extremely good at detecting structures such as faults from the borders of anomalies [23], and it is generally insensitive to data noise and interference effects between close sources. Many assumptions about the sources were proposed by [24], including (1) the vertical regional magnetic field, (2) the vertical source magnetization, (3) the vertical contacts, (4) the isolated contacts, and (5) the thick sources. This method is widely used in mineral exploration; however, it is lease susceptible to data noise because it only considers the two first-order horizontal derivatives of the magnetic field. If M (x, y) is the magnetic field and the horizontal derivatives of the field are (∂M/∂x and ∂M/∂y), then the THG (x, y) is given by Equation (1):
3.4. Tilted Derivative (TDR) Method
The TDR is employed in this search for mineral exploration targets and mapping shallow basement structures using Oasis Montag (8.4); however, it is not usable in deep sources, since the observed edges have vanished. According to [25], the arctangent of the ratio of the potential field’s vertical derivative (VDR) to its entire horizontal derivative (THDR) gives the tilt angle function as illustrated in Equation (2):
3.5. Analytical Signal (AS) Technique
One of the most essential features of the AS technique for deriving magnetic parameters from the aeromagnetic data is that it is independent of rock magnetization. Mineral deposits with large concentrations of iron minerals are frequently linked with ophiolitic serpentinite rocks, ophiolitic basic and metavolcanic rocks, and gabbroic rocks, which have high AS amplitudes. This demonstrates that the AS amplitude is dependent on the causal body’s magnetizing amplitude [26,27], where the 3D AS, as shown in Equation (3), is the square root of the sum of the squares of the derivatives in the x, y, and z directions. The AS amplitude can be used to map the borders of rock units and delineate underlying structural features.
3.6. CET Porphyry Analysis
This technique is used in our research to explore porphyry mineral deposits across the area using the RTP grid, and it involves several processing stages, including the Circular Feature Transform plugin, the Central Peak Detection plugin, the Amplitude Contrast Transform plugin, and the Boundary Tracing plugin (Figure 2).
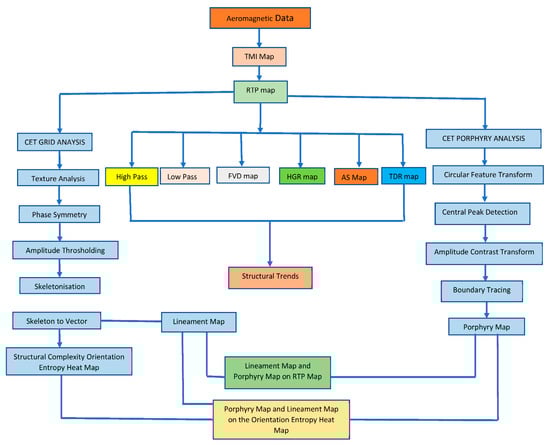
Figure 2.
Methodology flow chart of the study.
4. Results and Discussion
There is not much difference between the RTP map and the TMI map (Figure 3), except that several anomalies change their direction northward due to the elimination of the study area’s declination. The anomalies’ forms are also centered over their respective causal bodies. By looking at the RTP map, we can see that the magnetic intensity range is between 41,833 and 43,330 nT. As a result of the magnetized rocks in the region, the investigated region is distinguished by high and low magnetic anomalies of both low and high frequencies; the high magnetic anomalies have high magnetic susceptibilities due to the high iron content within ophiolitic serpentinite rocks, ophiolitic basic and metavolcanic rocks, and gabbroic rocks, whereas the low magnetic anomalies are due to the presence of quaternary alluvium deposits, felsic rocks (Calc-alkaline), and intermediate-to-acidic metavolcanic and metapyroclastic rocks.
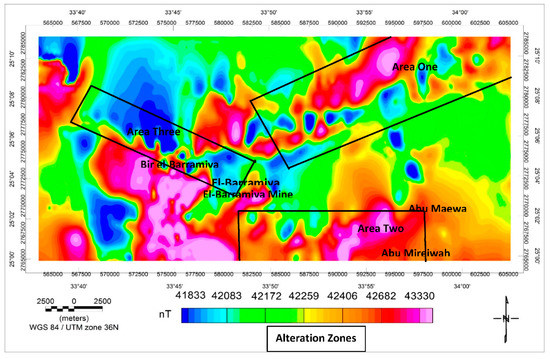
Figure 3.
RTP magnetic map of the research area.
The significant magnetic anomalies (pink color) in the northeastern portion of the study region are attributed to the mineralization belt (Barramiya-Um Saltit belt) linked with the NE-SW running faults. Low magnetic anomalies (blue color) are found throughout the area, but they extend in three directions: NE–SW, NW–SE, and N–S, which could be related to the sedimentary cover and calc-alkaline rocks. The area is highly deformed and sheared and includes different alteration zone according to our results from the aeromagnetic data and [28]. Area one is shown on the RTP map, representing the first alteration zone where it is located in the northeast and extends in the NE–SW direction parallel to the Gulf of Suez trend. Area two is the second alteration zone, extending in the E–W. Related to the strike-slip faults and transgressed thrust faults, this trend represents the Mediterranean trend and the major ductile shear zones that occur in the central part, coinciding with the Arabian Nubian shield collision with the Nile Craton in the west [29,30]. Our geophysical approach has also identified a third alteration zone, located in the western half of the study region next to the Barramiya mine and stretching in a northwest-southeast direction parallel to the Red Sea trend. The RTP magnetic data’s radially averaged power spectrum is split into three parts, as shown in Figure 4: regional (deep) sources, residual (shallow) sources, and Nyquist.
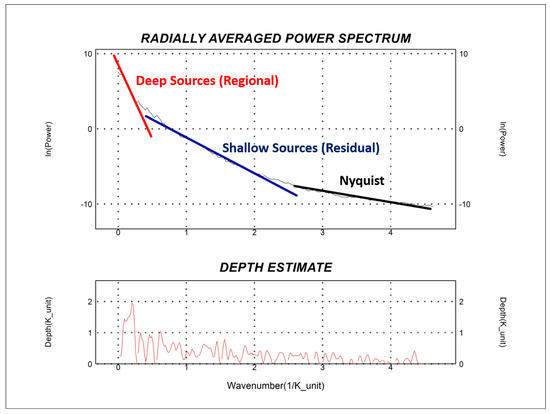
Figure 4.
The research region’s radially-averaged power spectrum as calculated from the RTP magnetic data.
The residual RTP magnetic-component map (Figure 5A) is the most effective in detecting shallow-seated geological structures. A cut-off wavelength of 0.0002 cycle/unit was applied to the RTP map, and the results show that the predominant structures are in the NNE–SSW and NW–SE directions, which are attributed to the area’s near-surface structures. In the study area, the magnetic field intensity varies from the highest (319 nT) to the lowest values (−389 nT). The region contains a variety of local anomalies defined by relatively high frequencies and short wavelengths of various forms (elongated and circular). According to the geological map of the research region, positive anomalies extend in the NE–SW and N–S directions that are associated with the strike-slip faults and transgressed thrust faults. The negative anomalies are distributed in the central part of the study area and extend in the NE–SW and N–S direction due to the presence of sedimentary rocks and calc-alkaline rocks.
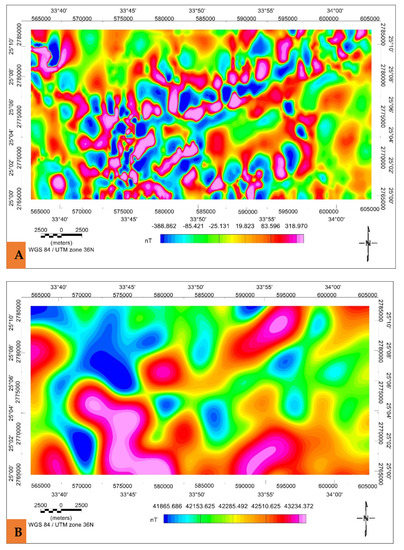
Figure 5.
(A) High-pass filtered map; (B) Low-pass and filtered map of the study area.
The regional (low-pass) magnetic map (Figure 5B) depicts deep-seated magnetic anomalies. The RTP map was subjected to a wavelength cutoff of 0.0002 cycle/unit, and regional anomalies were shown by lowering the amplitude and frequency. The RTP map can be used to locate deep-seated structures. However, with lowering the amplitudes and frequencies, several useless anomalies from the RTP map may appear in the low pass map. The deep-seated structural trends affecting the area are in the NW–SE, NE–SW, and N–S directions. The magnetic field intensity in the research area ranges from 43,234 to 41,866 nT. High magnetic anomalies, represented by magenta and red colors, are accounted for by ophiolitic serpentinite, gabbroic rocks, metagabbro, and metavolcanic rocks, and extend in a NE–SW direction; low magnetic anomalies, represented by blue, yellow, and green colors, are accounted for by the Taref formation, Quseir formation, wadi deposits, and calc-alkaline rocks, and extend in a NW–SE direction.
The magnitude of magnetic anomalies varies between 1.175 and −2.540 nT/Km on the FVD map in greyscale (Figure 6A) and extends in the NE–SW, NW–SE, and N–S directions. The high magnetic anomalies are linked to ophiolitic serpentinite rocks, gabbroic rocks, and metavolcanic rocks, and this is indicated by the Barramiya–Um Saltit mineralization belt, whereas the low magnetic anomalies are associated with sedimentary cover, metasediments, and calc-alkaline rocks. Short-wavelength anomalies were discovered in the northeast and eastern parts of the research area, indicating shallow depths of the causative sources in comparison to the western section, which showed deeper sources associated with the presence of sedimentary deposits. The three alteration zones, which run NE–SW, E–W and NW–SE, are clearly seen here.
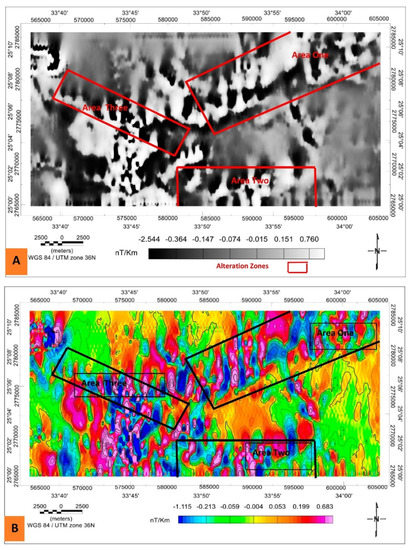
Figure 6.
The FVD map (A), and the THG map (B) of the research area.
The horizontal gradient derivative method is used to identify the borders that separate the common rock units in the area, where steep gradients occur across near-vertical contacts between units of variable magnetic characteristics [31,32]. The local peaks can be used to determine the location of the steepest gradients. The anomalies range in magnitude from 0.683 to −1.115 nT/Km (Figure 6B). Most of the anomalies run in the N–S direction due the main NE-trending structure which controls the mineralization in the area. The borders of the area’s more substantial amplitude anomalies can easily be seen in the HGR map everywhere across the area, while the lesser amplitude anomalies’ bounds are yet unknown. The three detected shear zones are clear in this map and concordant with other methods.
The AS map is shown in Figure 7. The findings of applying this filter show that the major trend is in a NE–SW direction, which corresponds to the Barramiya–Um Saltit mineralization zone belt. Low magnetic susceptibility values (0.048–0.104 nT/Km), an indicator of demagnetization, are found in the northern, eastern, and western parts of the area in the calc-alkaline, metasediments, quaternary deposits, and Taref and Quseir formations. The ophiolitic serpentinite, ophiolitic basic metagabbro, and gabbroic rocks are connected with positive anomalies of (0.559–1.870 nT/Km) in the northeastern and southern portions. When compared to the TMI and RTP maps in the northeastern and middle parts of the region, this AS algorithm highlights the differences that are readily apparent near the borders of the ophiolitic serpentinite (Figure 3).
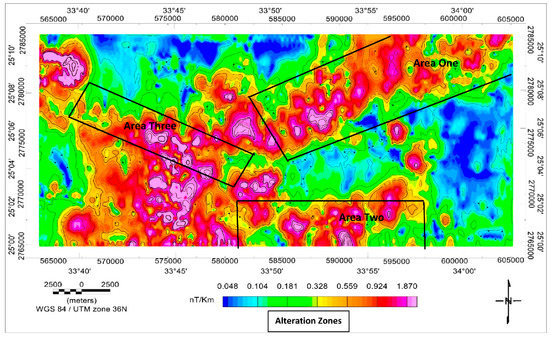
Figure 7.
The research area’s AS map.
The magnitudes of TDR anomalies on the TDR map (Figure 8) range from 0.821 to −1.096 radians. Positive magnetic anomalies are associated with ophiolitic serpentinite rocks, gabbroic rocks, and metavolcanic rocks, as well as the Barramiya–Um Saltit mining belt, which is associated with NE–SW faults. The zero-contour line is important in the TDR map and is used in the detection of subsurface lineaments, so the dashed lines represent structural lineaments that are similar to those subtracted from the AS maps, where there is evidence for the formation of gold mineralization in the study region.
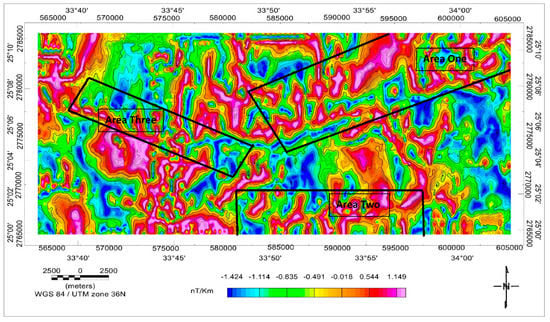
Figure 8.
A map showing the research area’s TDR.
By identifying the axes of symmetry, phase symmetry can be used to detect line-like patterns (Figure 9). The phase symmetry aids in the clarification of primary trends and lineation, and these properties can be easily mapped using it. This technique was utilized to aid mineral exploration by detecting favorable zones, and only the positive traits were utilized in this case. Here, the boundary between ophiolitic rocks, sediments, and other rock units was cleared here. Noise and background signals were reduced using amplitude thresholding. The extracted linear features were then thinned using skeletonization. Finally, the skeleton, which included the linear features extracted, was transformed to lineaments, as indicated by the magnetic lineaments map (Figure 9). The proposed prospective areas are inferred from the rose diagram’s defined patterns in the N–S, NW–SE, NNW–SSE, NNE–SSW, minor E–W, and NE–SW structures of the CET grid approach (Figure 9). Favorable zones include those where altered sediments are linked to basement rocks lithologically (Figure 9).
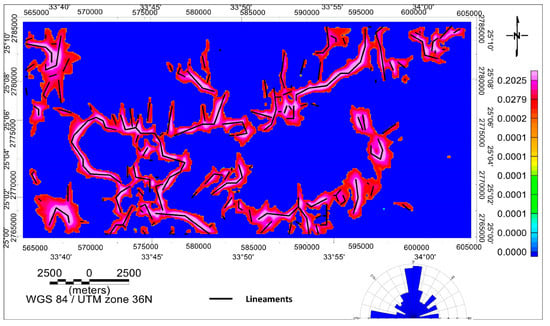
Figure 9.
Phase symmetry map; black lines interpreted as faults by the CET grid. Insert showing rose diagram.
The structural complexity orientation entropy (OE) map was used to illustrate porphyry properties (Figure 10B). It depicts regions where structures appear in a variety of orientations; high-entropy regions are assumed to have a high level of statistical unpredictability, and thus a high level of structural complexity. The ophiolitic serpentinite, metagabbro, and ophiolitic basic metavolcanic rocks have most of these similar traits. The NE–SW and NW–SE directions are the favored orientations of these deposits, meaning that additional ore will be deposited in the investigated area.
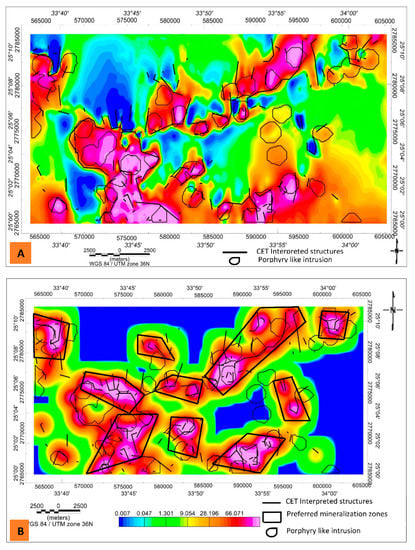
Figure 10.
(A) The circular boundary porphyry tracing and skeleton of vector lineaments are superimposed on the RTP map of the study region. (B) Figure illustrating the OE map, vectorized lineaments (black lines), the circular boundary porphyry tracing (black circular), and prospective areas (in the black line) of the study area.
The boundary tracing plugin is useful for outlining discovered porphyry-like features from the CET porphyry analysis. This plugin makes use of the output from the Central Peak Detection and Amplitude Contrast Transform plugins, which offer detected porphyry center locations and a halo-shaped ring around the porphyries, respectively. The RTP and the OE maps (Figure 10A,B) were overlaid with the circular boundary tracing and vectorization lineaments. As can be seen, the study region contains many locations for porphyry mineral deposits, which are almost concentrated in the Barramiya gold mine area in the western part of the region, as well as large deposits delineated on the Barramiya Umm-Salatit belt in the northeast of the study region and extending in the NE–SW direction. However, the western part of the study area, which is represented by Abu Marwa and Abu Mireiwah, covers a large amount of porphyry deposits. The CET have a significant role in the detection of the potential location for mineralization where the favorable locations for deposition are determined on the entropy map (Figure 10B) and structurally controlled by the lineaments detected from the vectorization lineaments map (Figure 9). The results obtained by this technique are concordant with the geological studies conducted by many researchers on the area.
In terms of geophysical techniques, aeromagnetic techniques, for example, are appropriate and effective in examining mineralized, alteration, and prospective zones [33,34,35,36,37,38]. However, there are just a few publications that have been published that look at the relationship between magnetic intensity and gold mineralization zones (e.g., [16,39,40]. We used magnetic data and various techniques to determine the structural trends and/or shear zones that control and identify mineralization zones in this study.
Lineaments are utilized in magnetic studies to indicate the main shear zones, fracturing, and faulting patterns so that we may learn more about the forces that have influenced the area in the past. The mine area is affected by lateral strike-slip faults [14]. From the magnetic maps, subsurface structural lineaments were traced using [41] concepts. The RTP, FVD, HGR, AS, regional, and residual maps, and CFT grid analysis are all used to trace the lineaments. The N–S, NE–SW, NW–SE, and E–W are the principal tectonic trends impacting the study region, with the major trends traced from the geology map being in the NEE–SWW, NE–SW, NW–SE, and E–W directions (Figure 11). Thrust faults that run NE–SW and NEE–SWW and dip NW separate the island arc rock groups represented by metasedimentary and metavolcanic layered units, intrusive gabbro to diorite plutons, and ophiolitic rocks [42,43]. The N–S trend coincides with the New Counter Lode trend, which [44] termed the East African trend and regarded as an ongoing direction of dike intrusion and faulting in Egypt.
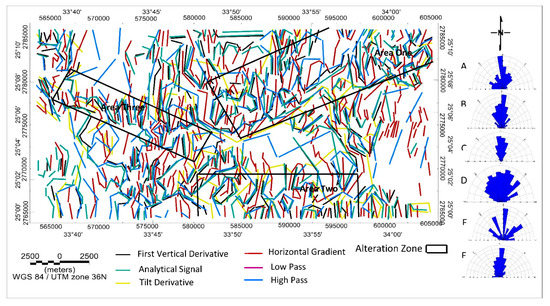
Figure 11.
A map depicting the faults, dykes, and shears beneath the surface of the region under study from the AS (A), FVD (B), HGD (C), High Pass (D), Low Pass (E), and TDR (F) maps, the major and minor trends of the subsurface lineaments are depicted in the rose diagrams (A–F).
The applied filters and the application of CET techniques helped to detect three different alteration zones distributed in the area, with the first alteration zone located NE of the Barramiya mine area and extending in the N–SW direction. The second alteration zone is located at the southeast of the Barramiya mine area and extends in the E–W direction and coincides with the E–W structural trend. Our results for these two alteration zones are consistent with findings by [28]. They integrated fieldwork and satellite datasets with geochemical and mineralogical data to investigate new gold discoveries in two alteration zones in the northeast (zone 1) and southeast (zone 2) in the ultramafic–mafic successions of the Barramiya gold mine. Talc, magnesite, ankerite, calcite, and quartz are found in varying concentrations in regions 1 and 2, according to mineralogical studies. Other studies using an ore microscope indicated that these zones contain sulphide minerals that hold gold [28]. The third alteration zone (zone 3) lies in the central part of the mine area and extend in the NW–SE direction. [42] described the major cleavage direction NEE–SWW and two joint systems of granites striking NNE, SWW, and dipping toward the east. In the Barramiya mine site, NNE is represented by left-lateral strike-slip faults, which were evidenced by horizontal slickensides.
In comparison to sophisticated magnetic data applications, gravity datasets are widely employed for advanced applications such as monitoring mass variations and groundwater resources [45,46,47,48].
5. Conclusions
The principal structural trends affecting the area are in the N–S, NE–SW, NW–SE, and E–W directions, and these structures control mineralization in the study area, as determined by the application of derivative filters and the processing of aeromagnetic data such as FVD, THG, AS, TDR, and CET techniques. It is shown that the research region’s mineral resources are linked to shear zones, which are found in many parts of the area and resulted from the contact of ophiolitic serpentinite rocks with metasediments and other rock units in the study region, based on the integration of geophysical techniques and the geology of the area. The shear zones and favored mineralization zones from the center of exploratory targeting, as well as the other filter maps, match geological research in the area. In our investigation, the CET technique was found to be an excellent tool for constructing the OE maps for the identification of lineaments operating as possible hydrothermal fluid plumbing systems, and this study confirms that aeromagnetic data have a significant impact on alteration zone detection and mineral exploration.
Author Contributions
Conceptualization, A.M. and M.A.; methodology, M.A., A.M. and M.A.M.; software, M.A., A.M. and M.A.M.; validation, M.A. and A.M.; formal analysis, A.M., M.A., F.A., A.A. and M.A.M.; investigation, A.M., M.A. and F.A.; resources, M.A., A.M. and F.A.; data curation, F.A., A.A. and M.A.M.; writing—original draft preparation, M.A. and A.M.; writing—review and editing, A.M. and M.A; visualization, A.M. and M.A.; supervision, A.M. and M.A.; project administration, A.M. and M.A.; funding acquisition, A.M., F.A., A.A. and M.A.M. All authors have read and agreed to the published version of the manuscript.
Funding
The authors extend their appreciation to the Abdullah Alrushaid Chair for Earth Science Remote Sensing Research for funding.
Data Availability Statement
The data is available upon request from the authors.
Conflicts of Interest
The authors declare that they have no known competing financial interest or personal relationships that could have appeared to influence the work reported in this paper.
References
- Mohamed, A.; Al Deep, M. Depth to the bottom of the magnetic layer, crustal thickness, and heat flow in Africa: Inferences fromgravity and magnetic data. J. Afr. Earth Sci. 2021, 179, 104204. [Google Scholar] [CrossRef]
- Mohamed, A.; Al Deep, M.; Abdelrahman, K.; Abdelrady, A. Geometry of the Magma Chamber and Curie Point Depth Beneath Hawaii Island: Inferences from Magnetic and Gravity Data. Front. Earth Sci. Sect. Solid Earth Geophys. 2022, 10, 847984. [Google Scholar] [CrossRef]
- Al Deep, M.; Araffa, S.A.S.; Mansour, S.A.; Taha, A.I.; Mohamed, A.; Othman, A. Geophysics and remote sensing applications for groundwater exploration in fractured basement: A case study from Abha area, Saudi Arabia. J. Afr. Earth Sci. 2021, 184, 104368. [Google Scholar] [CrossRef]
- Mohamed, A.; Abu El Ella, E.M. Magnetic Applications to Subsurface and Groundwater Investigations: A Case Study from WadiEl Assiuti, Egypt. Int. J. Geosci. 2021, 12, 77–101. [Google Scholar] [CrossRef]
- Hume, W. Geology of Egypt. Part II. The later plutonic and intrusive rocks. Geol. Surv. Egypt 1935, 2, 301–688. [Google Scholar]
- El Ramly, M.F. A new geological map for the basement rocks in the Eastern and Southwestern desert of Egypt: Scale 1: 1,000,000. Ann. Geol. Surv. Egypt 1972, 2, 18. [Google Scholar]
- Sabet, A.H.; Tscgoev, V.B.; Bordonosov, V.P.; Babourin, L.M.; Zalata, A.A.; Francis, M.H. On gold mineralization in the eastern desert of Egypt. Ann. Geol. Surv. Egypt 1976, 6, 201–212. [Google Scholar]
- Marten, B. Reconnaissance of the Gold Deposits of the Eastern Desert of Egypt. Parts I and II; Minerals International Ltd., Exploration Department: New Bury, UK, 1986; pp. 1–44. [Google Scholar]
- Refai, E.; Wassif, N.A.; Shoaib, A. Stability of remanence and paleomagnetic studies of some chromite ores from Barramiya and Allawi occurrences, Eastern Desert, Egypt. Earth Planet. Sci. Lett. 1989, 94, 151–159. [Google Scholar] [CrossRef]
- Abd El Nabi, S.H. Curie point depth beneath the Barramiya–Red Sea coast area estimated from spectral analysis of aeromagnetic data. J. Asian Earth Sci. 2012, 43, 254–266. [Google Scholar] [CrossRef]
- Pham, L.T.; Oksum, E.; Do, T.D. Edge enhancement of potential field data using the logistic function and the total horizontal gradient. Acta Geod. Geophys. 2019, 54, 143–155. [Google Scholar] [CrossRef]
- Prasad, K.D.; Pham, L.T.; Singh, A.P. Structural mapping of potential field sources using BHG filter. Geocarto Int. 2022, 1–28. [Google Scholar] [CrossRef]
- Conoco. Egyptian general authority for petroleum. In Scale (1:500,000) between El-Minia and Sohag; Conoco: Ponca City, OK, USA, 1987. [Google Scholar]
- Zoheir, B.; Lehmann, B. Listvenite-lode association at the Barramiya gold mine, Eastern Desert, Egypt. Ore Geol. Rev. 2011, 39, 101–115. [Google Scholar] [CrossRef]
- Stern, R.J. Petrogenesis and tectonic setting of Late Precambrian ensimatic volcanic rocks, Eastern Desert of Egypt. Precambrian Res. 1981, 16, 195–230. [Google Scholar] [CrossRef]
- Saleh, A.; Abdelmoneim, M.; Abdelrady, M.; Al Deep, M. Subsurface structural features of the basement complex and mineralization zone investigation in the Barramiya area, Eastern Desert of Egypt, using magnetic and gravity data analysis. Arab. J. Geosci. 2018, 11, 1–14. [Google Scholar] [CrossRef]
- Zoheir, B.; El-Wahed, M.A.; Pour, A.B.; Abdelnasser, A. Orogenic gold in transpression and transtension zones: Field and remote sensing studies of the barramiya–mueilha sector, Egypt. Remote Sens. 2019, 11, 2122. [Google Scholar] [CrossRef]
- Zoheir, B.; Weihed, P. Greenstone-hosted lode-gold mineralization at Dungash mine, Eastern Desert, Egypt. J. Afr. Earth Sci. 2014, 99, 165–187. [Google Scholar] [CrossRef]
- Egyptian General Petroleum Corporation (EGPC). Aeromagnetic Survey of North Eastern Desert and Gulf of Suez; Western Geophysical Company of America: Singapore, 1983. [Google Scholar]
- Milligan, P.; Gunn, P.J. Enhancement and presentation of airborne geophysical data. AGSO J. Aust. Geol. Geophys. 1997, 17, 63. [Google Scholar]
- El-Ata, A.S.A.; EI-Khafeef, A.A.; Ghoneimi, A.E.; Abd Alnabi, S.H.; Al-Badani, M.A. Applications of aeromagnetic data to detect the Basement Tectonics of Eastern Yemen region. Egypt. J. Pet. 2013, 22, 277–292. [Google Scholar] [CrossRef]
- Keating, P. A simple technique to identify magnetic anomalies due to kimberlite pipes. Explor. Min. Geol. 1995, 4, 121–125. [Google Scholar]
- Grauch, V.; Cordell, L.J.G. Limitations of determining density or magnetic boundaries from the horizontal gradient of gravity or pseudogravity data. Geophysics 1987, 52, 118–121. [Google Scholar] [CrossRef]
- Phillips, J.D. Locating magnetic contacts: A comparison of the horizontal gradient, analytic signal, and local wavenumber methods. In SEG Technical Program Expanded Abstracts 2000; Society of Exploration Geophysicists: Houston, TX, USA, 2000; pp. 402–405. [Google Scholar]
- Miller, H.G.; Singh, V. Potential field tilt-A new concept for location of potential field sources. J. Appl. Geophys. 1994, 32, 213–217. [Google Scholar] [CrossRef]
- Nabighian, M.N. The analytic signal of two-dimensional magnetic bodies with polygonal cross-sections; its properties and use for automated anomaly interpretation. Geophysics 1972, 37, 507–517. [Google Scholar] [CrossRef]
- Roest, W.R.; Pilkington, M. Identifying remanent magnetization effects in magnetic data. Geophysics 1993, 58, 653–659. [Google Scholar] [CrossRef]
- Salem, M.S.; Soliman, M.N.; Ramadan, M.T. Exploration of new gold occurrences in the alteration zones at the Barramiya District, Central Eastern Desert of Egypt using ASTER data and geological studies. Arab. J. Geosci. 2014, 7, 1717–1731. [Google Scholar] [CrossRef]
- Klitzsch, E. Plate tectonics and cratonal geology in Northeast Africa (Egypt, Sudan). Geol. Rundsch. 1986, 75, 755–768. [Google Scholar] [CrossRef]
- Schandelmeier, H.; Richter, A.; Harms, U. Proterozoic deformation of the East Saharan Craton in southeast Libya, south Egypt and north Sudan. Tectonophysics 1987, 140, 233–246. [Google Scholar] [CrossRef]
- Grauch, V.J.S.; Johnston, C.S. Gradient window method: A simple way to separate regional from local horizontal gradients in gridded potential-field data. In Proceedings of the 2002 SEG International Exposition and 72 Annual Meeting, Salt Lake City, UT, USA, 6–11 October 2002; OnePetro: Richardson, TX, USA, 2002. [Google Scholar]
- Grauch, V.; Hudson, M.R.J.G. Guides to understanding the aeromagnetic expression of faults in sedimentary basins: Lessons learned from the central Rio Grande rift, New Mexico. Geosphere 2007, 3, 596–623. [Google Scholar] [CrossRef]
- Rayner, J. Magnetic survey of the Gulgong deep leads. Ann. Rep. Dep. Mines NSW 1931, 83–84. [Google Scholar]
- Rayner, J.M. Magnetic Prospecting of the Gulgong Deep Leads; Tennart, Mineral Resources Department Mines: Leadville, NSW, Australia, 1940; Volume 38, pp. 135–160. [Google Scholar]
- Daly, J. Magnetic prospecting at Tennant Creek, Northern Territory, 1935–37; W.M. Houston, Govt. Printer: Melbourne, Australian, 1957; Volume 44. [Google Scholar]
- Groves, D.; Ho, S.E.; Houston, S.M. The Nature of Archaean Gold Deposits in Western Australia with Particular Emphasis on Parameters Relevant to Geophysical Exploration; Geology Department, University of Western Australia: Crawley, WA, Australia, 1984; Volume 10, pp. 1–63. [Google Scholar]
- El-Magd, I.A.; Mohy, H.; Basta, F. Application of remote sensing for gold exploration in the Fawakhir area, Central Eastern Desert of Egypt. Arab. J. Geosci. 2015, 8, 3523–3536. [Google Scholar] [CrossRef]
- Eldosouky, A.M.; El-Qassas, R.A.Y.; Pham, L.T.; Abdelrahman, K.; Alhumimidi, M.S.; El Bahrawy, A. Mapping Main Structures and Related Mineralization of the Arabian Shield (Saudi Arabia) Using Sharp Edge Detector of Transformed Gravity Data. Minerals 2022, 12, 71. [Google Scholar] [CrossRef]
- Tang, H.; Zhao, Z.; Tian, Z.; Lu, B.; Tang, W.; He, K.; Zhu, C.; Wang, P. Characteristics of the Density and Magnetic Susceptibility of Rocks in Northern Borneo and their Constraints on the Lithologic Identification of the Mesozoic Rocks in the Southern South China Sea. Acta Geol. Sin. Engl. Ed. 2021, 95, 280–293. [Google Scholar] [CrossRef]
- Wang, S.; Chang, L.; Tao, C.; Bilardello, D.; Liu, L.; Wu, T. Seafloor Magnetism under Hydrothermal Alteration: Insights from Magnetomineralogy and Magnetic Properties of the Southwest Indian Ridge Basalts. J. Geophys. Res. Solid Earth 2021, 126, e2021JB0226. [Google Scholar] [CrossRef]
- Gay, S.P. Fundamental Characteristics of Aeromagnetic Lineaments; American Stereo Map Company: Salt Lake City, UT, USA, 1972. [Google Scholar]
- Shukri, N.M.; Lotfi, M. The geology of the Bir Barramiya area. Bull. Fac. Sci. Cairo Univ. 1955, 34, 80–130. [Google Scholar]
- Abdel-Khalek, M.L. Tectonic evolution of the basement rocks in the southern and central Eastern Desert of Egypt. Evolution and Mineralization of the Arabian-Nubian Shield 1; Pergamon: Elmsford, NY, USA, 2017; pp. 53–62. [Google Scholar]
- Said, R. The Geology of Egypt; Elsevier: Amsterdam, The Netherlands, 1962; p. 377. [Google Scholar]
- Mohamed, A.; Abdelrahman, K.; Abdelrady, A. Application of Time-Variable Gravity to Groundwater Storage Fluctuations inSaudi Arabia. Front. Earth Sci. 2022, 10, 873352. [Google Scholar] [CrossRef]
- Mohamed, A.; Al Deep, M.; Othman, A.; Taha Al Alshehri, F.; Abdelrady, A. Integrated geophysical assessment of groundwater potential in southwestern Saudi Arabia. Front. Earth Sci. 2022, 10, 937402. [Google Scholar] [CrossRef]
- Othman, A.; Abdelrady, A.; Mohamed, A. Monitoring Mass Variations in Iraq Using Time-Variable Gravity Data. Remote Sens. 2022, 14, 3346. [Google Scholar] [CrossRef]
- Mohamed, A.; Faye, C.; Othman, A.; Abdelrady, A. Hydro-geophysical Evaluation of the Regional Variability of Senegal’s Terrestrial Water Storage Using Time-Variable Gravity Data. Remote Sens. 2022, 14, 4059. [Google Scholar] [CrossRef]
Publisher’s Note: MDPI stays neutral with regard to jurisdictional claims in published maps and institutional affiliations. |
© 2022 by the authors. Licensee MDPI, Basel, Switzerland. This article is an open access article distributed under the terms and conditions of the Creative Commons Attribution (CC BY) license (https://creativecommons.org/licenses/by/4.0/).