
An Improved Method Based on EEMD-LSTM to Predict Missing Measured Data of Structural Sensors


 ,
, 
Abstract
:1. Introduction
2. Theoretical Background of the Models
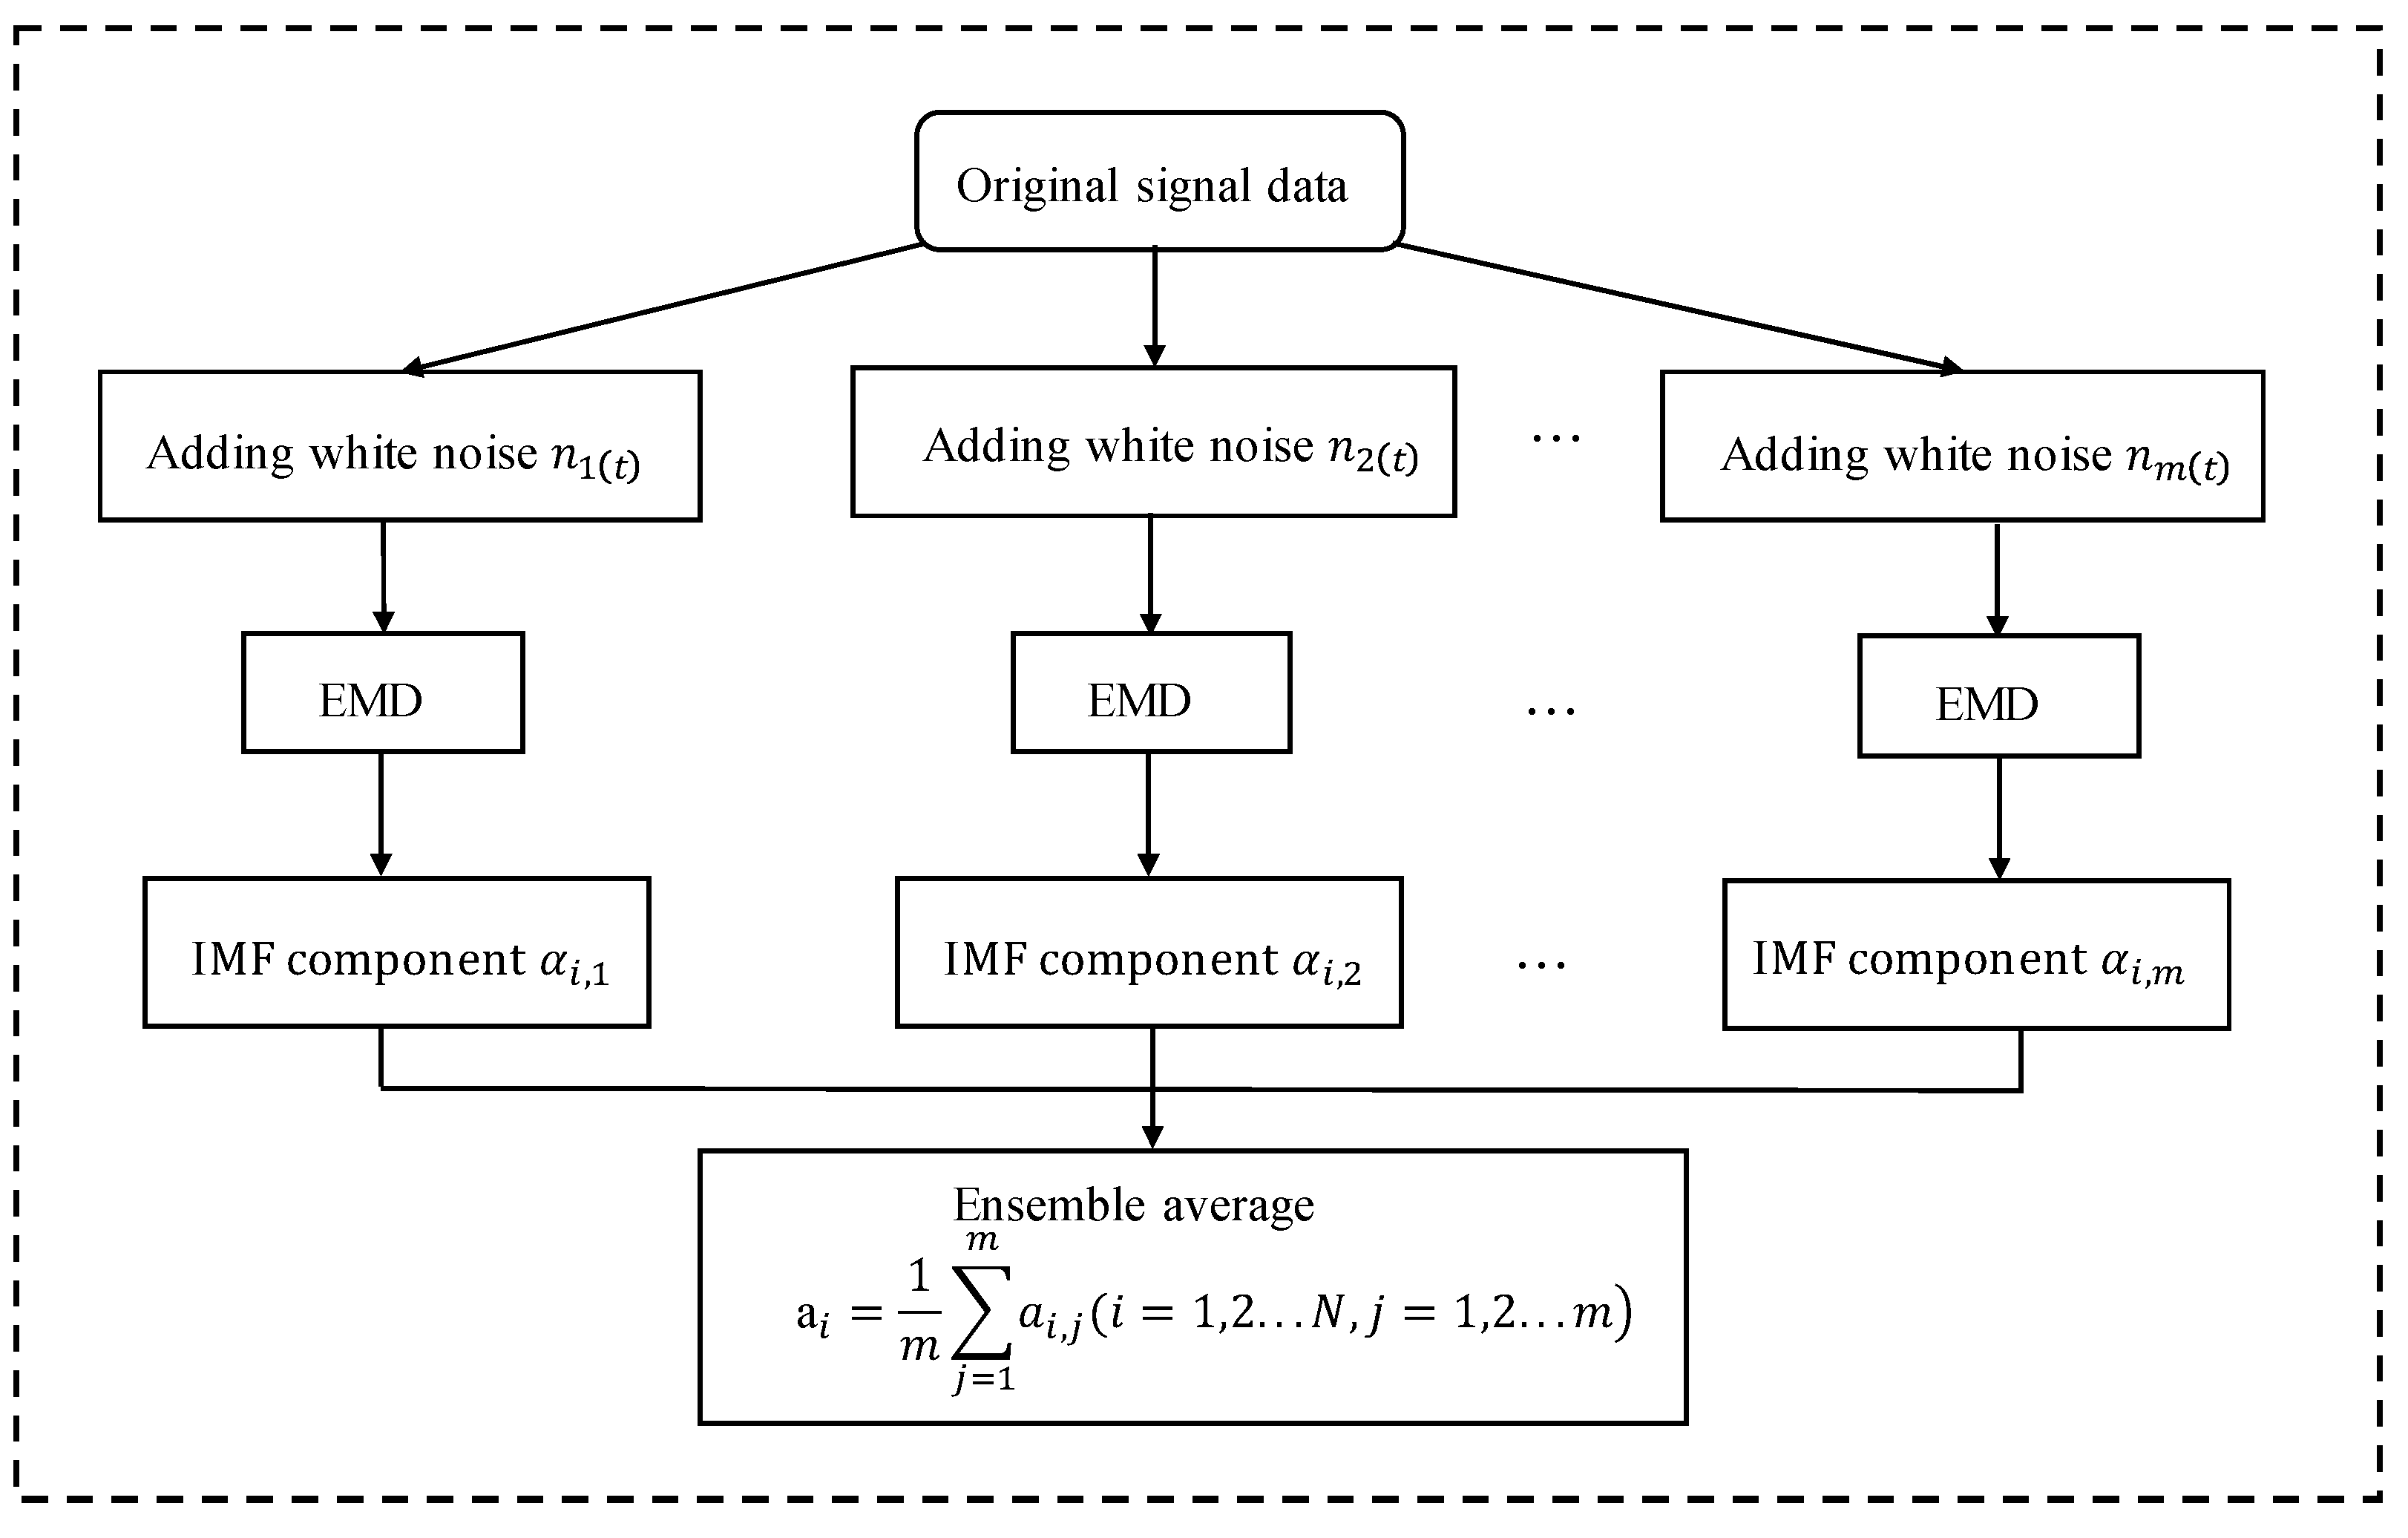
2.1. Ensemble Empirical Mode Decomposition
- (1).
- Setting the original signals’ processing times to be equal, m;
- (2).
- Adding random white noise of different amplitudes to each of these m original signals to form a new series of signals;
- (3).
- Performing EMD decomposition on each of these new signals to obtain a series of IMF components;
- (4).
- The EEMD decomposition results are obtained by averaging the IMF components of the corresponding modes separately.
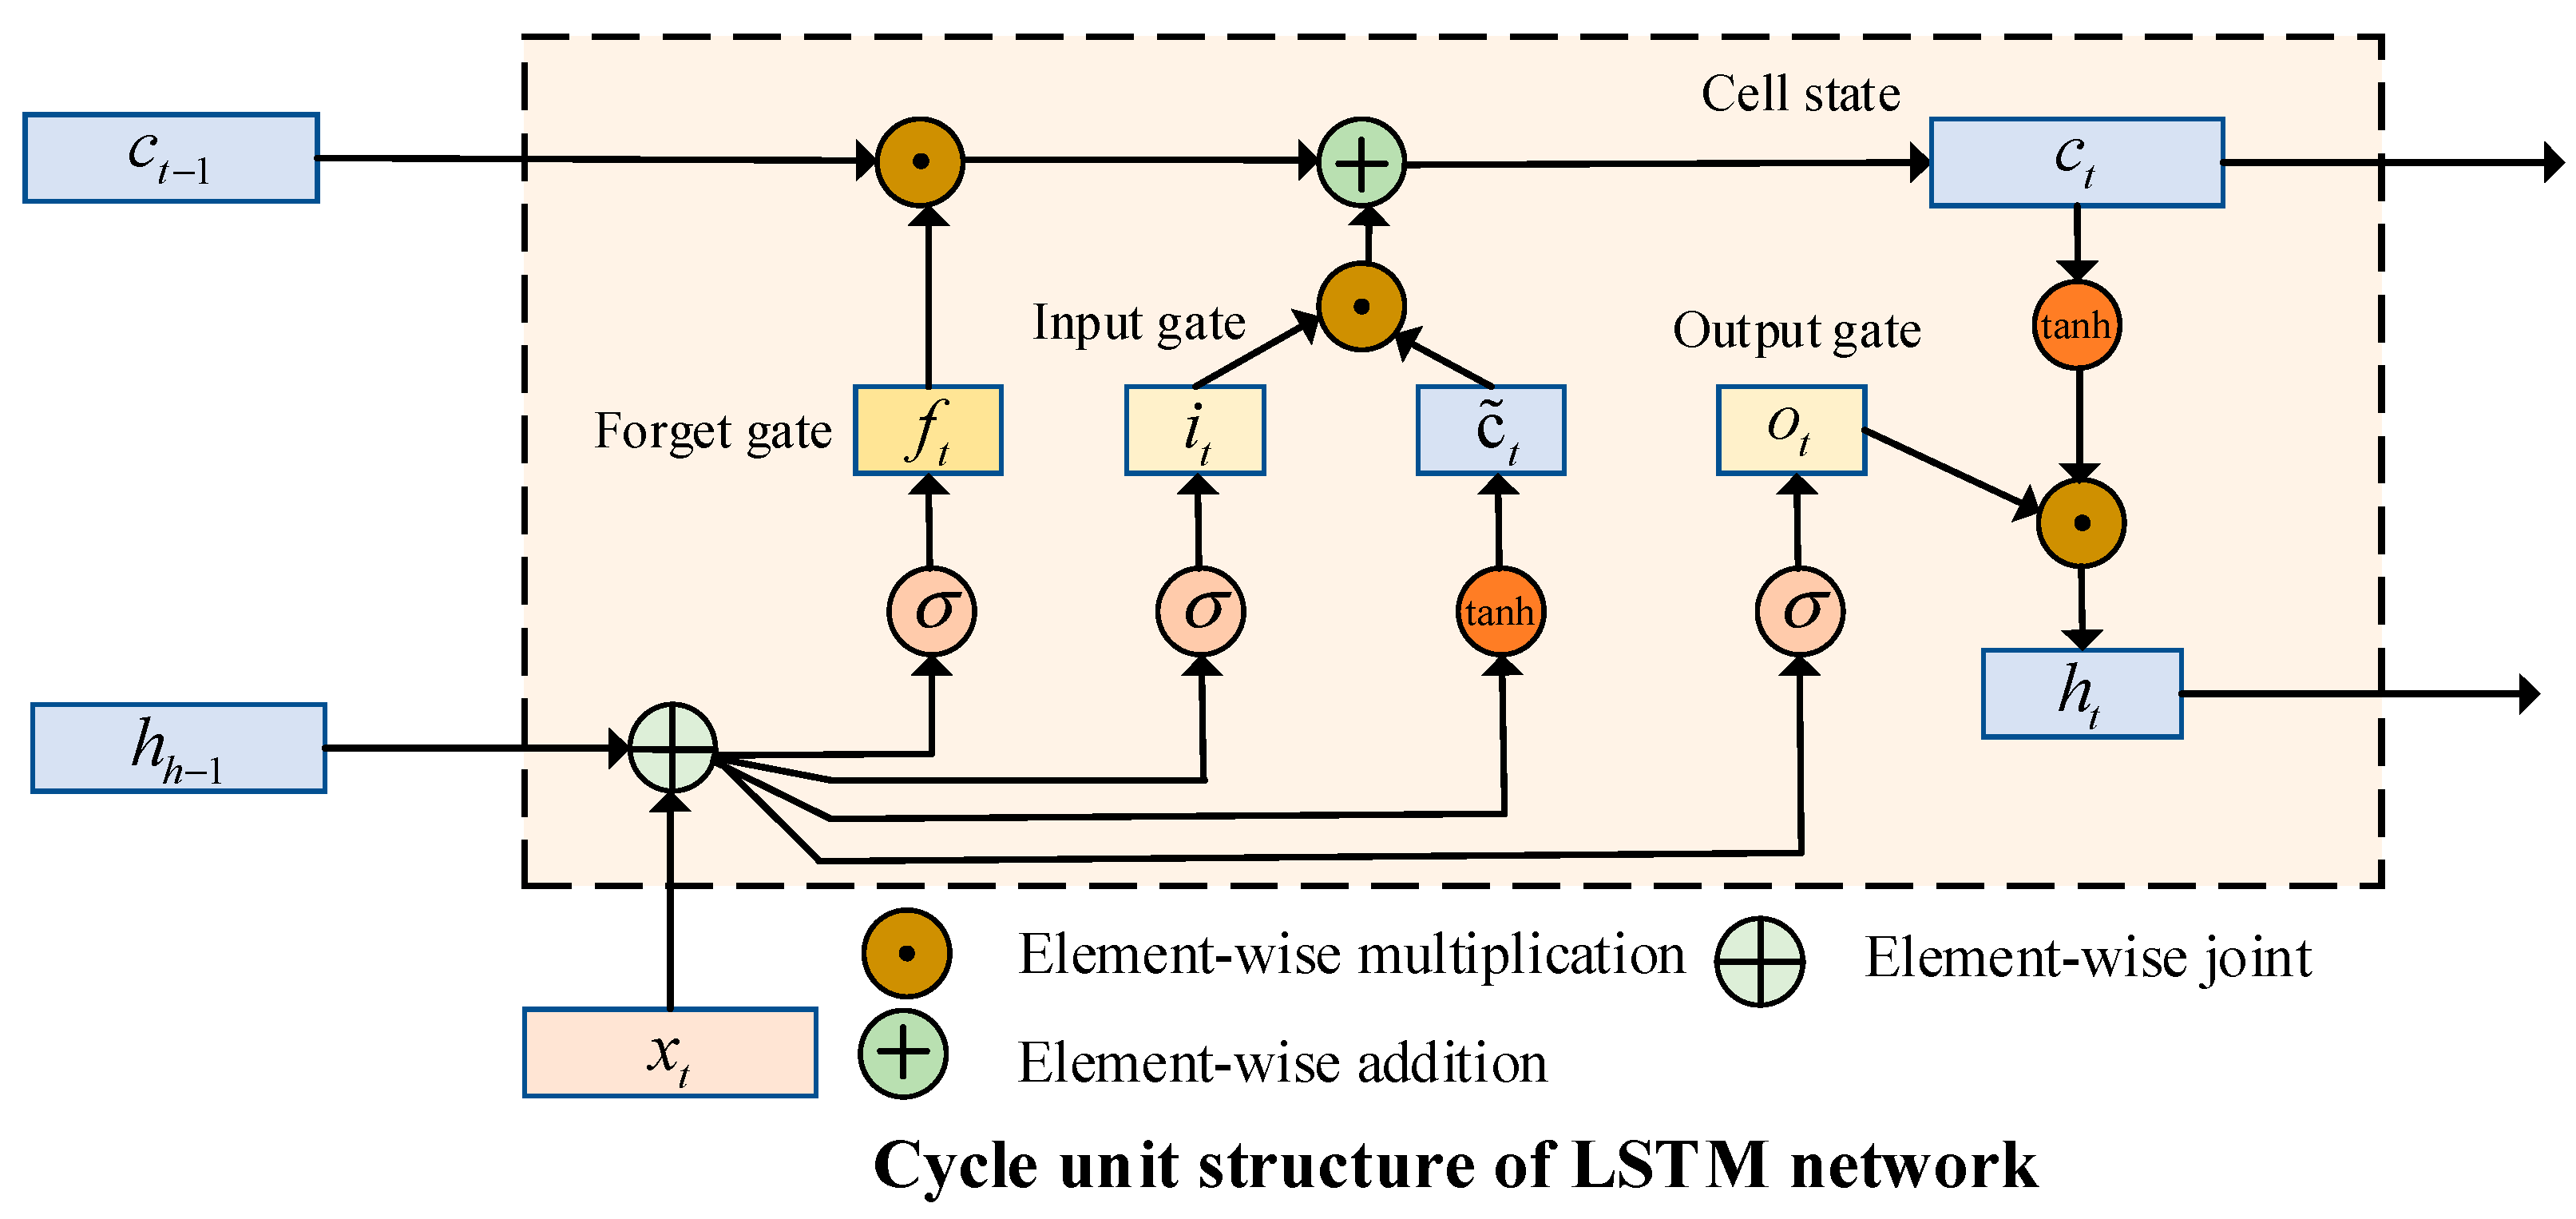
2.2. Long Short-Term Memory
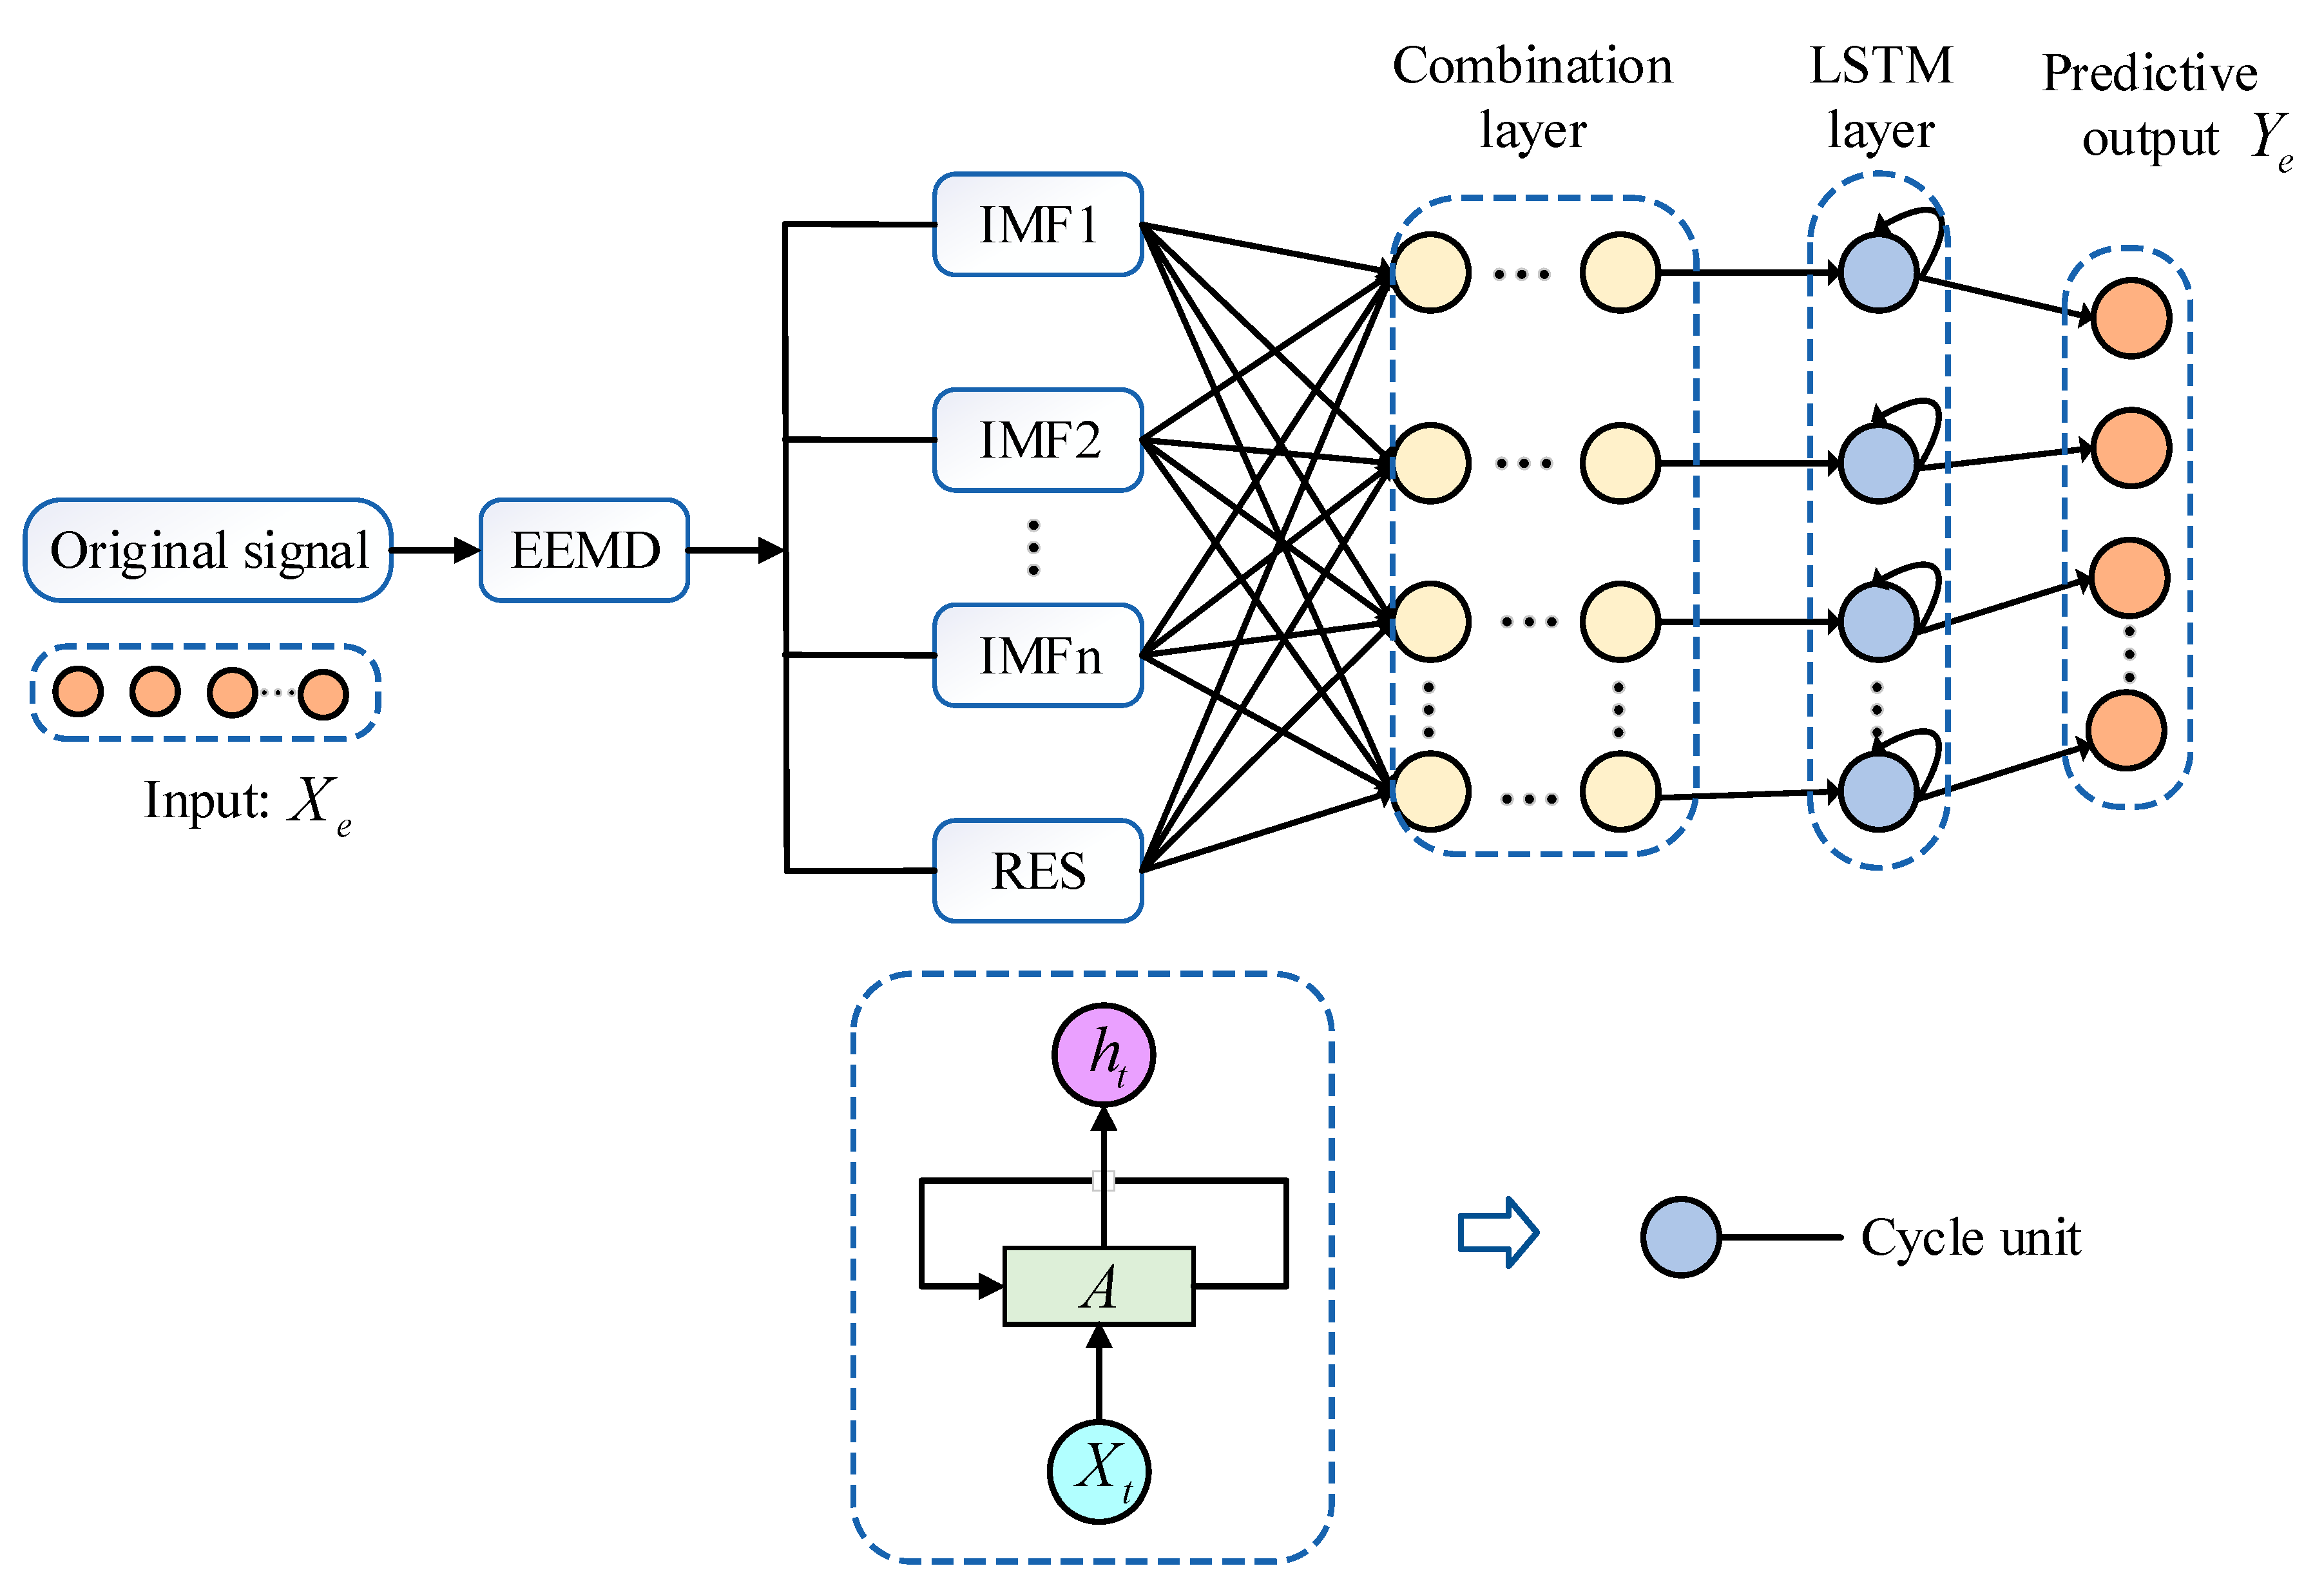
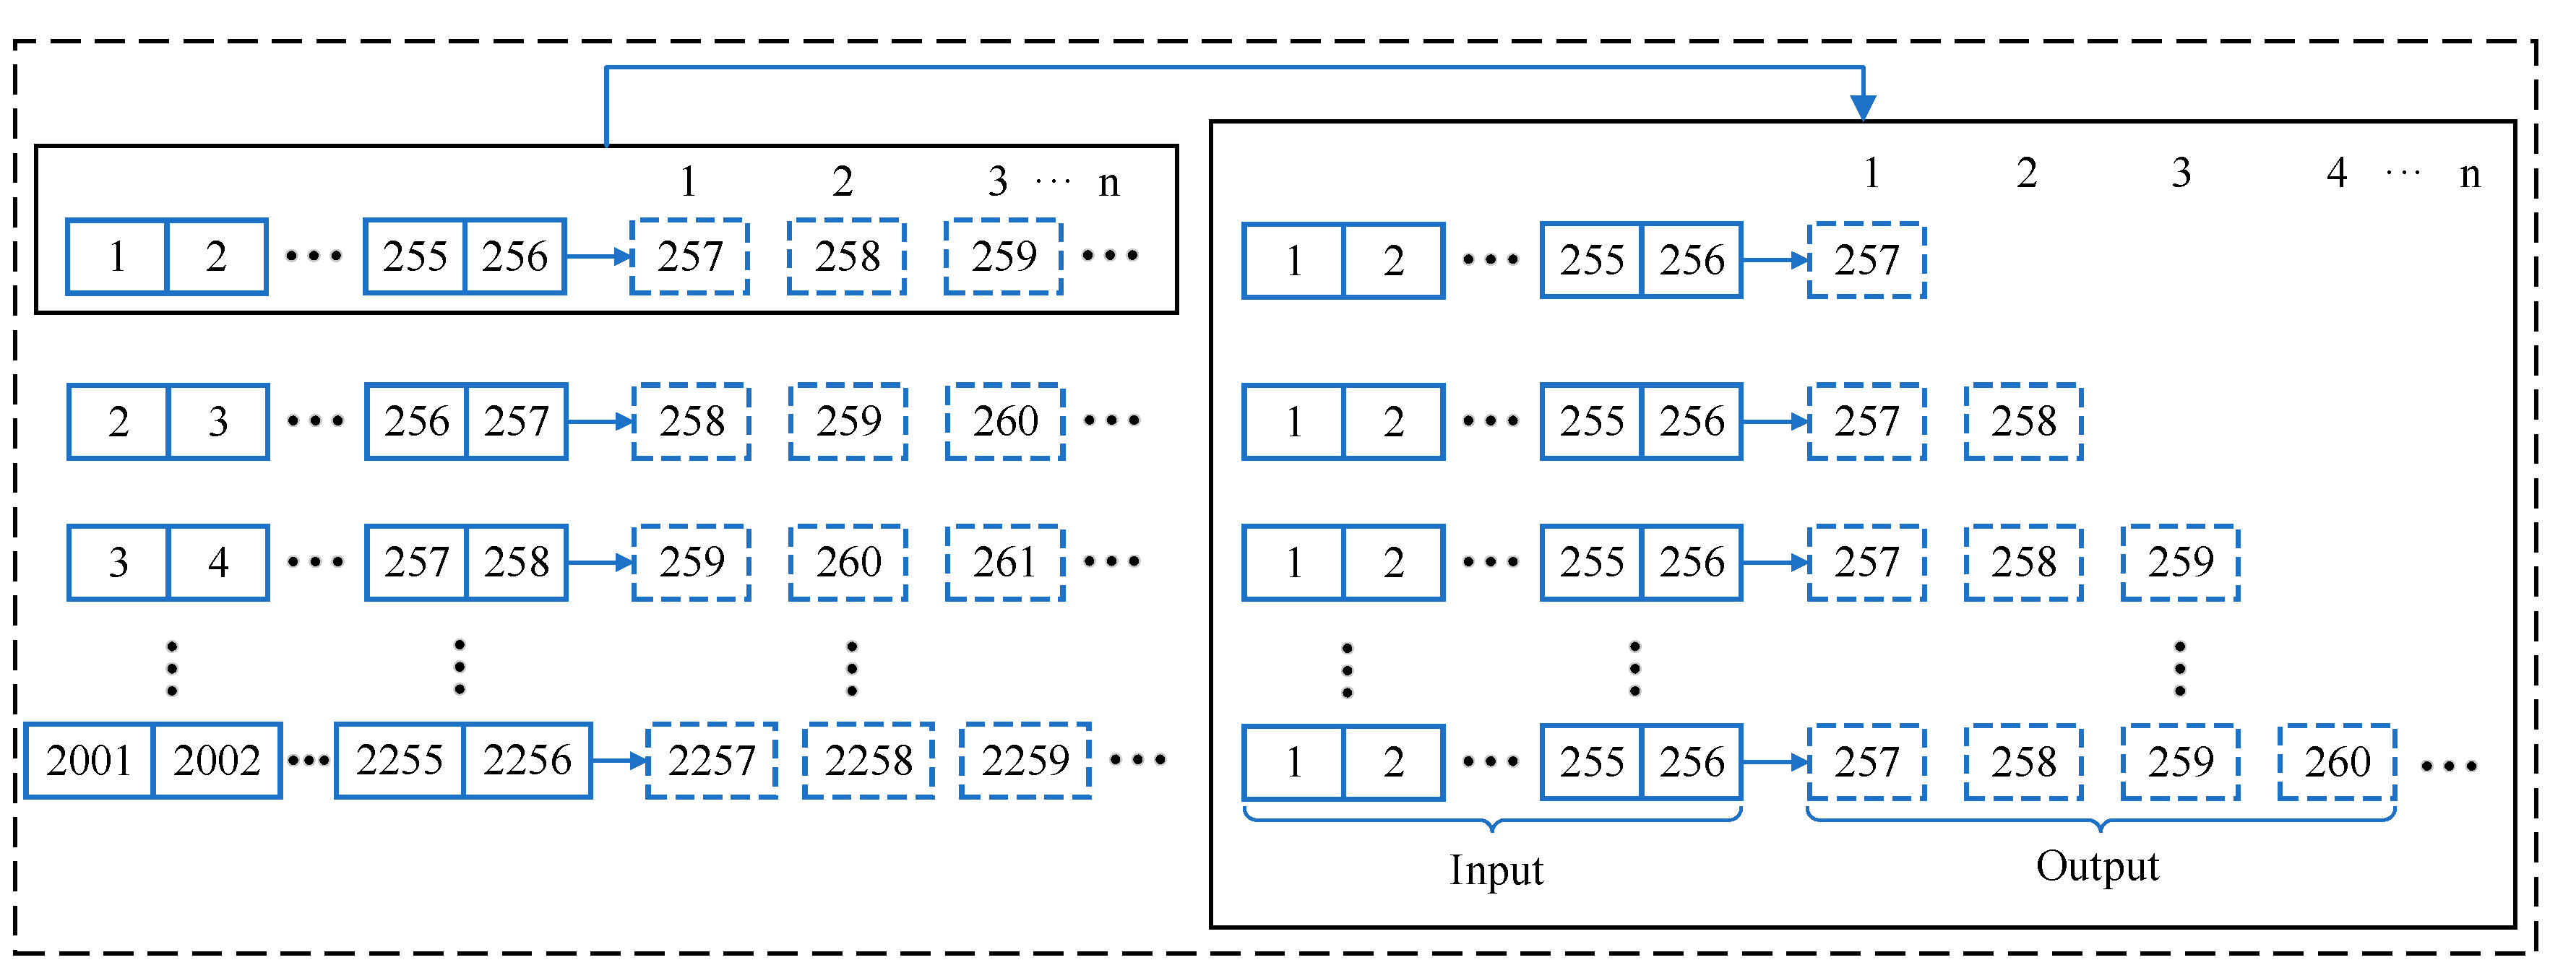
2.3. The Procedure of the Proposed Method
- (1).
- The use of the algorithm to decompose the original measured signal data can enhance the robustness of prediction;
- (2).
- The LSTM in the framework of the proposed method can make full use of the long-term correlation of the time series data;
- (3).
- The underlying EEMD-LSTM relies on a data-driven approach with no assumption restrictions on the input data.
3. Experimental Design and Evaluation Criteria
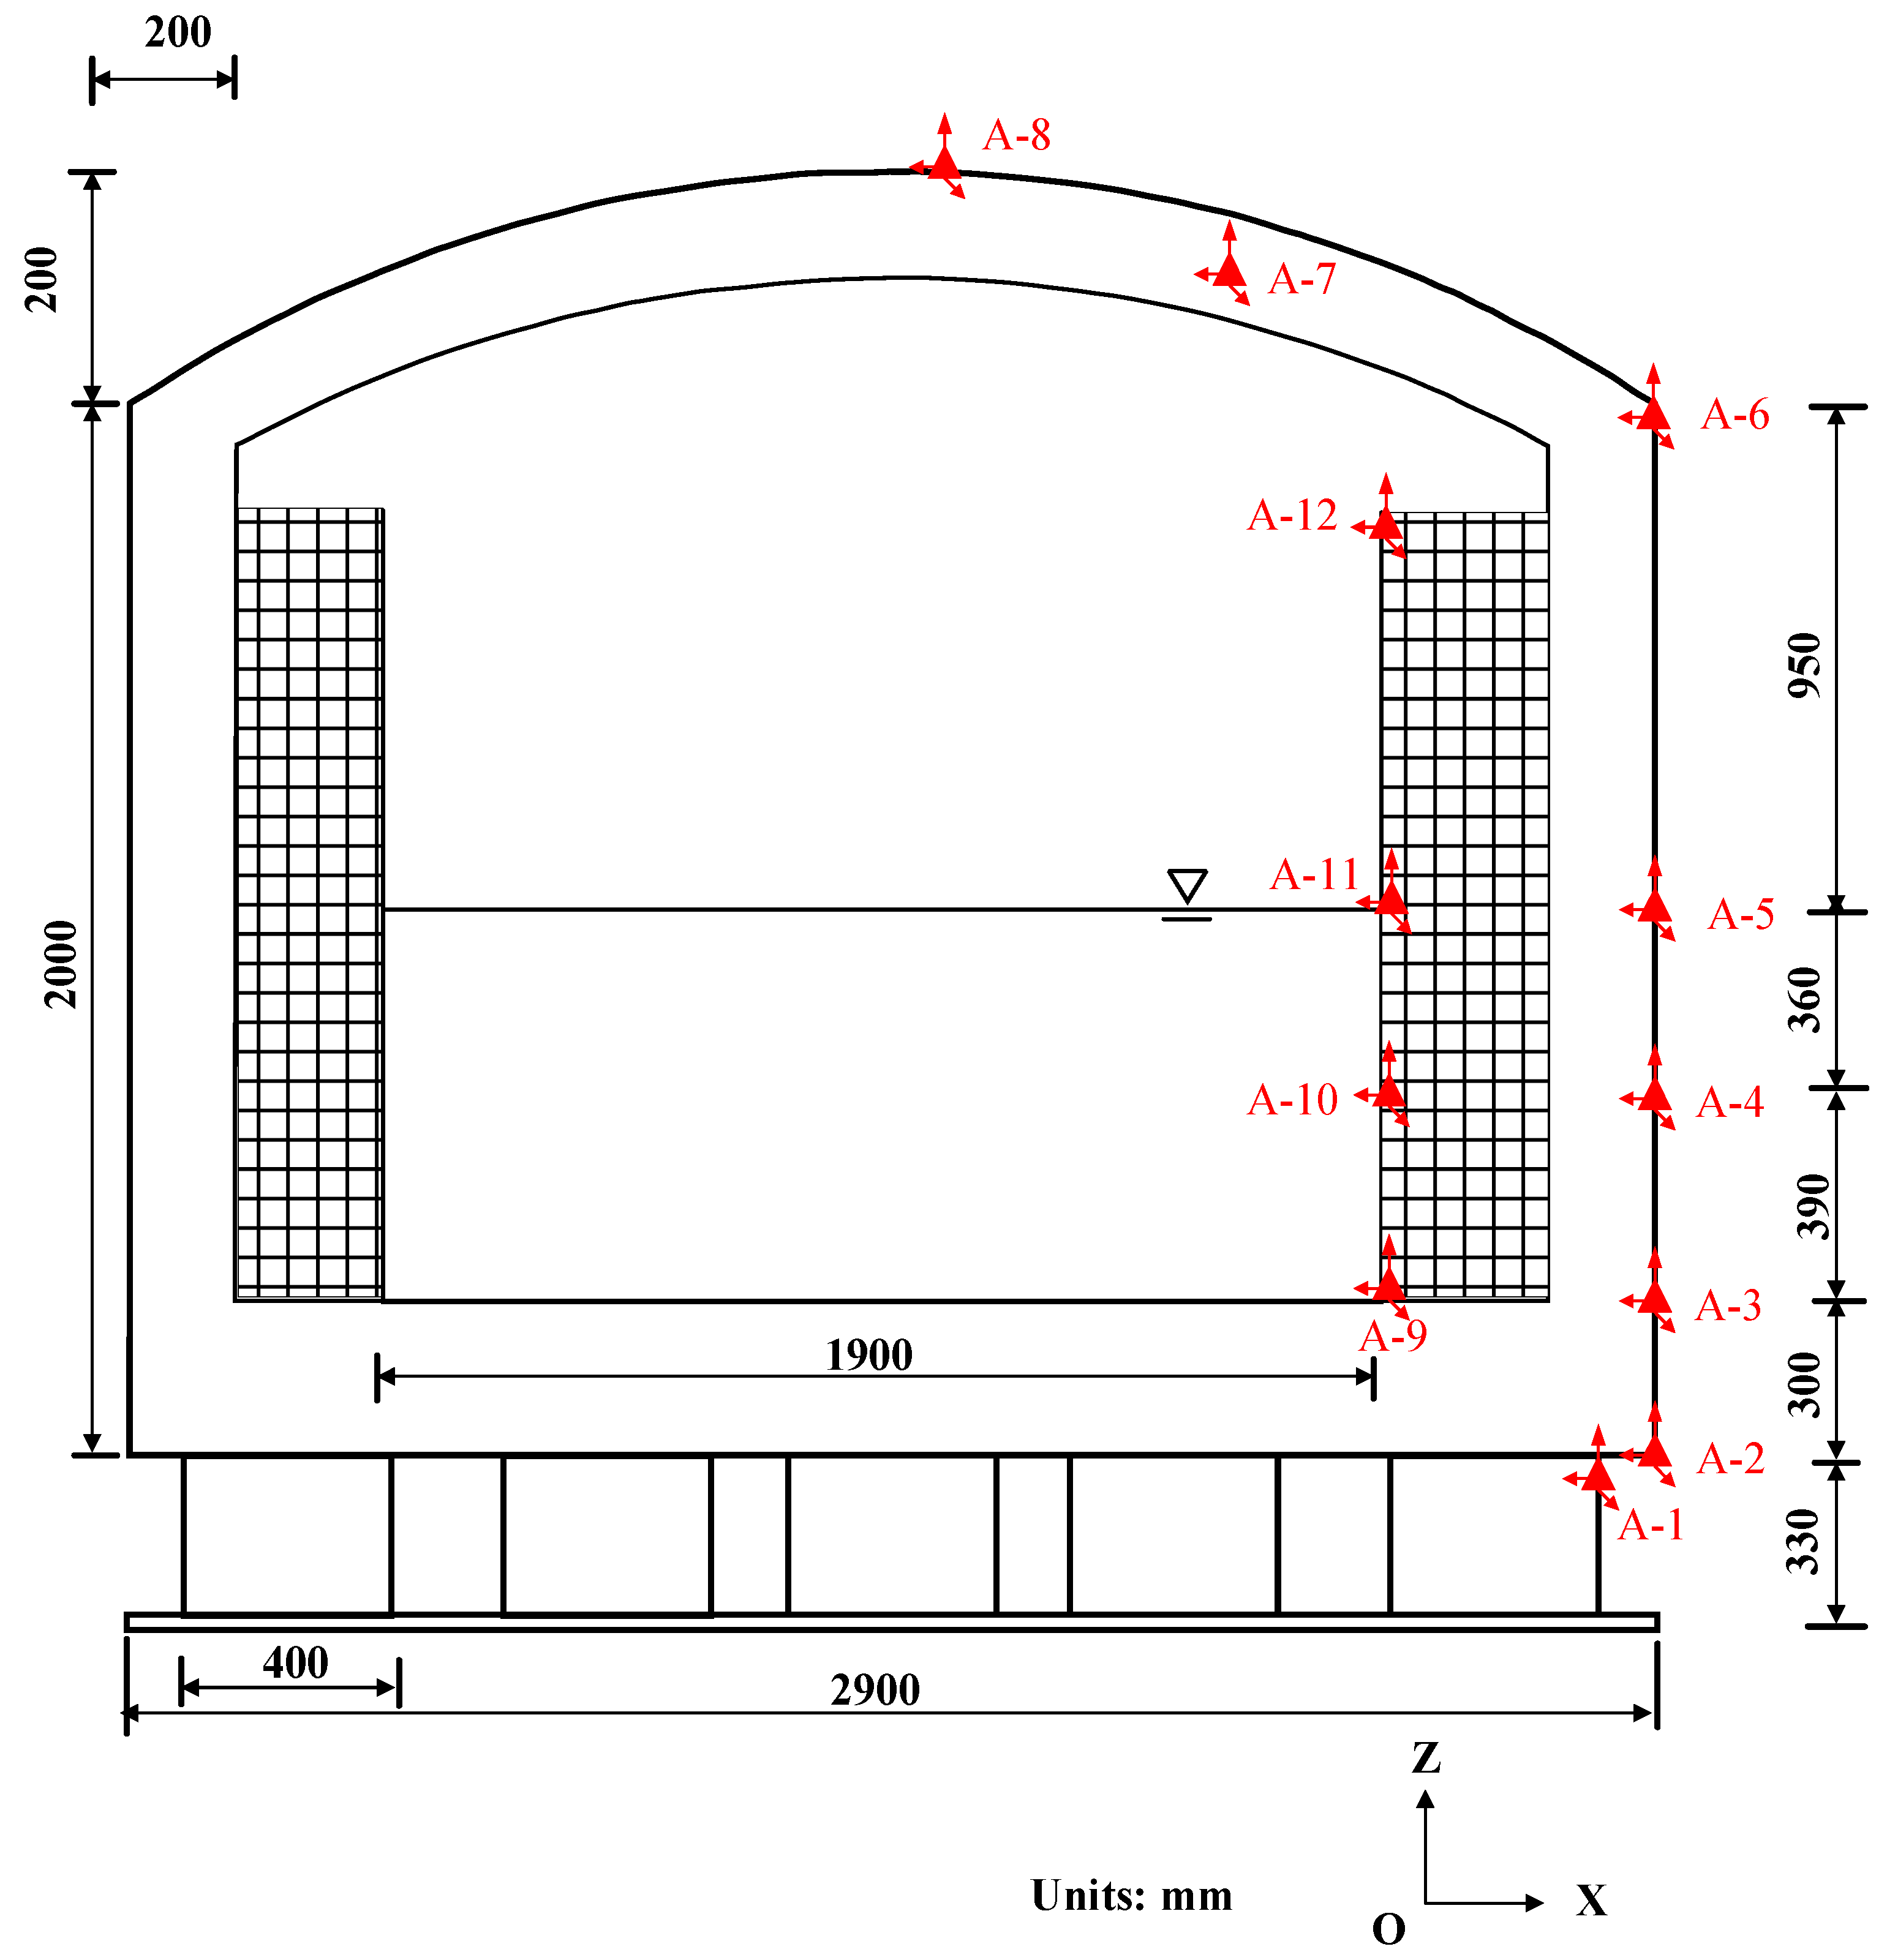
3.1. Data Description
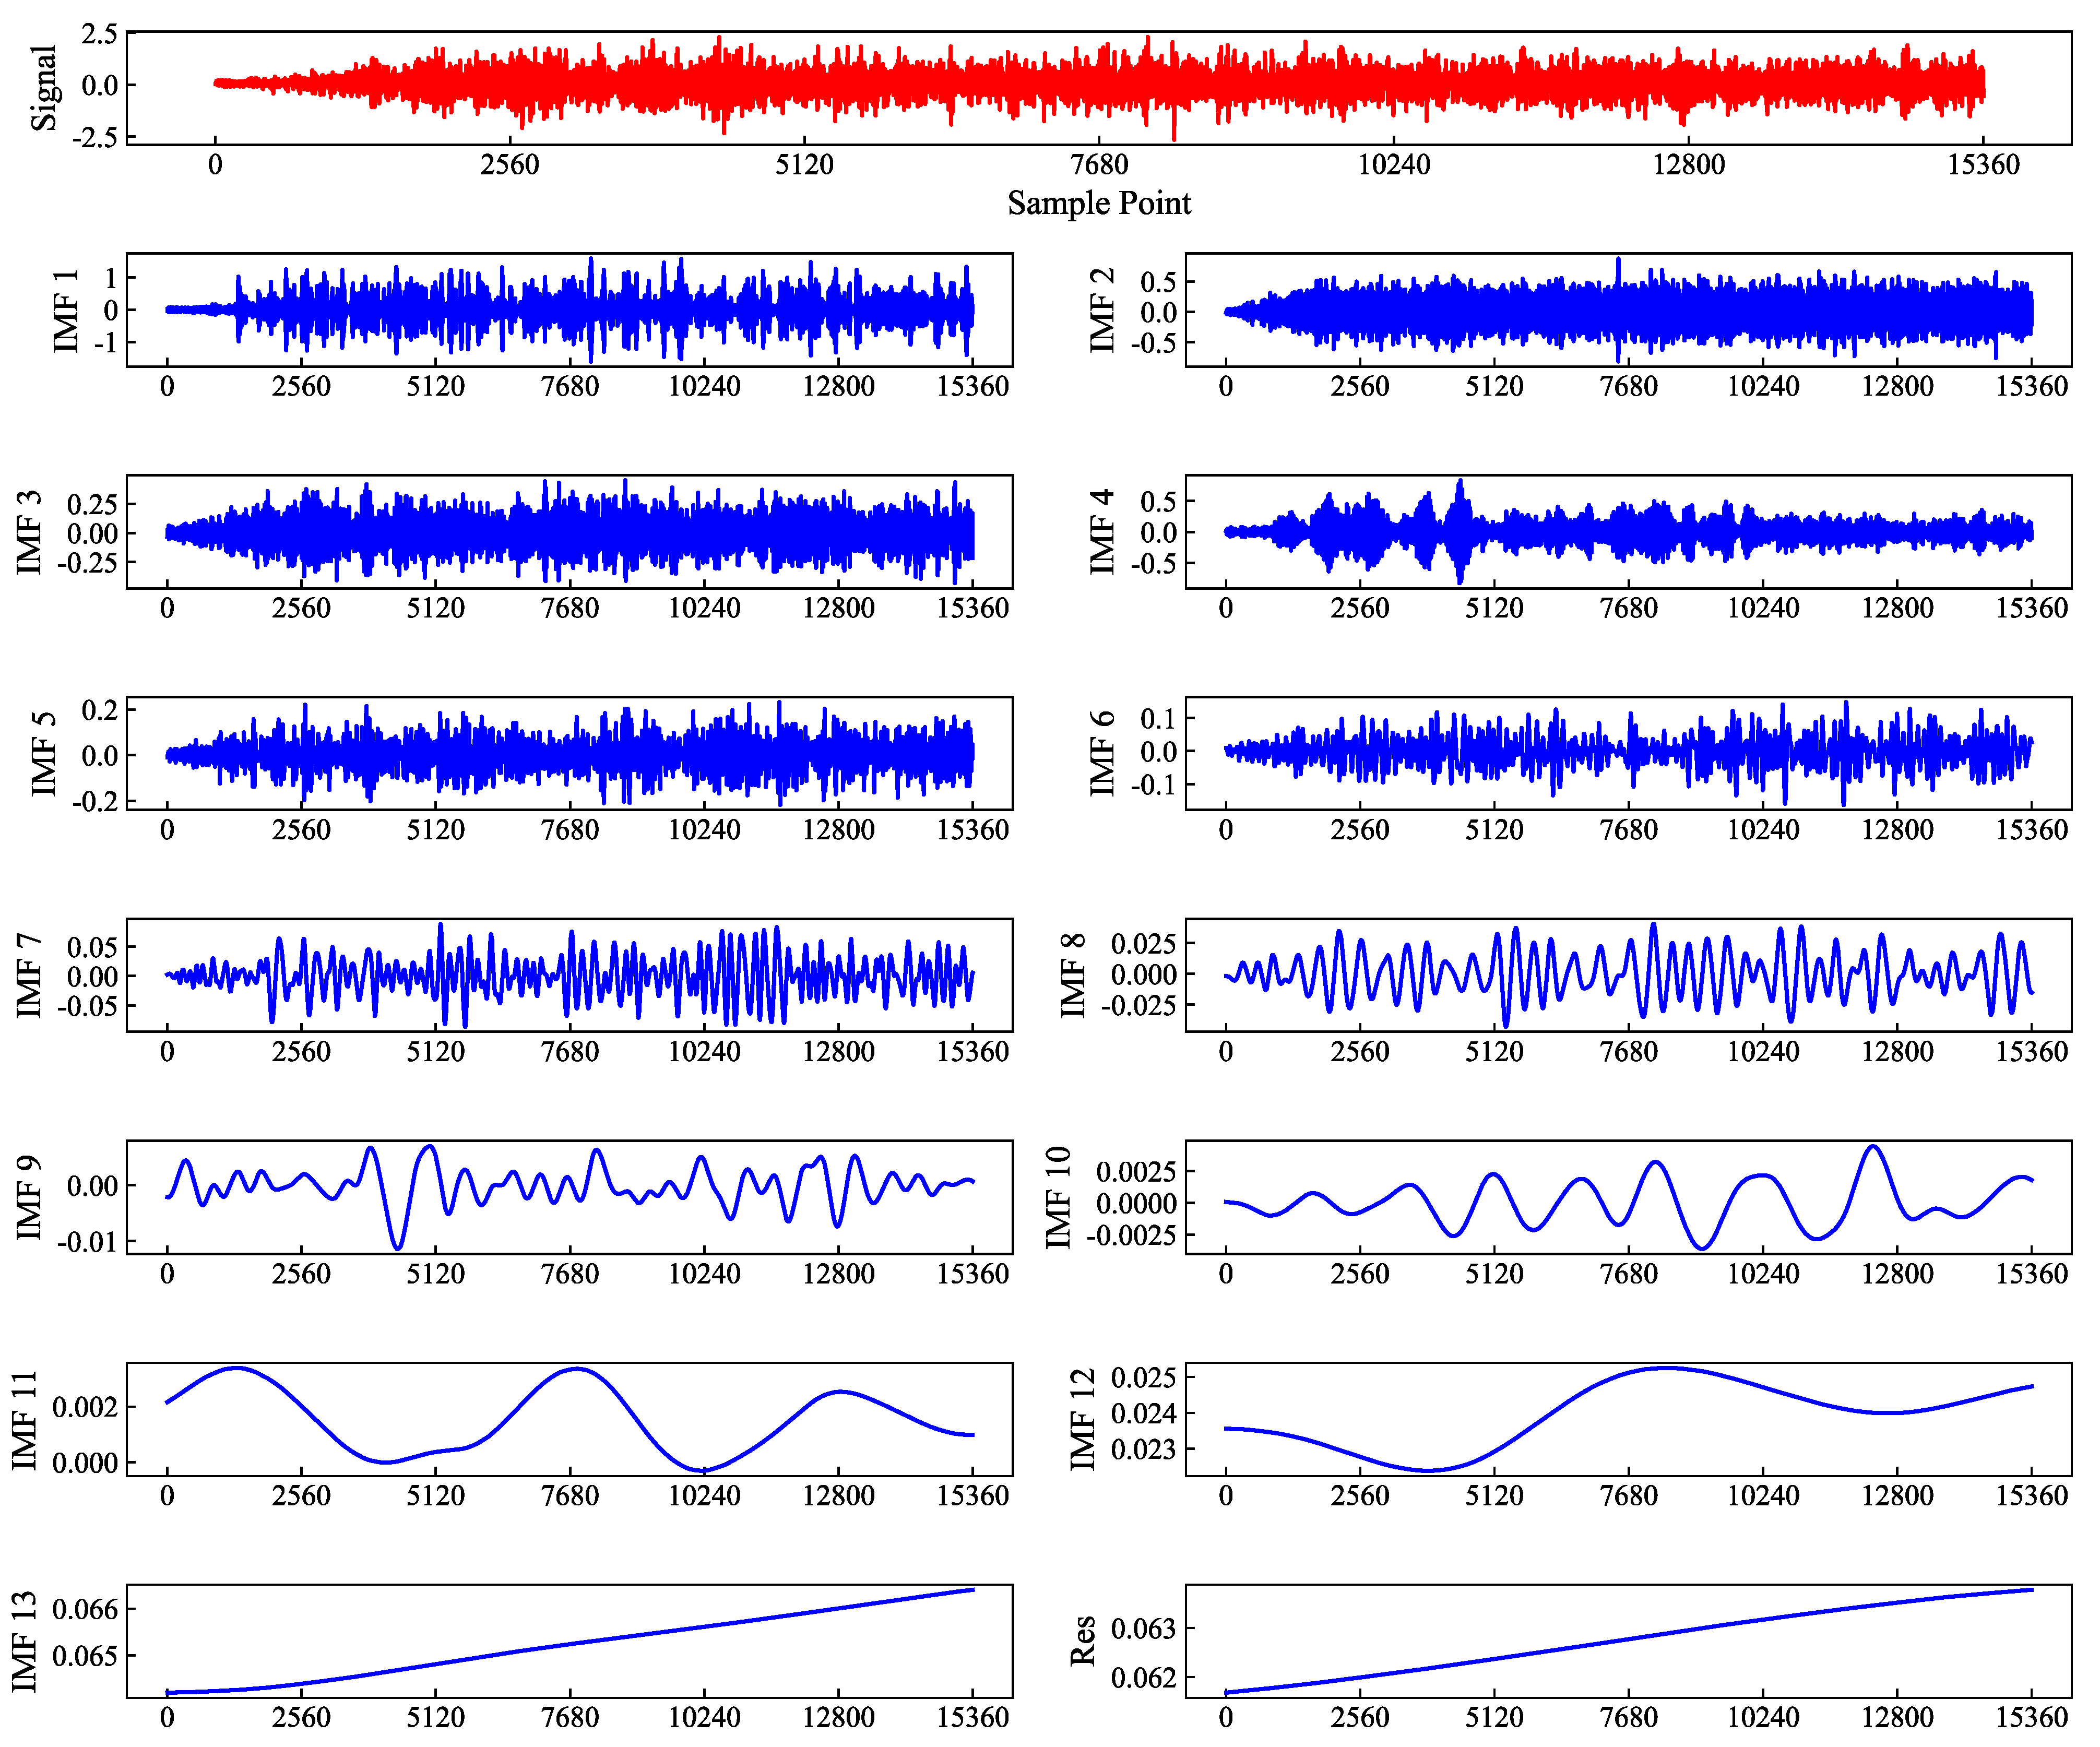
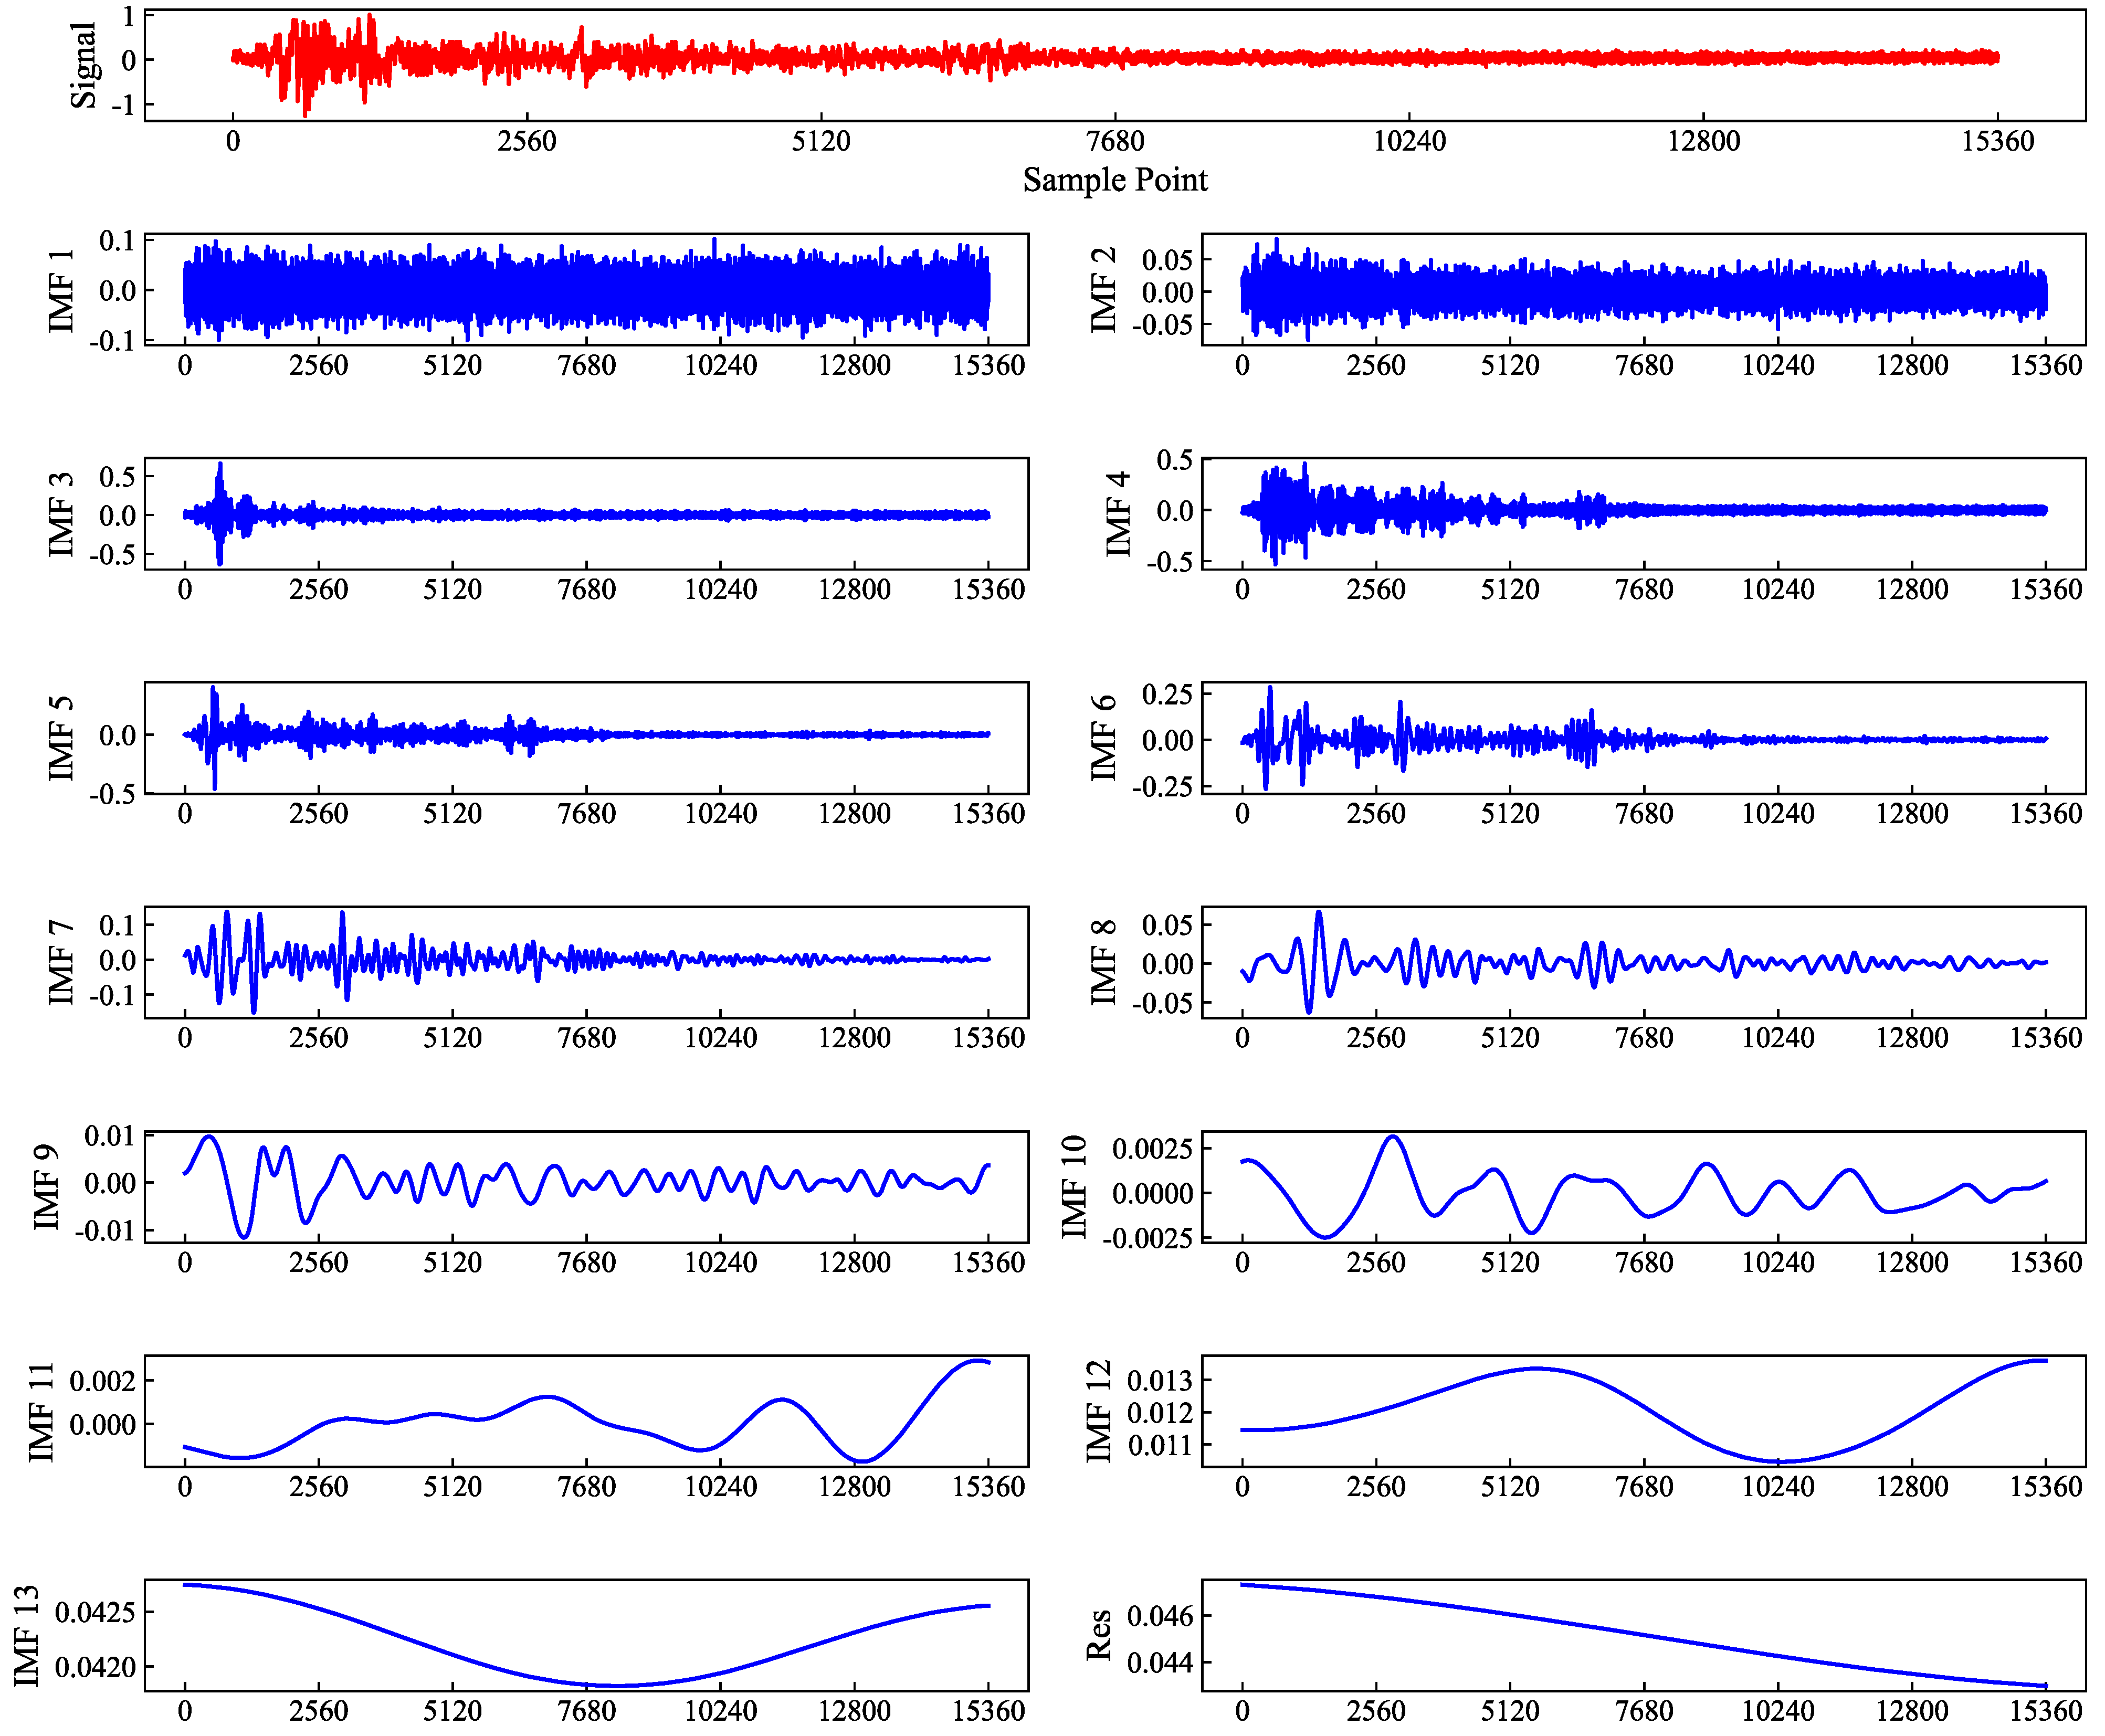
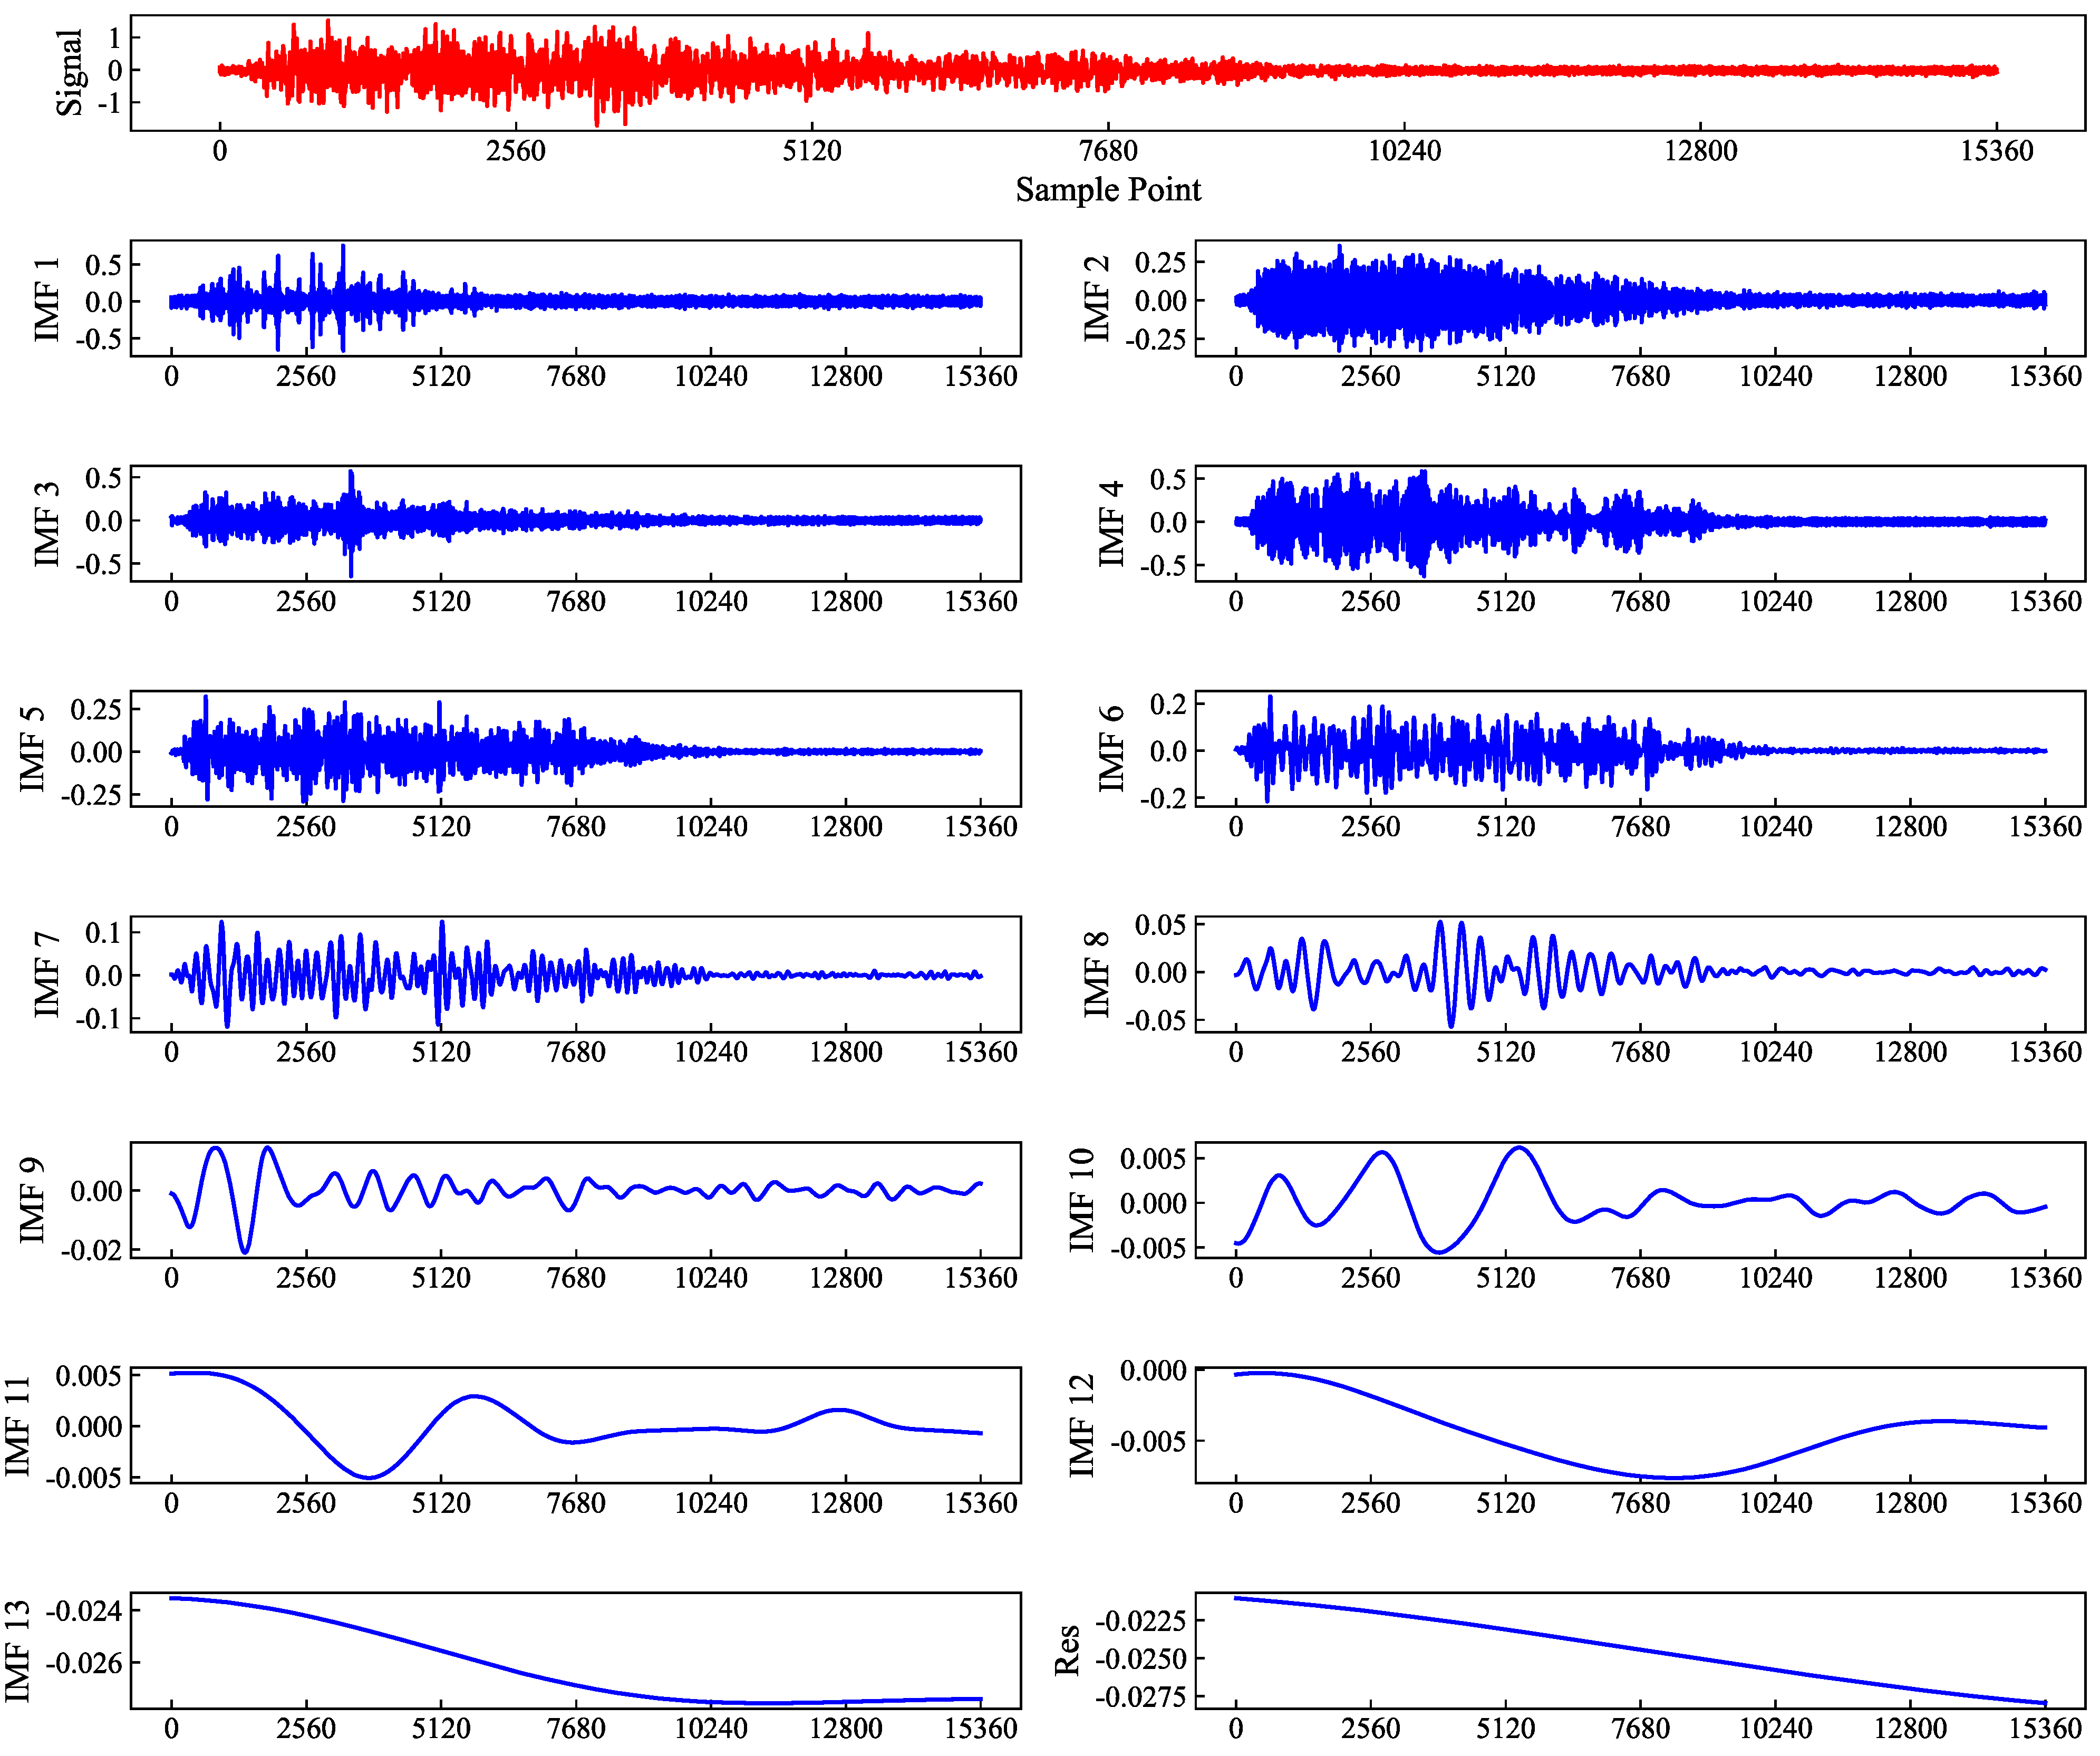
3.2. Acceleration Decomposition Based on EEMD
3.3. Parameters Selection
3.4. Evaluation Criteria
4. Comparative Analysis of the Results
4.1. Performance Evaluation of EEMD
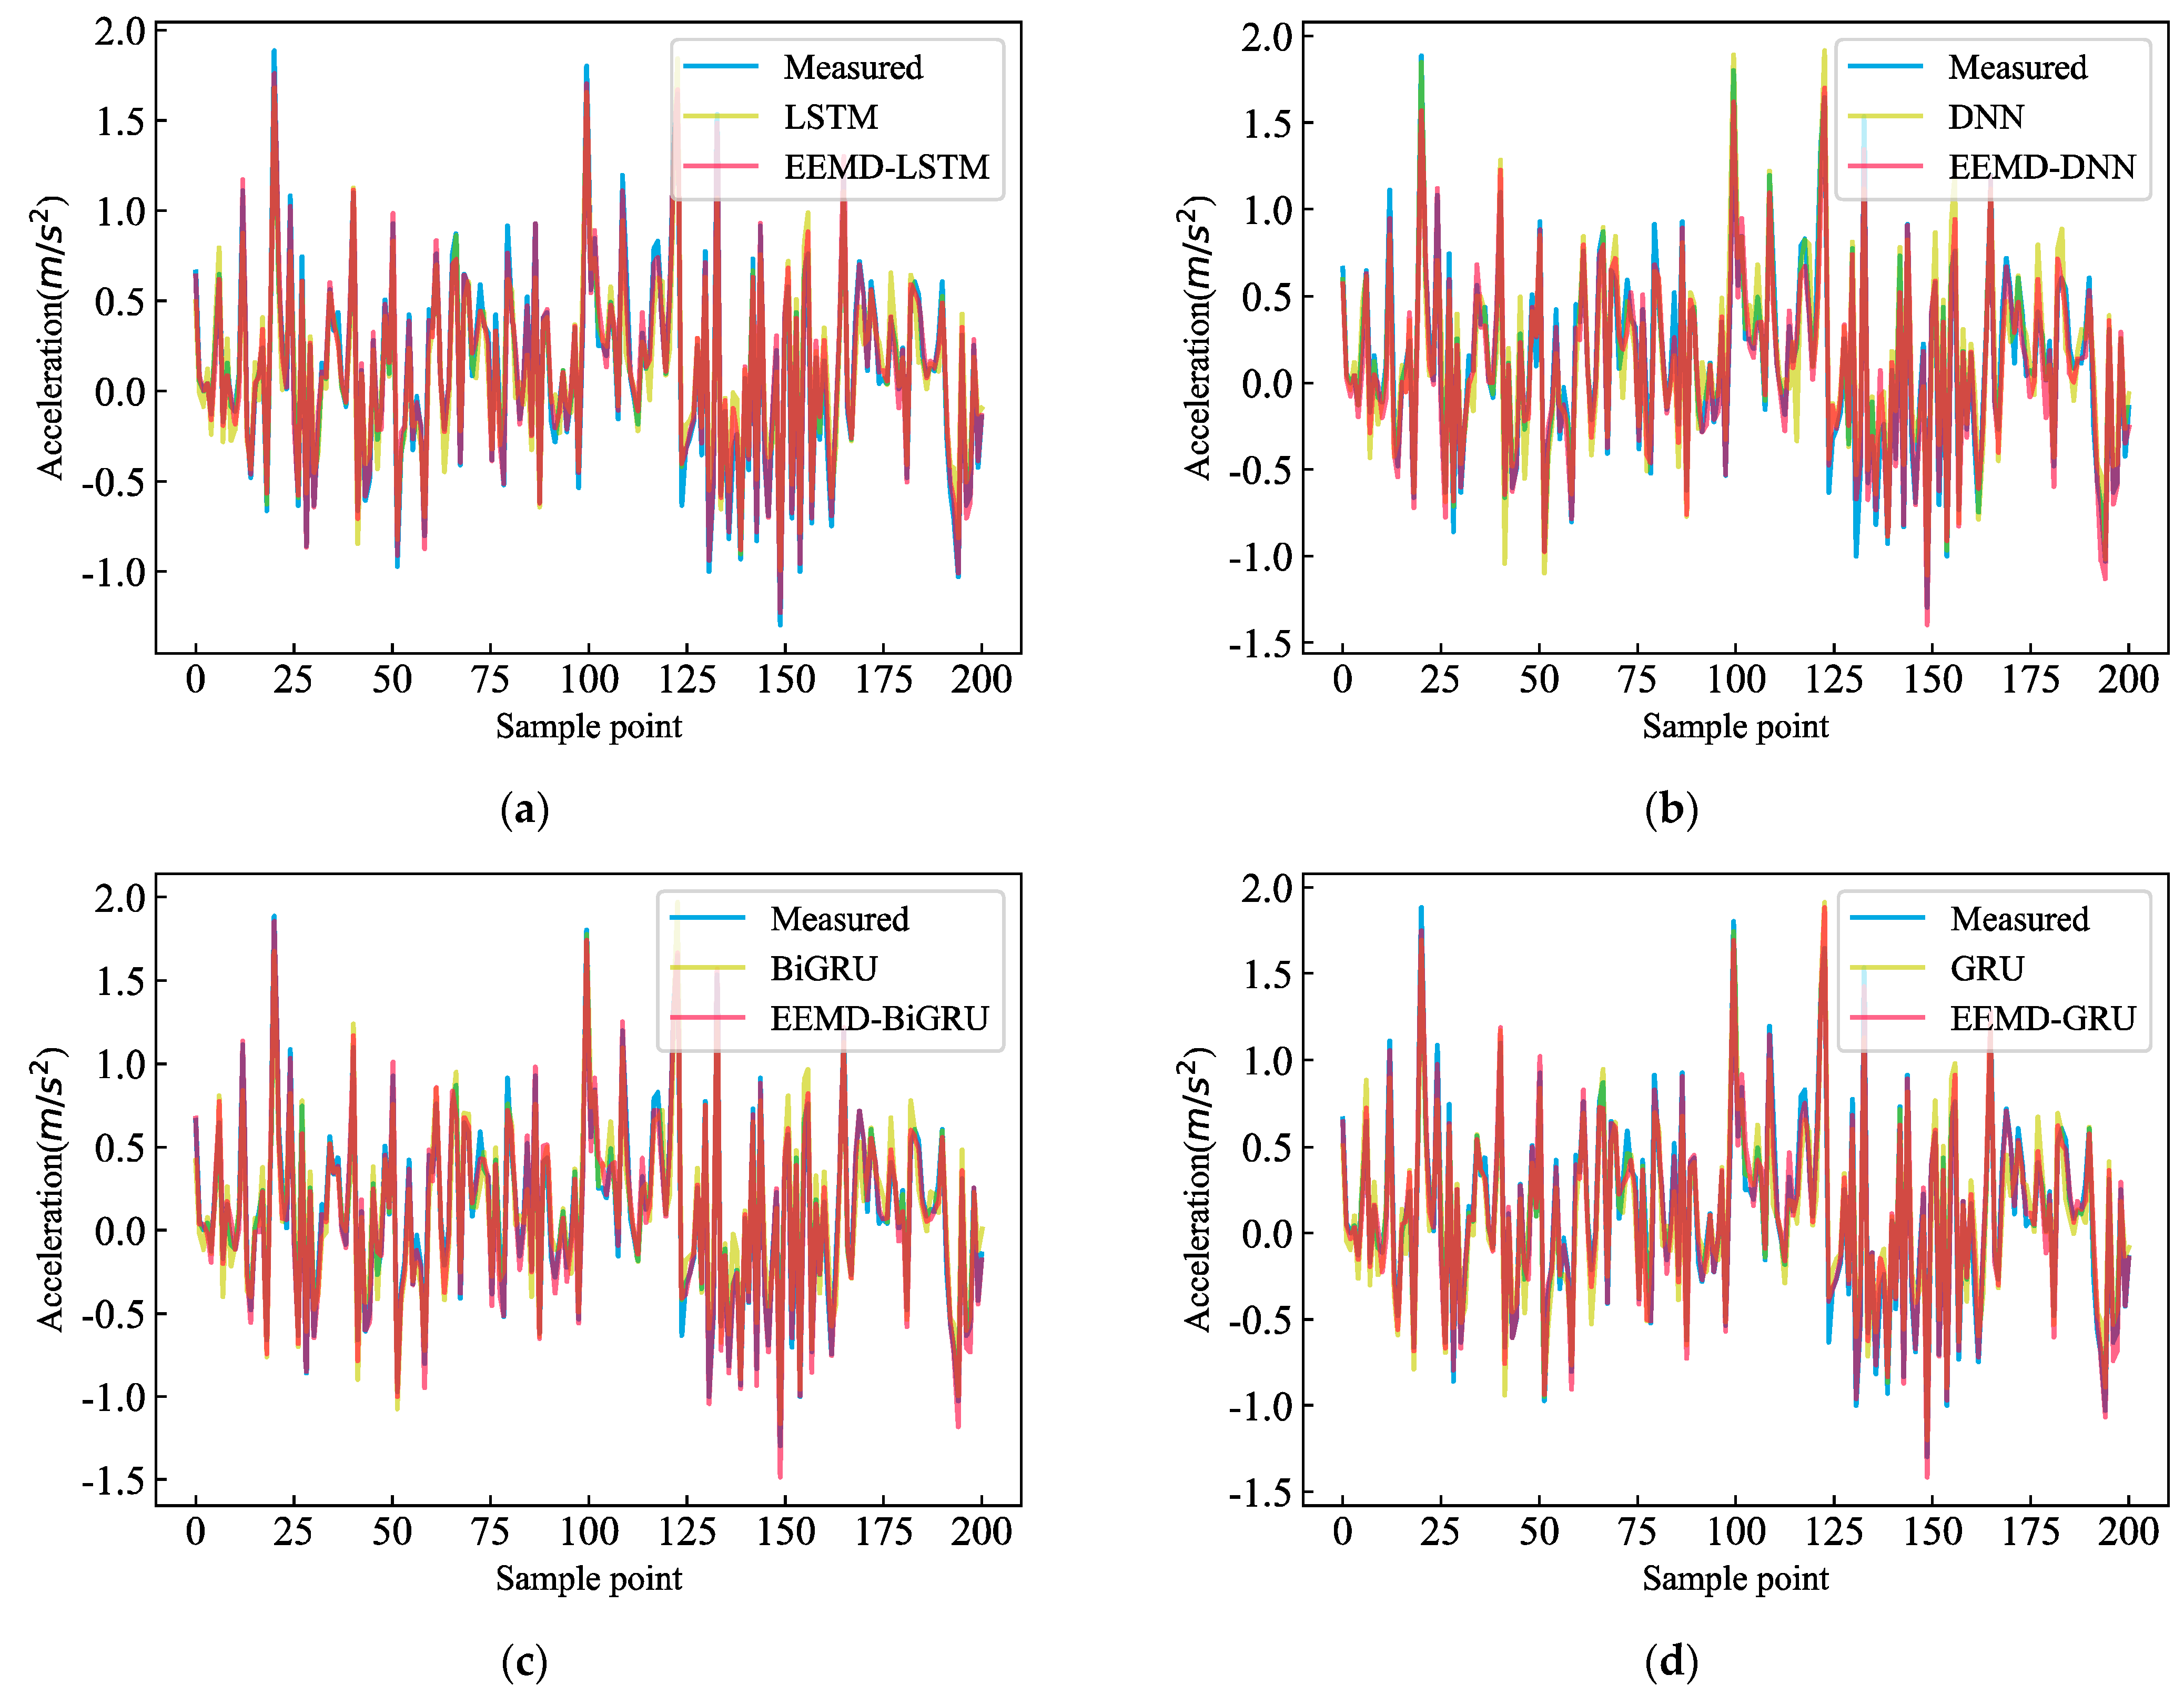
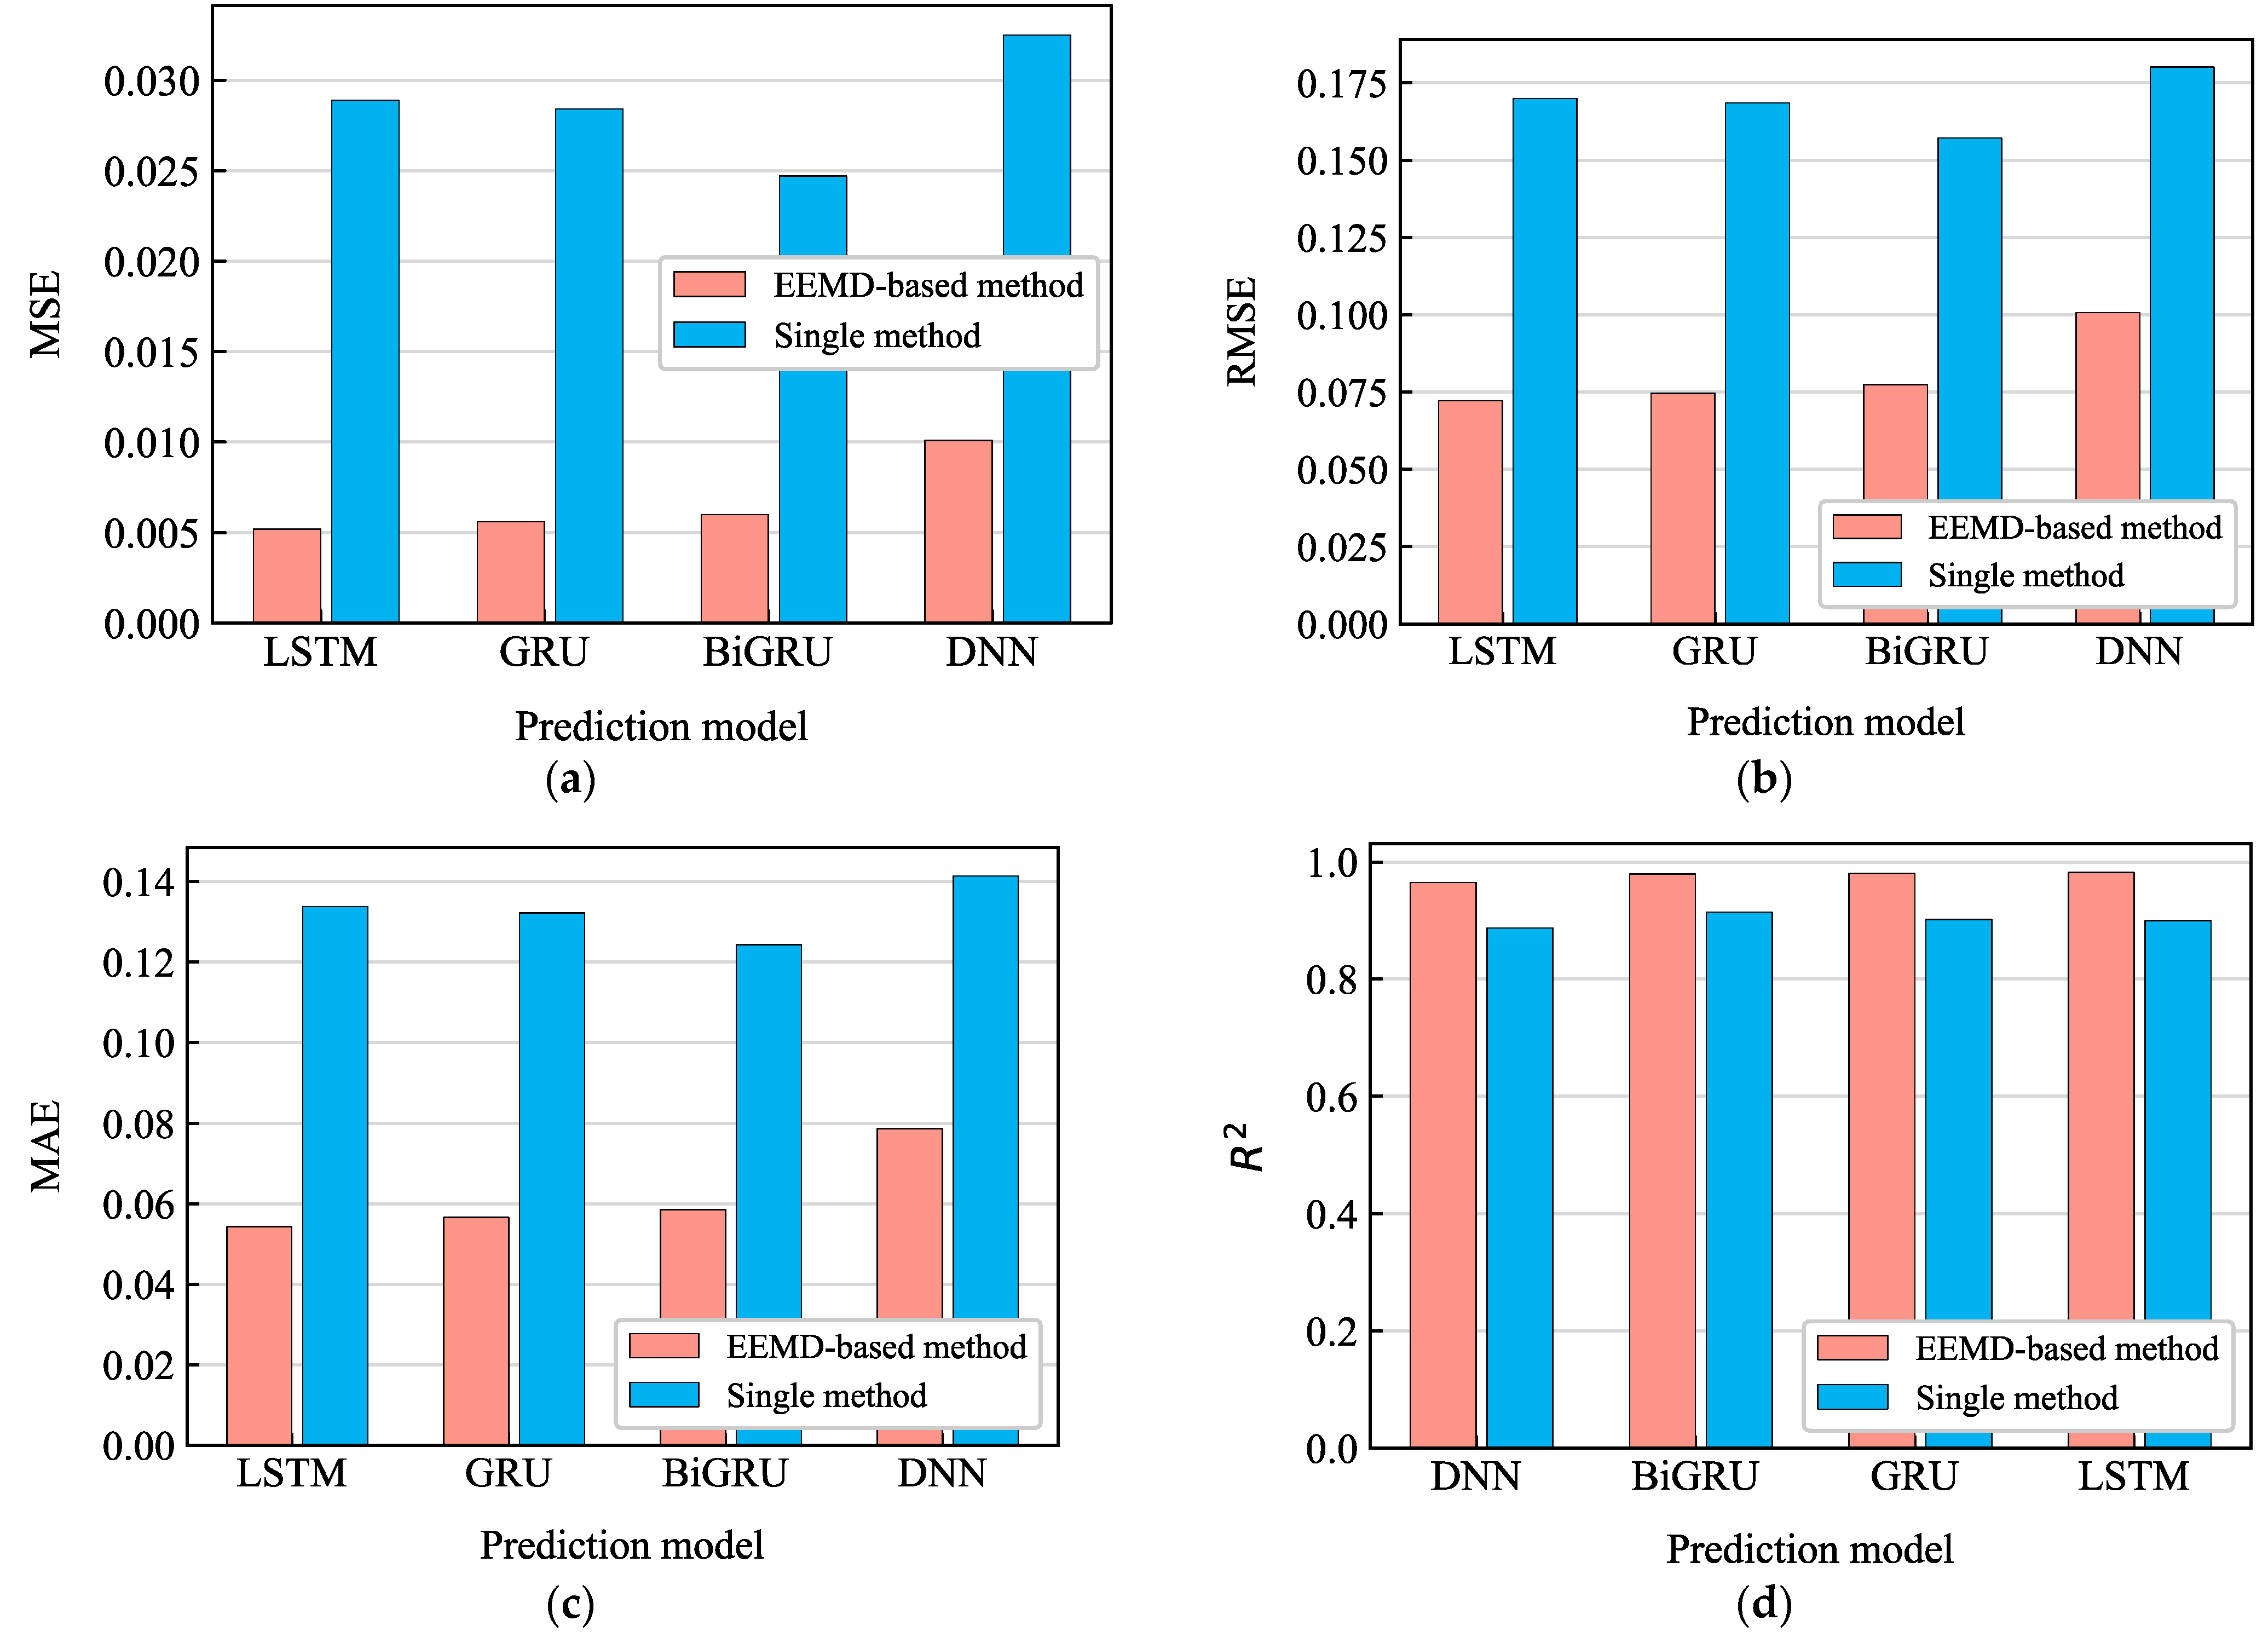
4.2. Performance Evaluation of the Proposed Models
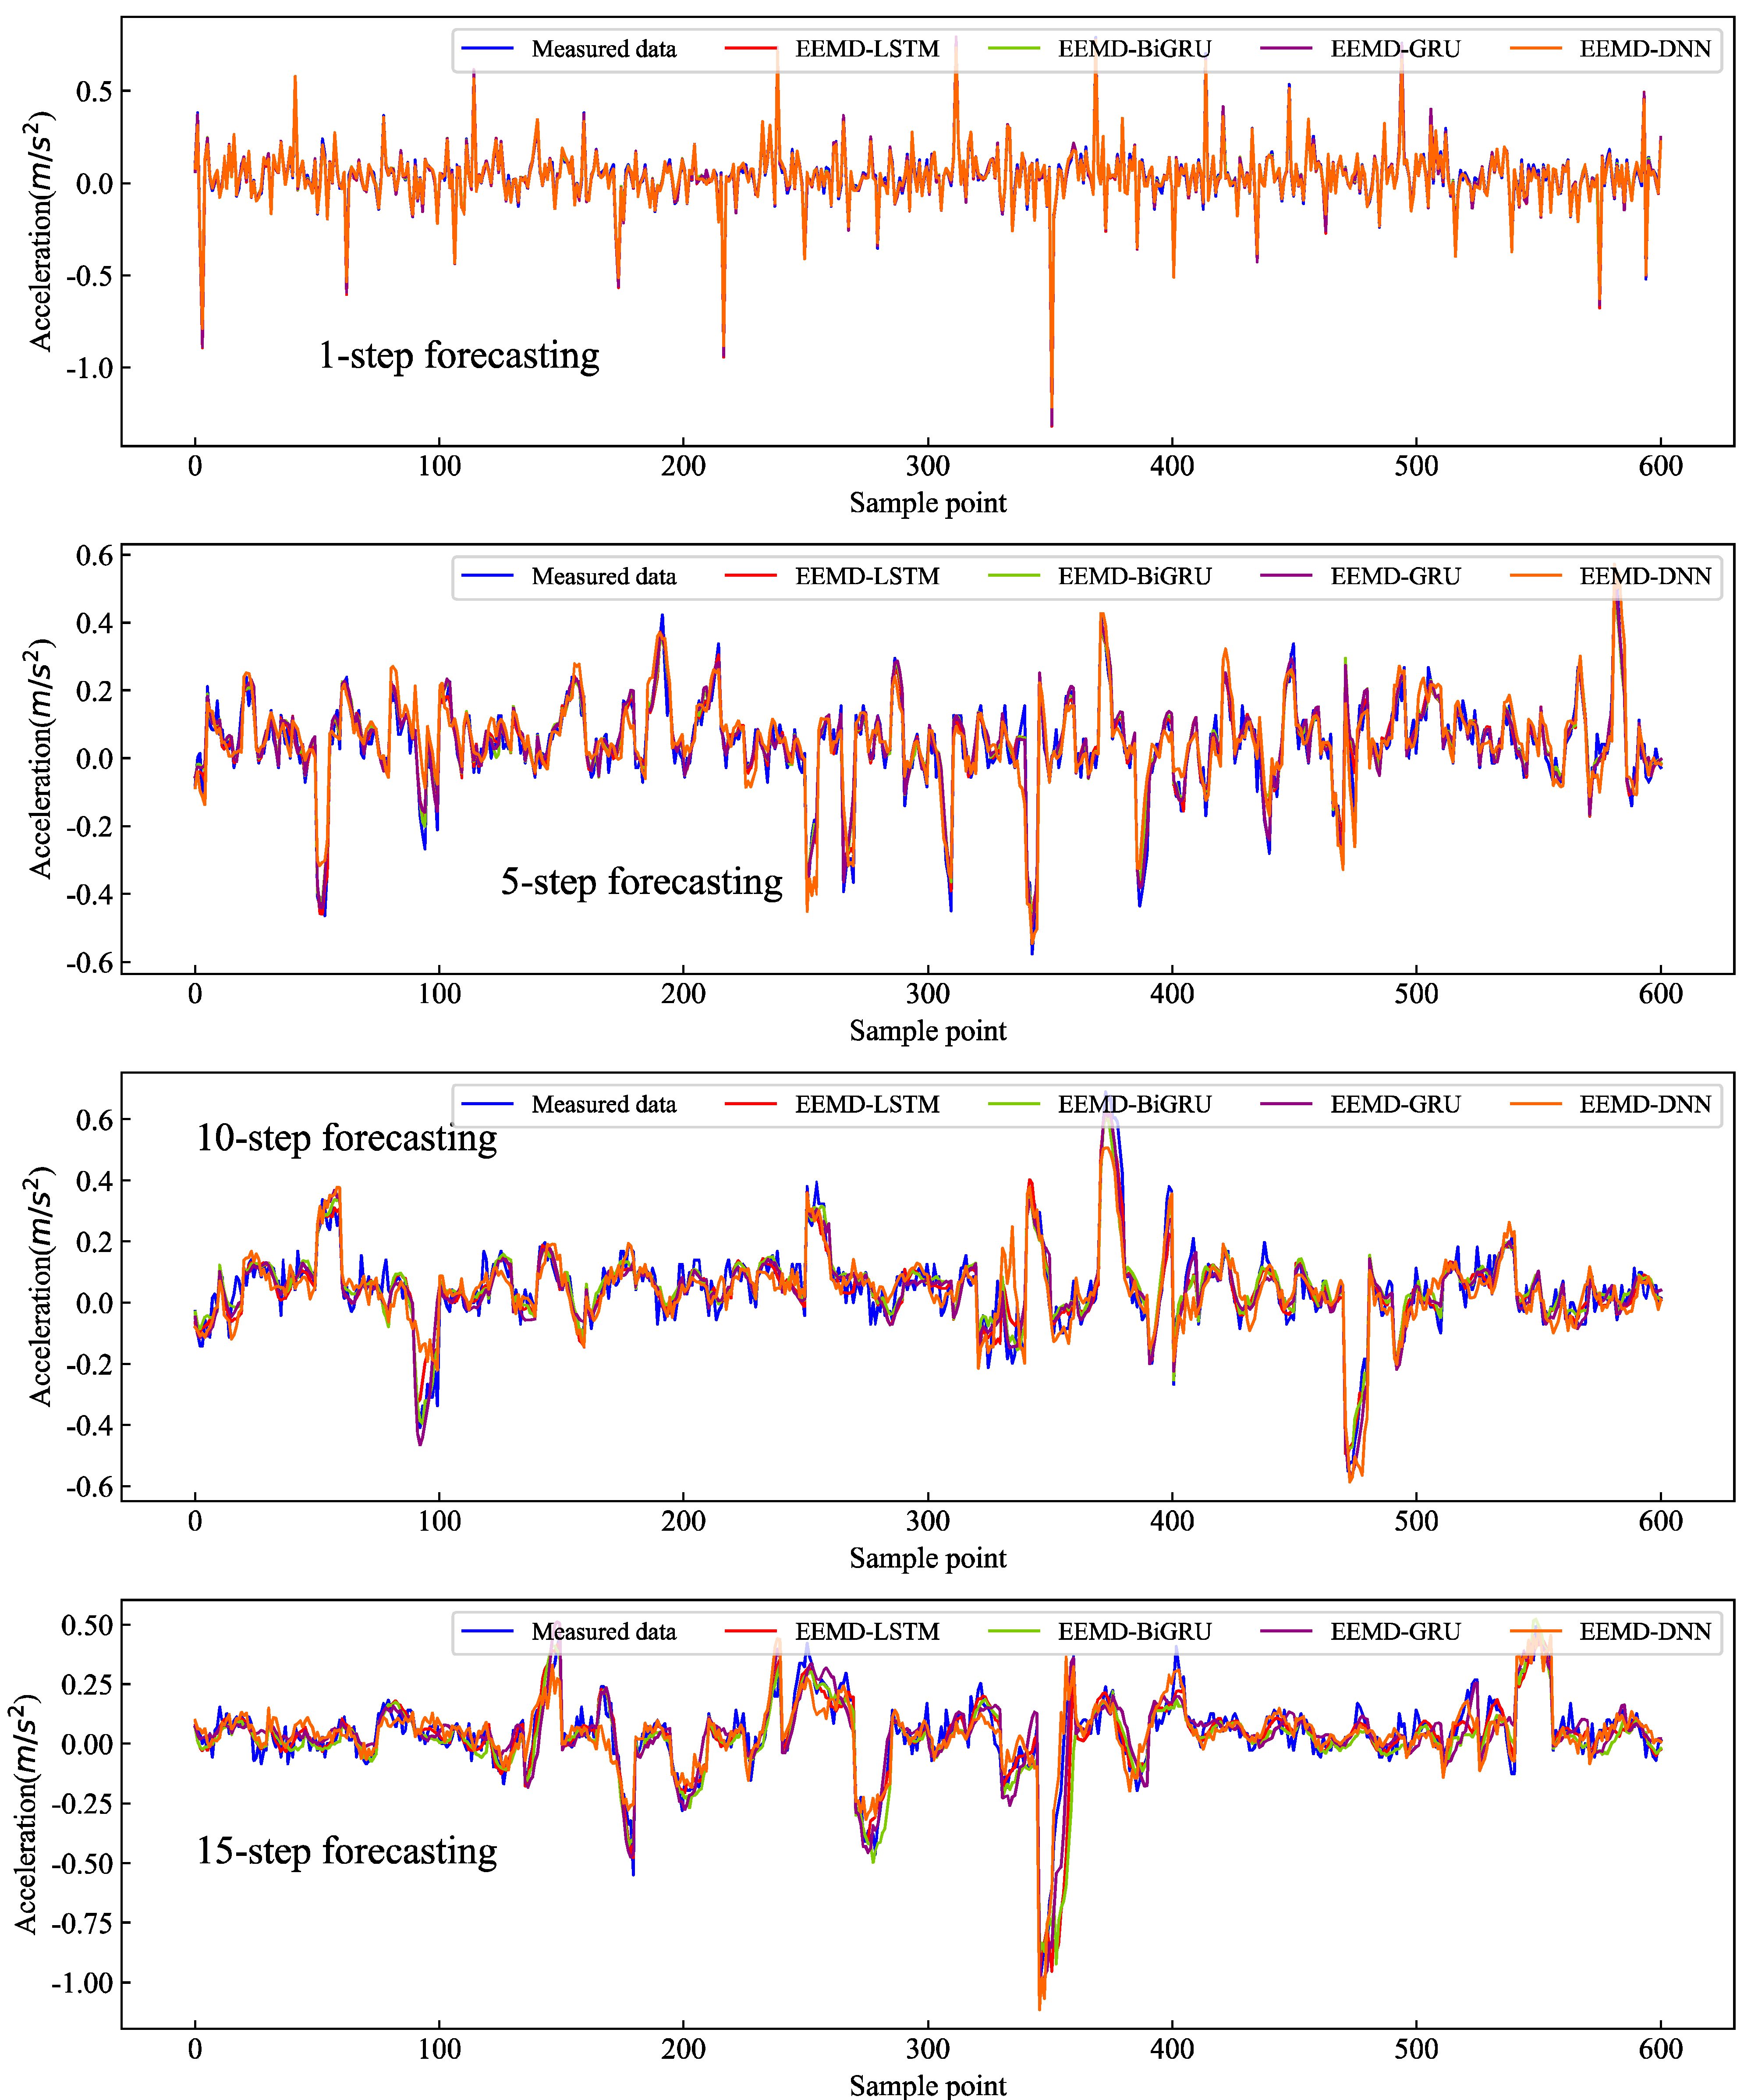
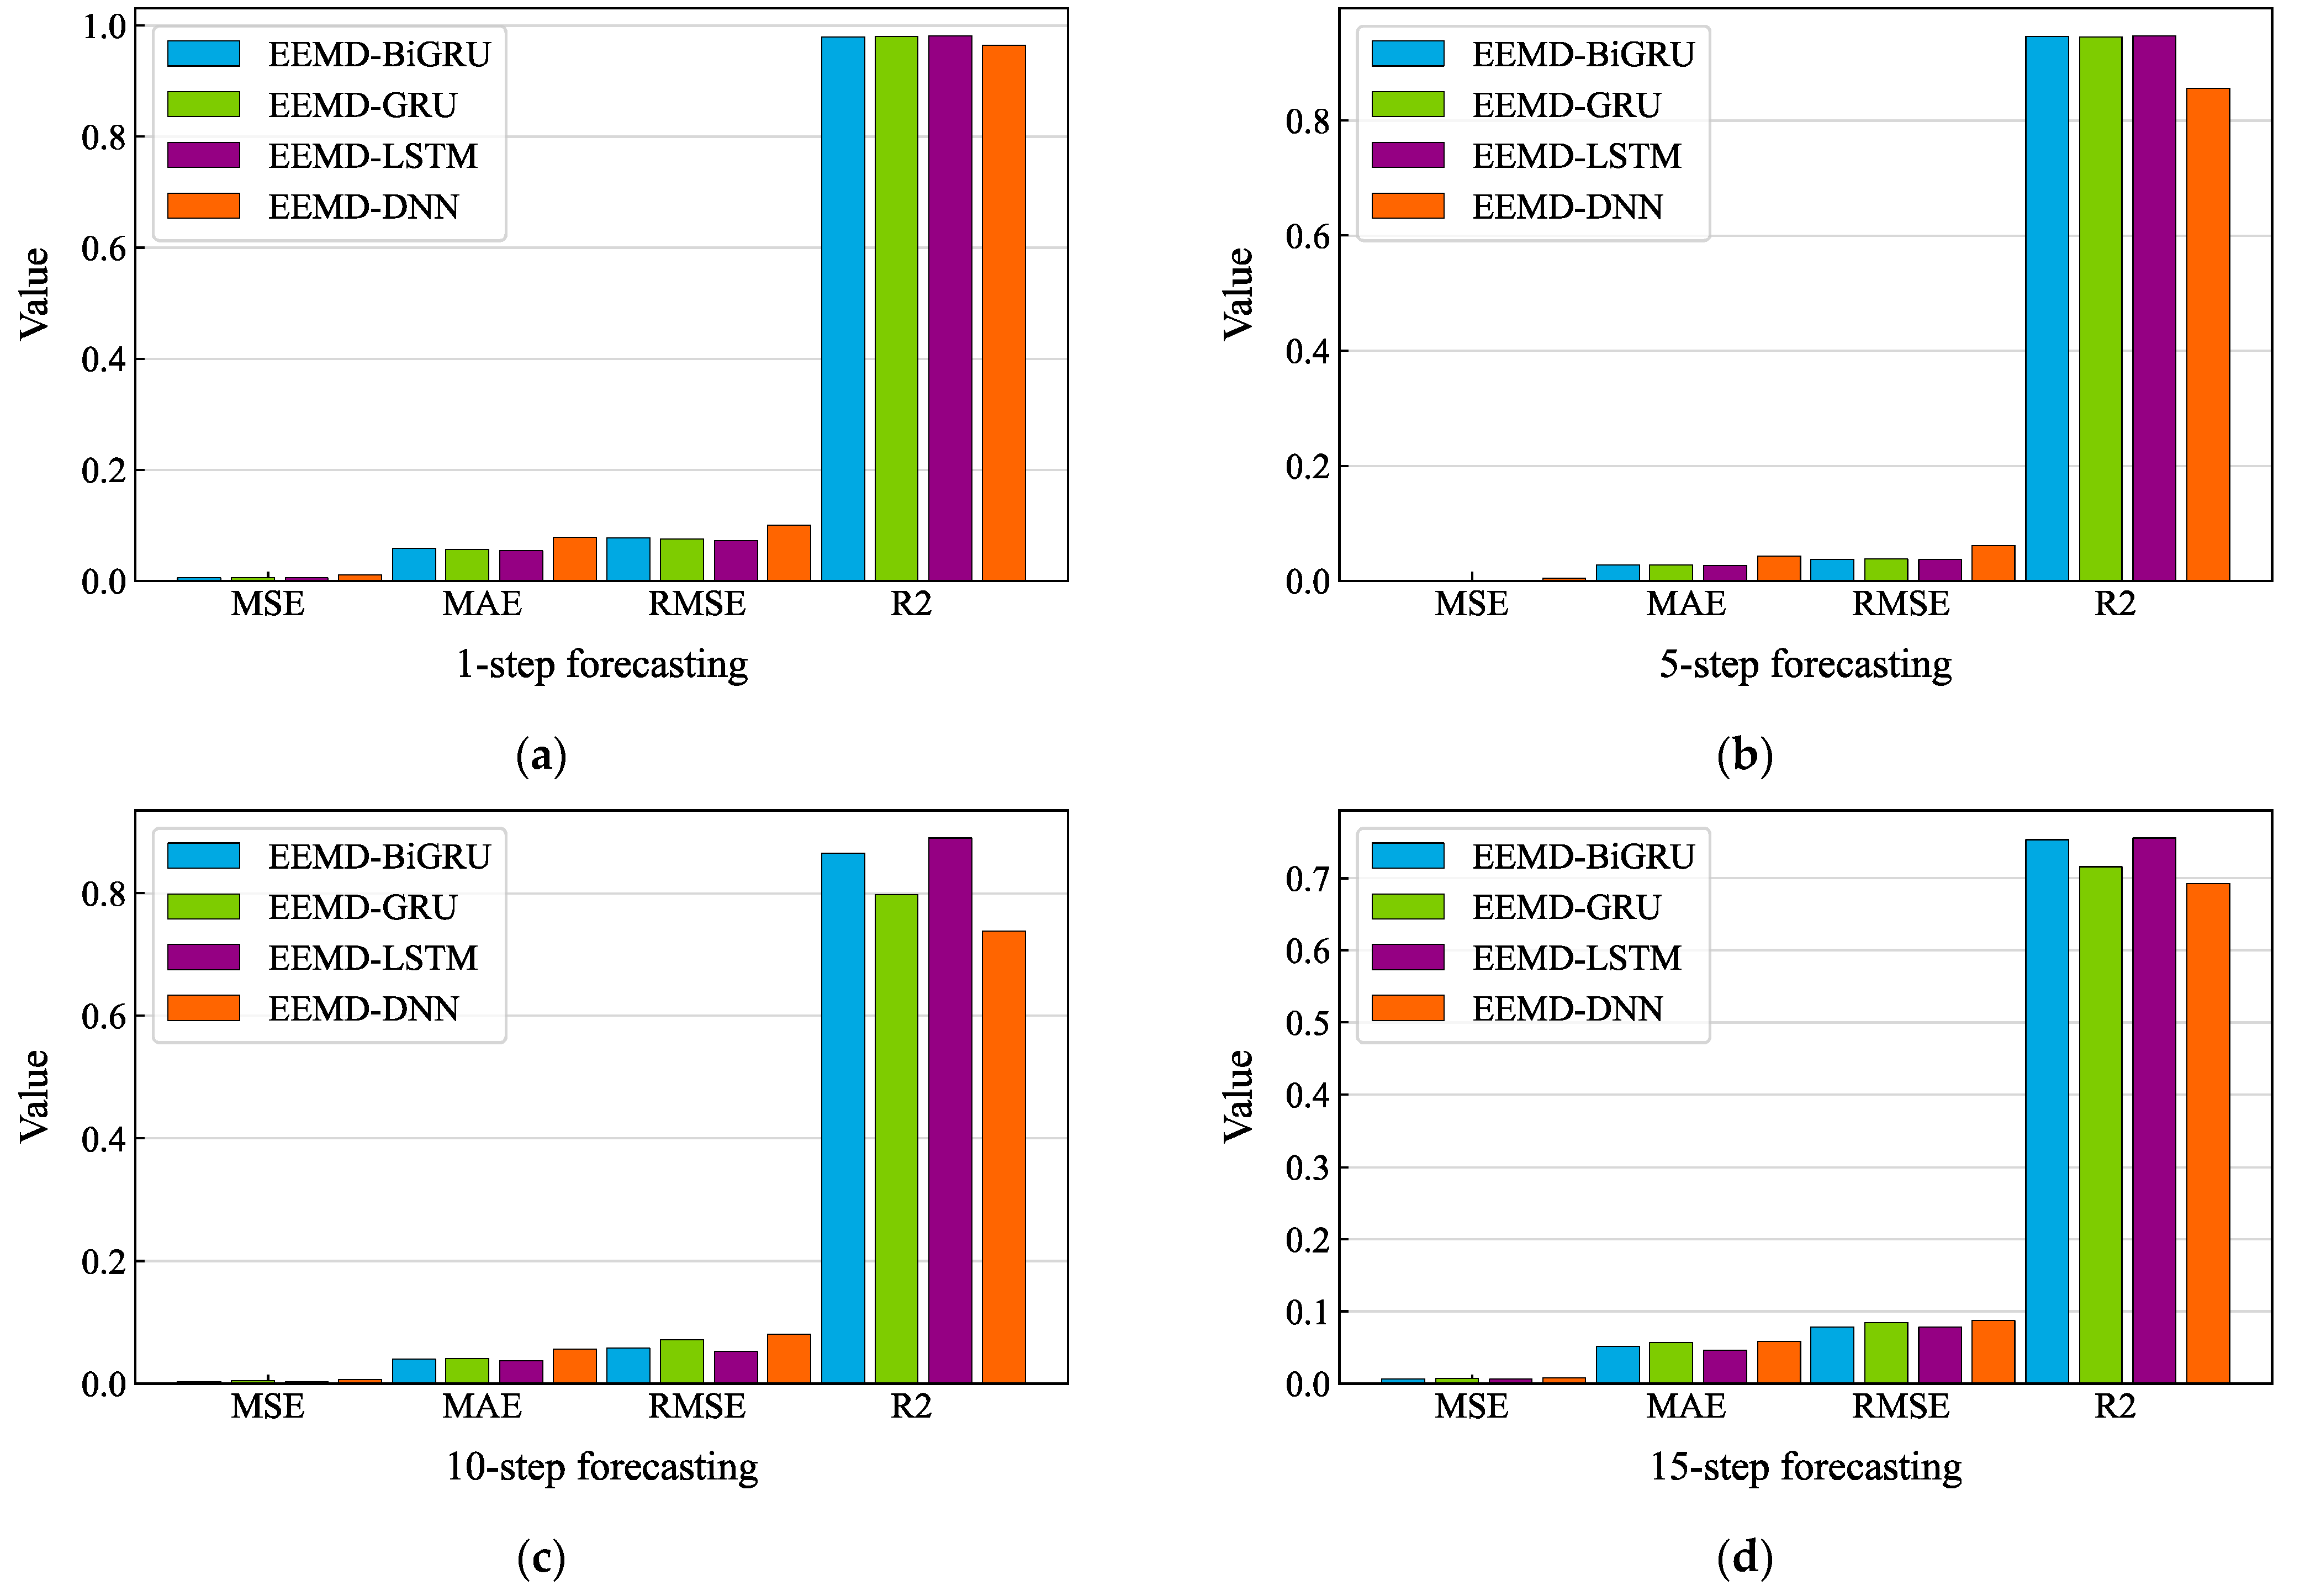
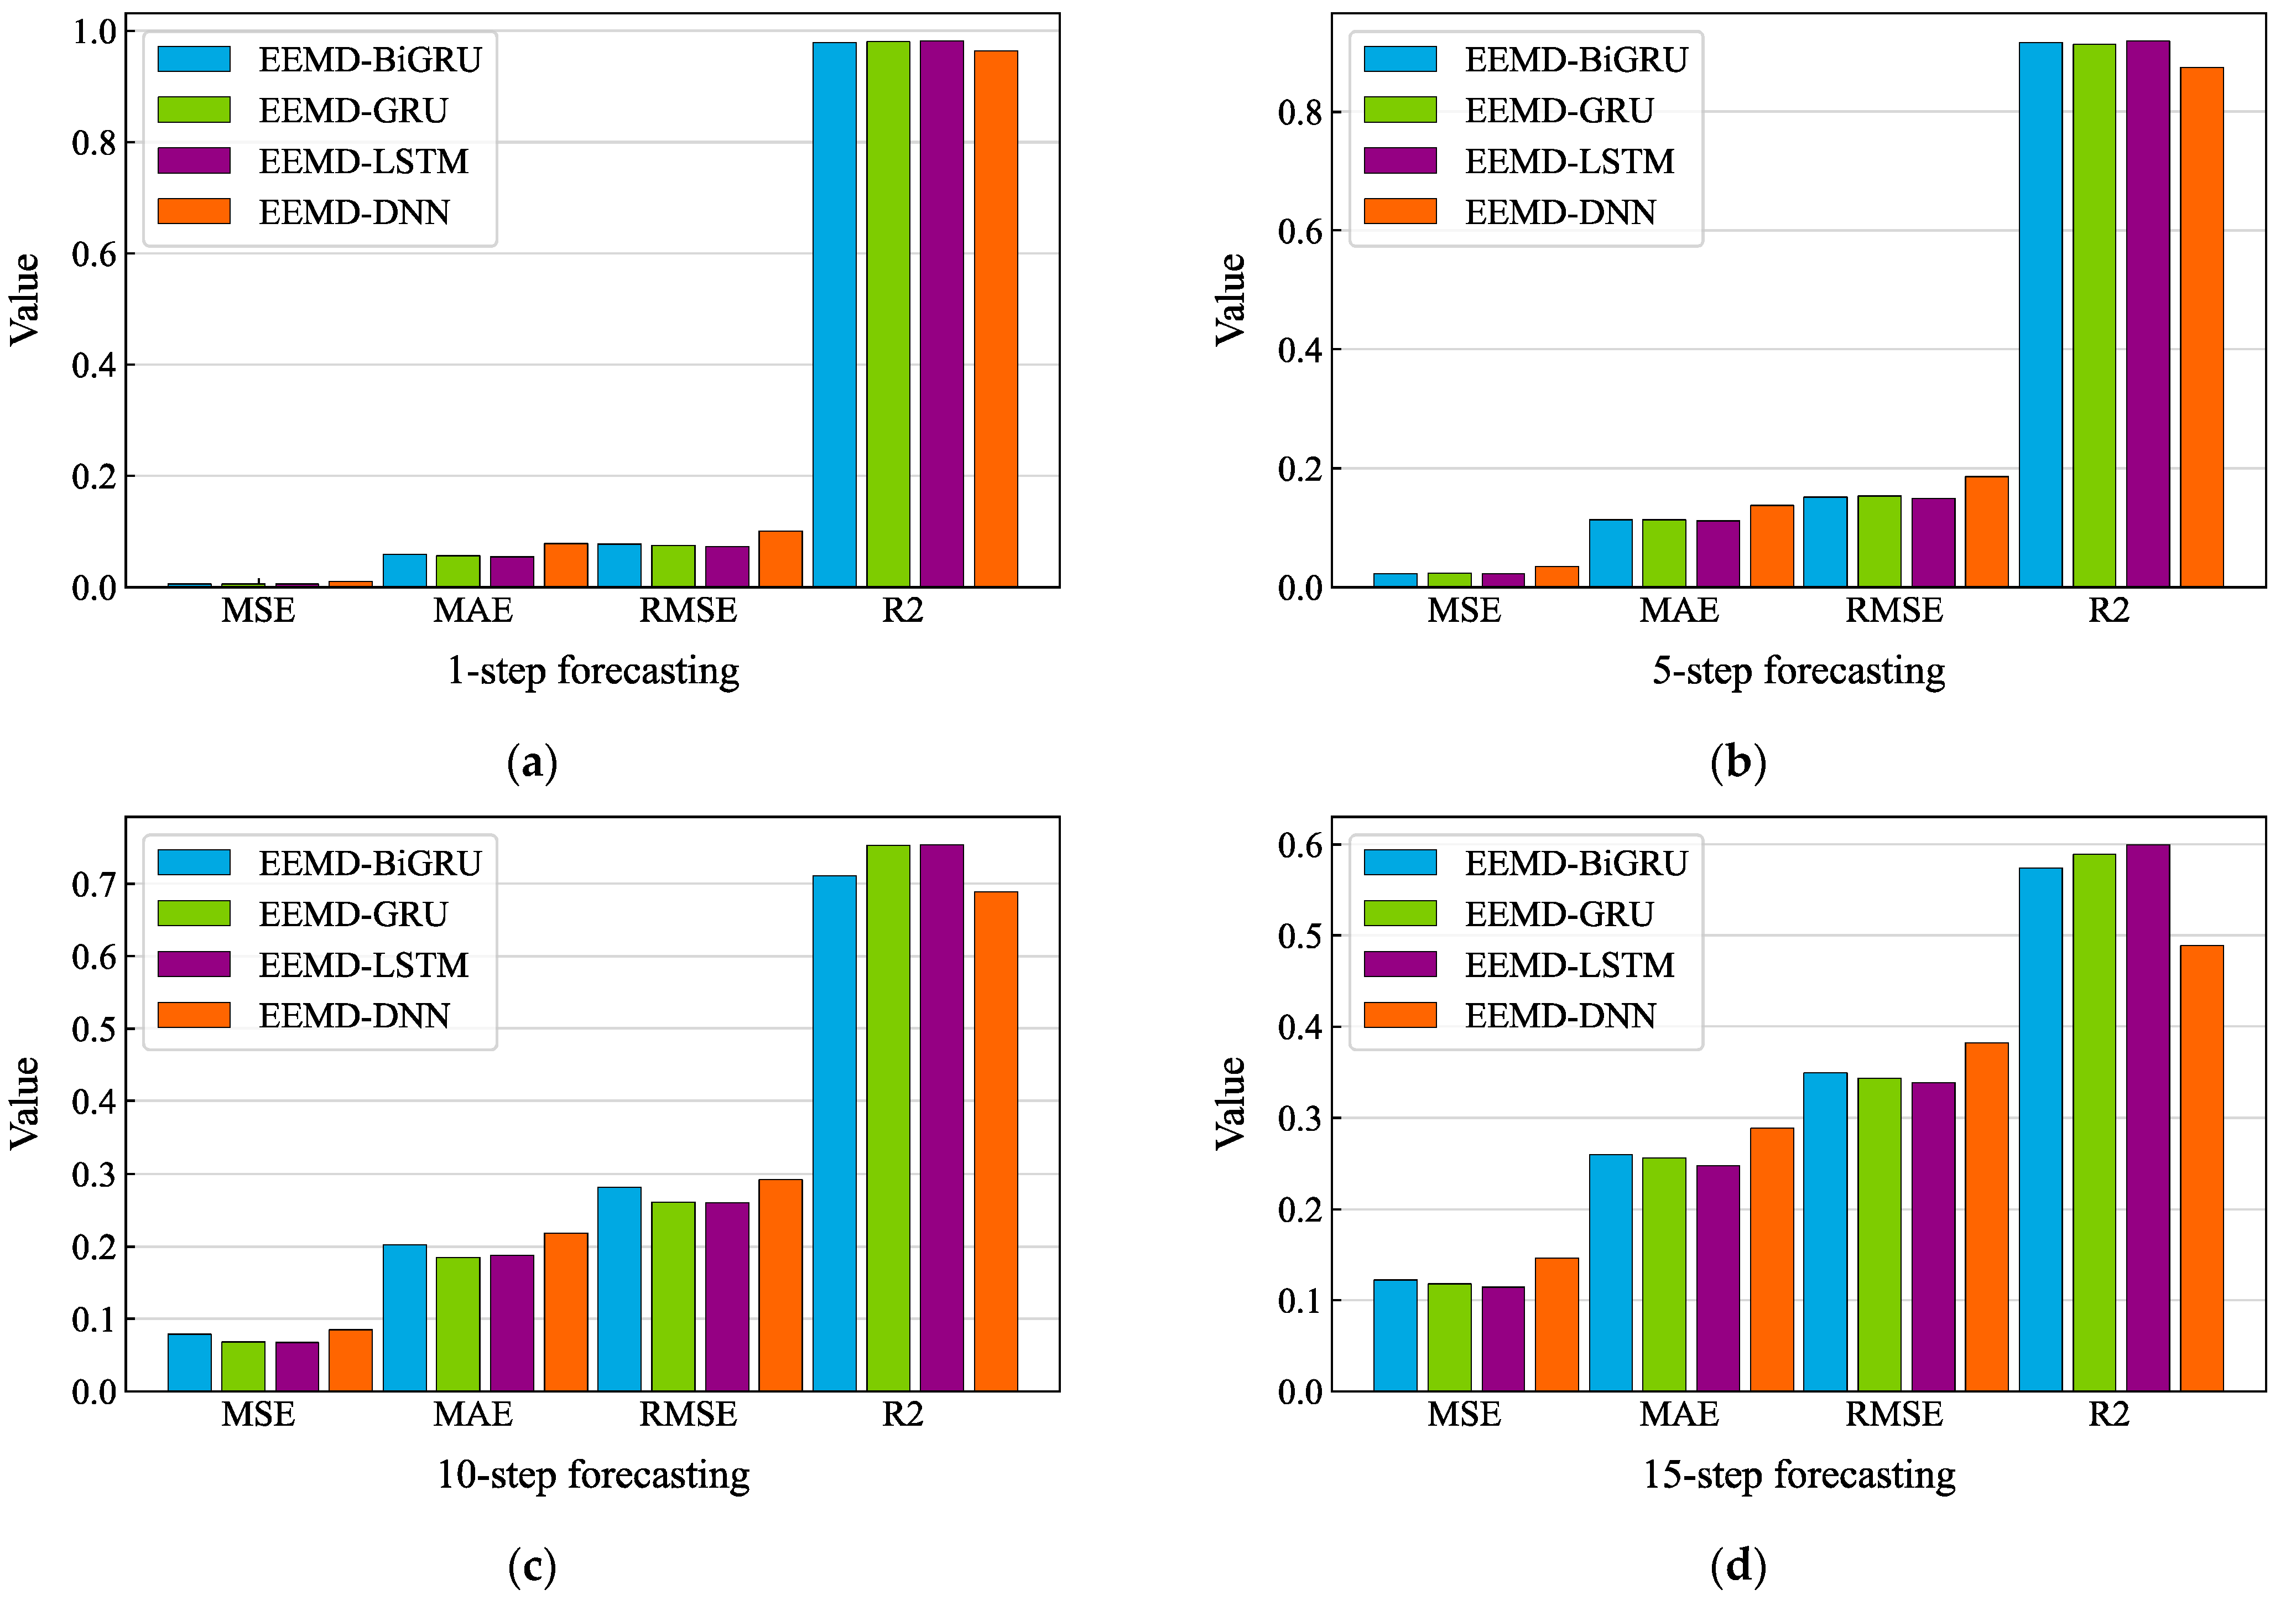
4.3. Performance Evaluation of the Multi-Steps
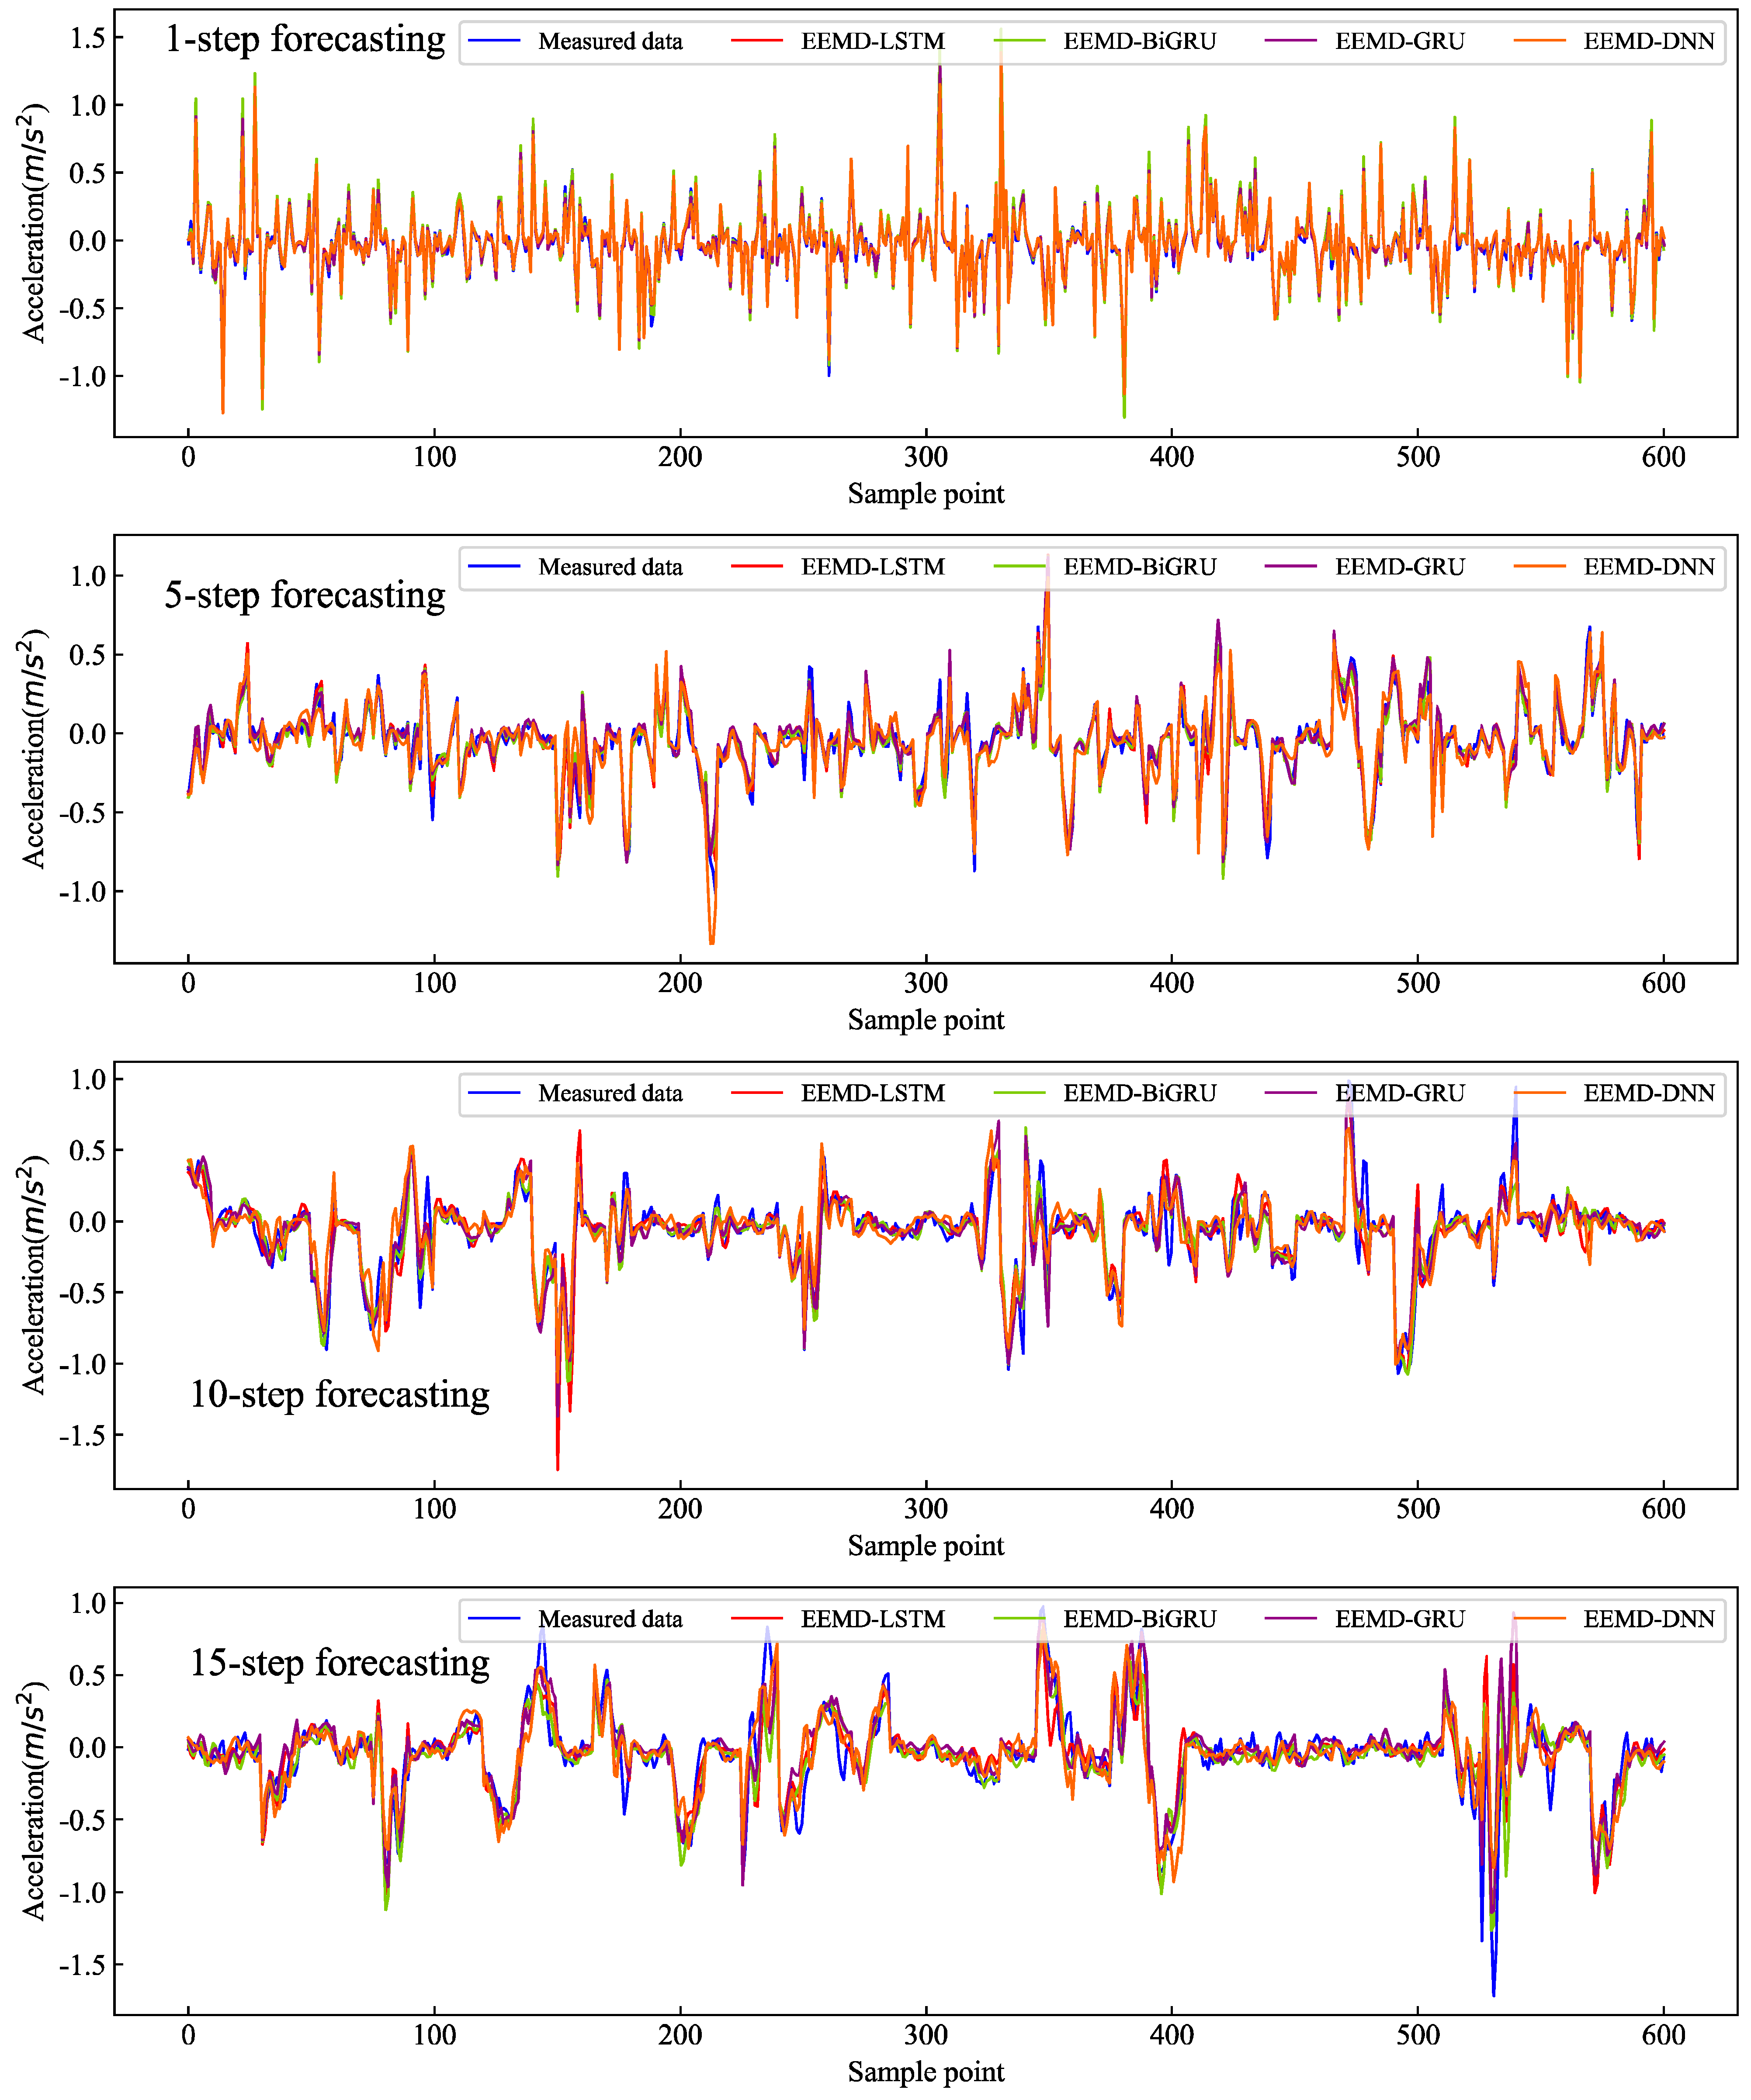
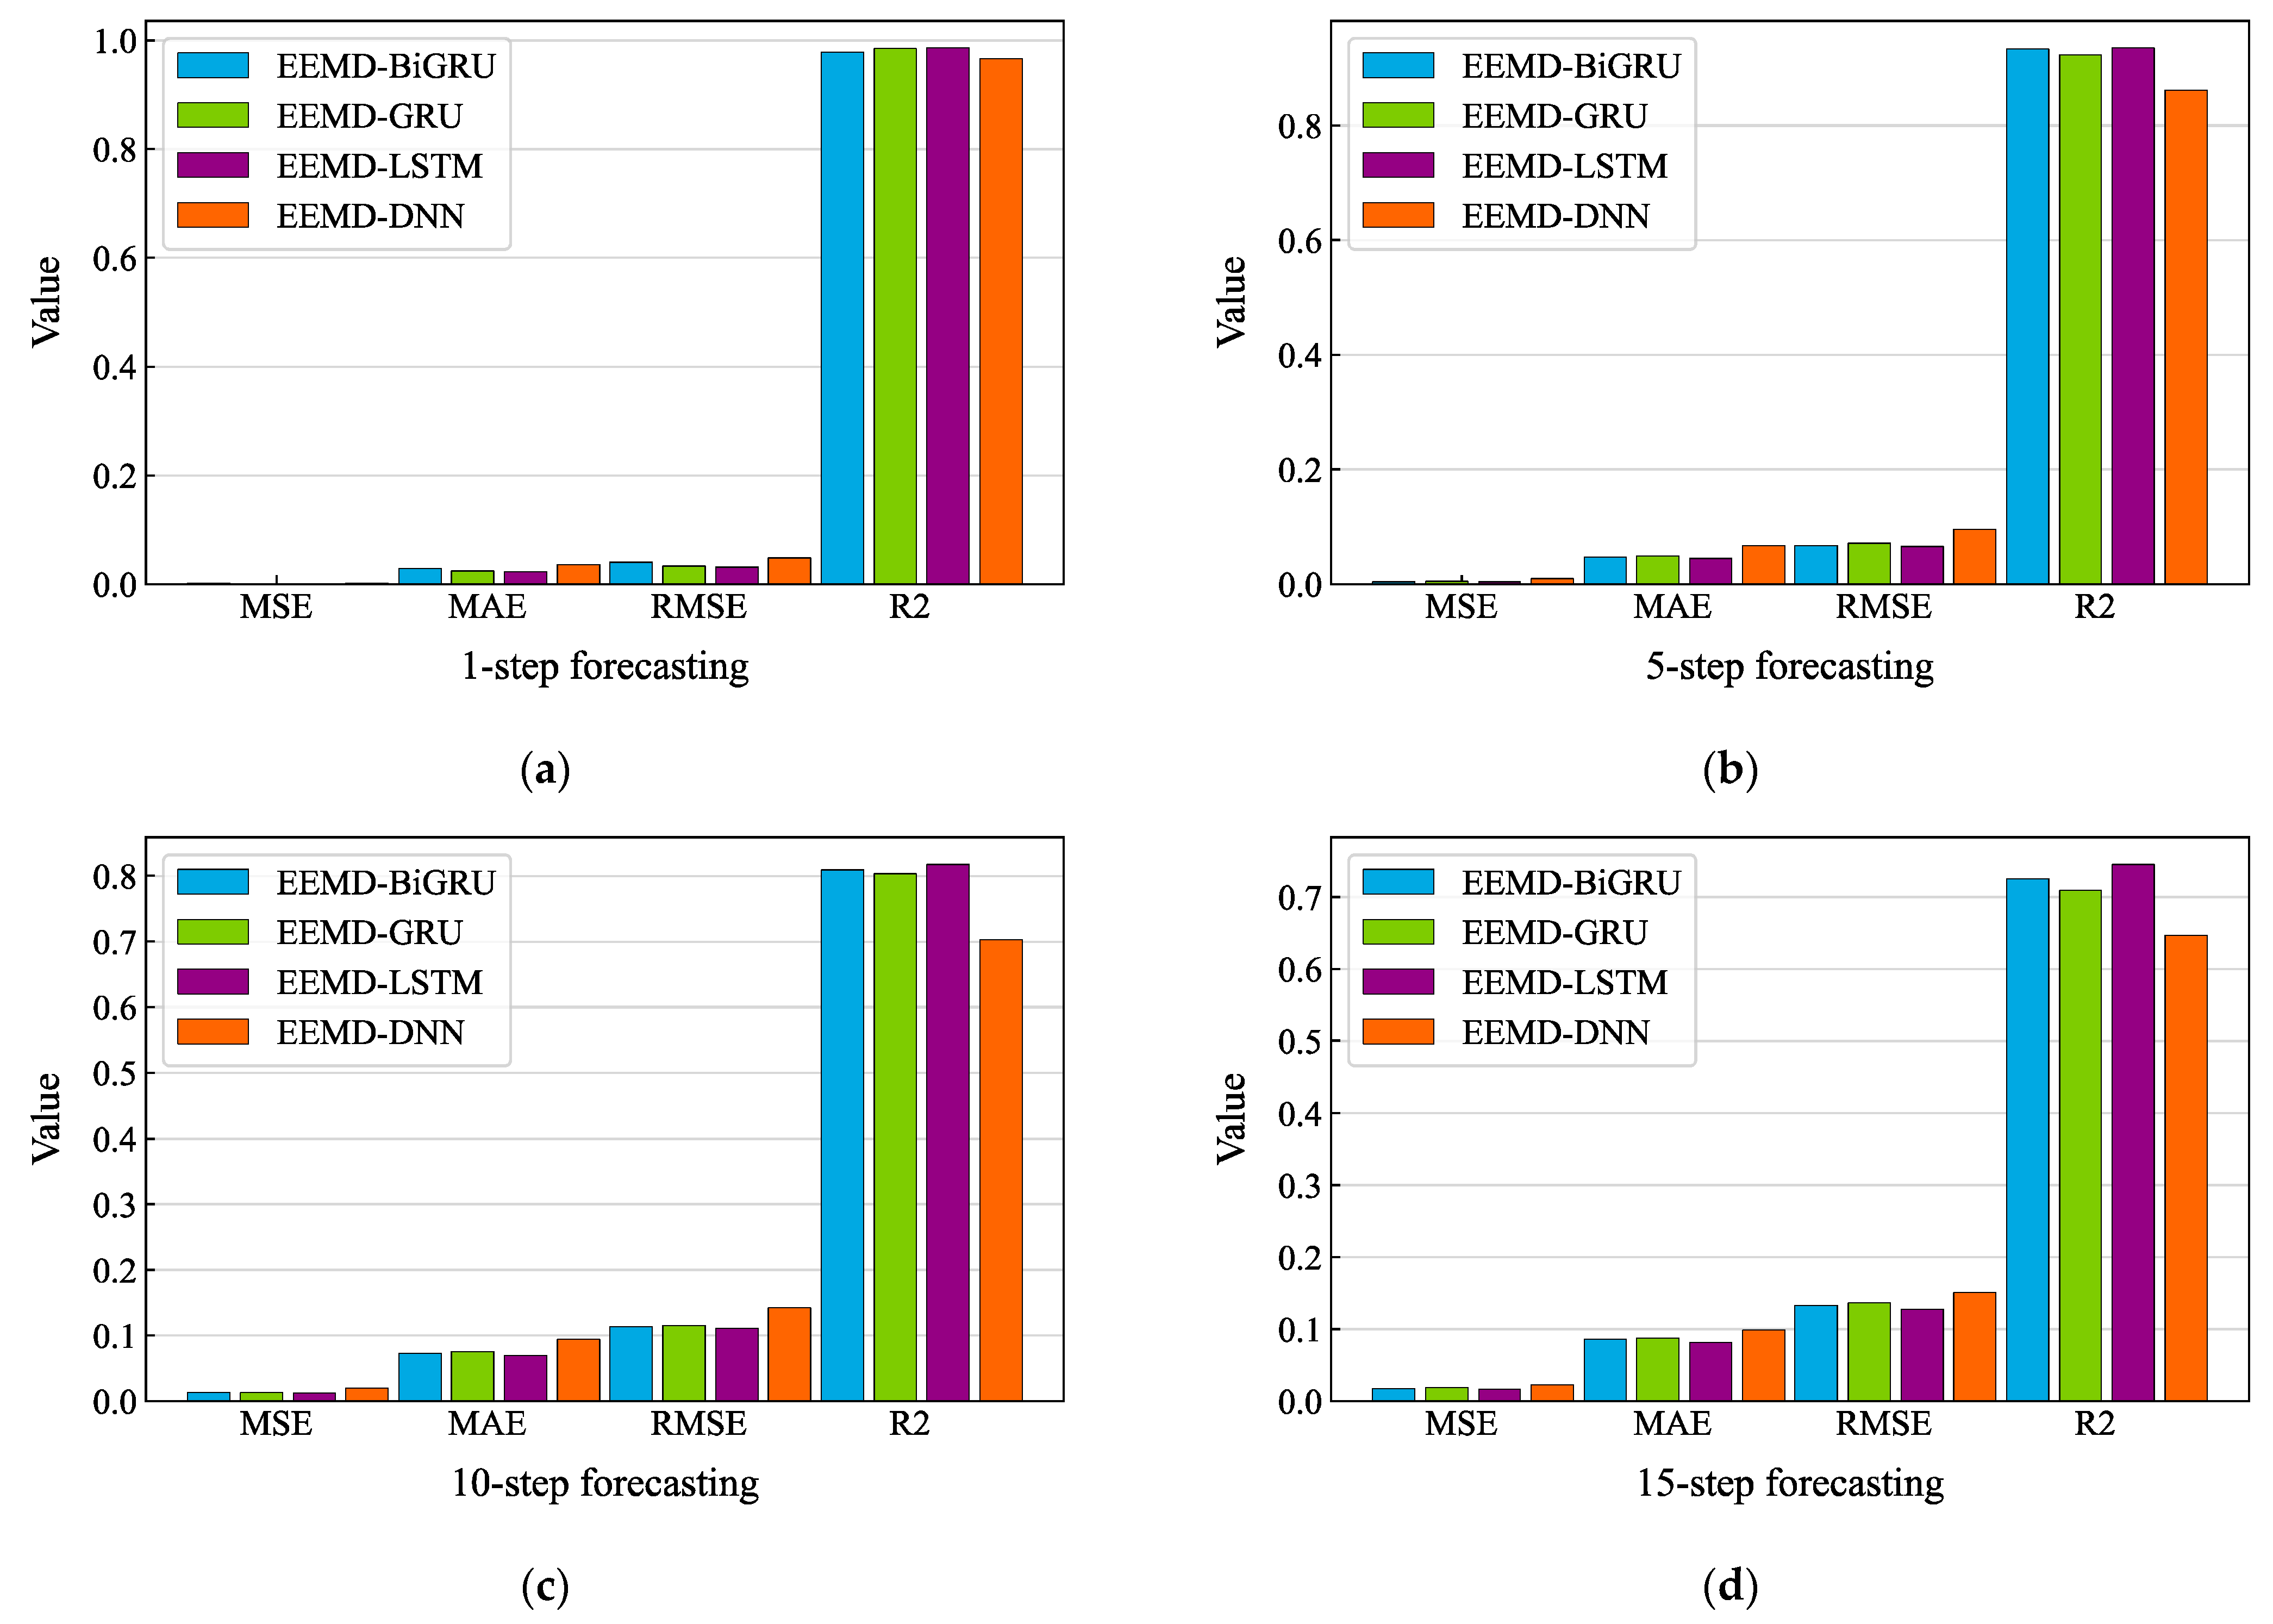
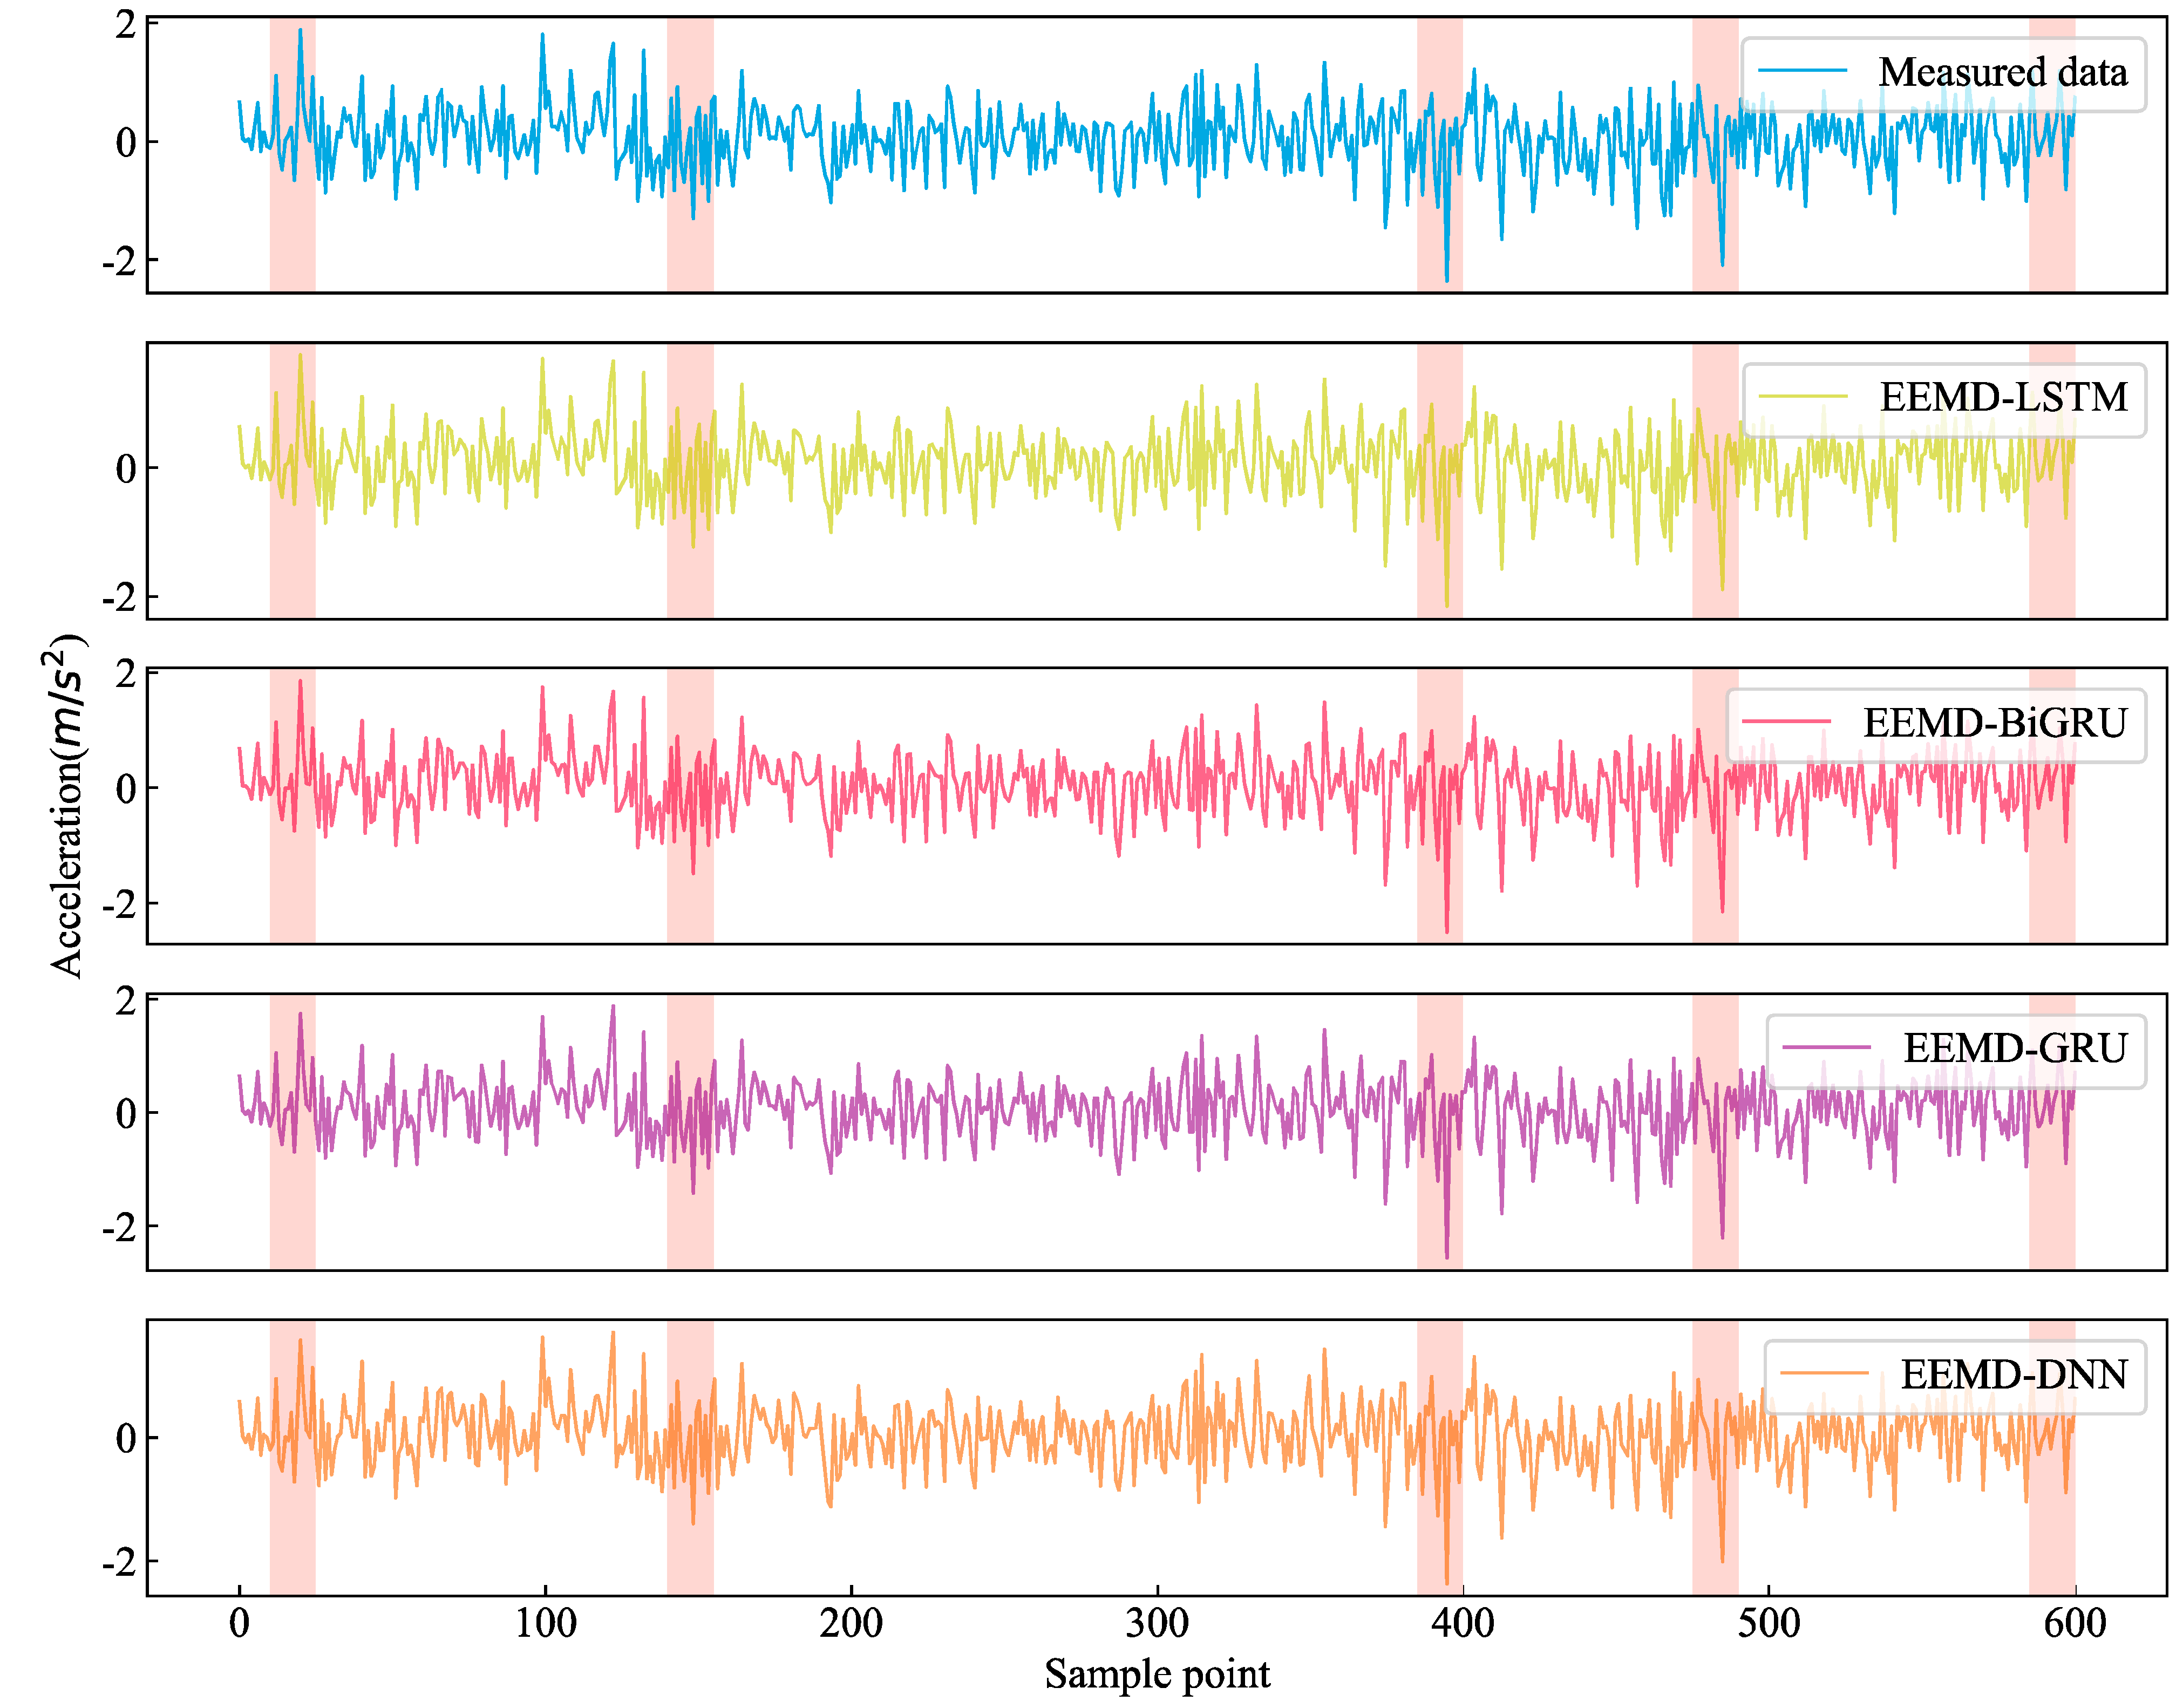
4.4. Generalization Ability of the Proposed Model
5. Conclusions
- (1).
- Compared with the traditional single prediction models, the proposed EEMD-based methods well captured the micro change features of the measured signal, thereby obtaining a better data complementary performance;
- (2).
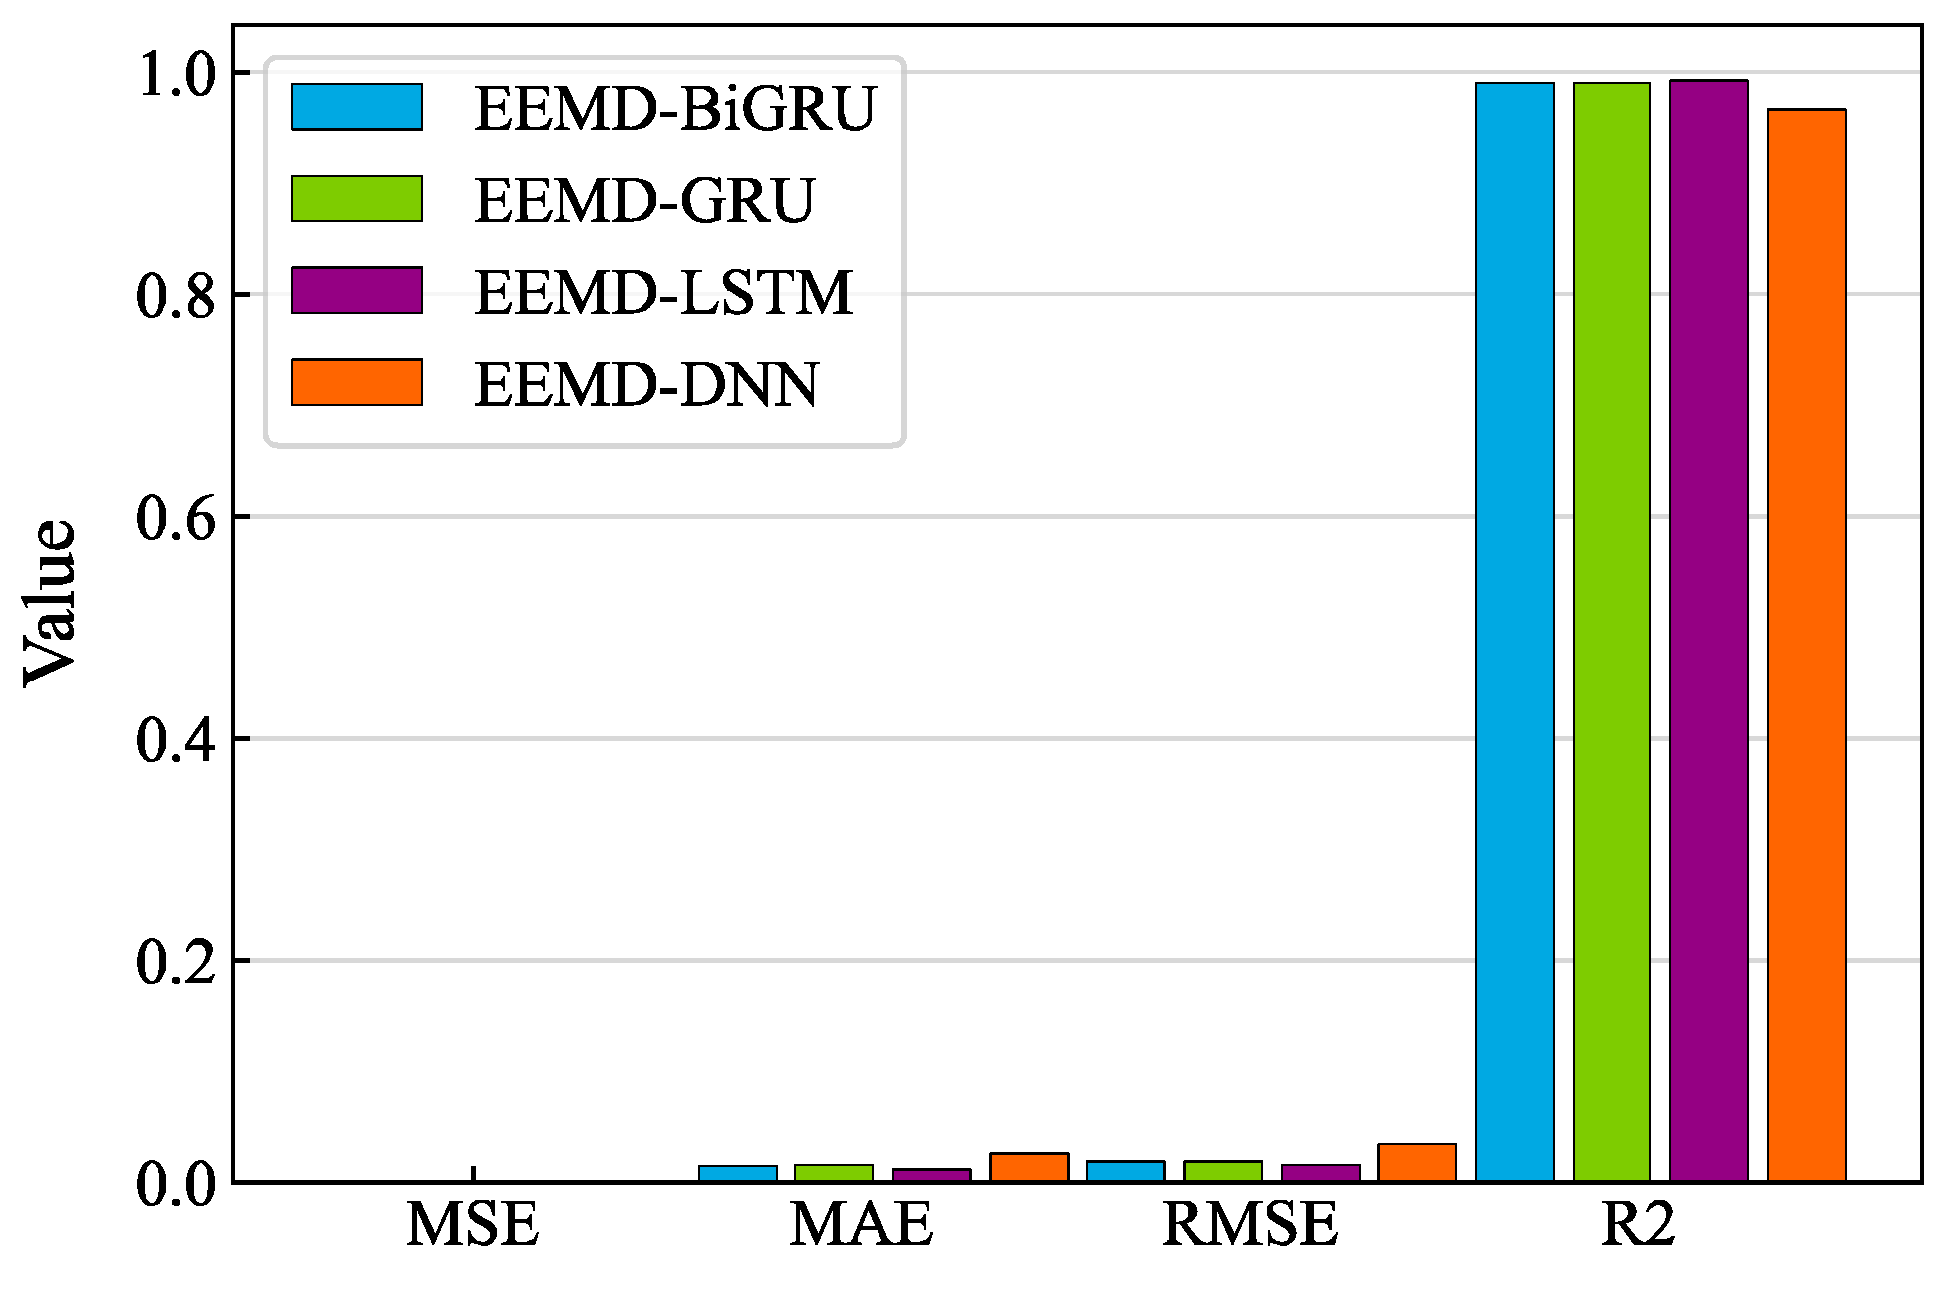
- The results of the measured signal data recovery showed that compared with EEMD-BiGRU, EEMD-GRU, and EEMD-DNN, the proposed EEMD-LSTM method could make full use of the long-term correlation of time series data and, thus, performed optimally in the missing data complementation performance indicators. It was also demonstrated that EEMD-LSTM could effectively correlate the historical information with the current input features and achieve accurate missing data completion;
- (3).
- The data recovery capability of most of the algorithms may decrease with the increase in missing data. The results showed that the model’s accuracy decreased with the increasing in step size. It is worth mentioning that EEMD-LSTM had the best missing data complementation performance among all methods when the missing data increased.
Author Contributions
Funding
Institutional Review Board Statement
Informed Consent Statement
Data Availability Statement
Acknowledgments
Conflicts of Interest
Appendix A

| Dataset | Point | Metrics | EEMD-BiGRU | EEMD-GRU | EEMD-LSTM | EEMD-DNN | BiGRU | GRU | LSTM | DNN |
|---|---|---|---|---|---|---|---|---|---|---|
| El-Centro | 1 | MSE | 0.006 | 0.0056 | 0.0052 | 0.0101 | 0.0247 | 0.0284 | 0.0289 | 0.0325 |
| 1 | RMSE | 0.0774 | 0.0746 | 0.0722 | 0.1007 | 0.1571 | 0.1685 | 0.1699 | 0.1801 | |
| 1 | MAE | 0.0585 | 0.0566 | 0.0543 | 0.0787 | 0.1243 | 0.1322 | 0.1338 | 0.1414 | |
| 1 | R2 | 97.92% | 98.06% | 98.19% | 96.47% | 91.42% | 90.13% | 89.96% | 88.72% | |
| 5 | MSE | 0.0014 | 0.0014 | 0.0013 | 0.0037 | 0.0077 | 0.0076 | 0.0075 | 0.0057 | |
| 5 | RMSE | 0.0371 | 0.0375 | 0.0365 | 0.0607 | 0.0878 | 0.0869 | 0.0867 | 0.0752 | |
| 5 | MAE | 0.0273 | 0.0272 | 0.027 | 0.0433 | 0.0621 | 0.0629 | 0.0622 | 0.0549 | |
| 5 | R2 | 94.58% | 94.46% | 94.76% | 85.52% | 69.72% | 70.31% | 70.42% | 77.75% | |
| 10 | MSE | 0.0034 | 0.005 | 0.0027 | 0.0065 | 0.0132 | 0.0131 | 0.0152 | 0.0118 | |
| 10 | RMSE | 0.0579 | 0.071 | 0.0522 | 0.0807 | 0.1151 | 0.1145 | 0.1235 | 0.1086 | |
| 10 | MAE | 0.0396 | 0.0408 | 0.0378 | 0.0562 | 0.0747 | 0.0793 | 0.0781 | 0.0708 | |
| 10 | R2 | 86.52% | 79.76% | 89.07% | 73.85% | 46.82% | 47.36% | 38.77% | 52.67% | |
| 15 | MSE | 0.0061 | 0.0071 | 0.0061 | 0.0076 | 0.0165 | 0.0167 | 0.1794 | 0.0124 | |
| 15 | RMSE | 0.0784 | 0.084 | 0.0779 | 0.0874 | 0.1285 | 0.1293 | 0.4236 | 0.1114 | |
| 15 | MAE | 0.0511 | 0.0564 | 0.0463 | 0.0586 | 0.0856 | 0.0861 | 0.3272 | 0.0734 | |
| 15 | R2 | 75.30% | 71.60% | 75.60% | 69.26% | 33.60% | 32.74% | 37.29% | 50.04% |
| Dataset | Point | Metrics | EEMD-BiGRU | EEMD-GRU | EEMD-LSTM | EEMD-DNN | BiGRU | GRU | LSTM | DNN |
|---|---|---|---|---|---|---|---|---|---|---|
| RG | 1 | MSE | 0.0016 | 0.0011 | 0.001 | 0.0024 | 0.0072 | 0.0077 | 0.0072 | 0.0089 |
| 1 | RMSE | 0.0399 | 0.0333 | 0.031 | 0.0488 | 0.085 | 0.0877 | 0.0851 | 0.0942 | |
| 1 | MAE | 0.0286 | 0.0237 | 0.0226 | 0.0358 | 0.0628 | 0.0662 | 0.0638 | 0.0698 | |
| 1 | R2 | 97.80% | 98.47% | 98.67% | 96.71% | 90.00% | 89.35% | 89.97% | 87.71% | |
| 5 | MSE | 0.0045 | 0.0051 | 0.0043 | 0.0092 | 0.0257 | 0.0267 | 0.0268 | 0.0241 | |
| 5 | RMSE | 0.0669 | 0.0712 | 0.0654 | 0.096 | 0.1604 | 0.1635 | 0.1636 | 0.1552 | |
| 5 | MAE | 0.0475 | 0.0491 | 0.0448 | 0.0669 | 0.1089 | 0.1106 | 0.1114 | 0.1028 | |
| 5 | R2 | 93.29% | 92.40% | 93.60% | 86.19% | 61.45% | 59.91% | 59.90% | 63.89% | |
| 10 | MSE | 0.013 | 0.0134 | 0.0124 | 0.0202 | 0.0386 | 0.0407 | 0.0532 | 0.0364 | |
| 10 | RMSE | 0.1139 | 0.1158 | 0.1113 | 0.1421 | 0.1964 | 0.2017 | 0.2307 | 0.1907 | |
| 10 | MAE | 0.0734 | 0.076 | 0.0698 | 0.0942 | 0.1359 | 0.1372 | 0.1552 | 0.1258 | |
| 10 | R2 | 80.95% | 80.31% | 81.81% | 70.34% | 43.39% | 40.28% | 21.85% | 46.61% | |
| 15 | MSE | 0.0178 | 0.0188 | 0.0165 | 0.0229 | 0.0394 | 0.0448 | 0.0467 | 0.0379 | |
| 15 | RMSE | 0.1334 | 0.1372 | 0.1284 | 0.1512 | 0.1986 | 0.2116 | 0.2162 | 0.1947 | |
| 15 | MAE | 0.0857 | 0.0877 | 0.0815 | 0.0992 | 0.1363 | 0.1432 | 0.1496 | 0.1265 | |
| 15 | R2 | 72.53% | 70.95% | 74.57% | 64.72% | 39.16% | 30.93% | 27.90% | 41.53% |
References
- Xu, Y.; Lu, X.; Cetiner, B.; Taciroglu, E. Real-time regional seismic damage assessment framework based on long short-term memory neural network. Comput.-Aided Civ. Infrastruct. Eng. 2021, 36, 504–521. [Google Scholar] [CrossRef]
- Lee, S.-C.; Ma, C.-K. Time history shaking table test and seismic performance analysis of Industrialised Building System (IBS) block house subsystems. J. Build. Eng. 2021, 34, 101906. [Google Scholar] [CrossRef]
- Betti, M.; Galano, L.; Vignoli, A. Time-History Seismic Analysis of Masonry Buildings: A Comparison between Two Non-Linear Modelling Approaches. Buildings 2015, 5, 597–621. [Google Scholar] [CrossRef]
- Wang, C.; Xiao, J. Shaking Table Tests on a Recycled Concrete Block Masonry Building. Adv. Struct. Eng. 2012, 15, 1843–1860. [Google Scholar] [CrossRef]
- Lignos, D.G.; Chung, Y.; Nagae, T.; Nakashima, M. Numerical and experimental evaluation of seismic capacity of high-rise steel buildings subjected to long duration earthquakes. Comput. Struct. 2011, 89, 959–967. [Google Scholar] [CrossRef]
- Mandic, D.P.; Chambers, J.A. Recurrent Neural Networks Architectures. In Recurrent Neural Networks for Prediction; Wiley: Hoboken, NJ, USA, 2001; pp. 69–89. [Google Scholar] [CrossRef]
- Schuster, M.; Paliwal, K.K. Bidirectional recurrent neural networks. IEEE Trans. Signal Process. 1997, 45, 2673–2681. [Google Scholar] [CrossRef]
- Hochreiter, S.; Schmidhuber, J. Long Short-Term Memory. Neural Comput. 1997, 9, 1735–1780. [Google Scholar] [CrossRef]
- Dai, D.; Xiao, X.; Lyu, Y.; Dou, S.; She, Q.; Wang, H. Joint Extraction of Entities and Overlapping Relations Using Position-Attentive Sequence Labeling. In Proceedings of the AAAI Conference on Artificial Intelligence, Honolulu, HI, USA, 27 January–1 February 2019; Volume 33, pp. 6300–6308. [Google Scholar] [CrossRef]
- Nadkarni, P.M.; Ohno-Machado, L.; Chapman, W.W. Natural language processing: An introduction. J. Am. Med. Inform. Assoc. 2011, 18, 544–551. [Google Scholar] [CrossRef] [Green Version]
- Chen, S.; Leng, Y.; Labi, S. A deep learning algorithm for simulating autonomous driving considering prior knowledge and temporal information. Comput.-Aided Civ. Infrastruct. Eng. 2020, 35, 305–321. [Google Scholar] [CrossRef]
- Panakkat, A.; Adeli, H. Recurrent Neural Network for Approximate Earthquake Time and Location Prediction Using Multiple Seismicity Indicators. Comput.-Aided Civ. Infrastruct. Eng. 2009, 24, 280–292. [Google Scholar] [CrossRef]
- Kuyuk, H.S.; Susumu, O. Real-Time Classification of Earthquake using Deep Learning. Procedia Comput. Sci. 2018, 140, 298–305. [Google Scholar] [CrossRef]
- Park, H.O.; Dibazar, A.A.; Berger, T.W. Discrete Synapse Recurrent Neural Network for Nonlinear System Modeling and Its Application on Seismic Signal Classification. In Proceedings of the 2010 International Joint Conference on Neural Networks (IJCNN), Barcelona, Spain, 18–23 July 2010; pp. 1–7. [Google Scholar]
- Bhandarkar, T.; Satish, N.; Sridhar, S.; Sivakumar, R.; Ghosh, S. Earthquake trend prediction using long short-term memory RNN. Int. J. Electr. Comput. Eng. 2019, 9, 1304–1312. [Google Scholar] [CrossRef]
- Zhang, R.; Chen, Z.; Chen, S.; Zheng, J.; Büyüköztürk, O.; Sun, H. Deep long short-term memory networks for nonlinear structural seismic response prediction. Comput. Struct. 2019, 220, 55–68. [Google Scholar] [CrossRef]
- Perez-Ramirez, C.A.; Amezquita-Sanchez, J.P.; Valtierra-Rodriguez, M.; Adeli, H.; Dominguez-Gonzalez, A.; Romero-Troncoso, R.J. Recurrent neural network model with Bayesian training and mutual information for response prediction of large buildings. Eng. Struct. 2019, 178, 603–615. [Google Scholar] [CrossRef]
- Kim, T.; Song, J.; Kwon, O.-S. Pre- and post-earthquake regional loss assessment using deep learning. Earthq. Eng. Struct. Dyn. 2020, 49, 657–678. [Google Scholar] [CrossRef]
- Lu, X.; Xu, Y.; Tian, Y.; Cetiner, B.; Taciroglu, E. A deep learning approach to rapid regional post-event seismic damage assessment using time-frequency distributions of ground motions. Earthq. Eng. Struct. Dyn. 2021, 50, 1612–1627. [Google Scholar] [CrossRef]
- Liu, D.; Bao, Y.; He, Y.; Zhang, L. A Data Loss Recovery Technique Using EMD-BiGRU Algorithm for Structural Health Monitoring. Appl. Sci. 2021, 11, 10072. [Google Scholar] [CrossRef]
- Chen, Z.; Fu, J.; Peng, Y.; Chen, T.; Zhang, L.; Yuan, C. Baseline Correction of Acceleration Data Based on a Hybrid EMD–DNN Method. Sensors 2021, 21, 6283. [Google Scholar] [CrossRef] [PubMed]
- Wu, Z.; Huang, N.E. Ensemble empirical mode decomposition: A noise-assisted data analysis method. Adv. Adapt. Data Anal. 2009, 1, 1–41. [Google Scholar] [CrossRef]
- Huang, N.; Shen, Z.; Long, S.; Wu, M.L.C.; Shih, H.; Zheng, Q.; Yen, N.-C.; Tung, C.-C.; Liu, H. The empirical mode decomposition and the Hilbert spectrum for nonlinear and non-stationary time series analysis. Proc. R. Soc. Lond. Ser. A Math. Phys. Eng. Sci. 1998, 454, 903–995. [Google Scholar] [CrossRef]
- Jiang, P.; Yang, H.; Heng, J. A hybrid forecasting system based on fuzzy time series and multi-objective optimization for wind speed forecasting. Appl. Energy 2019, 235, 786–801. [Google Scholar] [CrossRef]
- Xiu, C.; Sun, Y.; Peng, Q.; Chen, C.; Yu, X. Learn traffic as a signal: Using ensemble empirical mode decomposition to enhance short-term passenger flow prediction in metro systems. J. Rail Transp. Plan. Manag. 2022, 22, 100311. [Google Scholar] [CrossRef]
- Zhai, H.; Xiong, W.; Li, F.; Yang, J.; Su, D.; Zhang, Y. Prediction of cold rolling gas based on EEMD-LSTM deep learning technology. Assem. Autom. 2022, 42, 181–189. [Google Scholar] [CrossRef]
- Sherstinsky, A. Fundamentals of Recurrent Neural Network (RNN) and Long Short-Term Memory (LSTM) network. Phys. D Nonlinear Phenom. 2020, 404, 132306. [Google Scholar] [CrossRef]
- Smagulova, K.; James, A.P. A survey on LSTM memristive neural network architectures and applications. Eur. Phys. J. Spec. Top. 2019, 228, 2313–2324. [Google Scholar] [CrossRef]
- Chen, Z.; Xu, Y.; Hua, J.; Xu, F.; Tse, K.T.; Huang, L.; Xue, X. Unsteady aerodynamic forces on a tapered prism during the combined vibration of VIV and galloping. Nonlinear Dyn. 2022, 107, 599–615. [Google Scholar] [CrossRef]
- Chen, Z.-S.; Tse, K.T.; Kwok, K.C.S. Unsteady pressure measurements on an oscillating slender prism using a forced vibration technique. J. Wind Eng. Ind. Aerodyn. 2017, 170, 81–93. [Google Scholar] [CrossRef]


| Dataset | No. of Samples | Mean | Standard Deviation | Minimum | Maximum |
|---|---|---|---|---|---|
| White | 15,360 | 0.0673 | 0.5269 | −2.6461 | 2.3082 |
| El-Centro | 15,360 | 0.0441 | 0.1509 | −1.2667 | 1.0134 |
| RG (artificial wave) | 15,360 | −0.0260 | 0.2602 | −1.7171 | 1.5201 |
| Dataset | Point | Metrics | EEMD-BiGRU | EEMD-GRU | EEMD-LSTM | EEMD-DNN | BiGRU | GRU | LSTM | DNN |
|---|---|---|---|---|---|---|---|---|---|---|
| White | 1 | MSE | 0.0060 | 0.0056 | 0.0052 | 0.0101 | 0.0247 | 0.0284 | 0.0289 | 0.0325 |
| 1 | RMSE | 0.0774 | 0.0746 | 0.0722 | 0.1007 | 0.1571 | 0.1685 | 0.1699 | 0.1801 | |
| 1 | MAE | 0.0585 | 0.0566 | 0.0543 | 0.0787 | 0.1243 | 0.1322 | 0.1338 | 0.1414 | |
| 1 | R2 | 97.92% | 98.06% | 98.19% | 96.47% | 91.42% | 90.13% | 89.96% | 88.72% | |
| El-Centro | 1 | MSE | 0.0003 | 0.0003 | 0.0003 | 0.0006 | 0.003 | 0.003 | 0.0034 | 0.0036 |
| 1 | RMSE | 0.018 | 0.0179 | 0.0178 | 0.0244 | 0.0547 | 0.0551 | 0.058 | 0.0601 | |
| 1 | MAE | 0.0143 | 0.0144 | 0.0143 | 0.0191 | 0.0432 | 0.0436 | 0.0458 | 0.0455 | |
| 1 | R2 | 98.63% | 98.65% | 98.66% | 97.49% | 87.40% | 87.17% | 85.80% | 84.78% | |
| RG | 1 | MSE | 0.0016 | 0.0011 | 0.001 | 0.0024 | 0.0072 | 0.0077 | 0.0072 | 0.0089 |
| 1 | RMSE | 0.0399 | 0.0333 | 0.031 | 0.0488 | 0.085 | 0.0877 | 0.0851 | 0.0942 | |
| 1 | MAE | 0.0286 | 0.0237 | 0.0226 | 0.0358 | 0.0628 | 0.0662 | 0.0638 | 0.0698 | |
| 1 | R2 | 97.80% | 98.47% | 98.67% | 96.71% | 90.00% | 89.35% | 89.97% | 87.71% |
| Dataset | Point | Metrics | EEMD-BiGRU | EEMD-GRU | EEMD-LSTM | EEMD-DNN | BiGRU | GRU | LSTM | DNN |
|---|---|---|---|---|---|---|---|---|---|---|
| White | 1 | MSE | 0.006 | 0.0056 | 0.0052 | 0.0101 | 0.0247 | 0.0284 | 0.0289 | 0.0325 |
| 1 | RMSE | 0.0774 | 0.0746 | 0.0722 | 0.1007 | 0.1571 | 0.1685 | 0.1699 | 0.1801 | |
| 1 | MAE | 0.0585 | 0.0566 | 0.0543 | 0.0787 | 0.1243 | 0.1322 | 0.1338 | 0.1414 | |
| 1 | R2 | 97.92% | 98.06% | 98.19% | 96.47% | 91.42% | 90.13% | 89.96% | 88.72% | |
| 5 | MSE | 0.0228 | 0.0237 | 0.0221 | 0.0345 | 0.116 | 0.1287 | 0.1123 | 0.1007 | |
| 5 | RMSE | 0.1510 | 0.1539 | 0.1487 | 0.1857 | 0.3406 | 0.3588 | 0.3351 | 0.3173 | |
| 5 | MAE | 0.1137 | 0.1129 | 0.1109 | 0.1375 | 0.2571 | 0.2714 | 0.2536 | 0.2393 | |
| 5 | R2 | 91.66% | 91.34% | 91.91% | 87.39% | 57.59% | 52.93% | 58.93% | 63.18% | |
| 10 | MSE | 0.0793 | 0.0679 | 0.0675 | 0.0853 | 0.1498 | 0.1423 | 0.1459 | 0.1417 | |
| 10 | RMSE | 0.2815 | 0.2606 | 0.2599 | 0.2921 | 0.387 | 0.3772 | 0.382 | 0.3764 | |
| 10 | MAE | 0.2019 | 0.1849 | 0.1869 | 0.2183 | 0.299 | 0.2914 | 0.2954 | 0.2891 | |
| 10 | R2 | 71.15% | 75.29% | 75.42% | 68.95% | 45.48% | 48.22% | 46.90% | 48.43% | |
| 15 | MSE | 0.1218 | 0.1176 | 0.1145 | 0.1462 | 0.1856 | 0.1868 | 0.1794 | 0.1764 | |
| 15 | RMSE | 0.3490 | 0.343 | 0.3383 | 0.3824 | 0.4309 | 0.4322 | 0.4236 | 0.4201 | |
| 15 | MAE | 0.26 | 0.2561 | 0.2478 | 0.289 | 0.332 | 0.3335 | 0.3272 | 0.3258 | |
| 15 | R2 | 57.42% | 58.89% | 59.99% | 48.90% | 35.12% | 34.72% | 37.29% | 38.33% |
Publisher’s Note: MDPI stays neutral with regard to jurisdictional claims in published maps and institutional affiliations. |
© 2022 by the authors. Licensee MDPI, Basel, Switzerland. This article is an open access article distributed under the terms and conditions of the Creative Commons Attribution (CC BY) license (https://creativecommons.org/licenses/by/4.0/).
Share and Cite
Chen, Z.; Yuan, C.; Wu, H.; Zhang, L.; Li, K.; Xue, X.; Wu, L. An Improved Method Based on EEMD-LSTM to Predict Missing Measured Data of Structural Sensors. Appl. Sci. 2022, 12, 9027. https://doi.org/10.3390/app12189027
Chen Z, Yuan C, Wu H, Zhang L, Li K, Xue X, Wu L. An Improved Method Based on EEMD-LSTM to Predict Missing Measured Data of Structural Sensors. Applied Sciences. 2022; 12(18):9027. https://doi.org/10.3390/app12189027
Chicago/Turabian StyleChen, Zengshun, Chenfeng Yuan, Haofan Wu, Likai Zhang, Ke Li, Xuanyi Xue, and Lei Wu. 2022. "An Improved Method Based on EEMD-LSTM to Predict Missing Measured Data of Structural Sensors" Applied Sciences 12, no. 18: 9027. https://doi.org/10.3390/app12189027
APA StyleChen, Z., Yuan, C., Wu, H., Zhang, L., Li, K., Xue, X., & Wu, L. (2022). An Improved Method Based on EEMD-LSTM to Predict Missing Measured Data of Structural Sensors. Applied Sciences, 12(18), 9027. https://doi.org/10.3390/app12189027