Article

Surface Defect Detection of Rolled Steel Based on Lightweight Model

1
School of Automation and Information Engineering, Sichuan University of Science & Engineering, Yibin 644000, China
2
Artificial Intelligence Key Laboratory of Sichuan Province, Sichuan University of Science & Engineering, Zigong 643000, China
*
Author to whom correspondence should be addressed.
Appl. Sci. 2022, 12(17), 8905; https://doi.org/10.3390/app12178905
Submission received: 10 August 2022 / Revised: 1 September 2022 / Accepted: 2 September 2022 / Published: 5 September 2022

Abstract

:
A lightweight rolled steel strip surface defect detection model, YOLOv5s-GCE, is proposed to improve the efficiency and accuracy of industrialized rolled steel strip defect detection. The Ghost module is used to replace the CBS structure in a part of the original YOLOv5s model, and the Ghost bottleneck is employed to replace the bottleneck structure in C3 to minimize the model’s size and make the network lightweight. The EIoU function is added to improve the accuracy of the regression of the prediction frame and accelerate its convergence. The CA (Coordinate Attention) attention method is implemented to reinforce critical feature channels and their position information, enabling the model to identify and find targets correctly. The experimental results demonstrate that the accuracy of YOLOv5s-GCE is 85.7%, which is 3.5% higher than that of the original network; the model size is 7.6 MB, which is 44.9% smaller than that of the original network; the number of model parameters and calculations are reduced by 47.1% and 48.8%, respectively; and the detection speed reached 58.8 fps. YOLOv5s-GCE meets the necessity for real-time identification of rolled steel flaws in industrial production compared to other common algorithms.

1. Introduction

The rolled strip is widely used in national defense, aerospace, and other manufacturing industries and is a critical steel product. With the continuous improvement of scientific technology and industrial levels, the iron and steel manufacturing industry has made significant progress [1]. In the production process of strip steel, it will be affected by various factors, such as the performance of rolling equipment and fluctuations in the production process [2]. These factors may cause various defects on the surface of the strip, reduce the quality of the strip products, and cause severe economic losses. Therefore, it is necessary to carry out surface defect detection on strip steel.
Traditionally, rolled steel defects are detected through manual visual inspection. This technique has low detection effectiveness, is easily influenced by the inspector’s personality, and has the dangers of missed detection and false detection. As a result of the rapid advancement of computer vision technology, many image processing and traditional machine learning techniques are employed to ensure product quality. To identify and localize defects, the area of pixel mutation is identified in the image based on the color and shape features of the defects [3]. This form of detection is quick and inexpensive, making it a suitable alternative to artificial vision for detection, hence significantly enhancing the production efficiency of businesses. However, traditional machine learning techniques need human feature design and extraction; when surface imperfections vary, the algorithm must be modified, making it impossible for the traditional machine algorithm to fulfill the increasingly complex needs of industrial production [4].
Numerous deep learning-based techniques are employed for defect identification and classification due to the rapid development of convolutional neural networks [5]. There are two general categories of defect detection algorithms now in use: two-stage target detection algorithms and one-stage target detection algorithms. After feature extraction, a two-stage target detection algorithm creates a pre-selection box (region proposal) that might include the object to be detected. Following this, a sample classification calculation is made using a convolutional neural network, such as R-CNN [6], SPP-Net [7], Fast R-CNN [8], and Faster R-CNN [9]. One-stage target detection algorithms, such as OverFeat [10], YOLO [11], SSD [12], RetinaNet [13], and others, directly extract feature values from the network to classify and find targets. The deep learning technique automatically extracts features during picture recognition by using the image’s pixel information as input. The created detection model can identify a range of faults after learning from a large number of samples, increasing the effectiveness and generalization of defect detection.
Although deep learning models have excellent capabilities, model training requires powerful computer hardware. The weight files generated by training are typically several hundreds of megabytes, making deployment on devices with low resources challenging. Numerous lightweight networks, such as EfficientNet [14], MobileNet [15], ShuffleNet [16], and GhostNet [17], have been presented to reduce the number of model parameters and computations. Under the premise of preserving accuracy to the greatest extent feasible, these networks are optimized in terms of volume and speed, allowing them to achieve optimal performance and fulfill the needs of practical applications when processing power and storage space are restricted. Due to the reduction in the number of parameters and the quantity of computation, certain flaws may be overlooked during the feature extraction process of a lightweight network. Attention mechanisms such as SENet [18], ECANet [19], and CBAM [20] assist in improving the feature expression of small target detection networks, i.e., focusing on essential features and suppressing unnecessary features, which can effectively improve image classification and target detection performance.
This research will employ the method of deep learning to detect surface defects on rolled steel. Based on YOLOv5s, an enhanced YOLOv5s algorithm is presented to improve the accuracy of rolled steel flaw detection and actualize the network’s lightweight to satisfy industrial production needs and real-time detection requirements.

2. Related Works

2.1. The Traditional Methods

Traditional methods for flaw identification rely mostly on image processing and machine learning. Methods based on image processing typically employ an image feature extraction or template matching algorithm to detect defects [21,22,23]. This approach has limitations for different background defect detection. Simultaneously, the retrieval and matching of templates may significantly increase the detection time. Support vector machines and decision trees are typically used by machine learning-based approaches to classify faulty samples [24]. For instance, Guo et al. [25] employed machine vision techniques to categorize surface flaws of steel plates using support vector machines, and the recognition accuracy rate exceeded 90%. Hua et al. [26] introduced a classifier that combines an optimized BP neural network, a probabilistic neural network, and an enhanced support vector machine and requires just 6ms for a single defect map of cold rolled strip. Guo et al. [27] employed a decision tree classifier to detect diode surface flaws, with an accuracy rate of 92.3 percent.

2.2. The Deep-Learning-Based Methods

Deep learning can automatically extract features by means of convolutional neural networks, and it has a broad scope and high adaptability. Weng et al. [28] introduced an enhanced Mask R-CNN technique that uses the k-means II clustering algorithm to improve the production of anchor boxes, eliminates the mask branch, and achieves a detection rate of 5.9 frames per second. On the basis of YOLOv3, Li et al. [29] adjusted the a priori frame settings using the weighted K-means method and added a large-scale detection layer, resulting in an 11% increase in detection accuracy. Based on the Resnet50 and MobilenetV3 models, Yuan et al. [30] created an enhanced lightweight neural network model using the knowledge distillation technique. On average, it took 24 milliseconds per image for the mobile terminal to detect steel surface flaws. Deep learning has been applied extensively in the industrial sector, and the trend to realize online detection of industrial production is to investigate a more precise learning framework, reduce the complexity of the learning model, and enhance the real-time performance of the defect detection system.

3. Methods and Principles

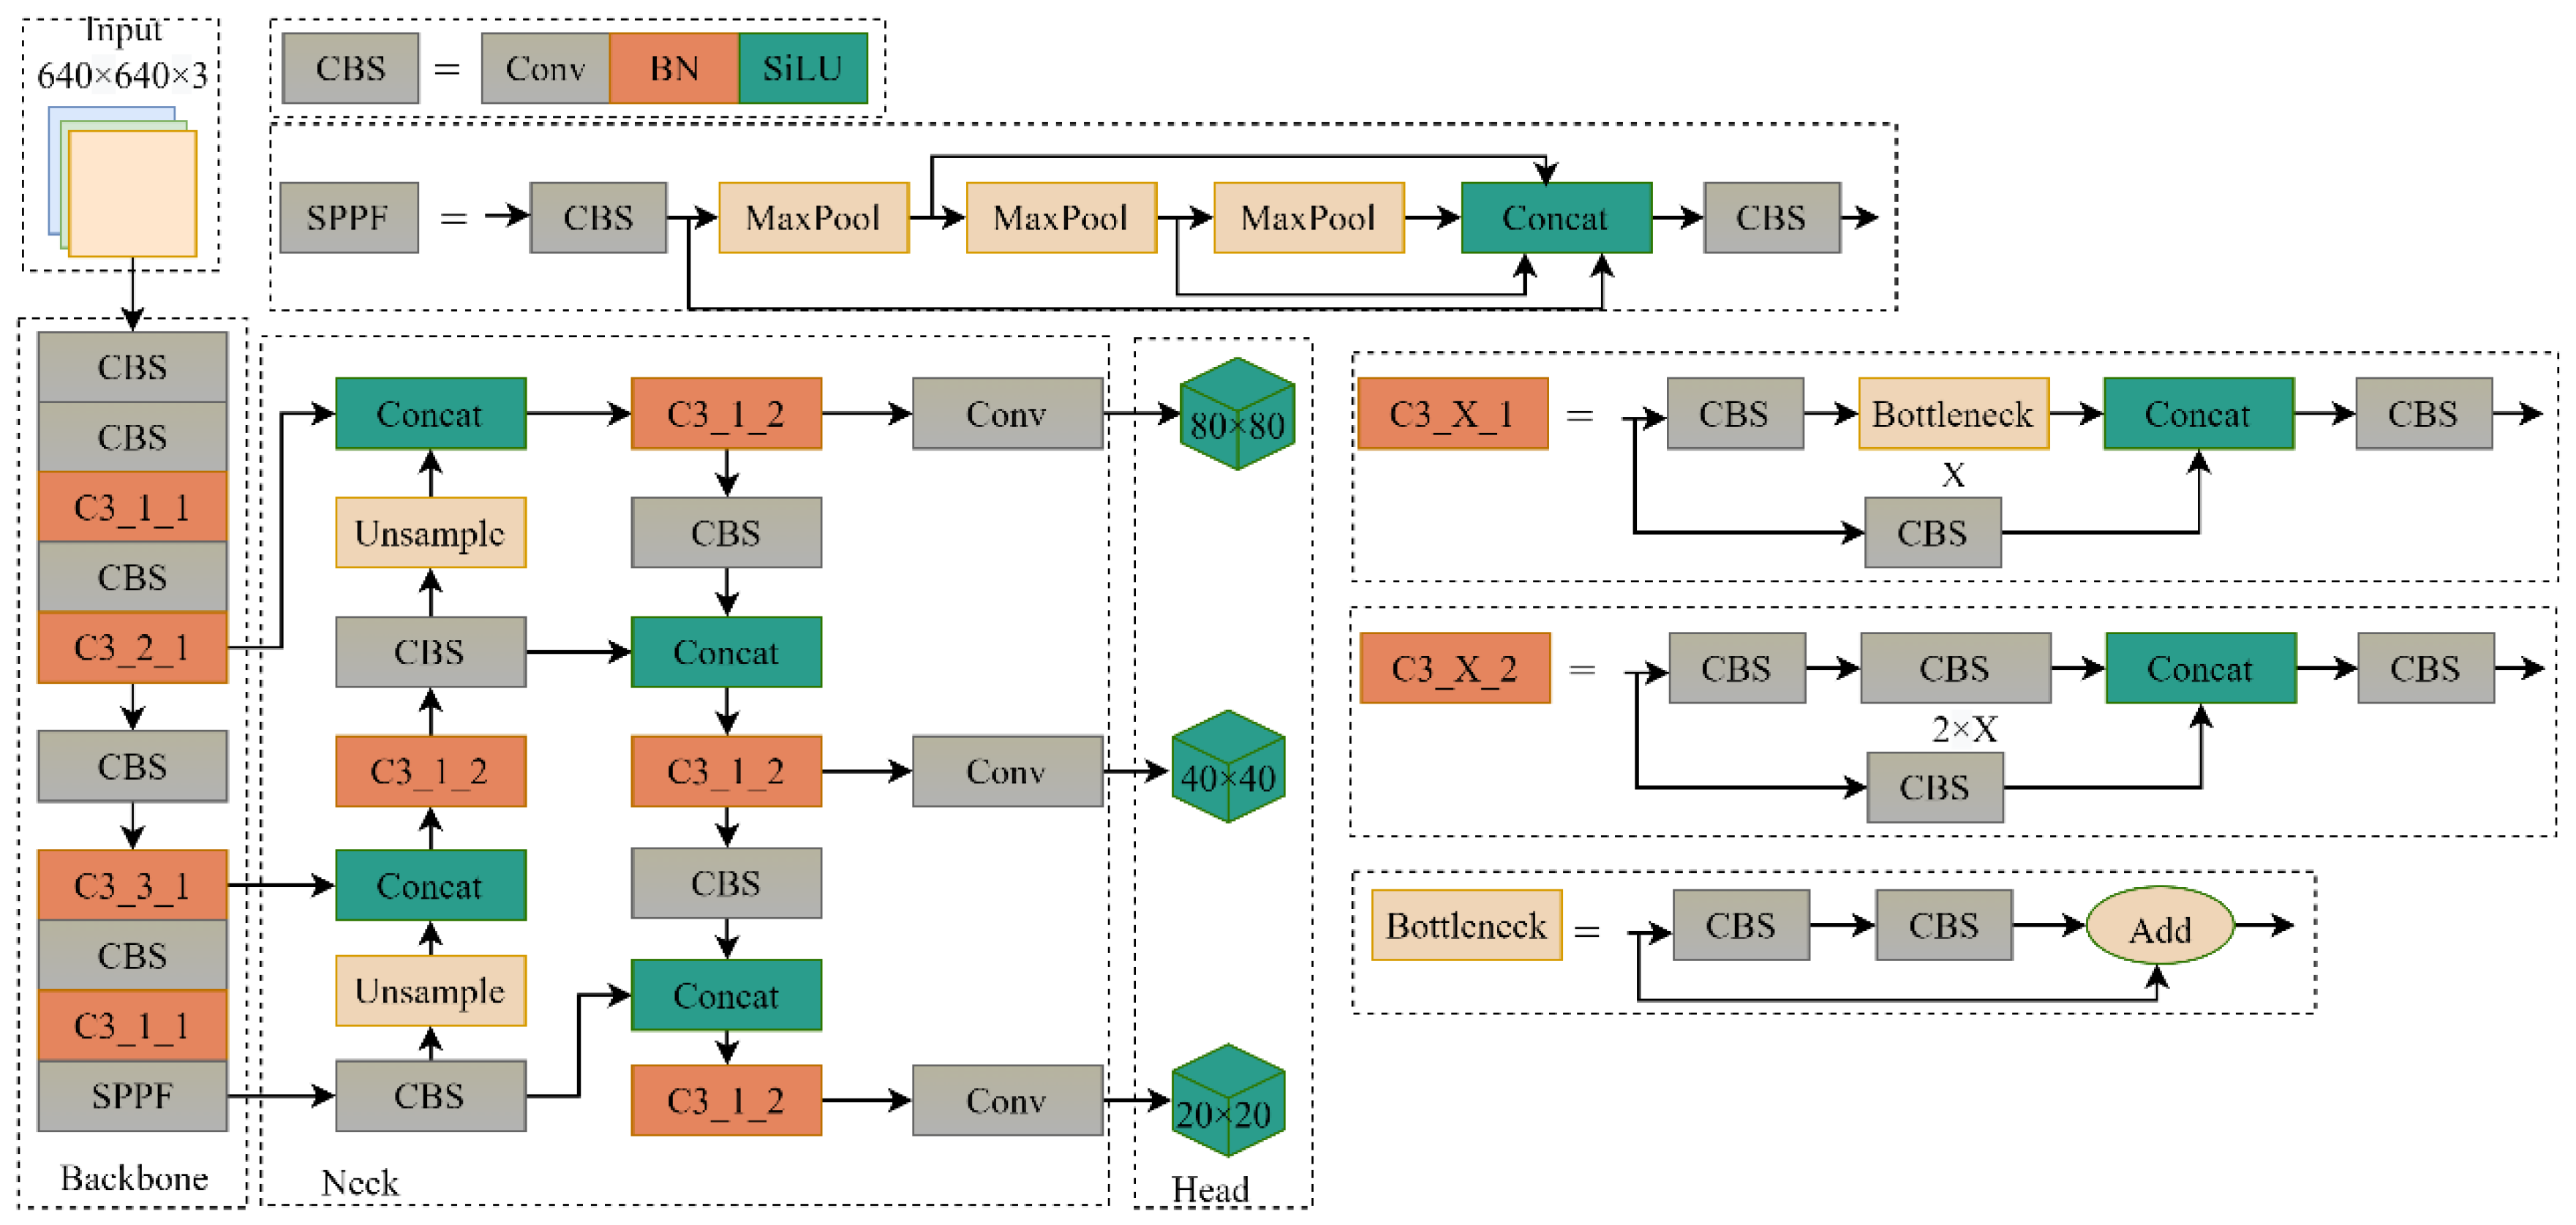
3.1. The Principle of YOLOv5

YOLO (You Only Look Once) [11] is a target detection algorithm based on the deep neural network, which runs fast and can meet the requirements of real-time detection. The overall network structure of YOLOv5 and YOLOv4 is similar. It contains four models, namely YOLOv5s, YOLOv5m, YOLOv5l, and YOLOv5x. The model complexity and depth increase in turn. In this paper, YOLOv5s is selected as the basic model. Its network structure mainly includes four parts: the input terminal ‘Input’, the backbone network ‘Backbone’, the neck ‘Neck’, and the detection head ‘Head’, as shown in Figure 1.
Input: The data samples are randomly scaled, cropped, and arranged in the Mosaic method to enhance the data; the prediction frame is compared with the pre-labeled frame, and the difference is calculated, and then the network parameters are updated in reverse to independently calculate the maximum value of each training. Best anchor box: reduce redundant information and improve inference speed through adaptive image scaling.
Backbone: This part can extract image features, including the C3 module, to speed up inference and the spatial pyramid pooling module SPPF. The C3 in the Backbone part uses the C3_X_1 structure.
Neck: This is the feature fusion part, consisting of C3 and PANet [31] modules. The PANet module contains a Feature Pyramid Network (FPN [32]) and Pyramid Attention Network (PAN [33]). FPN is a top-down upsampling fusion feature pyramid, and PAN is a bottom-up downsampling fusion feature pyramid. The C3 in the Neck part uses the C3_X_2 structure.
Head: This part is the prediction part of the network, using weighted non-maximum suppression (NMS [34]) to filter the target box, using CIoU Loss [35] as the bounding box loss function.

3.2. The Improved Network

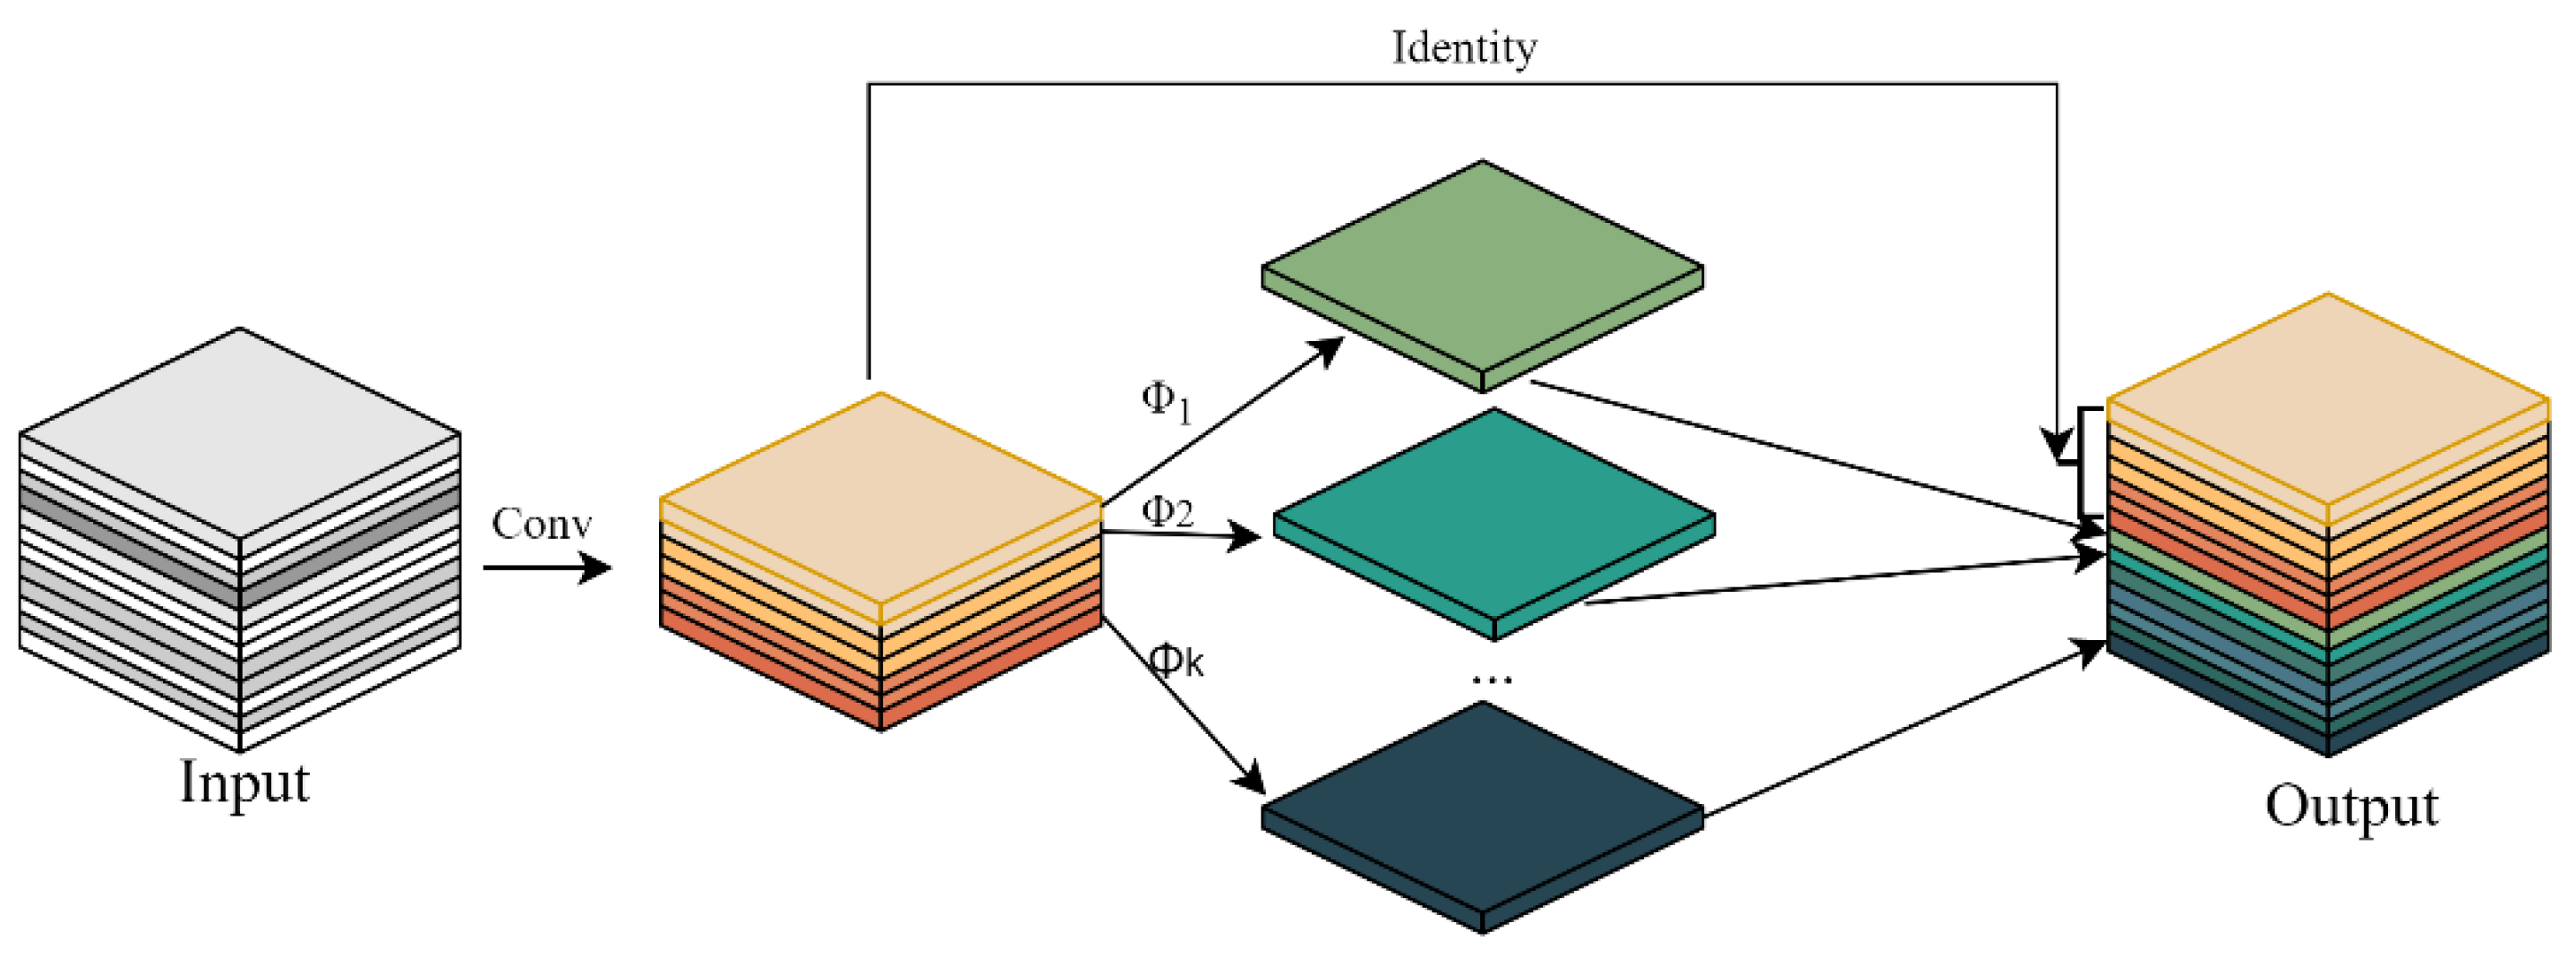
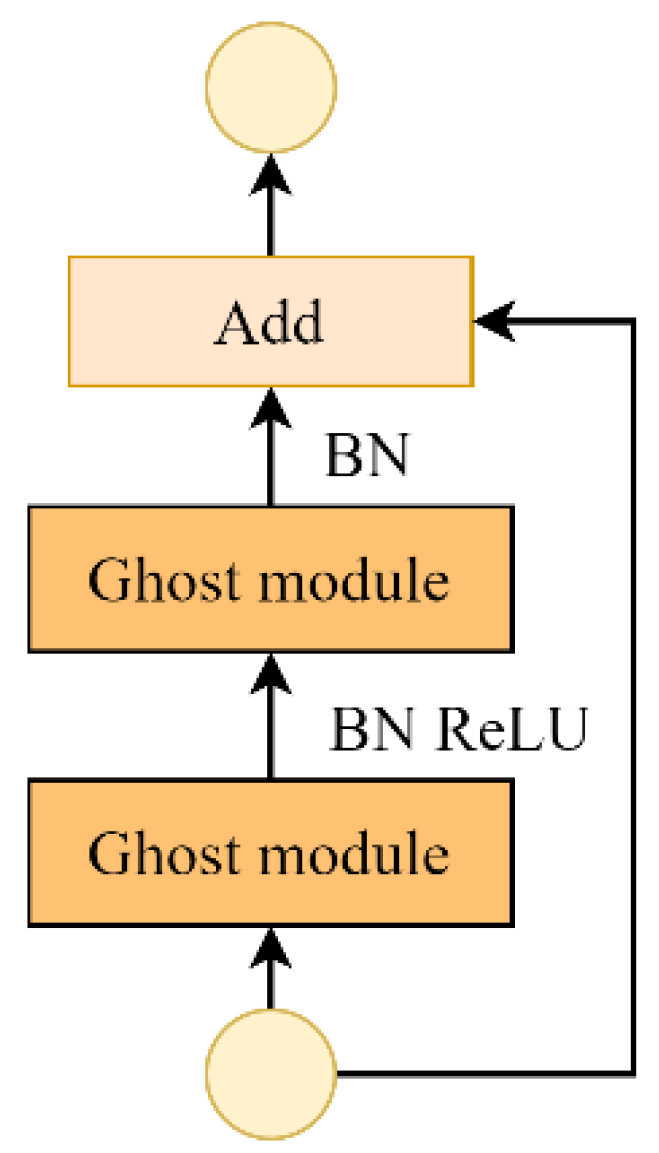
3.2.1. The Lightweight Module

The Ghost module [17] can generate more feature maps with a small number of parameters after a series of simple linear operations, as is shown in Figure 2. Its parameter and calculation amounts are lower than those of ordinary convolutional neural networks. The calculation method is as follows:
First, extract the feature layer and generate a feature map set by convolution operation, where X is the input feature map with width h , length w , and the number of channels c ; f is the number of input channels c , and the number of output channels is m , the convolution kernel is a k × k convolutional layer; Y is a feature map set with a width of h , a length of w , and the number of channels of m generated after convolution, as shown in Equation (1):
Y = X f , Y R h × w × m , X R h × w × c , f = R c × k × k × m
Then, perform the linear transformation on each element in Y = [ y 1 , y 2 , , y m ] , generate a total of s Ghost feature maps, and finally, obtain a total of m s feature map sets Y = [ y 11 , y 12 , , y m s ] , as shown in Equation (2). Compared with ordinary convolution, the calculation amount is reduced by about s times.
y i , j = Φ i , j ( y i ) , i = 1 , 2 , 3 , , m , j = 1 , 2 , 3 , , s
The Ghost bottleneck consists of two Ghost modules stacked with a stride of 1. The structure is shown in Figure 3. After the input passes through the first Ghost module, the number of channels will increase. After passing through the second Ghost module, the number of output channels will decrease so that it can match the number of input channels and then perform the shortcut operation.
Therefore, in this paper, the Ghost module is used in the backbone network to replace part of the CBS structure. The Ghost bottleneck is used to replace the bottleneck structure in C3, which can effectively reduce the number of model parameters and complexity.

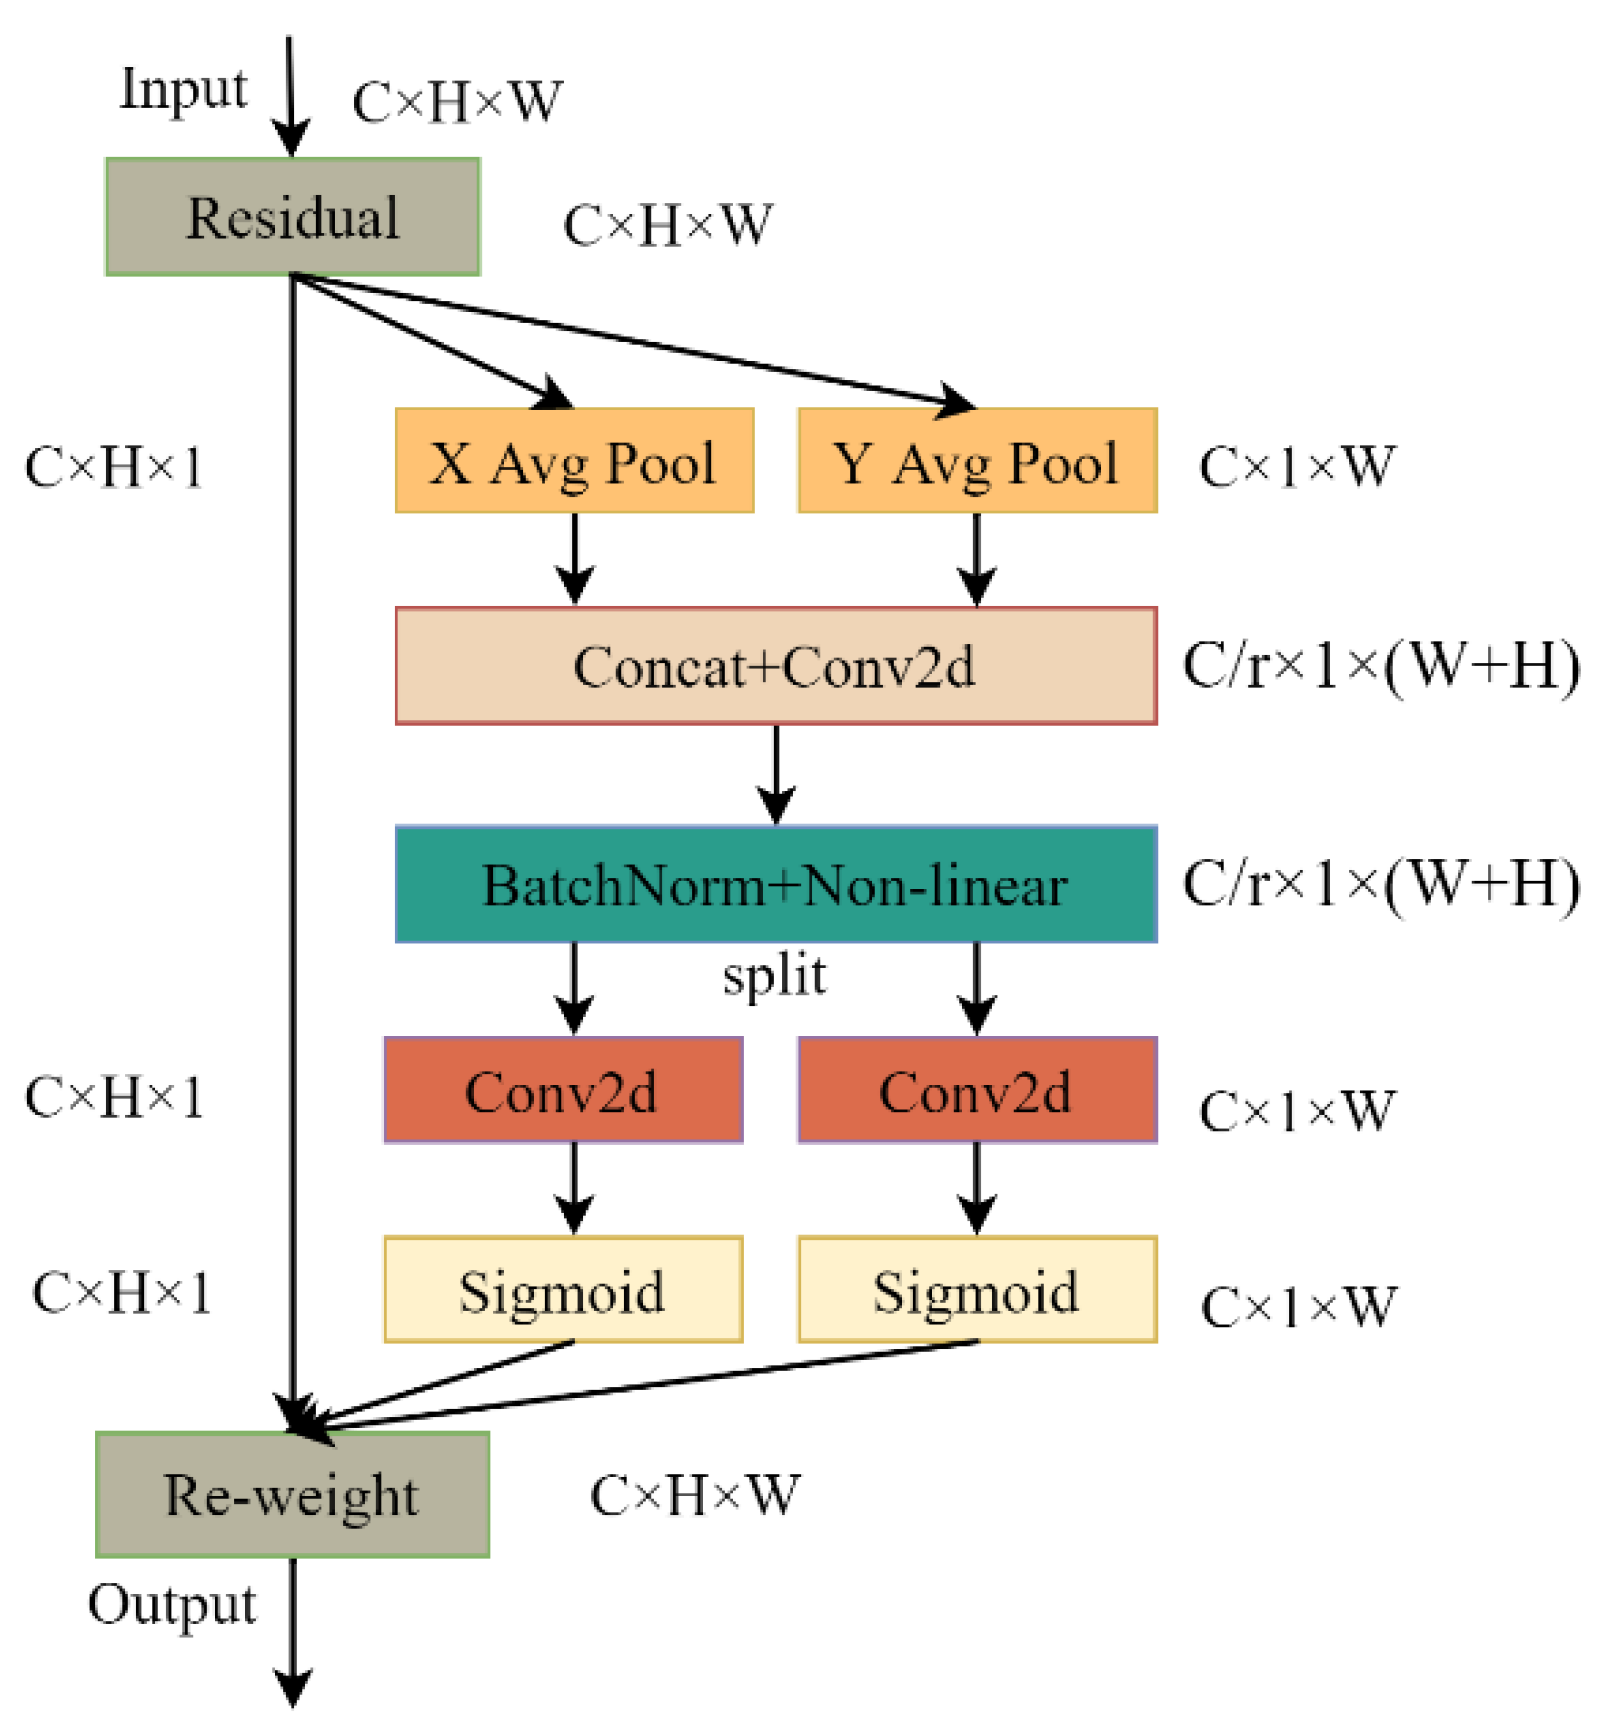
3.2.2. Coordinate Attention Mechanism

The channel attention mechanism assigns different weights to each feature channel according to its importance, allowing the neural network to focus on specific feature channels. The channel attention mechanism can improve the model’s performance to a certain extent, but it often ignores the location information that is very important for generating spatially selective attention maps. The authors of the CA (Coordinate Attention) mechanism [36] added location information to the channel attention, which can help the model identify and locate objects more accurately. Its network structure is shown in Figure 4. Coordinate Attention decomposes channel attention into two one-dimensional feature encoding processes, capturing long-range dependencies along one spatial direction and retaining precise location information along the other. The generated feature maps are then separately encoded to form a pair of orientation-aware and position-sensitive feature maps, which can be complementarily applied to the input feature maps to enhance the representation of objects of interest.
Coordinate Attention encodes channel relationships and long-term dependencies through precise location information. The specific operations are divided into two steps: coordinate information embedding and Coordinate Attention generation. In the process of coordinate information embedding, the global pooling is first decomposed into one-to-one one-dimensional feature encoding according to Equation (3):
z c = 1 H × W i = 1 H j = 1 W x c ( i , j )
For input X , using pooling kernels of size ( H , 1 ) and ( 1 , W ) to encode each channel along the horizontal and vertical coordinates, respectively, the output of the channel c of height h is as shown in Equation (4):
z c h ( h ) = 1 W 0 i < W x c ( h , i ) ,
the output of the channel c of width w is as shown in Equation (5):
z c w ( w ) = 1 H 0 j < H x c ( j , w ) ,
the above two transformations aggregate features along two spatial directions to obtain a pair of direction-aware feature maps.
To make use of the above information, in Coordinate Attention generation, the above transformation is firstly subjected to the concat operation. Then the convolution transformation function F 1 is used to transform it, as shown in Equation (6):
f = δ ( F 1 ( [ z h , z w ] ) ) ,
where δ is the nonlinear activation function, and f is the intermediate feature map that encodes spatial information in horizontal and vertical directions.
Then decompose f into tensors f h and f w along the spatial dimension, and use two 1 1 convolutional transforms F h and F w to transform f h and f w into tensors with the same number of channels, respectively, as shown in Equations (7) and (8):
g h = σ ( F h ( f h ) ) ,
g w = σ ( F w ( f w ) ) ,
then the outputs g h and g w are extended as attention weights, respectively. The final output Y is as shown in Equation (9):
y c ( i , j ) = x c ( i , j ) × g c h ( i ) × g c w ( j )

3.2.3. The EIoU Function

In the defect detection process, the algorithm will generate multiple prediction frames for the position of the same defect, so it is necessary to filter the redundant prediction frames to make the prediction output close to the actual value. In YOLOv5, CIoU is used as an indicator to measure the degree of coincidence of two borders, which takes the overlapping area, center point distance, and aspect ratio into consideration, which speeds up the convergence of the model to a certain extent. However, when the width, height, and aspect ratio of the prediction box and the actual box are linearly related, the width and height of the prediction box cannot be increased or decreased simultaneously, which will hinder the effective optimization of the model.
Based on CIoU, EIoU [37] disassembles the influence factors of the aspect ratio of the predicted frame and the actual frame and calculates the length and width of the predicted frame and the actual frame, respectively, solving the problems of CIoU and improving the model performance. Its definition formula is shown in Equation (10):
L E I O U = L I O U + L d i s + L a s p = 1 I O U + ρ 2 ( o , o g t ) c 2 + ρ 2 ( k , k g t ) C w 2 + ρ 2 ( g , g g t ) C h 2 ,
where L I O U , L d i s , L a s p represent overlap loss, center distance loss, and width and height loss, respectively. I O U represents the ratio of intersection and union between predicted boxes and ground truth boxes. o , o g t represent the center point of the predicted box and the actual box, respectively. k , k g t represent the width of the predicted box and the actual box, respectively. g , g g t represent the height of the predicted box and the actual box, respectively. ρ represents the Euclidean distance calculation. C w , C h are the width and height of the minimum bounding box covering the predicted and ground-truth boxes.

3.3. Proposed Model

In this study, the convolutional structure in the backbone and neck is swapped out for the Ghost module, which decreases the complexity of the model and the need for parameter calculations while generating more features with fewer parameters when extracting features from the network. To improve the network’s sensitivity to information such as direction and location and enable the network to capture critical feature information, three Coordinate Attentions are added to the backbone network. EIoU Loss can improve the position of the predicted bounding box, speed up convergence, and increase accuracy. The improved model is displayed in Figure 5.

4. Experiment and Results

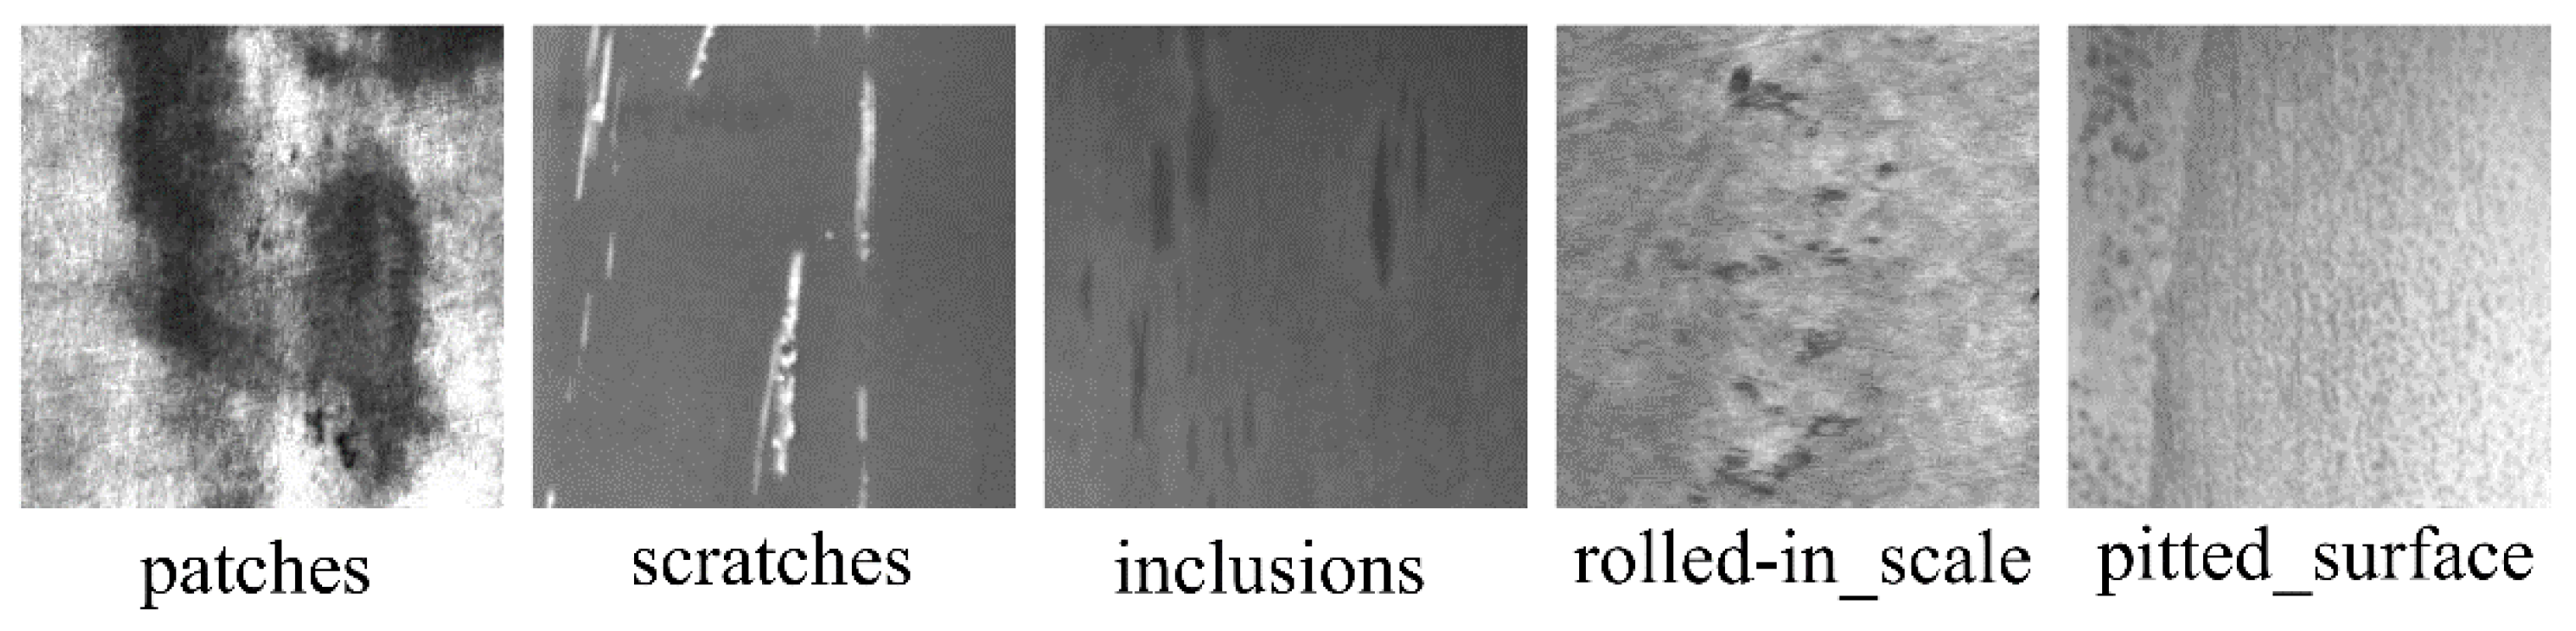
4.1. Experimental Environmen and Dataset

This experiment is implemented under the Windows 11 operating system. The CPU is i7-10750H, and the memory is 16 GB; the GPU is RTX2060, and the video memory is 8 GB; the operating environment is PyCharm, the Python version is 3.6, and the deep learning framework is PyTorch1.7.1; Cuda10.2 and Cudnn8.4.0 are used to achieve GPU acceleration.
This experiment uses the steel surface defect data set NEU-DET [38] produced by Song’s team at Northeastern University to detect the five defects contained in it, namely patches, scratches, inclusions, rolled-in_scale and pitted_surface. Each defect type contains 300 pictures, the picture resolution is 200 × 200, and it is a grayscale image. Label the defects in the data set using Labeling software, and finally, generate a label file in the format of XML, and divide the data set into training set and validation set according to the ratio of 9:1, namely 1350 training sets and 150 validation sets. Figure 6 shows pictures of different defect types in the dataset.

4.2. Training and Evaluation Indicators

The model is trained for 300 epochs, the batch size is 16, and the initial learning rate is 0.01. The SGD optimization algorithm is used in the training process, and the weight decay coefficient is 0.0005. The transfer learning method is adopted to reduce the training time, and the network weights obtained by YOLOv5 trained on the large COCO dataset are used as the initial weights of the model.
This paper uses the model parameters ‘Parameters’, calculation amount GFLOPs, model volume, detection rate fps, model accuracy rate ‘Precision; (P), recall rate ‘Recall’ (R), and mean average precision mAP as the performance evaluation criteria of the model. Parameters is the number of parameters of the model; GFLOPs is the number of floating-point operations performed by the model; model volume is the size of the weight generated by the model; fps is the number of images recognized by the model in one second. For the ratio of all detected positive samples, the recall rate R is the ratio of correctly detected positive samples to all positive samples; the average precision AP is the average of the precision rates P corresponding to all recall rates R; the mean average precision mAP is all categories. The mean of the AP value is calculated as shown in Equations (11)–(14):
P = T P T P + F P ,
R = T P T P + F N ,
A P = 0 1 P ( R ) d R ,
m A P = 1 n i = 1 n A P k ,
where T P is the number of correctly detected positive samples; F P is the number of false positive samples detected; F N is the number of detected errors in all positive samples; n is the number of all types.

4.3. Ablation Studies

To verify the feasibility of the network improvement in this paper, five groups of control experiments were set up, and the effects of each improvement point on the model performance were compared and analyzed. The results are shown in Table 1.
YOLOv5s is the original model, YOLOv5s-G is a network with the Ghost module added, YOLOv5s-C is a network with attention mechanism CA added, YOLOv5s-E is a network using EIoU loss, YOLOv5s-GCE is a network that incorporates the above three improvement points. It can be known from the table that compared with YOLOv5s, the parameters and computation of YOLOv5s-G are reduced by 47.5% and 48.7%, respectively, the model volume is reduced by 45.7%, and the accuracy is improved by 1.8%, which shows that the use of the Ghost module can be used without affecting the model. Under the premise of high accuracy and speed, the amount and volume of model parameters are significantly reduced. The parameters and model volume of YOLOv5s-C are slightly larger than the original model. However, the accuracy has increased by 1.4%, and the amount of calculation remains unchanged, which shows that the introduction of the CA attention mechanism can enable the model to extract features effectively. Compared with the original model, YOLOv5s-E has almost no change, and the accuracy is slightly increased, but the model detection speed is increased by 23%, which proves that the addition of EIoU can make the model more accurate in localization and classification. Compared with the original model, the improved YOLOv5s-GCE model reduces the number of parameters by 47.1%, the amount of calculation by 48.7%, the model volume by 44.9%, and the accuracy increased by 3.5%, and the fps decreased by only 5.9%.
The comparison of the accuracy of YOLOv5s and the improved model YOLOv5s-GCE on the detection results of various defects is shown in Figure 7. The comparison analysis shows that the improved model specifically affects detecting patches, scratches, inclusion, and pitted_surface. The average detection accuracy is increased by 1.2%, 0.4%, 3.3%, and 12.5%, respectively, and the detection accuracy of the two types of defects, inclusion, and pitted_surface, is improved the most. For the defect type of rolled-in_scale, the detection accuracy of the improved model is the same as that of the original YOLOv5s model.
The YOLOv5s and algorithm models in this paper are used to detect the defect pictures, respectively, as shown in Figure 8. From the two detection results, it can be found that YOLOv5s-GCE detects the targets that were not detected in the original YOLOv5s, reducing the missed detection rate of the model. Moreover, from the detection results of such defects as rolled-in_scale, it can be seen that the improved model can locate the defect position more accurately. Hence, the improved YOLOv5s-GCE model has a better detection effect on each defect than the original YOLOv5s model.

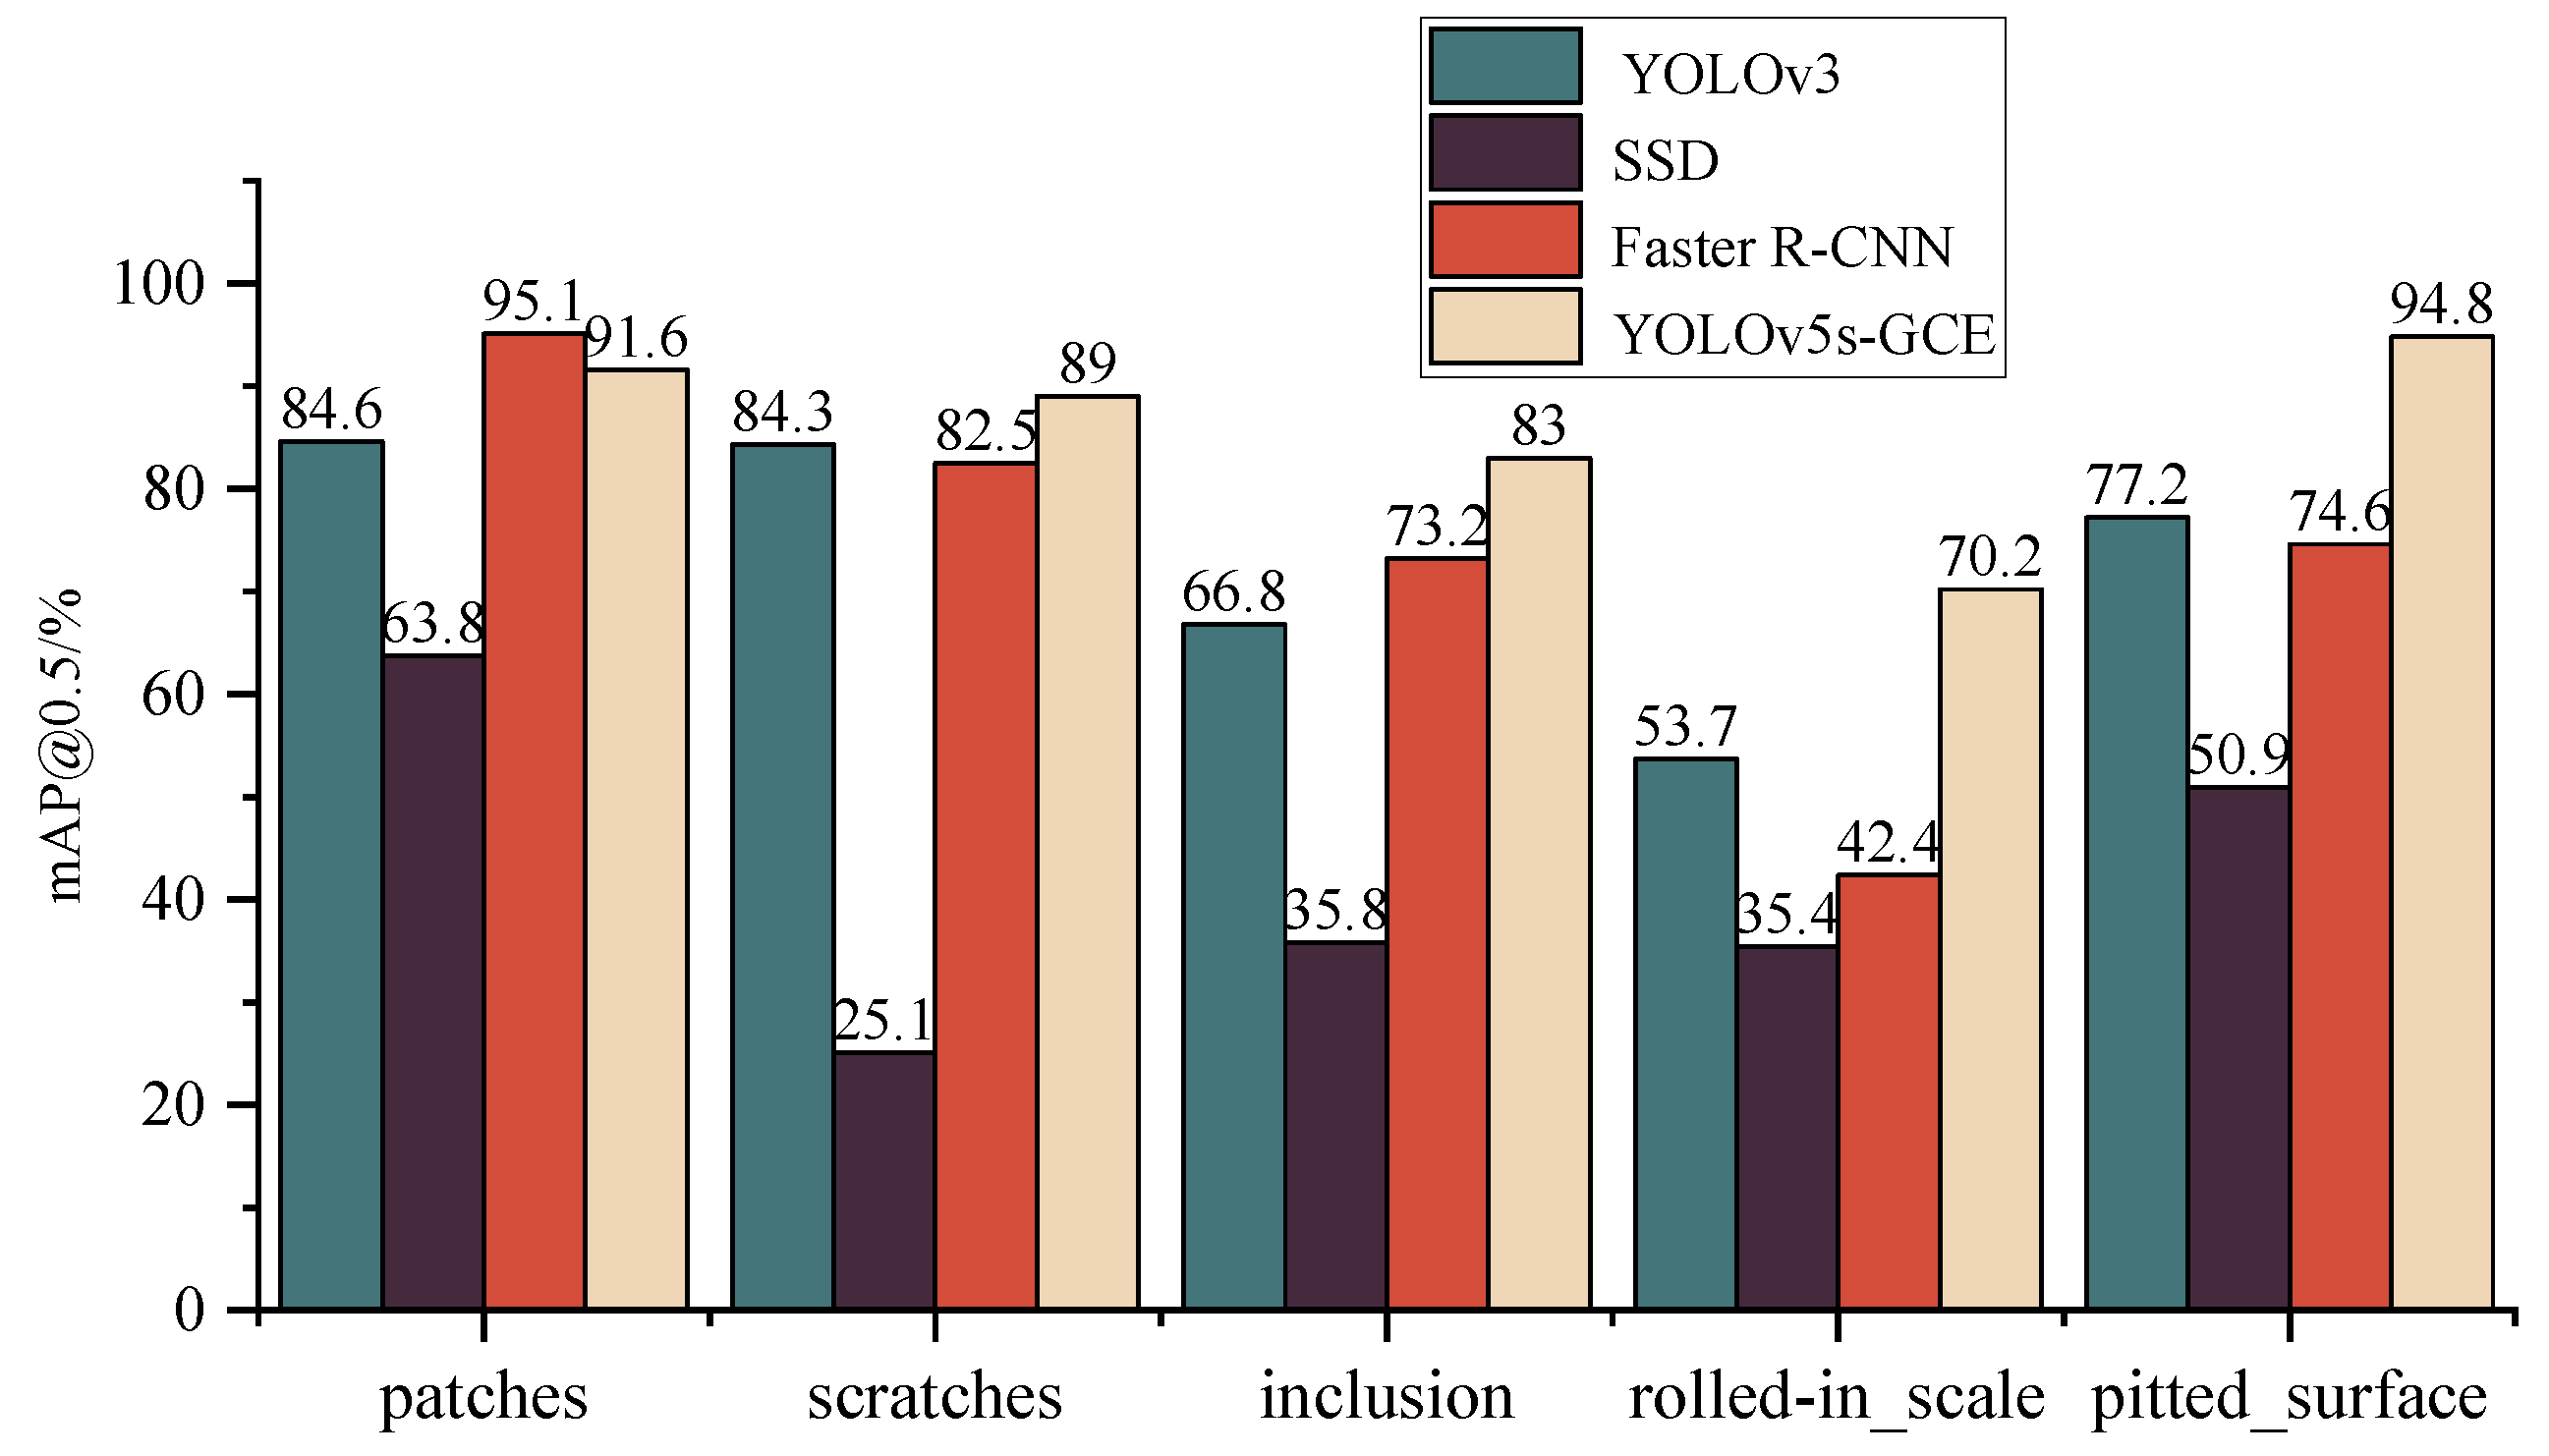
4.4. Comparison Experiment of Different Algorithms

This paper picks three popular target detection methods, YOLOv3, SSD, and Faster R-CNN, and conducts experiments on the same dataset to further validate the detection performance of the technique presented here. The results are shown in Table 2 and Figure 9.
From the analysis in Table 2 and Figure 6, the results can identify that YOLOv3 and Faster R-CNN have similar detection accuracy. However, Faster R-CNN has far more parameters and calculations than YOLOv3, and the detection speed is also low. The detection accuracy of SSD is the lowest, but the detection speed is higher than that of YOLOv3 and Faster R-CNN. The mAP value of the YOLOv5s-GCE algorithm in this paper is 12.4%, 43.5%, and 12.1% higher than that of YOLOv3, SSD, and Faster R-CNN, respectively. The detection accuracy of YOLOv5s-GCE for defect patches is slightly lower than that of Faster R-CNN. However, the detection accuracy of other defects is higher than the other three algorithms, which can meet the high requirements of model detection accuracy in actual defect detection. While the YOLOv5s-GCE algorithm maintains high precision, the model’s amount of parameters and calculations are far lower than the other three algorithms. The model size is only 7.6 MB, which is more suitable for mobile applications, and the detection speed also reaches 58.8 fps. Based on the above analysis, the comprehensive detection performance of the YOLOv5s-GCE algorithm in this paper is better than that of the mainstream target detection algorithms such as YOLOv3, SSD, and Faster R-CNN. The model is small in size and high in detection speed. It can meet the real-time detection requirements of rolled steel in industrial defect detection.

5. Conclusions

This paper designs the lightweight YOLOv5s-GCE model for detecting surface flaws in rolled steel. By reducing the model’s calculation and parameter requirements, the Ghost module makes the model faster and easier for deploying on mobile devices with subpar technology. Adding the CA attention mechanism and EIoU loss causes the model to pay closer attention to the fundamental features, increasing the model’s detection precision and speeding up its convergence. According to the experimental findings, YOLOv5s-GCE has a detection accuracy of 85.7%, a detection speed of 58.8 frames per second, and a model size of just 7.6 MB. YOLOv5s-GCE has the smallest volume and strikes the ideal balance between preserving detection accuracy and speed compared to other widely used detection algorithms. Nevertheless, there is still room for improvement in this model’s detection performance for some small targets. The model will be further optimized to increase detection accuracy in the subsequent stage, and it may even be combined with a mobile terminal to detect defects practically.

Author Contributions

Conceptualization, Y.Z. and S.L.; methodology, Y.Z. and H.Z.; software, Y.Z.; validation, X.Z.; resources, S.Z.; data curation, X.L.; writing—original draft preparation, Y.Z.; writing—review and editing, Y.Z. and S.Z.; supervision, Y.Z. All authors have read and agreed to the published version of the manuscript.

Funding

This research was funded by the Sichuan Provincial Department of Science and Technology Projects (Grant No. 2020YFSY0027, 2020YFG0178).

Institutional Review Board Statement

Not applicable.

Informed Consent Statement

Not applicable.

Data Availability Statement

Not applicable.

Conflicts of Interest

The authors declare no conflict of interest.

References

  1. Hu, G. Research on Steel Surface Defect Inspection System Based on Computer Vision. Master’s Thesis, Harbin University of Science and Technology, Harbin, China, 2013. [Google Scholar]
  2. Wu, H.; Lv, Q.; Diraco, G. Hot-Rolled Steel Strip Surface Inspection Based on Transfer Learning Model. J. Sens. 2021, 2021, 6637252. [Google Scholar] [CrossRef]
  3. Luo, D.; Cai, Y.; Yang, Z.; Zhang, Z.; Zhou, Y.; Bai, X. Survey on industrial defect detection with deep learning. Sci. Sin. 2022, 52, 1002–1039. [Google Scholar] [CrossRef]
  4. Wang, L. Research on Workpiece Surface Defect Detection Based on Deep Learning. Master’s Thesis, Southwest University of Science and Technology, Mianyang, China, 2022. [Google Scholar]
  5. LeCun, Y.; Bengio, Y.; Hinton, G. Deep learning. Nature 2015, 521, 436–444. [Google Scholar] [CrossRef]
  6. Girshick, R.; Donahue, J.; Darrell, T.; Malik, J. Rich Feature Hierarchies for Accurate Object Detection and Semantic Segmentation. In Proceedings of the IEEE Conference on Computer Vision and Pattern Recognition, Columbus, OH, USA, 23–28 June 2014; pp. 580–587. [Google Scholar]
  7. He, K.; Zhang, X.; Ren, S.; Sun, J. Spatial Pyramid Pooling in Deep Convolutional Networks for Visual Recognition. IEEE Trans. Pattern Anal. Mach. Intell. 2015, 37, 1904–1916. [Google Scholar] [CrossRef] [PubMed]
  8. Girshick, R. Fast R-CNN. In Proceedings of the IEEE International Conference on Computer Vision, Santiago, Chile, 7–13 December 2015; pp. 1440–1448. [Google Scholar]
  9. Ren, S.; He, K.; Girshick, R.; Sun, J. Faster R-CNN: Towards Real-Time Object Detection with Region Proposal Networks. IEEE Trans. Pattern Anal. Mach. Intell. 2017, 39, 1137–1149. [Google Scholar] [CrossRef] [PubMed]
  10. Sermanet, P.; Eigen, D.; Zhang, X.; Mathieu, M.; Fergus, R.; LeCun, Y. Overfeat: Integrated recognition, localization and detection using convolutional networks. arXiv 2013, arXiv:1312.6229. [Google Scholar]
  11. Redmon, J.; Divvala, S.; Girshick, R. You Only Look Once: Unified, Real-Time Object Detection. In Proceedings of the IEEE Conference on Computer Vision and Pattern Recognition, Las Vegas, NV, USA, 12 December 2016; pp. 779–788. [Google Scholar]
  12. Liu, W.; Anguelov, D.; Erhan, D.; Szegedy, C.; Reed, S.; Fu, C.Y.; Berg, A.C. SSD: Single Shot Multibox Detector. In Proceedings of the European Conference on Computer Vision, Amsterdam, The Netherlands, 8–16 October 2016; pp. 21–37. [Google Scholar]
  13. Lin, T.Y.; Goyal, P.; Girshick, R.; He, K.; Dollár, P. Focal Loss for Dense Object Detection. In Proceedings of the IEEE International Conference on Computer Vision, Venice, Italy, 22–29 October 2017; pp. 2980–2988. [Google Scholar]
  14. Tan, M.; Le, Q. Efficientnet: Rethinking model scaling for convolutional neural networks. In Proceedings of the International Conference on Machine Learning, Long Beach, CA, USA, 10–15 June 2019; pp. 6105–6114. [Google Scholar]
  15. Howard, A.; Zhu, M.; Chen, B.; Kalenichenko, D.; Wang, W.; Weyand, T.; Andreetto, M.; Adam, H. MobileNets: Efficient Convolutional Neural Networks for Mobile Vision Applications. arXiv 2017, arXiv:1704.04861. [Google Scholar]
  16. Zhang, X.; Zhou, X.; Lin, M.; Sun, J. ShuffleNet: An Extremely Efficient Convolutional Neural Network for Mobile Devices. In Proceedings of the IEEE Conference on Computer Vision and Pattern Recognition, Salt Lake City, UT, USA, 18–23 June 2018; pp. 6848–6856. [Google Scholar]
  17. Han, K.; Wang, Y.; Tian, Q.; Guo, J.; Xu, C.; Xu, C. GhostNet: More Features From Cheap Operations. In Proceedings of the IEEE Conference on Computer Vision and Pattern Recognition, Seattle, WA, USA, 13–19 June 2020; pp. 1580–1589. [Google Scholar]
  18. Hu, J.; Shen, L.; Sun, G. Squeeze-and-excitation networks. In Proceedings of the IEEE Conference on Computer Vision and Pattern Recognition, Salt Lake City, UT, USA, 18–23 June 2018; pp. 7132–7141. [Google Scholar]
  19. Wang, Q.; Wu, B.; Zhu, P.; Li, P.; Zuo, W.; Hu, Q. ECA-Net: Efficient Channel Attention for Deep Convolutional Neural Networks. In Proceedings of the IEEE Conference on Computer Vision and Pattern Recognition, Seattle, WA, USA, 13–19 June 2020; pp. 11531–11539. [Google Scholar]
  20. Woo, S.; Park, J.; Lee, J.; Kweon, I.S. CBAM: Convolutional Block Attention Module. In Proceedings of the European Conference on Computer Vision, Munich, Germany, 8–14 September 2018; pp. 3–19. [Google Scholar]
  21. Li, J.; Quan, X.; Wang, Y. Research on Defect Detection Algorithm of Ceramic Tile Surface with Multi-feature Fusion. Comput. Eng. Appl. 2020, 56, 191–198. [Google Scholar]
  22. Ma, C.; Zhang, T. Digital Printing Defect Detection System based on SURF Algorithm. Light Ind. Mach. 2021, 39, 52–56. [Google Scholar]
  23. Guo, J.; Xu, J.; Zuo, H.; Fei, H.; Zhong, Z.; Xu, X. Civil Aircraft Surface Defects Detection Based on Histogram of Oriented Gradient. In Proceedings of the IEEE International Conference on Civil Aviation Safety and Information Technology, Kunming, China, 17–19 October 2019; pp. 34–38. [Google Scholar]
  24. Zhang, T.; Liu, Y.; Yang, Y.; Wang, X.; Jin, Y. Review of Surface Defect Detection Based on Machine Vision. Sci. Technol. Eng. 2020, 20, 14366–14376. [Google Scholar]
  25. Guo, H.; Xu, W.; Liu, Y. Steel Plate Surface Defect Recognition Based on Support Vector Machine. J. Donghua Univ. 2018, 44, 635–639. [Google Scholar]
  26. Hua, C.; Zhou, H. Study on Surface Defect Recognition of Cold Rolled Steel Strip by Improving Combination Classifier. Mech. Sci. Technol. Aerosp. Eng. 2017, 36, 1785–1790. [Google Scholar]
  27. Guo, C.; Zhang, Z. The design on surface defects detection system of cylindricaldiode based on decision tree learning. Inf. Technol. Netw. Secur. 2015, 34, 39–41. [Google Scholar]
  28. Weng, Y.; Xiao, J.; Xia, Y. Strip Steel Surface Defect Detection Based on Improved Mask R-CNN Algorithm. Comput. Eng. Appl. 2021, 57, 235–242. [Google Scholar]
  29. Li, W.; Ye, X.; Zhao, Y.; Wang, W. Strip Steel Surface Defect Detection Based on Improved YOLOv3 Algorithm. Acta Electron. Sin. 2020, 48, 1284–1292. [Google Scholar]
  30. Yuan, H.; Du, G.; Yu, Z.; Wei, X. Fast Identification of Steel Surface Defects Based on Lightweight Neural Network. Sci. Technol. Eng. 2021, 21, 14651–14656. [Google Scholar]
  31. Liu, S.; Qi, L.; Qin, H.; Shi, J.; Jia, J. Path Aggregation Network for Instance Segmentation. In Proceedings of the IEEE Conference on Computer Vision and Pattern Recognition, Salt Lake City, UT, USA, 18–23 June 2018; pp. 8759–8768. [Google Scholar]
  32. Lin, Y.; Dollár, P.; Girshick, R.; He, K.; Hariharan, B.; Belongie, S. Feature Pyramid Networks for Object Detection. In Proceedings of the IEEE International Conference on Computer Vision, Venice, Italy, 22–29 October 2017; pp. 2117–2125. [Google Scholar]
  33. Wang, W.; Xie, E.; Song, X.; Zang, Y.; Wang, W.; Lu, T.; Yu, G.; Shen, C. Efficient and Accurate Arbitrary-Shaped Text Detection With Pixel Aggregation Network. In Proceedings of the IEEE International Conference on Computer Vision, Long Beach, CA, USA, 10–15 June 2019; pp. 8440–8449. [Google Scholar]
  34. Neubeck, A.; Van Gool, L. Efficient Non-Maximum Suppression. In Proceedings of the International Conference on Pattern Recognition, Hong Kong, China, 20–24 August 2006; pp. 850–855. [Google Scholar]
  35. Zheng, Z.; Wang, P.; Ren, D.; Liu, W.; Ye, R.; Hu, Q.; Zuo, W. Enhancing Geometric Factors in Model Learning and Inference for Object Detection and Instance Segmentation. IEEE Trans. Cybern. 2022, 52, 8574–8586. [Google Scholar] [CrossRef] [PubMed]
  36. Hou, Q.; Zhou, D.; Feng, J. Coordinate Attention for Efficient Mobile Network Design. In Proceedings of the IEEE International Conference on Computer Vision, Nashville, TN, USA, 20–25 June 2021; pp. 13713–13722. [Google Scholar]
  37. Zhang, Y.; Ren, W.; Zhang, Z.; Jia, Z.; Wang, L.; Tan, T. Focal and Efficient IOU Loss for Accurate Bounding Box Regression. Neurocomputing 2022, 506, 146–157. [Google Scholar] [CrossRef]
  38. Luo, Q.; Fang, X.; Liu, L.; Yang, C.; Sun, Y. Automated Visual Defect Detection for Flat Steel Surface: A Survey. IEEE Trans. Instrum. Meas. 2020, 69, 626–644. [Google Scholar] [CrossRef] [Green Version]
Figure 1. Structure of YOLOv5s.
Applsci 12 08905 g001
Figure 2. The structure of the Ghost module.
Applsci 12 08905 g002
Figure 3. Ghost bottleneck.
Applsci 12 08905 g003
Figure 4. Coordinate Attention.
Applsci 12 08905 g004
Figure 5. Structure of improved YOLOv5s.
Applsci 12 08905 g005
Figure 6. Pictures of different defect types.
Applsci 12 08905 g006
Figure 7. The detection results of various defects.
Applsci 12 08905 g007
Figure 8. Comparison of detection effects.
Applsci 12 08905 g008
Figure 9. Detection results of various defects by different algorithms.
Applsci 12 08905 g009
Table 1. Comparison of each model.
ModelParametersGFLOPsWeight/MB[email protected]/%fps
YOLOv5s7,033,11415.813.882.262.5
YOLOv5s-G3,695,3308.17.584.062.5
YOLOv5s-C7,057,27415.813.983.658.8
YOLOv5s-E7,033,11415.813.882.776.9
YOLOv5s-GCE3,719,4908.17.685.758.8
Table 2. Performance comparison of different algorithms.
ModelParametersGFLOPsWeight/MB[email protected]/%fps
YOLOv361,545,00065.6235.173.334.1
SSD26,285,00062.792.642.252.6
Faster R-CNN137,099,000370.2108.373.67.9
YOLOv5s-GCE3,719,4908.17.685.758.8
Publisher’s Note: MDPI stays neutral with regard to jurisdictional claims in published maps and institutional affiliations.

