
Simulation Study of the Capture and Purification Performance of Exhaust Fume Systems in Chinese Commercial Kitchens—Case Study in Tianjin


Abstract
:1. Introduction
2. Numerical Simulation Methodology
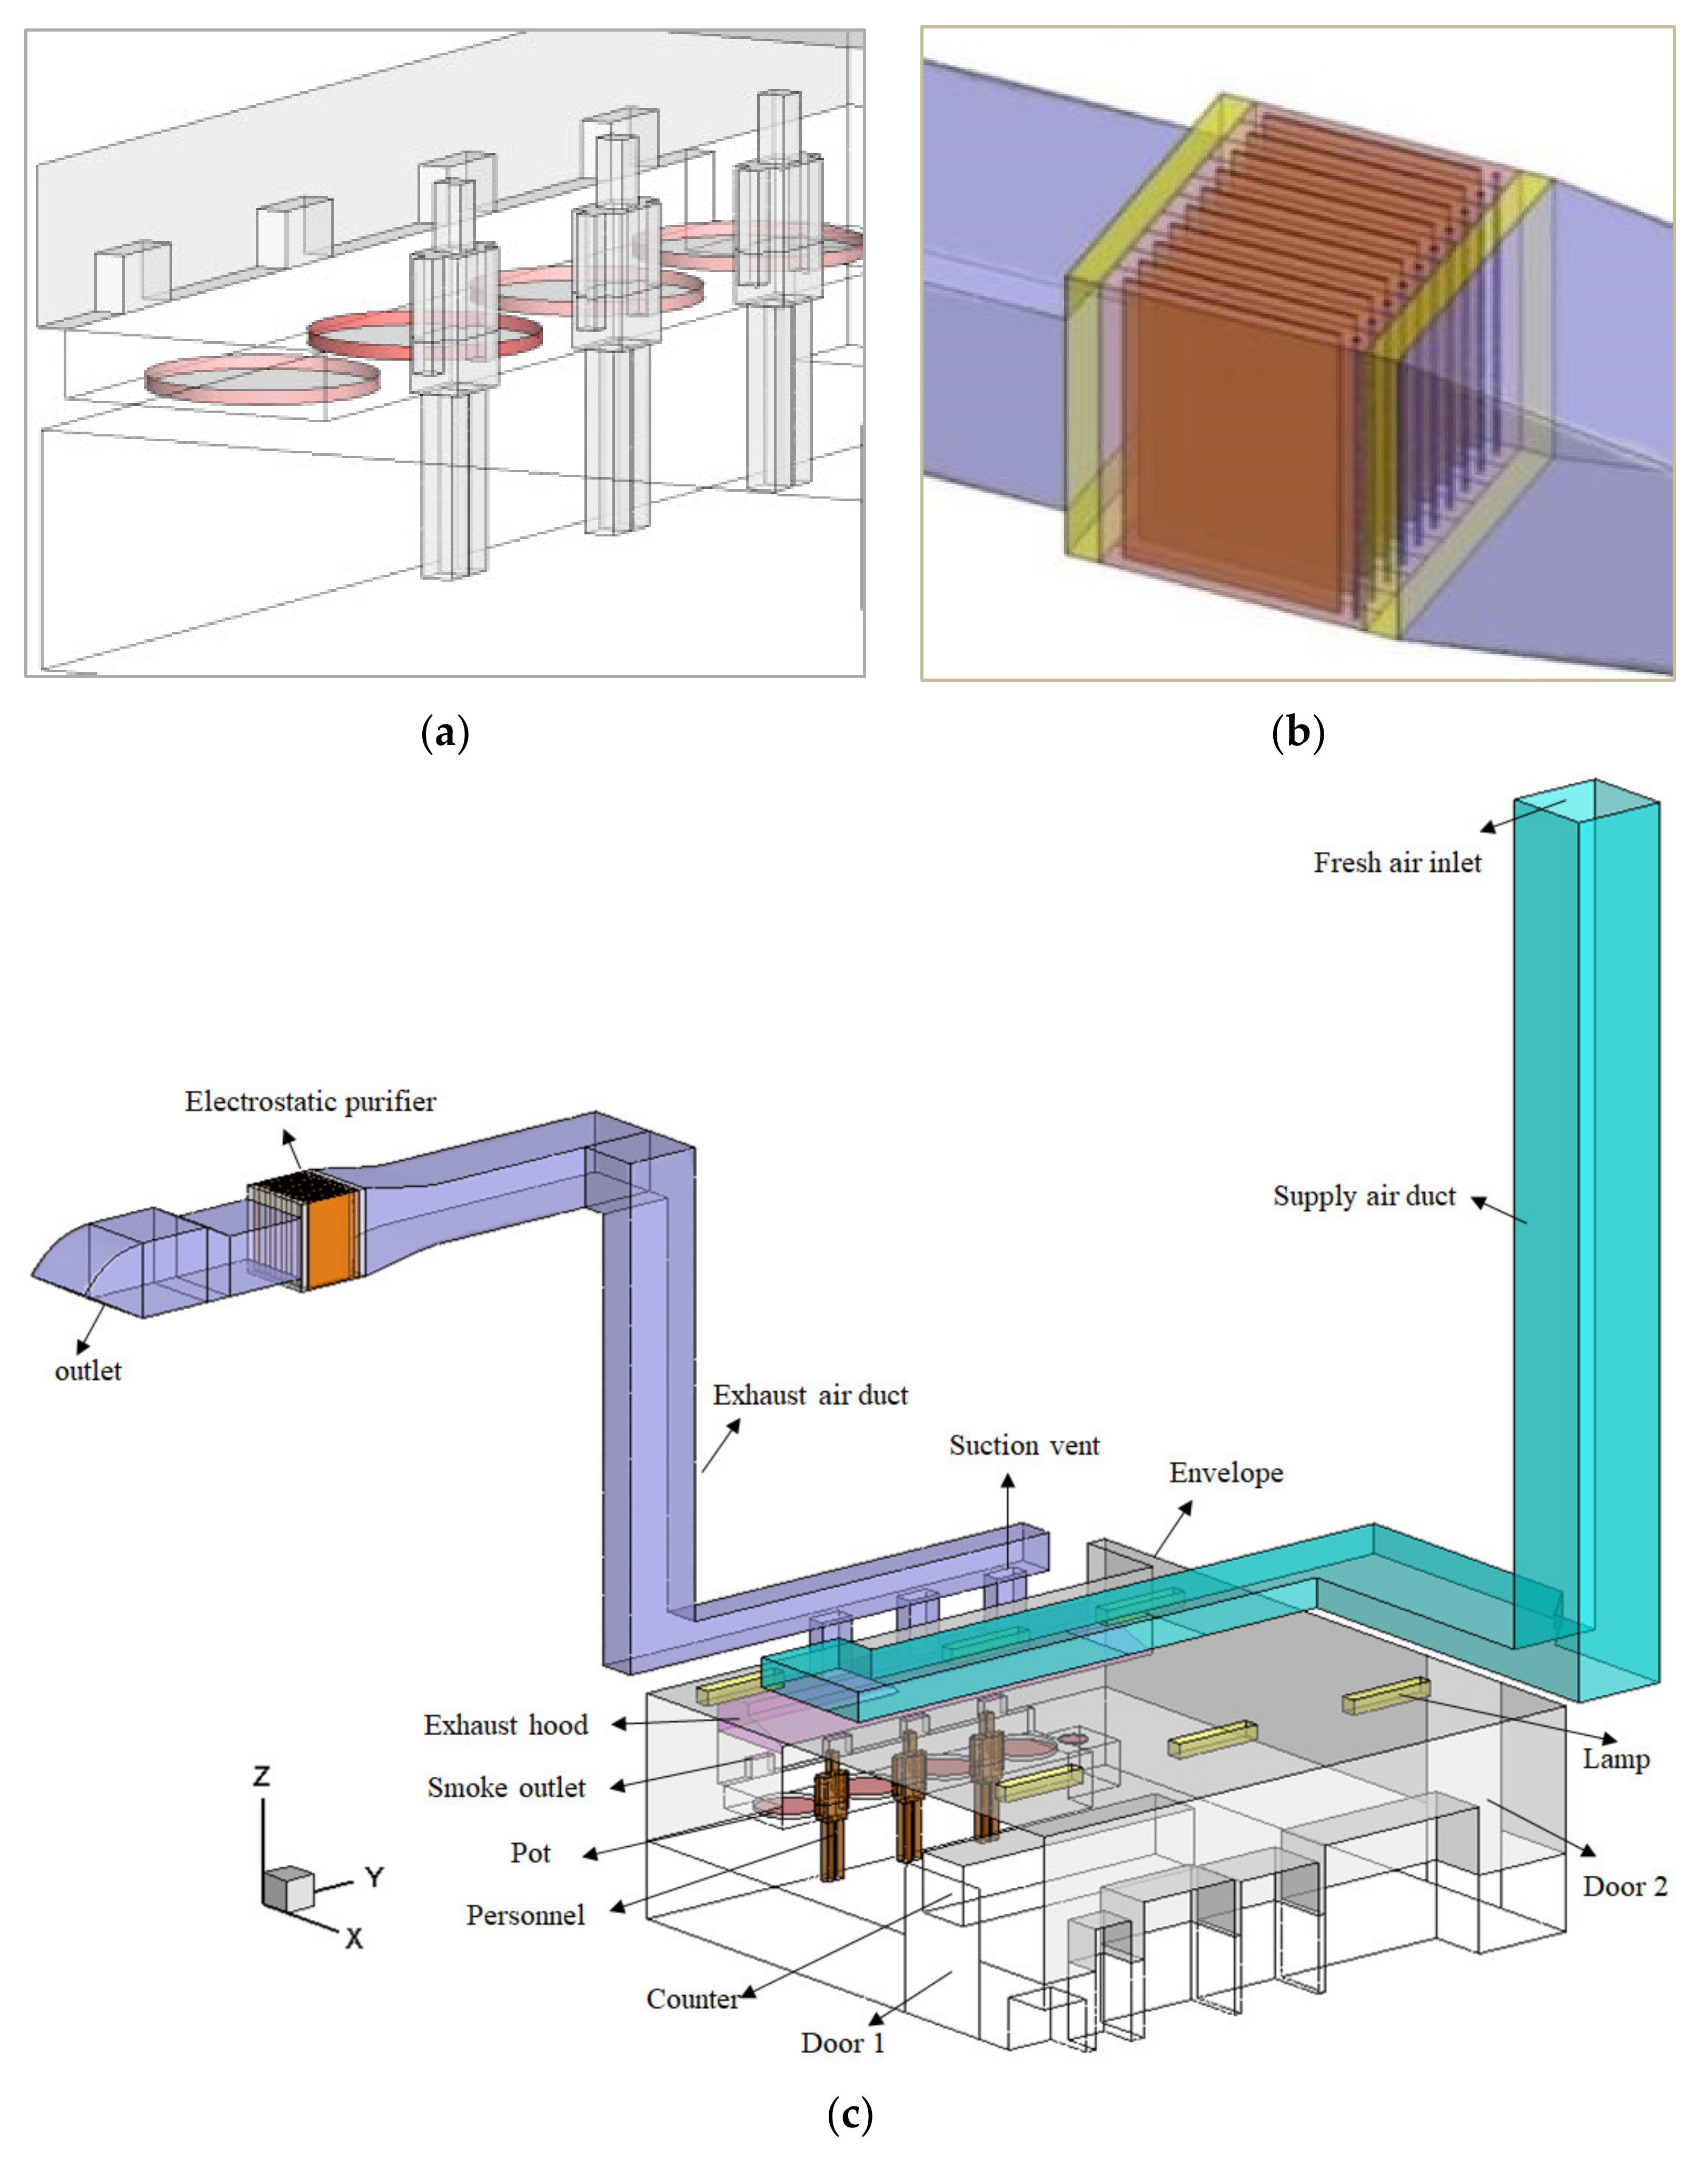
2.1. Geometric Model and Grid Generation
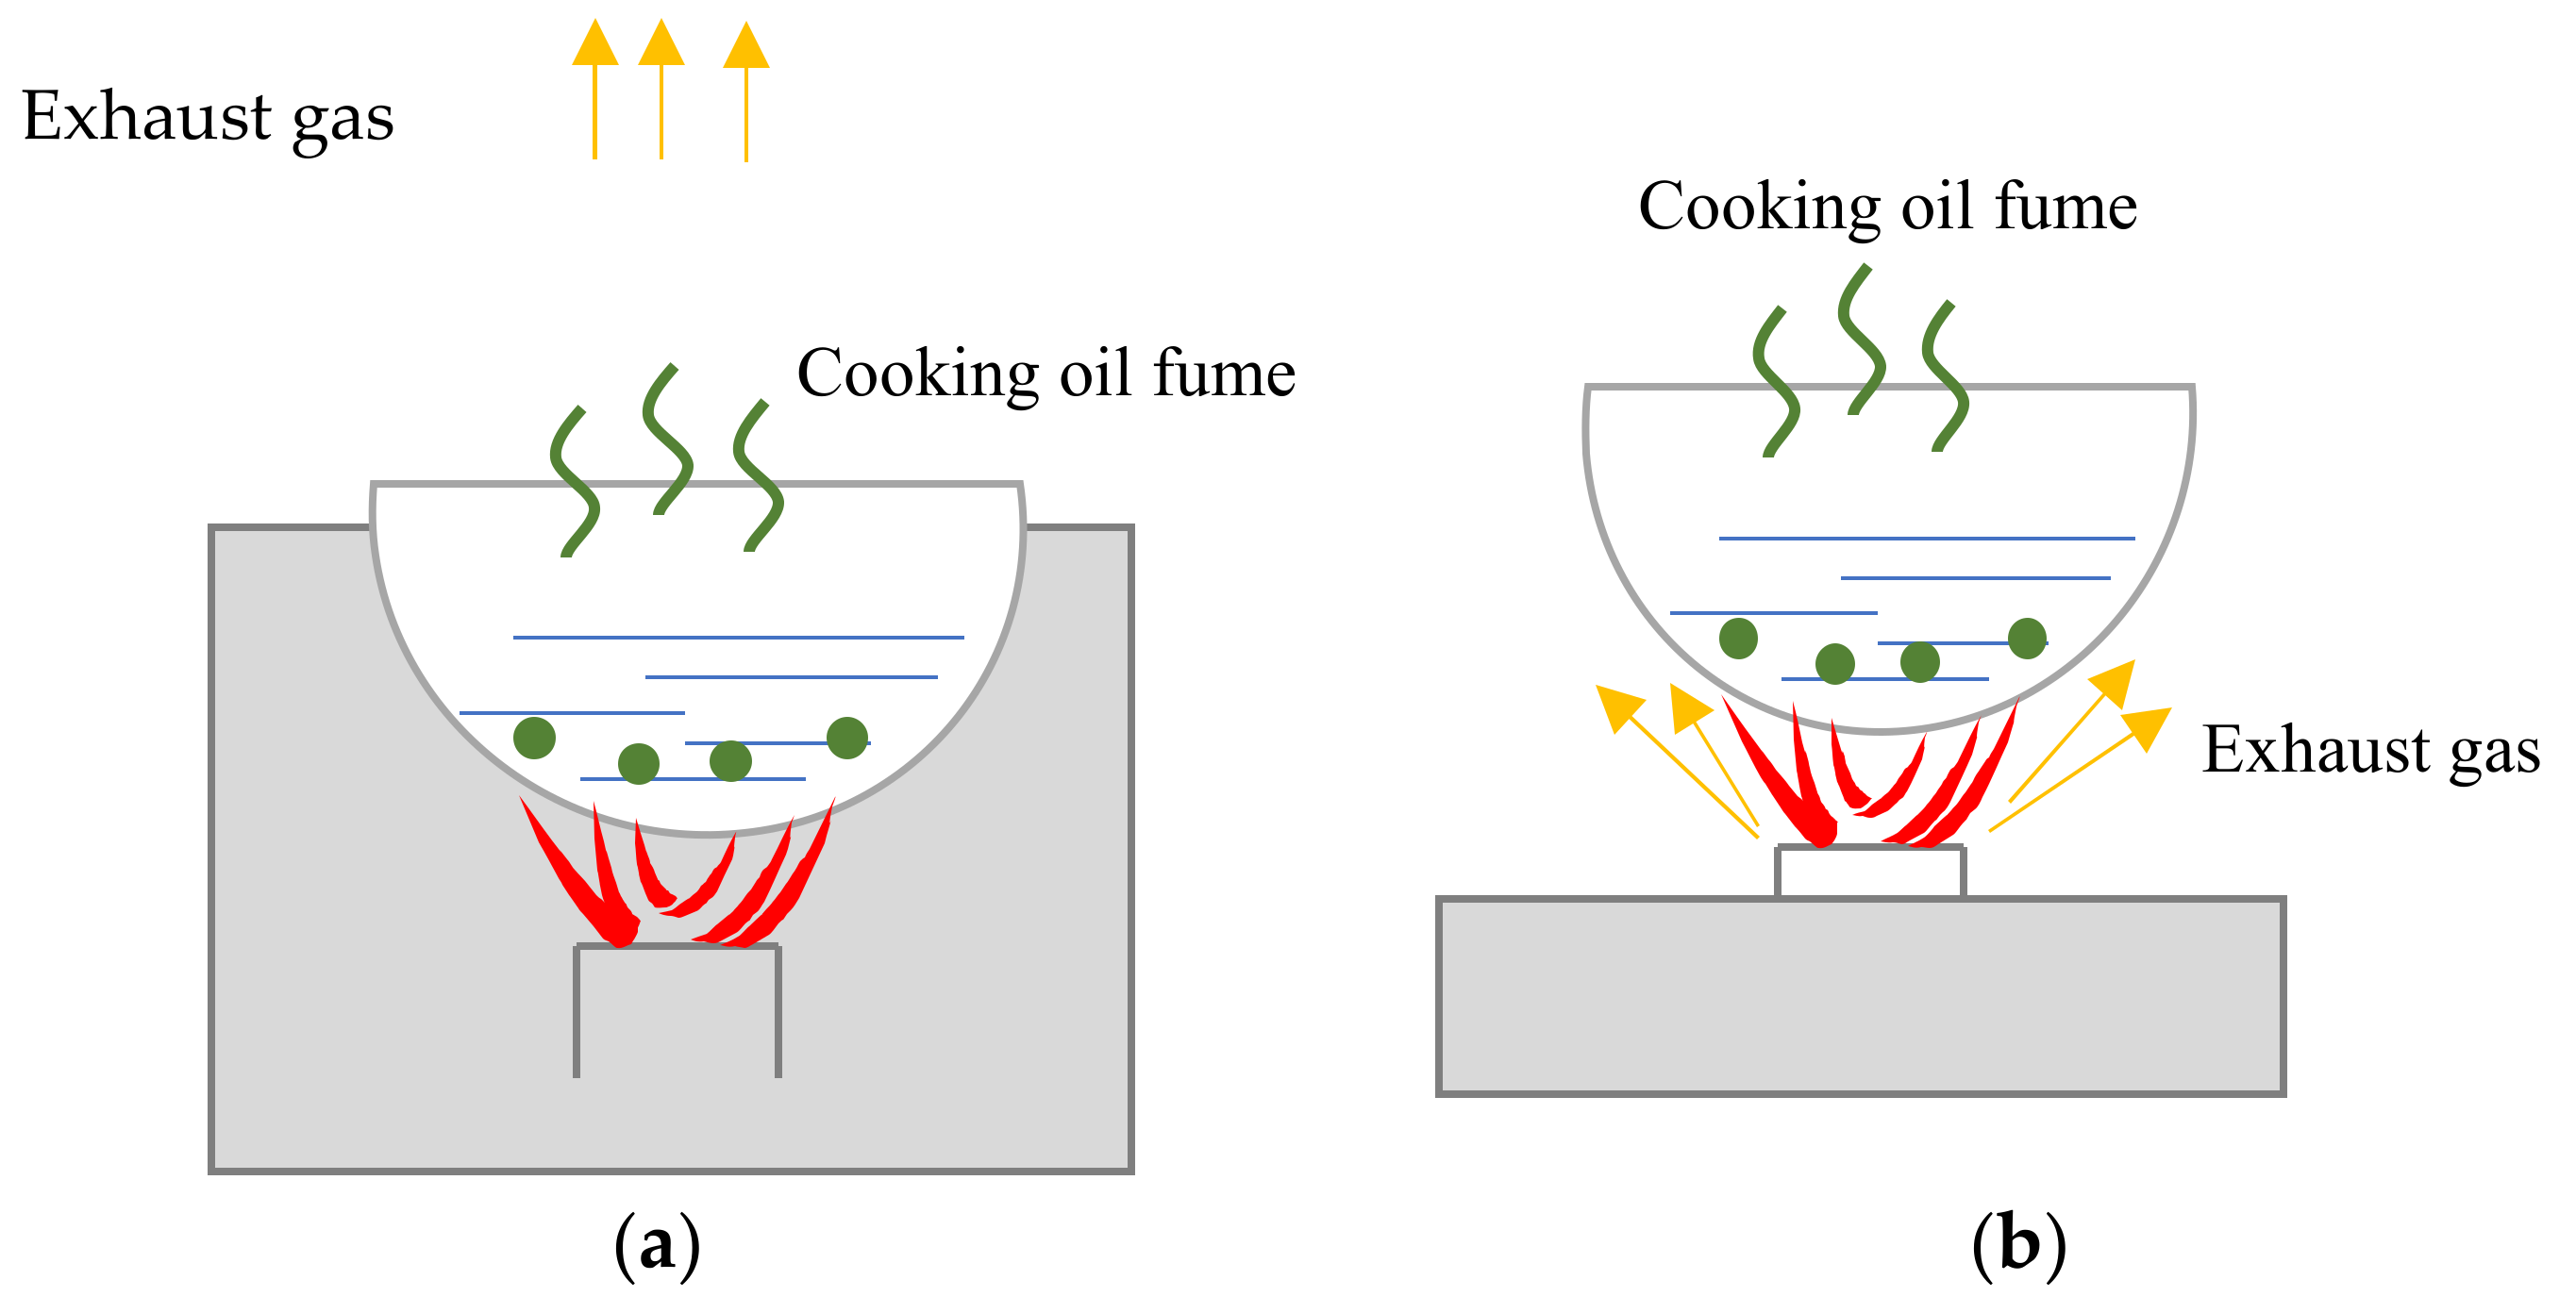
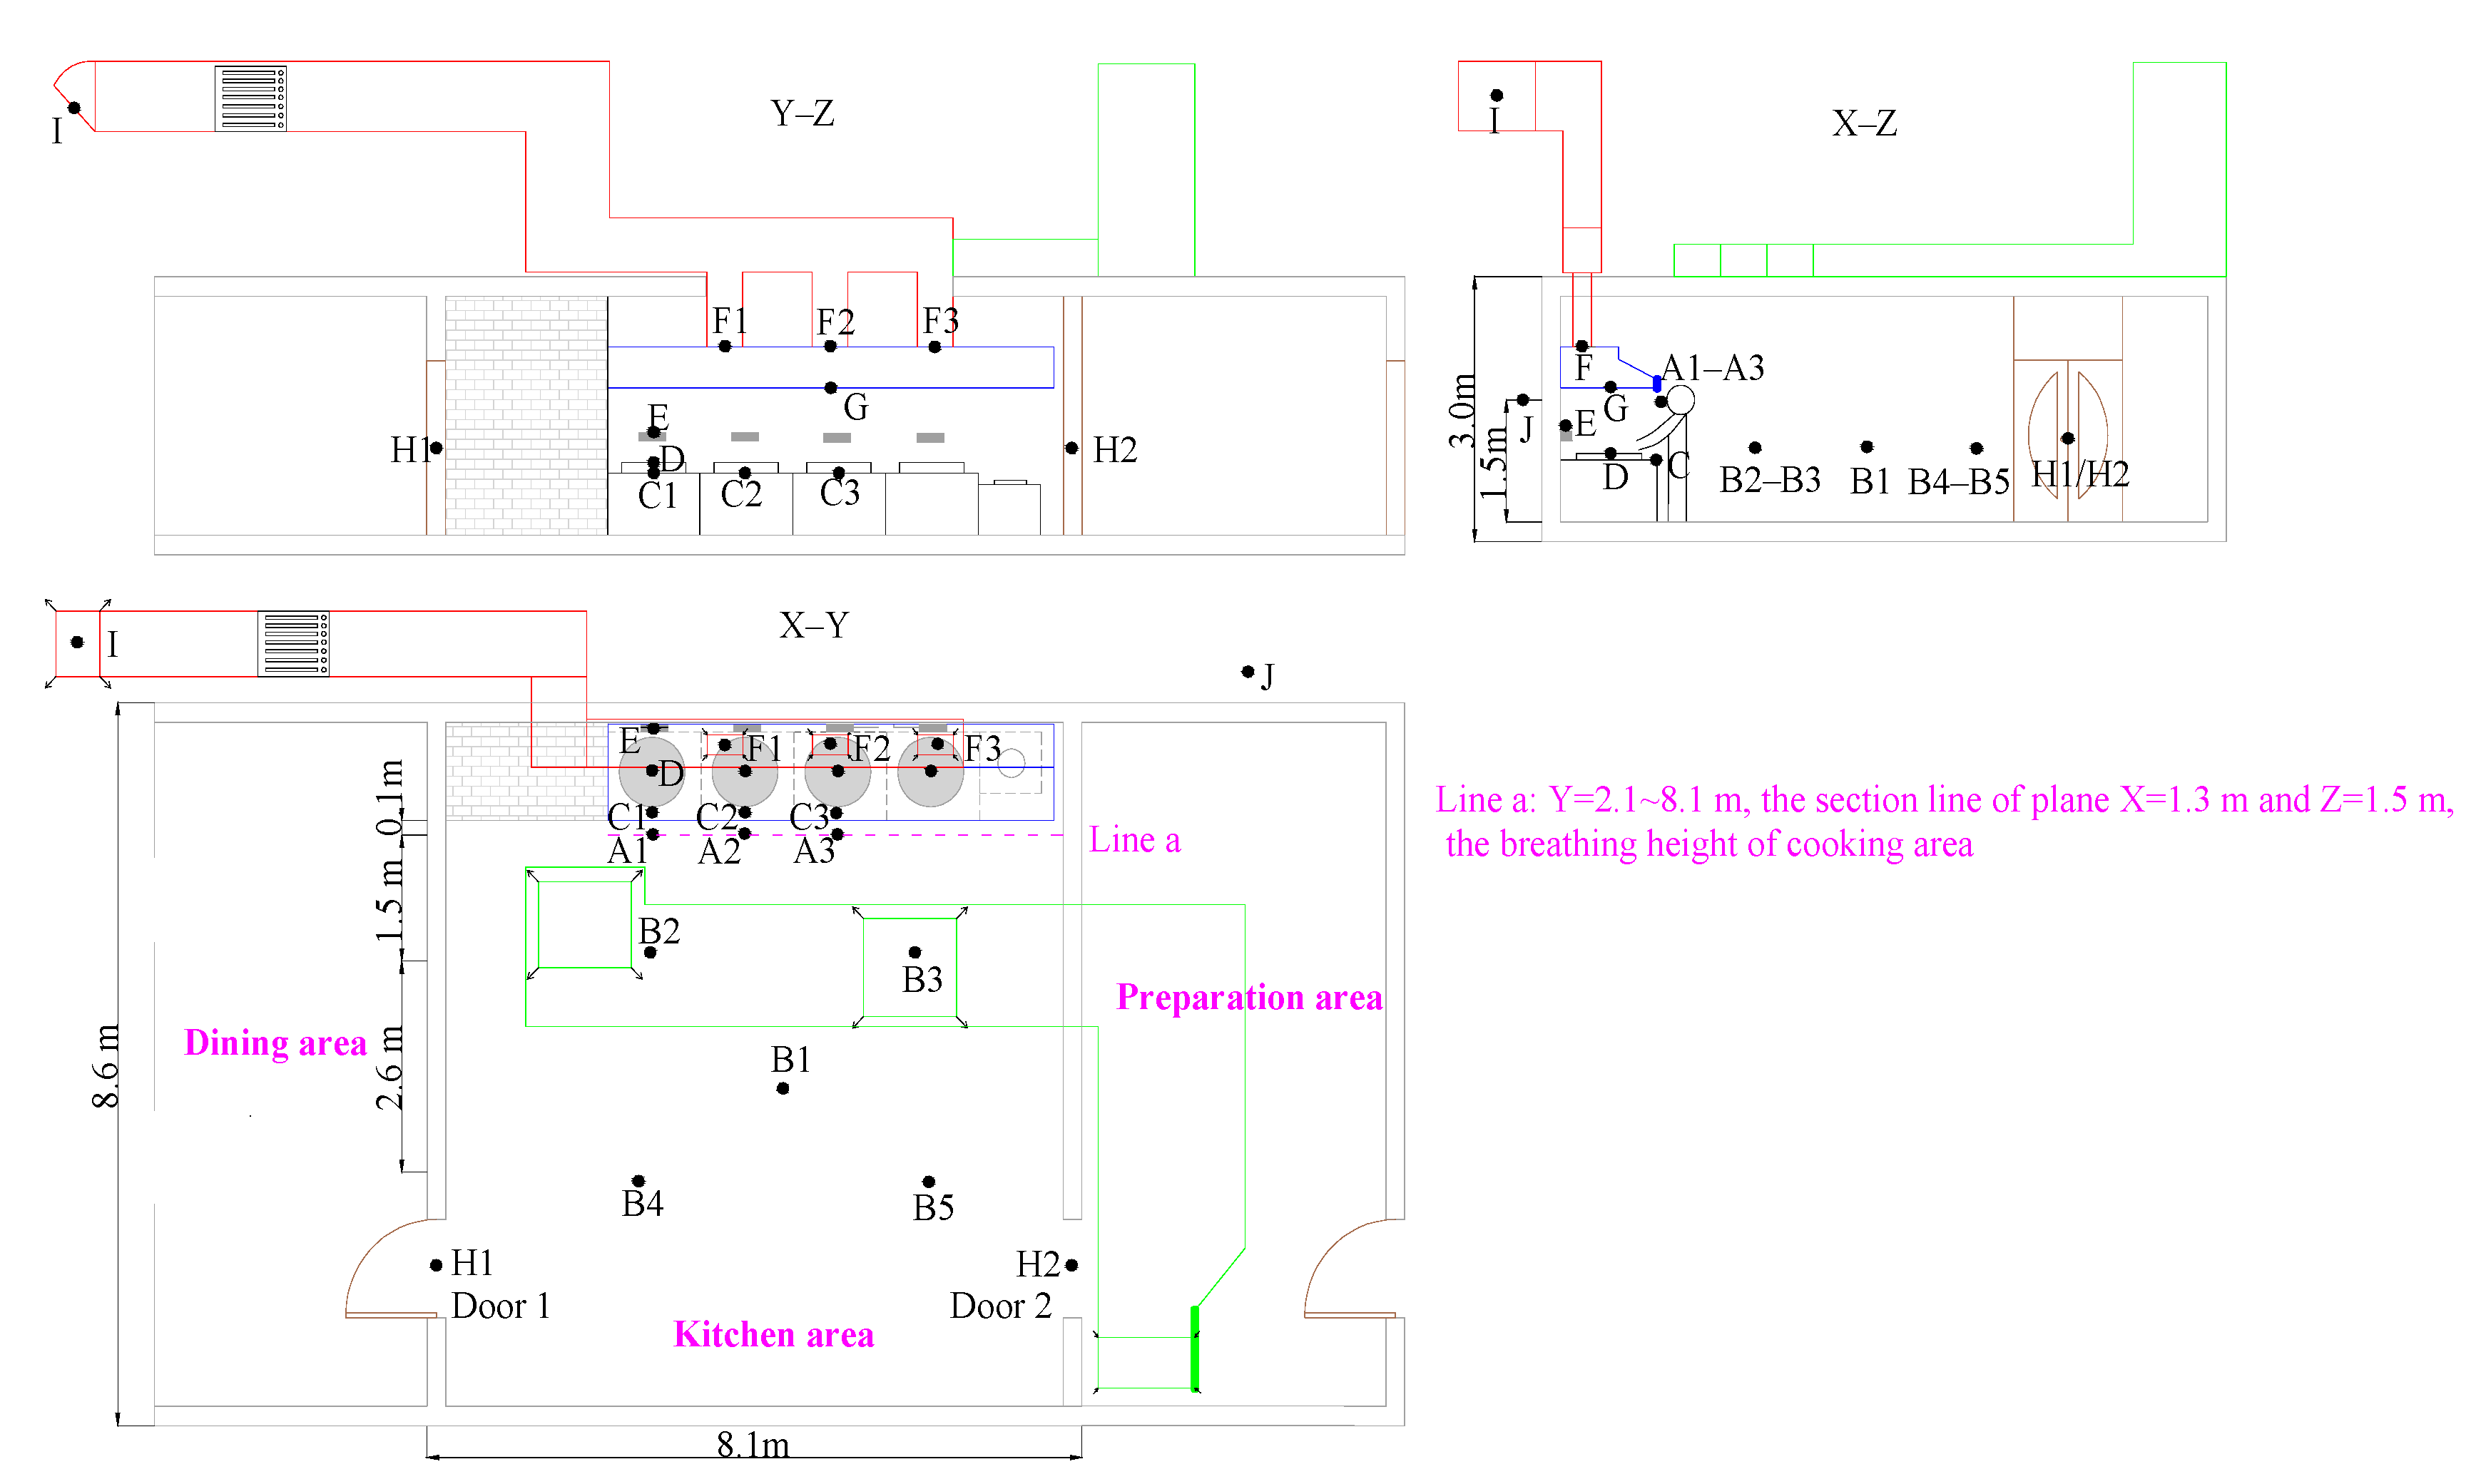
2.1.1. Geometric Model
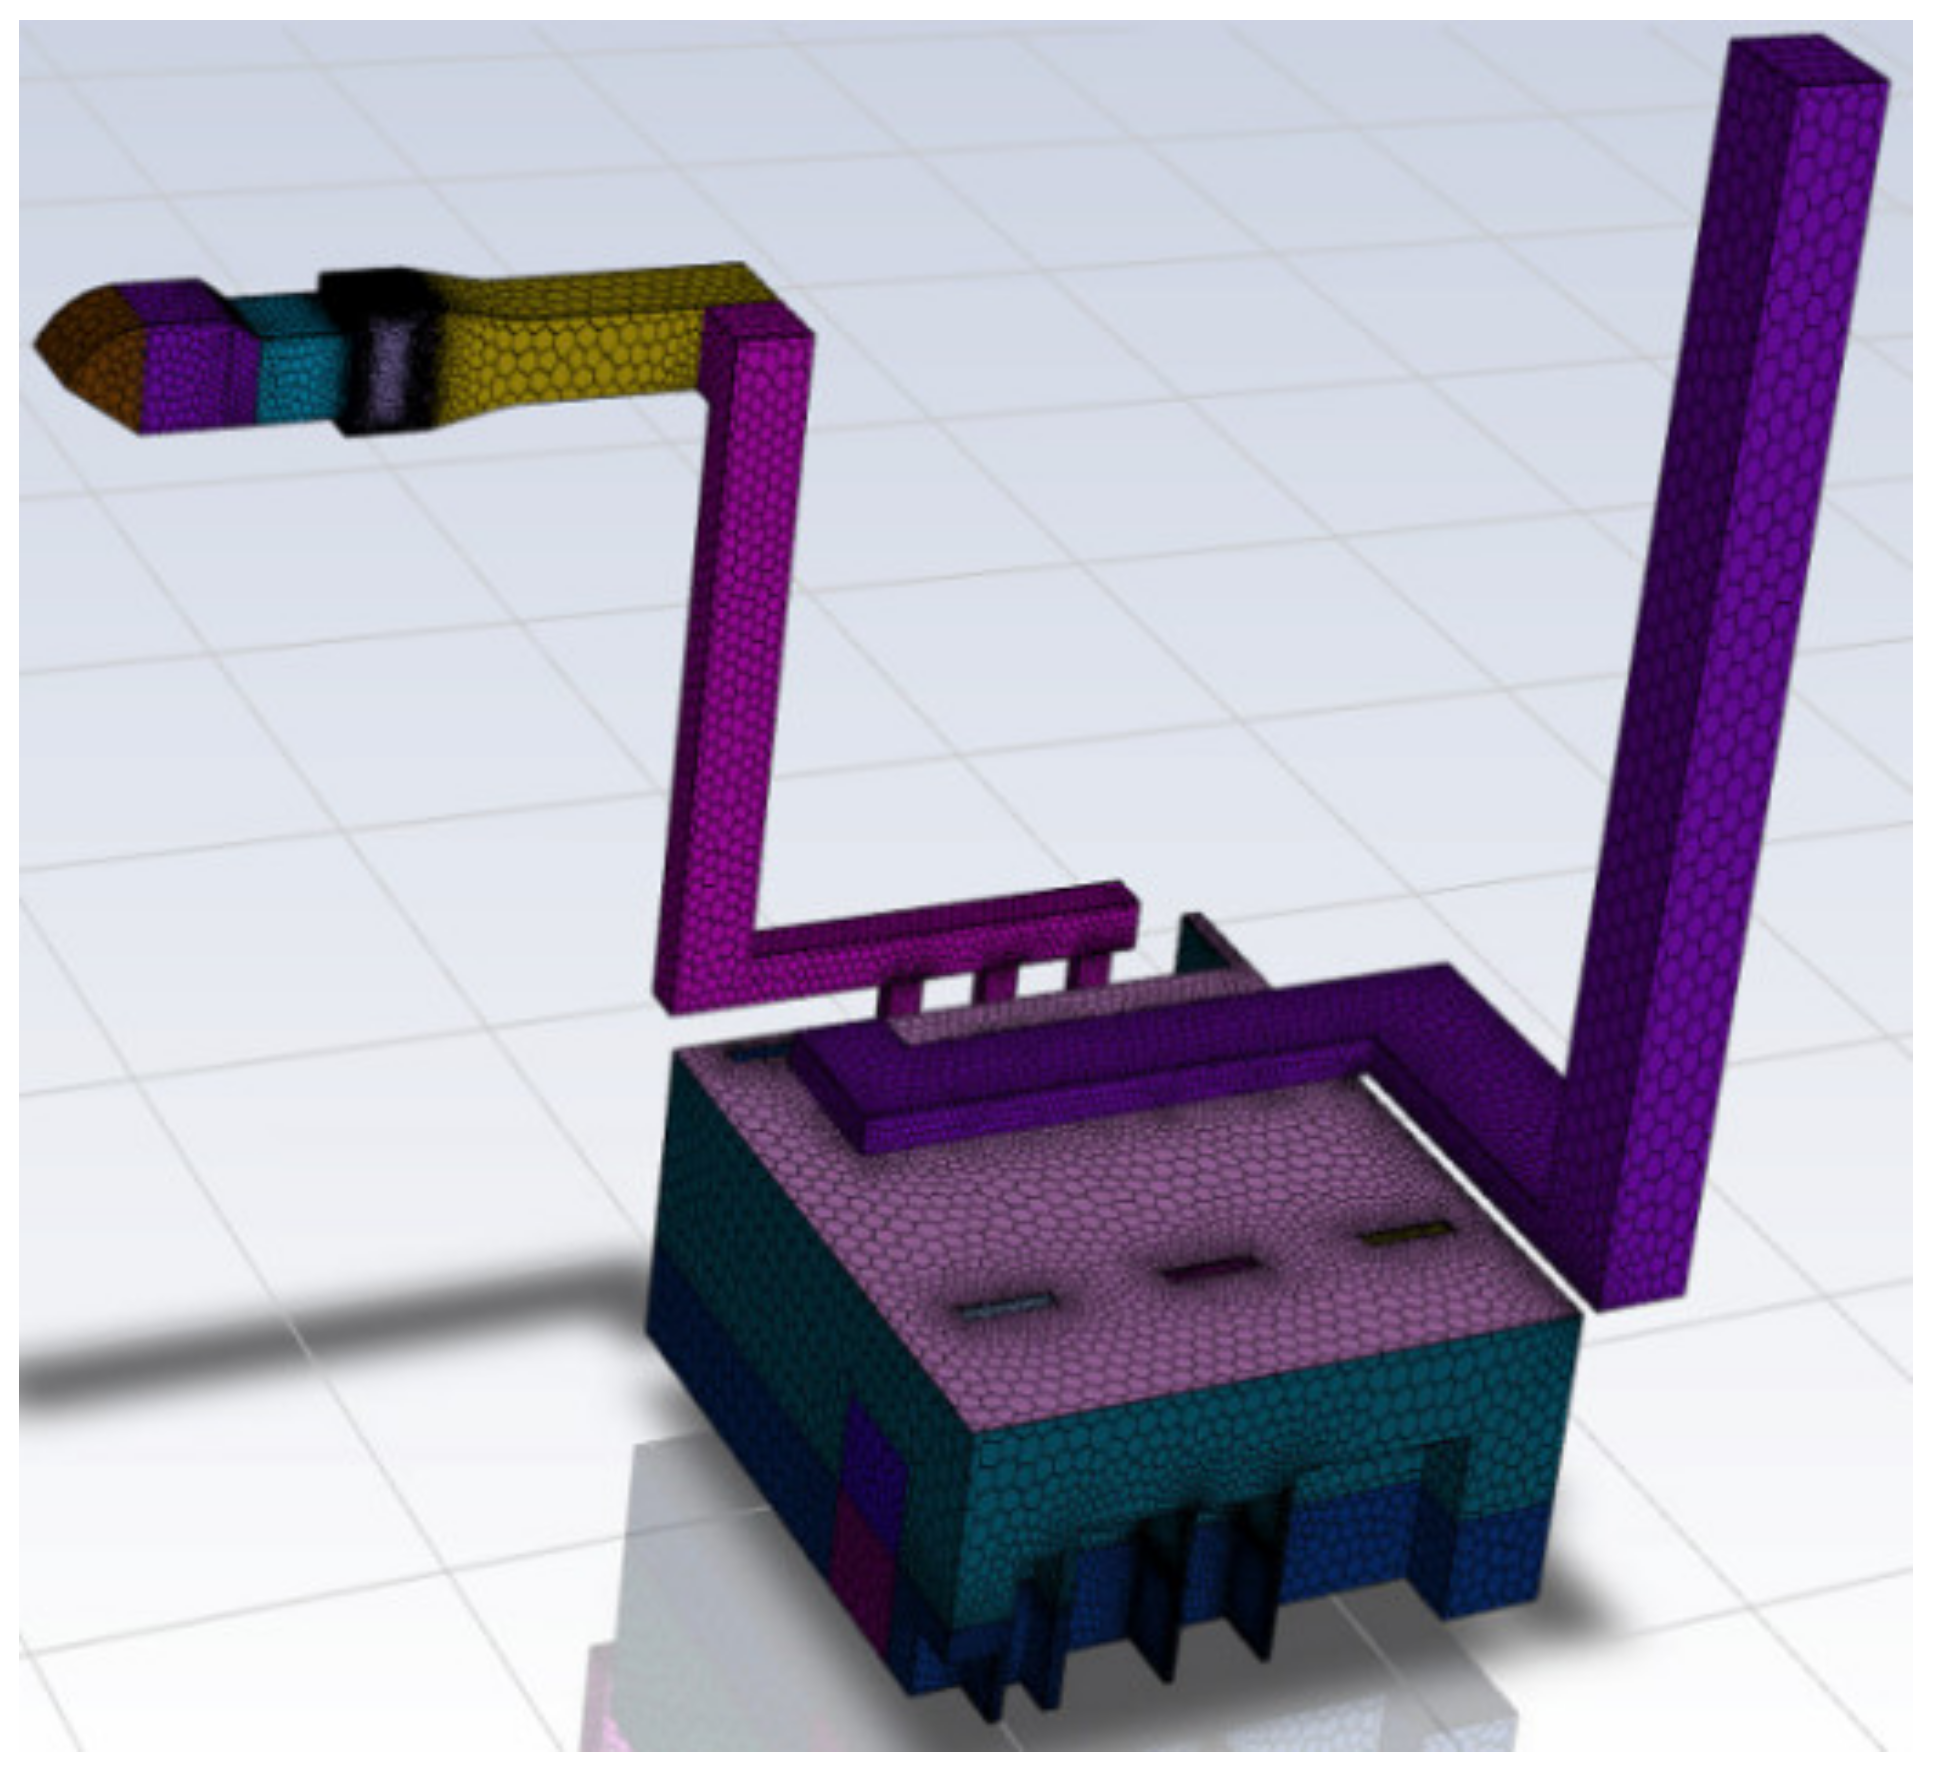
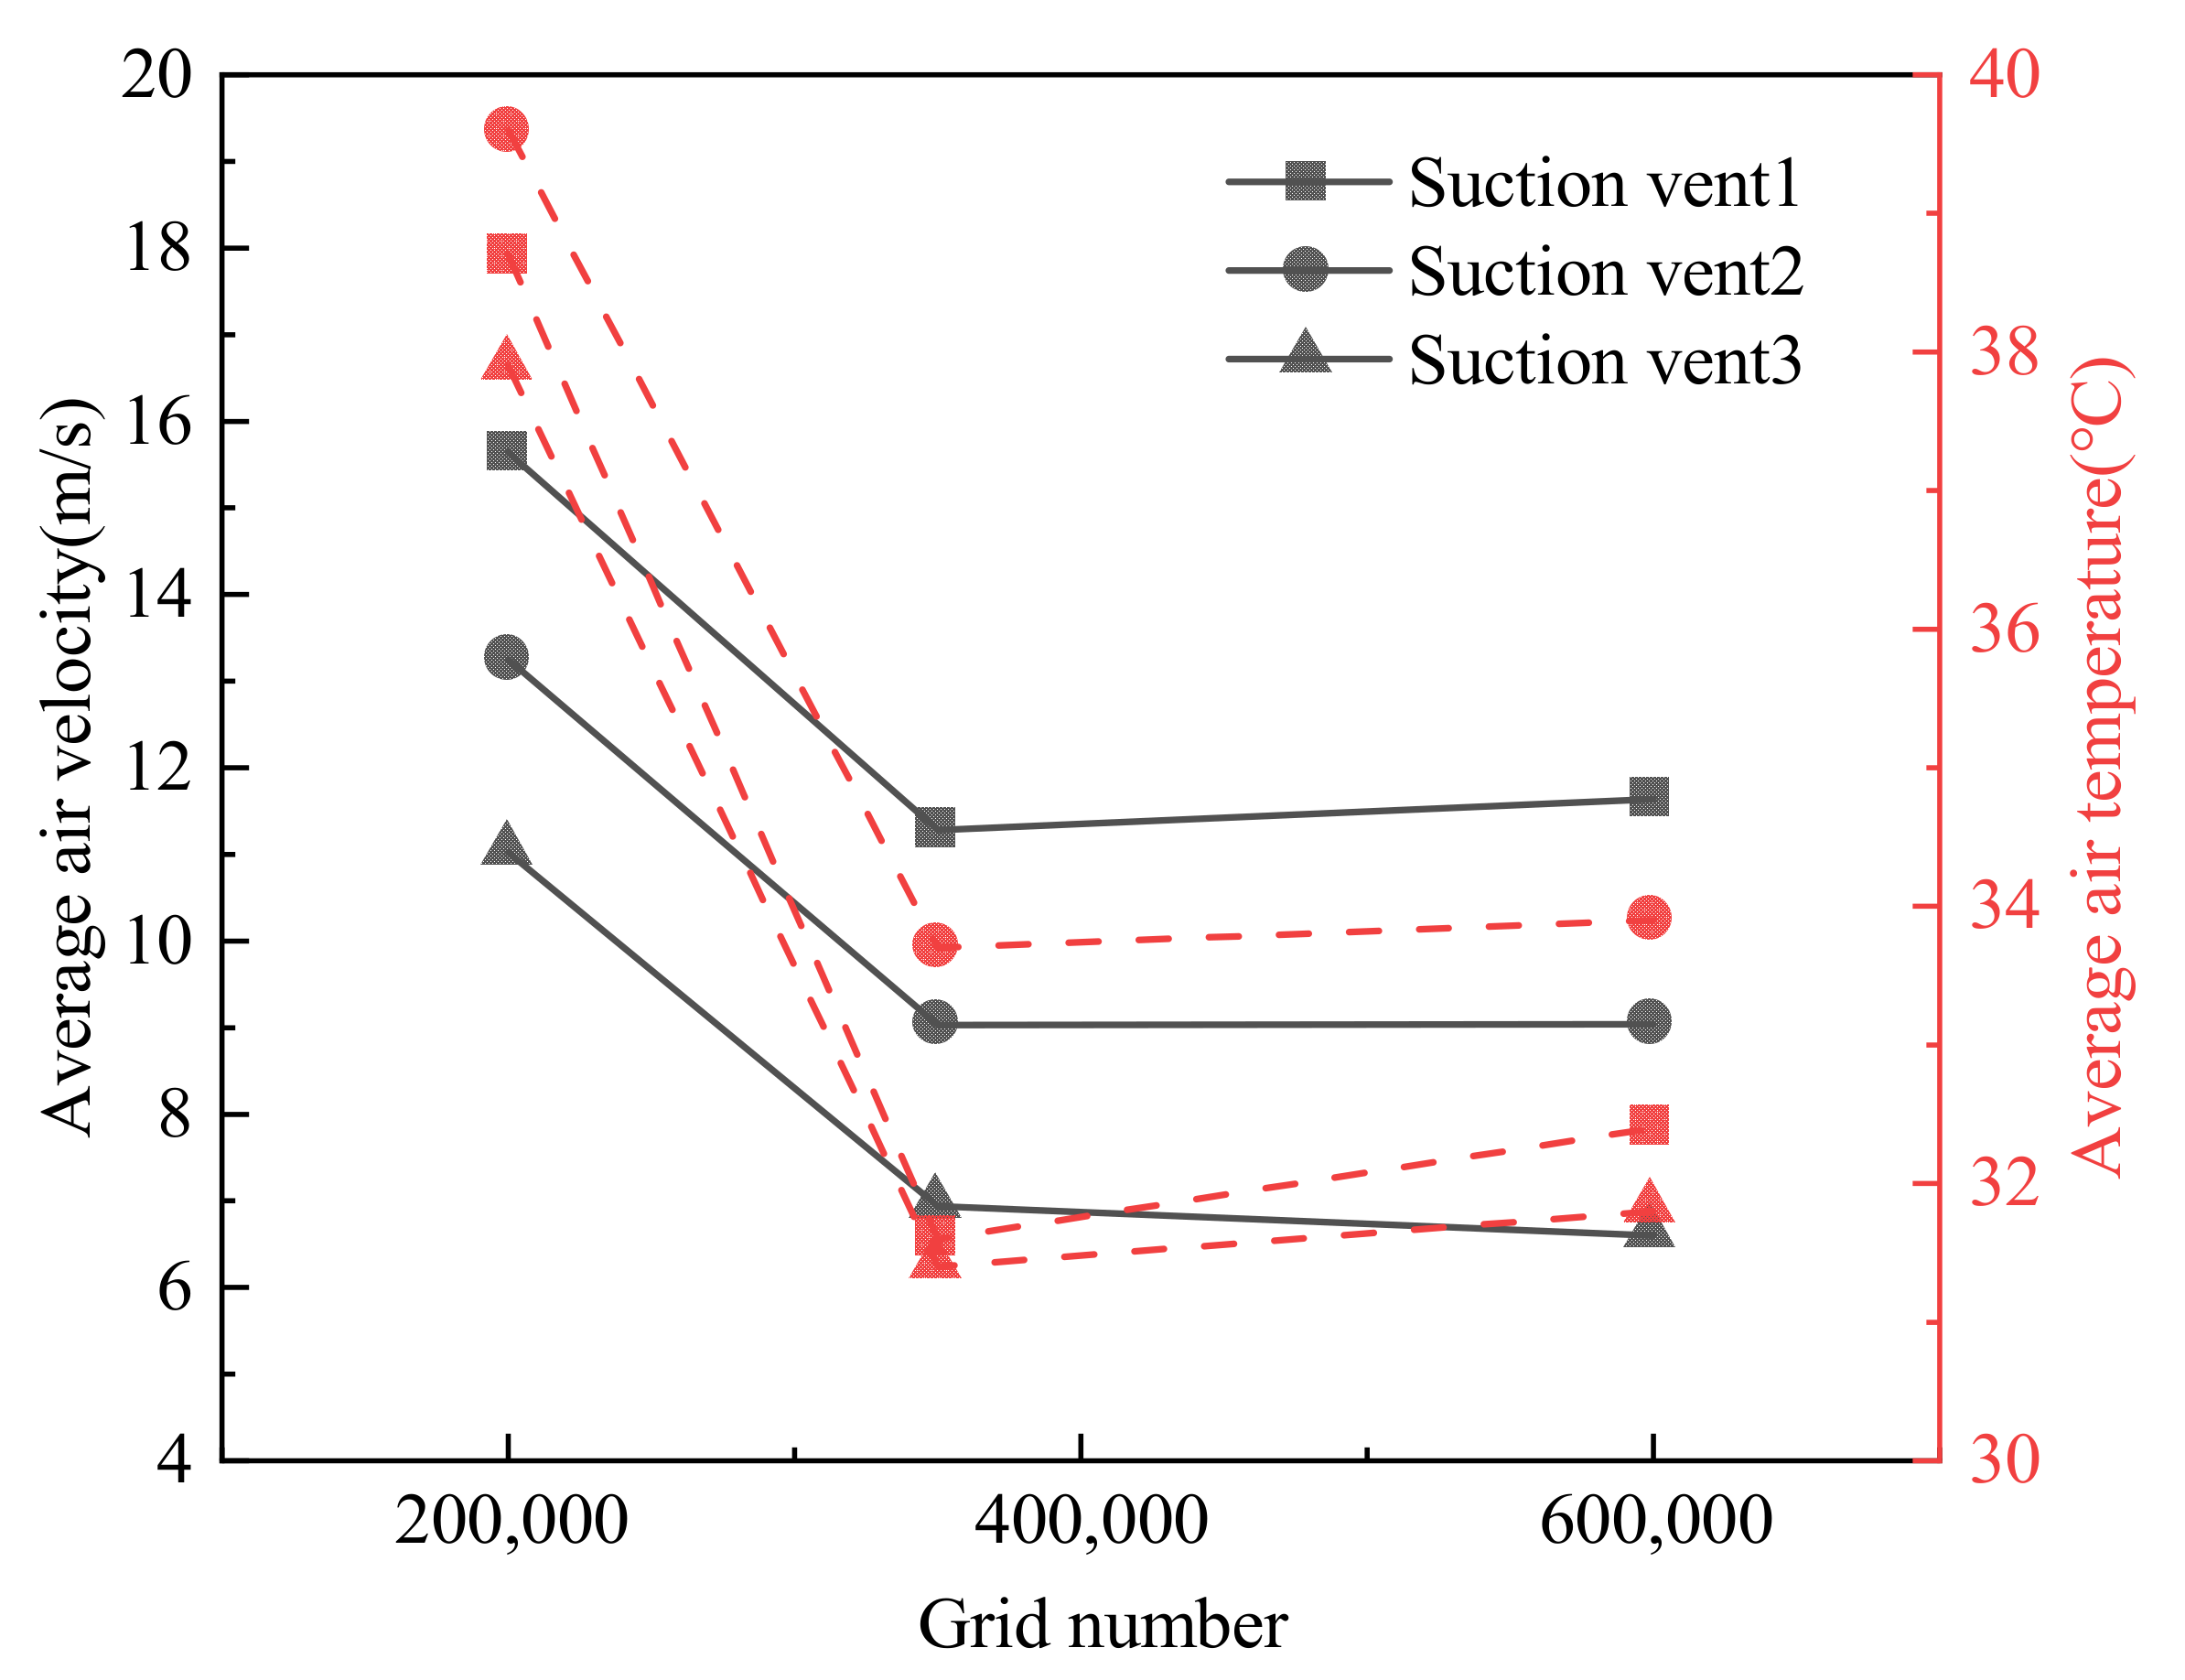
2.1.2. Grid Generation
2.2. Definition of Materials and Boundary Conditions
2.2.1. Materials
2.2.2. Boundary Conditions
2.3. Numerical Methods
2.3.1. Calculation Process
2.3.2. Governing Equation
2.3.3. Details of the Computational Method
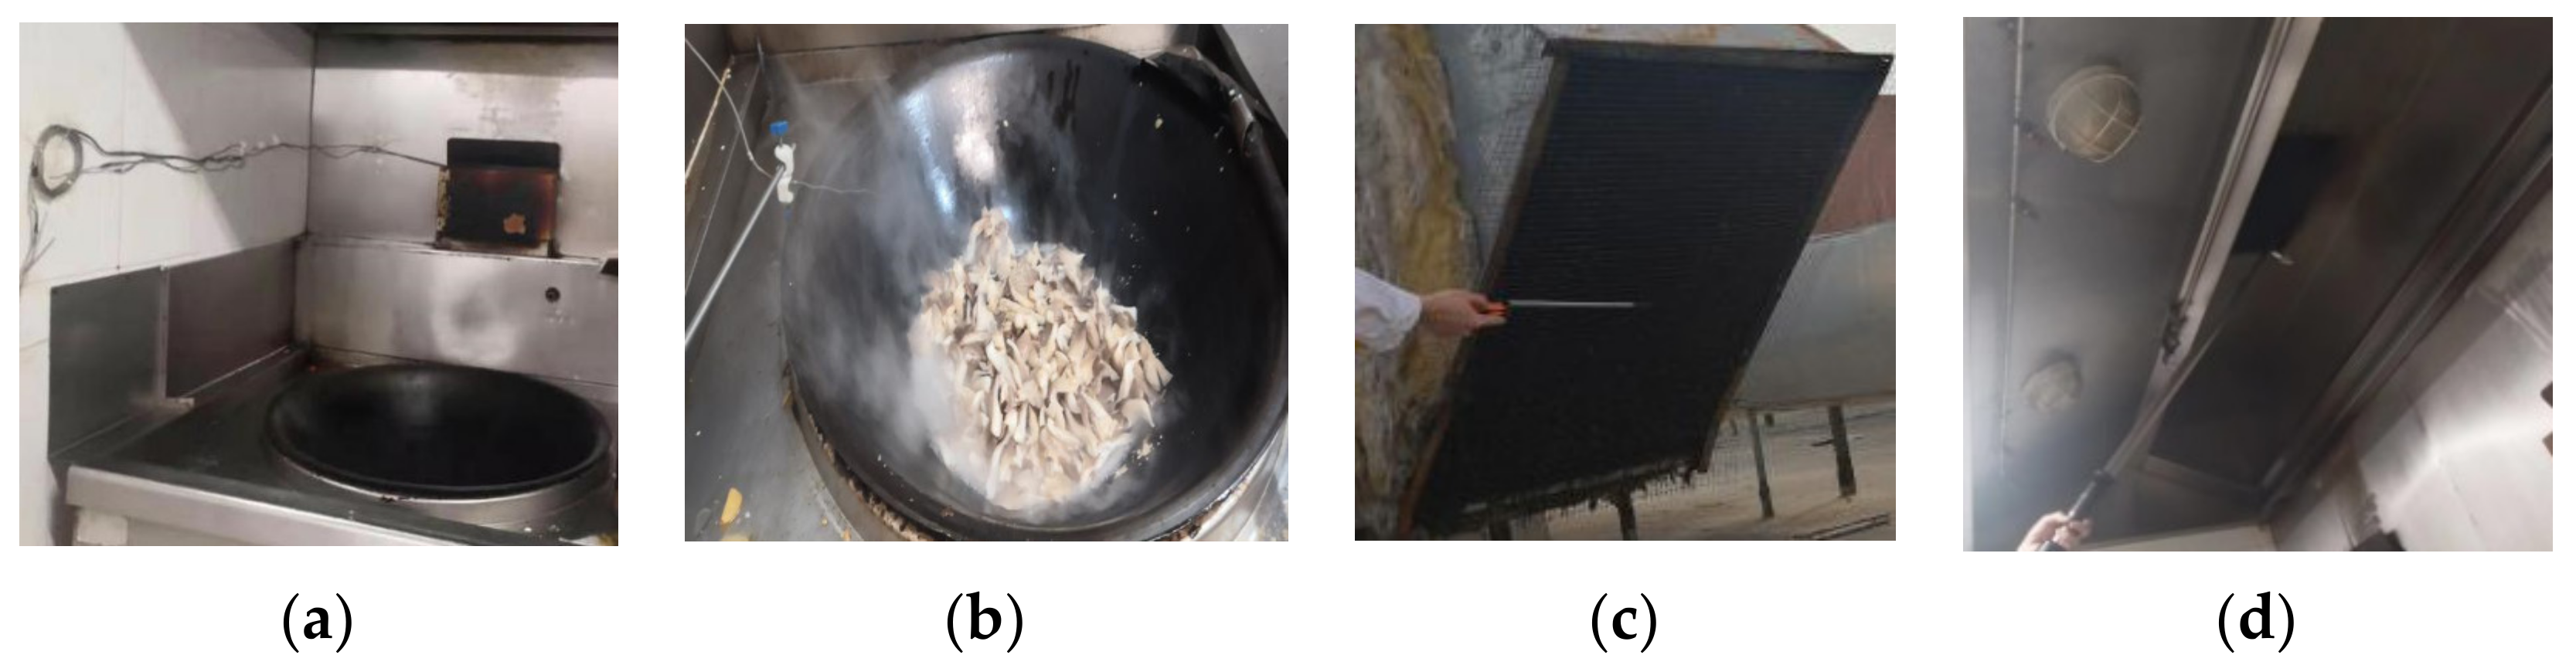
3. Field Measurement
4. Results and Discussion
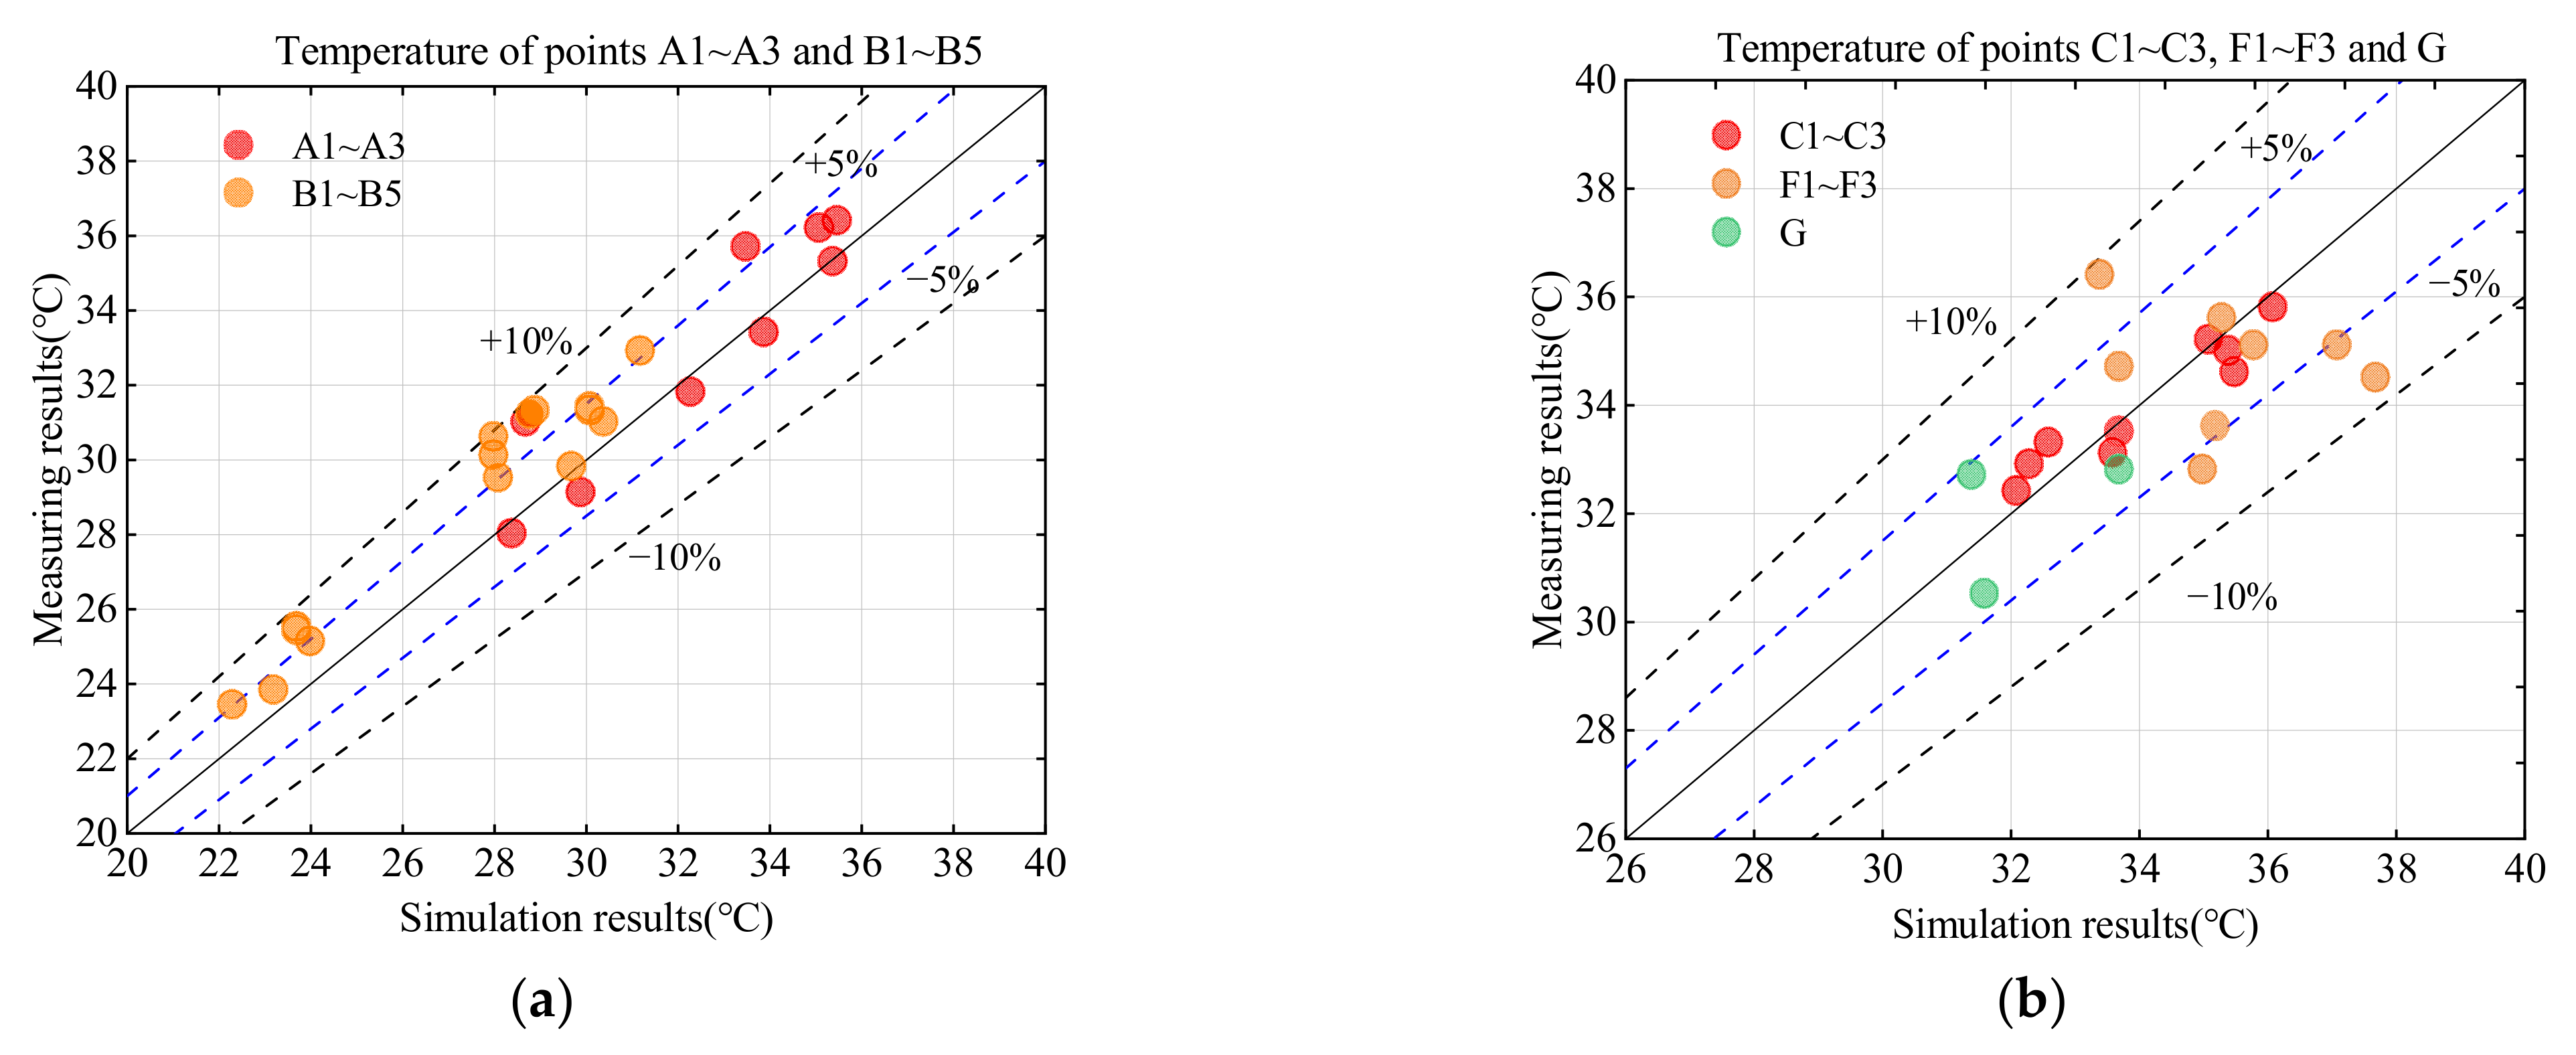
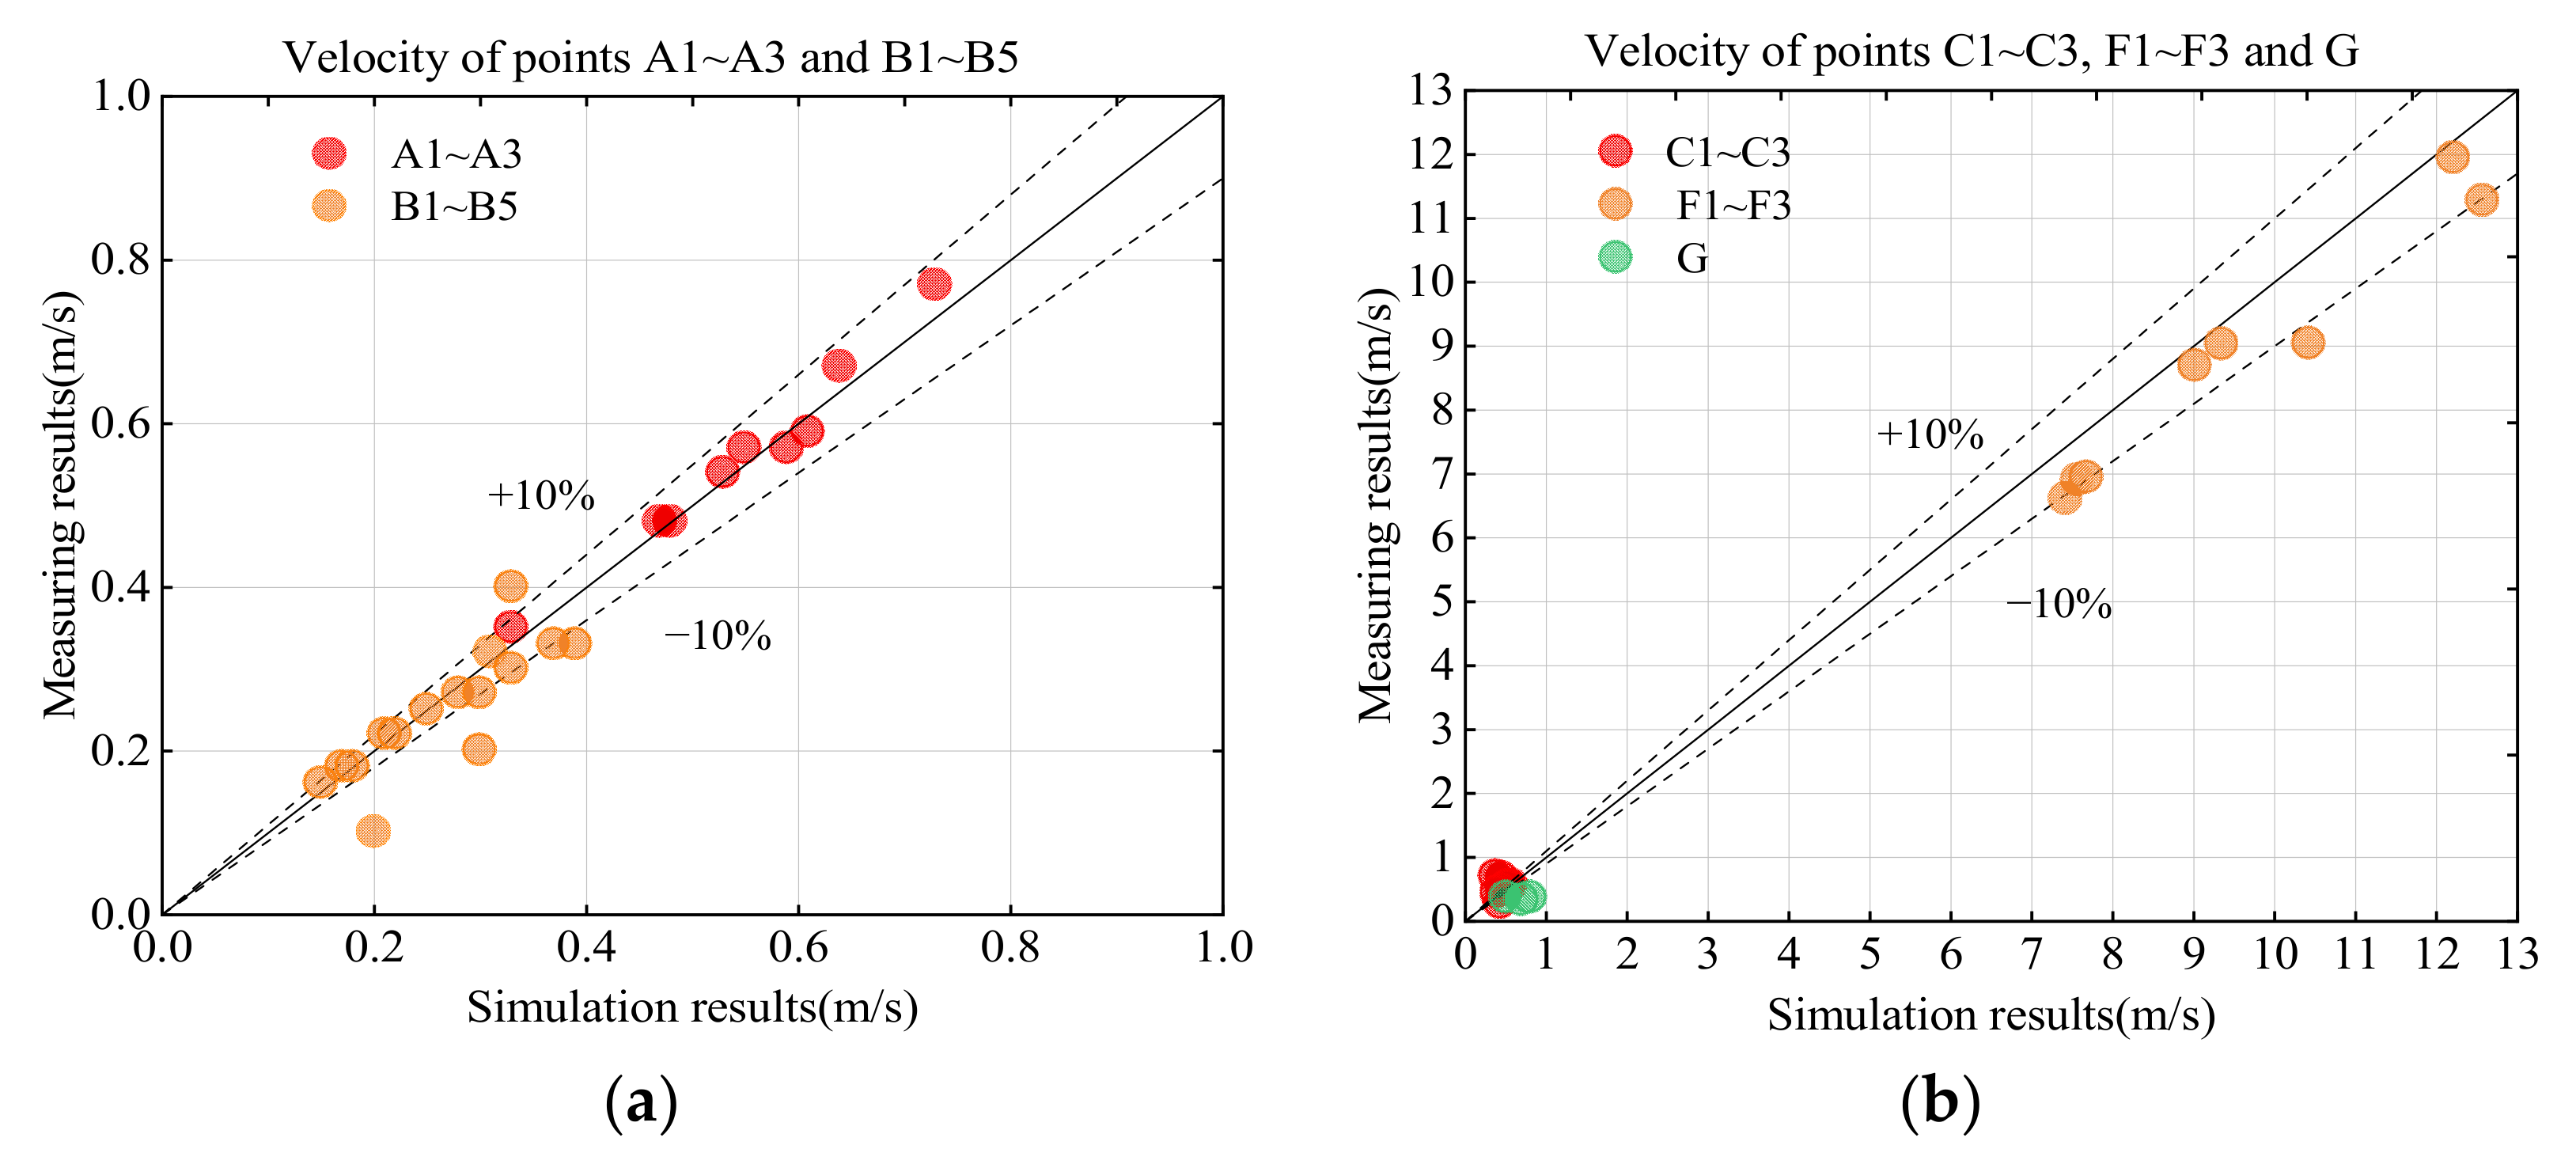
4.1. Model Validation from Experimental Data
4.1.1. Temperature
4.1.2. Velocity
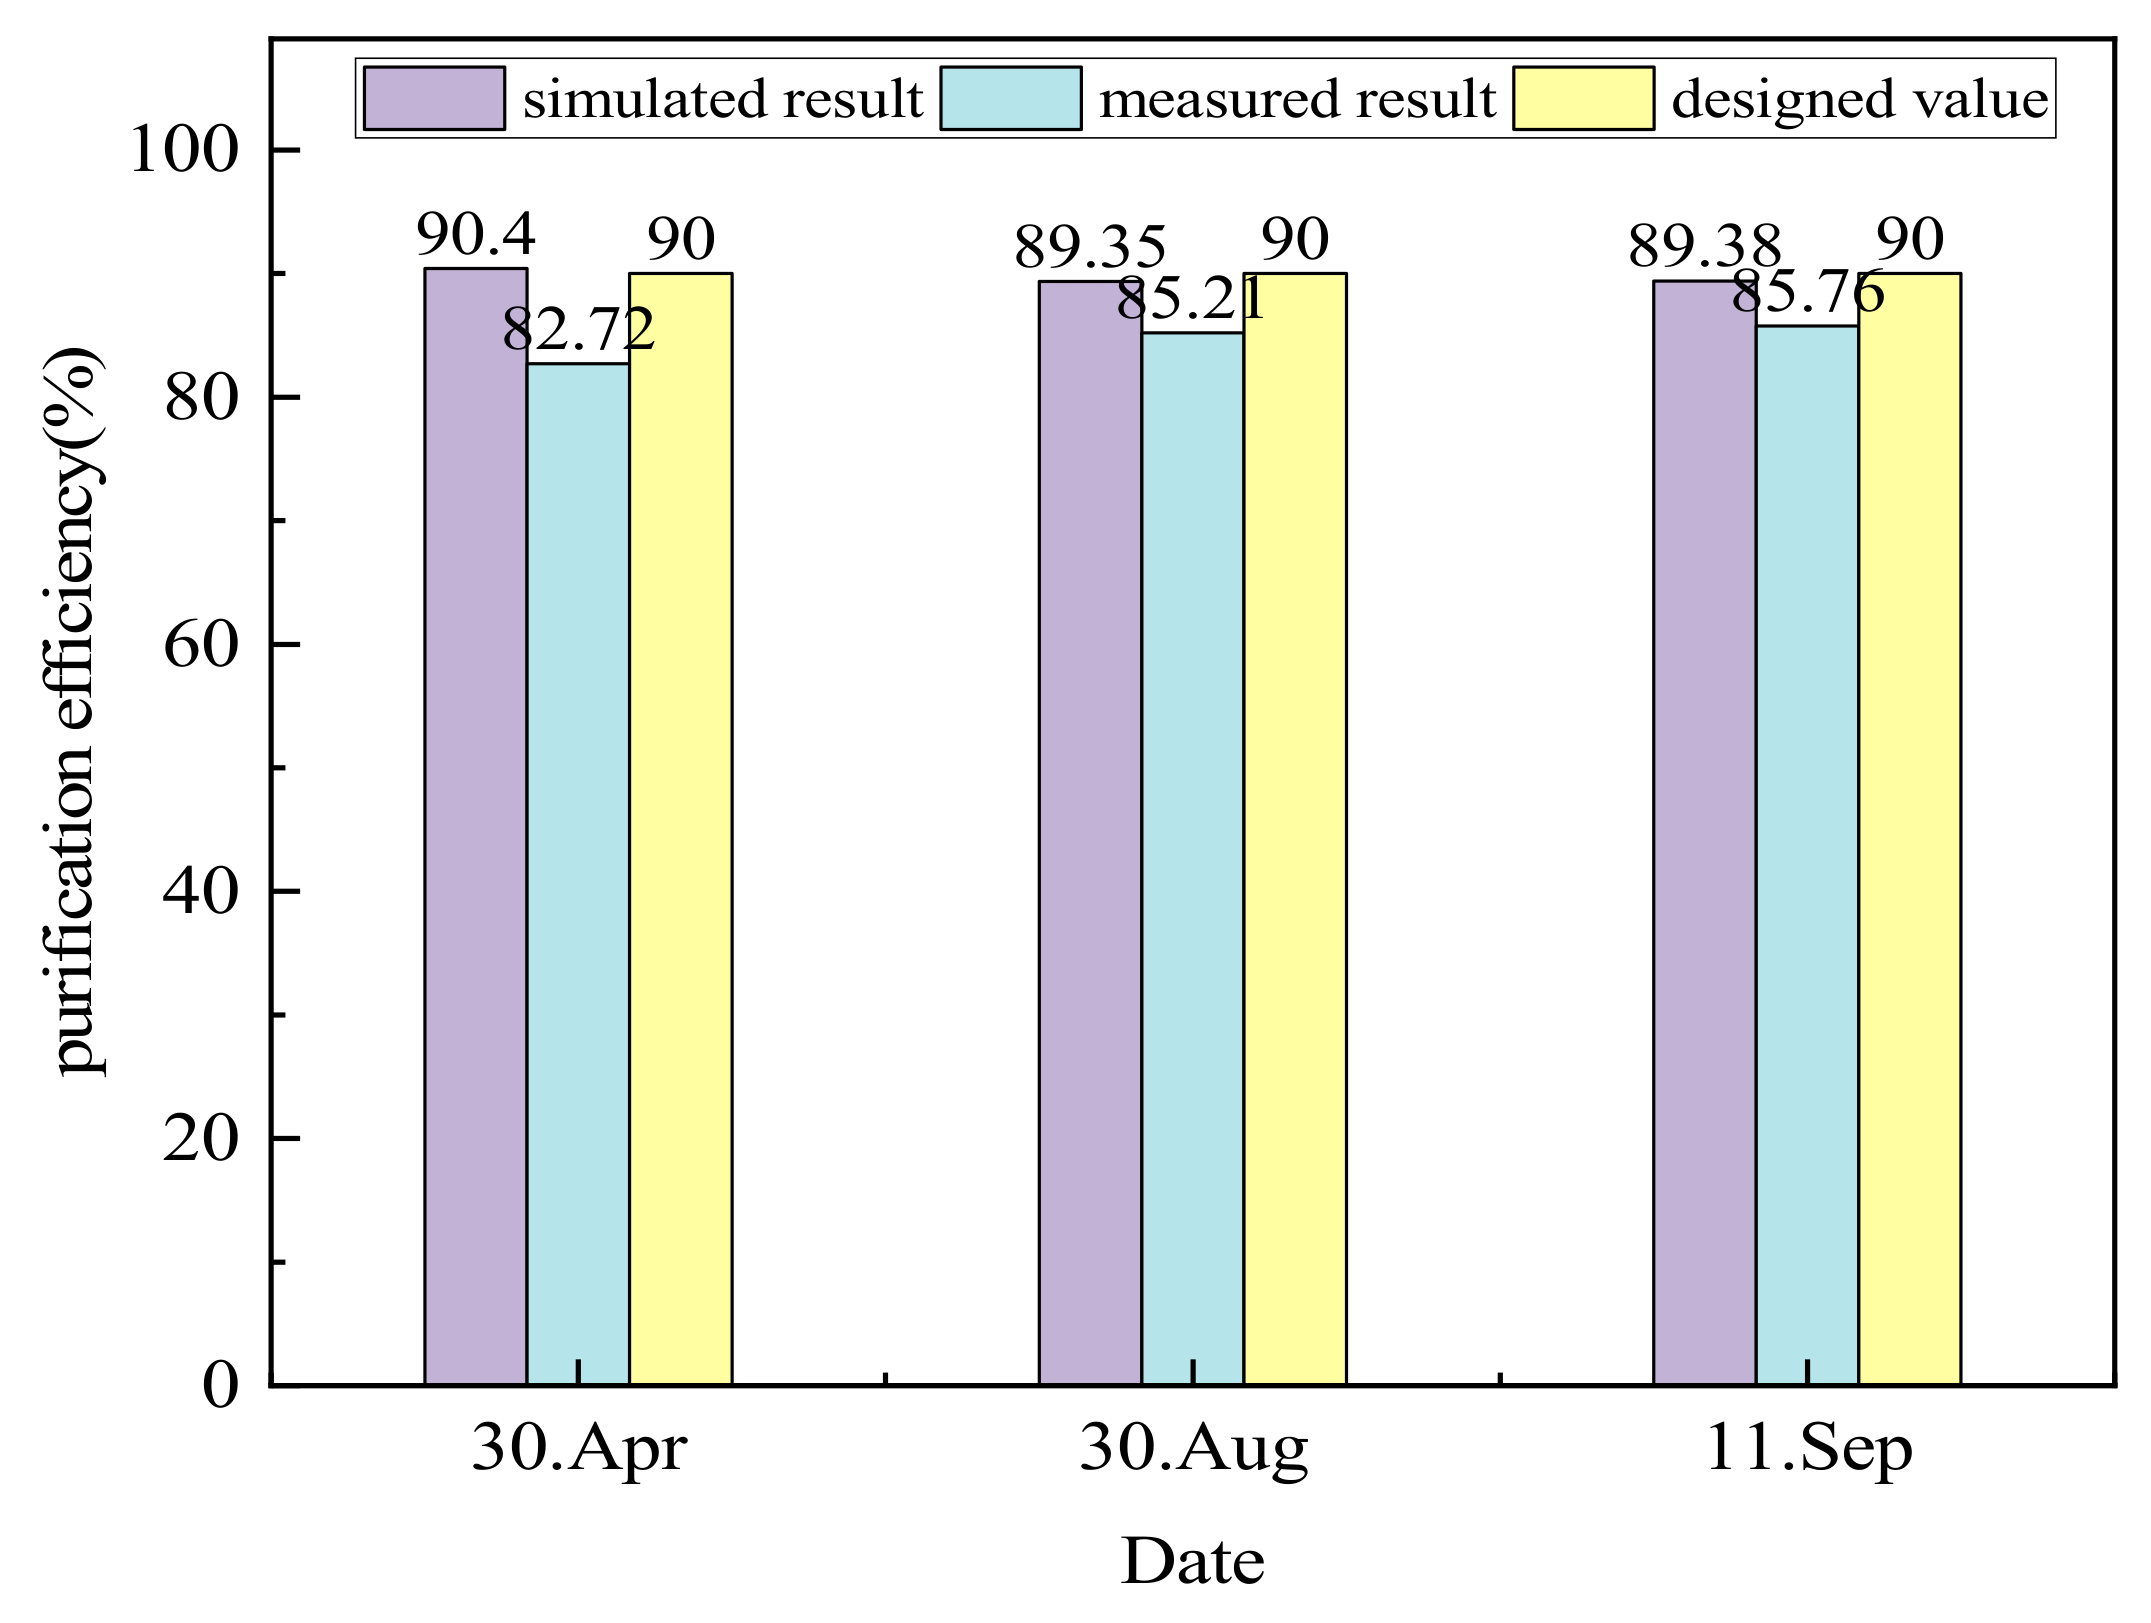
4.1.3. Purification Efficiency
4.2. Performance Prediction of Case CCKEF System under Various Conditions
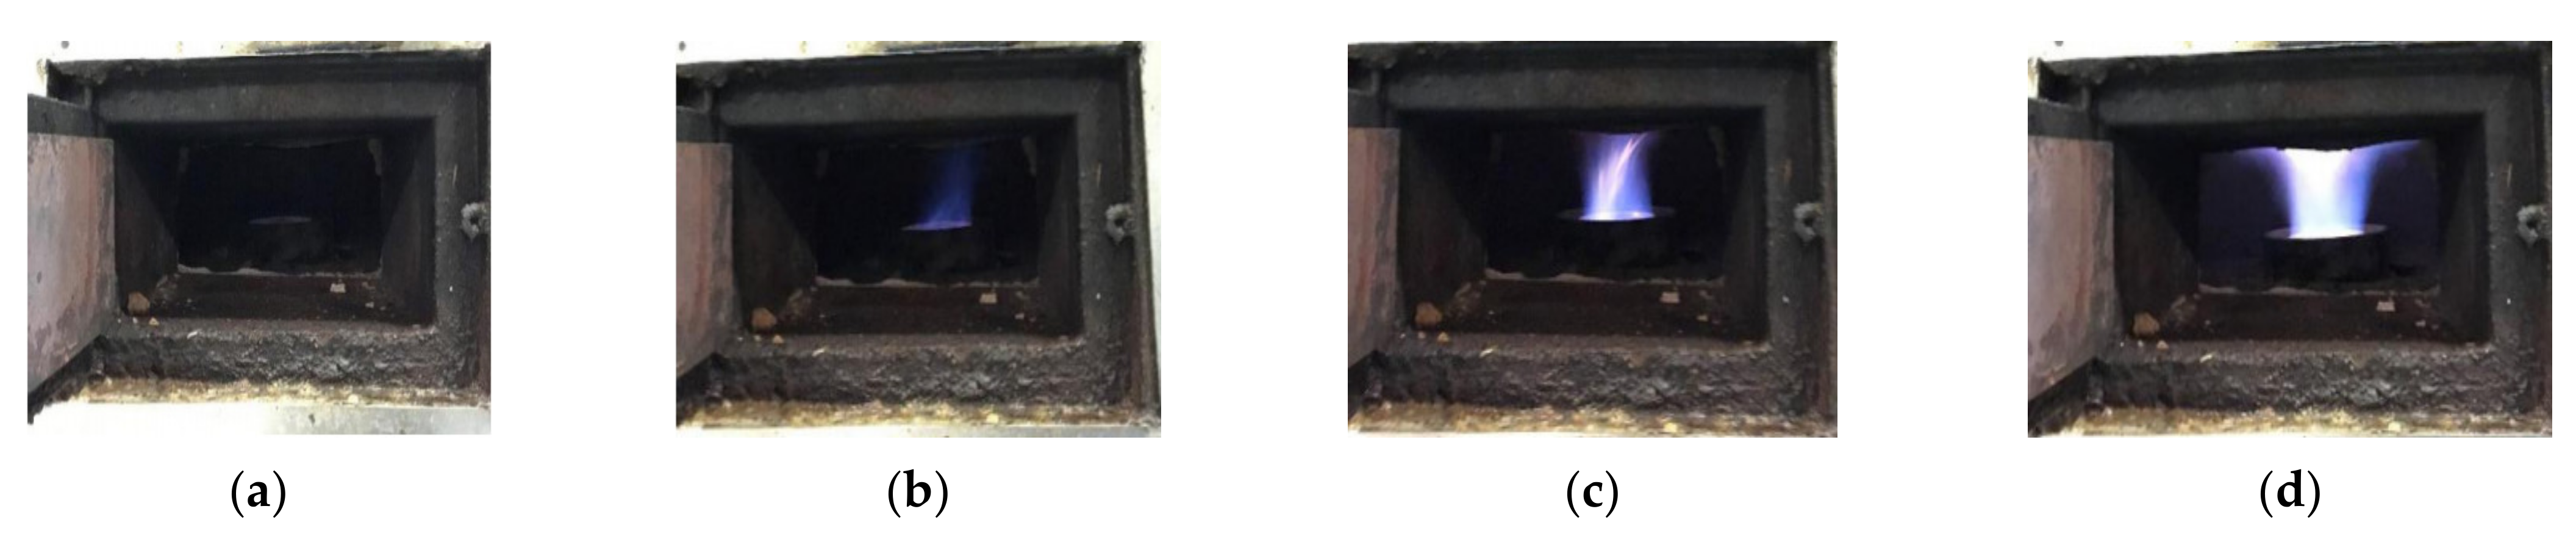
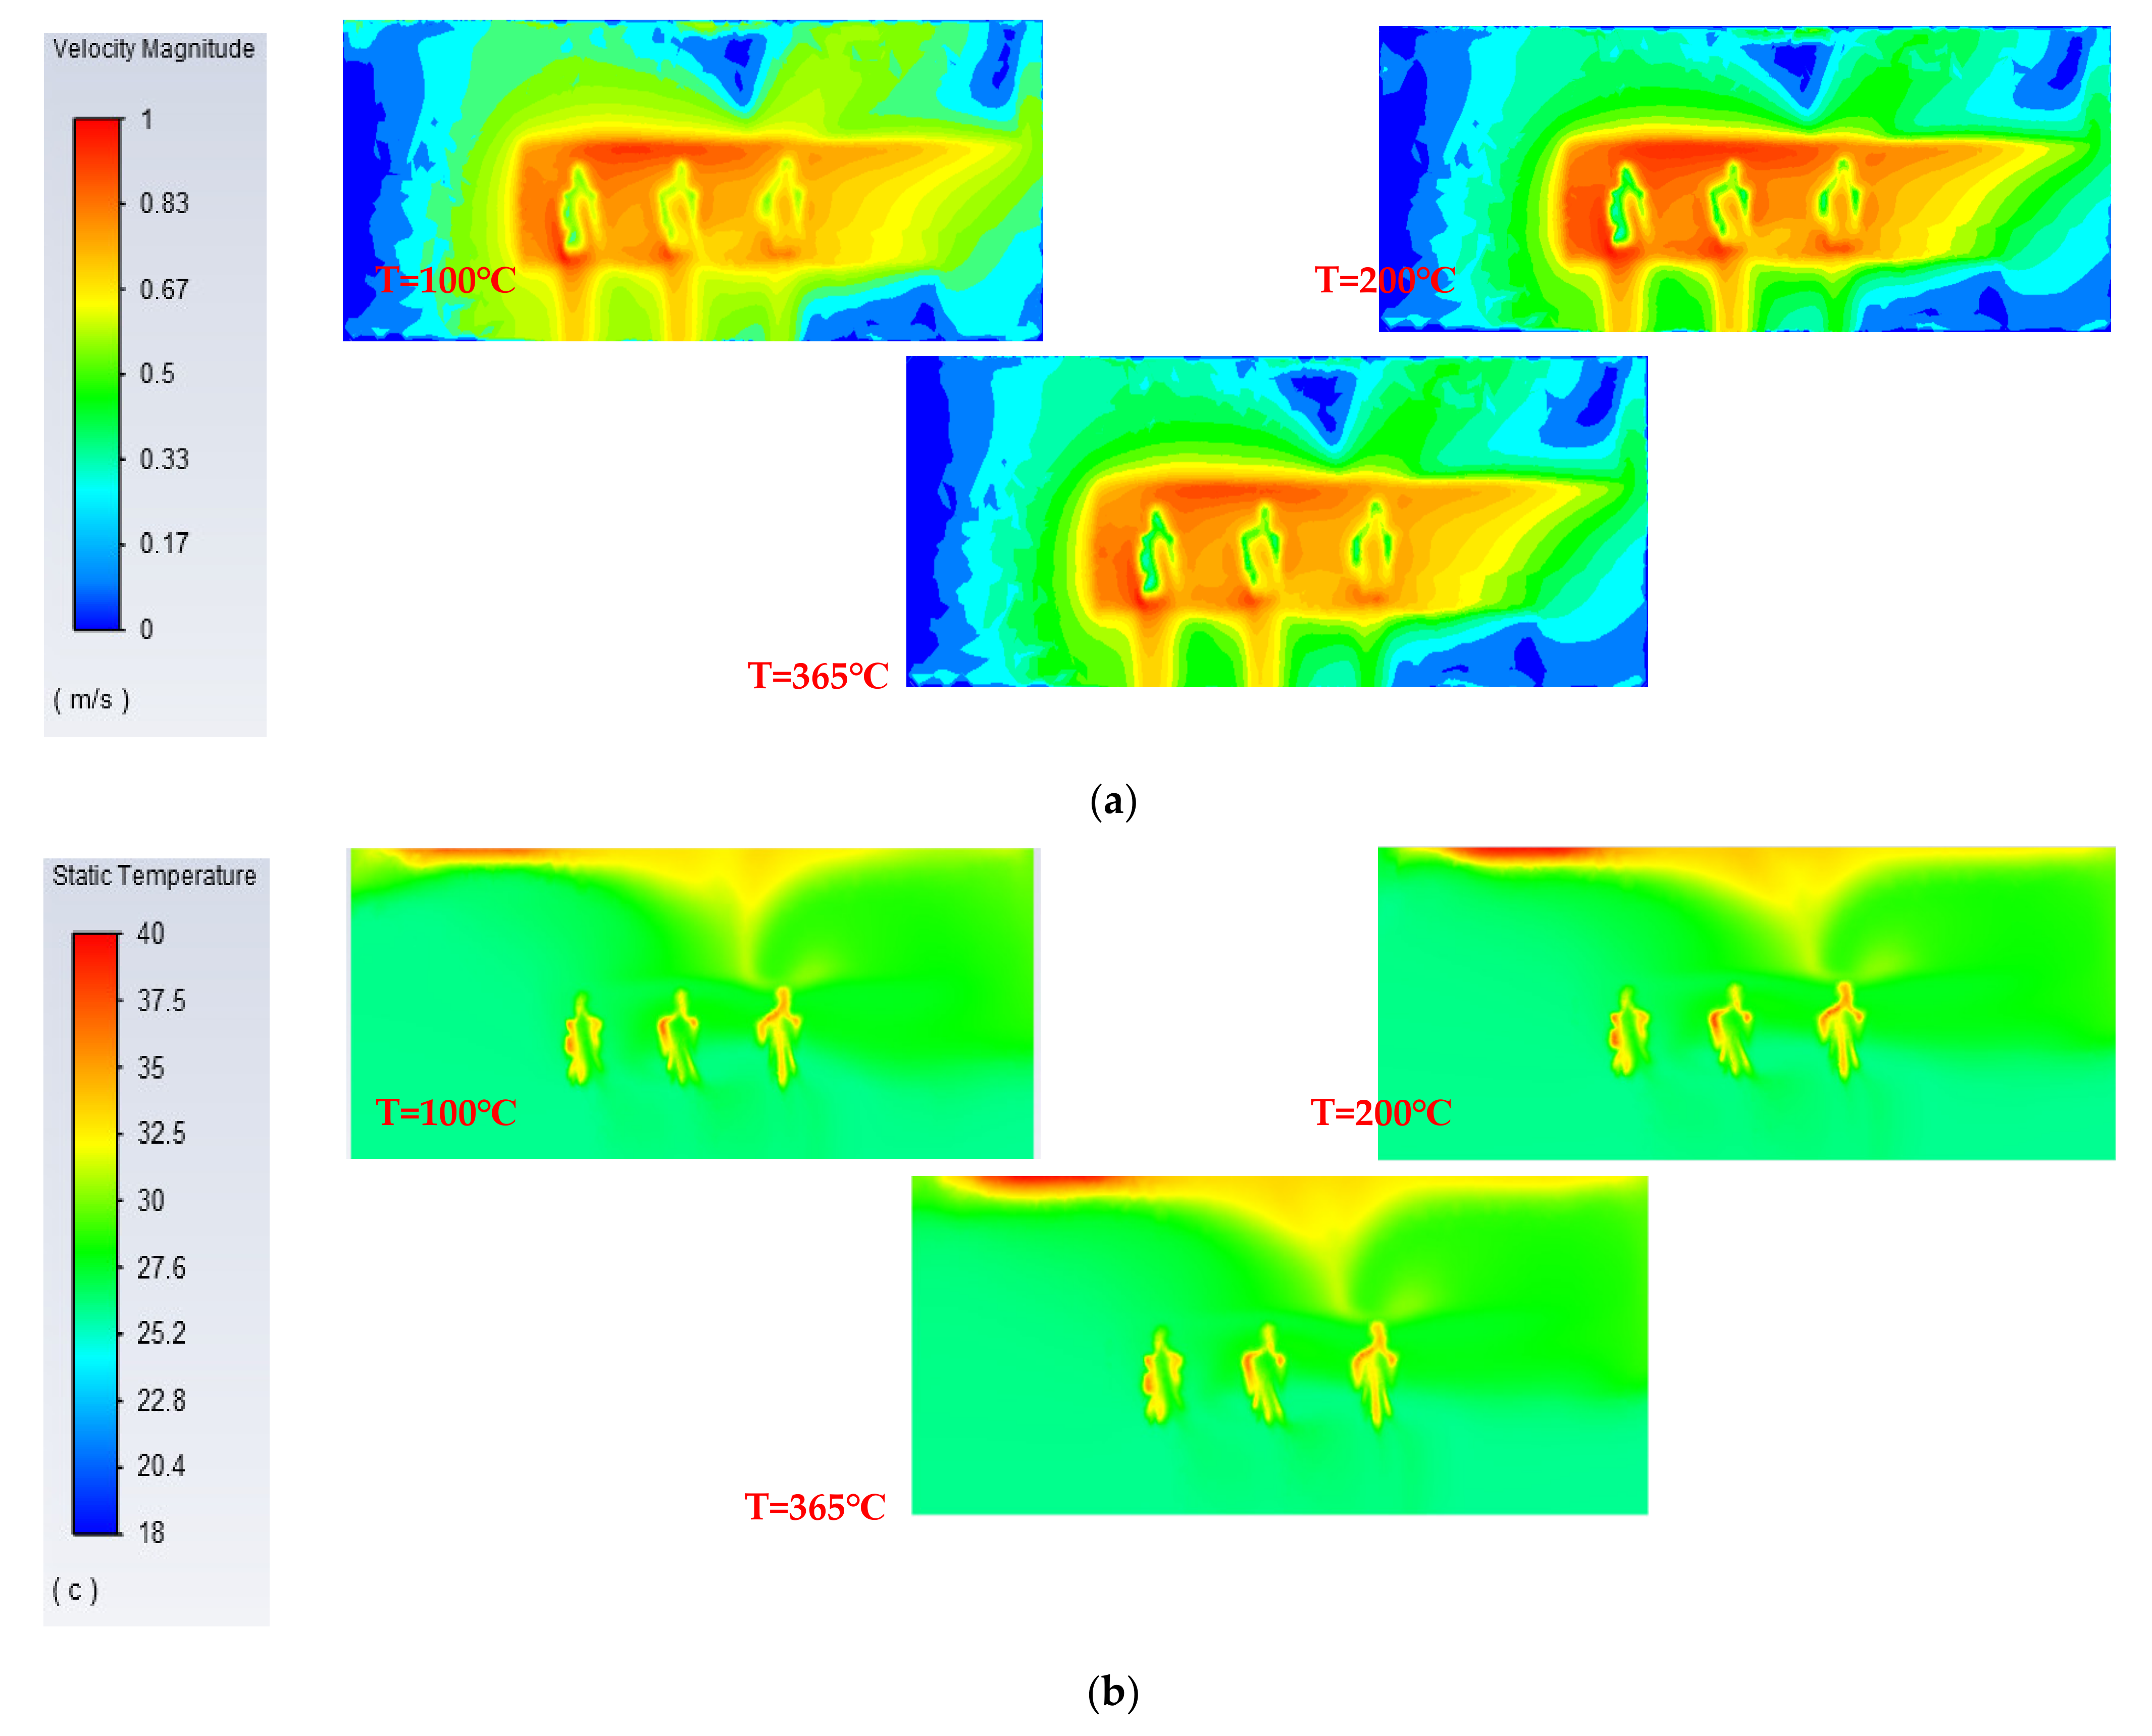
4.2.1. Different Surface Temperatures of Stoves
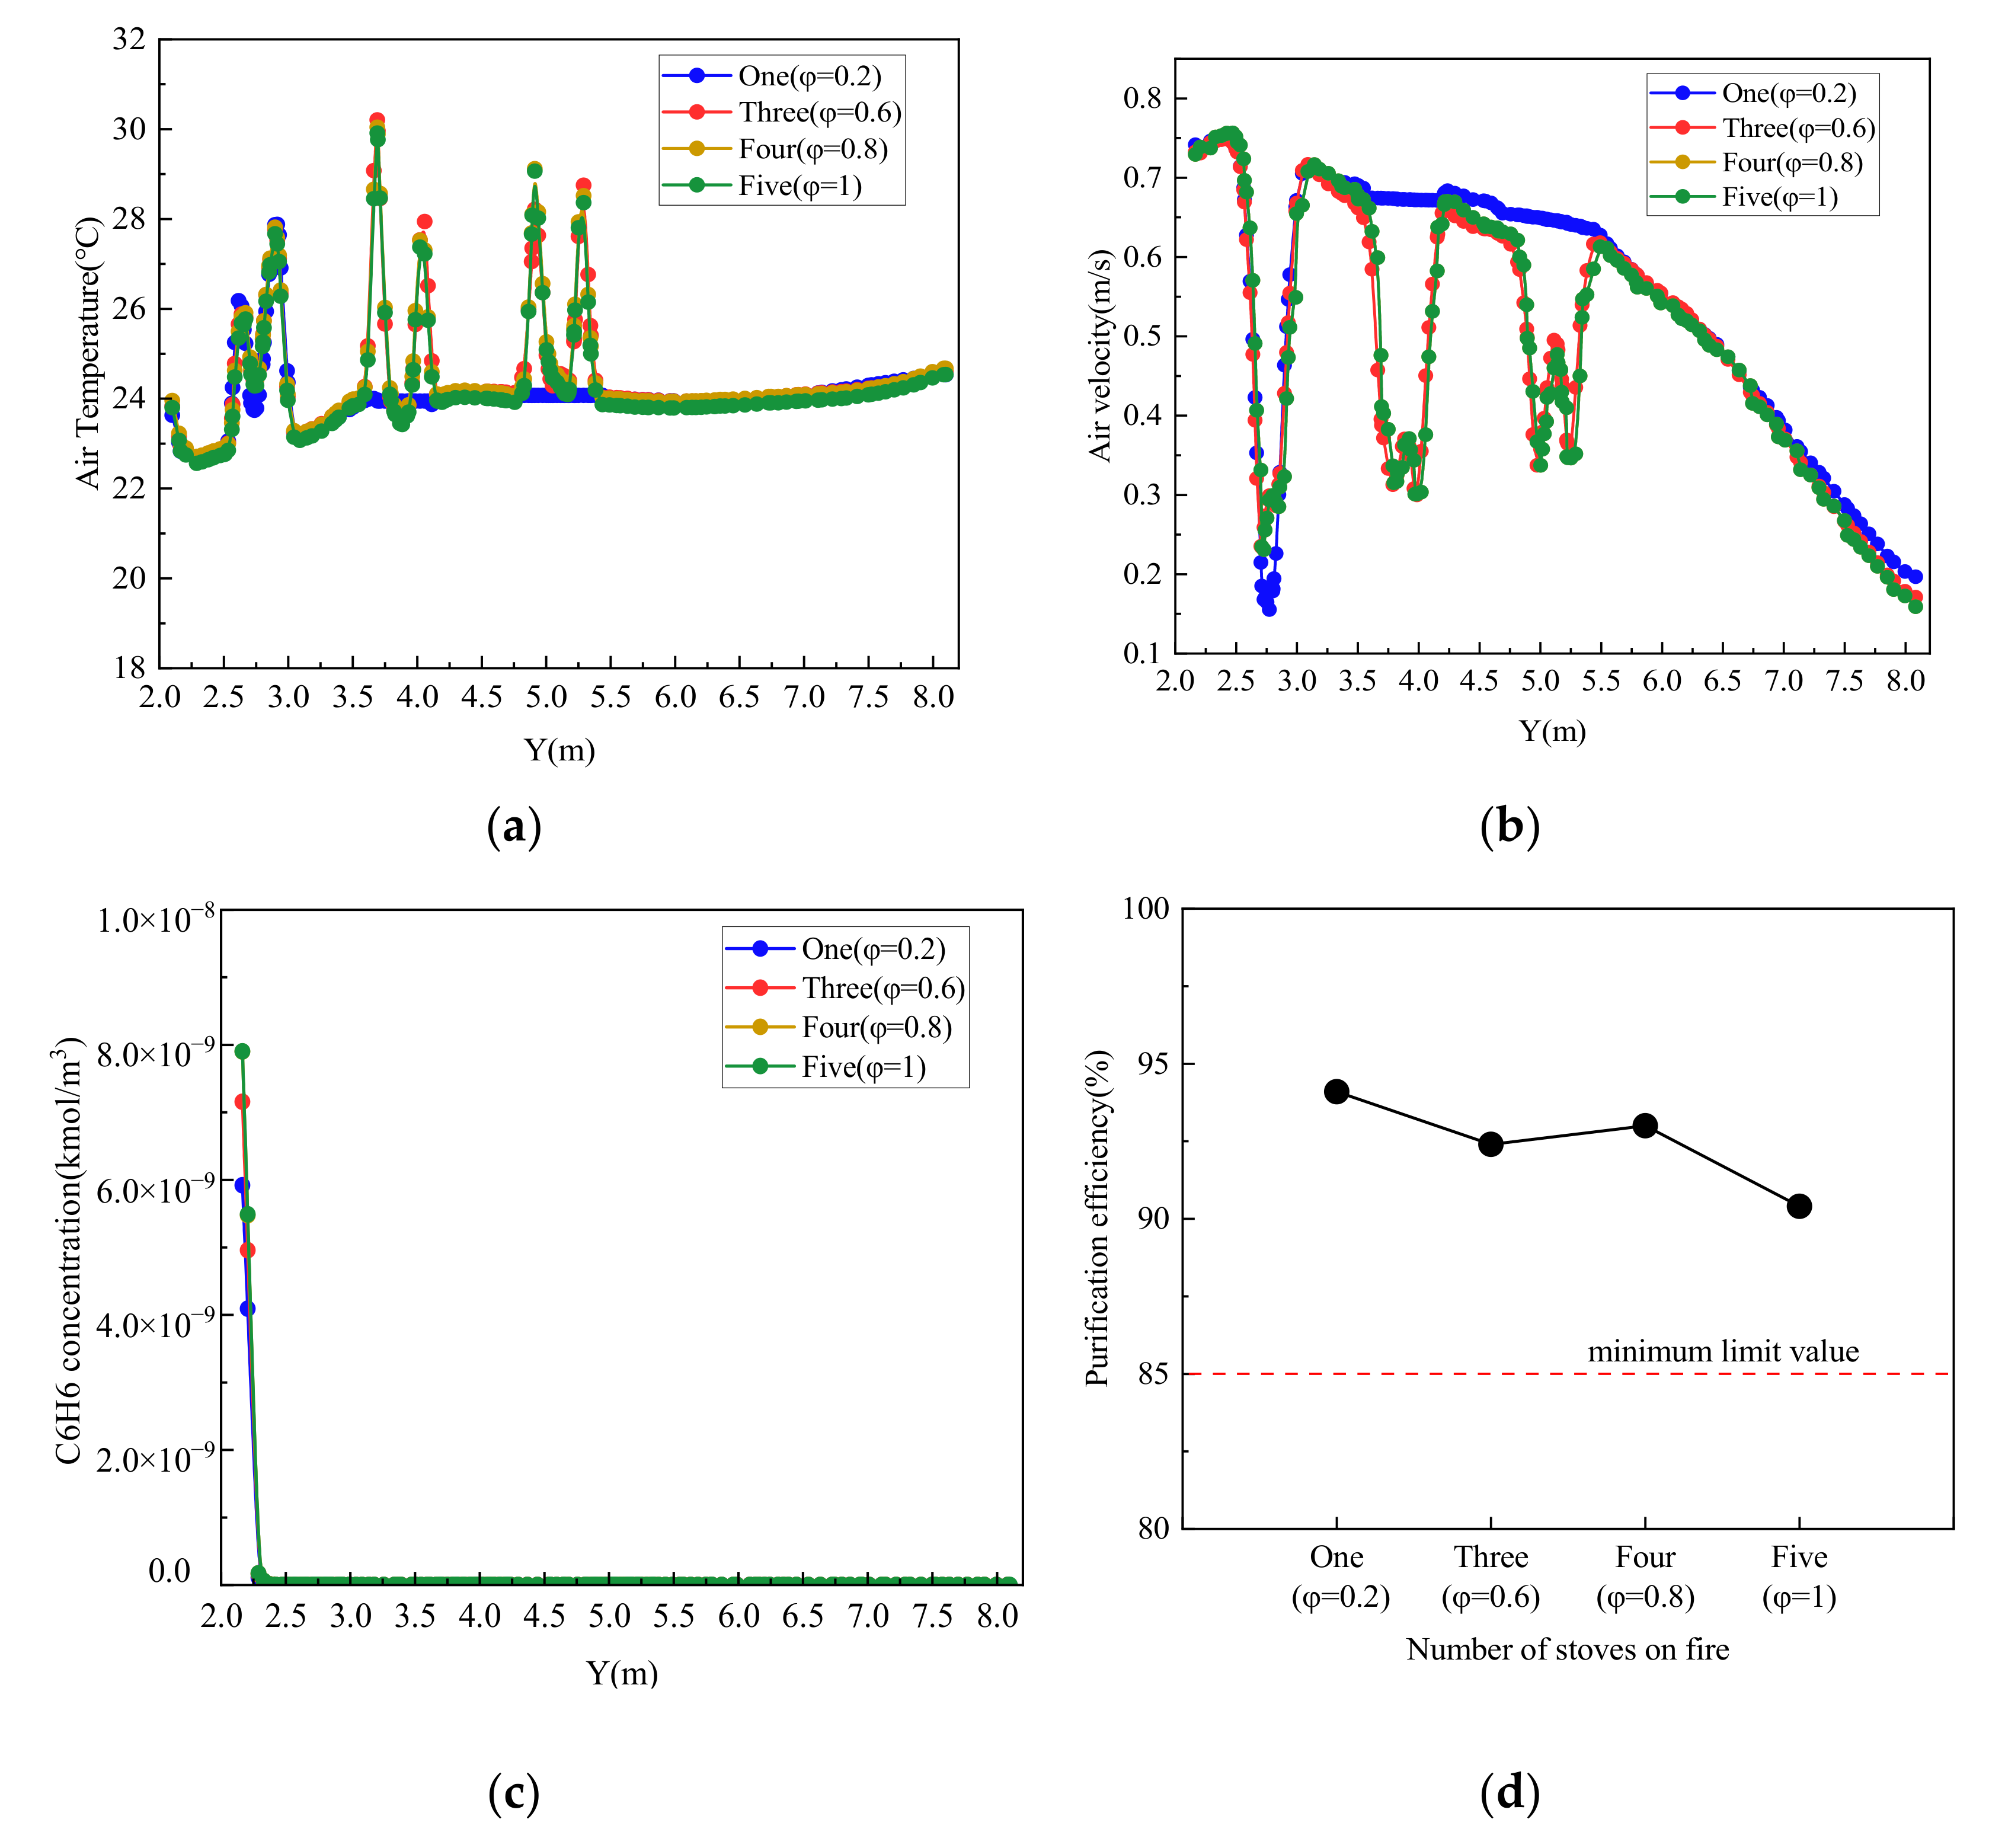
4.2.2. Different Simultaneity Coefficient of Stoves
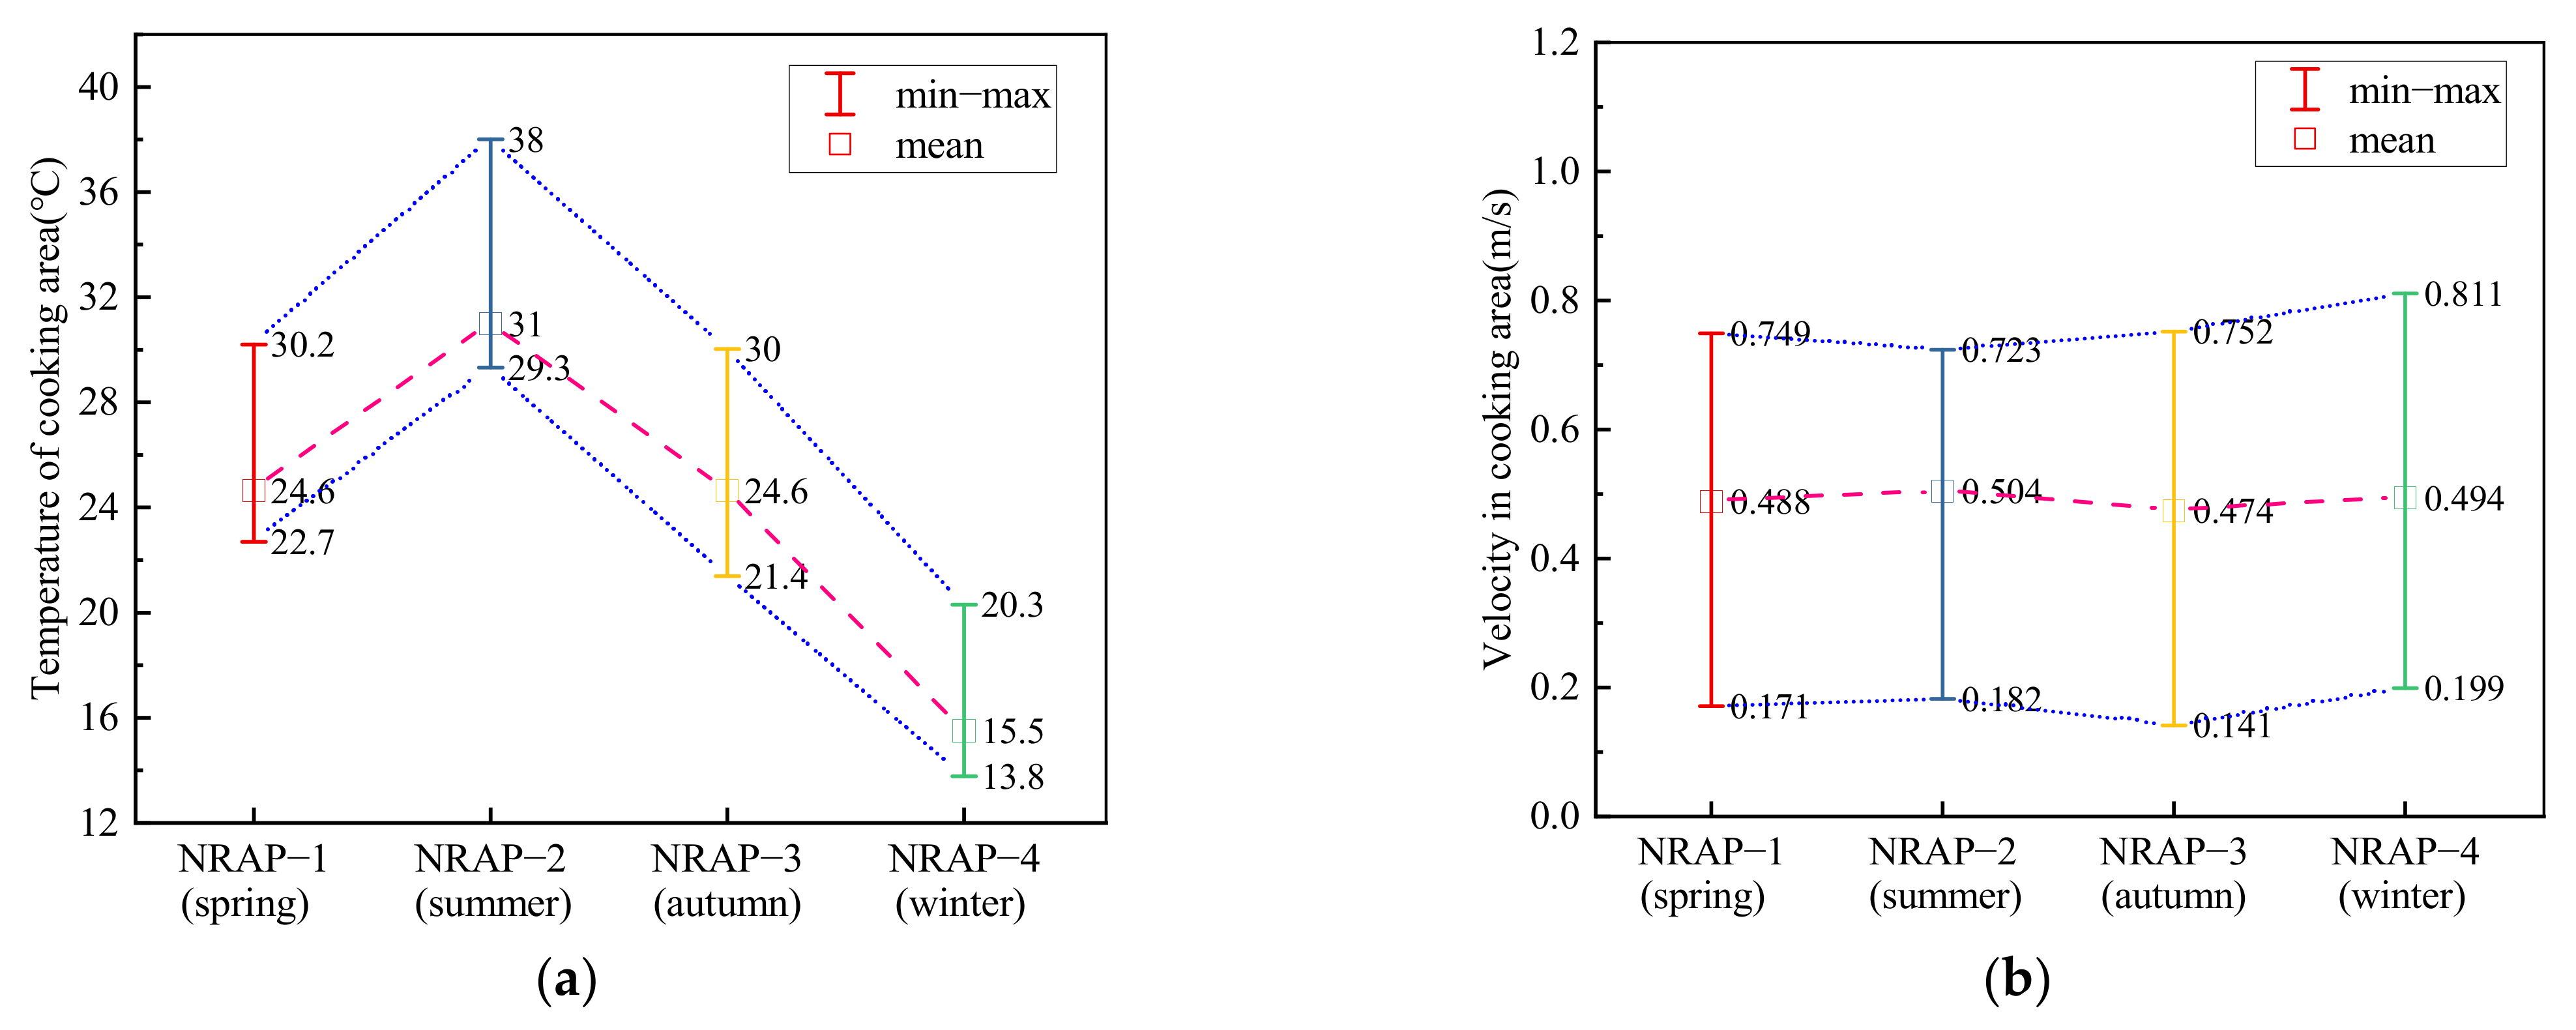
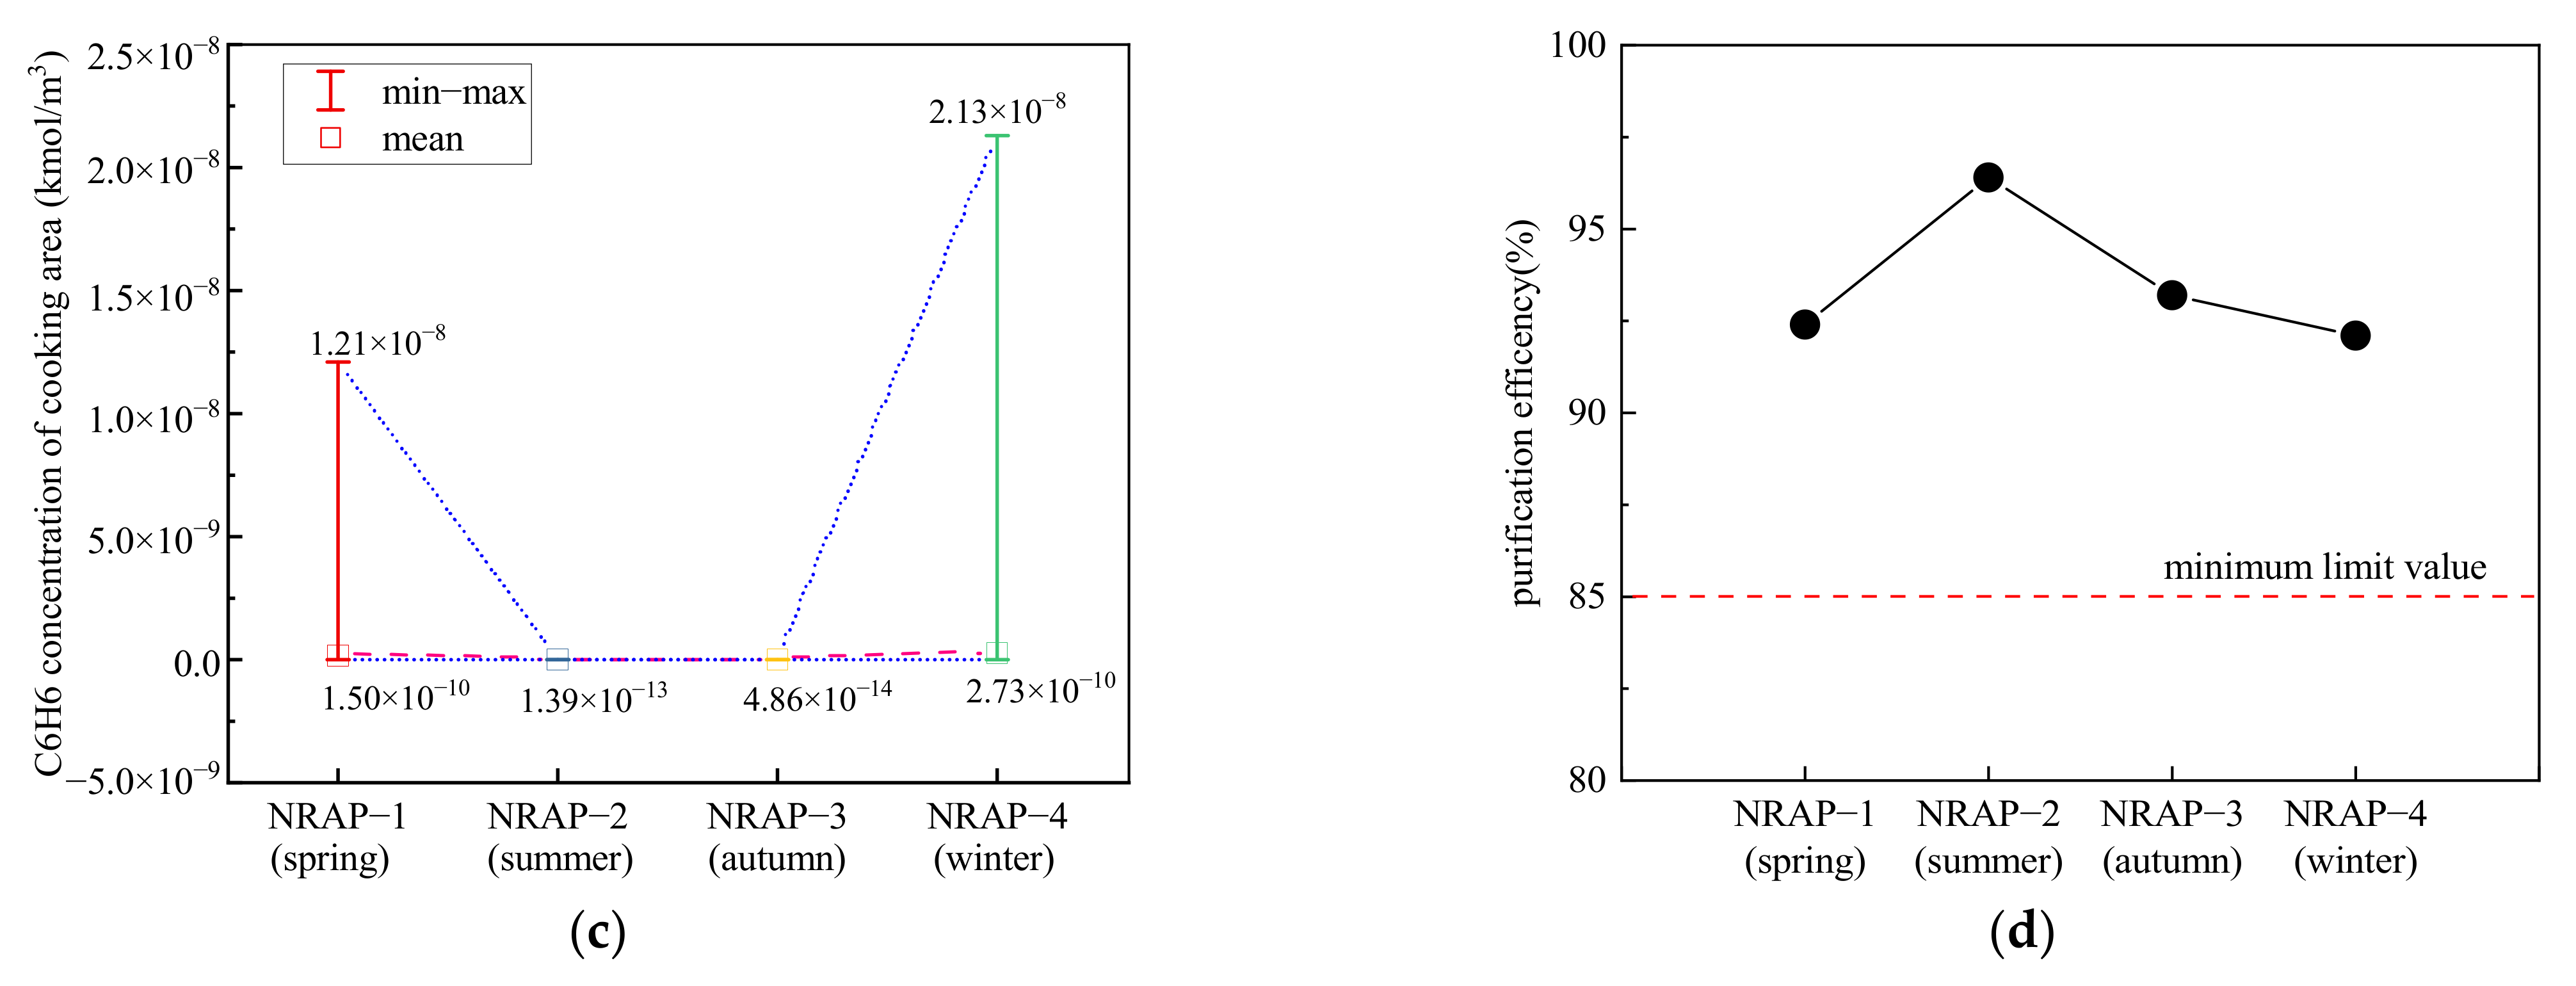
4.2.3. Different Scenarios of Natural Transfer Air from Adjacent Rooms
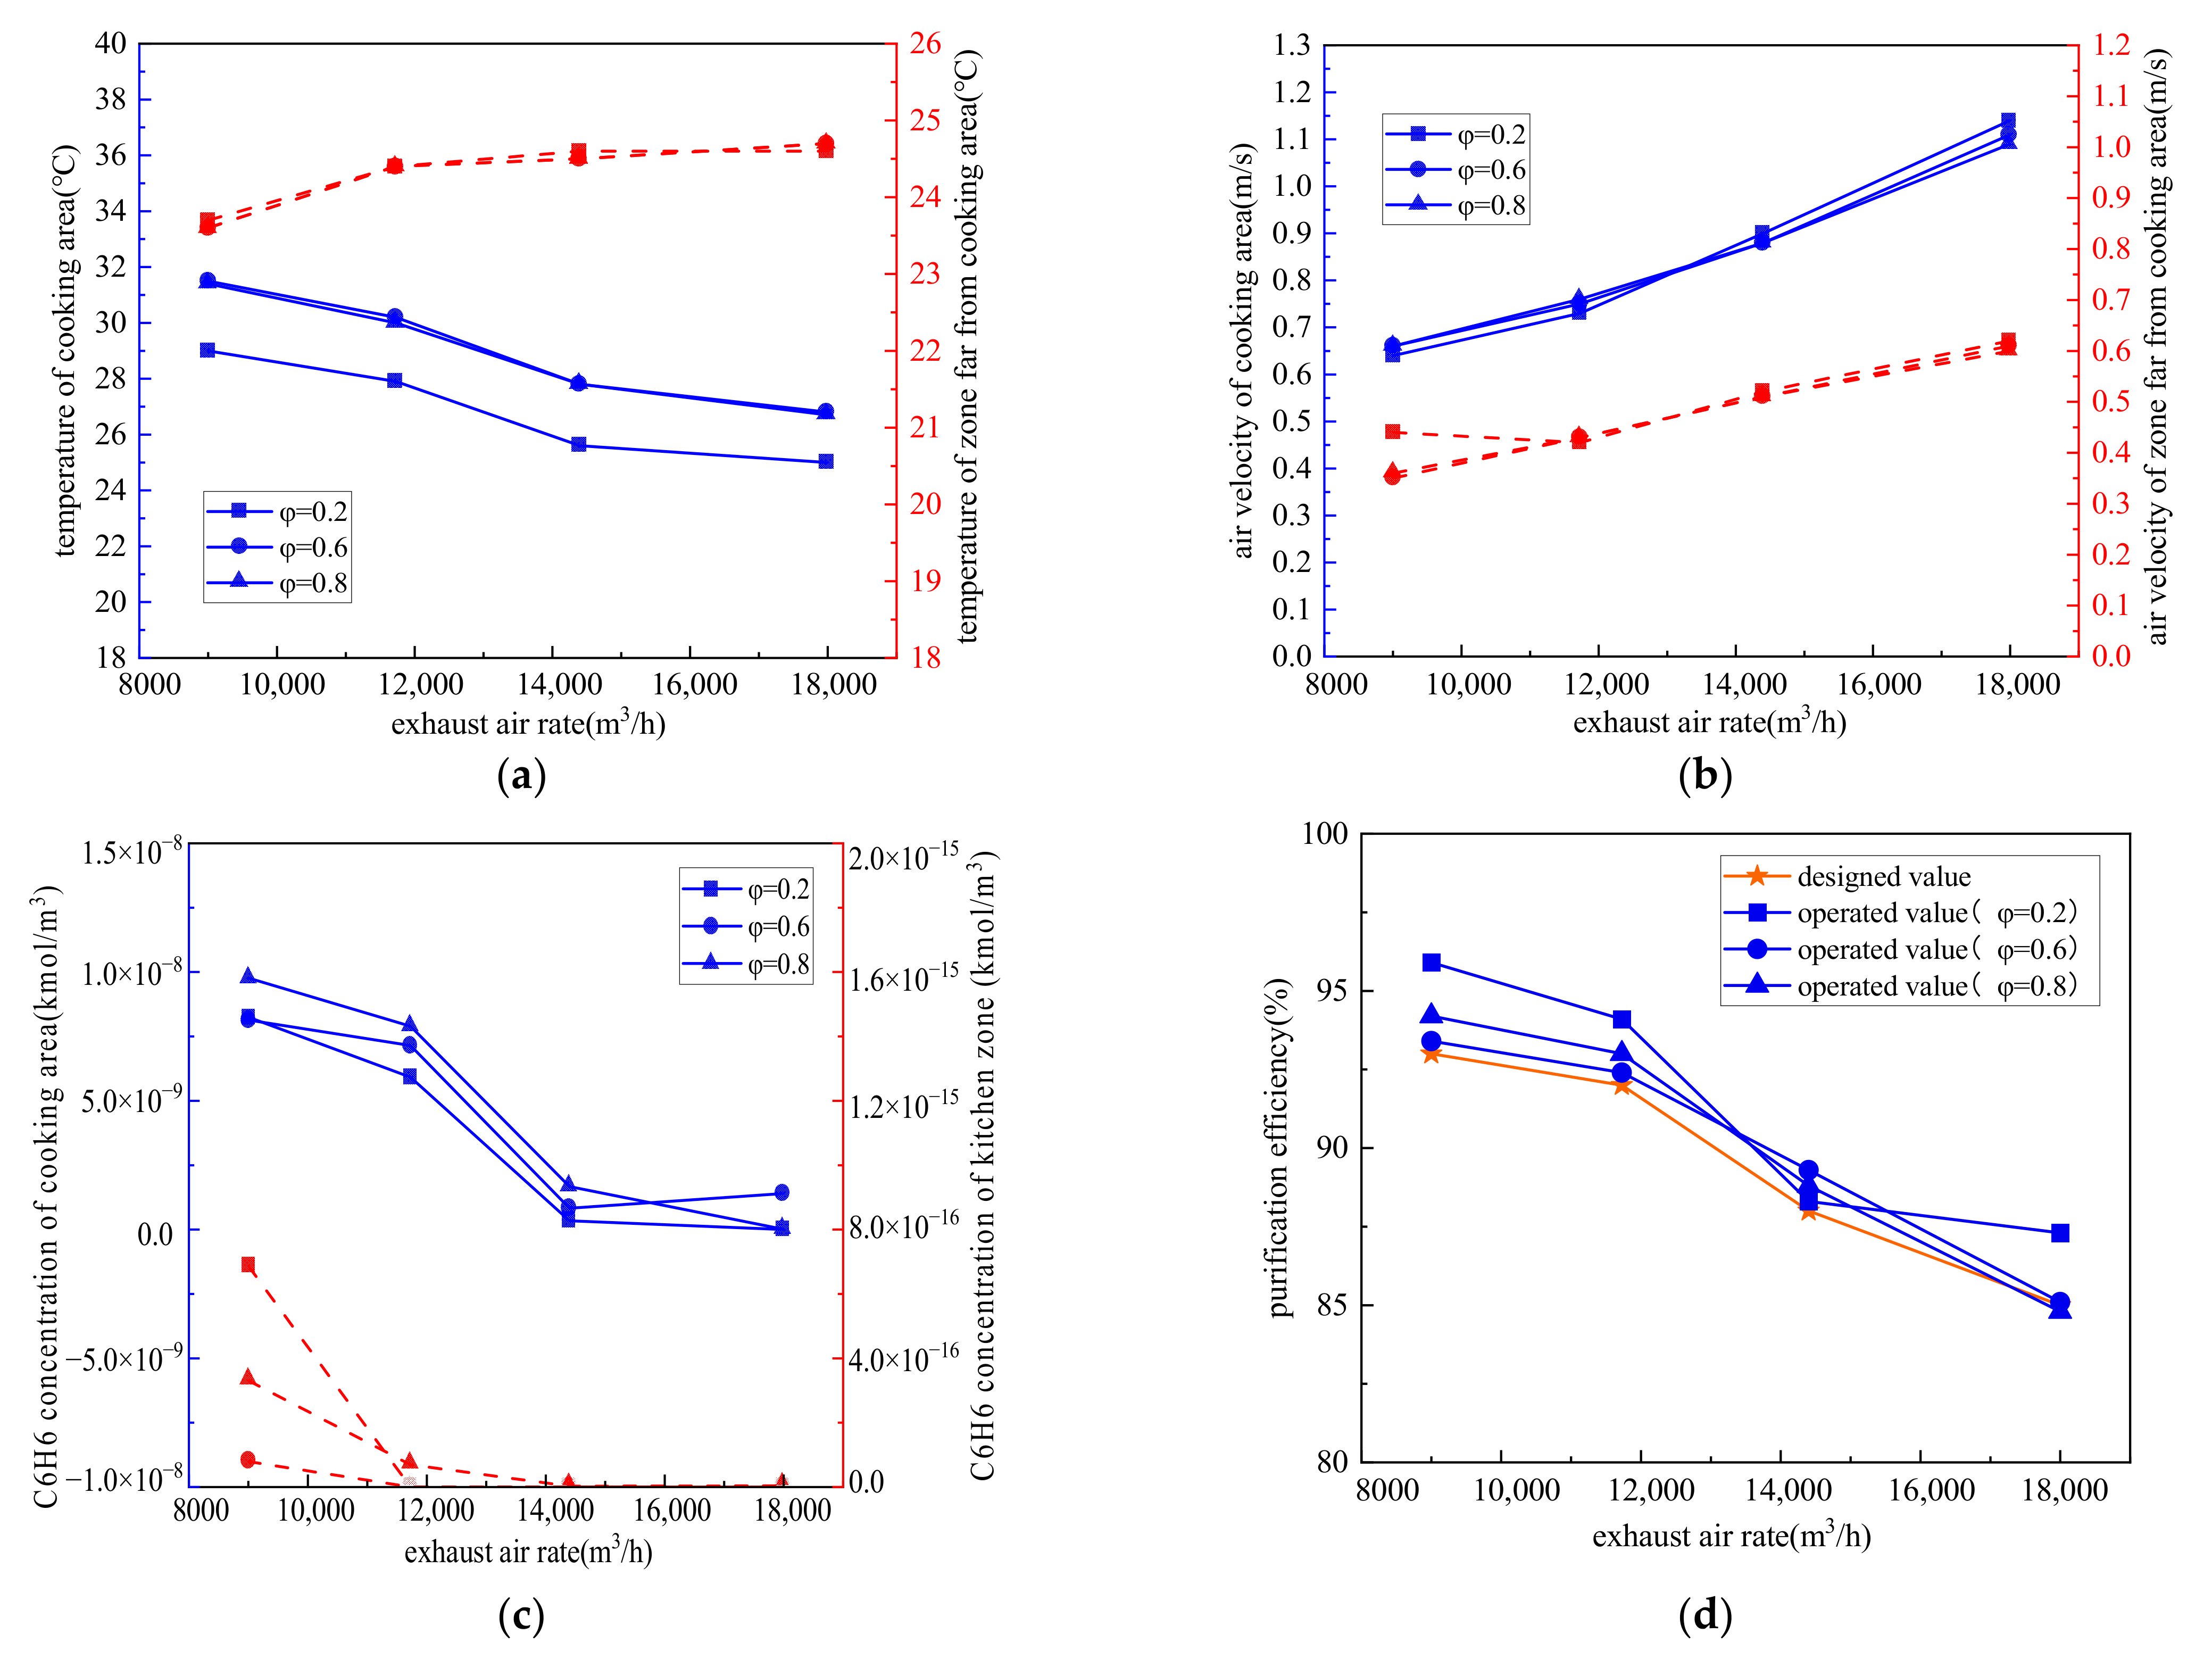
4.2.4. Different Exhaust Air Volumes
5. Conclusions
- (1)
- The change in simultaneity coefficient of stoves affected the air velocity, temperature and pollutant concentration distribution of the cooking area near the cooking stoves. Compared with the surface temperature of stoves, the temperature of natural transfer air from adjacent rooms had a greater impact on the thermal environment of the cooking area, and high airflow from adjacent rooms may disturb the hood capture performance. In order to improve the indoor kitchen environment, air-conditioned air was suggested to be introduced into the kitchen in summer and winter;
- (2)
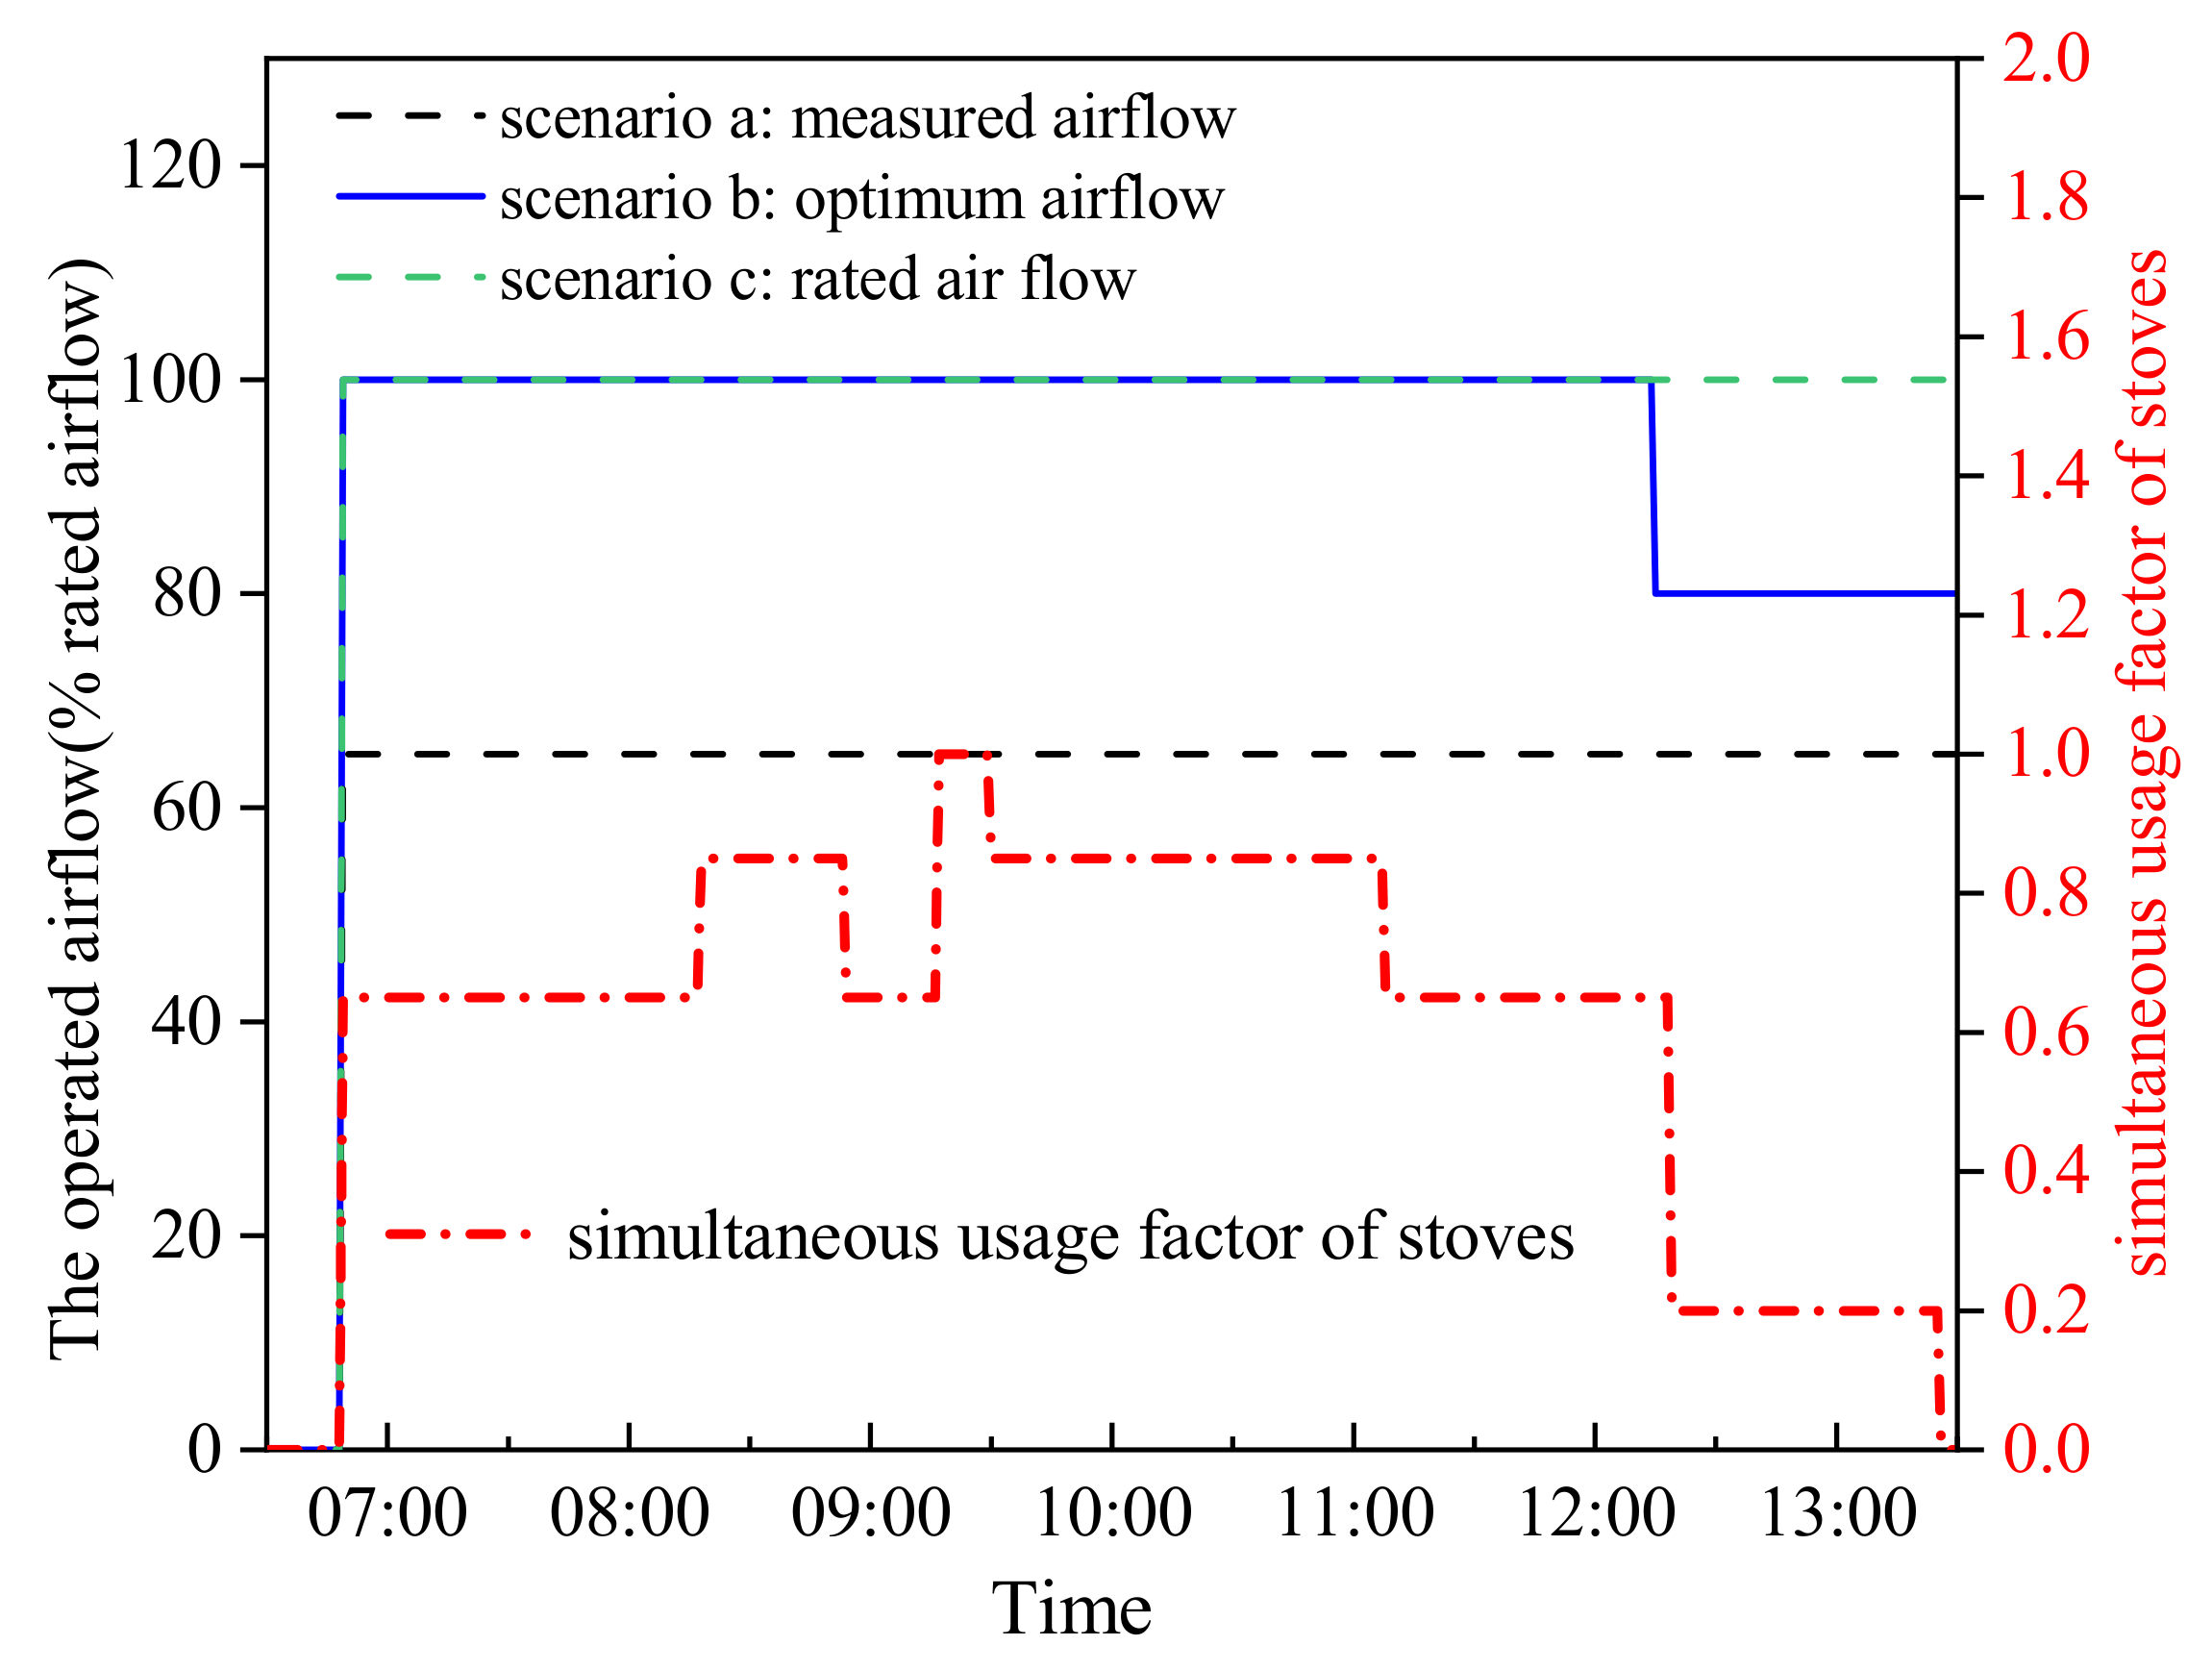
- The exhaust air volume had a significant influence on both the indoor air environment and purification efficiency. The measured air volume for the case CCKEF system, 65% of the rated air volume, was not the optimal operating air volume. The optimal operating air volume varied with the simultaneous coefficient of stoves, which was 80% and 100% of the rated air volume when the simultaneous coefficient of stoves was 0.2 and greater than 0.6, respectively;
- (3)
- On the premise of providing a comfortable indoor environment and eligible purification efficiency, the CCKEF system was suggested to be operated at the optimum airflow according to the simultaneous coefficient of stoves as the energy consumption of the system can be saved by 3.75% during the brunch cooking period.
Author Contributions
Funding
Institutional Review Board Statement
Informed Consent Statement
Data Availability Statement
Conflicts of Interest
References
- Huang, L.; Cheng, H.N.; Ma, S.T. The exposures and health effects of benzene, toluene and naphthalene for Chinese chefs in multiple cooking styles of kitchens. Environ. Int. 2021, 156, 106721. [Google Scholar] [PubMed]
- Zhang, W.; Bai, Z.; Shi, L.B.; Son, J.H.; Li, L.; Wang, L.; Chen, J. Investigating aldehyde and ketone compounds produced from indoor cooking emissions and assessing their health risk to human beings. J. Environ. Sci. 2022, 127, 389–398. [Google Scholar]
- Liu, Z.H.; Su, J.B.; Ma, A.J.; Liu, P. Study on emission characteristics of tracer pollutants in cooking oil fumes. Atmos. Pollut. Res. 2022, 13, 101409. [Google Scholar]
- Lin, C.S.; Huang, R.J.; Duan, J.; Zhong, H. Polycyclic aromatic hydrocarbons from cooking emissions. Sci. Total Environ. 2022, 818, 151700. [Google Scholar] [PubMed]
- EN 16282; Equipment For Commercial Kitchens–Components for Ventilation in Commercial Kitchens. Part 1: General Requirements Including Calculation Method. European Committee for Standardization: Brussels, Belgium, 2017.
- ANSI/ASHRAE 62.1-2019; Ventilation For Acceptable Indoor Air Quality. The American Society of Heating, Refrigeration, and Air-Conditioning Engineers: Atlanta, GA, USA, 2019.
- ANSI/ASHRAE 55-2020; Refrigeration, and Air-Conditioning Engineers. The American Society of Heating, Thermal Environmental Conditions for Human Occupancy: Atlanta, GA, USA, 2020.
- GB18483; Emission Standard of Cooking Fume. National Environment Protection Bureau: Washington, DC, USA; China Environmental Science Press: Beijing, China, 2019.
- Han, O.; Li, A.G.; Kosonen, R. Hood performance and capture efficiency of kitchens: A review. Build. Environ. 2019, 161, 106221. [Google Scholar]
- Zhao, Y.J.; Li, A.G.; Tao, P.; Gao, R. The impact of various hood shapes, and side panel and exhaust duct arrangements, on the performance of typical Chinese style cooking hoods. Build. Simul. 2012, 6, 139–149. [Google Scholar]
- Wang, Y.B.; Li, H.X.; Feng, G.H. Simulating the influence of exhaust hood position on ultrafine particles during a cooking process in the residential kitchen. Build. Simul. 2020, 13, 1339–1352. [Google Scholar]
- Zhou, B.; Wei, P.; Tan, M.; Xu, Y.; Lili, D.; Xinyue, M.; Zhao, Y.; Kosonen, R. Capture efficiency and thermal comfort in Chinese residential kitchen with push-pull ventilation system in winter-a field study. Build. Environment. 2019, 149, 182–195. [Google Scholar]
- Lu, S.; Zhou, B.; Zhang, J.Z.; Hou, M.; Jiang, J.; Li, F.; Wang, Y. Performance evaluation of make-up air systems for pollutant removal from gas stove in residential kitchen by using a push-pull ventilation system. Energy Build. 2021, 240, 110907. [Google Scholar]
- Chen, Z.L.; Xin, J.J.; Liu, P.Y. Air quality and thermal comfort analysis of kitchen environment with CFD simulation and experimental calibration. Build. Environ. 2020, 172, 106691. [Google Scholar]
- Liu, S.M.; Cao, Q.; Zhao, X.W.; Lu, Z.; Deng, Z.; Dong, J.; Lin, X.; Qing, K.; Zhang, W.; Chen, Q. Improving indoor air quality and thermal comfort in residential kitchens with a new ventilation system. Build. Environ. 2020, 180, 107016. [Google Scholar] [CrossRef]
- Lv, L.; Gao, J.; Zeng, L.J.; Cao, C.; Zhang, J.; He, L. Performance assessment of air curtain range hood using contaminant removal efficiency: An experimental and numerical study. Build. Environ. 2021, 188, 107456. [Google Scholar] [CrossRef]
- Song, Y.L.; Chen, X.; Zhang, Z.; Cao, S.; Du, T.; Guo, H. Studies on the control of kitchen pollutants by exhaust hood with air-filled slots. J. Build. Eng. 2022, 48, 103891. [Google Scholar] [CrossRef]
- Pal, C.L.; Netam, N. Analysis of temperature and exhaust gases distribution in residential kitchen of LIG house. Mater. Today: Proc. 2021, 44, 3025–3031. [Google Scholar]
- Lv, L.; Zeng, L.J.; Wu, Y.H.; Gao, J.; Xie, W.; Cao, C.; Chen, Y.; Zhang, J. Effects of human walking on the capture efficiency of range hood in residential kitchen. Build. Environ. 2021, 196, 107821. [Google Scholar] [CrossRef]
- Mahaki, M.; Mattsson, M.; Salmanzadeh, M.; Hayati, A. Experimental and numerical simulations of human movement effect on the capture efficiency of a local exhaust ventilation system. J. Build. Eng. 2022, 52, 104444. [Google Scholar] [CrossRef]
- Zhao, D.F.; You, X.Y. Cooking grease particles purification review and technology combination strategy evaluation for commercial kitchens. Build. Simul. 2021, 14, 1597–1617. [Google Scholar] [CrossRef]
- Zhang, A.W.; Deng, N.; Shen, C.Y.; Hao, R.; Liu, J.; Wang, Y.; Long, Z. Survey study on Chinese commercial kitchen exhaust fume systems in Tianjin. Build. Environ. 2020, 171, 106629. [Google Scholar] [CrossRef]
- Gao, M.X.; Zhu, Y.; Yao, X.; Shi, J. Dust removal performance of two-stage electrostatic precipitators and its influencing factors. Powder Technol. 2019, 348, 13–23. [Google Scholar] [CrossRef]
- Li, S.S.; Zhang, S.Y.; Pan, W.X.; Long, Z.; Yu, T. Experimental and theoretical study of the collection efficiency of the two-stage electrostatic precipitator. Powder Technol. 2019, 356, 1–10. [Google Scholar] [CrossRef]
- Zhu, Y.; Chen, C.; Shi, J.W.; Chen, M.; Shangguan, W. Experimental investigation of the effect of collection length in a two-stage electrostatic precipitator for removal of PM2.5. Chem. Eng. J. 2021, 421, 127797. [Google Scholar] [CrossRef]
- Wang, L.N.; Xiang, Z.Y.; Stevanovic, S.; Ristovski, Z.; Salimi, F.; Gao, J.; Wang, H.; Li, L. Role of Chinese cooking emissions on ambient air quality and human health. Sci. Total Environ. 2017, 589, 173–181. [Google Scholar] [CrossRef]
- Gao, J.; Cao, C.; Zhang, X. Volume-based size distribution of accumulation and coarse particles (PM0.1–10) from cooking fume during oil heating. Build. Environ. 2013, 59, 575–580. [Google Scholar] [CrossRef]
- Jaworek, A.; Marchewicz, A.; Sobczyk, A.T.; Krupa, A.; Czech, T. Two-stage electrostatic precipitators for the reduction of PM2.5 particle emission. Prog. Energy Combust. Sci. 2018, 67, 206–233. [Google Scholar] [CrossRef]
- Liu, Y.; Dong, J.K.; Wang, Y.; Zheng, W.; Jiang, Y. Numerical investigation on the influence of natural make-up air in Chinese-style residential kitchen on indoor environment in a partitioned household. Sustain. Energy Technol. Assess. 2021, 46, 101244. [Google Scholar] [CrossRef]
- Benchikh, L.H.A.E.; Poncet, S.; Fellouah, H. CFD modeling of the CO2 capture by range hood in a full-scale kitchen. Build. Environ. 2020, 183, 107168. [Google Scholar] [CrossRef]
- Xie, W.H.; Gao, J.; Lv, L.P.; Cao, C.; Hou, Y.; Wei, X.; Zeng, L. Exhaust rate for range hood at cooking temperature near the smoke point of edible oil in residential kitchen. J. Build. Eng. 2022, 45, 103545. [Google Scholar] [CrossRef]
- Zhao, Y.; Chen, C.; Zhao, B. Is oil temperature a key factor influencing air pollutant emissions from Chinese cooking? Atmos. Environ. 2018, 193, 190–197. [Google Scholar] [CrossRef]
- Liu, Y.; Li, H.X.; Feng, G.H. Simulation of inhalable aerosol particle distribution generated from cooking by Eulerian approach with RNG k-epsilon turbulence model and pollution exposure in a residential kitchen space. Build. Simul. 2017, 10, 135–144. [Google Scholar] [CrossRef]
- Choi, H.Y.; Park, Y.G.; Ha, M.Y. Numerical simulation of the wavy collecting plate effects on the performance of an electrostatic precipitator. Powder Technol. 2021, 382, 232–243. [Google Scholar] [CrossRef]
- Gao, W. Numerical simulation of particle migration in electrostatic precipitator with different electrode configurations. Powder Technol. 2020, 361, 238–247. [Google Scholar]


| Position | Type | Pollutant | Detail Parameters | Reference |
|---|---|---|---|---|
| Emit | Mass-flow inlet | Aerosol particle | Release rate = 3.3 × 10⁻⁷ kg/s; T = 210 °C | [33] |
| Stove burner | Mass-flow inlet | CO2 | Release rate = 4.7 × 10⁻³ kg/s; T = 127 °C; Mass fraction = 100% | [30] |
| Boiler | Velocity inlet | Water vapor | V = 2 m/s; T = 70 °C | [14] |
| Pot (exterior) | Wall | - | T = 120 °C | [15] |
| Pot (top) | Wall | - | T = 310 °C | |
| Emit | Velocity-inlet | Ultrafine particles | V = 0.1 m/s; T = 210 °C | [11] |
| Pollutant/heat source | Mass-flow inlet | CO2 | T = 1400 K; Release rate = 1.28 × 10⁻³ kg/s | [13] |
| Pot (exterior) | Wall | - | T = 100 °C | [29] |
| Pot (top) | Mass-flow inlet | PM2.5 | Release rate = 10−7 kg/s; T = 100 °C | |
| Pot | Velocity inlet | SF6 | V = 0.29 m/s; T = 100 °C; Mass fraction = 10% | [19] |
| Gas burner | Velocity inlet | Exhaust gas | V = 1.714 m/s; T = 1200 K | [18] |
| Pot | Velocity inlet | - | V = 0.161–0.192 m/s; T = 200–300 °C | [31] |
| Position | Type | Parameters | ||||
|---|---|---|---|---|---|---|
| Velocity | Temperature | Mole Fraction | Particle | Electric Potential | ||
| Envelop/counter | Wall | No slip | Adiabatic | - | Reflect | Insulation |
| Lamps | Wall | No slip | 130.6 W/m2 | - | Reflect | Insulation |
| Personnel | Wall | No slip | 115 W/m2 | - | Reflect | Insulation |
| Pot(top) | Wall | No slip | Measured value | 0.2% C6H6, 99.8% H2O | Escape | Insulation |
| Pot(exterior) | Wall | No slip | - | Reflect | Insulation | |
| Smoke outlet | Mass flow inlet | 0.012 kg/s | Measured value | 9.2% CO2, 18.3% H2O, 72.5% N2 | Escape | = 0 |
| Hood/duct | Wall | No slip | Adiabatic | - | Reflect | Insulation |
| Wire plate | Wall | No slip | Adiabatic | - | Reflect | 25 kV |
| Collecting plate | - | Trap | 5 kV | |||
| Other plates | - | Reflect | 0 kV | |||
| Outlet | Reverse velocity-inlet | Measured value | - | - | Escape | = 0 |
| Door 1/door 2/Fresh air inlet | Pressure-inlet | 0 | Measured value | 23.1% O2, 76.9% N2 | Escape | = 0 |
| Points | 30 April | 30 August | 11 September | |||
|---|---|---|---|---|---|---|
| T (°C) | V (m/s) | T (°C) | V (m/s) | T (°C) | V (m/s) | |
| A1 | 31.0 ± 0.16 | 0.35 ± 0.01 | 36.2 ± 0.07 | 0.54 ± 0.02 | 35.7 ± 0.06 | 0.48 ± 0.02 |
| A2 | 29.1 ± 0.12 | 0.67 ± 0.02 | 36.4 ± 0.06 | 0.77 ± 0.03 | 28.8 ± 0.02 | 0.57 ± 0.01 |
| A3 | 28.0 ± 0.10 | 0.57 ± 0.01 | 35.3 ± 0.09 | 0.59 ± 0.01 | 33.4 ± 0.07 | 0.48 ± 0.03 |
| B1 | 25.4 ± 0.05 | 0.32 ± 0.01 | 31.4 ± 0.04 | 0.33 ± 0.02 | 31.3 ± 0.04 | 0.22 ± 0.06 |
| B2 | 25.5 ± 0.11 | 0.22 ± 0.01 | 31.3 ± 0.01 | 0.40 ± 0.003 | 30.6 ± 0.10 | 0.18 ± 0.01 |
| B3 | 23.8 ± 0.02 | 0.27 ± 0.02 | 31.0 ± 0.01 | 0.10 ± 0.01 | 30.1 ± 0.02 | 0.16 ± 0.01 |
| B4 | 25.1 ± 0.03 | 0.09 ± 0.03 | 32.9 ± 0.04 | 0.14 ± 0.08 | 31.2 ± 0.04 | 0.18 ± 0.01 |
| B5 | 23.4 ± 0.02 | 0.16 ± 0.02 | 29.8 ± 0.04 | 0.30 ± 0.005 | 29.5 ± 0.02 | 0.25 ± 0.03 |
| C1 | 32.4 | 0.55 ± 0.02 | 35 | 0.48 ± 0.01 | 34.6 | 0.26 ± 0.06 |
| C2 | 32.9 | 0.66 ± 0.04 | 35.2 | 0.53 ± 0.02 | 33.1 | 0.46 ± 0.03 |
| C3 | 33.3 | 0.68 ± 0.03 | 35.8 | 0.51 ± 0.04 | 33.5 | 0.42 ± 0.03 |
| D | / | / | / | / | 365.8 | / |
| E | / | / | / | / | 339.5 | / |
| F1 | 35.1 ± 0.75 | 11.28 ± 0.28 | 34.48 ± 1.11 | 11.98 ± 0.14 | 43.83 ± 1.04 | 11.95 ± 0.16 |
| F2 | 35.6 ± 1.67 | 9.03 ± 0.22 | 35.08 ± 1.06 | 9.04 ± 0.13 | 33.6 ± 0.39 | 8.69 ± 0.07 |
| F3 | 36.4 ± 1.97 | 6.94 ± 0.16 | 32.75 ± 0.24 | 6.35 ± 0.13 | 34.65 ± 0.89 | 6.60 ± 0.19 |
| G | 30.5 ± 0.40 | 0.35 ± 0.04 | 32.8 ± 0.18 | 0.35 ± 0.11 | 32.7 ± 0.16 | 0.31 ± 0.01 |
| I | 34.6 ± 0.50 | 4.23 ± 0.20 | 44.47 ± 0.18 | 4.73 ± 0.16 | 39.6 ± 0.08 | 4.09 ± 0.10 |
| H1 | 24.1 ± 0.02 | 0.66 ± 0.01 | 31.8 ± 0.02 | 0.69 ± 0.01 | 30.6 ± 0.02 | 0.73 ± 0.03 |
| H2 | 22.3 ± 0.01 | 0.15 ± 0.02 | 29.7 ± 0.01 | 0.31 ± 0.02 | 29.2 ± 0.02 | 0.22 ± 0.01 |
| J | 27.3 ± 0.07 | / | 32.5 ± 0.04 | / | 23.4 ± 0.06 | / |
| Date | Cooking Fume Concentration (mg/m3) | Purification Efficiency (%) | |
|---|---|---|---|
| Point F1 | Point I | ||
| 30 April | 14.99 ± 0.49 | 2.59 ± 0.27 | 82.72 |
| 30 August | 12.24 ± 0.52 | 1.81 ± 0.29 | 85.21 |
| 11 September | 12.22 ± 0.55 | 1.74 ± 0.19 | 85.76 |
| Fire Status | Small Fire | Medium Fire | Big Fire |
|---|---|---|---|
| Surface temperature | 100 °C | 210 °C | 365 °C |
| Number of Stoves Burning | Usage State of Stoves | Simultaneity Factor (φ) | Percentage (%) | ||||
|---|---|---|---|---|---|---|---|
| S1 | S2 | S3 | S4 | S5 | |||
| One | Frying | Off | Off | Off | Off | 0.2 | 16.9 |
| Three | Frying | Frying | Frying | Off | Off | 0.6 | 46.1 |
| Four | Frying | Frying | Frying | Stewing | Off | 0.8 | 33.8 |
| Five | Frying | Frying | Frying | Stewing | Stewing | 1 | 3.2 |
| Case | NRAP–1 (Spring) | NRAP–2 (Summer) | NRAP–3 (Autumn) | NRAP–4 (Winter) | |
|---|---|---|---|---|---|
| 1 | T1 (°C) | 24.4 | 30.3 | 25.8 | 17.9 |
| V1 (m/s) | 0.47 | 0.41 | 0.40 | 0.41 | |
| 2 | T2 (°C) | 22.3 | 29.3 | 24.3 | 12.9 |
| V2 (m/s) | 0.46 | 0.40 | 0.39 | 0.51 | |
Publisher’s Note: MDPI stays neutral with regard to jurisdictional claims in published maps and institutional affiliations. |
© 2022 by the authors. Licensee MDPI, Basel, Switzerland. This article is an open access article distributed under the terms and conditions of the Creative Commons Attribution (CC BY) license (https://creativecommons.org/licenses/by/4.0/).
Share and Cite
Zhang, A.; Deng, N.; Long, Z.; Hao, R.; Shen, C.; Cao, G. Simulation Study of the Capture and Purification Performance of Exhaust Fume Systems in Chinese Commercial Kitchens—Case Study in Tianjin. Appl. Sci. 2022, 12, 8896. https://doi.org/10.3390/app12178896
Zhang A, Deng N, Long Z, Hao R, Shen C, Cao G. Simulation Study of the Capture and Purification Performance of Exhaust Fume Systems in Chinese Commercial Kitchens—Case Study in Tianjin. Applied Sciences. 2022; 12(17):8896. https://doi.org/10.3390/app12178896
Chicago/Turabian StyleZhang, Awen, Na Deng, Zhengwei Long, Ruisen Hao, Changyu Shen, and Guoqing Cao. 2022. "Simulation Study of the Capture and Purification Performance of Exhaust Fume Systems in Chinese Commercial Kitchens—Case Study in Tianjin" Applied Sciences 12, no. 17: 8896. https://doi.org/10.3390/app12178896
APA StyleZhang, A., Deng, N., Long, Z., Hao, R., Shen, C., & Cao, G. (2022). Simulation Study of the Capture and Purification Performance of Exhaust Fume Systems in Chinese Commercial Kitchens—Case Study in Tianjin. Applied Sciences, 12(17), 8896. https://doi.org/10.3390/app12178896