Article

Analysis of Water Quality Improvement Effect of Controlled River by Multi-Functional Weir Operation

1
Department of Environmental Engineering, Inje University, Gimhae-si 50834, Korea
2
Nakdong River Support Team, Presidential Water Commission, Changwon-si 51439, Korea
3
Nakdong River Environment Research Center, National Institute of Environmental Research (NIER), Incheon 40103, Korea
4
Department of Faculty of Civil Engineering, Seoul National University of Science and Technology, Seoul 01811, Korea
5
Department of Civil & Environmental Engineering, Myongji University, Yongin-si 17058, Korea
*
Author to whom correspondence should be addressed.
Appl. Sci. 2022, 12(17), 8883; https://doi.org/10.3390/app12178883
Submission received: 10 February 2022 / Revised: 22 August 2022 / Accepted: 22 August 2022 / Published: 4 September 2022
(This article belongs to the Topic Sustainable Environmental Technologies)

Abstract

:
In this study, the water quality change in a stagnant controlled river containing hard management structures due to pulsed flow was simulated. The Environmental Fluid Dynamics Code (EFDC) model was used for the water quality change simulation, and the water quality improvement effect caused by pulsed flow was simulated for multiple scenarios. Based on Case 1, in which 274.2–291.8 CMS was discharged for five hours, other scenarios, in which the gate was opened by 0.5 m and 1.0 m while the discharge time was doubled, were simulated. On comparing the water level results with the observed data, a relatively positive result of R2 = 0.82 was obtained. The water quality simulation results showed that the concentrations of Chl-a, COD, and T-P were, respectively, approximately 7.7%, 4.5%, and 4.0% higher in Case 2 than in Case 1, 24 h after the start of discharge. Cases 3 and 4, on the other hand, exhibited decreased concentrations of Chl-a, COD, and T-P 24 h after the start of discharge. These results confirm that pulsed flow leads to different water quality improvement effects depending on the discharge amount and duration. Furthermore, the water quality improvement effect was recorded at close to 0% after 72 h in all scenarios. As the water quality improvement effect due to pulsed flow appears within 24 h and almost disappears after 72 h depending on the scenario, a physical solution to this problem is required.

1. Introduction

The concept of pulsed flow was established by the Australian Government’s National Water Commission (NWC). It was reported that the water quality as well as the natural ecology of the river environment can be improved by mimicking the conditions of natural flooding by adjusting the flow rate changes in existing controlled rivers through the discharge of dams and weirs [1]. In the Nakdong River, located in the south-eastern region of South Korea, eight multifunctional weirs have been constructed to prepare for droughts and floods. Each of these consists of a fixed weir and a gate for controlling the flow rate, their purpose is to adjust the flow of the Nakdong River according to precipitation. A river in which the flow rate is managed using gates, such as the multifunctional weirs of the Nakdong River, is referred to as a “controlled river”. A controlled river allows for the benefit of manipulating the flow of the river depending on its purpose. However, the sediment accumulation in the river due to the implementation of hard management and the subsequent bed slope as well as particle size change become factors that can alter the river environment [2]. Because such a change in the river environment affects the water quality of the river system, it is necessary to monitor the change in water quality due to the operation of these gates. This is especially important for the Nakdong River system as it supplies water to nearby cities and agricultural lands, in addition to some areas without any treatment, ergo it is imperative to determine gate operation plans for improvement in water quality [3]. Weir gate operation and pulsed flow are also interconnected with the algal bloom warning system, which has classified four cyanobacteria species (Microcystis, Anabaena, Oscillatoria, and Aphanizomenon) that produce toxic substances into three warning levels depending on the population of harmful cyanobacteria: attention, alert, and outbreak. The gates are used to perform a pulsed flow from the alert step through a dam-weir link operation for the purpose of improving the water quality in the main channel of the Nakdong River.
In the case of the Murray River in Australia, the average annual flow rate was reduced by half through the use of weirs constructed upstream. Due to the decrease in the flow rate, river deformation was observed, such as the drying and exposure of some of the river beds [4,5]. In France, studies on the effect of pulsed flow on canal water quality management and algae reduction in terms of water quality management have been reported [6]. In addition, in the United States, in-lake mesocosm experiments were conducted in small bays during an outbreak of harmful algae, and the effect of reducing algae by pulsed flow was demonstrated [7]. In South Korea, the water pollution phenomenon in which algal bloom occurs due to the construction of hydraulic structures is recognized as an important issue in managed river systems. To reduce water pollution by algae, a temporary water quality improvement effect induced by the discharge of a large amount of flow from an upstream reservoir using pulsed flow is often used. To analyze the flushing effect of pulsed flow, Chung et al. explored the improvement in the Daecheong Dam reservoir water quality after pulsed flow [8]. Further, Jung et al. studied water quality improvement and algal bloom due to pulsed flow in the Seungchon Weir of the Yeongsan River [9]. The puled flow, which does not take into account the algal growth characteristics and growth rate, increases the nutrient utilization rate of the algae, which can cause side effects such as increased algae generation or accumulation in downstream weirs. Therefore, for optimal weir operation, a detailed study on the puled flow effect is required. However, these studies, which applied actual gate operation cases of a multifunctional weir for their research on water quality improvement, are not sufficient. Extensive and intensive experiments are needed to evaluate the effect of improving water quality and reducing algae according to pulsed flow.
It is difficult to evaluate the effect of pulsed flow with short-term measurement results. The reason is that the water quality concentration and algae density of rivers are the results of complex interactions between physical, chemical, and biological factors such as weather, water quantity, and water quality. Therefore, it is difficult to distinguish the effect of pulsed flow alone through experiments. The most efficient method is to use a model that can derive appropriate alternatives through analysis of various scenarios [10].
The purpose of this study is to analyze the water quality improvement effect through the pulsed flow of a multi-functional weir by modeling the hydraulic flow and water quality phenomenon using a three-dimensional EFDC model. The water quality improvement effect of pulsed flow was analyzed for the section of the Nakdong River from the Gangjeong-Goryeong Weir to the Dalseong Weir, which has become a controlled river due to the construction of multi-functional weirs. Through the analysis, changes in the concentration of variables determining the water quality were expressed as an increase or decrease rates (%). In addition, the increase and decrease periods of the concentrations due to pulsed flow were ascertained in order to arrive at measures for water quality improvement. It is intended to be used as the basic data for the multi-functional weir operation plan for water quality improvement.

2. Research Background

2.1. Pulsed Flow

Pulsed flow refers to a gate operation method that temporarily discharges a large amount of water to improve downstream water quality and river habitats [11]. Pulsed flow is performed in the Nakdong River to improve water quality when an algal bloom occurs. The operation affects the water quality of the Nakdong River where the surface water is used as a water supply source for the neighboring regions. As multiple agricultural intake stations are distributed from the Gangjeong-Goryeong Weir to the Dalseong Weir of the Nakdong River, it is necessary to verify the operation methods of the weirs and the effect of pulsed flow on the improvement of water quality. Observation is required in order to improve the water quality using pulsed flow, but on-site verification is difficult when a large amount of flow is discharged at once. Therefore, in this study, the water quality improvement effect of pulsed flow was verified according to the operation methods of the weirs, through numerical experiments that used the Environmental Fluid Dynamics Code (EFDC).

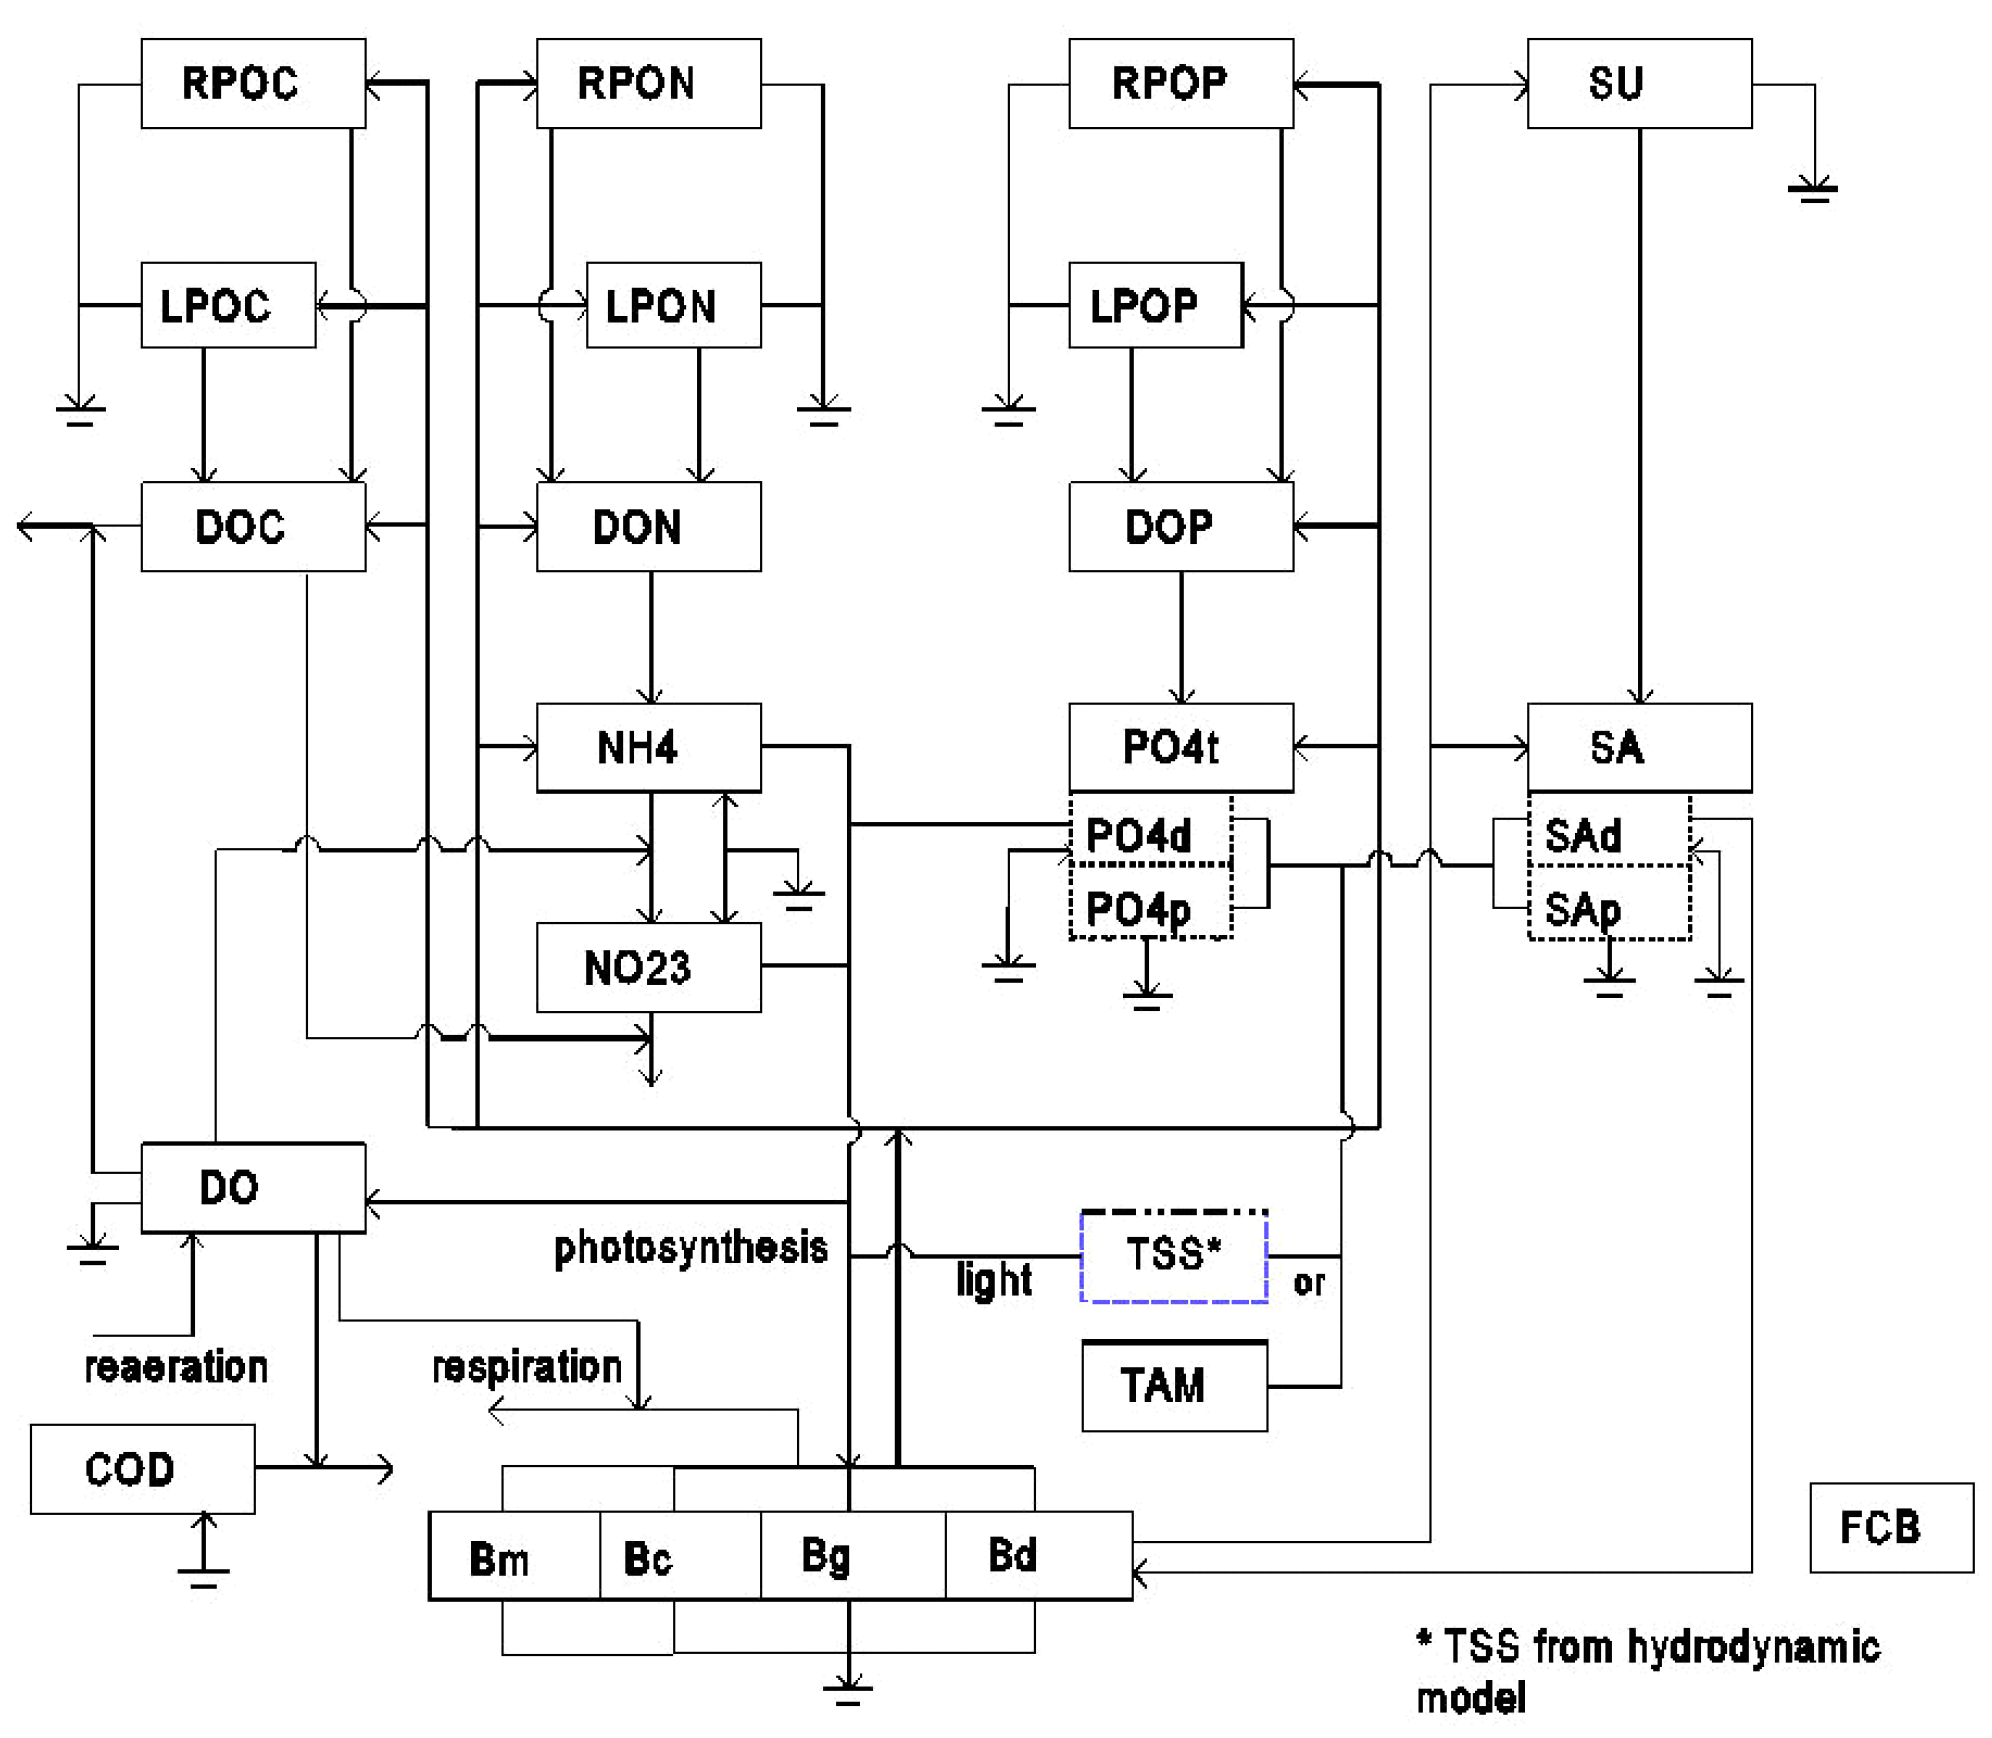
2.2. EFDC (Environmental Fluid Dynamics Code) Overview

EFDC is a software program developed by the Virginia Institute of Marine Science and is maintained and managed by the Environmental Protection Agency (EPA) of the United States of America. It consists of a hydrodynamics model, a water quality model, and a sediment transport model. It is capable of quasi-three-dimensional (3D) hydraulic and water quality analysis in various areas, such as rivers, lakes, and coastal systems. The hydrodynamic model, which is the basis of simulation using EFDC, uses the time-averaged Navier-Stokes equation as the governing equation. It uses the curvilinear-orthogonal coordinate in the horizontal direction and the sigma coordinate in the vertical direction. The momentum equations of the hydrodynamics model in the x and y directions are as follows [12]:
t m x m y H u + x m y H u u + y m x H v u + z m x m y w u f e m x m y H v = m y H x p + p a t m + ϕ + m y x z b * + z x H z p + z m x m y A v H z u + x m y m x H A H x u + y m x m y H A H y u m x m y c p D p u 2 + v 2 1 / 2 u
t m x m y H v + x m y H u v + y m x H v v + z m x m y w v + f e m x m y H u = m x H y p + p a t m + ϕ + m x y z b * + z y H z p + z m x m y A v H z v + x m y m x H A H x v + y m x m y H A H y v m x m y c p D p u 2 + v 2 1 / 2 v
where u, v, and w are flow velocities in the x, y, and z directions. mx and my are scale factors in the x and y directions. AH and AV are eddy viscosities in the horizontal and vertical directions. z s * , z b * are the physical vertical coordinates of the free surface and bed., H is the water depth,, f e is the effective Coriolis acceleration, D p is the dimensionless projected vegetation area, and c p is the drag coefficient. As the motion equation for the vertical direction, the following equation assuming hydrostatic pressure was used:
z p = g H b = g H ρ ρ o ρ o 1
where ρ and ρ o are the density and reference density, respectively, and denotes the buoyancy. In addition, the continuity equation is as follows:
t m x m y H + x m y H u + y m x H v + z m x m y w = 0
The water quality model of EFDC calculates the spatio-temporal distribution of water quality factors using the flow calculation results of the hydrodynamics model, and utilizes the following 3D advection-diffusion equation as the governing equation.
t m x m y H C + x m y H u C + y m x H v C + z m x m y w C z m x m y w s c C = x m y m x H K H x C + y m x m y H K H y C + z m x m y K v H z C + Q c
where C is the concentration, K v and K H are diffusion coefficients in the vertical and horizontal directions, w s c is the settling velocity, and Q c is the source-sink term [13,14,15]. The water quality model considered 22 water quality factors as the calculation variables to implement the complicated interrelationships between aquatic ecosystems. Among them, four types of algae—cyanobacteria, green algae, diatom algae, and stationary algae—were included [16]. For the three variables (salinity, water temperature, and total suspended solids) required for the calculation of the 22 variables, the results derived from the hydrodynamic model were used [17]. The interaction between each water quality item is shown in Figure 1. As can be seen from the figure, it is necessary to determine appropriate parameters for the simulation of complicated interrelationships between water quality factors. In this study, parameters were corrected using the observation results of the water quality observatories located in the section between the Gangjeong-Goryeong Weir and the Dalseong Weir.

3. Study Methods

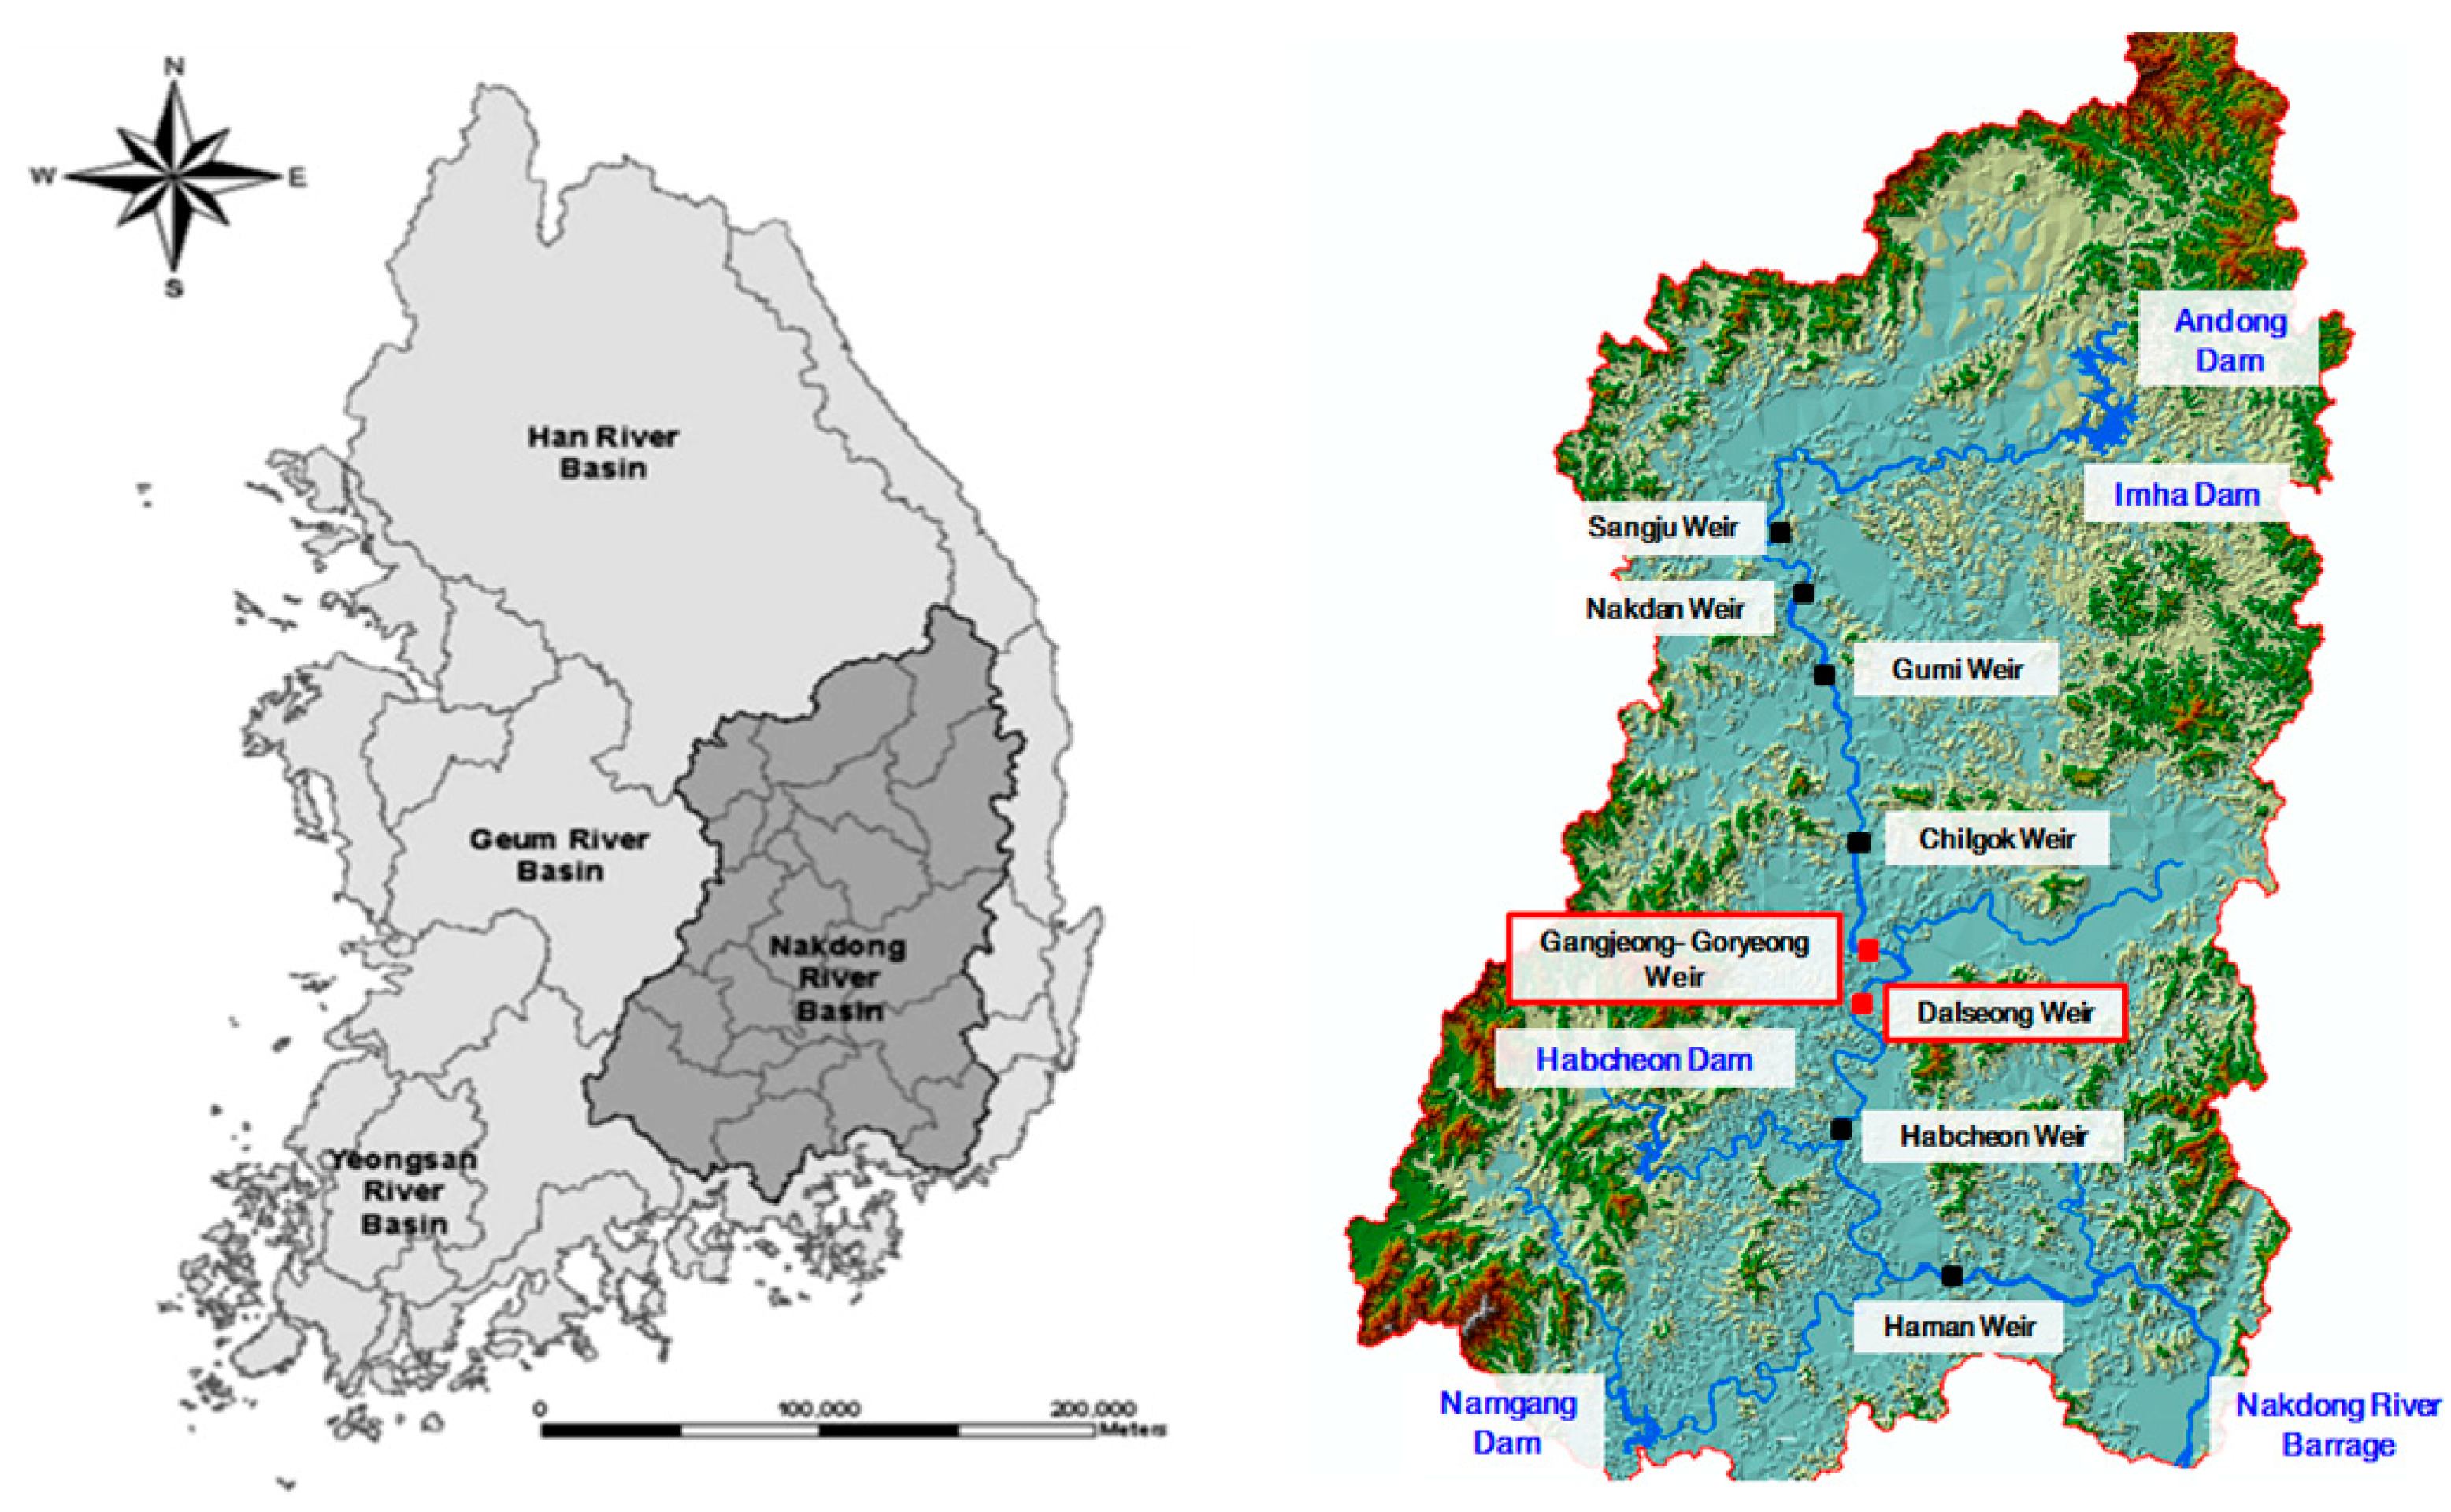
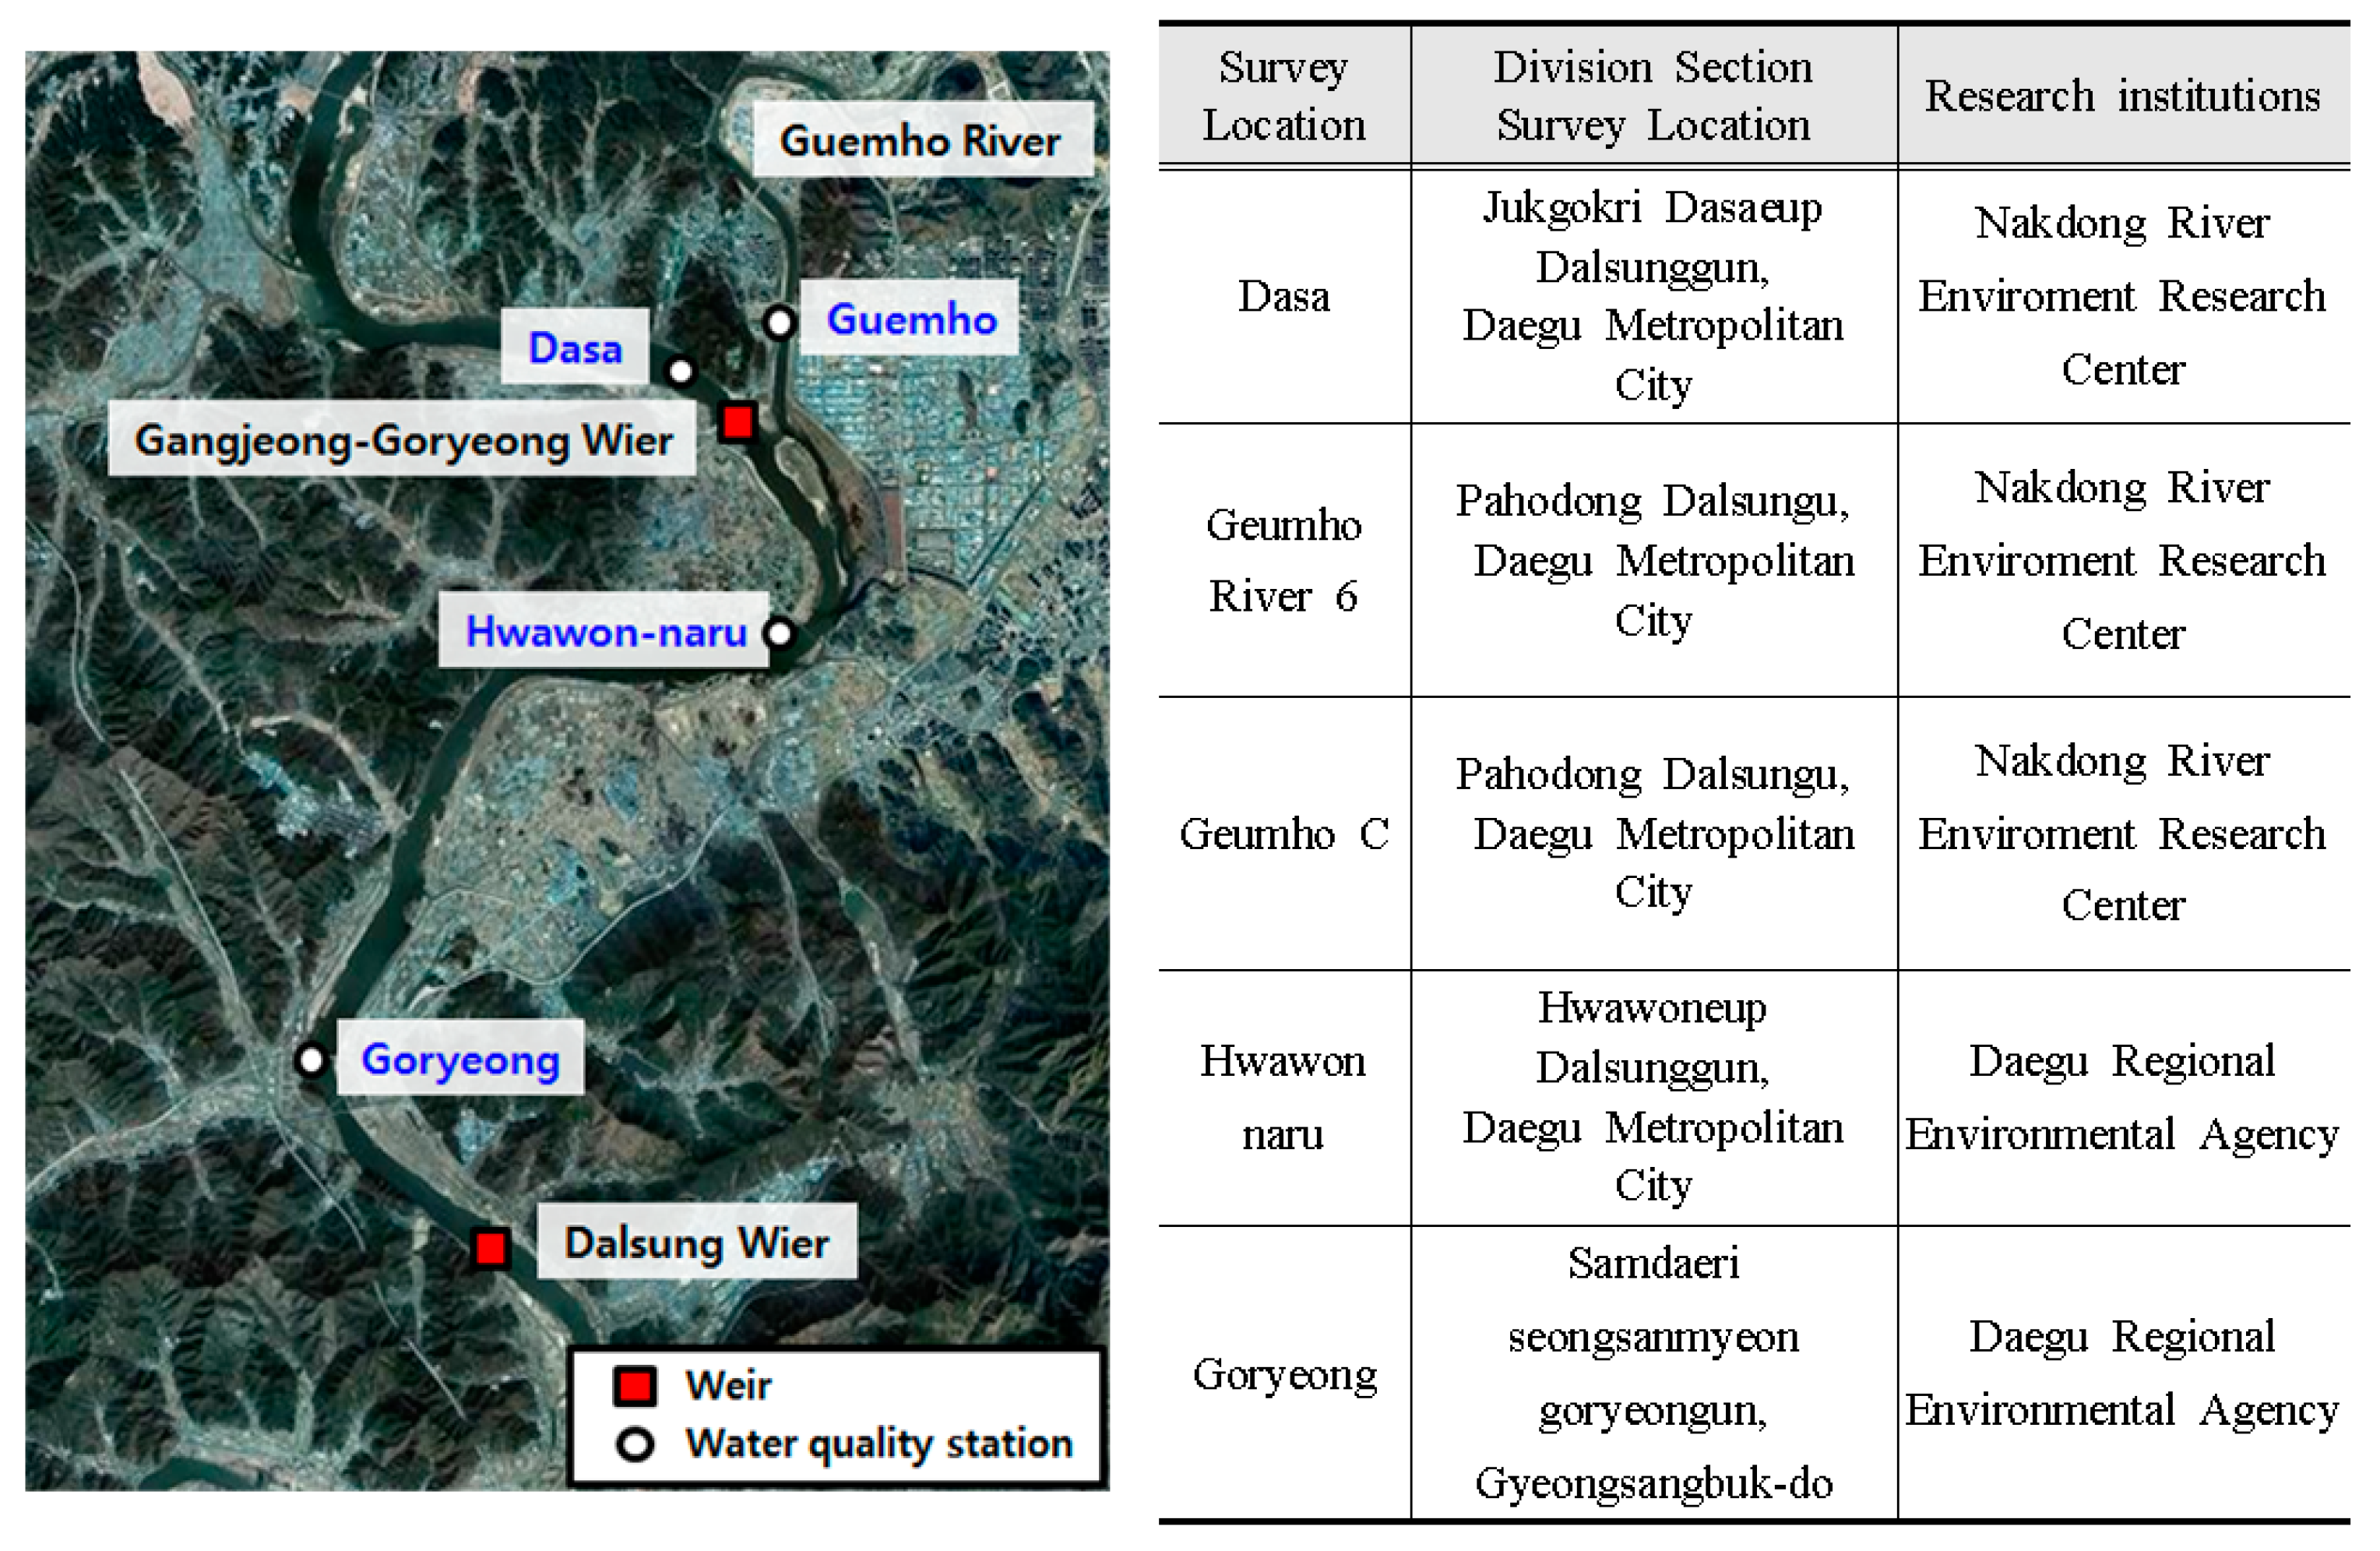
3.1. Descriptions of Study Area

The section between the Gangjeong-Goryeong Weir and the Dalseong Weir, which is the target section of this study, is located in the middle and downstream areas of the Nakdong River basin (Figure 2). The length of this section is approximately 25 km, and the Geumho River confluence point is located in the downstream area of the Gangjeong-Goryeong Weir. In addition, a river island is located at the Geumho River confluence point, and complicated topographical characteristics including bends occur from the confluence point to approximately 4 km downstream. Located in this study section are two water quality measurement networks; the National Institute of Environmental Research (NIER) provides water quality observation data for these networks every eight days. Furthermore, the hourly data on the discharge amount and water level produced by the Gangjeong-Goryeong Weir and the Dalseong Weir was used as the input data for the hydraulic and water quality simulation.

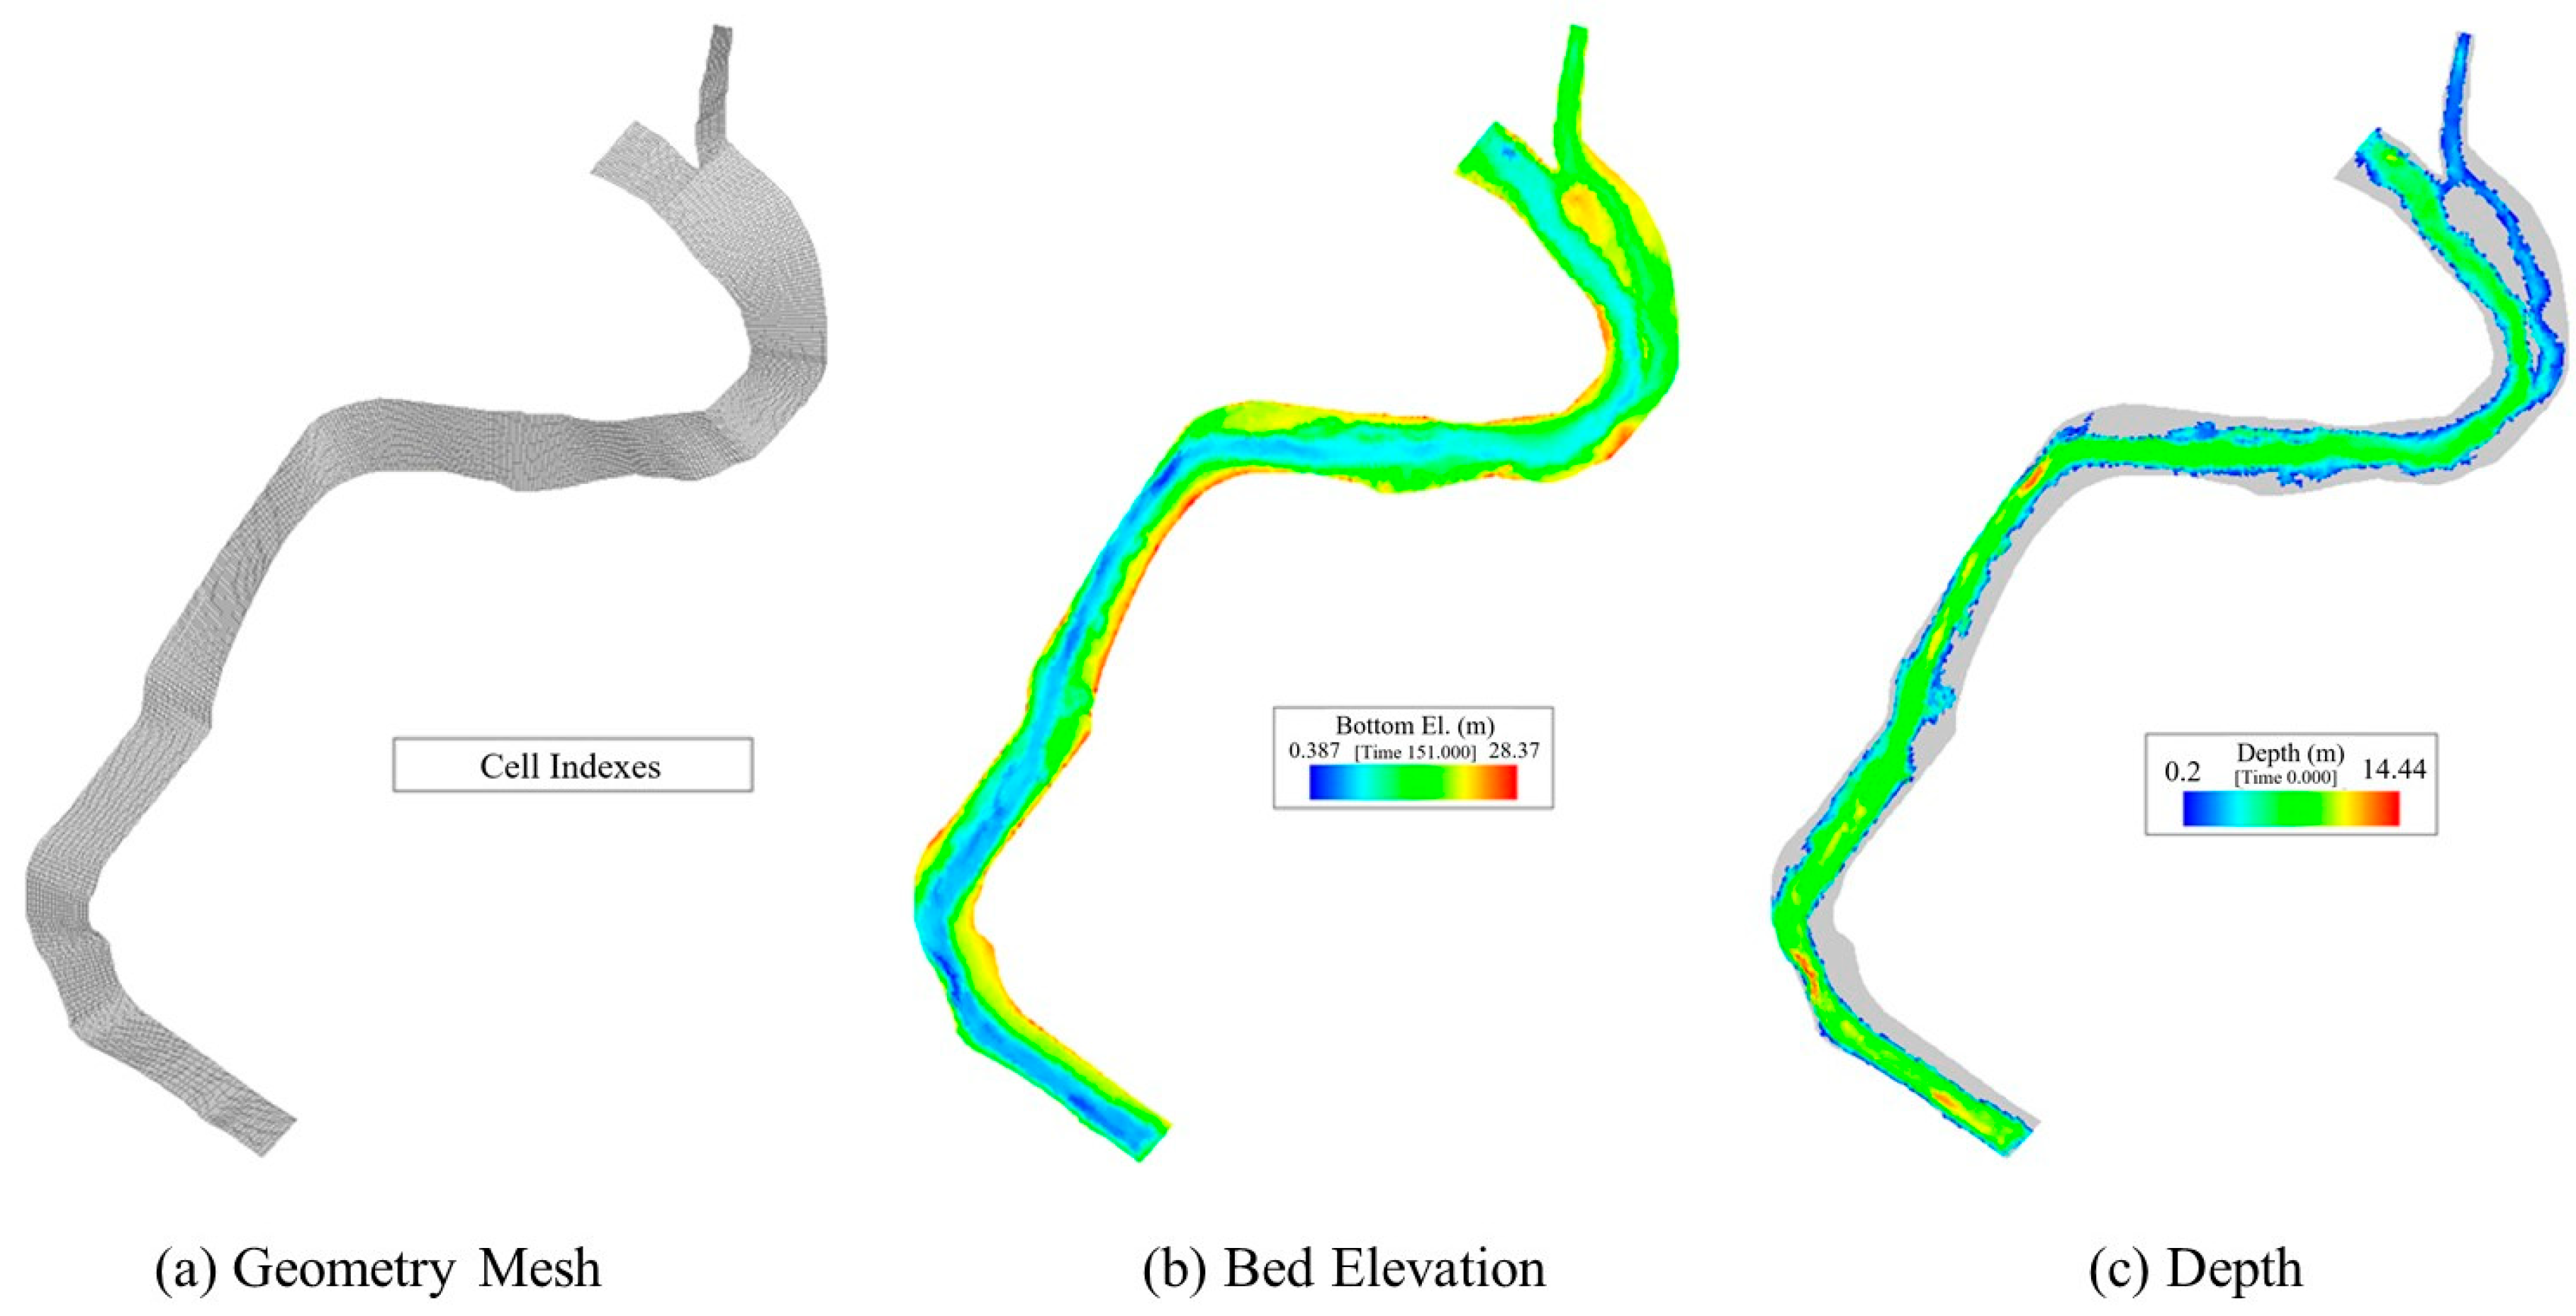
3.2. Model Input Data

The flow simulation results of the hydrodynamic model were required in the water quality simulation using the water quality model, and precise topographic data and boundary conditions for the simulation section were required as input to improve the accuracy of the flow simulation results [18]. In particular, as sudden topographic changes occur in the section between the Gangjeong-Goryeong Weir and the Dalseong Weir due to the large difference in altitude between the main waterway and the floodplain, precise topographic data capable of considering such characteristics were required [19]. Therefore, in this study, the topographical information measured precisely at the intervals of 40–50 m in the longitudinal and transverse directions in the study section of the Nakdong River was used to construct computational grids [20]. By constructing an orthogonal curvilinear grid using orthogonal curvilinear coordinates, the planar shape of the stream was expressed with a high degree of accuracy with the minimum number of grids centered on the main flow. Figure 3 shows the numerical grid generated using topographic data. The grid configuration is shown in Figure 3a, which consists of 12,000 pieces. Figure 3b show the finite difference between lattice and the bed height for each lattice and the water depth for each lattice [21].
Figure 4 shows the locations of the multifunctional weirs and water quality observatories in the study section. For flow simulation using the hydrodynamics model, the discharge amount of the Gangjeong-Goryeong Weir and the inflow rate of the Geumho River were used as the upstream boundary conditions, and the inflow rate of the Dalseong Weir was used as the downstream boundary condition. The discharge amount data provided by WAMIS [22] were used for the discharge amount of the Gangjeong-Goryeong Weir, and the daily flow rate data provided by Geumho C were used for the flow rate of the Geumho River. For water quality input data of the Nakdong River, the data measured by the Dasa water quality observatory, located in the upstream area of the Gangjeong-Goryeong Weir, from 1 January to 1 December 2014 were used. For the Geumho River, the simulation was performed using the water quality data measured at Geumho River 6 during the same period.

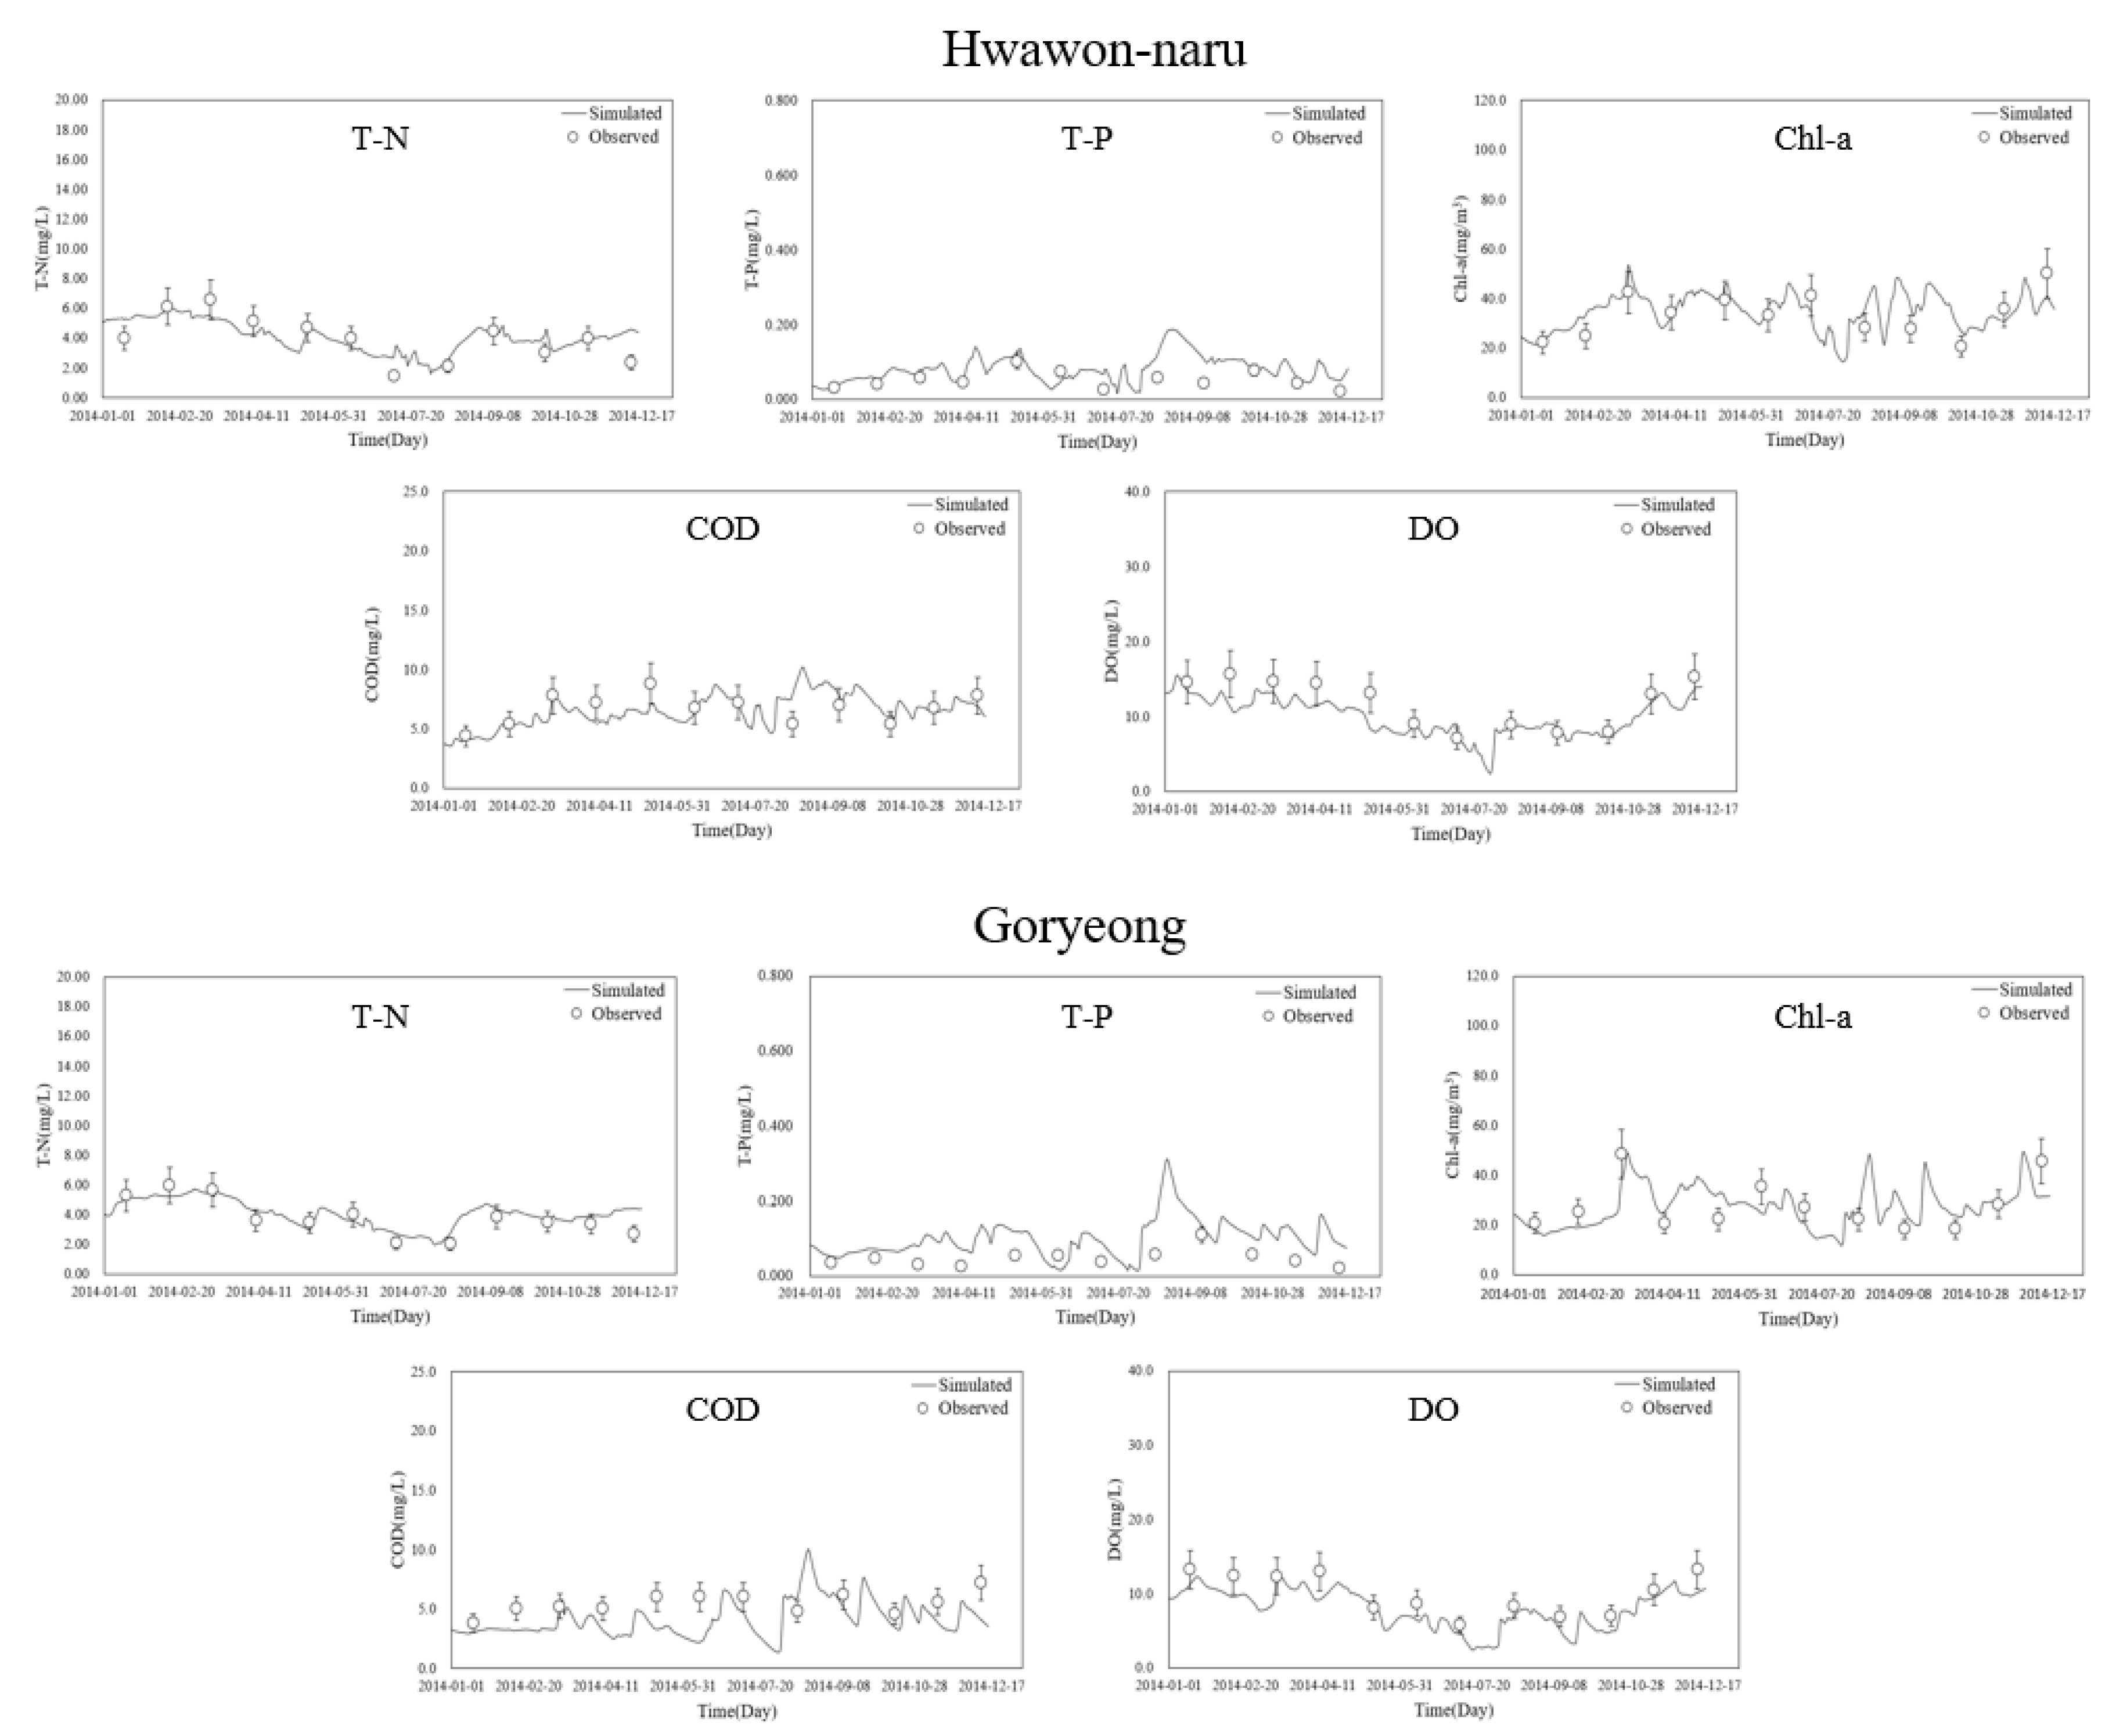
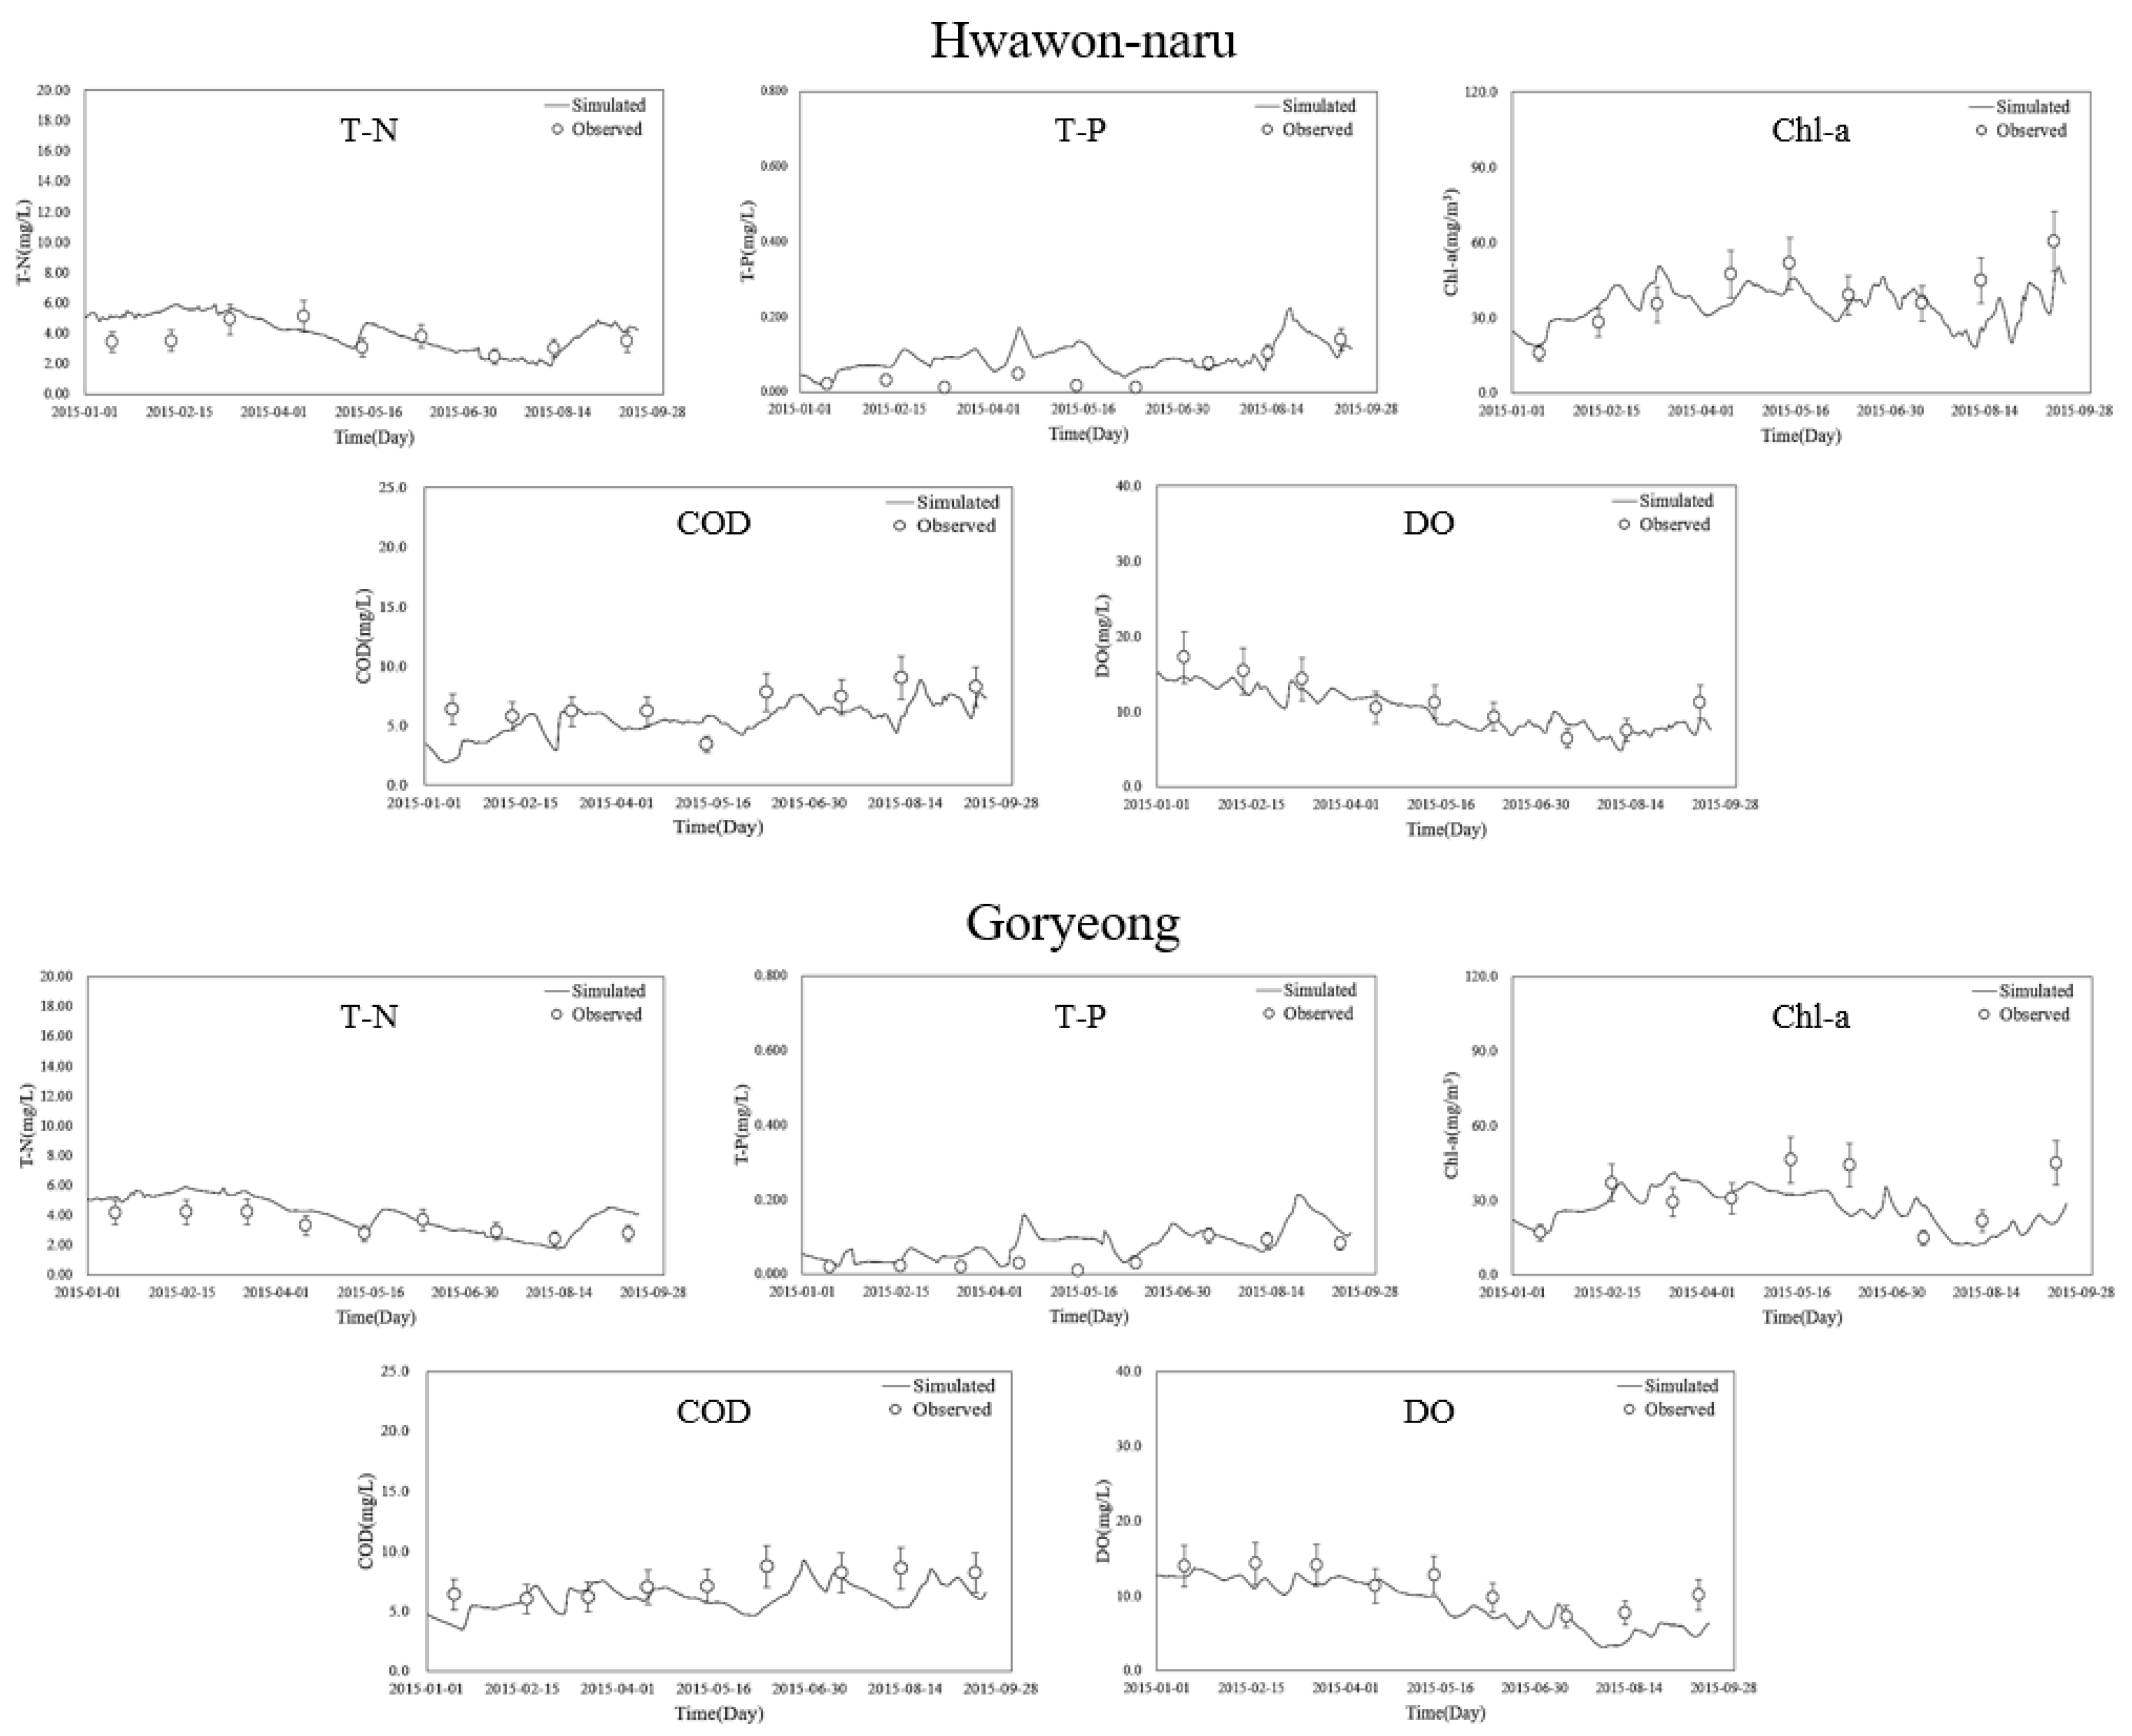
3.3. Calibration & Validation of EFDC Model

To correct the errors in the parameters of the hydrodynamic model, the water level data measured from the upstream area of the Dalseong Weir from 1 January to 1 December 2014 were compared with the numerical simulation results. The parameters of the hydrodynamic model were corrected through a trial-and-error method. After correcting the parameters, the results were compared with the observation results and an R2 of 0.82 was obtained. Flow simulation was performed using the corrected parameters, and the results were compared with the water level data measured from 1 January to 1 September 2015. Here too, an R2 of 0.82 was obtained and it was possible to appropriately reproduce the flow of the simulated section using the corrected parameters.
For the water quality model for simulation, appropriate parameter values were selected through a comparison of the measurement results presented by NIER [23]. For parameter correction of the water quality model, the water quality data measured at the Hwawon-naru and Goryeong water quality observatories from 1 January to 1 December 2014 were used. Figure 5 is a graph that compares the results of the water quality simulation with the corrected parameters and the measurement results of the Hwawon-naru and Goryeong water quality observatories. The five water quality factors (Chl-a, DO, COD, T-N, and T-P) measured at the Hwawon-naru and Goryeong water quality observatories showed errors of less than 20% and the daily change in each of these water quality factors could be reproduced effectively.
To verify whether the corrected parameters of the water quality model could be applied to other periods, the water quality data were measured at the Hwawon-naru and Goryeong water quality observatories from 1 January to 1 September in 2015 were compared with the simulation results. Figure 6 is a graph that compares the time series data of each water quality factor with the numerical simulation results. The numerical simulation results reflected the daily change in each water quality factor, and the average error from the observation results was within approximately 20%. This indicates that the corrected parameters for the simulation section can be applied to other periods.

4. Results

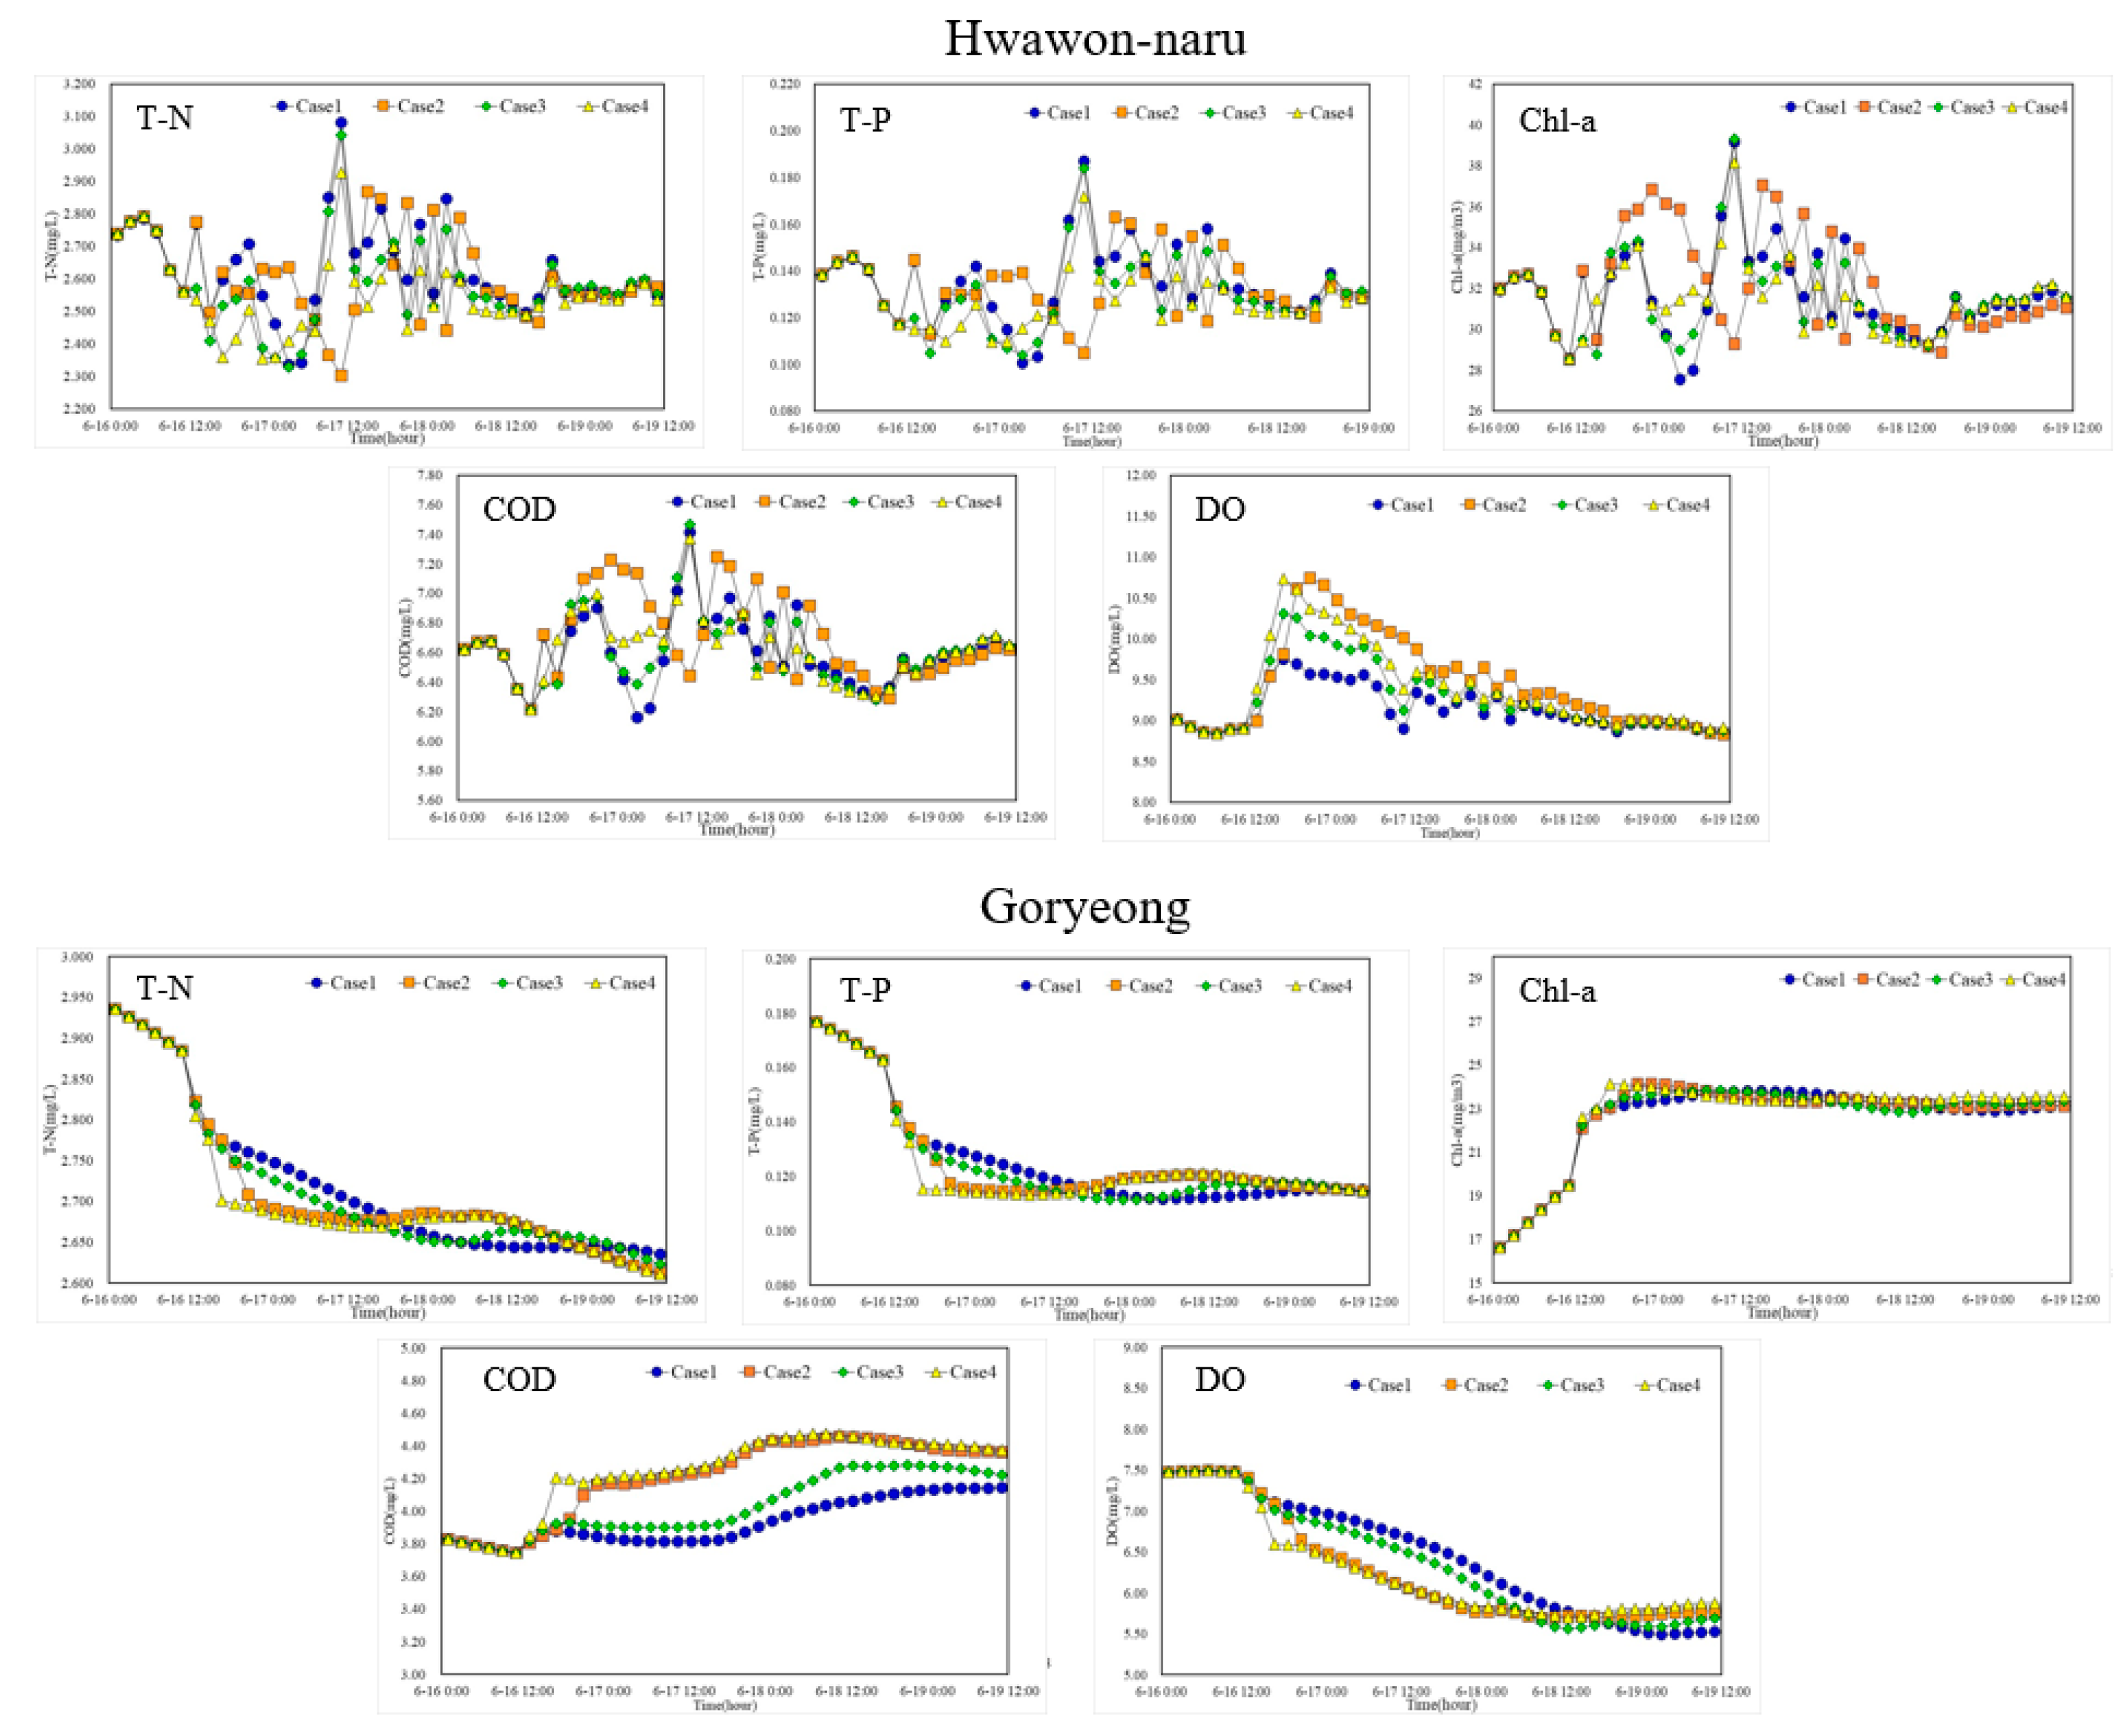
4.1. Results of Scenario by Multi-Functional Weir Operation

Numerical simulation was performed to analyze the water quality improvement effect of pulsed flow in the section between the Gangjeong-Goryeong Weir and the Dalseong Weir. Four scenarios were considered based on the gate operation method (Table 1). First, in Case 1, the actual pulsed flow at the Gangjeong-Goryeong Weir on 16 June 2015, was reproduced through numerical simulation. In Case 1, the basic discharge amount of the Gangjeong-Goryeong Weir was 274.2 m3/s, and a pulsed flow operation was performed to temporarily discharge up to 291.8 m3/s for five hours from 11:00 to 16:00. In Case 2, the pulsed flow duration was doubled to 10 h, and a maximum of 291.8 m3/s was discharged, similar to Case 1. To compare the water quality improvement effects based on the linked operations of the weirs located in the upstream and downstream areas, changes in the water quality according to the flow rate and flow velocity were compared in Cases 3 and 4 by opening the Dalseong Weir gate by 0.5 m and 1.0 m respectively, and the same pulsed flow conditions as in Case 1 were applied.
Figure 7 is a graph that compares water quality changes according to the weir operation scenarios in Table 1 at the Hwawon-naru water quality observatory. Each water quality concentration exhibited different variations depending on the pulsed flow scenario. In Case 1, the DO concentration increased and Chl-a, COD, T-N, and T-P showed a tendency to decrease after 11:00 when the pulsed flow was initiated. Water quality fluctuation was observed at the Hwawon-naru point in the downstream area of the Gangjeong-Goryeong Weir from the moment the pulsed flow operation began at 11:00 on 16 June 2015; flow rate and flow velocity also increased. The DO concentration increased and the concentrations of Chl-a, COD, T-N, and T-P decreased as the discharge time increased, indicating the water quality improvement effect of pulsed flow. However, the water quality fluctuation at the Goryeong point, located in the 15-km downstream area from Hwawon-naru, was smaller than that at Hwawon-naru; also, the water quality fluctuation exhibited inconsistent tendencies. Therefore, it can be concluded that the water quality improvement effect of pulsed flow at the Gangjeong-Goryeong Weir was concentrated in the upstream area and it decreased in the direction of the downtown area.

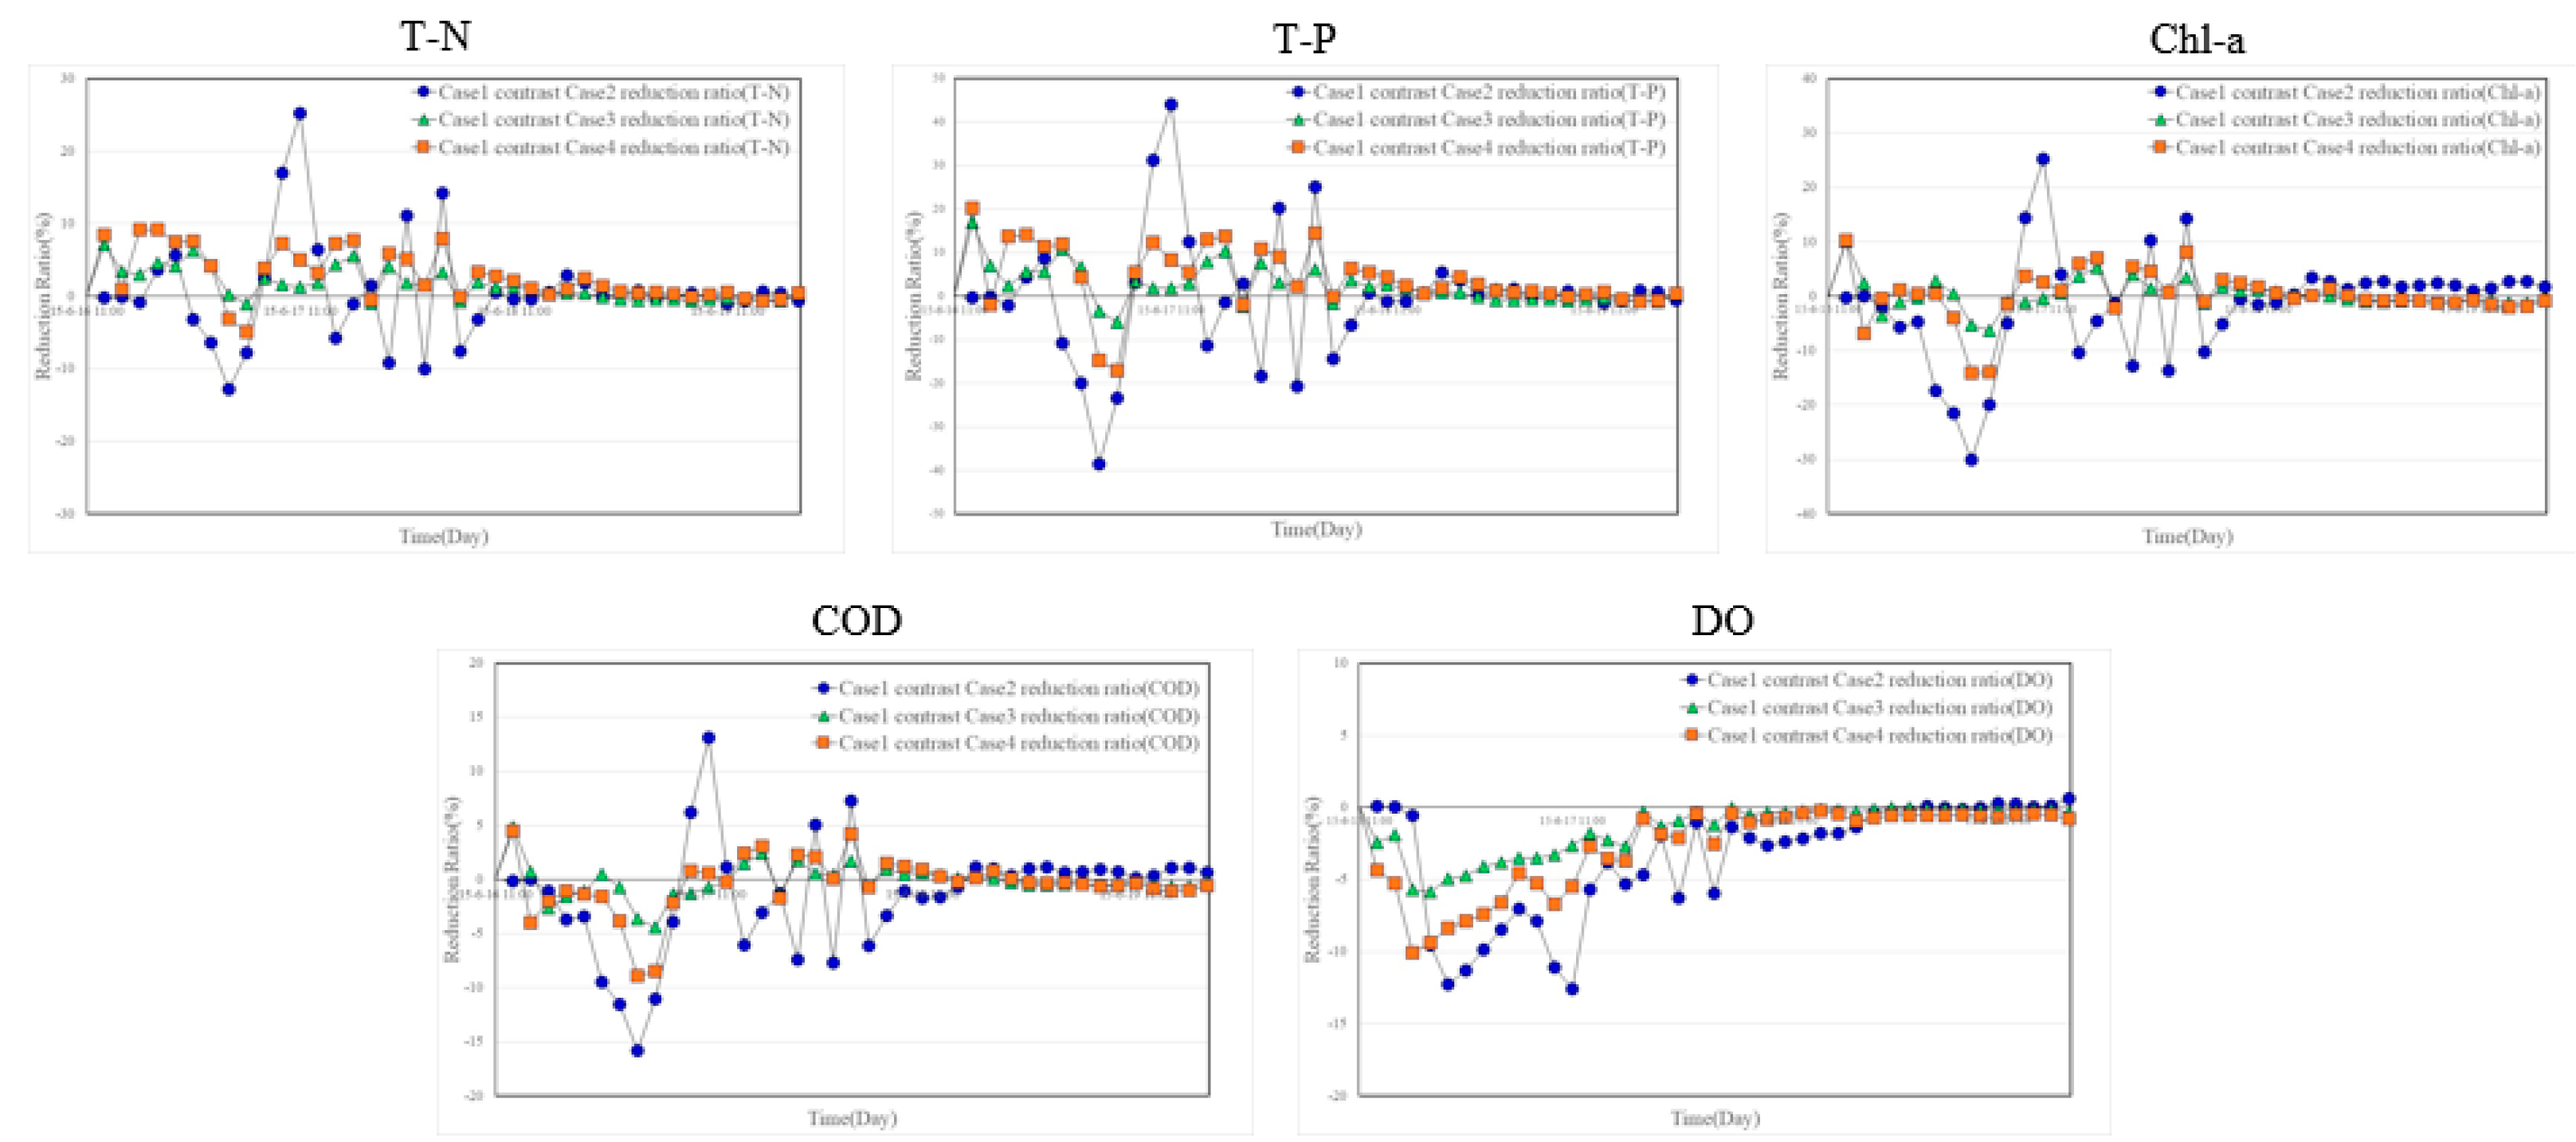
4.2. Analysis of Water Quality Improvement effect

To analyze the water quality improvement effect, the water quality changes in Cases 2, 3, and 4 were compared with each other based on the scenario in Case 1, in which the actual pulsed flow was performed. Figure 8 is a graph showing the time variation of the water quality decrease rate in each scenario compared to Case 1, and Table 2 summarizes the change in the decrease rate over time. In Case 2, Chl-a, COD, and T-P were, respectively, 7.68%, 4.48%, and 3.99% higher compared to Case 1 for 24 h after the start of discharge, and the water quality concentrations were found to be higher due to the change in the fluid flow caused by the pulsed flow. For the following 48 h, the decrease rates of the water quality variables, except for DO, increased, and DO gradually increased, thereby exhibiting the water quality improvement effect. After 72 h, however, the decrease rate was close to 0% and the effect of pulsed flow showed a tendency to decrease. The initial increase in organic matter is considered to be the cause of the re-floating of organic matter in the sediment deposited on the river bed according to the pulsed flow. Therefore, it is considered that the effect of sediment organic matter re-floating should be carefully considered when performing pulsed flow. Therefore, when the pulsed flow time was extended, the initial water quality concentrations temporarily increased due to the upstream influence, but the water quality concentrations slowly improved over time due to the flushing effect. However, only a temporary water quality improvement effect was observed, and it seemed that effective countermeasures were necessary to obtain a continuous water quality improvement effect.
For Cases 3 and 4, the flow velocity was found to be higher than that in Case 1 due to the opening of the gate. Therefore, the upstream water was temporarily introduced immediately after discharge, and thus the Chl-a, COD concentrations increased for 24 h after the start of pulsed flow similar to Case 2. The water quality concentrations of Case 4, in which there was a wider gap in the gate, were found to be higher than those of Case 3. T-N and T-P showed an immediate response to pulsed flow, and showed a tendency to improve compared to other water quality items due to the dilution effect as the flow rate increased. After 48 h, the flow was gradually stabilized, DO increased, and the decreased rates of Chl-a, COD, T-N, and T-P slowly increased, resulting in the improvement of water quality observed through the decrease in water quality concentrations. In addition, Case 4 exhibited a higher water quality improvement effect than Case 3. After 72 h, the decrease rate was close to 0% and the effect of pulsed flow disappeared as is seen in Case 2. These results indicate that the flushing effect is improved through the increase in the flow velocity caused by the opening of the downstream gate, and that the water quality improvement effect increased as the opening of the gate widened.

5. Discussion

In this study, the water quality improvement effect of pulsed flow was analyzed for the section between the Gangjeong-Goryeong Weir and the Dalseong Weir of the Nakdong River, which became a controlled river due to the construction of multifunctional weirs. To determine an efficient pulsed flow method, the water quality improvement effects according to the upstream and downstream gate operation systems were compared via numerical simulation using the EFDC. To perform numerical simulation using EFDC, the parameters of the hydrodynamic model and water quality model were corrected through a comparison of the simulation results with the water quality observation results. The hydrodynamic model exhibited an R2 value of 0.84, indicating that the model could effectively reproduce the flow of the target section. In addition, after correcting the parameters of the water quality model, the average error range of each water quality factor was found to be within 20% and the model accurately represented the water quality change of the target section. Various scenarios were analyzed using a physics-based water quality model. Finally, an effective multi-functional weir operation plan was attempted to improve water quality.
To analyze the water quality improvement effect of pulsed flow, a numerical simulation was performed for a total of four pulsed flow scenarios, including an actual pulsed flow case and three gate operation scenarios. Water quality improvement was observed mostly in the upstream section, and the water quality concentrations hardly changed at the 15-km downstream point. Furthermore, the water quality improvement gradually decreased with time. When the discharge time was doubled, the water quality concentrations became lower for 24–48 h. In addition, when the gates of the upstream and downstream weirs were opened instead of maintaining the discharge time, the water quality improvement effect was higher than when the discharge time was extended. In general, the pulsed flow is used as a method for controlling the algal bloom. Flow management strategies such as pulsed flows, weir drawdown, and artificial de-stratification have been proposed as means of controlling cyanobacterial blooms in regulated rivers [24]. The algal management strategy for the Murray–Darling Basin aims to reduce the frequency and intensity of algal blooms and other water quality problems associated with nutrient pollution in the basin through a framework of coordinated planning and management actions [25]. The success of pulsed flows to disperse established algal blooms has been demonstrated in the Murray Darling Basin [26,27,28,29]. The provision of pulsed flows above production targets has become part of the operating protocols for many systems including the Murray River. While the successes of pulsed flows to disperse algal blooms are numerous, there are documented cases of negative impacts. For example, the dispersal of an established bloom with pulsed flows can also create impacts in downstream reaches. In highly regulated systems such as the Menindee Lakes, blooms dispersed from upstream can simply reestablish in regulated reaches or impoundments further downstream where conducive flow conditions return [30]. The mitigation of algal bloom by pulsed flow in the Yeongsan River in Korea can be seen as an attempt to improve the efficiency with the minimum flow rate in the seasonal situation of the dry season when the flow rate is insufficient. However, it was a tool for solving problems in some sections, not macroscopically considering the condition of the downstream river. It contained limitations in controlling high concentrations of algal biomass [11]. When algal blooms occur frequently or for a long period of time, the economic loss caused by the suspension of small hydro power generation and the downstream impact of the transfer of algal blooms must be considered at the same time [1]. This indicates that managing the gate operation, for increasing the flow velocity, of the target area is essential to ensure improvement in the water quality and that a physical method for preventing stratification is also required.

6. Conclusions

In this study, water quality change according to puled flow was analyzed using a physics-based model. Recently, uncertainty about water quality variables is increasing due to changes in the river environment and the effects of climate change. Therefore, field monitoring should be performed concurrently for precise predictive modeling. In addition, it is considered that the accumulation of monitoring data for the improvement of cyanobacteria in summer should proceed. By presenting a method to identify and predict changes in river flow and water quality according to weir operation scenarios, it is expected to be utilized as decision-making data for weir operation. Therefore, it is possible to continuously supplement and improve the quality of the results according to the actual weir operation scenario in the future. It is judged that the effect of improving water quality through efficient weir operation can be maximized in connection with the on-site monitoring results.

Author Contributions

Conceptualization, J.-K.H.; Data curation, W.-S.J.; Formal analysis, J.-K.H. and I.-H.P.; Investigation, J.-M.K.; Methodology, J.-K.H., W.-S.J., J.-M.K., I.-H.P. and Y.-D.K.; Project administration, Y.-D.K.; Writing—original draft, J.-K.H.; Writing—review & editing, Y.-D.K. All authors have read and agreed to the published version of the manuscript.

Funding

This work is supported by the Korea Agency for Infrastructure Technology Advancement (KAIA) grant funded by the Ministry of Land, Infrastructure and Transport (Grant 1615012318).

Institutional Review Board Statement

Not applicable.

Informed Consent Statement

Not applicable.

Data Availability Statement

Not applicable.

Conflicts of Interest

The authors declare no conflict of interest.

References

  1. Watts, R.J.; Allan, C.; Bowmer, K.H.; Page, K.J.; Ryder, D.S.; Wilson, A.L. Pulsed Flows: A Review of Environmental Costs and Benefits and Best Practice; Waterlines Report; National Water Commission: Canberra, Australia, 2009; p. 16. [Google Scholar]
  2. Brandt, S.A. Classification of geomorphological effects downstream of dams. Catena. 2000, 40, 375–401. [Google Scholar] [CrossRef]
  3. Research on Implementing the Harmful Algal Bloom Alert System for Weir in the Nakdong River watershed, NIER RP2013-249. Available online: https://dl.nanet.go.kr/ (accessed on 1 January 2014).
  4. Thoms, M.C.; Walker, K.F. Channel changes associated with two adjacent weirs on a regulated lowland alluvial river. River Res. Appl. 1993, 8, 271–284. [Google Scholar] [CrossRef]
  5. Baker, P.D.; Brookes, J.D.; Burch, M.D.; Maier, H.R.; Ganf, G.G. Advection, growth and nutrient status of phytoplankton populations in the lower River Murray, South Australia. River Res. Appl. 2000, 16, 327–344. [Google Scholar] [CrossRef]
  6. Mitrovic, S.M.; Chessman, B.C.; Bowling, L.C.; Cooke, R.H. Modelling suppression of cyanobacterial blooms by flow management in a Lowland River. River Res. Appl. 2006, 22, 109–114. [Google Scholar] [CrossRef]
  7. Fovet, O.; Genthon, O.; Litrico, X.; Belaud, G. Managing invasive algae with flushing flows: New perspectives for canal control. In Proceedings of the World Environmental and Water Resources Congress 2012, Albuquerque, NM, USA, 20–24 May 2010; pp. 2177–2187. [Google Scholar] [CrossRef]
  8. Chung, S.W.; Kim, Y.K. Impact of a flushing discharge from an upstream dam on the NH3-N concentrations during winter seasons in Geum River. J. Korean Soc. Water Environ. 2005, 21, 609–616. [Google Scholar]
  9. Chong, S.A.; Yi, H.S.; Hwang, H.S.; Kim, H.J. Modeling the Flushing Effect of Multi-purpose Weir Operation on Algae Removal in Yeongsan River. J. Korean Soc. Environ. Eng. 2015, 37, 563–572. [Google Scholar] [CrossRef]
  10. Park, D.Y.; Park, H.S.; Kim, S.J.; Chung, S.W. Analysis of Water Quality Variation by Lowering of Water Level in Gangjeong-Goryong Weir in Nakdong River. J. Environ. Impact Assess. 2019, 28, 245–262. [Google Scholar] [CrossRef]
  11. Shin, J.K.; Kang, B.G.; Hwang, S.J. Limnological Study on Spring-Bloom of a Green Algae, Eudorina elegans and Weirwater Pulsed-Flows in the Midstream (Seungchon Weir Pool) of the Yeongsan River, Korea. Korean J. Ecol. Environ. Korean Soc. Limnol. 2016, 49, 320–333. [Google Scholar] [CrossRef]
  12. Hamrick, J.M. A Three-Dimensional Environmental Fluid Dynamics Computer Code: Theoretical and Computational Aspects; Special Report, 317; College of William and Mary: Williamsburg, VA, USA; Virginia Institute of Marine Science: Gloucester Point, VA, USA, 1992. [Google Scholar]
  13. Hur, Y.T.; Park, J.H. Assessment of EFDC model for hydrodynamic analysis in the Nakdong River. J. Korea Water Resour. Assoc. 2009, 42, 309–317. [Google Scholar] [CrossRef]
  14. James, S.C.; Shrestha, P.L.; Roberts, J.D. Modeling noncohesive sediment transport using multiple sediment size classes. J. Coast. Res. 2006, 22, 1125–1132. [Google Scholar] [CrossRef]
  15. Lee, K.S. A Study on the Effect of Watershed Characteristics Change on Estuaries Using EFDC. Master’s Thesis, Changwon National University, Changwon, Korea, 2013. [Google Scholar]
  16. Park, K.; Kuo, A.Y.; Shen, J.; Hamrick, J.M. A Three-Dimensional Hydrodynamic-Eutrophication Model (HEM-3D): Description of Water Quality and Sediment Process Submodels, Special Report; Virginia Institute of Marine Science: Gloucester Point, VA, USA; College of William and Mary: Williamsburg, VA, USA, 1995. [Google Scholar]
  17. Moustafa, M.Z.; Hamrick, J.M. Modeling circulation and salinity transport in the Indian River Lagoon. In Estuarine and Coastal Modeling; ASCE: Reston, VA, USA, 1993; pp. 381–395. [Google Scholar]
  18. National Geographic Information Institute. Available online: https://ngii.go.kr (accessed on 1 January 2014).
  19. Ann, J.M.; Park, I.H. An Assessment on the Hydraulic Characteristics of a Multi-dimensional Model in Response to Measurement Resolution and Spatial Interpolation Methods. Korean Soc. Geospat. Inf. Syst. 2012, 20, 43–51. [Google Scholar] [CrossRef]
  20. National Institute of Environmental Research Water Information System. Available online: https://water.nier.go.kr (accessed on 1 January 2014).
  21. Seo, S.H. Analysis of Hydraulic Characteristics on Geum River Using 3 Dimensional Numerical Model-Focused on the Gongju Weir. Master’s Thesis, Kongju National University, Kongju, Korea, 2012. [Google Scholar]
  22. Water Resources Management Information System. Available online: http://www.wamis.go.kr/. (accessed on 1 January 2014).
  23. National Institute of Environmental Research. Nakdong River Water Quality Model Factor Research; National Institute of Environmental Research: Incheon, Korea, 2004. [Google Scholar]
  24. Herath, G. Freshwater algal blooms and their control: Comparison of the European and Australian experience. J. Environ. Manag. 1997, 51, 217–227. [Google Scholar] [CrossRef]
  25. Sherman, B.S.; Webster, I.T.; Jones, G.J.; Oliver, R.L. Transitions between Auhcoseira and Anabaena dominance in a turbid river weir pool. Limnol. Oceanogr. 1998, 43, 1902–1915. [Google Scholar] [CrossRef]
  26. Webster, I.T.; Sherman, B.S.; Bormans, M.; Jones, G. Management strategies for cyanobacterial blooms in an impounded lowland river. Regul. Rivers Res. Manag. Int. River Res. Manag. 2000, 16, 513–525. [Google Scholar] [CrossRef]
  27. Maier, H.R.; Kingston, G.B.; Clark, T.; Frazer, A.; Sanderson, A. Risk-based approach for assessing the effectiveness of flow management in controlling cyanobacterial blooms in rivers. River Res. Appl. 2004, 20, 459–471. [Google Scholar] [CrossRef]
  28. Mitrovic, S.M.; Oliver, R.L.; Rees, C.; Bowling, L.C.; Buckney, R.T. Critical flow velocities for the growth and dominance of Anabaena circinalis in some turbid freshwater rivers. Freshw. Biol. 2003, 48, 164–174. [Google Scholar] [CrossRef]
  29. Vink, S.; Bormans, M.; Ford, P.W.; Grigg, N.J. Quantifying ecosystem metabolism in the middle reaches of Murrumbidgee River during irrigation flow releases. Mar. Freshw. Res. 2005, 56, 227–241. [Google Scholar] [CrossRef]
  30. Grace, M.; Holland, D.; Chan, T.; Roberts, S. Lower Darling River Algal Growth Studies; Canberra, Australia, 2004. Available online: https://www.act.gov.au/ (accessed on 1 January 2014).
Figure 1. Schematic Diagram for The EFDC Water Column Water Quality Model (13).
Applsci 12 08883 g001
Figure 2. Gangjeong-Goryeong Weir and Dalseong Weir Section in Study Area.
Applsci 12 08883 g002
Figure 3. Test bed Section Geographic Construction.
Applsci 12 08883 g003
Figure 4. Survey Location of Water Quality Gangjeong-Goryeong Weir and Dalseong Weir Section.
Applsci 12 08883 g004
Figure 5. Water Quality Simulation Calibration (From January 2014 to December 2014).
Applsci 12 08883 g005
Figure 6. Water Quality Simulation Validation (From January 2015 to December 2015).
Applsci 12 08883 g006
Figure 7. Scenario Comparison Results.
Applsci 12 08883 g007
Figure 8. Case 1 Contrast Scenario Reduction Ratio.
Applsci 12 08883 g008
Table 1. Scenario Simulations of the Operating Weir.
Scenario
Case 1Real Case16 June 2015 Pulse Discharge actual operating Weir
(11:00~16:00, Discharge: 274.2 m3/s~291.8 m3/s)
Case 2Real Case
Discharge time extension
16 June 2015 Pulse Discharge actual operating Weir
+ Discharge times, twice extended
Case 3Upstream Weir Operations16 June 2015 Pulse Discharge
+ GangjeongGoryeong Weir, Dalseong Weir
0.5 m opening gate
Case 4Upstream Weir Operations16 June 2015 Pulse Discharge
+ GangjeongGoryeong Weir, Dalseong Weir
1.0 m opening gate
Table 2. Case 1 Contrast Scenario Reduction Ratio.
Case 1 Contrast Case 2 Reduction Ratio
Time(hour)CaseChl-aChl-aCaseDO (mg/L)DO (%)CaseCOD (mg/L)CODCaseT-N (mg/L)T-N (%)CaseT-P (mg/L)T-P (%)
(mg/m3)(%)(%)
After 24 h131.27.68∇19.46.49∇16.574.48∇12.570.22∇10.1263.99∇
233.421026.8522.5720.128
After 48 h1330.41∇19.24.46∇16.760.79∇12.711.86Δ10.1452.73Δ
232.929.626.822.6420.139
After 72 h130.71.52Δ18.90.88∇16.50.30Δ12.560.48Δ10.130.99Δ
230.22926.4822.5420.128
Case 1 Contrast Case 3 Reduction Ratio
Time(hour)CaseChl-aChl-aCaseDO (mg/L)DO (%)CaseCOD (mg/L)CODCaseT-N (mg/L)T-N (%)CaseT-P (mg/L)T-P (%)
(mg/m3)(%)(%)
After 24 h131.20.23∇19.43.65∇16.570.89∇12.573.01Δ10.1264.28Δ
331.239.836.6232.4930.12
After 48 h1331.53Δ19.21.21∇16.760.56Δ12.712.08Δ10.1453.67Δ
332.539.336.7232.6530.14
After 72 h130.70.32∇18.90.16∇16.50.14∇12.560.06Δ10.130.16Δ
330.83936.5132.5630.129
Case 1 Contrast Case 4 Reduction Ratio
Time(hour)CaseChl-aChl-aCaseDO (mg/L)DO (%)CaseCOD (mg/L)CODCaseT-N (mg/L)T-N (%)CaseT-P (mg/L)T-P (%)
(mg/m3)(%)(%)
After 24 h131.22.06∇19.46.32∇16.572.33∇12.574.17Δ10.1264.97Δ
431.741046.7142.540.118
After 48 h1333.10Δ19.22.13∇16.761.23Δ12.714.08Δ10.1457.21Δ
431.949.446.6742.5940.134
After 72 h130.70.17∇18.90.57∇16.50.05∇12.560.85Δ10.131.68Δ
430.84946.542.5440.127
Publisher’s Note: MDPI stays neutral with regard to jurisdictional claims in published maps and institutional affiliations.

