

A Fault Diagnosis Model for Tennessee Eastman Processes Based on Feature Selection and Probabilistic Neural Network


Abstract
:1. Introduction
- When there are nonlinear, high-dimensional TE process datasets, we use a two-stage feature selection method to eliminate duplicate features and reduce memory needs. This makes fault diagnosis more accurate and effective.
- The Lévy flight method is included in SSA, and a new algorithm, MSSA, is developed to alleviate SSA’s deficiencies, such as its slow convergence speed and propensity to slip into local optimum. The approach can iteratively randomize the leader’s position and enhance the optimal global searchability. In addition, it can provide selective updates to followers, which will accelerate convergence.
- Using MSSA to optimize the smoothing factor of PNN can improve the reliability, self-correction capability, and accuracy of PNN when dealing with data categorization problems.
2. Materials and Methods
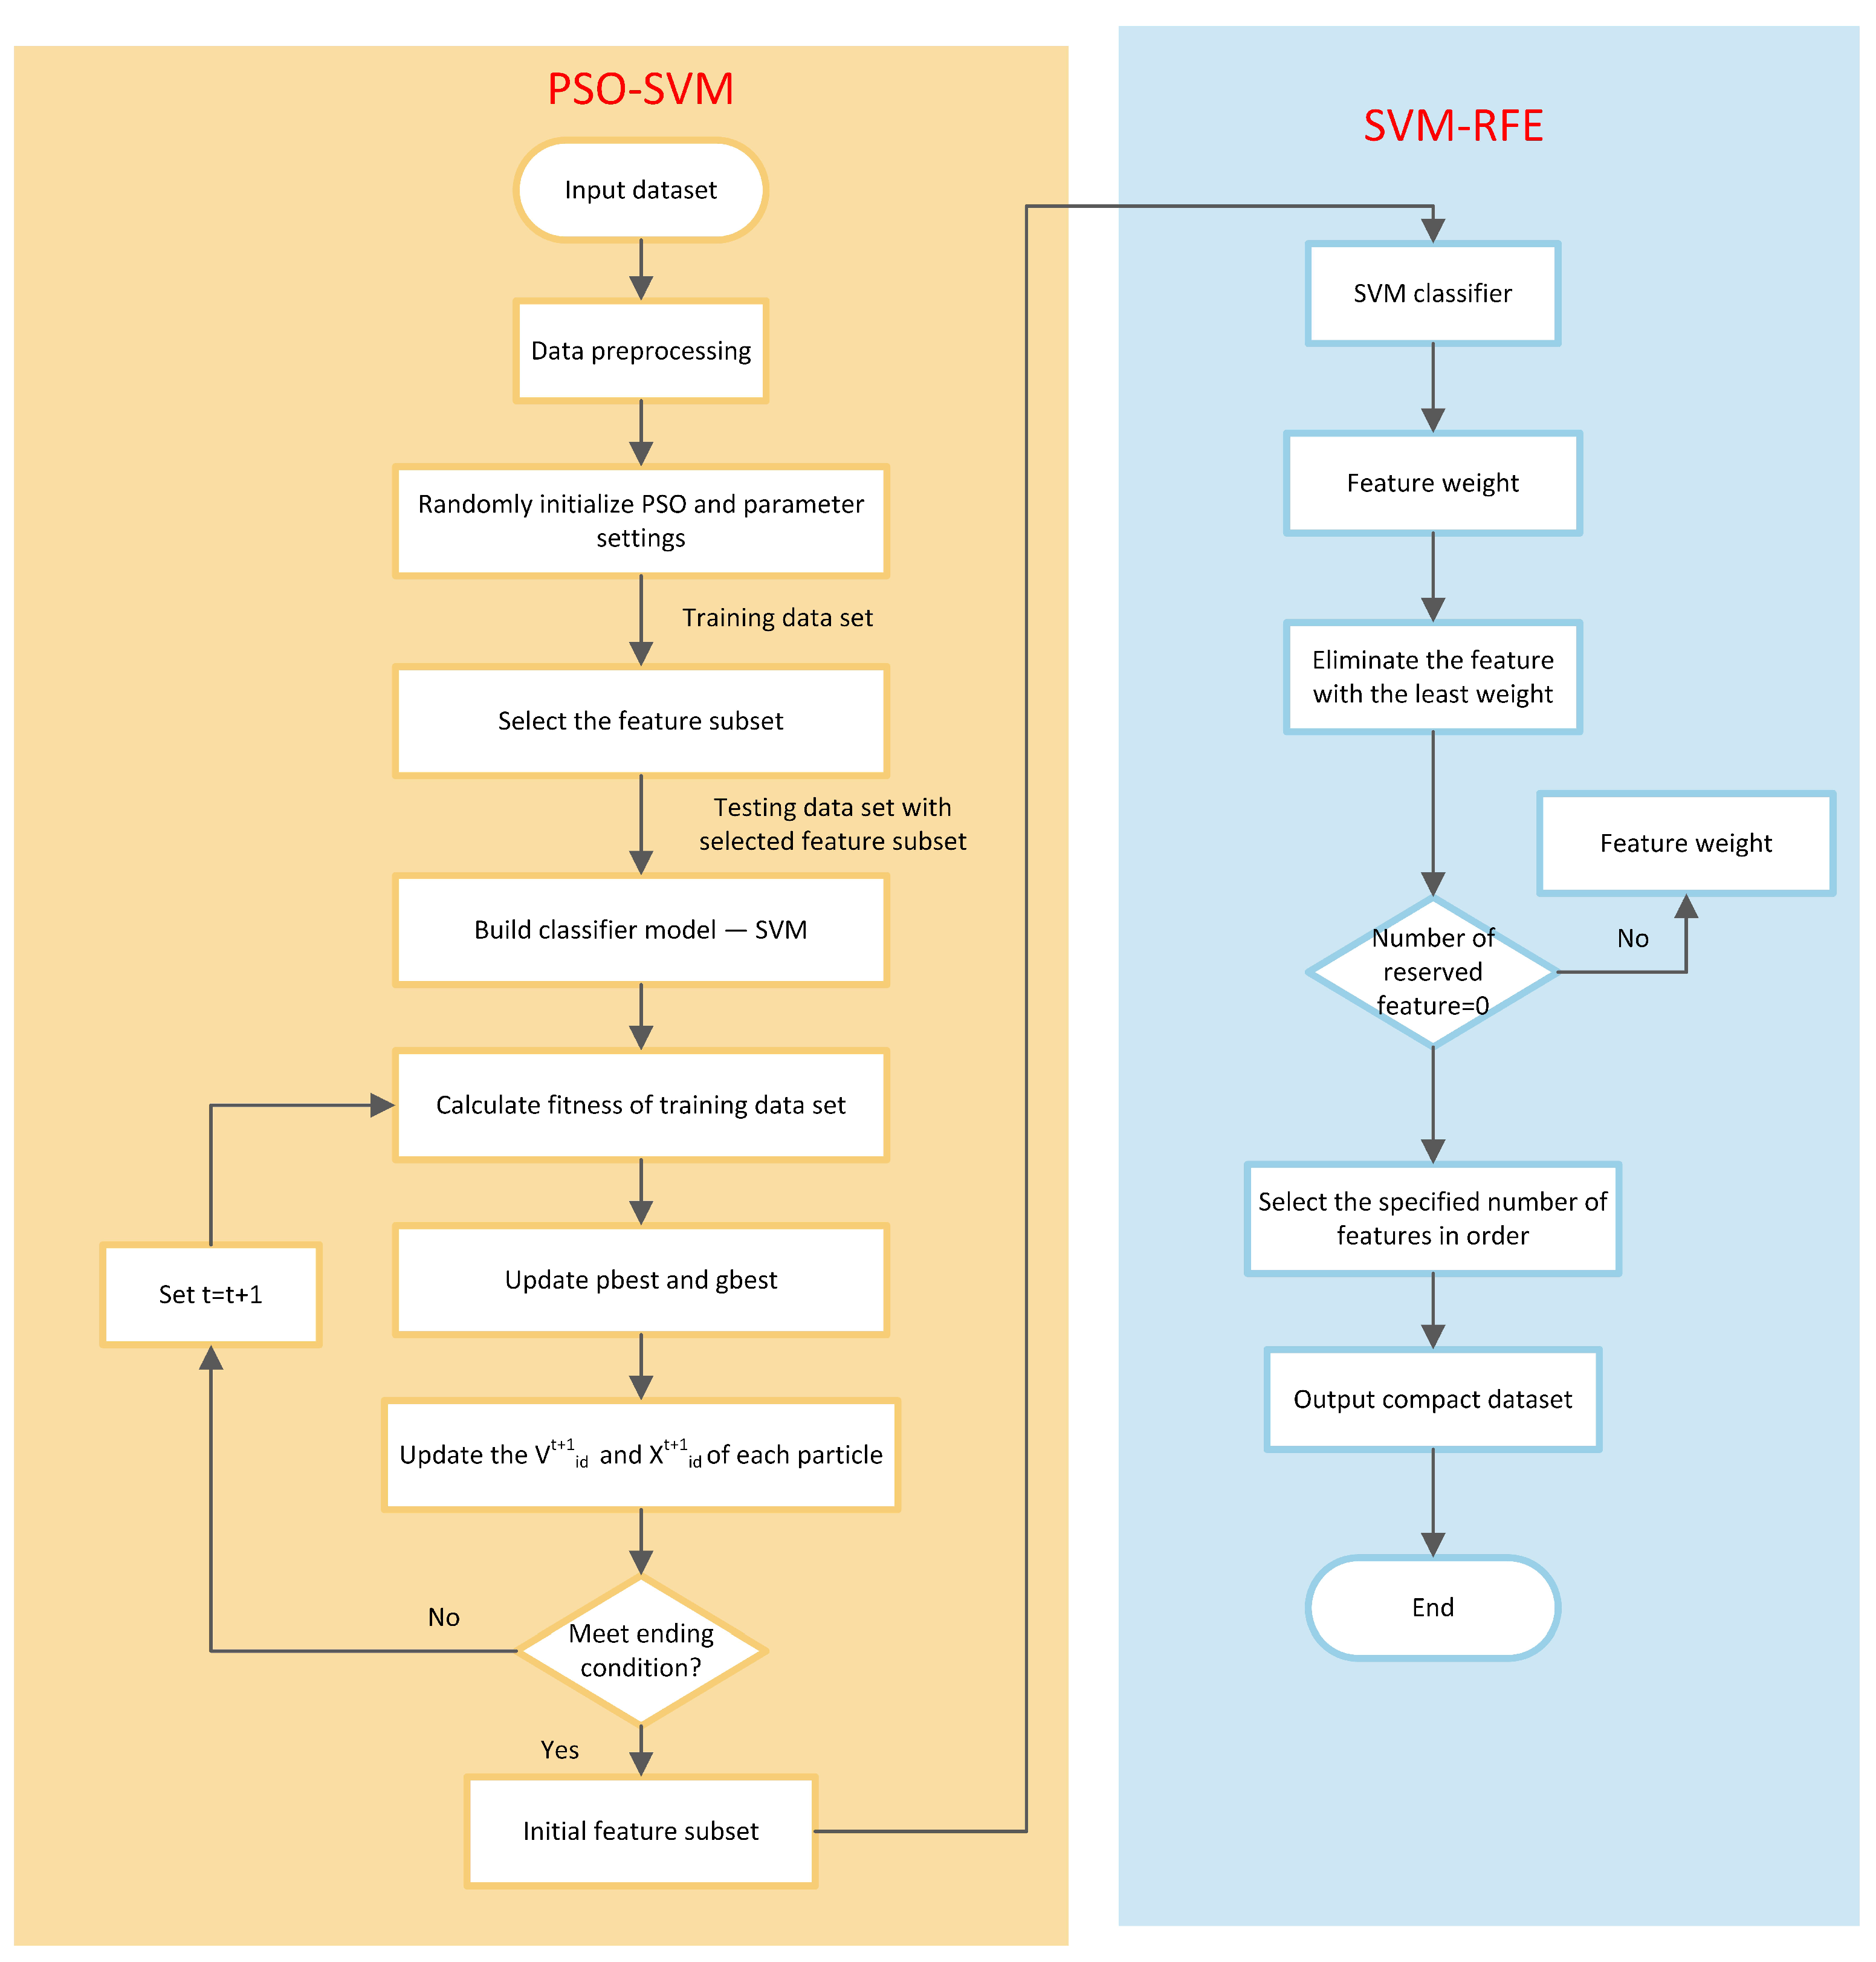
2.1. Feature Selection Phase
2.1.1. Support Vector Machine Recursive Feature Elimination
2.1.2. Feature Selection Using PSO-SVM
2.1.3. Two-Level Feature Selection Preprocessing Model
2.2. Classification Phase
2.2.1. Modified Salp Swarm Algorithm
- •
- Step 1: Initialization phase
- •
- Step 2: Improve update strategy for leader positions
- •
- Step 3: Improve update strategy for follower positions
| Algorithm 1 Modified salp swarm algorithm (Pseudo-code) |
1: Initialization parameters: population size N, dimension D, maximun number of iterations . 2: Generate the initial population by Equation (11); 3: Calculate the fintess value for each individual search agent. 4: While do 5: Update by Equation (13); 6: for do 7: if (leader) then 8: Update random numbers and ; 9: Update the position of the leader salp as in Equation (19); 10: else 11: Update by Equation (16); 12: Update the position of the follower salp as in Equation (20); 13: end if 14: end for 15: ; 16: end while Output: Best classification and predication results. |
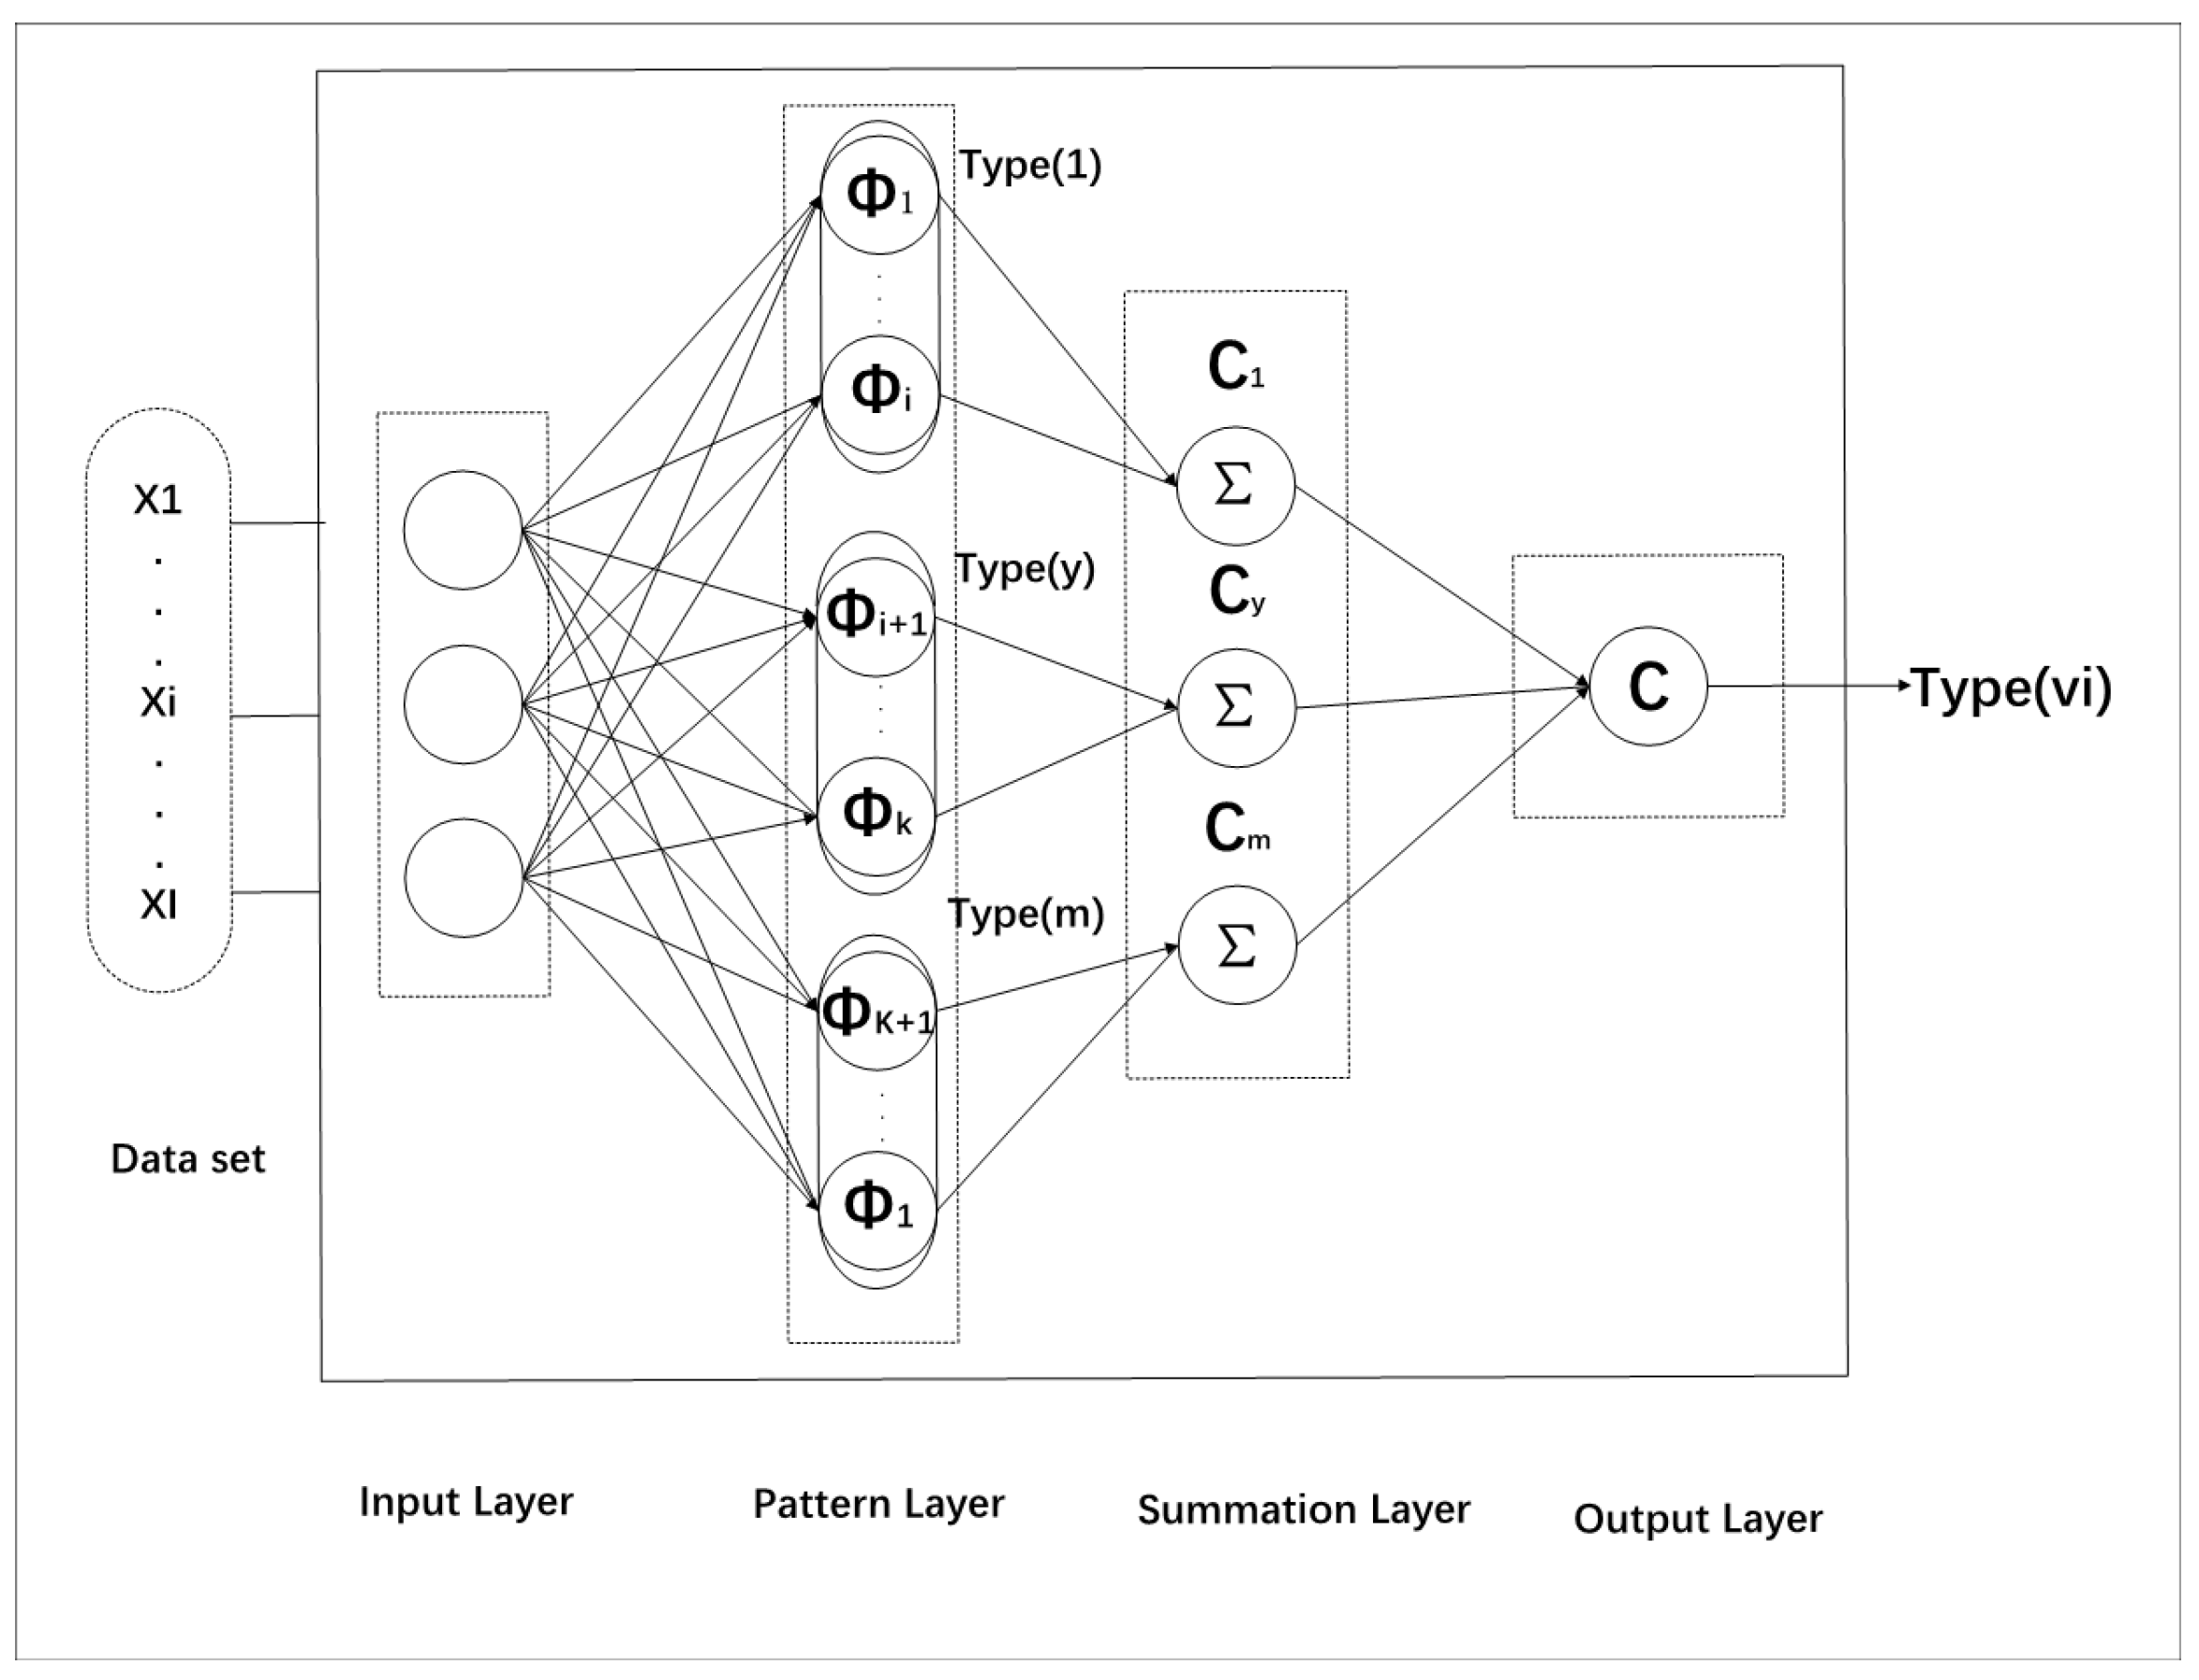
2.2.2. Probabilistic Neural Network
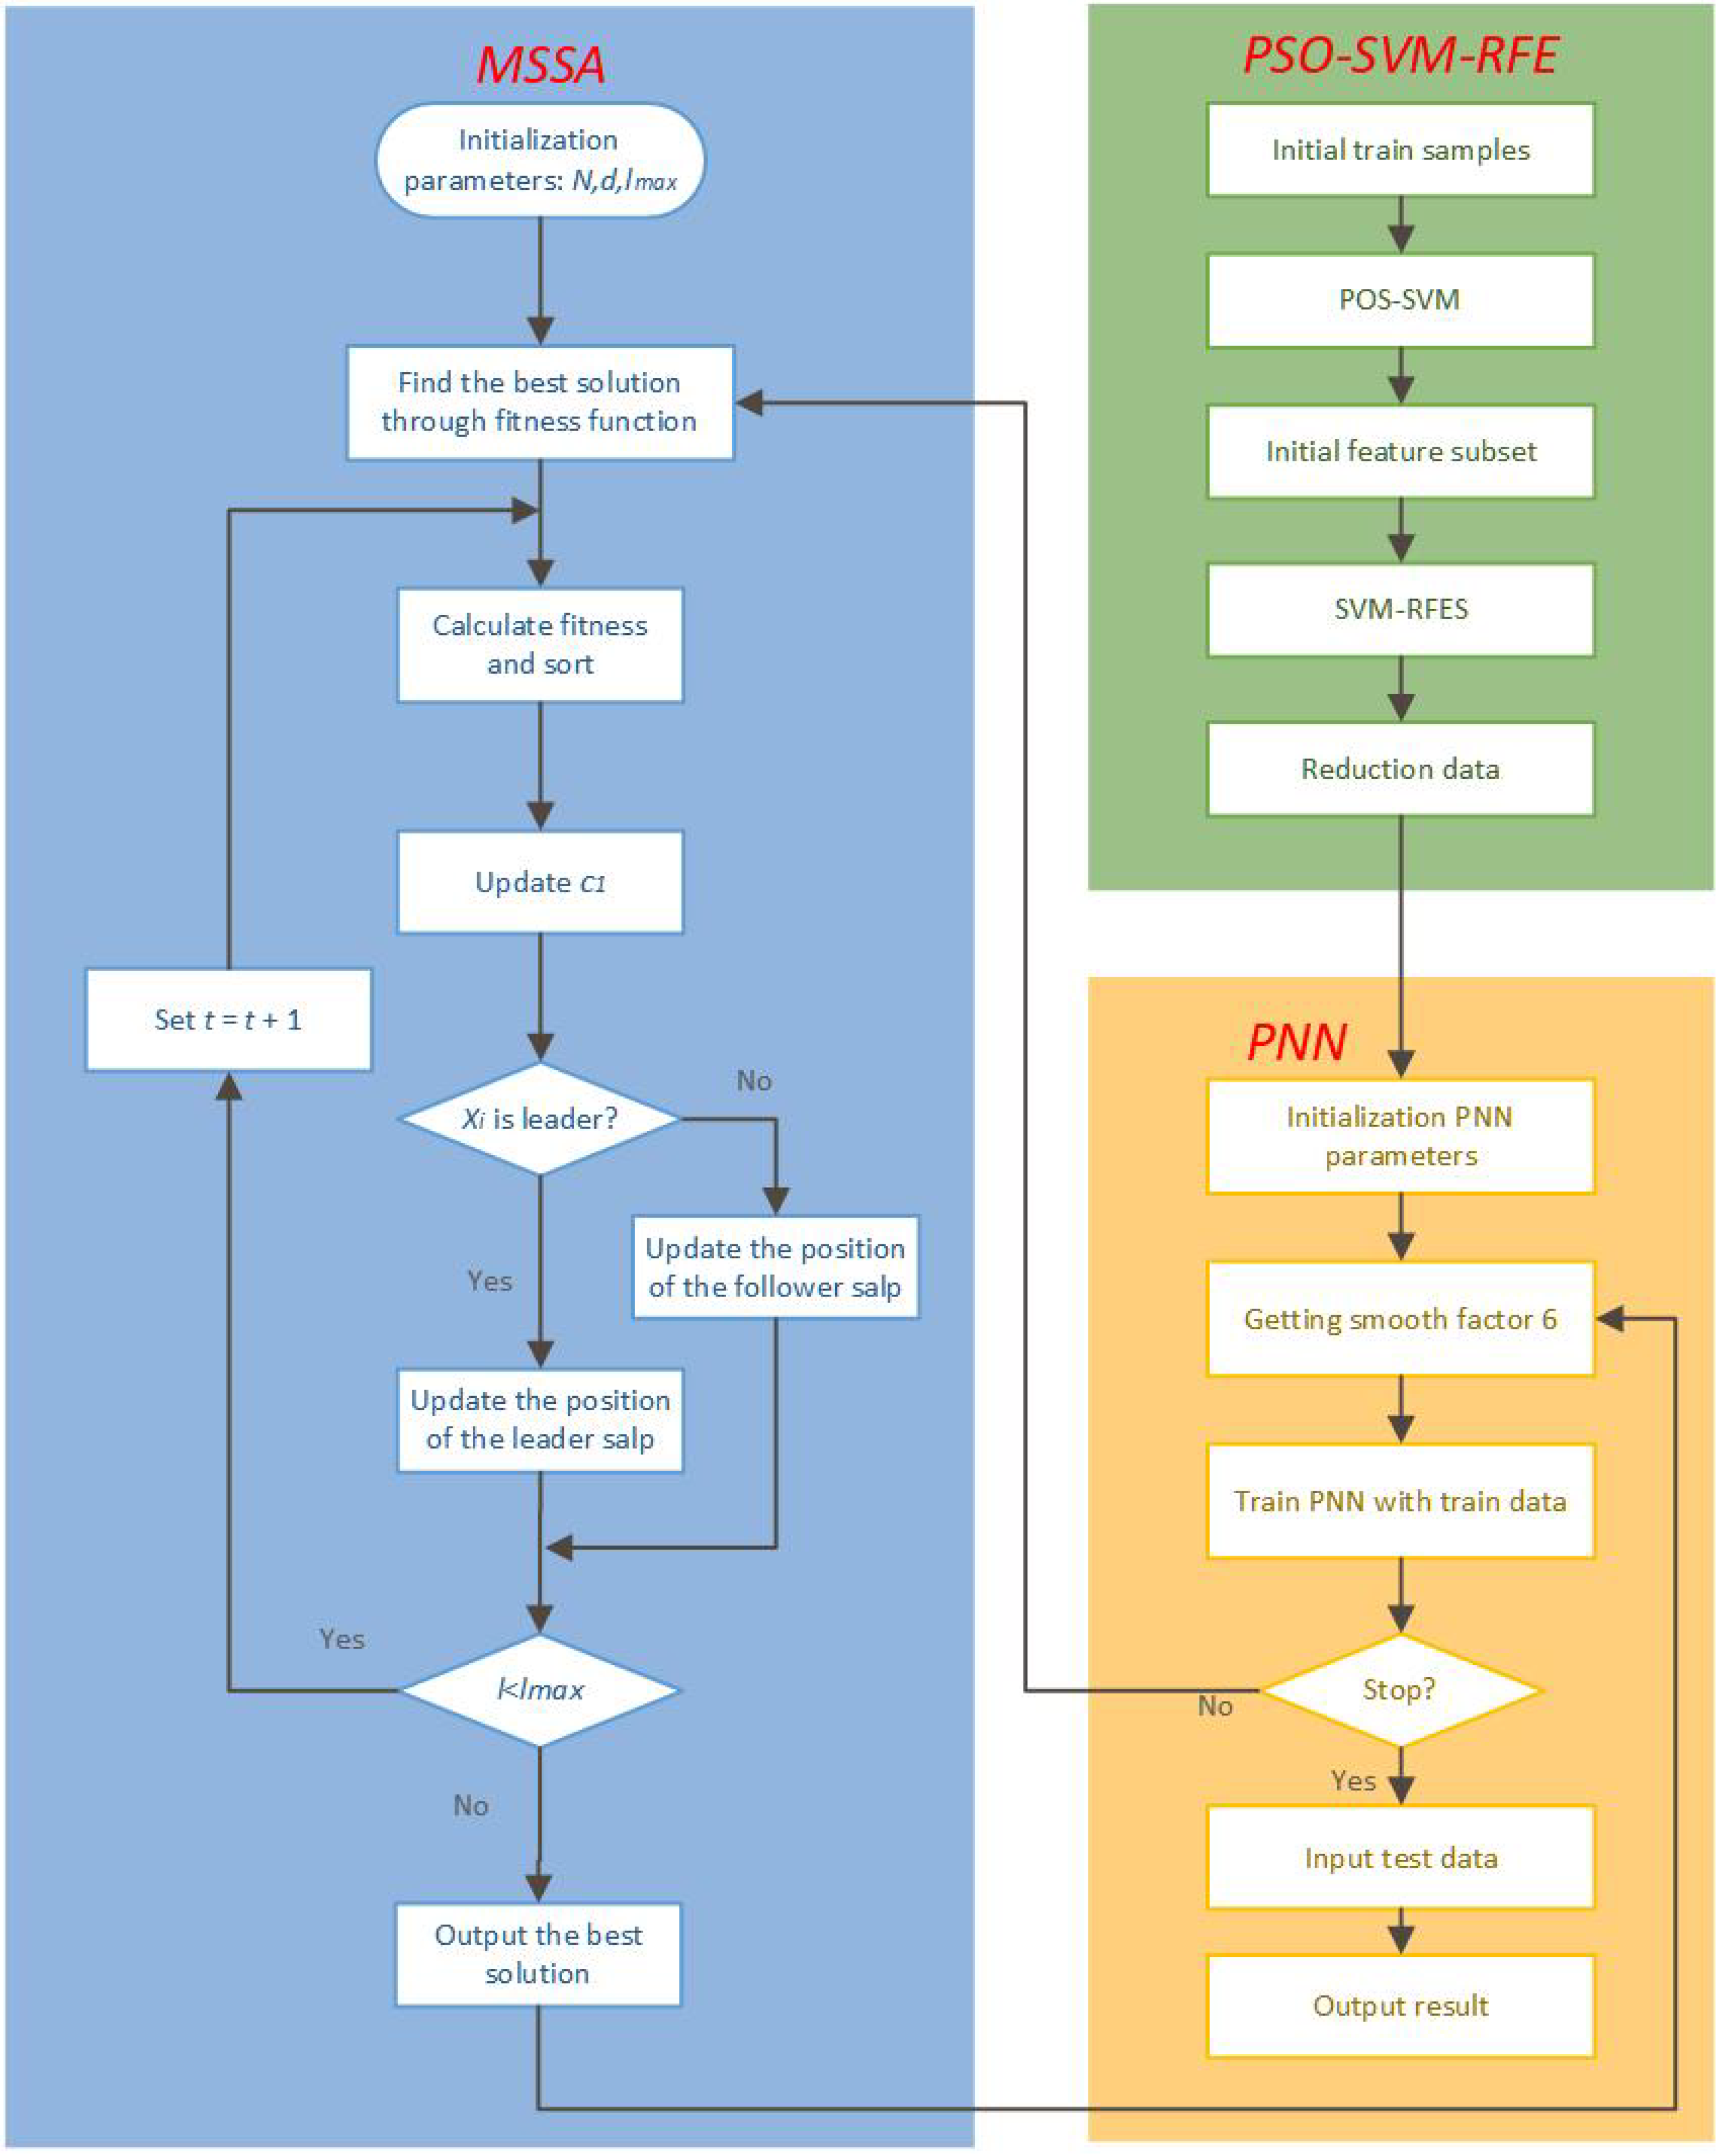
2.3. The Proposed PSO-SVM-RFE-MSSA-PNN Model
- Step 1:
- The data samples were entered into PSO-SVM-RFE and ranked in order of importance for each feature.
- Step 2:
- Select the specified number of features to construct feature subsets based on the ranking results, and obtain the simplified sample dataset based on the feature subsets.
- Step 3:
- The simplified data samples are preprocessed and then randomly input to PNN.
- Step 4:
- The initial parameters of MSSA are set as follows: the number of populations N, dimension d, and the maximum number of iterations . In addition, the population positions of MSSA are initialized by Equation (12).
- Step 5:
- The fitness of salp individuals in the initial population is calculated and ranked. The fitness function in this paper is set as the mean square error function, as shown in Equation (20):where and are the training accuracy and testing accuracy under the effect of a particular smoothing factor, respectively.
- Step 6:
- The salp individual location with the best fitness was considered to be the current food location. Of the remaining N-1 salp individuals, the most adaptable salp is considered the leader, and the rest are considered followers.
- Step 7:
- Update according to Equation (14).
- Step 9:
- The following process is continued if the maximum number of iterations is reached or the preset conditions are met. If not, return to step 6.
- Step 10:
- At the end of the training process, the optimized smoothing factor is input into PNN to obtain a PNN with global optimization performance. Then, input the test sample data into PNN to obtain the final diagnosis result.
3. Results and Discussions
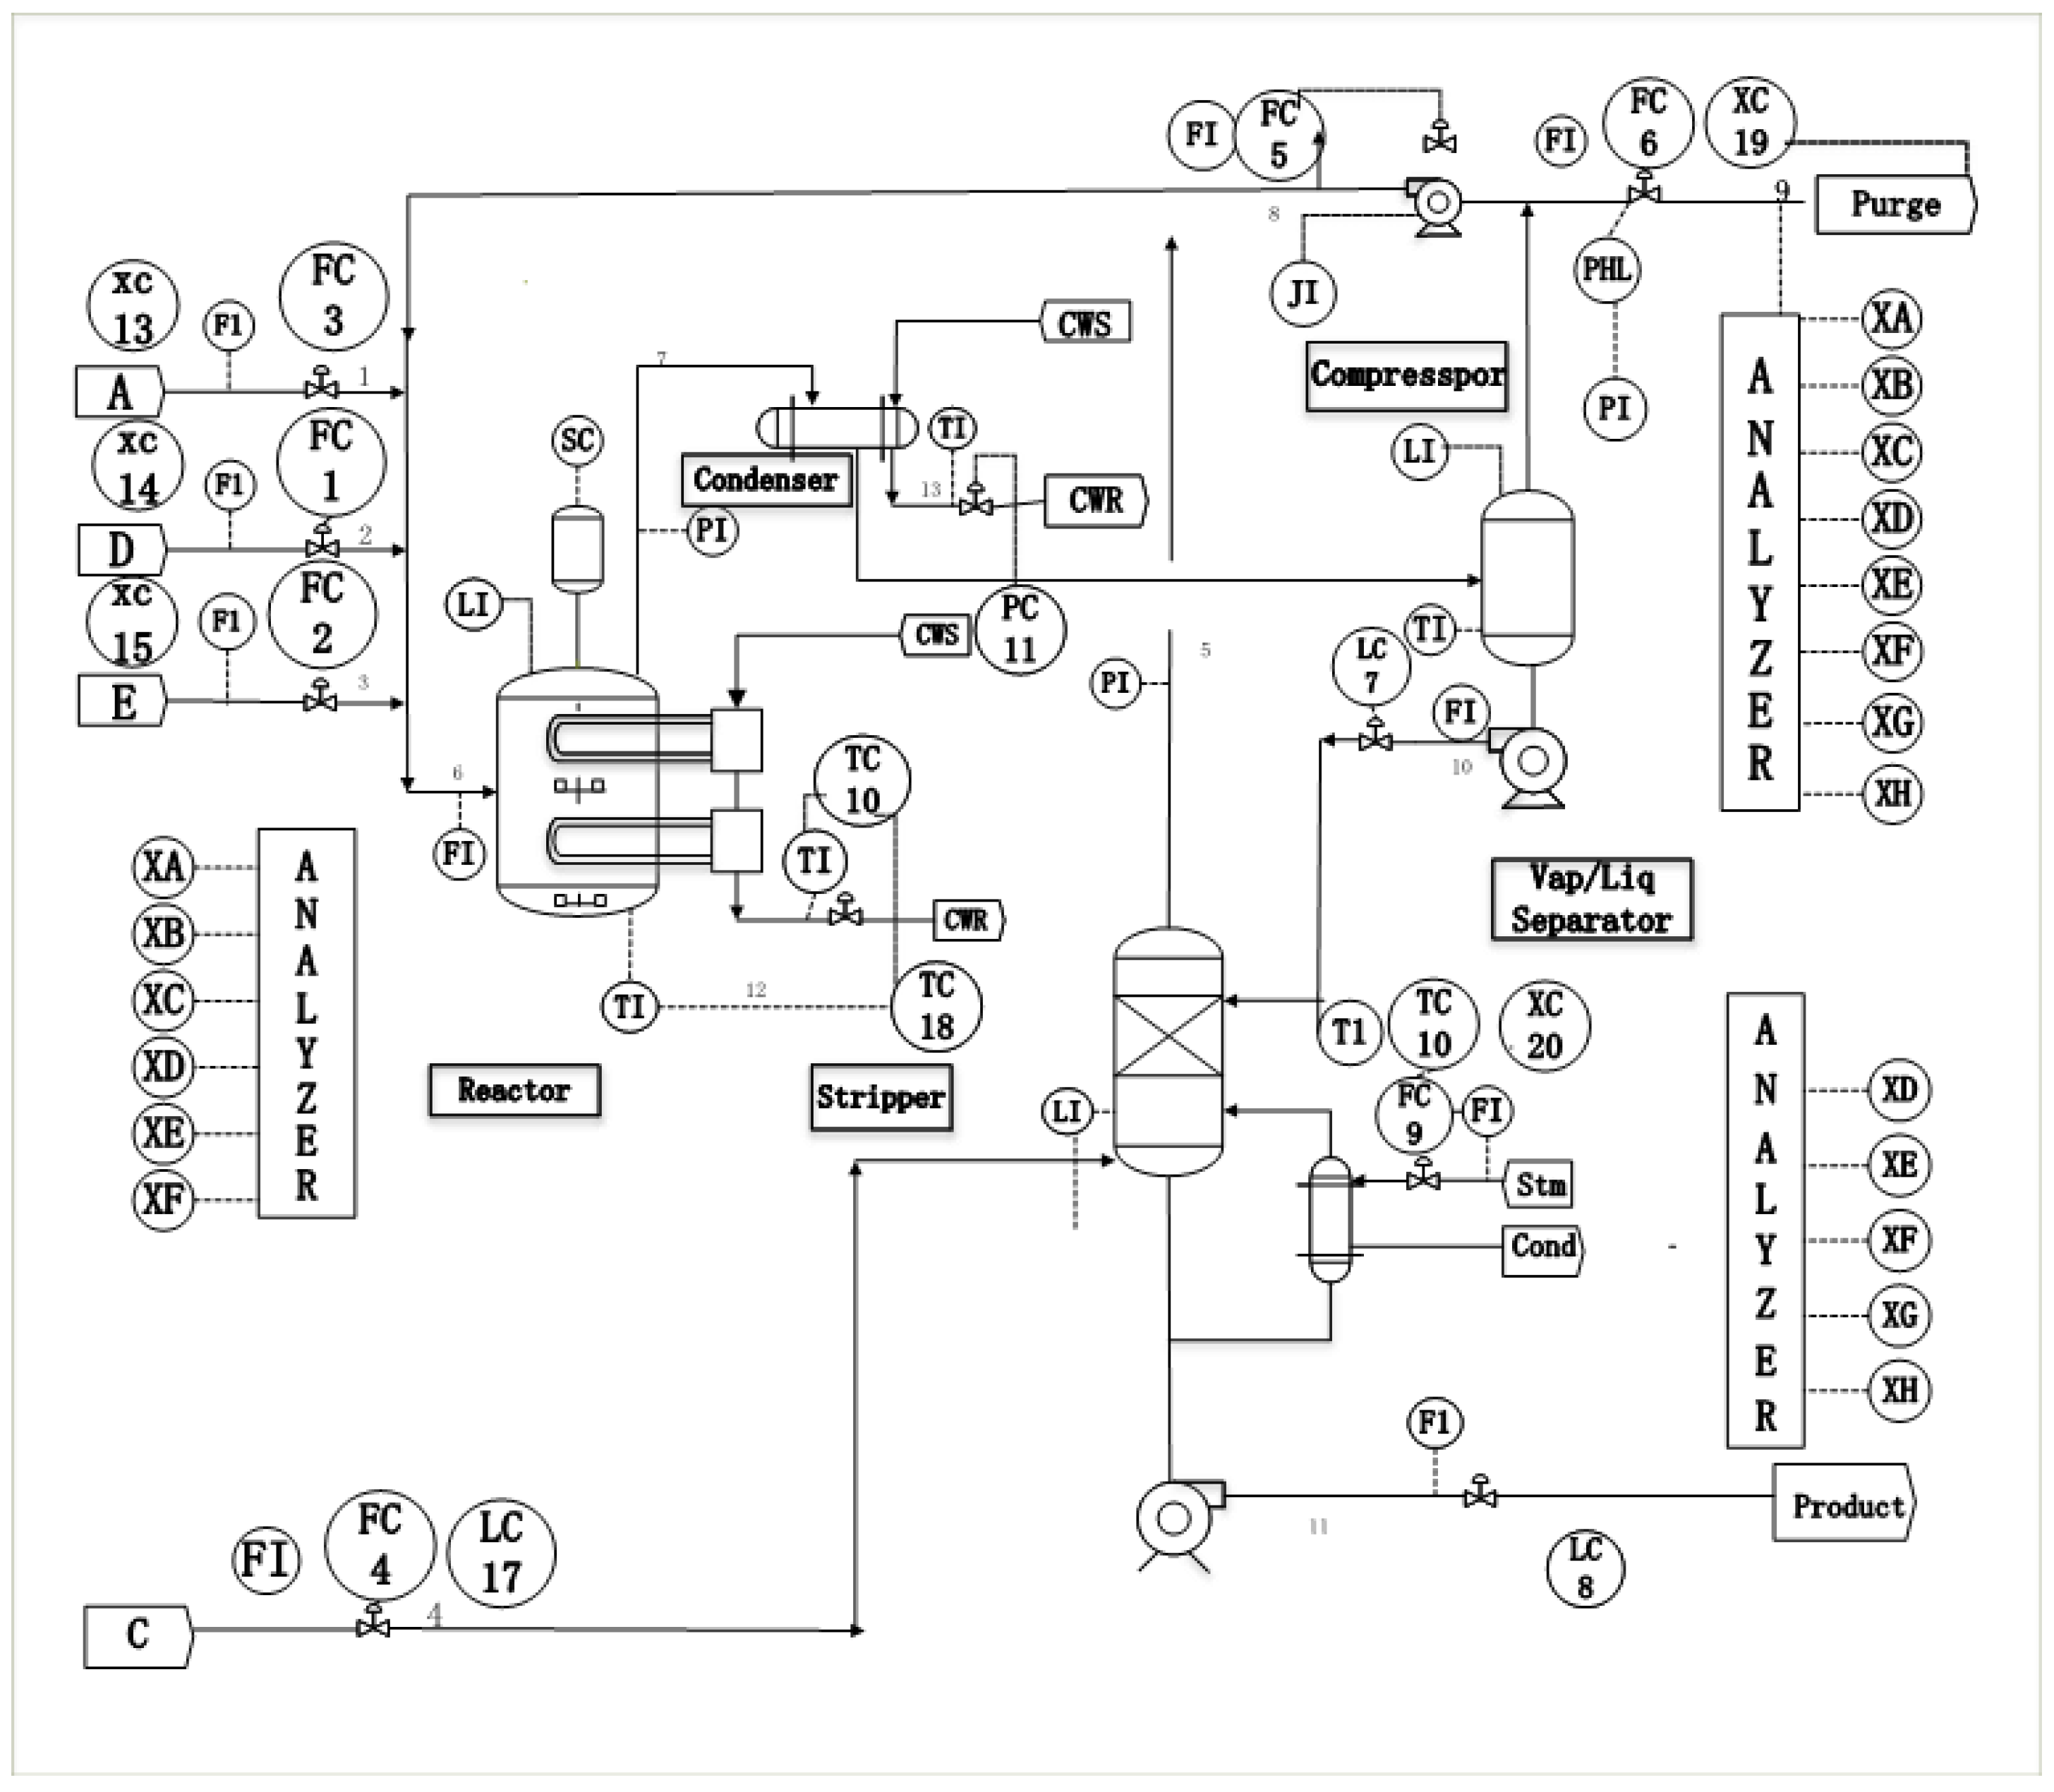
3.1. Tennessee Eastman Process
3.2. Three Experiments to Verify the Validity of the Proposed Model
3.2.1. Influence of Different Feature Selection Algorithms on the Performance of Fault Diagnosis
- ①
- The PSO-SVM-RFE model offers a considerable advantage in feature selection for categories 3, 9, 11, 13, 14, 17, and 19, compared to the SVM-RFE model for these seven fault categories. Despite the fact that the PSO-SVM-RFE model does not outperform the SVM model in categories 8, 10, 15, and 16, its diagnosis rate is still higher than 80%. In the remaining categories of defects, the differences between them are insignificant. Thus, when it comes to selecting features, the PSO-SVM-RFE model with initial pre-screening by PSO-SVM does better than the SVM-RFE model.
- ②
- For categories 3, 9, 11, 13, 14, 17, and 19, the PSO-SVM-RFE model has a significant advantage over the SVM-RFE model in feature selection for these seven fault categories. Although the PSO-SVM-RFE model does not have an advantage over the SVM-RFE model for categories 8, 10, 15, and 16, its diagnostic rate is still above 80.00%. In the other fault categories, the difference between them is not significant. Thus, the PSO-SVM-RFE model with initial pre-screening by PSO-SVM performs better in feature selection than the single SVM-RFE model.
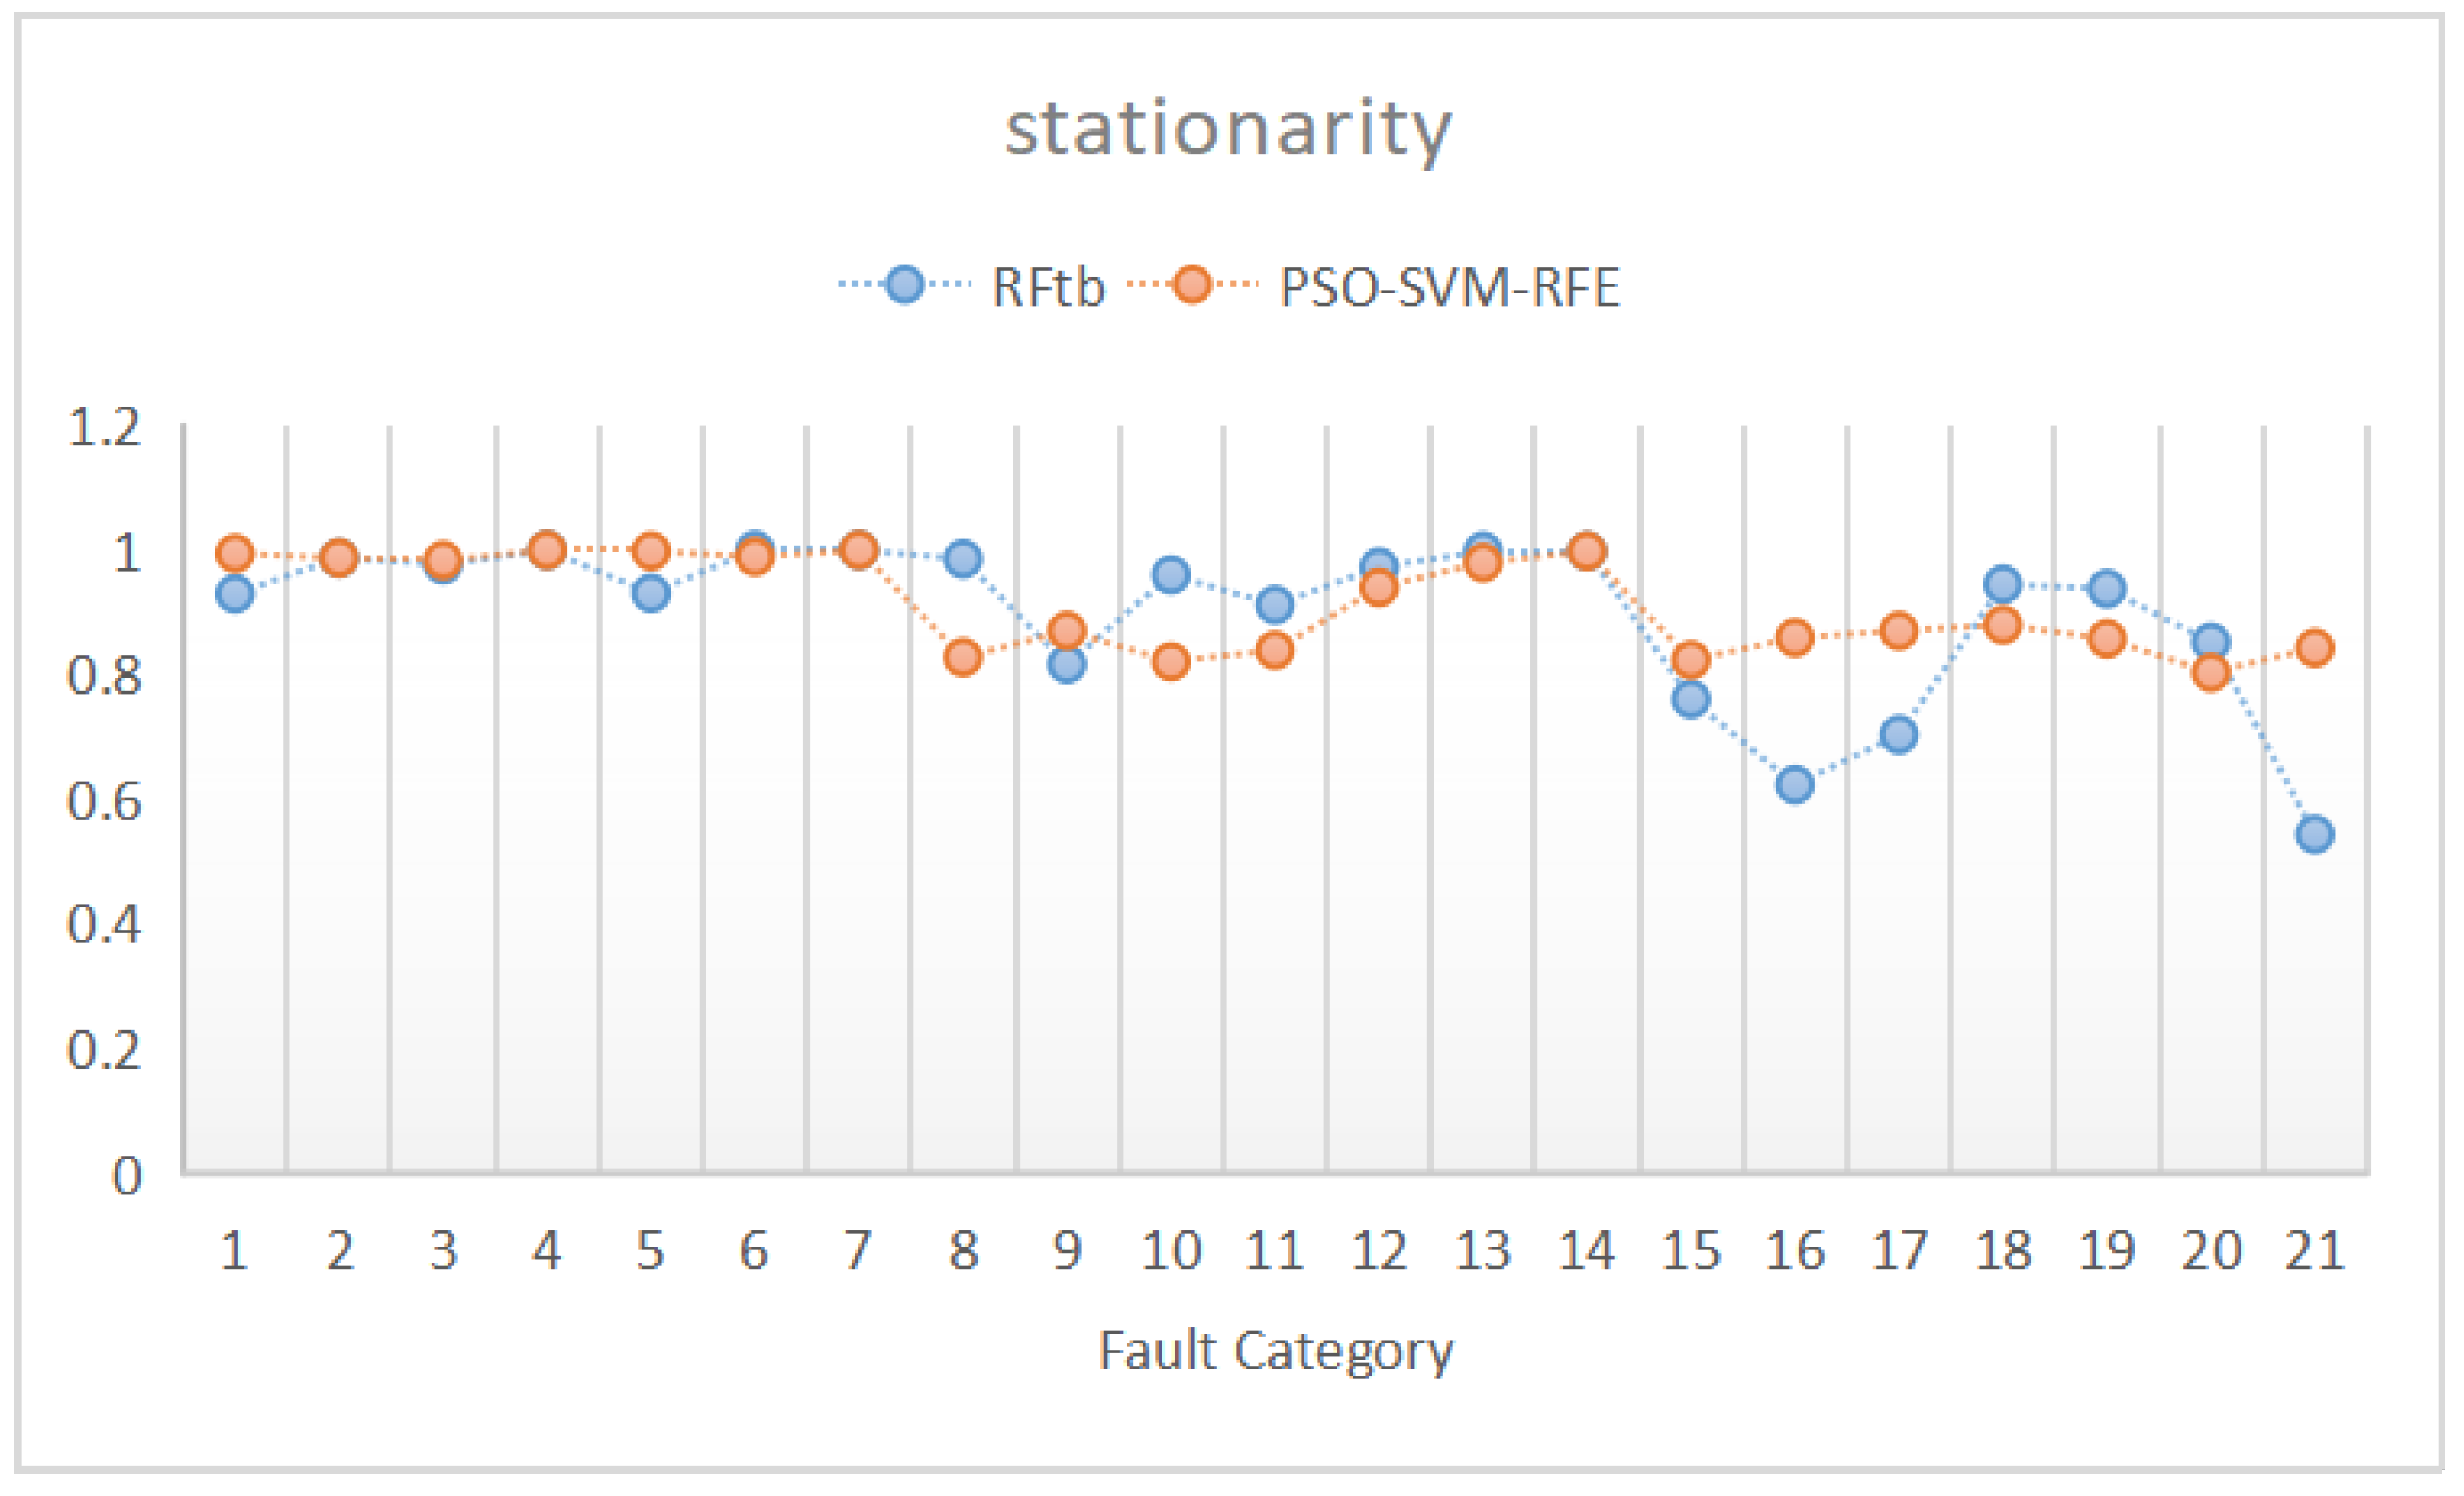
- ③
- PSO-SVM-RFE had an average diagnostic rate of 91%, whereas RFtb had an average diagnostic rate of 90%. The former has a minor edge in the average accuracy rate if there is little difference in the diagnostic rate of 21 fault categories. PSO-SVM-RFE has a better diagnostic rate for several fault types than RFtb. Figure 5 shows that the PSO-SVM-RFE algorithm gives a better diagnosis rate for the 21 fault categories while keeping a more or less smooth quasi-break rate.
3.2.2. Performance Analysis of Fault Classification for Different Optimized PNN Schemes
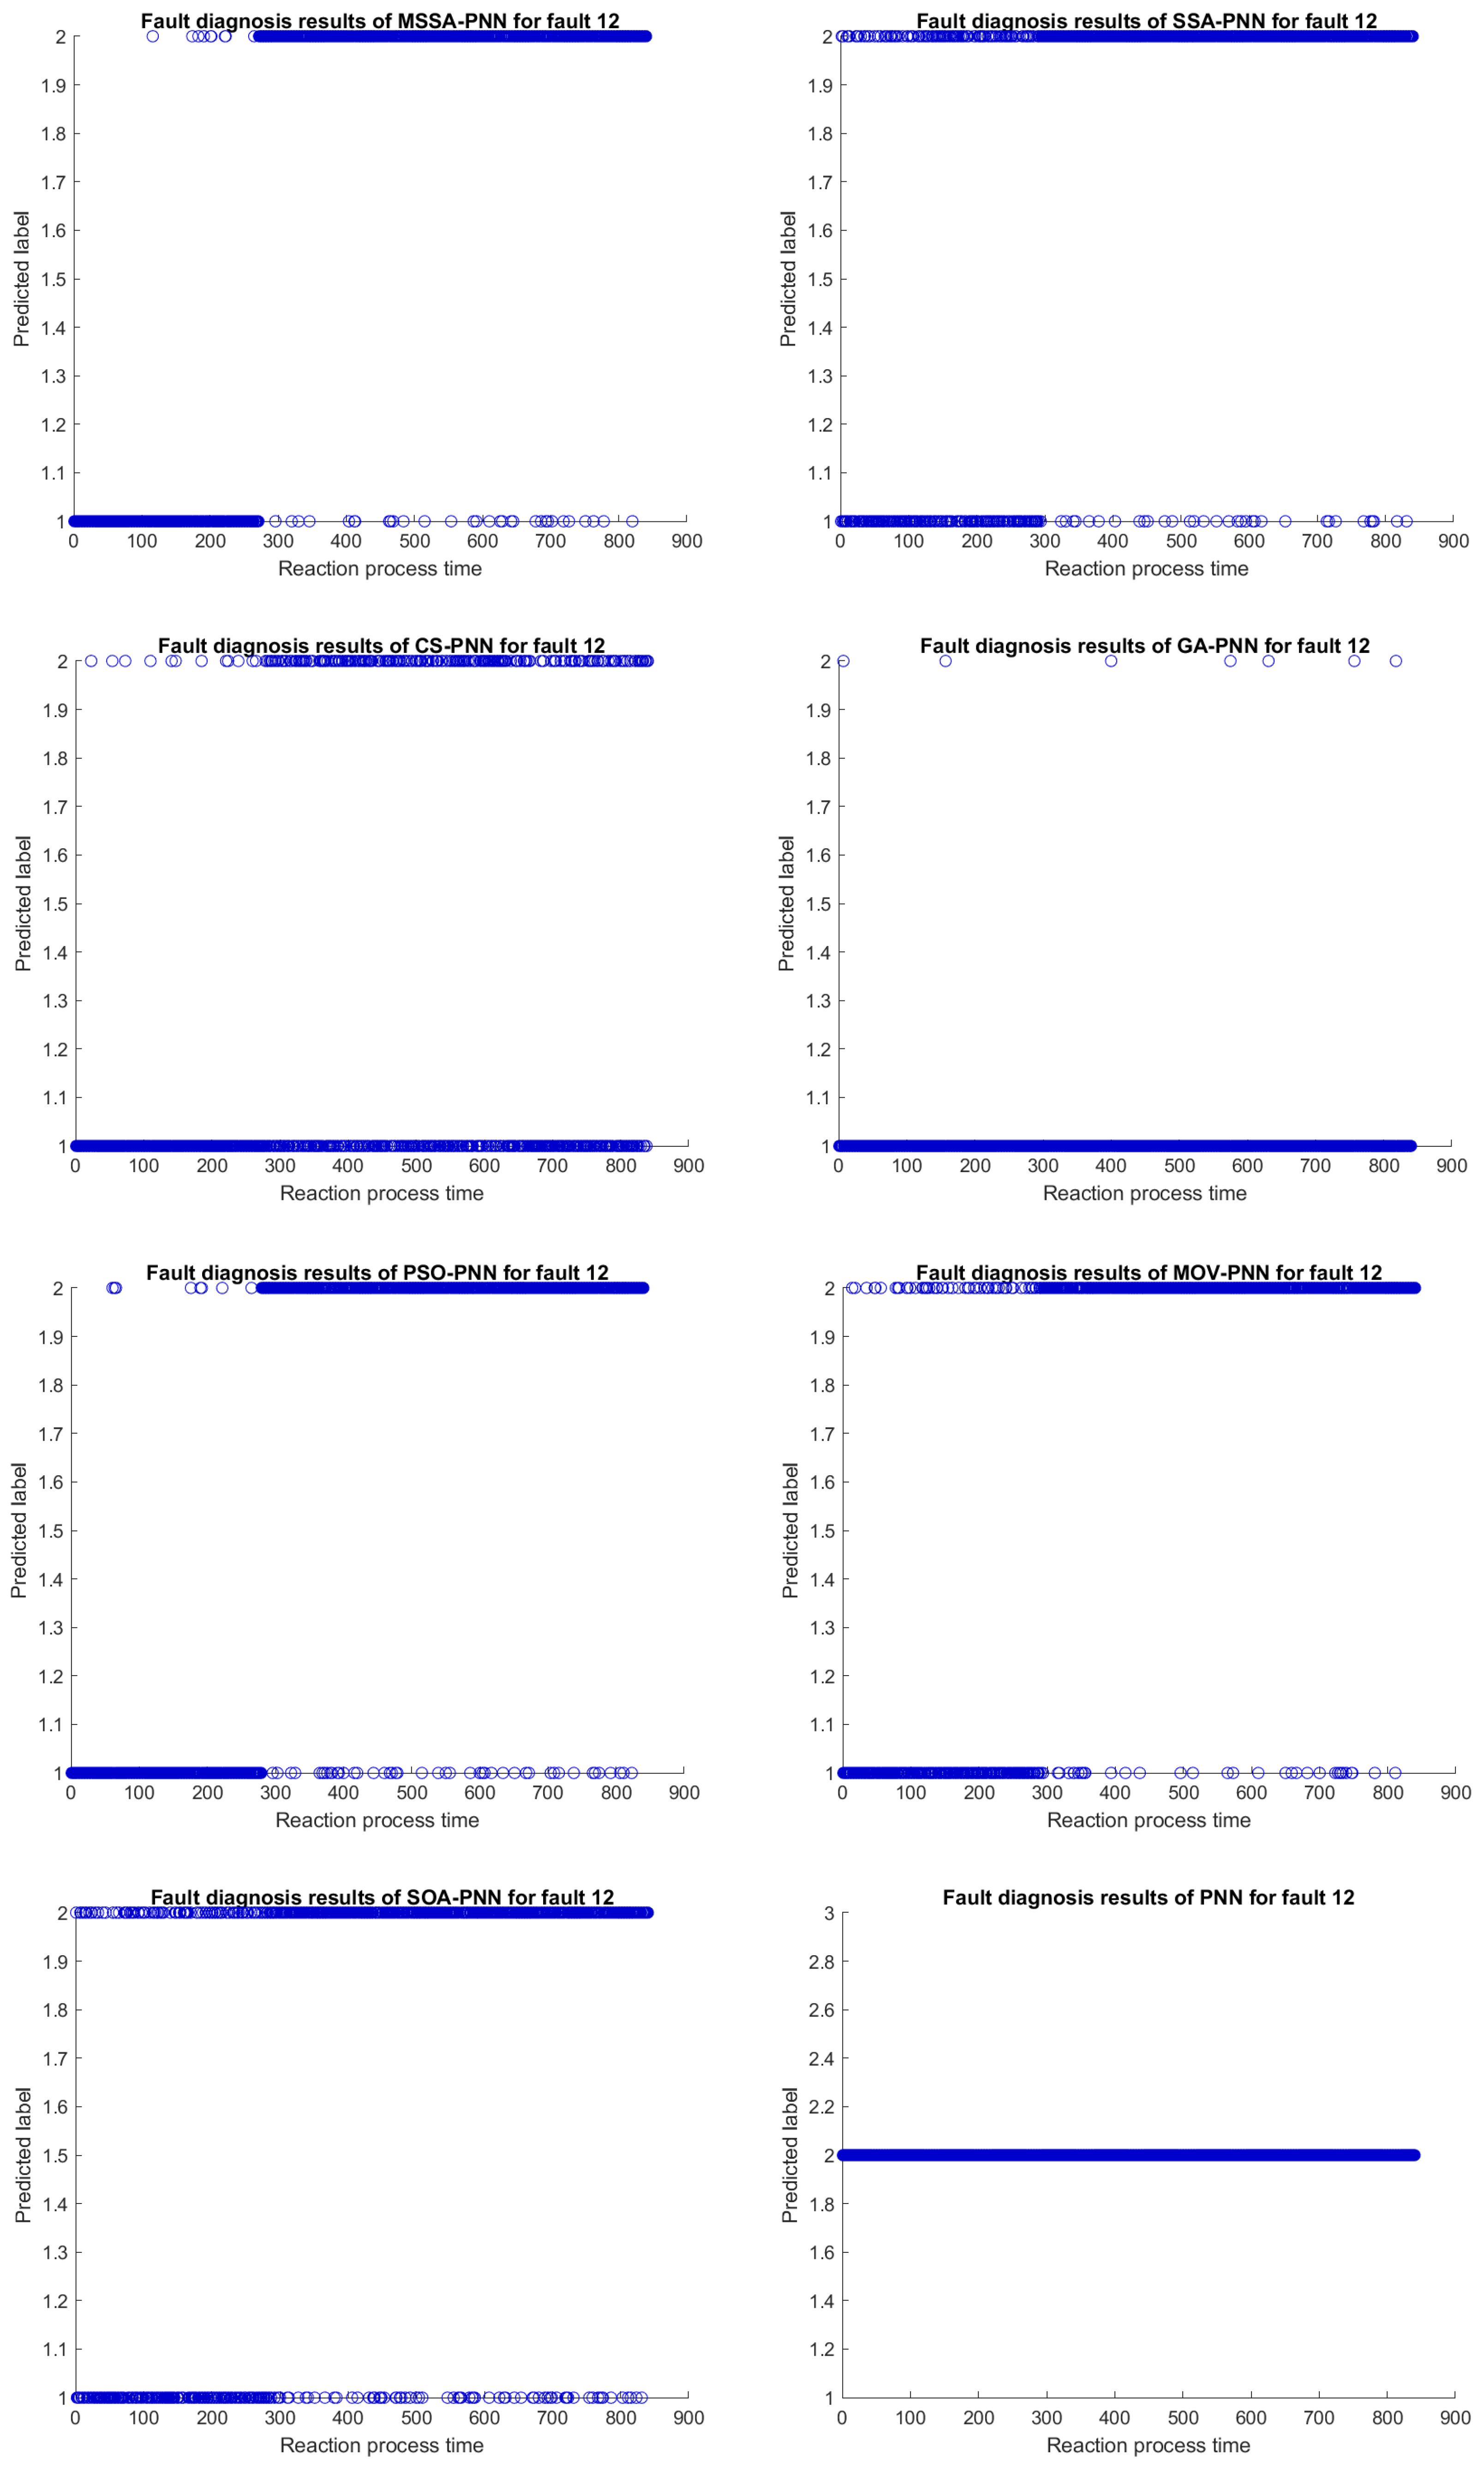
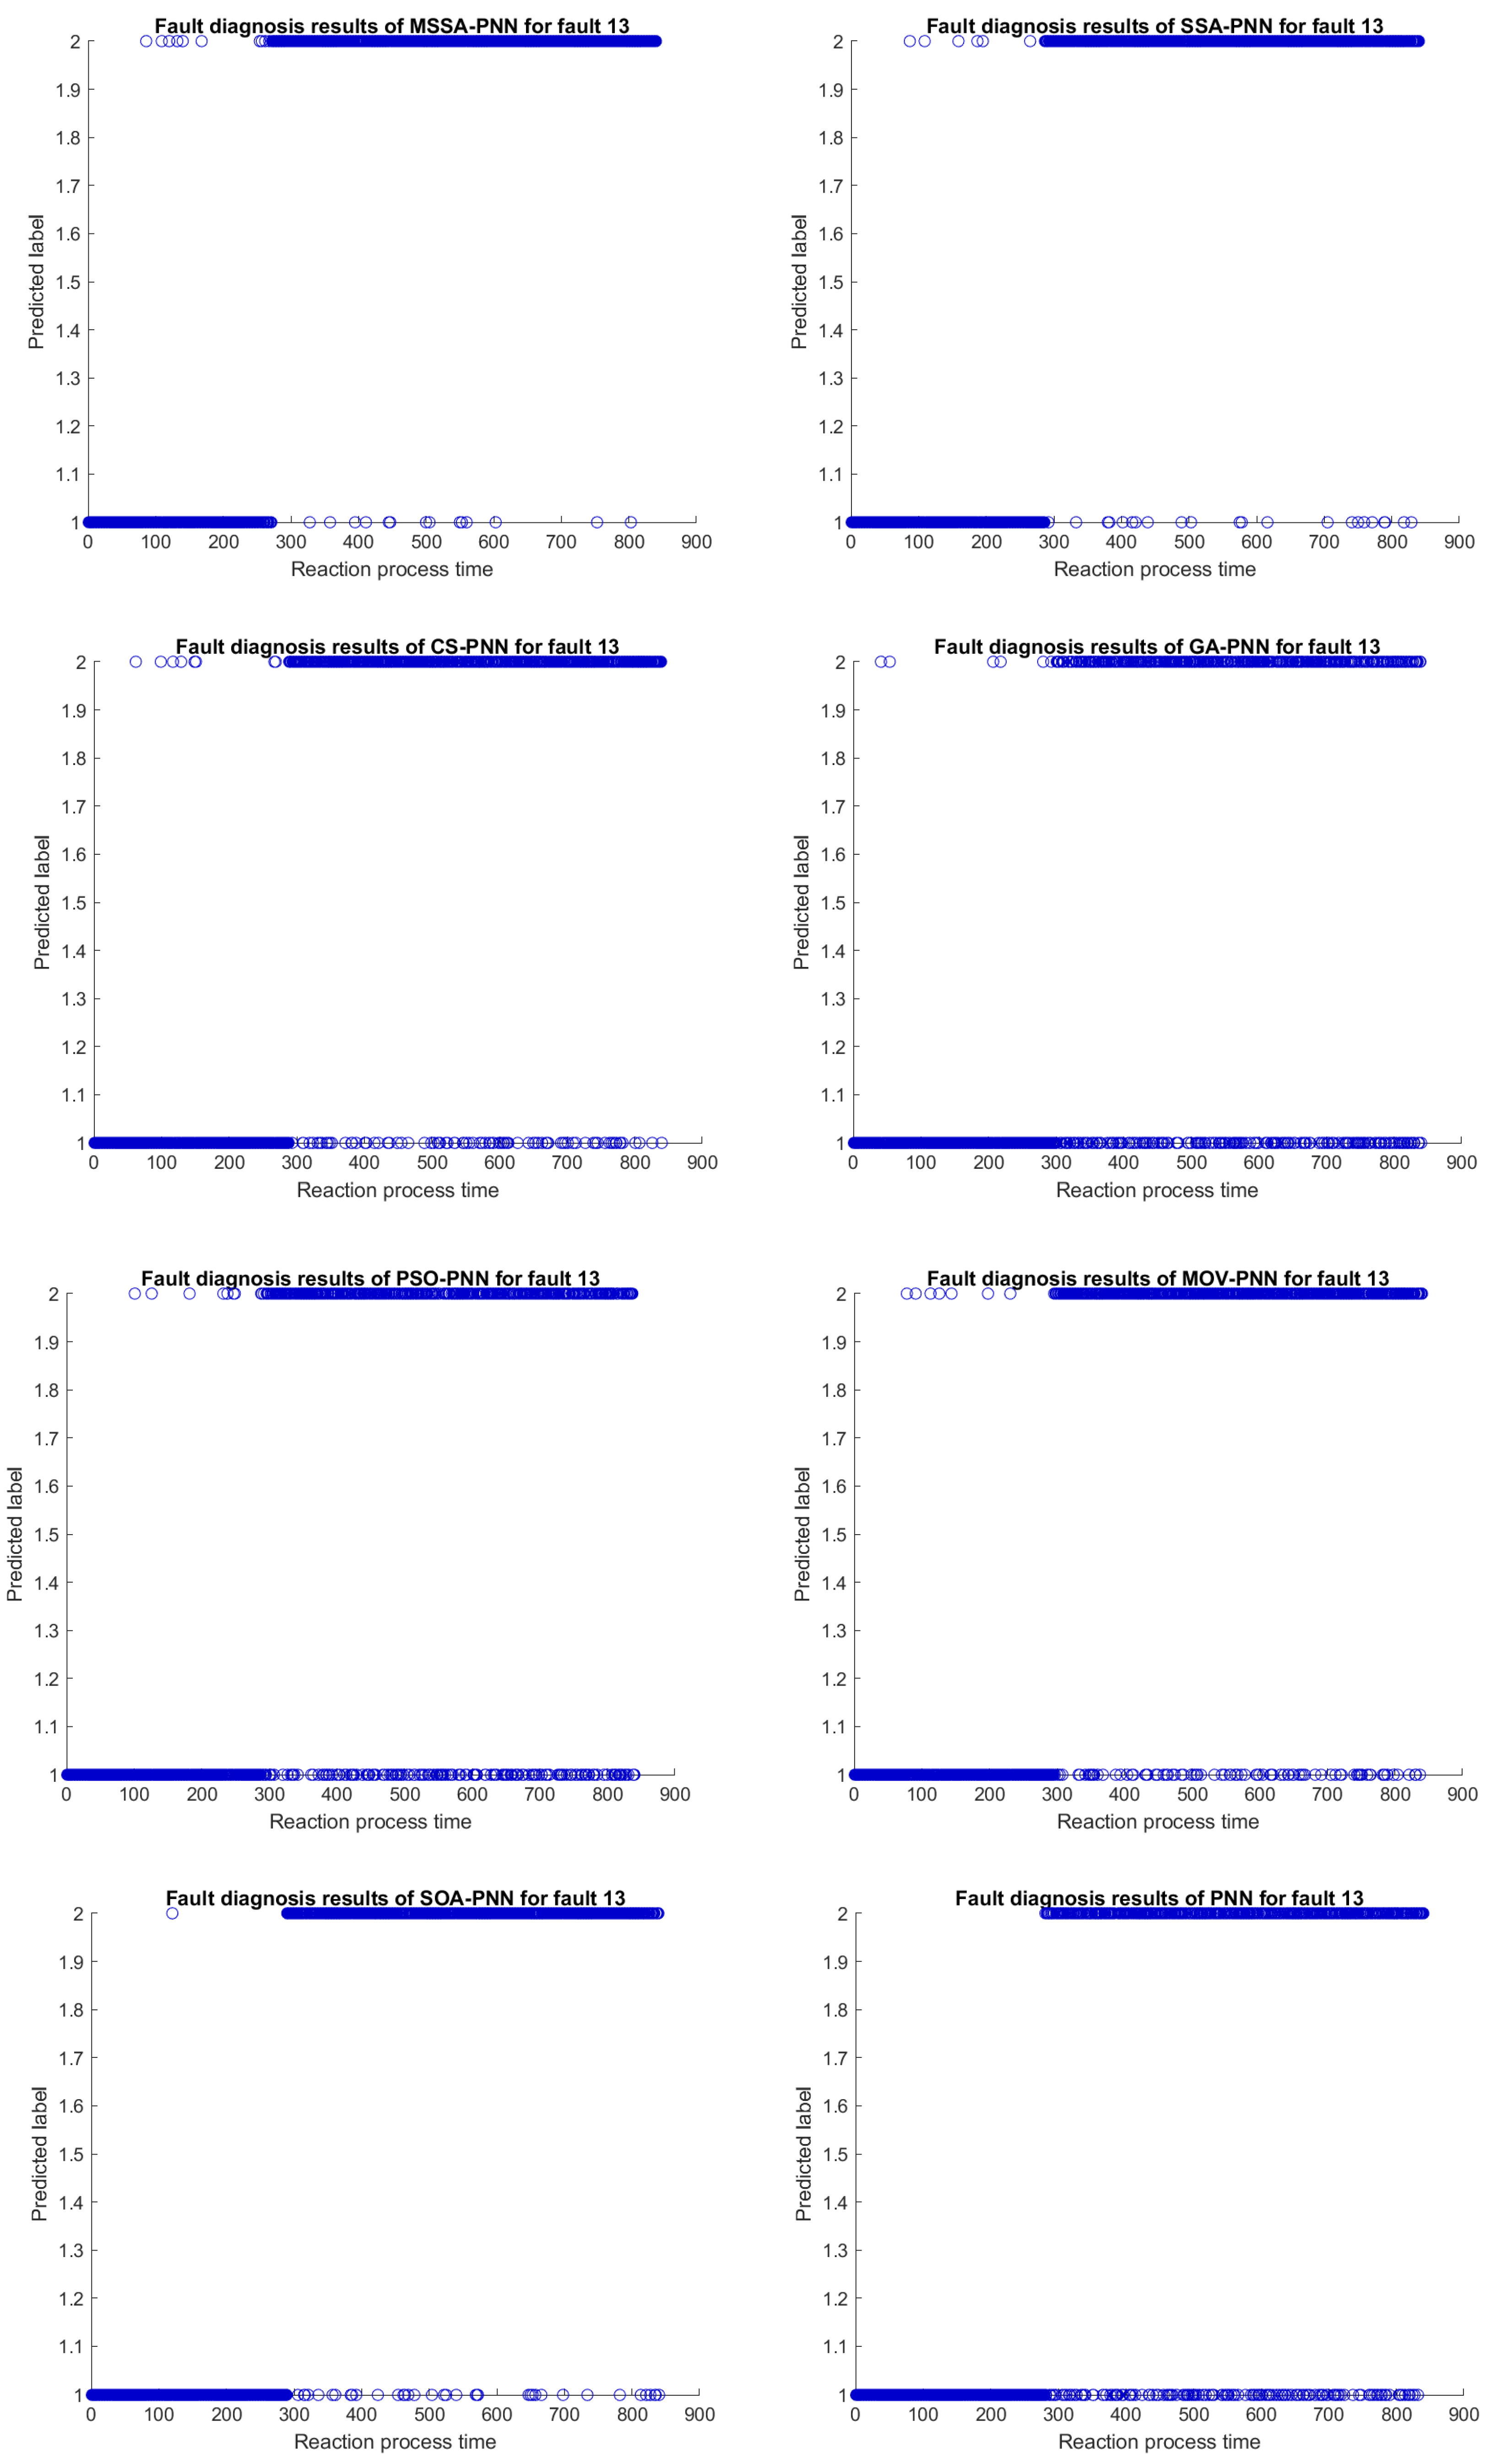
- ①
- Compared to the other optimization models, the diagnostic rate of PNN is lower on average, which demonstrates the inadequacies of the common PNN and the importance of the optimization model.
- ②
- MSSA-PNN has a higher average diagnostic rate than SSA-PNN, demonstrating the advantages of optimized SSA and the soundness of this theory.
- ③
- MSSA-PNN has the highest average diagnosis rate among the aforementioned optimization models, and its fault diagnosis rate is superior than those of other optimization models. In addition, categories 3, 9, 13, and 17 outperform all other categories. Although it is inferior in a few defect categories, the difference is minor. Further evidence demonstrates that utilizing MSSA to optimize PNN can boost performance.
3.2.3. Analysis of Fault Diagnosis Performance Indicators of Different Classifiers
4. Conclusions
- This paper uses a two-stage feature selection algorithm to delete redundant features. Experiments verify the practicability and superiority of the algorithm, but the influence of operation time is ignored in the experiments. In future work, further simplification of the structure of the feature selection algorithm, such as adopting NSGA-II, should be considered to achieve simplification in the data preprocessing stage.
- The quality of the original data of the TE process directly affects the diagnostic performance of the fault diagnosis model. By observing the sample data, it can be seen that each characteristic variable of the TE process fluctuates in a normal state, which can easily cause misjudgment, which may be the reason for the low diagnosis rate of some fault types. Therefore, it is necessary to scale out abnormal data before feature selection in practical applications.
- The feature selection algorithm in this paper only filters redundant features at the data level. Next, we can combine the characteristics of the TE chemical process itself, explore the chemical connection between the characteristic variables, and ignore unnecessary variables from the chemical direction, which will be a new cross-optimization direction.
- In a natural chemical process, faults can be divided into process and sensor faults. Process faults are characterized by multivariate coordination, while sensor faults are variable independent, and the fault variable is unique. The occurrence of a process fault means that the system’s operating state deviates from its normal value. In contrast, sensor faults interfere with the system’s stability and affect the operator’s judgment, which may lead to failures. Examples are drift, jitter, and stepping of data. This paper makes no distinction between the two, but they are uniformly classified as faults. Therefore, we should distinguish and differentiate between process and sensor faults in chemical processes in subsequent research.
Author Contributions
Funding
Institutional Review Board Statement
Informed Consent Statement
Data Availability Statement
Conflicts of Interest
References
- Soui, M.; Mansouri, N.; Alhamad, R.; Kessentini, M.; Ghedira, K. NSGA-II as feature selection technique and AdaBoost classifier for COVID-19 prediction using patient’s symptoms. Nonlinear Dyn. 2021, 106, 1453–1475. [Google Scholar] [CrossRef] [PubMed]
- Nor, N.M.; Hassan, C.R.C.; Hussain, M.A. A review of data-driven fault detection and diagnosis methods: Applications in chemical process systems. Rev. Chem. Eng. 2020, 36, 513–553. [Google Scholar] [CrossRef]
- Wu, D.; Zhao, J. Process topology convolutional network model for chemical process fault diagnosis. Process Saf. Environ. Prot. 2021, 150, 93–109. [Google Scholar] [CrossRef]
- Yu, W.; Dillon, T.; Mostafa, F.; Rahayu, W.; Liu, Y. A global manufacturing big data ecosystem for fault detection in predictive maintenance. IEEE Trans. Ind. Inform. 2020, 16, 183–192. [Google Scholar] [CrossRef]
- Li, B.; Delpha, C.; Diallo, D.; Migan-Dubois, A. Application of Artificial Neural Networks to photovoltaic fault detection and diagnosis: A review. Renew. Sustain. Energy Rev. 2021, 138, 110512. [Google Scholar] [CrossRef]
- Huang, K.; Wu, Y.; Wang, C.; Xie, Y.; Yang, C.; Gui, W. A projective and discriminative dictionary learning for high-dimensional process monitoring with industrial applications. IEEE Trans. Ind. Inform. 2021, 17, 558–568. [Google Scholar] [CrossRef]
- Stief, A.; Ottewill, J.R.; Baranowski, J.; Orkisz, M. A PCA and two-stage Bayesian sensor fusion approach for diagnosing electrical and mechanical faults in induction motors. IEEE Trans. Ind. Electron. 2019, 66, 9510–9520. [Google Scholar] [CrossRef]
- Zhou, P.; Zhang, R.; Xie, J.; Liu, J.; Wang, H.; Chai, T. Data-driven monitoring and diagnosing of abnormal furnace conditions in blast furnace ironmaking: An integrated PCA-ICA method. IEEE Trans. Ind. Electron. 2021, 68, 622–631. [Google Scholar] [CrossRef]
- Wolf, R.C.; Rashidi, M.; Fritze, S.; Kubera, K.M.; Northoff, G.; Sambataro, F.; Calhoun, V.D.; Geiger, L.S.; Tost, H.; Hirjak, D. A neural signature of parkinsonism in patients with schizophrenia spectrum disorders: A multimodal MRI study using parallel ICA. Schizophr. Bull. 2020, 46, 999–1008. [Google Scholar] [CrossRef]
- Lina; Arisandi, D. Vowel Recognition Based on Face Images Using Fisher Linear Discriminant Analysis. IOP Conf. Ser. Mater. Sci. Eng. 2020, 852, 012130. [Google Scholar] [CrossRef]
- Liu, L.; Chu, M.; Gong, R.; Zhang, L. An improved nonparallel support vector machine. IEEE Trans. Neural Netw. Learn. Syst. 2021, 32, 5129–5143. [Google Scholar] [CrossRef] [PubMed]
- Li, W.; Chen, Y.; Song, Y. Boosted K-nearest neighbor classifiers based on fuzzy granules. Knowl.-Based Syst. 2020, 195, 105606. [Google Scholar] [CrossRef]
- Acheampong, A.O.; Boateng, E.B. Modelling carbon emission intensity: Application of artificial neural network. J. Clean. Prod. 2019, 225, 833–856. [Google Scholar] [CrossRef]
- Ragab, A.; El-Koujok, M.; Poulin, B.; Amazouz, M.; Yacout, S. Fault diagnosis in industrial chemical processes using interpretable patterns based on Logical Analysis of Data. Expert Syst. Appl. 2018, 95, 368–383. [Google Scholar] [CrossRef]
- Zhang, S.; Bi, K.; Qiu, T. Bidirectional recurrent neural network-based chemical process fault diagnosis. Ind. Eng. Chem. Res. 2019, 59, 824–834. [Google Scholar] [CrossRef]
- Wang, Y.; Pan, Z.; Yuan, X.; Yang, C.; Gui, W. A novel deep learning based fault diagnosis approach for chemical process with extended deep belief network. ISA Trans. 2020, 96, 457–467. [Google Scholar] [CrossRef]
- Wang, N.; Yang, F.; Zhang, R.; Gao, F. Intelligent Fault Diagnosis for Chemical Processes Using Deep Learning Multimodel Fusion. IEEE Trans. Cybern. 2022, 52, 7121–7135. [Google Scholar] [CrossRef] [PubMed]
- Zhu, H.; Lu, L.; Yao, J.; Dai, S.; Hu, Y. Fault diagnosis approach for photovoltaic arrays based on unsupervised sample clustering and probabilistic neural network model. Sol. Energy 2018, 176, 395–405. [Google Scholar] [CrossRef]
- Yao, Y.; Wang, N. Fault diagnosis model of adaptive miniature circuit breaker based on fractal theory and probabilistic neural network. Mech. Syst. Signal Process. 2020, 142, 106772. [Google Scholar] [CrossRef]
- Ahmadipour, M.; Hizam, H.; Othman, M.L.; Radzi, M.A. Islanding detection method using ridgelet probabilistic neural network in distributed generation. Neurocomputing 2019, 329, 188–209. [Google Scholar] [CrossRef]
- Zhou, Y.; Yang, X.; Tao, L.; Yang, L. Transformer Fault Diagnosis Model Based on Improved Gray Wolf Optimizer and Probabilistic Neural Network. Energies 2021, 14, 3029. [Google Scholar] [CrossRef]
- Lashkari Ahangarani, M.; Ostadmahdi Aragh, N.; Mojeddifar, S.; Hemmati Chegeni, M. A combination of probabilistic neural network (PNN) and particle swarm optimization (PSO) algorithms to map hydrothermal alteration zones using ASTER data. Earth Sci. Inform. 2020, 13, 929–937. [Google Scholar] [CrossRef]
- Chen, M.; Shi, H.; Wu, J. Research on Transformer Fault Diagnosis Based on Sparrow Algorithm Optimization Probabilistic Neural Network. In Proceedings of the ICIIP 2021: 2021 6th International Conference on Intelligent Information Processing, Bucharest, Romania, 29–31 July 2021; Association for Computing Machinery: New York, NY, USA, 2021; pp. 254–259. [Google Scholar] [CrossRef]
- Qais, M.H.; Hasanien, H.M.; Alghuwainem, S. Enhanced salp swarm algorithm: Application to variable speed wind generators. Eng. Appl. Artif. Intell. 2019, 80, 82–96. [Google Scholar] [CrossRef]
- Shehab, M.; Abualigah, L.; Al Hamad, H.; Alabool, H.; Alshinwan, M.; Khasawneh, A.M. Moth–flame optimization algorithm: Variants and applications. Neural Comput. Appl. 2020, 32, 9859–9884. [Google Scholar] [CrossRef]
- Nemati, S.; Basiri, M.E.; Ghasem-Aghaee, N.; Aghdam, M.H. A novel ACO–GA hybrid algorithm for feature selection in protein function prediction. Expert Syst. Appl. 2009, 36, 12086–12094. [Google Scholar] [CrossRef]
- Aghdam, M.H.; Ghasem-Aghaee, N.; Basiri, M.E. Text feature selection using ant colony optimization. Expert Syst. Appl. 2009, 36, 6843–6853. [Google Scholar] [CrossRef]
- Huang, C.L.; Dun, J.F. A distributed PSO–SVM hybrid system with feature selection and parameter optimization. Appl. Soft Comput. 2008, 8, 1381–1391. [Google Scholar] [CrossRef]
- Kothari, V.; Anuradha, J.; Shah, S.; Mittal, P. A Survey on Particle Swarm Optimization in Feature Selection. In Proceedings of the Global Trends in Information Systems and Software Applications, Vellore, TN, India, 9–11 December 2012; Krishna, P.V., Babu, M.R., Ariwa, E., Eds.; Springer: Berlin/Heidelberg, Germany, 2012; pp. 192–201. [Google Scholar] [CrossRef]
- Xue, Y.; Zhang, L.; Wang, B.; Zhang, Z.; Li, F. Nonlinear feature selection using Gaussian kernel SVM-RFE for fault diagnosis. Appl. Intell. 2018, 48, 3306–3331. [Google Scholar] [CrossRef]
- Ding, X.; Yang, F.; Ma, F. An Efficient Model Selection for Linear Discrimination Function-based Recursive Feature Elimination. J. Biomed. Inform. 2022, 129, 104070. [Google Scholar] [CrossRef]
- Zhang, F.; Petersen, M.; Johnson, L.; Hall, J.; O’Bryant, S.E. Recursive Support Vector Machine Biomarker Selection for Alzheimer’s Disease. J. Alzheimer’s Dis. 2021, 79, 1691–1700. [Google Scholar] [CrossRef]
- Liu, Z.; Mi, M.; Li, X.; Zheng, X.; Wu, G.; Zhang, L. A lncRNA prognostic signature associated with immune infiltration and tumour mutation burden in breast cancer. J. Cell. Mol. Med. 2020, 24, 12444–12456. [Google Scholar] [CrossRef] [PubMed]
- Naorem, L.D.; Prakash, V.S.; Muthaiyan, M.; Venkatesan, A. Comprehensive analysis of dysregulated lncRNAs and their competing endogenous RNA network in triple-negative breast cancer. Int. J. Biol. Macromol. 2020, 145, 429–436. [Google Scholar] [CrossRef] [PubMed]
- Shi, Q.; Zhang, H. Fault diagnosis of an autonomous vehicle with an improved SVM algorithm subject to unbalanced datasets. IEEE Trans. Ind. Electron. 2021, 68, 6248–6256. [Google Scholar] [CrossRef]
- Yu, L.; Han, Y.; Mu, L. Improved quantum evolutionary particle swarm optimization for band selection of hyperspectral image. Remote Sens. Lett. 2020, 11, 866–875. [Google Scholar] [CrossRef]
- Mirjalili, S.; Gandomi, A.H.; Mirjalili, S.Z.; Saremi, S.; Faris, H.; Mirjalili, S.M. Salp Swarm Algorithm: A bio-inspired optimizer for engineering design problems. Adv. Eng. Softw. 2017, 114, 163–191. [Google Scholar] [CrossRef]
- Abadi, M.Q.H.; Rahmati, S.; Sharifi, A.; Ahmadi, M. HSSAGA: Designation and scheduling of nurses for taking care of COVID-19 patients using novel method of hybrid salp swarm algorithm and genetic algorithm. Appl. Soft Comput. 2021, 108, 107449. [Google Scholar] [CrossRef]
- Zhang, H.; Liu, T.; Ye, X.; Heidari, A.A.; Liang, G.; Chen, H.; Pan, Z. Differential evolution-assisted salp swarm algorithm with chaotic structure for real-world problems. Eng. Comput. 2022, 1–35. [Google Scholar] [CrossRef]
- Kanazawa, K.; Sano, T.G.; Cairoli, A.; Baule, A. Loopy Lévy flights enhance tracer diffusion in active suspensions. Nature 2020, 579, 364–367. [Google Scholar] [CrossRef] [Green Version]
- Alweshah, M.; Alkhalaileh, S.; Al-Betar, M.A.; Bakar, A.A. Coronavirus herd immunity optimizer with greedy crossover for feature selection in medical diagnosis. Knowl.-Based Syst. 2022, 235, 107629. [Google Scholar] [CrossRef]
- Tarkhaneh, O.; Shen, H. Training of feedforward neural networks for data classification using hybrid particle swarm optimization, Mantegna Lévy flight and neighborhood search. Heliyon 2019, 5, e01275. [Google Scholar] [CrossRef]
- Chadha, G.S.; Panambilly, A.; Schwung, A.; Ding, S.X. Bidirectional deep recurrent neural networks for process fault classification. ISA Trans. 2020, 106, 330–342. [Google Scholar] [CrossRef]
- Hao, H.; Zhang, K.; Ding, S.X.; Chen, Z.; Lei, Y. A data-driven multiplicative fault diagnosis approach for automation processes. ISA Trans. 2014, 53, 1436–1445. [Google Scholar] [CrossRef]
- Hajihosseini, P.; Anzehaee, M.M.; Behnam, B. Fault detection and isolation in the challenging Tennessee Eastman process by using image processing techniques. ISA Trans. 2018, 79, 137–146. [Google Scholar] [CrossRef]
- Zou, W.; Xia, Y.; Li, H. Fault diagnosis of Tennessee-Eastman process using orthogonal incremental extreme learning machine based on driving amount. IEEE Trans. Cybern. 2018, 48, 3403–3410. [Google Scholar] [CrossRef]
- Yang, X.; Zhou, J.; Xie, Z.; Ke, G. Chemical process fault diagnosis based on enchanted machine-learning approach. Can. J. Chem. Eng. 2019, 97, 3074–3086. [Google Scholar] [CrossRef]
- Xie, Z.; Yang, X.; Li, A.; Ji, Z. Fault diagnosis in industrial chemical processes using optimal probabilistic neural network. Can. J. Chem. Eng. 2019, 97, 2453–2464. [Google Scholar] [CrossRef]
- Xu, L.; Raitoharju, J.; Iosifidis, A.; Gabbouj, M. Saliency-Based Multilabel Linear Discriminant Analysis. IEEE Trans. Cybern. 2021, 1–14. [Google Scholar] [CrossRef]
- Wang, X.; Li, X.; Ma, R.; Li, Y.; Wang, W.; Huang, H.; Xu, C.; An, Y. Quadratic discriminant analysis model for assessing the risk of cadmium pollution for paddy fields in a county in China. Environ. Pollut. 2018, 236, 366–372. [Google Scholar] [CrossRef]
- Zhang, J.; Wang, T.; Ng, W.W.; Pedrycz, W. KNNENS: A k-Nearest Neighbor Ensemble-Based Method for Incremental Learning Under Data Stream With Emerging New Classes. IEEE Trans. Neural Netw. Learn. Syst. 2022, 1–8. [Google Scholar] [CrossRef]
- Tekin, S.; Guner, E.D.; Cilek, A.; Unal Cilek, M. Selection of renewable energy systems sites using the MaxEnt model in the Eastern Mediterranean region in Turkey. Environ. Sci. Pollut. Res. 2021, 28, 51405–51424. [Google Scholar] [CrossRef]
- Wu, X.; Zuo, W.; Lin, L.; Jia, W.; Zhang, D. F-SVM: Combination of Feature Transformation and SVM Learning via Convex Relaxation. IEEE Trans. Neural Netw. Learn. Syst. 2018, 29, 5185–5199. [Google Scholar] [CrossRef]
- Qu, Z.; Mao, W.; Zhang, K.; Zhang, W.; Li, Z. Multi-step wind speed forecasting based on a hybrid decomposition technique and an improved back-propagation neural network. Renew. Energy 2019, 133, 919–929. [Google Scholar] [CrossRef]

| Category | Description | Type |
|---|---|---|
| 1 | A/C Feed ratio, B composition constant (Stream 4) | Step |
| 2 | B composition, A/C ratio constant (Stream 4) | Step |
| 3 | D feed temperature (Stream 2) | Step |
| 4 | Reactor cooling water inlet temperature | Step |
| 5 | Condenser cooling water inlet temperature | Step |
| 6 | A feed loss (Stream 1) | Step |
| 7 | C header pressure loss (Stream 4) | Step |
| 8 | A, B, C, feed composition (Stream 4) | Random variation |
| 9 | D feed temperature (Stream 2) | Random variation |
| 10 | C feed temperature (Stream 4) | Random variation |
| 11 | Reactor cooling water inlet temperature | Random variation |
| 12 | Condenser cooling water inlet temperature | Random variation |
| 13 | Reaction kinetics | Slow drift |
| 14 | Reactor cooling water valve | Sticking |
| 15 | Condenser cooling water valve | Sticking |
| 16–20 | Unknown | Unknown |
| 21 | Valve (Stream 4) | Constant position |
| NO. | Process Measurements | NO. | Process Measurements |
|---|---|---|---|
| 1 | A feed | 27 | E in reactor feed |
| 2 | D feed | 28 | F in reactor feed |
| 3 | E feed | 29 | A in reactor feed |
| 4 | Total feed | 30 | B in reactor feed |
| 5 | Recycle flow | 31 | C in reactor feed |
| 6 | Reactor feed rate | 32 | D in reactor feed |
| 7 | Reactor pressure | 33 | E in reactor feed |
| 8 | Reactor level | 34 | F in reactor feed |
| 9 | Reactor temperature | 35 | G in reactor feed |
| 10 | Purge rate | 36 | H in reactor feed |
| 11 | Product separator temperature | 37 | D in product flow |
| 12 | Product separator level | 38 | E in product flow |
| 13 | Product separator pressure | 39 | F in product flow |
| 14 | Product separator underflow | 40 | G in product flow |
| 15 | Stripper level | 41 | H in product flow |
| 16 | Stripper pressure | 42 | D feed flow valve |
| 17 | Stripper underflow | 43 | E feed flow valve |
| 18 | Stripper temperature | 44 | A feed flow valve |
| 19 | Stripper steam flow | 45 | Total feed flow valve |
| 20 | Compressor work | 46 | Compressor recycle valve |
| 21 | Reactor cooling water outlet temperature | 47 | Purge valve |
| 22 | Separator cooling water outlet temperature | 48 | Separator pot liquid flow valve |
| 23 | A in reactor is feed | 49 | Stripper liquid product flow valve |
| 24 | B in reactor is feed | 50 | Stripper steam valve |
| 25 | C in reactor is feed | 51 | Reactor cooling water flow |
| 26 | D in reactor is feed | 52 | Condenser cooling water flow |
| Category | Feature | Category | Feature | Category | Feature |
|---|---|---|---|---|---|
| 1 | 18,16,7,46,44 | 8 | 50,19,18,13,16 | 15 | 17,52,18,7,20 |
| 2 | 10,7,47,20,19 | 9 | 52,17,13,7,19 | 16 | 17,52,48,12,7 |
| 3 | 52,17,11,19,18 | 10 | 13,7,50,19,18 | 17 | 21,7,13,9,51 |
| 4 | 51,9,21,18,19 | 11 | 52,17,48,12,16 | 18 | 52,17,50,18,20 |
| 5 | 52,17,11,19,18 | 12 | 7,13,50,19,16 | 19 | 52,17,48,12,20 |
| 6 | 1,44,36,26,10 | 13 | 50,19,13,52,17 | 20 | 52,17,13,7,20 |
| 7 | 45,7,35,25,16 | 14 | 52,17,51,9,13 | 21 | 17,52,19,18,50 |
| Category | Feature | Category | Feature | Category | Feature |
|---|---|---|---|---|---|
| 1 | 1,20,22,44,46 | 8 | 16,29,38,40,41 | 15 | 16,19,20,39,40 |
| 2 | 10,34,39,46,47 | 9 | 19,25,31,38,50 | 16 | 18,19,38,46,50 |
| 3 | 18,20,37,40,41 | 10 | 18,19,31,38,50 | 17 | 21,38,46,50,51 |
| 4 | 19,38,47,50,51 | 11 | 7,9,13,38,51 | 18 | 16,19,22,41,50 |
| 5 | 17,18,38,50,52 | 12 | 4,11,18,19,35 | 19 | 5,13,20,46,50 |
| 6 | 1,20,37,44,46 | 13 | 7,18,19,39,50 | 20 | 19,39,41,46,50 |
| 7 | 19,38,45,46,50 | 14 | 9,11,21,38,50 | 21 | 7,16,19,45,50 |
| Category | Feature | Category | Feature | Category | Feature |
|---|---|---|---|---|---|
| 1 | 40,42,13,44,18 | 8 | 17,24,28,34,52 | 15 | 28,29,34,39,35 |
| 2 | 5,29,40,47,51 | 9 | 28,29,34,38,41 | 16 | 24,26,29,33,40 |
| 3 | 19,18,37,41,40 | 10 | 25,28,29,34,35 | 17 | 7,50,20,23,38 |
| 4 | 29,35,40,42,51 | 11 | 19,7,27,39,16 | 18 | 4,17,22,32,52 |
| 5 | 8,17,22,35,52 | 12 | 3,44,13,20,47 | 19 | 18,25,29,32,35 |
| 6 | 46,26,13,16,20 | 13 | 13,16,24,50,41 | 20 | 7,37,14,41,35 |
| 7 | 7,16,20,31,45 | 14 | 21,51,43,29,25 | 21 | 11,18,35,37,50 |
| Category | PSO-SVM-RFE | SVM-RFE | RFtb | Unoptimized |
|---|---|---|---|---|
| 1 | 0.99 | 1.00 | 0.93 | 0.99 |
| 2 | 0.99 | 0.99 | 0.99 | 0.99 |
| 3 | 0.98 | 0.69 | 0.98 | 0.85 |
| 4 | 1.00 | 1.00 | 1.00 | 1.00 |
| 5 | 1.00 | 1.00 | 0.93 | 0.83 |
| 6 | 0.99 | 1.00 | 1.00 | 0.99 |
| 7 | 1.00 | 1.00 | 1.00 | 1.00 |
| 8 | 0.83 | 0.96 | 0.99 | 0.91 |
| 9 | 0.87 | 0.71 | 0.82 | 0.84 |
| 10 | 0.82 | 0.91 | 0.96 | 0.77 |
| 11 | 0.84 | 0.64 | 0.91 | 0.75 |
| 12 | 0.94 | 0.95 | 0.97 | 0.90 |
| 13 | 0.98 | 0.87 | 1.00 | 0.94 |
| 14 | 1.00 | 0.92 | 1.00 | 0.83 |
| 15 | 0.82 | 0.94 | 0.76 | 0.80 |
| 16 | 0.86 | 0.93 | 0.62 | 0.96 |
| 17 | 0.87 | 0.73 | 0.70 | 0.86 |
| 18 | 0.88 | 0.86 | 0.95 | 0.86 |
| 19 | 0.86 | 0.71 | 0.94 | 0.77 |
| 20 | 0.80 | 0.84 | 0.85 | 0.84 |
| 21 | 0.84 | 0.79 | 0.54 | 0.82 |
| Mean | 0.91 | 0.88 | 0.90 | 0.88 |
| Category | MSSA-PNN | SSA-PNN | CS-PNN | GA-PNN | PSO-PNN | MOV-PNN | SOA-PNN | PNN |
|---|---|---|---|---|---|---|---|---|
| 1 | 1.00 | 1.00 | 1.00 | 0.99 | 0.99 | 0.99 | 0.96 | 0.99 |
| 2 | 0.98 | 0.98 | 0.98 | 0.98 | 0.98 | 0.96 | 0.97 | 0.97 |
| 3 | 0.98 | 0.94 | 0.70 | 0.70 | 0.71 | 0.72 | 0.93 | 0.66 |
| 4 | 1.00 | 1.00 | 1.00 | 1.00 | 1.00 | 0.99 | 1.00 | 0.97 |
| 5 | 1.00 | 1.00 | 0.99 | 0.99 | 0.99 | 1.00 | 0.99 | 0.67 |
| 6 | 0.99 | 0.94 | 0.98 | 0.99 | 0.89 | 0.98 | 0.90 | 0.95 |
| 7 | 1.00 | 1.00 | 1.00 | 0.97 | 1.00 | 0.66 | 1.00 | 1.00 |
| 8 | 0.80 | 0.80 | 0.82 | 0.83 | 0.84 | 0.78 | 0.80 | 0.67 |
| 9 | 0.82 | 0.79 | 0.75 | 0.82 | 0.77 | 0.70 | 0.79 | 0.65 |
| 10 | 0.79 | 0.73 | 0.81 | 0.81 | 0.82 | 0.67 | 0.73 | 0.67 |
| 11 | 0.78 | 0.79 | 0.69 | 0.63 | 0.67 | 0.74 | 0.74 | 0.67 |
| 12 | 0.88 | 0.84 | 0.59 | 0.35 | 0.94 | 0.91 | 0.76 | 0.66 |
| 13 | 0.98 | 0.96 | 0.89 | 0.76 | 0.79 | 0.90 | 0.95 | 0.82 |
| 14 | 1.00 | 1.00 | 1.00 | 1.00 | 1.00 | 1.00 | 0.99 | 1.00 |
| 15 | 0.76 | 0.76 | 0.80 | 0.72 | 0.84 | 0.72 | 0.78 | 0.66 |
| 16 | 0.78 | 0.74 | 0.80 | 0.79 | 0.80 | 0.74 | 0.69 | 0.66 |
| 17 | 0.84 | 0.83 | 0.59 | 0.72 | 0.73 | 0.75 | 0.84 | 0.66 |
| 18 | 0.84 | 0.73 | 0.83 | 0.86 | 0.82 | 0.82 | 0.85 | 0.85 |
| 19 | 0.79 | 0.77 | 0.79 | 0.76 | 0.67 | 0.72 | 0.80 | 0.65 |
| 20 | 0.71 | 0.69 | 0.62 | 0.64 | 0.64 | 0.68 | 0.71 | 0.66 |
| 21 | 0.81 | 0.83 | 0.80 | 0.79 | 0.75 | 0.83 | 0.82 | 0.66 |
| Mean | 0.88 | 0.86 | 0.83 | 0.81 | 0.84 | 0.82 | 0.86 | 0.77 |
| Category | MSSA-PNN | LDA | QDA | KNN | SVM | MaxEnt | CS-BP | |||||||
|---|---|---|---|---|---|---|---|---|---|---|---|---|---|---|
| N | F | N | F | N | F | N | F | N | F | N | F | N | F | |
| 1 | 1.00 | 1.00 | 1.00 | 0.99 | 1.00 | 0.99 | 0.51 | 0.83 | 1.00 | 0.99 | 1.00 | 0.89 | 1.00 | 0.99 |
| 2 | 0.96 | 0.99 | 1.00 | 0.95 | 1.00 | 0.98 | 0.17 | 0.81 | 1.00 | 0.98 | 0.74 | 0.29 | 0.99 | 0.97 |
| 3 | 0.96 | 0.98 | 0.55 | 0.54 | 0.78 | 0.50 | 0.39 | 0.82 | 0.00 | 1.00 | 0.84 | 0.11 | 0.46 | 0.84 |
| 4 | 1.00 | 1.00 | 1.00 | 1.00 | 1.00 | 1.00 | 0.30 | 0.86 | 1.00 | 1.00 | 0.83 | 0.59 | 1.00 | 1.00 |
| 5 | 1.00 | 1.00 | 1.00 | 0.99 | 1.00 | 1.00 | 0.23 | 0.81 | 1.00 | 1.00 | 0.79 | 0.18 | 1.00 | 1.00 |
| 6 | 1.00 | 0.99 | 1.00 | 0.96 | 1.00 | 0.99 | 0.99 | 0.97 | 1.00 | 1.00 | 1.00 | 0.24 | 0.99 | 0.99 |
| 7 | 1.00 | 1.00 | 1.00 | 1.00 | 1.00 | 1.00 | 0.44 | 0.77 | 1.00 | 1.00 | 0.89 | 0.19 | 1.00 | 1.00 |
| 8 | 0.75 | 0.83 | 0.69 | 0.50 | 0.97 | 0.90 | 0.18 | 0.81 | 0.00 | 1.00 | 0.83 | 0.22 | 0.95 | 0.90 |
| 9 | 0.72 | 0.87 | 0.53 | 0.61 | 0.54 | 0.61 | 0.32 | 0.75 | 0.00 | 1.00 | 0.84 | 0.58 | 0.25 | 0.88 |
| 10 | 0.73 | 0.82 | 0.63 | 0.47 | 0.80 | 0.57 | 0.35 | 0.81 | 0.00 | 1.00 | 0.93 | 0.53 | 0.29 | 0.81 |
| 11 | 0.66 | 0.84 | 0.50 | 0.52 | 0.71 | 0.55 | 0.30 | 0.74 | 0.00 | 1.00 | 0.84 | 0.18 | 0.46 | 0.76 |
| 12 | 0.76 | 0.94 | 0.73 | 0.50 | 0.98 | 0.95 | 0.63 | 0.80 | 0.01 | 0.67 | 0.87 | 0.10 | 0.96 | 0.94 |
| 13 | 0.97 | 0.98 | 0.80 | 0.57 | 1.00 | 0.97 | 0.87 | 0.88 | 0.23 | 0.60 | 0.91 | 0.18 | 0.98 | 0.97 |
| 14 | 1.00 | 1.00 | 0.51 | 0.50 | 1.00 | 1.00 | 0.93 | 0.93 | 0.00 | 1.00 | 0.97 | 0.15 | 1.00 | 1.00 |
| 15 | 0.64 | 0.82 | 0.58 | 0.61 | 0.68 | 0.52 | 0.30 | 0.83 | 0.00 | 1.00 | 0.87 | 0.54 | 0.13 | 0.95 |
| 16 | 0.64 | 0.86 | 0.51 | 0.52 | 0.69 | 0.49 | 0.36 | 0.84 | 0.00 | 1.00 | 0.95 | 0.58 | 0.22 | 0.85 |
| 17 | 0.79 | 0.87 | 0.48 | 0.56 | 0.79 | 0.61 | 0.30 | 0.80 | 0.00 | 1.00 | 0.89 | 0.26 | 0.56 | 0.82 |
| 18 | 0.77 | 0.88 | 1.00 | 0.81 | 1.00 | 0.87 | 0.87 | 0.86 | 1.00 | 0.88 | 0.96 | 0.62 | 0.95 | 0.88 |
| 19 | 0.63 | 0.86 | 0.53 | 0.52 | 0.65 | 0.53 | 0.23 | 0.81 | 0.00 | 1.00 | 0.74 | 0.24 | 0.22 | 0.89 |
| 20 | 0.51 | 0.80 | 0.52 | 0.57 | 0.79 | 0.59 | 0.40 | 0.82 | 0.00 | 1.00 | 0.81 | 0.34 | 0.55 | 0.83 |
| 21 | 0.74 | 0.84 | 0.67 | 0.55 | 0.90 | 0.72 | 0.34 | 0.79 | 0.00 | 1.00 | 0.74 | 0.28 | 0.71 | 0.87 |
| Mean | 0.82 | 0.91 | 0.72 | 0.68 | 0.87 | 0.78 | 0.45 | 0.83 | 0.35 | 0.96 | 0.87 | 0.35 | 0.70 | 0.91 |
| Actual Class | Predicted Class | |
|---|---|---|
| Positive | Negative | |
| Positive | True positive (TP) | False Negative (FN) |
| Negative | False positive (FP) | True Negative (TN) |
| Category | MSSA-PNN | LDA | QDA | KNN | SVM | MaxEnt | CS-BP |
|---|---|---|---|---|---|---|---|
| 1 | 1.00 | 0.99 | 1.00 | 0.72 | 0.99 | 0.93 | 0.99 |
| 2 | 0.98 | 0.97 | 0.99 | 0.59 | 0.99 | 0.44 | 0.98 |
| 3 | 0.98 | 0.54 | 0.59 | 0.67 | 0.66 | 0.36 | 0.71 |
| 4 | 1.00 | 1.00 | 1.00 | 0.67 | 1.00 | 0.68 | 1.00 |
| 5 | 1.00 | 0.99 | 1.00 | 0.62 | 1.00 | 0.39 | 1.00 |
| 6 | 0.99 | 0.98 | 1.00 | 0.98 | 1.00 | 0.49 | 0.99 |
| 7 | 1.00 | 1.00 | 1.00 | 0.66 | 1.00 | 0.42 | 1.00 |
| 8 | 0.80 | 0.56 | 0.92 | 0.59 | 0.66 | 0.41 | 0.92 |
| 9 | 0.82 | 0.58 | 0.59 | 0.62 | 0.65 | 0.67 | 0.67 |
| 10 | 0.79 | 0.52 | 0.64 | 0.65 | 0.65 | 0.66 | 0.63 |
| 11 | 0.78 | 0.51 | 0.60 | 0.60 | 0.67 | 0.41 | 0.66 |
| 12 | 0.88 | 0.58 | 0.96 | 0.74 | 0.44 | 0.37 | 0.95 |
| 13 | 0.98 | 0.65 | 0.98 | 0.88 | 0.47 | 0.44 | 0.97 |
| 14 | 1.00 | 0.51 | 1.00 | 0.93 | 0.66 | 0.44 | 1.00 |
| 15 | 0.76 | 0.60 | 0.57 | 0.65 | 0.66 | 0.66 | 0.64 |
| 16 | 0.78 | 0.52 | 0.56 | 0.68 | 0.65 | 0.71 | 0.63 |
| 17 | 0.84 | 0.53 | 0.67 | 0.63 | 0.65 | 0.49 | 0.74 |
| 18 | 0.84 | 0.88 | 0.91 | 0.86 | 0.92 | 0.74 | 0.90 |
| 19 | 0.79 | 0.53 | 0.57 | 0.62 | 0.63 | 0.40 | 0.65 |
| 20 | 0.71 | 0.56 | 0.66 | 0.67 | 0.66 | 0.49 | 0.74 |
| 21 | 0.81 | 0.59 | 0.78 | 0.64 | 0.65 | 0.43 | 0.82 |
| Mean | 0.88 | 0.69 | 0.81 | 0.70 | 0.75 | 0.52 | 0.84 |
| Category | MSSA-PNN | LDA | QDA | KNN | SVM | MaxEnt | CS-BP |
|---|---|---|---|---|---|---|---|
| 1 | 1.00 | 0.99 | 1.00 | 0.80 | 1.00 | 0.94 | 1.00 |
| 2 | 0.98 | 0.97 | 0.99 | 0.72 | 0.99 | 0.41 | 0.98 |
| 3 | 0.98 | 0.61 | 0.63 | 0.77 | 0.79 | 0.18 | 0.79 |
| 4 | 1.00 | 1.00 | 1.00 | 0.78 | 1.00 | 0.70 | 1.00 |
| 5 | 1.00 | 1.00 | 1.00 | 0.74 | 1.00 | 0.28 | 1.00 |
| 6 | 1.00 | 0.98 | 1.00 | 0.98 | 1.00 | 0.39 | 0.99 |
| 7 | 1.00 | 1.00 | 1.00 | 0.75 | 1.00 | 0.30 | 1.00 |
| 8 | 0.85 | 0.61 | 0.94 | 0.72 | 0.80 | 0.33 | 0.94 |
| 9 | 0.87 | 0.66 | 0.66 | 0.73 | 0.79 | 0.69 | 0.78 |
| 10 | 0.84 | 0.57 | 0.68 | 0.75 | 0.79 | 0.68 | 0.74 |
| 11 | 0.83 | 0.59 | 0.65 | 0.71 | 0.80 | 0.28 | 0.75 |
| 12 | 0.91 | 0.61 | 0.97 | 0.80 | 0.61 | 0.16 | 0.96 |
| 13 | 0.98 | 0.68 | 0.98 | 0.90 | 0.60 | 0.30 | 0.98 |
| 14 | 1.00 | 0.57 | 1.00 | 0.95 | 0.79 | 0.26 | 1.00 |
| 15 | 0.82 | 0.67 | 0.61 | 0.76 | 0.80 | 0.67 | 0.77 |
| 16 | 0.84 | 0.59 | 0.59 | 0.77 | 0.79 | 0.73 | 0.75 |
| 17 | 0.88 | 0.61 | 0.71 | 0.74 | 0.79 | 0.40 | 0.80 |
| 18 | 0.87 | 0.89 | 0.93 | 0.89 | 0.93 | 0.75 | 0.93 |
| 19 | 0.85 | 0.59 | 0.62 | 0.74 | 0.78 | 0.35 | 0.77 |
| 20 | 0.79 | 0.63 | 0.69 | 0.76 | 0.80 | 0.48 | 0.81 |
| 21 | 0.85 | 0.64 | 0.81 | 0.74 | 0.79 | 0.39 | 0.86 |
| Mean | 0.91 | 0.74 | 0.83 | 0.79 | 0.84 | 0.46 | 0.88 |
Publisher’s Note: MDPI stays neutral with regard to jurisdictional claims in published maps and institutional affiliations. |
© 2022 by the authors. Licensee MDPI, Basel, Switzerland. This article is an open access article distributed under the terms and conditions of the Creative Commons Attribution (CC BY) license (https://creativecommons.org/licenses/by/4.0/).
Share and Cite
Xu, H.; Ren, T.; Mo, Z.; Yang, X. A Fault Diagnosis Model for Tennessee Eastman Processes Based on Feature Selection and Probabilistic Neural Network. Appl. Sci. 2022, 12, 8868. https://doi.org/10.3390/app12178868
Xu H, Ren T, Mo Z, Yang X. A Fault Diagnosis Model for Tennessee Eastman Processes Based on Feature Selection and Probabilistic Neural Network. Applied Sciences. 2022; 12(17):8868. https://doi.org/10.3390/app12178868
Chicago/Turabian StyleXu, Haoxiang, Tongyao Ren, Zhuangda Mo, and Xiaohui Yang. 2022. "A Fault Diagnosis Model for Tennessee Eastman Processes Based on Feature Selection and Probabilistic Neural Network" Applied Sciences 12, no. 17: 8868. https://doi.org/10.3390/app12178868
APA StyleXu, H., Ren, T., Mo, Z., & Yang, X. (2022). A Fault Diagnosis Model for Tennessee Eastman Processes Based on Feature Selection and Probabilistic Neural Network. Applied Sciences, 12(17), 8868. https://doi.org/10.3390/app12178868