Article

Decoding Structure–Odor Relationship Based on Hypergraph Neural Network and Deep Attentional Factorization Machine

1
Key Laboratory of High Confidence Software Technologies of Ministry of Education, School of Computer Science, Peking University, Beijing 100871, China
2
Tencent, Beijing 100193, China
*
Author to whom correspondence should be addressed.
Appl. Sci. 2022, 12(17), 8777; https://doi.org/10.3390/app12178777
Submission received: 6 July 2022 / Revised: 25 August 2022 / Accepted: 30 August 2022 / Published: 31 August 2022
(This article belongs to the Special Issue Applied Artificial Intelligence (AI))

Abstract

:
Understanding the relationship between the chemical structure and physicochemical properties of odor molecules and olfactory perception, i.e., the structure–odor relationship, remains a decades-old, challenging task. However, the differences among the molecular structure graphs of different molecules are subtle and complex, and the molecular feature descriptors are numerous, with complex interactions that cause multiple odor perceptions. In this paper, we propose to decompose the features of the molecular structure graph into feature vectors corresponding to each odor perception descriptor to effectively explore higher-order semantic interactions between odor molecules and odor perception descriptors. We propose an olfactory perception prediction model noted as HGAFMN, which utilizes a hypergraph neural network with the olfactory lateral inhibition-inspired attention mechanism to learn the molecular structure feature from the odor molecular structure graph. Furthermore, existing methods cannot effectively extract interactive features in the large number of molecular feature descriptors, which have complex relations. To solve this problem, we add an attentional factorization mechanism to the deep neural network module and obtain a molecular descriptive feature through the deep feature combination based on the attention mechanism. Our proposed HGAFMN has achieved good results in extensive experiments and will help product design and quality assessment in the food, beverage, and fragrance industries.

1. Introduction

Odor is ubiquitous in our daily life. Odor perception descriptors, i.e., odor descriptors, are the sensory impression of a substance that people smell. In daily life, people may use daily verbal descriptors to describe odors, such as “fruity”, “flowery”, “sulfur”, etc. With the development of synthetic chemistry, odor products such as perfumes have achieved more and more extensive development and application. However, synthesizing odors first requires understanding the relationship between the chemical information of odor molecules and odor perception, which is also the key to olfactory perception research. Finding the relationship between the chemical structure and physicochemical properties of odor molecules and olfactory perception, i.e., the prediction of the quantitative structure–odor relationship (QSOR), is a challenging task.
With the development of machine learning and deep learning, data-driven methods have gradually been used to predict the relationship between the chemical structure and physicochemical properties of odor molecules and olfactory perception [1,2,3]. Li et al. [4] published a related study of the random forest-based prediction model, which won the championship in the DREAM Olfaction Prediction Challenge. The work [5] is based on the graph neural network (GNN) to predict the odor descriptors of odor molecules, which treats atoms as nodes, bonds as edges, and constructs molecules as graph structures. However, this graph structure construction method is less effective for predicting olfactory perception of molecules with similar structures but different odors. This problem can be better solved by considering the “physicochemical odor space”, i.e., adding molecular feature descriptors that are important for odor prediction. The work [6] combines a simple deep neural network (DNN) and Xception-based convolutional neural network (CNN) to predict odor descriptors using molecular feature descriptors and molecular structure graphs and achieves relatively good results. However, the differences among the structural graphs of different molecules are subtle and complex. For example, single, double, and triple chemical bonds are likely to be identified inaccurately in complex molecules with different odors. In addition, the structural complexity of different molecules varies widely, some are very simple and some are very complex.
In the field of olfactory perception, each odor molecule has multiple odor descriptors, and each odor descriptor also corresponds to multiple odor molecules. The olfactory perception prediction problem can be regarded as a multi-label classification problem. Unlike single-label classification, multi-label tasks are more challenging because of two problems: the association of multi-labels with regions in the molecular structure graph, and the correlation between multi-labels. In recent years, graph neural networks have attracted extensive attention in various research fields and achieved remarkable performance. Most of the graph neural network models assume that the research objects are pairwise relationships and cannot model higher-order semantic dependencies. However, in the field of olfactory perception, the relationship between odor molecules and odor descriptors is high-order and goes beyond the pairwise relationship, so the simple graph structure cannot adequately describe this kind of relationship. Hypergraph [7,8] is more convenient for modeling higher-order data, so we model odor molecule–odor descriptor relationship data as a hypergraph structure that can better encode higher-order data correlations. To the best of our knowledge, there is no work on modeling this relation as a hypergraph structure. We decompose the features of molecular structure graphs into feature vectors corresponding to each odor descriptor and associate these vectors with hypergraph neural networks to explore higher-order semantic interactions.
Lateral inhibition mechanism of animal olfaction [9,10] refers to the process in which active neurons inhibit the activity of adjacent neurons by inhibiting connections. In this process, the most active olfactory processing channels will stand out. The lateral inhibition mechanism of animal olfaction plays a very important role in the sharpening and anti-interference ability of animal olfactory recognition [11]. To imitate the process of animal olfaction, we add a lateral inhibition-inspired attention map to the convolution module of the olfactory perception model. We utilize a convolutional neural network with an olfactory lateral inhibition-inspired attention mechanism to extract the features of the molecular structure graph. In more detail, the lateral inhibition mechanism is embedded in the gradient calculation of the convolutional neural network to improve the anti-interference ability of the model. In the backpropagation of the convolutional neural network, lateral inhibition is introduced into the hidden neurons of the same layer.
In order to effectively explore the high-order semantic interactions between odor molecules and odor descriptors and improve the anti-interference ability of the model, we propose to extract the features of the molecular structure graph using the convolutional neural network with a lateral inhibition-inspired attention mechanism, and then decompose the features of the molecular structure graph into feature vectors corresponding to each odor descriptor. These vectors are then associated through the hypergraph neural network to learn molecular structure feature vectors from the odor molecular structure graph. We utilize hypergraph neural networks to learn the relationship between molecular structure graphs and olfactory perception, which can further enhance the ability of expression learning to improve the prediction accuracy of olfactory perception.
In addition to the odor molecular structure graphs, “physicochemical odor space” also plays a very important role in olfactory perception prediction [12,13]. For this purpose, a large number (tens of thousands) of chemical and physical molecular properties, so-called molecular feature descriptors, are calculated using specific software (e.g., PaDEL-descriptor [14]). In order to deal with the resulting high-dimensional properties space, statistical decomposition is usually used to obtain the most important dimensions [15,16]. A large number of feature descriptors, such as electronic properties and flexibility of odor molecules, and their complex interactions reveal the drawbacks of traditional deep neural networks. Furthermore, not all feature interactions contribute equally to odor classification. To solve these problems, we add an attentional factorization mechanism to the deep neural network, which can effectively learn the weighted interactions between various features and obtain the molecular descriptive features through the deep feature combination based on the attention mechanism.
In this paper, we propose an olfactory perception prediction model, noted as HGAFMN, which is a computational framework for classifying and predicting odor molecules. The features of the molecular structure graph are first extracted by the convolutional neural network with a lateral inhibition-inspired attention mechanism, and the features of the molecular structure graph are decomposed into feature vectors corresponding to each odor descriptor. Then these vectors are associated through the hypergraph neural network to learn the molecular structure features from the odor molecular structure graph. In addition, we use the Deep Attentional Factorization Machine model (DeepAFM) to learn the importance of the feature interaction through the attention mechanism and effectively learn the weighted interactions between the molecular descriptive features to learn the molecular descriptive features from the molecular feature descriptors. It can predict the odor perception of a given odor molecule and help to understand the general mechanism of the relationship between the chemical structure and physicochemical properties of odor molecules and olfactory perception, which can play a positive role in the development of synthetic fragrance and other industries.
The main contributions of this paper can be summarized as follows:
(1)
We propose a neural network model based on hypergraph neural networks and a deep attentional factorization machine for olfactory perception prediction, solving the complex interactions problem of the large number of molecular feature descriptors which is difficult for the existing methods to deal with.
(2)
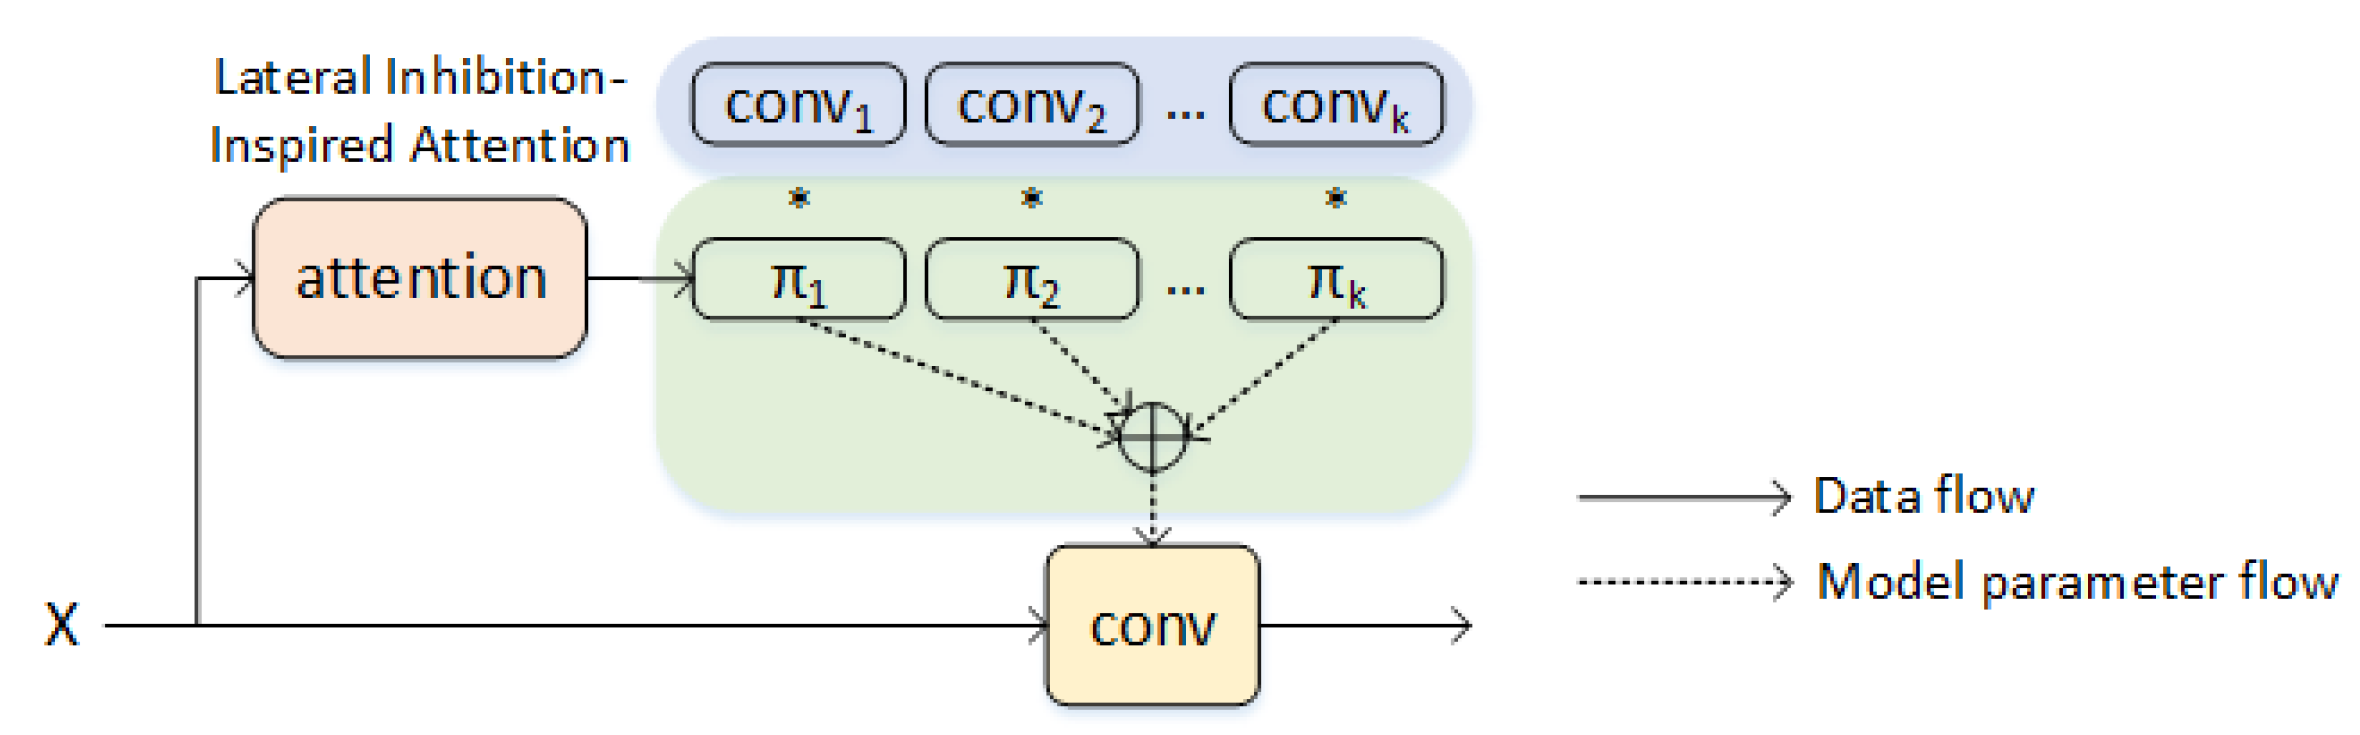
Imitating the olfactory lateral inhibition of animals, we add a lateral inhibition-inspired attention mechanism to the convolutional neural network of the feature-semantic interaction module of molecule-odor descriptor to improve the prediction accuracy of olfactory perception.
(3)
We conduct experiments on real-world datasets. Experimental results show that our proposed HGAFMN achieves good results in olfactory perception prediction.
The remainder of this paper is organized as follows. Section 2 presents the related work. Section 3 introduces the dataset used in this work and the details of the proposed model LIFMCN. Experiments and results are discussed in Section 4. Finally, Section 5 concludes the paper.

2. Related Work

2.1. Quantitative Structure–Odor Relationship

In the human cerebral cortex, the interpretation of neural signals produces a representation called “odor”, which is described semantically by various perceptual descriptors, such as “floral”, “sulphurous”, etc. The construction of olfactory perception prediction models, especially the quantitative structure–odor relationship (QSOR) prediction, has always been one of the difficulties in the field of olfactory research. Early research suggested that human perception of odor is determined by different molecular structures, such as functional groups, molecular size, carbon chain length, and covalent bond type [17], and reached some meaningful conclusions. For example, sulfur atoms in odor molecules are highly correlated with odor descriptors such as “garlic” and “fishy”. Furthermore, the more complex the molecular structure, the stronger the pleasant properties of the smell [18]. However, there are many physicochemical properties of odor molecules, and the relationships between them and olfactory perception are complex nonlinear relationships. Therefore, the development of QSOR is currently slow. With the development of computer technology, QSOR has gradually attracted people’s attention and has become a research hotspot. Data-driven olfactory perception prediction methods need to be researched on the basis of olfactory-related chemical or biological information. Input features for these studies include chemical molecular descriptors (CMD), electronic nose signals, gas chromatography (GC), electroencephalogram (EEG), physiological signals, and so on.
With the rapid development of machine learning and deep learning, the application of deep neural networks in many fields has attracted great attention. In 2015, the DREAM Olfaction Prediction Challenge was successfully held. A total of 476 odorants (i.e., the well-known DREAM dataset) were provided in the challenge, and the 4884-dimensional chemical molecular feature descriptors (CMDs) of these odorants were used to score 21 odor perception descriptors for individuals and groups. Subsequently, Li et al. [4] published a related study of the random forest-based prediction model, which won the championship in the DREAM Olfaction Prediction Challenge. It uses random forest as a prediction model to predict the scores of 21 odor perception descriptors and uses the feature selection function of random forest to find the 15 most important features of olfactory perception. Gutierrez et al. [19] applied natural language semantic representation to odor perception descriptors, which more accurately inferred the perceptual ratings of single-molecule odorants on a large set of odor perception descriptors. By treating atoms as nodes and chemical bonds as edges, Sanchez et al. [5] proposed the GNN-QSOR model, which uses a graph neural network (GNN)-based approach to predict odor perception descriptors for odor molecules. Similarly, Qiu et al. [20] also regarded atoms as nodes and chemical bonds as edges and proposed the Odor-GCN model, which is a graph convolutional network model for predicting odor impressions based on molecular structure. Shang et al. [21] proposed a SOR prediction approach based on odor descriptor clustering, and molecular structure features extracted by convolutional neural networks were employed to predict the odor categories. Combining deep neural network (DNN) and convolutional neural network (CNN), ref. [6] used a simple DNN to train molecular feature descriptors and an Xception-based CNN to learn molecular structure graphs to predict odor perception descriptors, which achieved relatively good results.
Different from these above works, we imitate the lateral inhibition mechanism of animal olfaction, which plays a very important role in the anti-interference and sharping ability, and integrate the lateral inhibition mechanism into the olfactory perception prediction model. In addition, we use hypergraph neural networks to efficiently explore higher-order semantic interactions between odor molecules and odor descriptors.

2.2. Graph Neural Networks-Based Learning

In the real world, many important datasets are stored in the form of graphs, such as social network information, knowledge graphs, protein networks, molecular structures, etc. These graph networks are not structured information images but unstructured information. A graph usually contains two parts of information: one part is the adjacency matrix, which is the information about the connection relationship between nodes, and the other part is the feature matrix, which is the information about the state of the nodes. Graph Neural Networks (GNN) [22,23] is an extension of neural networks for processing graph-structured data. GNNs have become a widely used graph analysis method due to their good performance and interpretability. GNN obtains dependencies in the graph by propagating information among nodes in the network, and the node updates its own state based on the state of its neighbors.
The hypergraph is different from the simple graph. For simple graphs, the degree of each edge is limited to two, i.e., each edge is linked with two nodes, while the hypergraphs allow edges with degrees of more than two, that is, each edge can be linked with multiple nodes. Therefore, the hypergraph neural network [7,8,24] is more convenient for modeling the correlation of higher-order data. At present, the hypergraph neural network has been widely used in image classification [25,26], recommendation systems [27,28,29], disease diagnosis [30], trajectory prediction [31] and other fields.
The relationships between odor molecules and odor descriptors are higher-order and go beyond pairwise relationships. However, there is no work on modeling this relation as a hypergraph structure currently. In this paper, we use hypergraph neural networks to explore its higher-order semantic interactions and make olfactory perception predictions.

2.3. Lateral Inhibition

The lateral inhibition mechanism of animal olfaction [9] refers to the process in which active neurons inhibit the activity of neighboring neurons by inhibiting connections. That is, when a nerve cell is excited, it will have an inhibitory effect on the surrounding nerve cells, thereby inhibiting the surrounding olfactory processing channels, and the most active olfactory processing channels will stand out. The lateral inhibition mechanism of animal olfaction plays a very important role in the anti-interference ability of animal olfactory recognition [32,33,34].
The lateral inhibition mechanism has been applied to some neural network models recently. Mao and Massaquoi [35] analyzed recurrent neural networks with a lateral inhibition mechanism. They found that lateral inhibition of adjacent neurons in the same layer made the network more stable and efficient. Cao et al. [36] embedded the lateral inhibition mechanism into top-down gradient computation for general CNN classification and applied it to weakly supervised salient object detection. Pais [37] employed a novel layer inspired by the biological mechanism of lateral inhibition for the task of a multilingual complex named entity recognition.
To the best of our knowledge, there is no work using lateral inhibition for olfactory perception prediction. In this paper, we utilize a convolutional neural network with a lateral inhibition-inspired attention mechanism to extract the feature map of the molecular structure graph in the HGNN module, which is of great significance for improving the accuracy of olfactory perception prediction.

3. Materials and Methods
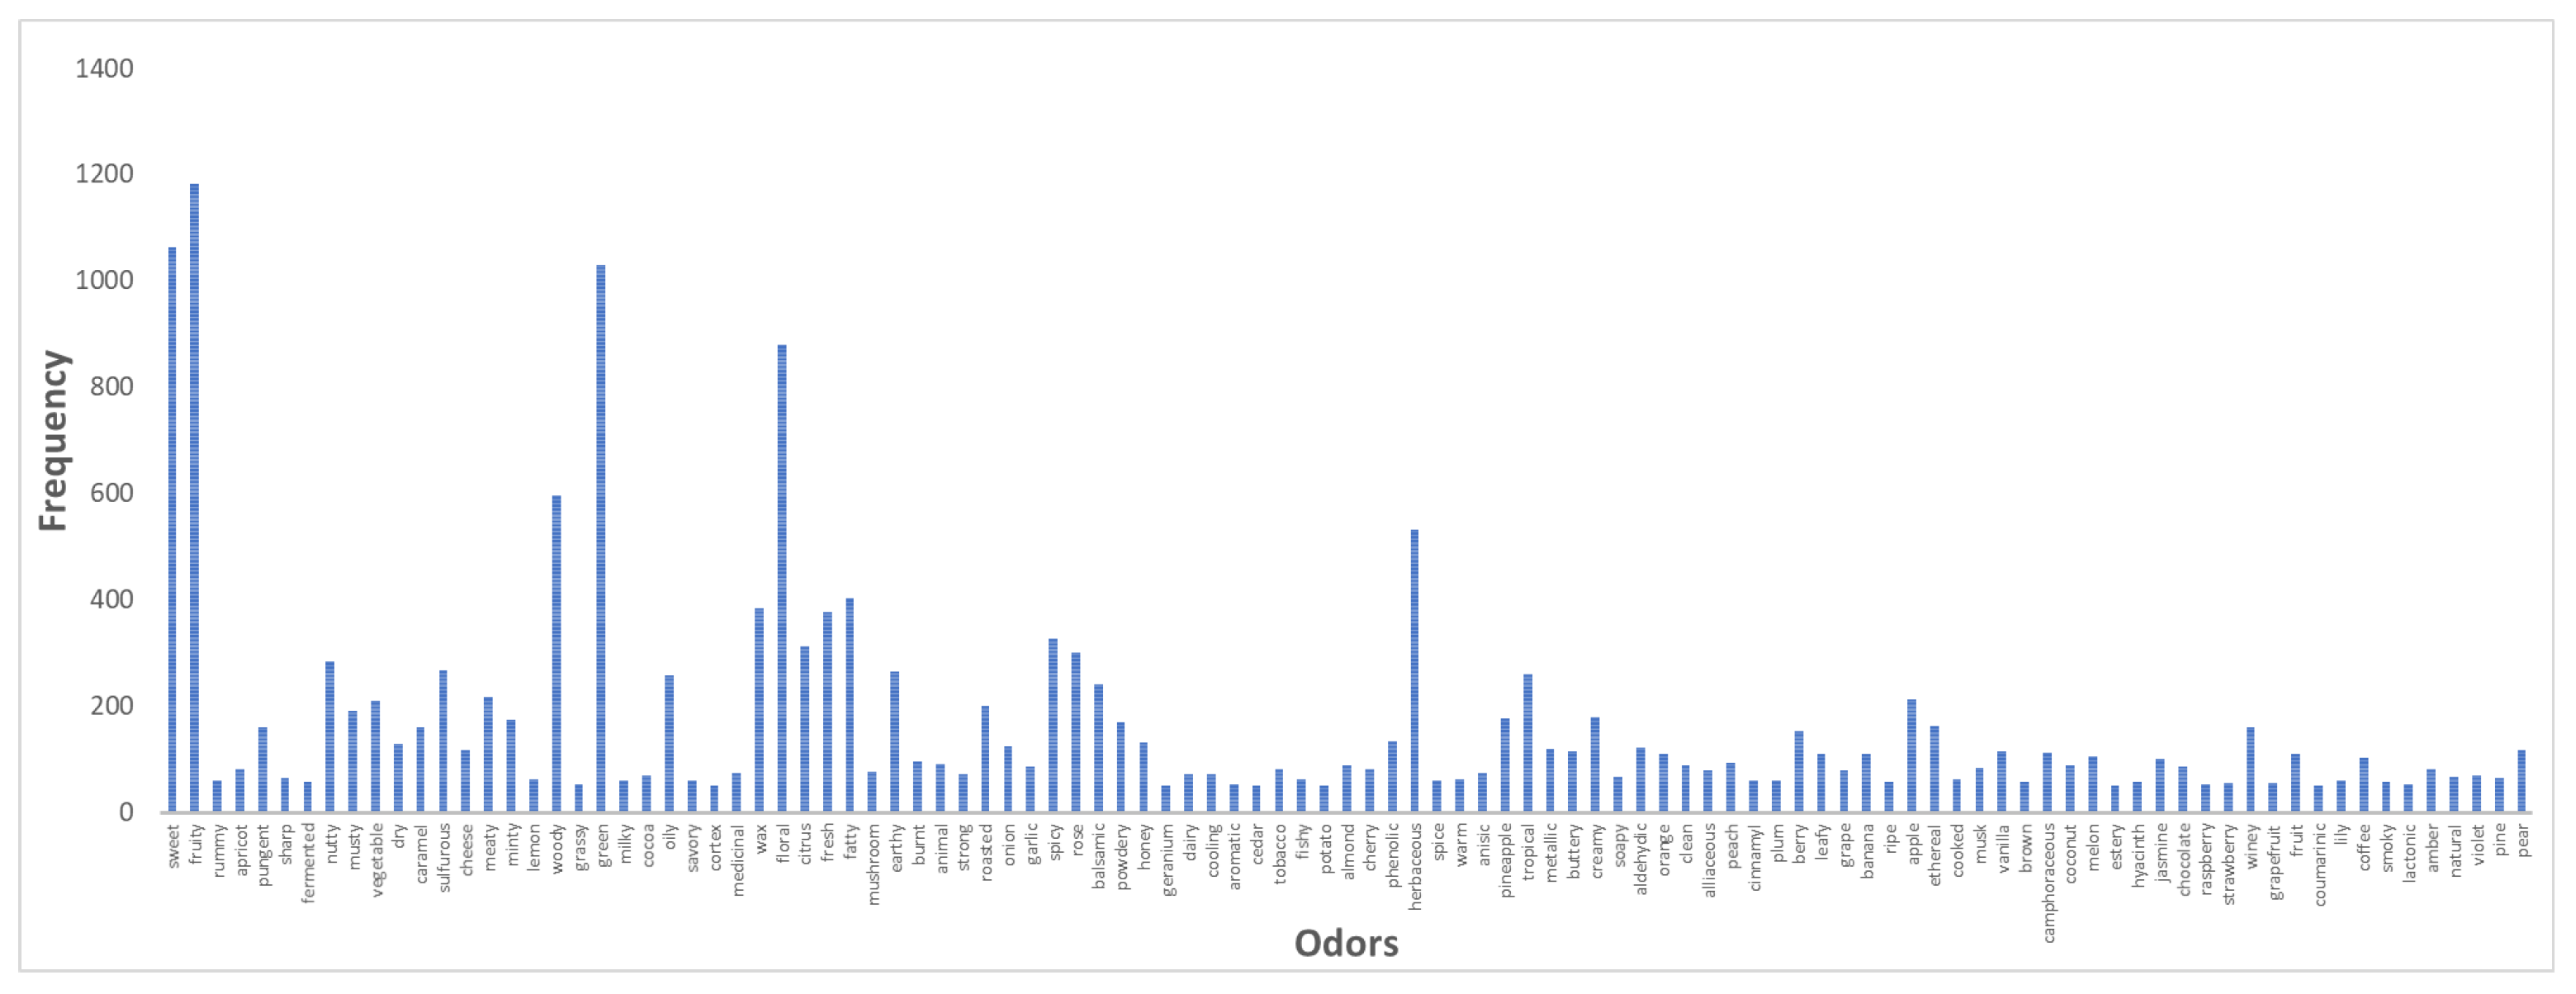
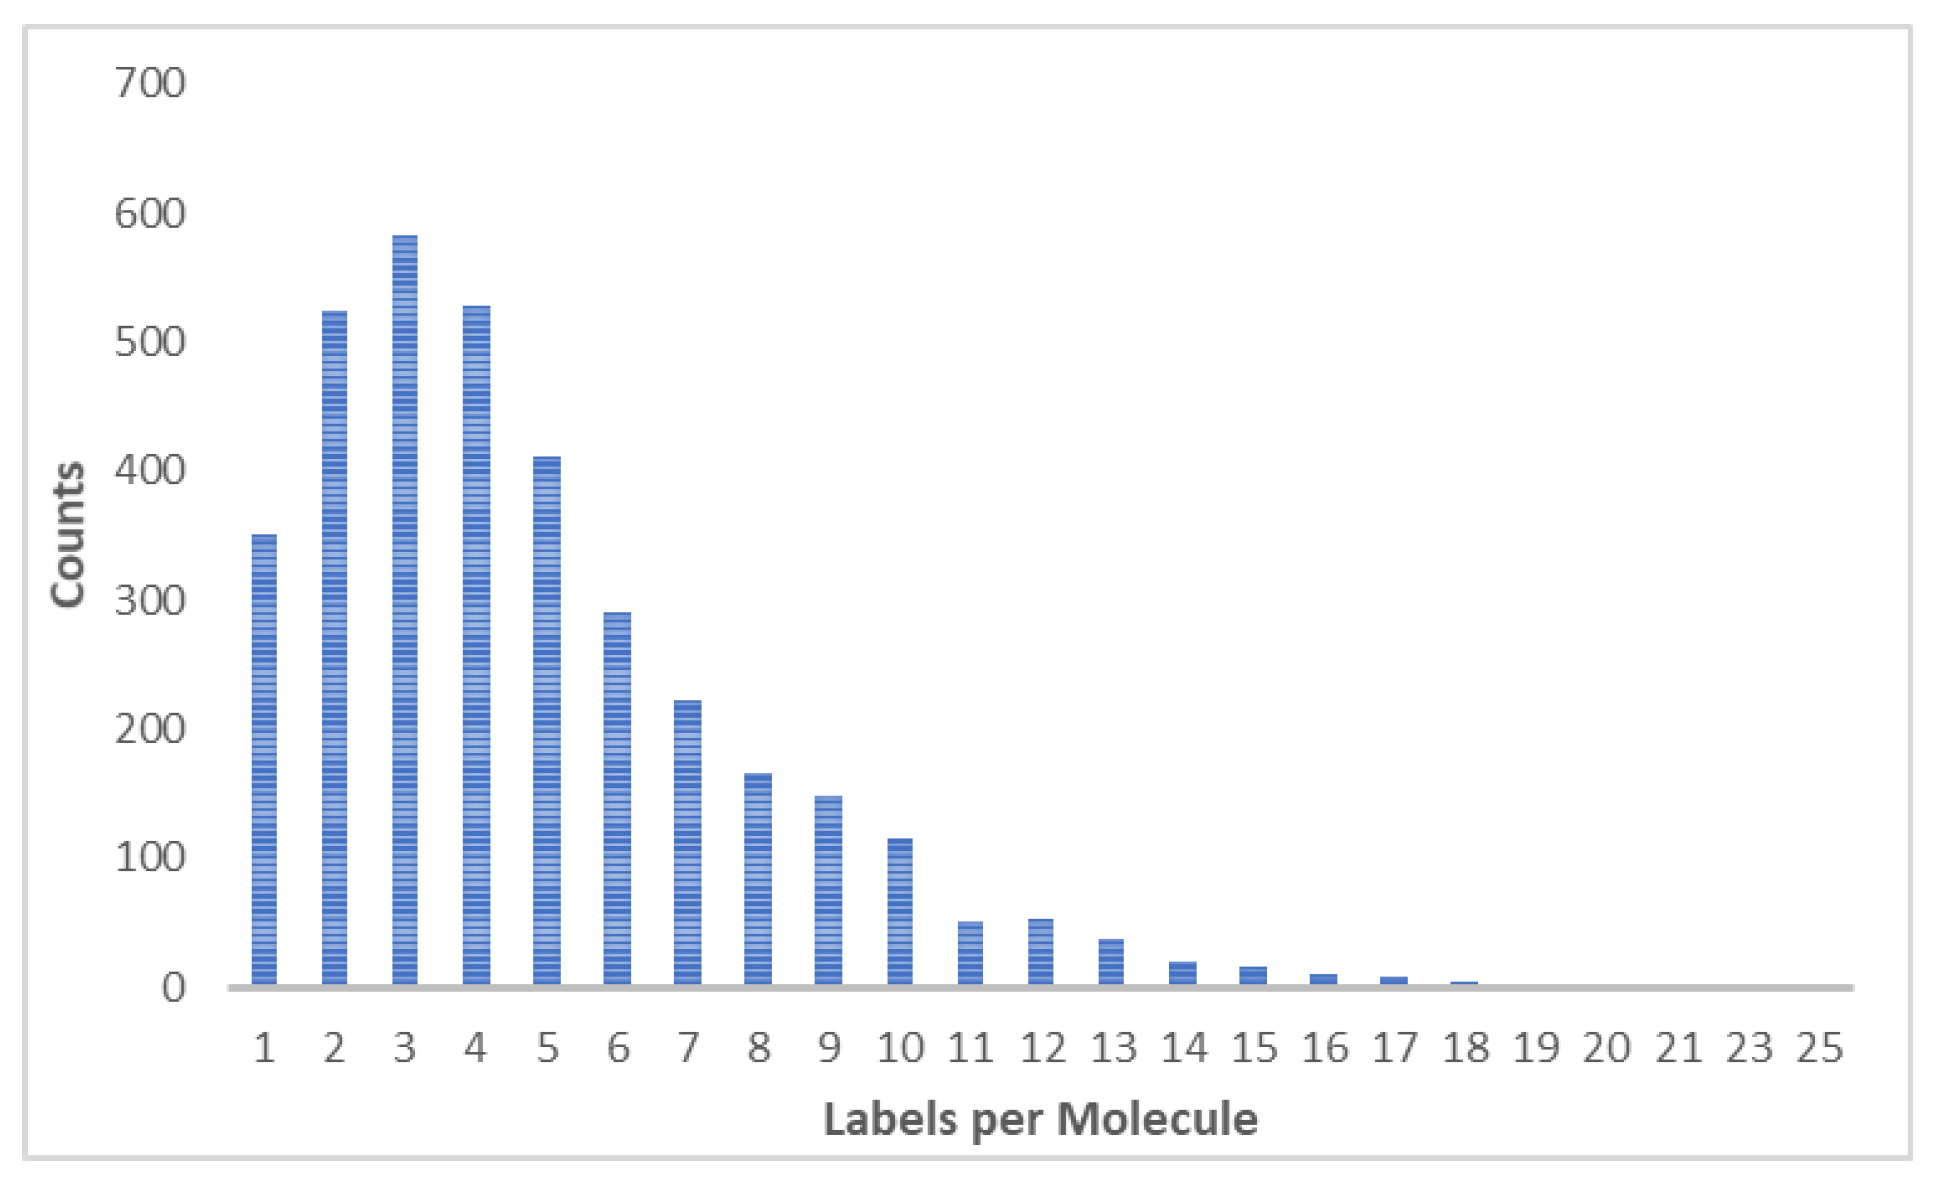
In this section, we will introduce the proposed HGAFMN model for the olfactory perception prediction task in detail, as shown in Figure 1. The overall architecture is mainly composed of two modules: the feature-semantic interaction of molecule-odor descriptor through HGNN and the weighted deep feature combination based on a deep attention factorization machine. The HGNN module is used to correlate the molecular structure features related to odor descriptors and explore the semantic interaction. It learns the molecular structure features from the molecular structure graphs. The deep attentional factorization machine is used to effectively learn the weighted interactions between the molecular descriptive features and learn the molecular descriptive features from the molecular feature descriptors.

3.1. Datasets

In this work, we collected multiple free and public olfactory perception databases, including odor datasets from OdorRactor, TGSC, Sigma Aldrich, Pubchem, Flavorbase, AromaDB, SuperScent, and Flavornet. There are mainly two types of databases: (a) databases based on individual perception estimates; (b) chemical databases encoded by one or several odor perception descriptors. Databases based on individual perception estimates include the Arctander dataset (3102 odor perceptions estimated by perfumers), the DREAM dataset (DREAM Olfactory Prediction Challenge dataset, 476 odor molecules with 19 odor descriptors evaluated by 49 participants), Dravnieks Atlas of Odor Character Profiles (138 single molecules and 16 mixtures/oils estimated by 150 participants to obtain olfactory perception described by 146 odor descriptors), Boelens Atlas, etc. The odor databases encoded by one or more odor perception descriptors include the Goods Scents Company Web Page (TGSC) (http://www.thegoodscentscompany.com/) (accessed on 1 August 2021), the Flavor-Base (FLB)-10th Edition database (http://www.leffingwell.com/flavbase.htm) (accessed on 1 August 2021), Flavornet website (http://www.flavornet.org) (accessed on 1 August 2021), Sigma-Aldrich spice catalog, SuperScent database, OdorRactor database (http://mdl.shsmu.edu.cn/ODORactor/) (accessed on 1 August 2021), AromaDB, PubChem (https://PubChem.ncbi.nlm.nih.gov/) (accessed on 1 August 2021), etc. There is significant homogeneity among the various data sources with respect to olfactory perception, olfactory characteristics, and evaluator expertise.
After removing overlapping and redundant chemical molecules and removing odorless molecules, a total of 4032 expert-labeled odor molecules were obtained. At the same time, odor descriptors were homogenized to convert odors with the same core meaning or derivation into root odors. To ensure that there are enough samples for experimental predictions, we kept odor perception descriptors that appeared in at least 50 chemical molecules, and others were excluded from this study. After processing, we obtained a total of 3553 odor molecules and 105 odor descriptors, as shown in Figure 2 and Figure 3. Each odor molecule can have multiple odor descriptors, and each odor descriptor can correspond to multiple odor molecules. Furthermore, some odor descriptors are very common, such as “fruity” and “sweet”, while others are rare, such as “potato” or “cedar”. The co-occurrence matrix of odor descriptors is shown in Figure 4. The color range of the heatmap is log-scaled and normalized so that each row and column can sum to 1.
PubChem [38] is a public database of chemical substances built by the National Institutes of Health (NIH). The database contains chemical properties and biological activity data for small organic molecules, including SMILES numbers (Simplified Molecular Linear Input Specification Numbers) for odor molecules. By querying the CID numbers of the collected 3553 molecules in batches on this website, the corresponding SMILES number dataset can be obtained.
PaDEL-descriptor [14] is a free software application for computing chemical molecular feature descriptors. By Importing the SMILES numbers of the 3553 odor molecules collected from PubChem into PaDEL-descriptor, we can use the chemical development toolkit to calculate 1875-dimensional feature descriptors (1444 one-dimensional and two-dimensional features, and 431 three-dimensional features) and 12 types of molecular fingerprints descriptor (16,092 bits total). It can calculate atom types, functional groups, number of fragments, molecular volume, logP, number of atoms, etc., as well as some topological and geometric descriptors, and the molecular fingerprint encodes the topological environment of the molecular graph as a fixed-length vector. In this work, we eliminated all zero-valued features and the features with the missing term “nan”, so each odor molecule is denoted by a feature descriptor vector of length 2140 dimensions.
RDKit [39] is an open-source cheminformatics python package. RDKit can convert SMILES numbers into 300 × 300 pixel images (RGB), which are 2D molecular structure graphs. To highlight chemical information, RDKit draws carbon atoms as black, oxygen atoms as red, nitrogen atoms as blue, sulfur atoms as yellow, chlorine atoms as green, and phosphorus atoms as orange. Regardless of the differences in molecular complexity, the images generated by RDKit are always suitable for the entire molecule, making each molecule nearly the same size.
After preprocessing, the final dataset contains 3553 odor molecules and 105 odor perception descriptors. The dataset is multi-labeled, with each molecule linked with one or more odor perception descriptors. Through the above data collection and preprocessing, we obtain molecular structure graphs and molecular feature descriptors as the input part of the olfactory perception prediction model.

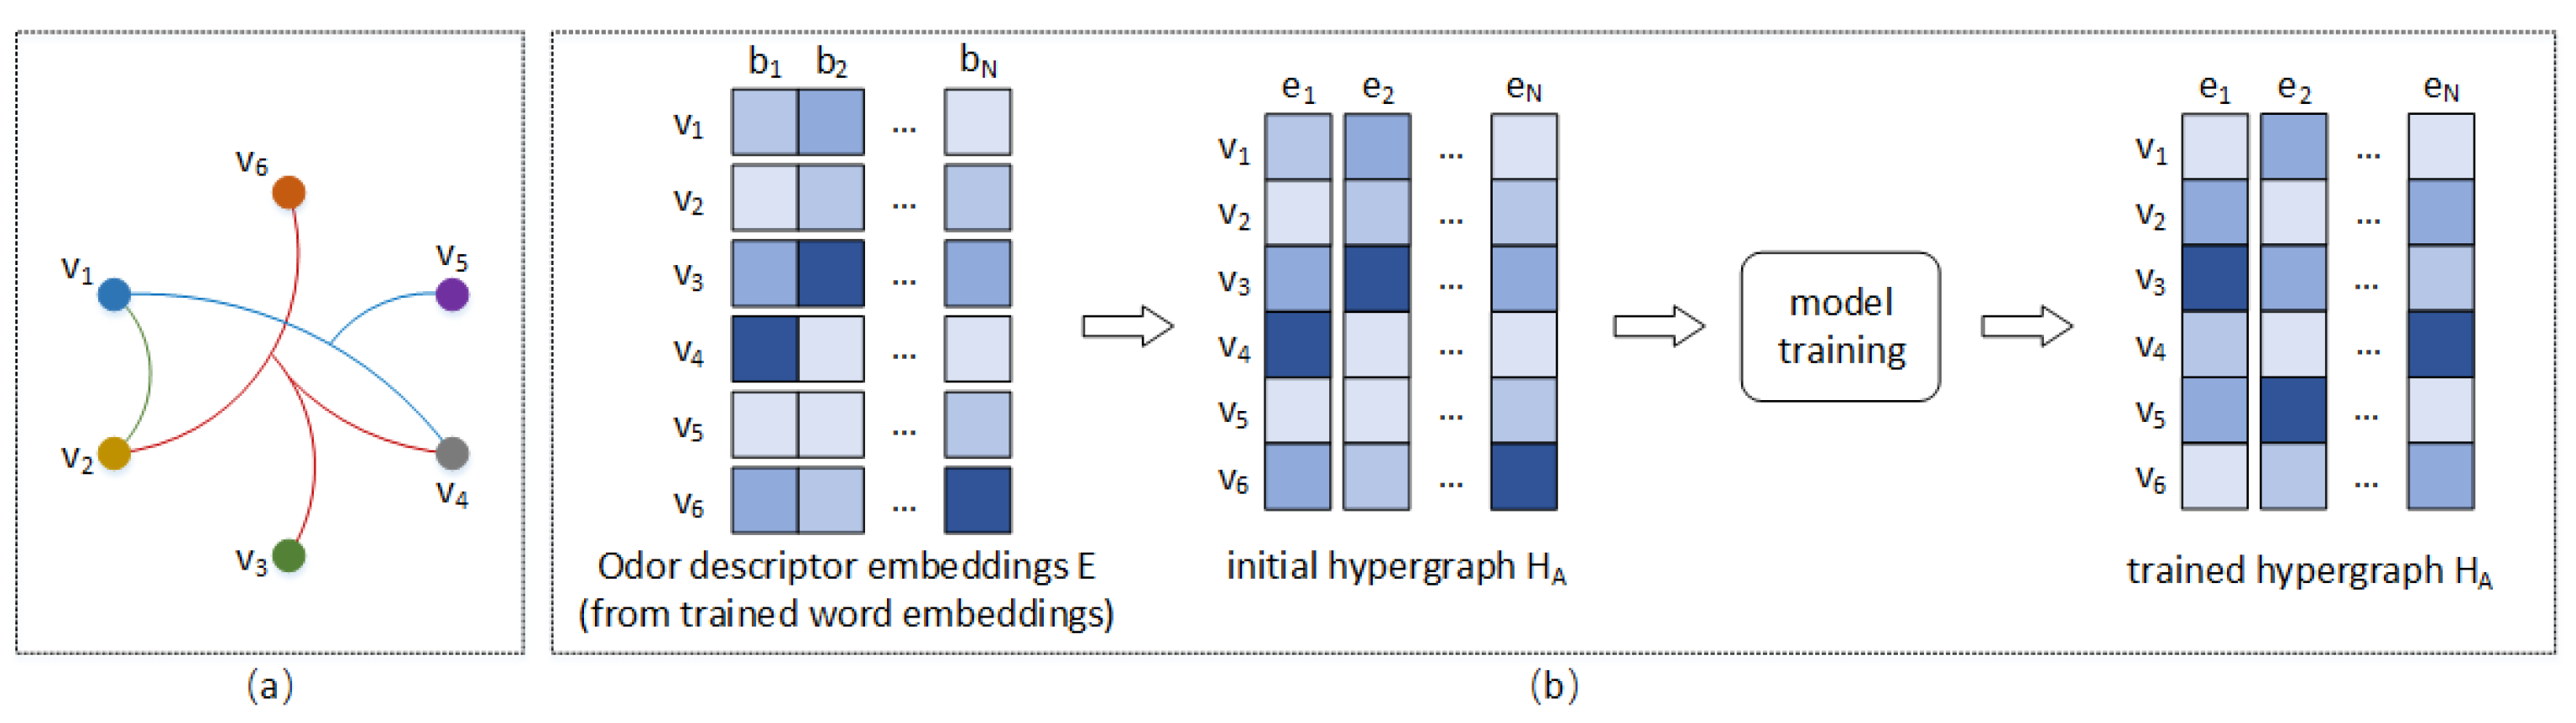
3.2. Feature-Semantic Interaction of Molecule-Odor Descriptor through HGNN

Following [7], a hypergraph is defined as G = ( V , E , W ) , where V is a set containing M vertices and E is a set containing N hyperedges, and each hyperedge ϵ E contains two or more vertices. The hypergraph is assigned a weighted matrix W R N × N , which is a diagonal matrix, with W ϵ ϵ representing the weight of hyperedge ϵ . A hypergraph can be represented as an incidence matrix H R M × N , where H i ϵ = 1 if the hyperedge ϵ E contains vertex v i V , otherwise 0. Vertex and hyperedge degree matrices are diagonal matrices, denoted by D and B, respectively, where D i i = ϵ = 1 N W ϵ ϵ H i ϵ and B ϵ ϵ = i = 1 M H i ϵ . In this paper, W ϵ ϵ is uniformly assigned to 1, and hence, W is an identity matrix.
Hypergraph convolution can be regarded as a two-stage refinement of the feature transformation of “node-hyperedge-node” on the hypergraph structure. Through vertex–hyperedge–vertex transformation, HGNN can effectively capture semantic dependencies and explore the interaction between the features of molecular structure graphs and the semantics of odor descriptors, that is, the feature–semantic interaction of the molecule-odor descriptor.
Figure 5a shows the hypergraph structure for odor molecule–odor descriptor modeling. Each colored node represents an odor descriptor. Odor descriptors connected by edges of the same color indicate that these odor descriptors co-occur in the same odor molecules. Figure 5b is the construction method of the hypergraph. Each hyperedge is abstracted as a relationship between nodes. The darker the color, the more correlated the node to the hyperedge. We can choose random values or odor descriptor embeddings to initialize H and then use the sigmoid function to activate it. To speed up the convergence, we use the odor descriptor embedding as initialization in this paper.
To train and validate the HGNN-based module, molecular structure graphs of size 300 × 300 pixels generated using RDKit were resized to 128 × 128 pixels. Given the molecular structure graph, ResNet [40] with an olfactory lateral inhibition-inspired attention mechanism is used to extract the feature maps. The output of the ResNet part is the feature map F i m a g e R W × H × C , where W, H, and C denote the width, height, and channel of the feature map, respectively.
Inspired by animal olfaction, we add an attention mechanism inspired by lateral inhibition [36] to the convolutional module of ResNet, as shown in Figure 6 and Figure 7. It further adjusts the feedback signal to obtain an attention map with lateral inhibition signals, which improves sharpening and anti-interference ability. Olfactory lateral inhibition is the process by which activated neurons propagate inhibitory signals to neighboring neurons. The most relevant neurons can be grouped together through the combination of lateral inhibition and feedback signals [41]. This part will be explained in detail below.
Since the ReLU layer determines which neurons can be activated, we add lateral inhibition to the ReLU layer. For the feedback signal matrix of the ReLU layer, the dimensions are ( W , H , C ) , where W, H, and C denote width, height, and channel. After feed-forward training, the gradients are back-propagated, and the inhibition is performed along the channel axis of the feedback signal. The maximum value in each channel axis is collected to obtain the Max-map; that is, the m a x operation is performed on all channel values at each ( w , h ) location. Although neurons at the same location share information in the same receptive field, they represent different patterns in different channels. The lateral inhibition value x i j L I of x i j is as follows,
x i j L I = a e x i j ¯ + b u v ( d u v e d u v δ ( x u v x i j ) )
δ ( x ) = x , i f x > 0 , 0 , i f x 0 .
where x i j denote the point at the location ( i , j ) in the Max-map, x i j ¯ is the average value of the Lateral Inhibition Area consisting of the n × n nearest neighbors of x i j in the Max-map, x u v is the neighbor point of x i j in the Lateral Inhibition Area, d u v is the Euclidean distance between x u v and x i j , which is divided by n, and a and b are balance coefficients. The state of a neuron is determined by the signals of itself and its neighboring neurons through the lateral inhibition model, and the neuron will not be inhibited by neighboring neurons whose value is lower than that of the neuron, as in Equation (2). The average term in Equation (1) (the first part of Equation (1)) maximizes the retention of neurons in the high-response area, that is, the target area. The differential term in Equation (1) (the second part of Equation (1)) tries to separate the target area from the background and emphasizes the sharpening of the boundary to improve the anti-interference ability. In Equation (1), d u v e d u v has a functional surface with an inverted “Mexican hat”, which is a computational model of lateral inhibition in neurobiology [42,43]. It means that the nearest and farthest neighbors have the least inhibitory effect on central neurons.
x i j = x i j , i f x i j x i j L I > 0 , 0 , i f x i j x i j L I 0 .
After lateral inhibition, the activated location is retained, and all other channels in the inhibition location are set to zero, as in Equation (3). Then, feed-forward or backpropagation is continued to perform again. The gradient or response of each layer is added by channels, that is, a s u m operation is performed on the values of all channels at each ( w , h ) location. Then, the gradient or response of each layer is scaled to the same size as the input, and normalized with the L2 norm to obtain the final attention map. The attention map with lateral inhibition is added to ResNet to adjust its convolution module. Finally, the feature map F i m a g e R W × H × C of the molecular structure graph is obtained.
To learn the odor descriptors-related features, the semantic decoupling module [44] is utilized to decouple the image features of molecular structure graphs into semantic-specific feature representations through odor descriptor embeddings. The module uses a low-rank bilinear pooling method and an attention function to calculate the attention coefficients. It pays more attention to the semantic-aware regions and thus learns the feature vector corresponding to this semantic class. The initial value of the odor descriptor embedding E s d R M × N is obtained by the pre-trained GloVe [45] model, where M denotes the number of odor descriptors, and N denotes the dimension of the odor descriptor feature vector.
To acquire high-order semantic relations automatically, we employ a three-layer hypergraph neural network to correlate the odor descriptors-related feature vectors and propagate information through a hypergraph to explore feature–semantic interactions of molecule-odor descriptors. Following the suggestion in [46], we remove the learnable matrix and nonlinear activation function for linear transformations in a hypergraph convolution. To prevent numerical instability caused by stacking multiple convolutional layers, we add in symmetric normalization, which can improve numerical stability. The hypergraph convolutional layer can be denoted as follows,
X ( l ) = D 1 / 2 H B 1 H T D 1 / 2 X ( l 1 ) ,
where the initial vertex feature X ( 0 ) R M × N is the output of the semantic decoupling module F s d .
Through a three-layer hypergraph neural network, the vertex features X ( L ) R M × N are obtained. Following [44], we also concatenate the output vertex feature F s d of the semantic decoupling module with the vertex feature X ( L ) . Then, we input it into the Multilayer Perceptron (MLP) to obtain the odor descriptor-related molecular structure features z H G N N R d :
z H G N N = M L P H G N N ( [ F s d X ( L ) ] ) ,
where ⊕ denotes a concatenation operation between two vectors or matrices.

3.3. Weighted Deep Feature Combination Based on Attentional Factorization Machine

In order to extract the descriptive features of odor molecules, we add an attention unit to the DeepFM framework proposed by [47] to form a DeepAFM model and obtain the molecular descriptive features through the weighted deep feature combination based on the attentional factorization machine. Odor molecular feature descriptors are numerous and complex, and not all feature interactions contribute equally to odor classification. Therefore, it is very reasonable to use DeepAFM to extract descriptive features from molecular feature descriptors.
The 2140-dimensional molecular feature descriptors generated using PaDEL-descriptor software are utilized to train and validate the attentional factorization machine-based deep neural network model. DeepAFM is divided into an attentional factorization machine (AFM) component [48] and a DNN component, which share the same input, and all parameters are trained jointly for the combined prediction model. AFM is used for feature extraction of order-1 features and order-2 features, which are formed by a pairwise combination of order-1 features, and its output is the sum of the addition unit and the attention unit; DNN is used for feature extraction of high-order features, which are formed by operations such as a full connection of order-1 features. Therefore, it can learn both high-order combination features and low-order combination features.
The AFM component is a factorization machine for learning weighted feature interactions, where FM estimates the target by modeling all interactions between each pair of features. It can capture order-2 feature interactions more effectively. Especially when the dataset is sparse, AFM can better learn feature interactions that never or rarely appear in the training data.
The raw input feature vectors for molecular feature descriptors are typically highly sparse, ultra-high-dimensional, and grouped by fields (e.g., electronic properties, functional groups, atomic numbers, etc.). For fields with categorical and binary raw features, after one-hot encoding, the feature space tends to be highly sparse and high-dimensional, which makes the network difficult to train. Therefore, the factorization machine is performed on the order-2 parameter matrix, and the latent variable space V R n × k (k is given) is introduced to solve this matrix, where n means that the sparse feature is a n-dimensional vector.
In addition, not all feature interactions contribute equally to odor classification. Therefore, we extend the attention mechanism [49] to capture the salient structure of molecular feature descriptors to extract feature interactions that are important for classification. The AFM component is as follows,
s i j = W s σ ( W a < V i , V j > x i · x j + b s )
α i j = e x p ( s i j ) i = 1 n j = i + 1 n e x p ( s i j )
y A F M = < w , x > + i = 1 n j = i + 1 n α i j < V i , V j > x i · x j
where w R n , V i R k , σ ( ) is the activation function, s i j is the attention score, and the attention value α i j denotes the importance of this order-2 feature interaction. The addition unit ( < w , x > ) of Equation (8) reflects the importance of the order-1 features, and the attention unit denotes the influence of the order-2 feature interaction.
Furthermore, the embedding layer is designed to compress the input vector into a low-dimensional dense real-valued vector, which is then fed into the network to train latent vectors; otherwise, the network may not be able to train. The overall network is jointly trained in an end-to-end manner. Following the embedding layer structure in [47], the output of the embedding layer is denoted as:
a ( 0 ) = [ e 1 , e 2 , , e i , , e m ]
where e i R k is the embedding of i-th field and m is the number of fields. a ( 0 ) is a low-dimensional, dense real-valued vector, which can be easily trained in the network. The embedding layer is then fed into the AFM component to model order-2 feature interactions and the DNN component to model higher-order feature interactions.
The DNN component is a feed-forward neural network that learns higher-order feature interactions. The embedding layer a ( 0 ) is fed into the DNN network as follows,
a ( l + 1 ) = σ ( W ( l ) a ( l ) + b ( l ) )
y D N N = W | H + 1 | · a | H | + b | H | + 1
where l is the layer depth and | H | denotes the number of layers of DNN. Combining y A F M and y D N N with a multilayer perceptron (MLP), we obtain the molecular descriptive feature vector z A F M R d of the odor molecule:
z A F M = M L P A F M ( [ y A F M y D N N ] )
Then, we combine the molecular structure feature vector obtained in Section 3.2 with the molecular descriptive feature vector obtained in this section to obtain the final feature vector z H A of the odor molecule:
z H A = M L P H A ( [ z H G N N z A F M ] )
where z H A R d , and ⊕ represent the concatenation operation between two vectors or matrices. Finally, we use the output layer to obtain the final predicted odor descriptors of the odor molecule, and the loss function is as follows:
l o s s = 1 C k = 0 C 1 ( y k l o g ( σ ( l k ) ) + ( 1 y k ) l o g ( 1 σ ( l k ) ) )
where y k is the odor descriptor label corresponding to the one-hot encoding, σ ( l k ) represents using the sigmoid function to activate the neurons of the output layer, C is the total number of labels, which is 105 in this paper, and the output layer contains C neurons corresponding to C classes.

4. Experiments

4.1. Experimental Settings

4.1.1. Baselines and Evaluation Metrics

In this experiment, we treat the odor descriptors prediction of odor molecules in the dataset (introduced in Section 3) as a multi-label classification problem. We compare our proposed model HGAFMN with the DREAM Winner model [4], GNN-QSOR model [5], and DNN-CNN model [6].
DREAM Winner model [4]: It is a random forest (RF)-based model that predicts odor perception from chemical feature descriptors of odor molecules.
GNN-QSOR model [5]: It treats atoms as nodes, chemical bonds as edges, and constructs an odor molecule as a graph structure. It predicts odor perception from the molecular structure graph of odor molecules.
DNN-CNN model [6]: It uses a simple DNN component to learn descriptive features from the chemical feature descriptors of odor molecules uses the Xception-based CNN component to learn structural features from the molecular structure graph of odor molecules, and fuses these two components to predict odor perception.
We use precision, recall, F1-score, and AUROC commonly used in classification problems to evaluate the performance of the above models. The higher the value of precision, recall, F1-score, and AUROC, the better the model performance. We randomly divided the entire dataset into three parts: 80% for training, 10% for validation, and 10% for testing.

4.1.2. Hyper-Parameter Settings

We use Pytorch to implement our proposed model. To optimize the objective function, we use Adam [50] as the optimizer, which performs exponentially weighted average and regularization on the gradient term, and uses momentum and adaptive learning rates to accelerate convergence, with β 1 = 0.9, β 2 = 0.999, and ϵ = 1 × 10 4 . Overfitting is an eternal problem when optimizing deep neural network models. To alleviate this problem, we adopt the dropout strategy [51] in the model, randomly dropping some neurons in the hidden layer during the training process and set the dropout rate to 0.5. The embedding size is set to 128 and the initial learning rate is set to 0.001. Furthermore, we use mini-batches for model training, and each batch size is set to 64. In order to compare the pros and cons of the model itself, we do not use the pre-trained weights from the pre-trained models such as VGG-16 and Xception [52,53].

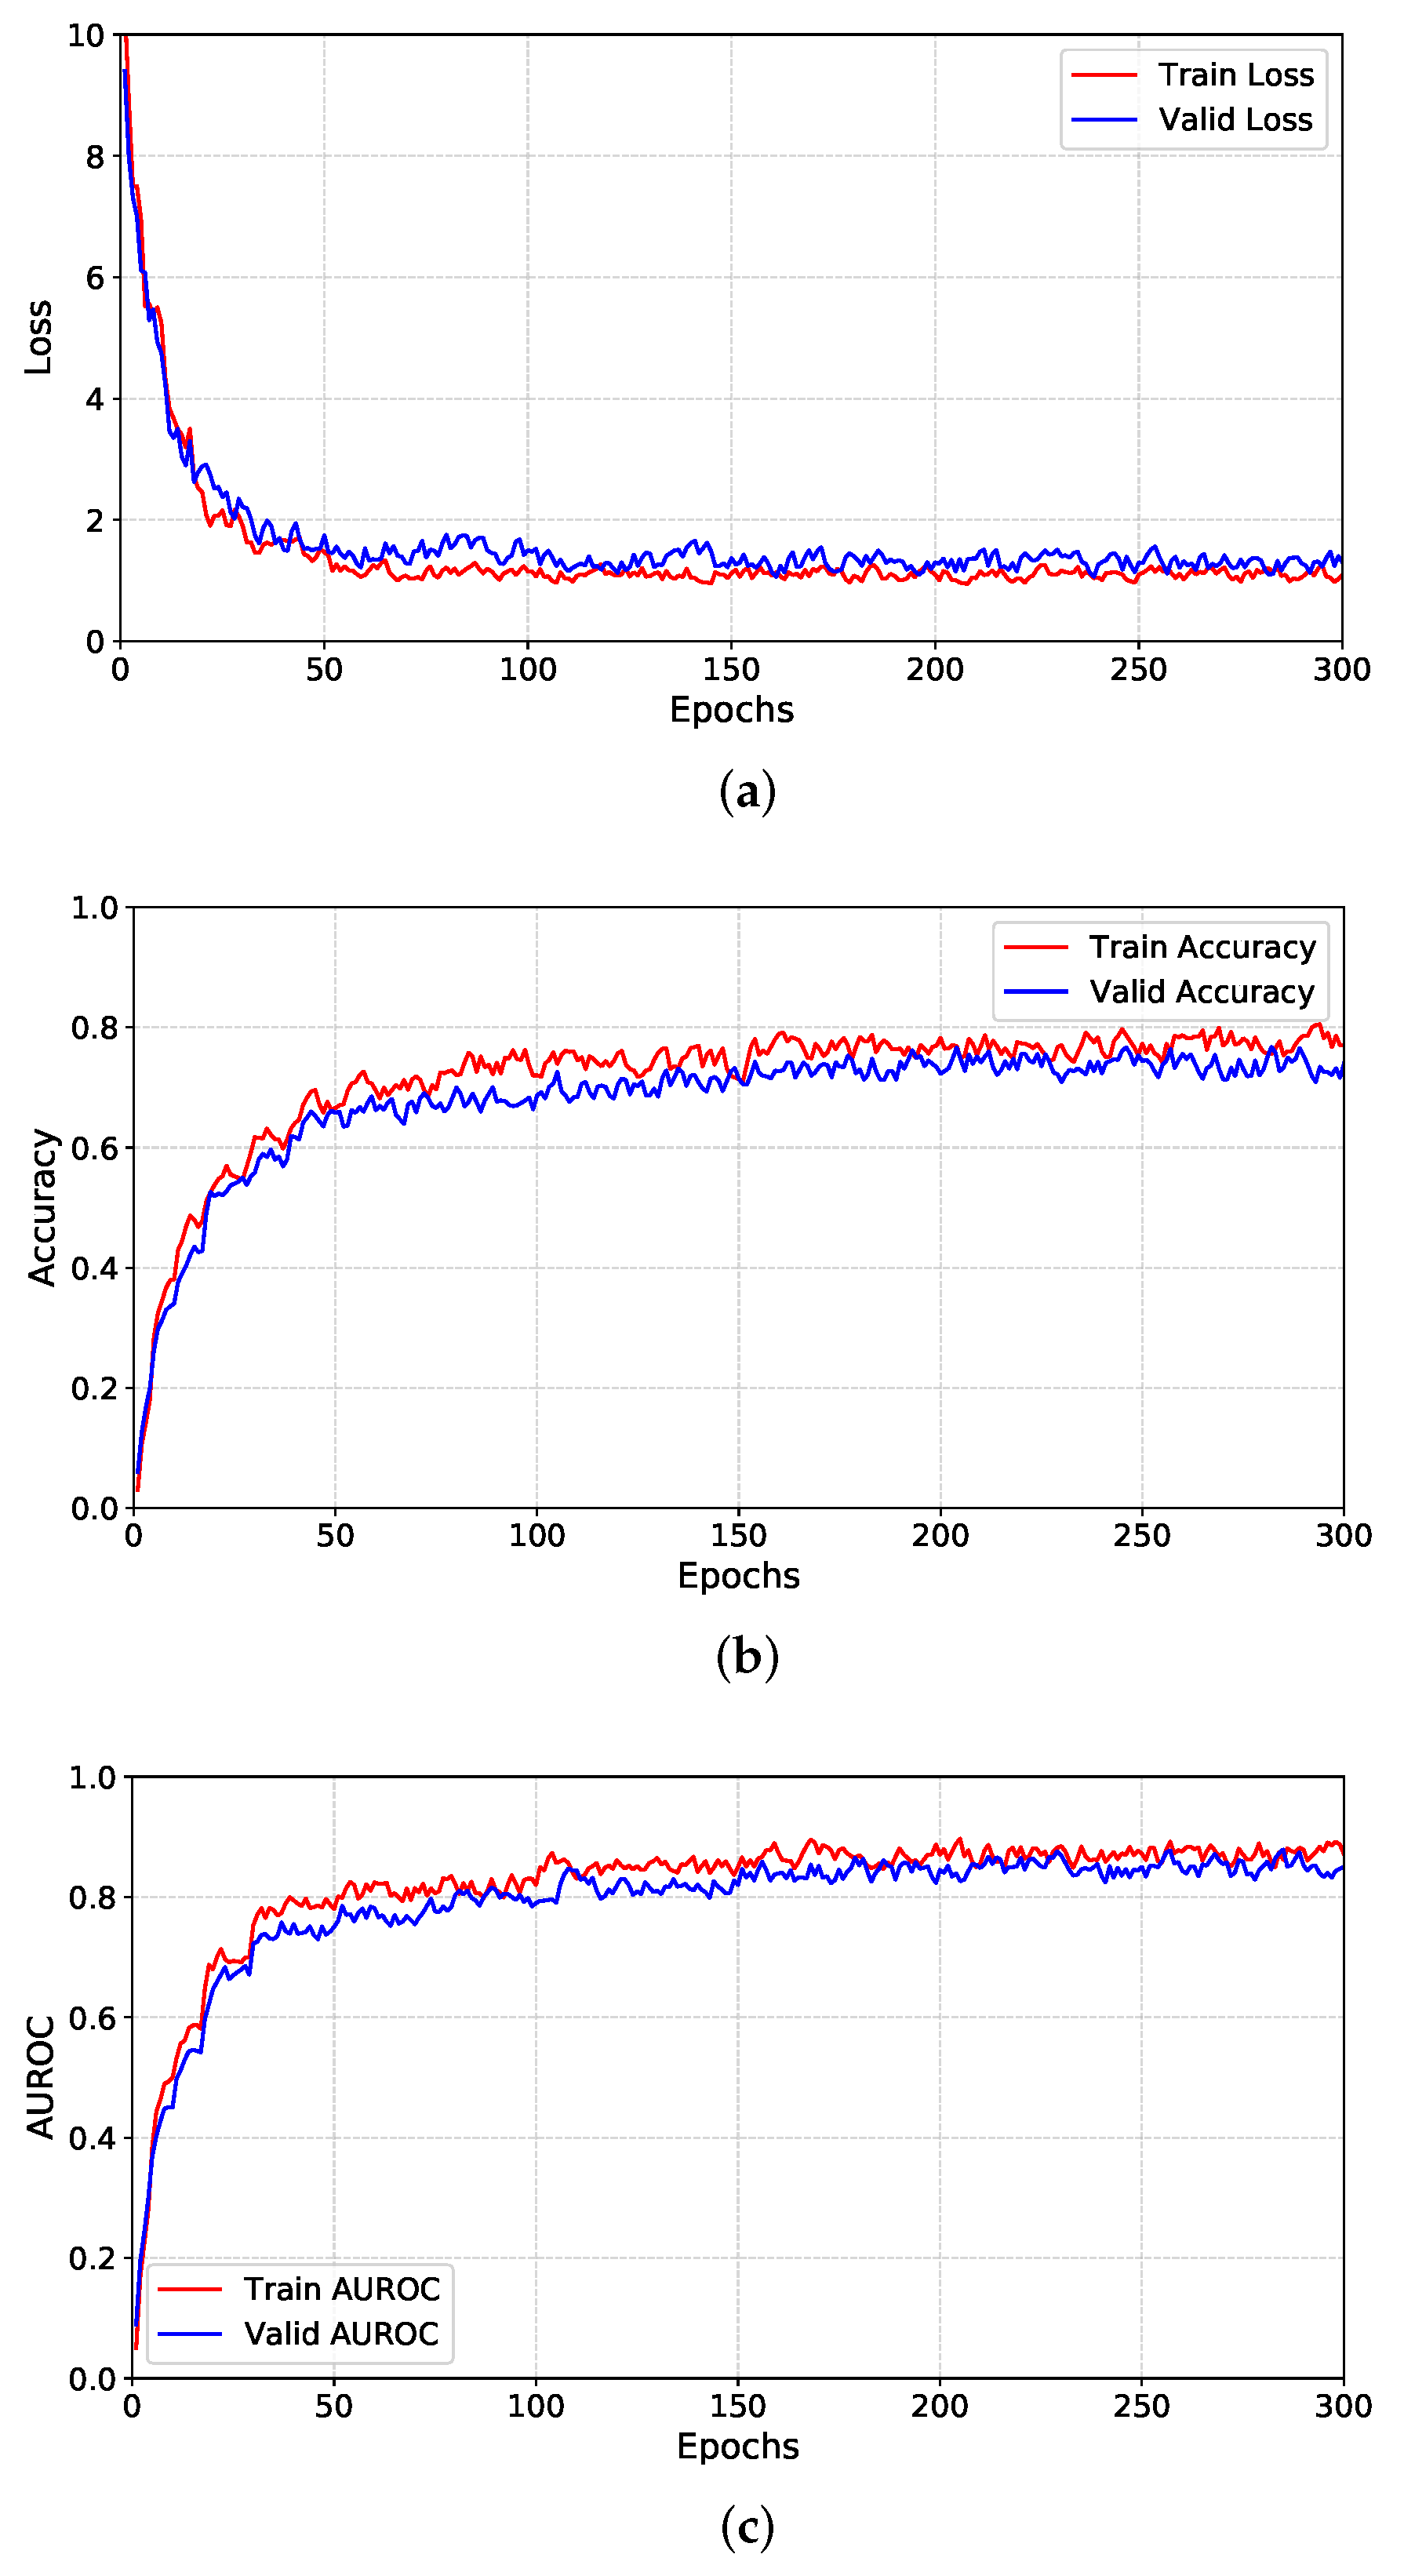
4.2. Performance Evaluation

We conduct experiments on the real-world dataset to compare our proposed HGAFMN with state-of-the-art methods. Table 1 summarizes the performance metrics of these models. The best performance is highlighted in bold, while the second best performance is marked with “†”. Among all models, our proposed HGAFMN achieves the best results in precision, recall, F1-score, and AUROC. Furthermore, we will analyze the shortcomings of these comparative models.
DREAM Winner model [4] is a random forest (RF)-based model that relies heavily on the best feature set for the input classifier. If there is a lot of noise in the training data, the RF will be overfitted. In addition, odor data are usually obtained by manual annotation and have a lot of noise, which has some negative effects on the accuracy of RF classification. Furthermore, since there are no standard rules about the number of features that will provide a better-performing model, some key information that is required for accurate prediction may be lost, especially when there are complex correlations among odor molecules.
The GNN-QSOR model [5] treats atoms as nodes and chemical bonds as edges to construct an odor molecule as a graph structure. It only extracts the structural features of chemical molecules without using quantitative feature descriptors of odor molecules. A disadvantage of GNN-QSOR is that it is difficult to distinguish molecules that are similar in structure but have different smells. For example, hydrogen cyanide and benzaldehyde have different structures but similar odors, both with a bitter almond. The carvone enantiomer R-(–) carvone and carvone have almost the same structures but completely different odors. The former is spearmint smell, while the latter is caraway smell.
The DNN-CNN model [6] greatly improves the prediction accuracy compared to other previous models. This model uses the most naive DNN component to learn molecular descriptive features from molecular feature descriptors, and uses the Xception-based CNN component to learn molecular structural features from molecular structure graphs. However, the feature descriptors of odor molecules are numerous with complex interactions. The model uses a simple DNN to extract molecular descriptive features and does not consider the feature combinations and interactions of these feature descriptors, which will cause omissions in feature extraction. Moreover, the differences between the structure graphs of different molecules are subtle and complex. For example, single, double, and triple bonds in chemical bonds are easily recognized inaccurately in complex molecules, which will lead to inaccurate olfactory perception prediction of odor molecules. In addition, the structural complexity of different molecules varies greatly—some are very simple while others are very complex—so the simple Xception-based CNN used in the DNN-CNN model may ignore some features.
Different from these works above, we integrate the lateral inhibition mechanism into the olfactory perception prediction model and use the hypergraph neural network to effectively explore the high-order semantic interaction between odor molecules and odor descriptors. Moreover, the DeepAFM (Deep Attentional Factorization Machine) model can learn the importance of each feature interaction through the attention mechanism and effectively learn the weighted interactions between descriptive features. For these reasons, our proposed HGAFMN achieves better results than these comparative models in predicting quantitative structure–odor relationships.

4.3. Experiment Analysis

The loss plot, accuracy plot, and AUROC plot of the proposed HGAFMN are shown in Figure 8. The valid loss converges to about 1.20, the valid accuracy converges to about 0.74, and the valid AUROC converges to about 0.86.

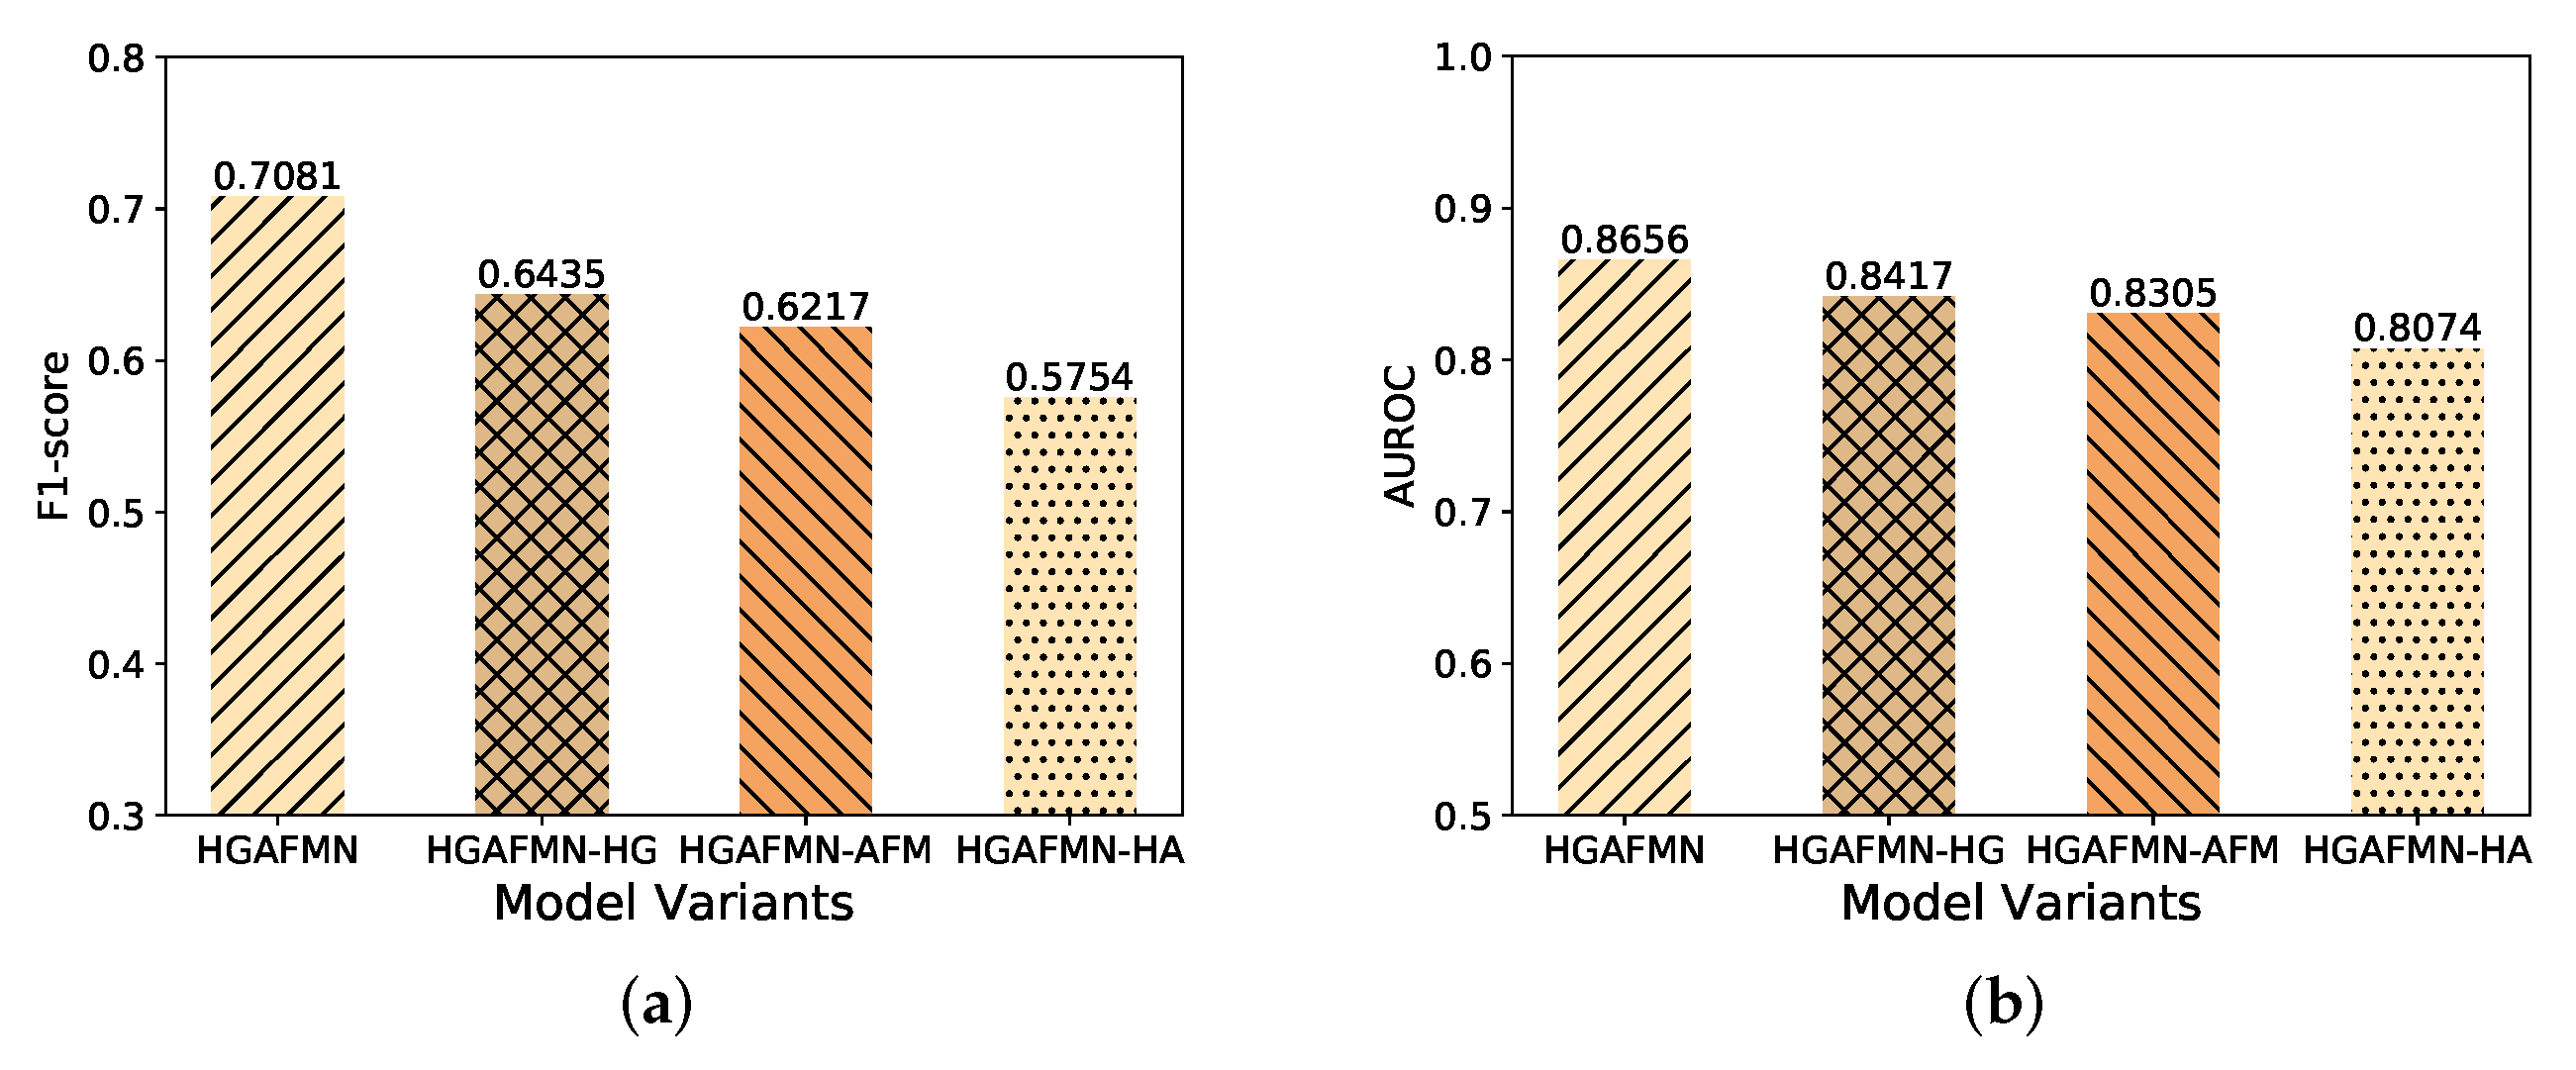
4.3.1. Ablation Study

In order to study the effect of HGNN-based feature–semantic interaction and attentional factorization machine, we compare model variants of HGAFMN. HGAFMN-HG is HGAFMN without the HGNN-based feature–semantic interaction module. HGAFMN-AFM is HGAFMN without the attentional factorization machine, and HGAFMN-HA is HGAFMN without the HGNN-based feature–semantic interaction module nor the attentional factorization machine. The experimental results are shown in Figure 9. The prediction performance of HGAFMN is significantly better than the model variant on both the F1-score and AUROC.
From Figure 9, we can see that the model HGAFMN-HG without the HGNN-based feature–semantic interaction module, the model HGAFMN-AFM without the attentional factorization machine, and the model HGAFMN-HA are worse than HGAFMN. The differences between the structure graphs of different molecules are subtle and complex, and the structural complexity of different molecules varies greatly. The HGNN-based feature–semantic interaction of the molecule-odor descriptor can play an important role in olfactory perception prediction. In addition, the deep neural network with attentional factorization machine considers the importance of each feature interaction, and can learn both high-order combination features and low-order combination features, which improves the performance of olfactory perception prediction. It shows that HGNN-based feature-semantic interaction and attentional factorization machines are effective at improving the prediction accuracy of olfactory perception.

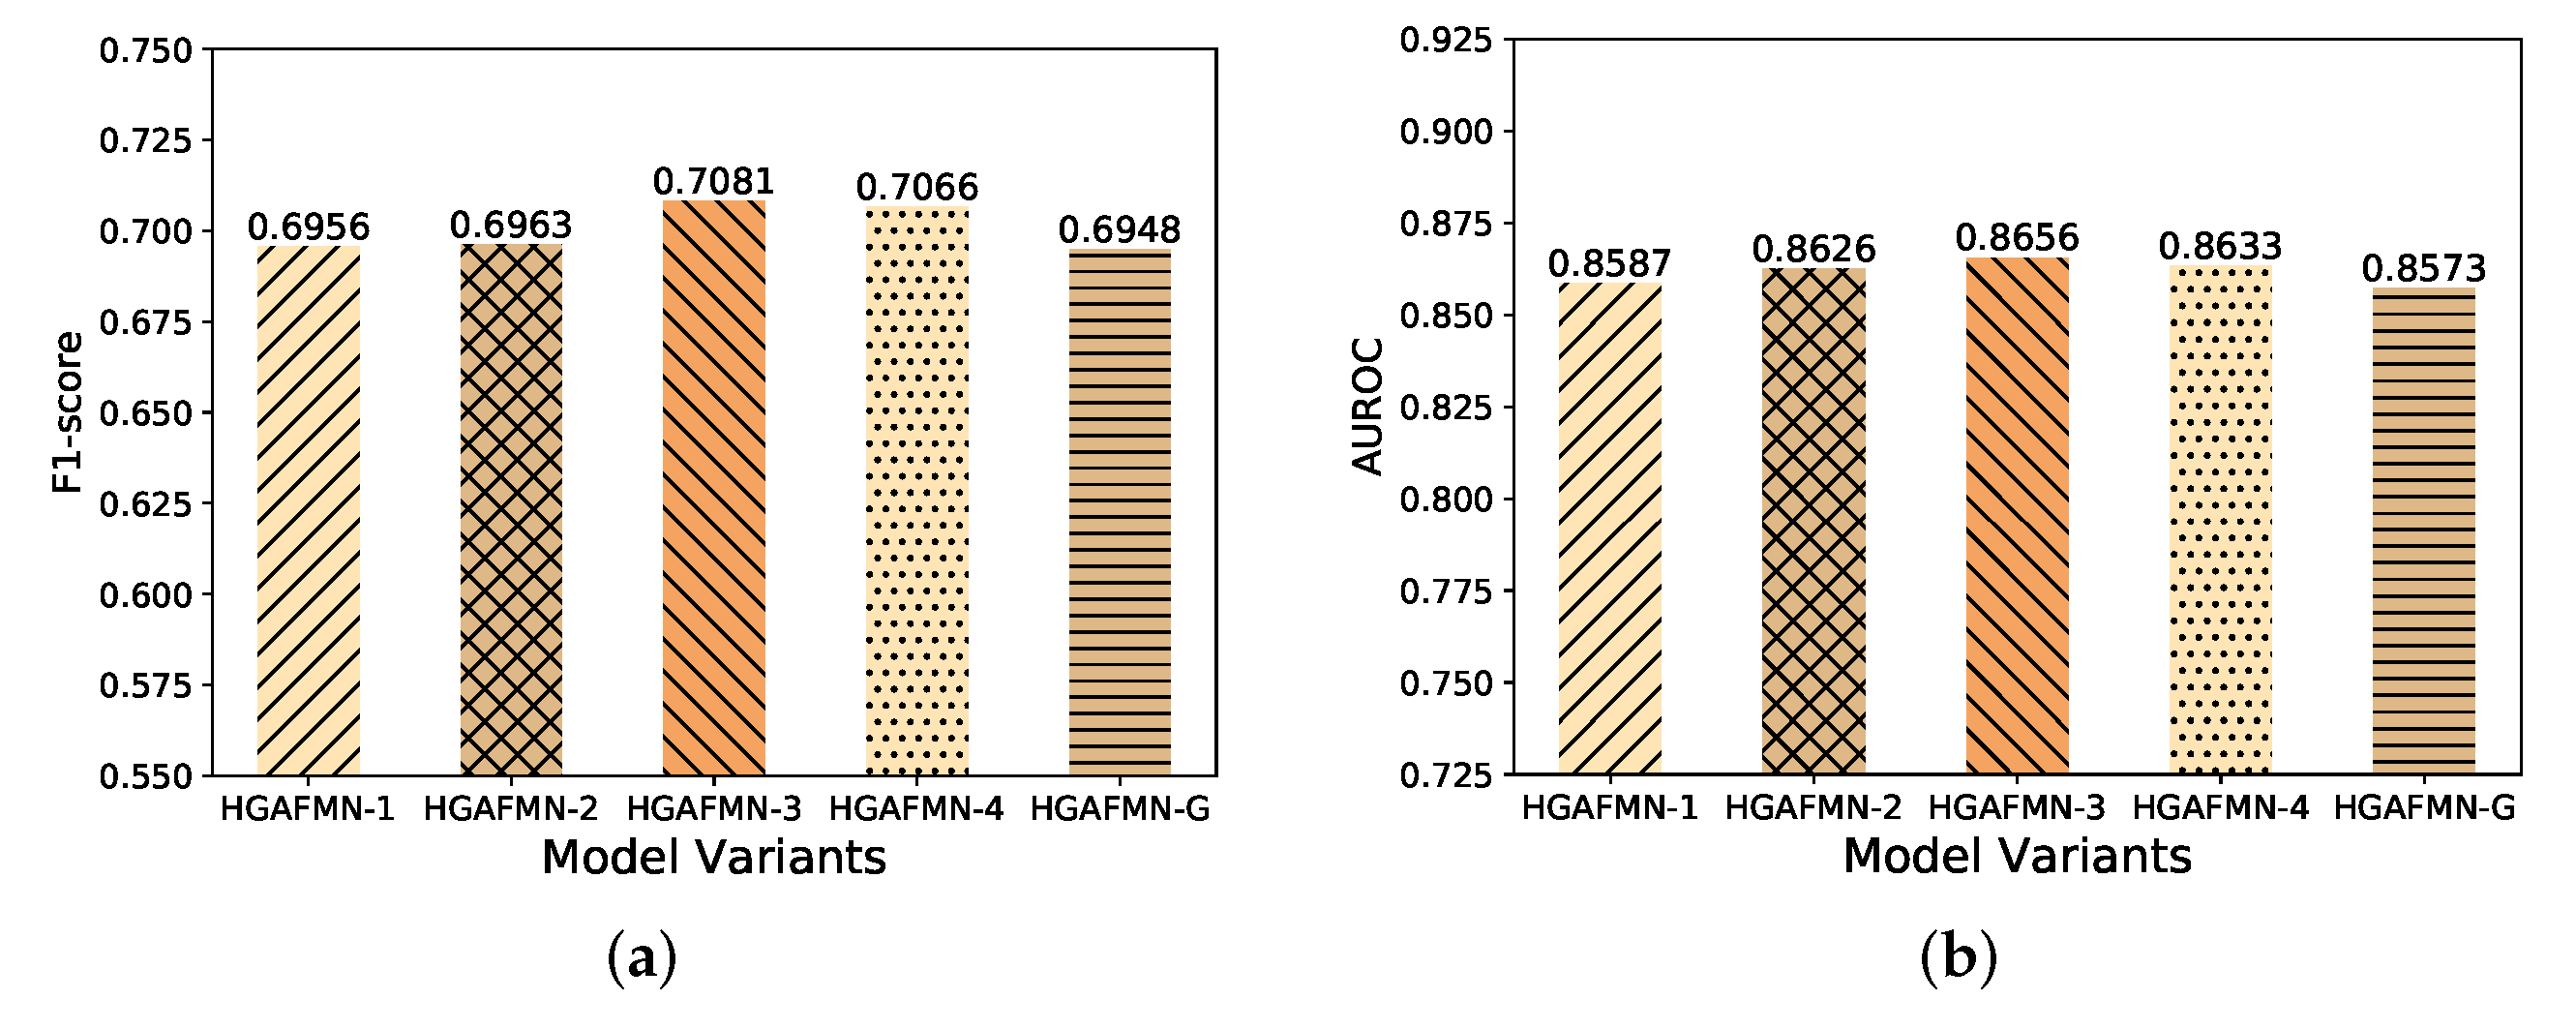
4.3.2. Performance Comparison w.r.t Layers of HGNNs

In order to study the influence of the number of layers of HGNN in the HGNN-based feature–semantic interaction module, we take the number of layers of HGNN as (1, 2, 3, 4), which are denoted as HGAFMN-1, HGAFMN-2, HGAFMN-3, HGAFMN-4. In addition, we also replace HGNN with GNN for performance comparison, where the number of layers of GNN is three, and it is denoted as HGAFMN-G.
The experimental results are shown in Figure 10. It can be seen that the prediction performance of HGAFMN-2 is better than that of HGAFMN-1, and the prediction performance of HGAFMN-3 is significantly better than that of HGAFMN-2. Furthermore, the prediction performance of HGAFMN-4 is slightly worse than that of HGAFMN-3. Experiments show that we obtain the best results when the number of layers of HGNN is three layers. Moreover, the prediction performance of HGAFMN-G is significantly worse than that of HGAFMN. It shows that in the feature–semantic interaction module of the molecular structure–odor descriptors, the model based on the hypergraph neural network performs better than the model based on the graph neural network. It also illustrates that it is very reasonable to model the odor molecular structure–odor descriptor relationship data as a hypergraph structure that can better encode high-order data correlations.

4.3.3. Performance Comparison with Respect to Hyper-Parameters

The dropout layer can avoid overfitting by randomly dropping incoming and outgoing connections in the hidden layer based on the dropout rate during the training process. We will discuss the effect of the dropout rate on model performance. We take the dropout rate as (0.1, 0.2, 0.3, 0.4, 0.5, 0.6, 0.7), and the performance is the best when the dropout rate is 0.5, as shown in Figure 11a. If the dropout rate is too small, the training will be overfitting. If the dropout rate is too large, it may drop useful features and leave useless features, resulting in insufficient training.
We also discuss the effect of embedding size on model performance, and the results are shown in Figure 11b. We set the embedding size to (8, 16, 32, 64, 128, 256, 512). As the embedding size increases from 8 to 512, the performance of the model first becomes better and then becomes worse. The performance is best when the embedding size is 128. If the embedding size is too small, the embedding representation will be rough, and the fitting ability will be insufficient. If the embedding size is too large, the embedding representation will become sparse, resulting in performance degradation.

5. Conclusions

Predicting odor descriptors is an important research area in olfactory perception, with a wide range of applications in virtual reality, food inspection, air quality, etc. In this paper, we propose an olfactory perception prediction model, noted as HGAFMN, to classify and predict the odor descriptors of chemical molecules. It is a hypergraph neural network-based model considering the feature-semantic interaction of molecular structure–odor descriptors, combined with a deep attentional factorization machine. One part is the molecular structural feature extraction part. To extract structural features from the molecular structure graph, the features of the molecular structure graph are decomposed into feature vectors corresponding to each odor descriptor, and hypergraph neural networks are used to correlate these vectors to explore higher-order semantic interactions. It also adds a lateral inhibition-inspired attention mechanism into the convolutional neural network that extracts the feature maps of molecular structure graphs to improve sharpening and anti-interference ability. The other part is the molecular descriptive feature extraction part, that is, adding an attentional factorization machine into the deep neural network. Through weighted deep feature combination, feature interactions that are important for odor classification are selected from the numerous and complex interactions of molecular feature descriptors so as to obtain molecular descriptive features.
In synthetic fragrances and sensory neuroscience, the chemical characterization of odor molecules is the key to designing new products. The development of the quantitative structure–odor relationship prediction will help to understand the general mechanisms underlying the relationship between the chemical structure and physicochemical properties of odor molecules and olfactory perception. In the future, we will introduce natural language processing techniques to predict the odor descriptors that are necessary for constituting the odor perceptual space.

Author Contributions

Conceptualization, Y.W.; investigation, Y.W.; methodology, Y.W.; resources, Q.Z.; software, Y.W. and Q.Z.; supervision, M.M. and J.X.; writing—original draft, Y.W.; writing—review and editing, Q.Z. All authors have read and agreed to the published version of the manuscript.

Funding

This work was supported in part by the National Key R&D Program of China under Grant 2019YFA0706401, and in part by the National Natural Science Foundation of China under Grant 62172014, Grant 62172015, Grant 61872166 and Grant 62002002.

Institutional Review Board Statement

Not applicable.

Informed Consent Statement

Not applicable.

Data Availability Statement

Not applicable.

Conflicts of Interest

The authors declare no conflict of interest.

References

  1. Wang, P.Y.; Sun, Y.; Axel, R.; Abbott, L.; Yang, G.R. Evolving the Olfactory System with Machine Learning. Neuron 2021, 109, 3879–3892.e5. [Google Scholar] [CrossRef] [PubMed]
  2. Li, X.; Luo, D.; Cheng, Y.; Wong, K.Y.; Hung, K. Identifying the Primary Odor Perception Descriptors by Multi-Output Linear Regression Models. Appl. Sci. 2021, 11, 3320. [Google Scholar] [CrossRef]
  3. Nozaki, Y.; Nakamoto, T. Predictive modeling for odor character of a chemical using machine learning combined with natural language processing. PLoS ONE 2018, 13, e0198475. [Google Scholar]
  4. Li, H.; Panwar, B.; Omenn, G.S.; Guan, Y. Accurate prediction of personalized olfactory perception from large-scale chemoinformatic features. Gigascience 2018, 7, gix127. [Google Scholar] [CrossRef]
  5. Sanchez-Lengeling, B.; Wei, J.N.; Lee, B.K.; Gerkin, R.C.; Aspuru-Guzik, A.; Wiltschko, A.B. Machine learning for scent: Learning generalizable perceptual representations of small molecules. arXiv 2019, arXiv:1910.10685. [Google Scholar]
  6. Sharma, A.; Kumar, R.; Ranjta, S.; Varadwaj, P.K. SMILES to smell: Decoding the structure–odor relationship of chemical compounds using the deep neural network approach. J. Chem. Inf. Model. 2021, 61, 676–688. [Google Scholar] [CrossRef]
  7. Feng, Y.; You, H.; Zhang, Z.; Ji, R.; Gao, Y. Hypergraph neural networks. In Proceedings of the AAAI Conference on Artificial Intelligence, Honolulu, HI, USA, 27 January–1 February 2019; Volume 33, pp. 3558–3565. [Google Scholar]
  8. Bandyopadhyay, S.; Das, K.; Murty, M.N. Line Hypergraph Convolution Network: Applying Graph Convolution for Hypergraphs. arXiv 2020, arXiv:2002.03392. [Google Scholar]
  9. Urban, N.N. Lateral inhibition in the olfactory bulb and in olfaction. Physiol. Behav. 2002, 77, 607–612. [Google Scholar] [CrossRef]
  10. Shmuel, R.; Secundo, L.; Haddad, R. Strong, weak and neuron type dependent lateral inhibition in the olfactory bulb. Sci. Rep. 2019, 9, 1602. [Google Scholar] [CrossRef]
  11. Whitesell, J.D.; Sorensen, K.A.; Jarvie, B.C.; Hentges, S.T.; Schoppa, N.E. Interglomerular lateral inhibition targeted on external tufted cells in the olfactory bulb. J. Neurosci. 2013, 33, 1552–1563. [Google Scholar] [CrossRef]
  12. Keller, A.; Gerkin, R.C.; Guan, Y.; Dhurandhar, A.; Turu, G.; Szalai, B.; Mainland, J.D.; Ihara, Y.; Yu, C.W.; Wolfinger, R.; et al. Predicting human olfactory perception from chemical features of odor molecules. Science 2017, 355, 820–826. [Google Scholar] [CrossRef]
  13. Keller, A.; Vosshall, L.B. Olfactory perception of chemically diverse molecules. BMC Neurosci. 2016, 17, 55. [Google Scholar] [CrossRef]
  14. Yap, C.W. PaDEL-descriptor: An open source software to calculate molecular descriptors and fingerprints. J. Comput. Chem. 2011, 32, 1466–1474. [Google Scholar] [CrossRef]
  15. Snitz, K.; Yablonka, A.; Weiss, T.; Frumin, I.; Khan, R.M.; Sobel, N. Predicting odor perceptual similarity from odor structure. PLoS Comput. Biol. 2013, 9, e1003184. [Google Scholar] [CrossRef]
  16. Jiang, D.; Wu, L.; Wen, T.; Li, J.; Jia, L.; Gao, Z. A Cheminformatic Compression Method for Multiple Odor Label in Intelligent Perception. In Proceedings of the 2021 IEEE International Conference on Smart Internet of Things (SmartIoT), Jeju, Korea, 13–15 August 2021; pp. 317–321. [Google Scholar]
  17. Boesveldt, S.; Olsson, M.J.; Lundström, J.N. Carbon chain length and the stimulus problem in olfaction. Behav. Brain Res. 2010, 215, 110–113. [Google Scholar] [CrossRef]
  18. Kermen, F.; Chakirian, A.; Sezille, C.; Joussain, P.; Le Goff, G.; Ziessel, A.; Chastrette, M.; Mandairon, N.; Didier, A.; Rouby, C.; et al. Molecular complexity determines the number of olfactory notes and the pleasantness of smells. Sci. Rep. 2011, 1, 206. [Google Scholar] [CrossRef]
  19. Gutiérrez, E.D.; Dhurandhar, A.; Keller, A.; Meyer, P.; Cecchi, G.A. Predicting natural language descriptions of mono-molecular odorants. Nat. Commun. 2018, 9, 4979. [Google Scholar] [CrossRef]
  20. Qiu, X.; Cheng, Y.; Luo, D.; He, C.; Angus, K.; Liu, Q. Odor-GCN: Graph Convolutional Network for Predicting Odor Impressions Based on Molecular Structures. Res. Sq. 2022. [Google Scholar] [CrossRef]
  21. Shang, L.; Tang, F.; Liu, C.; Chen, B.; Liu, L.; Hayashi, K. Machine-Learning-Based Olfactometry: Odor Descriptor Clustering Analysis for Olfactory Perception Prediction of Odorant Molecules. bioRxiv 2022. [Google Scholar] [CrossRef]
  22. Scarselli, F.; Gori, M.; Tsoi, A.C.; Hagenbuchner, M.; Monfardini, G. The graph neural network model. IEEE Trans. Neural Netw. 2008, 20, 61–80. [Google Scholar] [CrossRef]
  23. Wu, Z.; Pan, S.; Chen, F.; Long, G.; Zhang, C.; Philip, S.Y. A comprehensive survey on graph neural networks. IEEE Trans. Neural Netw. Learn. Syst. 2020, 32, 4–24. [Google Scholar] [CrossRef] [PubMed]
  24. Ji, S.; Feng, Y.; Ji, R.; Zhao, X.; Tang, W.; Gao, Y. Dual channel hypergraph collaborative filtering. In Proceedings of the 26th ACM SIGKDD International Conference on Knowledge Discovery & Data Mining, Virtual Event, 6–10 July 2020; pp. 2020–2029. [Google Scholar]
  25. Wu, X.; Chen, Q.; Li, W.; Xiao, Y.; Hu, B. AdaHGNN: Adaptive Hypergraph Neural Networks for Multi-Label Image Classification. In Proceedings of the 28th ACM International Conference on Multimedia, Seattle, WA, USA, 12–16 October 2020; pp. 284–293. [Google Scholar]
  26. Ma, Z.; Jiang, Z.; Zhang, H. Hyperspectral Image Classification using Feature Fusion Hypergraph Convolution Neural Network. IEEE Trans. Geosci. Remote Sens. 2021, 60, 1–14. [Google Scholar] [CrossRef]
  27. Wang, J.; Ding, K.; Hong, L.; Liu, H.; Caverlee, J. Next-item recommendation with sequential hypergraphs. In Proceedings of the 43rd International ACM SIGIR Conference on Research and Development in Information Retrieval, Xi’an, China, 25–30 July 2020; pp. 1101–1110. [Google Scholar]
  28. Xia, X.; Yin, H.; Yu, J.; Wang, Q.; Cui, L.; Zhang, X. Self-Supervised Hypergraph Convolutional Networks for Session-based Recommendation. In Proceedings of the AAAI Conference on Artificial Intelligence, Virtually, 2–9 February 2021; Volume 35, pp. 4503–4511. [Google Scholar]
  29. Peng, D.; Zhang, S. GC–HGNN: A global-context supported hypergraph neural network for enhancing session-based recommendation. Electron. Commer. Res. Appl. 2022, 52, 101129. [Google Scholar] [CrossRef]
  30. Madine, M.; Rekik, I.; Werghi, N. Diagnosing Autism Using T1-W MRI With Multi-Kernel Learning and Hypergraph Neural Network. In Proceedings of the 2020 IEEE International Conference on Image Processing (ICIP), Abu Dhabi, United Arab Emirates, 25–28 October 2020; pp. 438–442. [Google Scholar]
  31. Xu, C.; Li, M.; Ni, Z.; Zhang, Y.; Chen, S. GroupNet: Multiscale Hypergraph Neural Networks for Trajectory Prediction with Relational Reasoning. In Proceedings of the IEEE/CVF Conference on Computer Vision and Pattern Recognition, New Orleans, LA, USA, 19–24 June 2022; pp. 6498–6507. [Google Scholar]
  32. Luo, L. Principles of Neurobiology; Garland Science: New York, NY, USA, 2020. [Google Scholar]
  33. Pashkovski, S.L.; Iurilli, G.; Brann, D.; Chicharro, D.; Drummey, K.; Franks, K.M.; Panzeri, S.; Datta, S.R. Structure and flexibility in cortical representations of odour space. Nature 2020, 583, 253–258. [Google Scholar] [CrossRef]
  34. Aqrabawi, A.J.; Kim, J.C. Olfactory memory representations are stored in the anterior olfactory nucleus. Nat. Commun. 2020, 11, 1246. [Google Scholar] [CrossRef]
  35. Mao, Z.H.; Massaquoi, S.G. Dynamics of winner-take-all competition in recurrent neural networks with lateral inhibition. IEEE Trans. Neural Netw. 2007, 18, 55–69. [Google Scholar] [CrossRef]
  36. Cao, C.; Huang, Y.; Wang, Z.; Wang, L.; Xu, N.; Tan, T. Lateral inhibition-inspired convolutional neural network for visual attention and saliency detection. In Proceedings of the Thirty-Second AAAI Conference on Artificial Intelligence, New Orleans, LA, USA, 2–7 February 2018. [Google Scholar]
  37. Păiș, V. RACAI at SemEval-2022 Task 11: Complex named entity recognition using a lateral inhibition mechanism. In Proceedings of the 16th International Workshop on Semantic Evaluation (SemEval-2022), Seattle, WA, USA, 14–15 July 2022; pp. 1562–1569. [Google Scholar]
  38. Kim, S.; Thiessen, P.A.; Bolton, E.E.; Chen, J.; Fu, G.; Gindulyte, A.; Han, L.; He, J.; He, S.; Shoemaker, B.A.; et al. PubChem substance and compound databases. Nucleic Acids Res. 2016, 44, D1202–D1213. [Google Scholar] [CrossRef]
  39. Landrum, G. RDKit: A Software Suite for Cheminformatics, Computational Chemistry, and Predictive Modeling. 2013. Available online: http://www.rdkit.org (accessed on 10 August 2021).
  40. He, K.; Zhang, X.; Ren, S.; Sun, J. Deep residual learning for image recognition. In Proceedings of the IEEE Conference on Computer Vision and Pattern Recognition, Las Vegas, NV, USA, 27–30 June 2016; pp. 770–778. [Google Scholar]
  41. Nielsen, C.J. Effect of scenario and experience on interpretation of mach bands. J. Endod. 2001, 27, 687–691. [Google Scholar] [CrossRef]
  42. Müller, N.G.; Mollenhauer, M.; Rösler, A.; Kleinschmidt, A. The attentional field has a Mexican hat distribution. Vis. Res. 2005, 45, 1129–1137. [Google Scholar] [CrossRef]
  43. Casanova, M.F.; Buxhoeveden, D.; Gomez, J. Disruption in the inhibitory architecture of the cell minicolumn: Implications for autisim. Neuroscientist 2003, 9, 496–507. [Google Scholar] [CrossRef]
  44. Chen, T.; Xu, M.; Hui, X.; Wu, H.; Lin, L. Learning semantic-specific graph representation for multi-label image recognition. In Proceedings of the IEEE/CVF International Conference on Computer Vision, Seoul, Korea, 27–2 November 2019; pp. 522–531. [Google Scholar]
  45. Pennington, J.; Socher, R.; Manning, C.D. Glove: Global vectors for word representation. In Proceedings of the 2014 Conference on Empirical Methods in Natural Language Processing (EMNLP), Doha, Qatar, 25–29 October 2014; pp. 1532–1543. [Google Scholar]
  46. Chen, L.; Wu, L.; Hong, R.; Zhang, K.; Wang, M. Revisiting Graph Based Collaborative Filtering: A Linear Residual Graph Convolutional Network Approach. In Proceedings of the AAAI Conference on Artificial Intelligence, New York, NY, USA, 7–12 February 2020; Volume 34, pp. 27–34. [Google Scholar]
  47. Guo, H.; Tang, R.; Ye, Y.; Li, Z.; He, X. DeepFM: A factorization-machine based neural network for CTR prediction. arXiv 2017, arXiv:1703.04247. [Google Scholar]
  48. Xiao, J.; Ye, H.; He, X.; Zhang, H.; Wu, F.; Chua, T.S. Attentional factorization machines: Learning the weight of feature interactions via attention networks. arXiv 2017, arXiv:1708.04617. [Google Scholar]
  49. Vaswani, A.; Shazeer, N.; Parmar, N.; Uszkoreit, J.; Jones, L.; Gomez, A.N.; Kaiser, Ł.; Polosukhin, I. Attention is all you need. Adv. Neural Inf. Process. Syst. 2017, 30, 5998–6008. [Google Scholar]
  50. Kingma, D.P.; Ba, J. Adam: A method for stochastic optimization. arXiv 2014, arXiv:1412.6980. [Google Scholar]
  51. Srivastava, N.; Hinton, G.; Krizhevsky, A.; Sutskever, I.; Salakhutdinov, R. Dropout: A simple way to prevent neural networks from overfitting. J. Mach. Learn. Res. 2014, 15, 1929–1958. [Google Scholar]
  52. Simonyan, K.; Zisserman, A. Very Deep Convolutional Networks for Large-Scale Image Recognition. In Proceedings of the 3rd International Conference on Learning Representations, ICLR Conference Track Proceedings, San Diego, CA, USA, 7–9 May 2015. [Google Scholar]
  53. Chollet, F. Xception: Deep learning with depthwise separable convolutions. In Proceedings of the IEEE Conference on Computer Vision and Pattern Recognition, Honolulu, HI, USA, 21–26 July 2017; pp. 1251–1258. [Google Scholar]
Figure 1. The overall architecture of the proposed olfactory perception model HGAFMN.
Applsci 12 08777 g001
Figure 2. Frequency distribution of different odor descriptors.
Applsci 12 08777 g002
Figure 3. Number distribution of descriptors of different odor molecules.
Applsci 12 08777 g003
Figure 4. Co-occurrence matrix for odor descriptors.
Applsci 12 08777 g004
Figure 5. Hypergraph construction processes. (a) The hypergraph structure for odor molecule–odor descriptor modeling. (b) The construction method of the hypergraph.
Applsci 12 08777 g005
Figure 6. Lateral inhibition-inspired dynamic convolution.
Applsci 12 08777 g006
Figure 7. Lateral inhibition-inspired attention mechanism.
Applsci 12 08777 g007
Figure 8. The loss plot, accuracy plot, and AUROC plot of the proposed HGAFMN. (a) loss plot, (b) accuracy plot, (c) AUROC plot.
Applsci 12 08777 g008
Figure 9. (a) Experimental results of model variants on F1-score; (b) experimental results of model variants on AUROC.
Applsci 12 08777 g009
Figure 10. (a) Performance comparison with respect to layers of HGNNs on F1-score; (b) performance comparison with respect to layers of HGNNs on embedding size.
Applsci 12 08777 g010
Figure 11. (a) Performance comparison with respect to dropout rate; (b) performance comparison with respect to embedding size.
Applsci 12 08777 g011
Table 1. Comparison of odor descriptor prediction results with other models. The best values for each metric are in bold, while the second best values for each metric are marked with “†”.
ModelsPrecisionRecallF1AUROC
DREAM
Winner [4]
0.30630.31100.30820.8304
GNN-QSOR [5]0.36140.37010.36530.8618
DNN-CNN [6]0.5294 0.5307 0.5301 0.7851
Our Proposal0.65520.77010.70810.8656
Publisher’s Note: MDPI stays neutral with regard to jurisdictional claims in published maps and institutional affiliations.

