Article

ARION: A Digital eLearning Educational Tool Library for Synchronization Composition & Orchestration of Learning Session Data

by
Alexandros Papadakis
1,
Anastasios Barianos
1,
Michail Kalogiannakis
2,
Stamatios Papadakis
2 and
Nikolas Vidakis
1,*
1
Department of Electrical and Computer Engineering, School of Engineering, Hellenic Mediterranean University, 714 10 Heraklion, Greece
2
Department of Preschool Education, University of Crete, 700 13 Heraklion, Greece
*
Author to whom correspondence should be addressed.
Appl. Sci. 2022, 12(17), 8722; https://doi.org/10.3390/app12178722
Submission received: 27 July 2022 / Revised: 23 August 2022 / Accepted: 23 August 2022 / Published: 31 August 2022
(This article belongs to the Special Issue New Challenges in Serious Game Design)

Abstract

:
In the last decade, there has been increased use of eLearning tools. Platforms and ecosystems supporting digital learning generate a vast amount of data and information in various forms and formats. Digital repositories emerge, such as video, audio, emotional data, and data triplets of various events’ educational activities, making data management and orchestration extremely difficult. This results in evaluating learning sessions’ generated knowledge to remain unexploited. In other disciplines, such as law enforcement, various tools produce valuable data that help solve problems or improve situations by synchronizing several modalities. The data generated in educational learning sessions is an untapped treasure trove of information that can contribute to the production of essential conclusions that would be extremely difficult or impossible to produce with conventional methods and without the use of digital tools. ARION combines learning data into simple and understandable forms of information that will lead the teacher to a better understanding of the strengths and weaknesses of students, the lesson, the educational process, and himself by providing a critical look at available data aimed at a substantial improvement of all components of the learning path.

1. Introduction

The past decades have been characterized by exponential economic and technological growth, and unforeseen disruptions have been witnessed in all aspects of life, especially in the industrial and business spheres. The catalyst behind this accelerated evolution is the increased processing capabilities of modern electronics in conjunction with the internet and the World Wide Web. These technological achievements have transformed most aspects of daily life, including communication, education, and entertainment. Due to the unfortunate COVID-19 pandemic, the current global reality has proved how deep technology has gotten into our lives and how fast it can respond to new needs. Within a few days, platforms were ready to support the global economy in a remote working situation, learning and education were moved to virtual classrooms for the first time, and virtual meetings became the norm. Humanity was unprepared but capable of following this abrupt lifestyle change and quickly embraced technology as part of most daily activities. Online platforms and trade grew at never seen rates, while people of all ages turned to digital services for all their needs.
In the framework of higher education institutions (HEI), digital transformation may be defined as the total of all digital activities necessary to complete a transformation process that allows higher education institutions to employ digital technology [1] optimally. During the COVID-19 Pandemic, HEIs’ shift to online learning impacted learners, educators, and learning performance. Unfortunately, many educational institutions (E.I.), educators, and students were not ready for this new experience [2]. To promote learning, education institutions deployed online learning systems with varying capabilities and tactics [3]. HEIs used various instructional methods, including direct online lectures, audio, and video tutorials, shared online materials, and blended learning [4], while employing online evaluation tools, including online quizzes, examinations, and assignments [5]. Education institutions had to adapt to online teaching quickly. As a result of this unexpected and rash transition, they had to utilize and modify their existing technology resources and human forces, such as professors and researchers who lack the intrinsic technological skills for online teaching [6].
Hodges et al. [7] distinguished appropriately prepared online learning experiences from crisis-response courses. These researchers called online education during the epidemic “emergency remote teaching” (ERT) instead of quality or successful online learning. Online teaching and learning, supported by numerous research works, concepts, prototypes, theories, ethics, and benchmark evaluation, focus on high-quality online course design, teaching, and learning, are all essential components of effective online education [7]. During the COVID-19 pandemic, education has moved online with ERT, with global educational systems and virtual environments [7]. Even though ERT is not a form of eLearning, it shows that technology provides the means to support large-scale learning.
eLearning is supported using different course types, methodologies, tools, and technologies such as Massive Open Online Courses (MOOCs), Serious Games, Learning Management Systems (LMSs), and more. eLearning course types, methodologies, tools, and technologies share common technological artefacts such as cameras to stream videos of the learners or learning sessions, written conversation mechanics (chats and forums), quizzes or puzzles, and more.
In all cases, the students have an active role, different from the one in a classroom; even when they are watching a teacher (live or recorded), they have access to many tools that might engage or distract them from the active subject. Of course, distractions are also present in the classroom; however, one of the differences is that in a digital environment, action, or even inactivity, can be tracked differently, unlocking valuable information about how students learn and interact during their learning sessions. With the advancement in artificial intelligence and image processing, it is possible to identify faces and even a person’s emotions just by a video feed. Learning analytics has made it easy to understand when, where, and how students learn the most and what parts of the lesson they do not focus on. Through live chats and chatbots, it is possible to extract valuable information or even motivate students facing difficulties at any given moment. It is evident that learning has radically changed, offering a multitude of tools to teachers.
Serious Games, introduced as early as 1970 [8], are maybe the most complex and sophisticated in the technical scope of the tools used in education. Serious, or Educational, Games are games with a decisive educational goal and lean heavily on it, leaving entertainment as a secondary goal of the game [9,10]. There was heavy criticism towards serious games in the early years, but this is now in the past, with scientists and educators endorsing games as valuable educational tools with very high potential for education [11,12]. The success of educational games as tools has spread to the point where educators wish to create their small games without having the technical skills or background. Thus, a set of tools named Authoring Tools were created, which educators can use to create simple games, puzzles, or interactive stories with which their students can have an interactive experience while learning [13].
Furthermore, there is a growing interest in adaptive and personalized learning [14,15,16]. Adaptive learning techniques adjust the way educational material is presented to each student, affecting the presentation or navigation, for instance, and thus creating a personalized syllabus for each student, ultimately leading to all students reaching the same level of knowledge through different learning paths [17].
Modern educational tools have expanded, containing rich and varied features with complex functionalities. Each feature plays a significant role in the learning process, which is yet to be understood and crucial to improving digital and traditional learning [11]. eLearning is highly fragmented with scattered features, tools, and services, which in the circumstances is a very positive reality, offering diversity, variety, heterogeneity, and multiple capabilities. Nevertheless, at the same time, it makes it almost impossible to study the effects and deeply understand the benefits and drawbacks of each approach or even what action is needed to improve each method.
Based on the above observation, this paper intends to utilize the logging systems available in modern eLearning tools to assist educators in monitoring learning sessions more efficiently and extract valuable conclusions about (a) the learning process, (b) the way students learn, and (c) the tools used. In future work, the authors aim to automate this assessment procedure so that it can be applied to extensive data collections and unlock valuable knowledge about learning in the digital world.

2. Background Work

2.1. Data Orchestration

Data Orchestration in software engineering is linked mainly with service-oriented programming, virtualization, and cloud computing. A definition of orchestration in this context is the coordination and management of various entities to achieve the best possible outcome [18]. Depending on the context, orchestration can be further defined to better describe its purpose in the specific context. In service-oriented programming, the term can be defined as “a combination of services to create higher-level services and processes” [19]. In the field of computer-supported collaborative learning (CSCL), it is defined as: “the process of productively coordinating supportive interventions across multiple learning activities occurring at multiple social levels” [20]. The amount of data produced on an organization, or even applicational, is increasing daily at high rates. Therefore, the technologies used for storage management systems change frequently to best cover the current needs. One can say that if the data are managed well, there is no need for data orchestration, but this is a challenging task to accomplish, especially for legacy applications, already existing and producing data for years, creating data separation and through multiple management systems. Data orchestration is needed to unify data management and research between all systems. Data orchestration solves deduplication, lead-to-account matching, and data cleansing problems. In general, it minimizes missed data and ensures data integrity. Furthermore, by using data orchestration, privacy laws can be followed quickly, guarantee compliance with them, and provide the necessary information they require (how, when, and where the user data are used).

2.1.1. Current Technological Trends in the Steps of Data Orchestration

Any data orchestration tool or platform has a goal to highlight data overlooked from previous procedures applied to the provided set. Thus, each data point can act in harmony with all other available data while it is also examined as an individual unit and a part of the more extensive data set. Due to the broad spectrum of applications and fields utilizing these techniques, data orchestration solutions present various workflows, procedures, and milestones. There is no universal system. However, a general association of procedures and workflows that can define data orchestration can be identified. This workflow is comprised of the following steps [21].

Organize

Data are shaped and structured in this step according to the system before admission to ensure integrity and formatting. This step includes data validation to ensure that the incoming data are correct and not malicious, put labels or combine new data with existing information. Usually, APIs are provided by companies for this task to facilitate the process.

Transform

After the collection and validation of the data, data orchestration tools transform the data into one standard format. Making all the data have the same format makes the data analysis quicker and helps avoid possible errors, thus minimizing the risk of feeding the system with false information that will lead to mistaken conclusions.

Activate

Activation is the process of sending the available data to the tools requesting them. Such tools can be analytics platforms, management solutions, business intelligence, and more.

2.1.2. Orchestration in Learning

Orchestration in learning can be used in various aspects [22,23]. One of them includes the planning of the learning activities in such a way that will ensure that the activities will be achieved. Another aspect is the management of the learning processes to maximize the outcome [24]. Furthermore, orchestration can be characterized as the adaptation or intervention to design learning activities [25]. Assessment can provide information about how good, or bad the learning outcomes are; thus, orchestrating the assessment can benefit learners because the learning material can be adapted to their needs as the teachers can better adapt their teaching to the learner [24]. Finally, orchestration can be made from various perspectives, usually from the teacher’s perspective, but some approaches take the learner’s perspective. Orchestration in learning should ensure that combined learning activities can be well-orchestrated to deliver the desired learning outcome despite conditions that might change during the learning process [21]. Robust orchestration models for various learning scenarios should be created as the complexity of learning is increasing [23].

2.2. Video & Audio Synchronization

Video and audio synchronization is the attempt to gather information about an event from various devices or time segments and organize this information in the correct order so that the produced outcome will reflect the truth about the event [26]. The need for audio and video synchronization has peaked, due to the widespread use of mobile devices with embedded cameras, resulting in multiple recordings of the same event, from multiple attendees, without the need for specialized equipment. This results in low-resolution videos and audio, blurry, and most often noisy [26,27]. Having much data about an event from different sources makes extracting information hard; the extraction task is even more challenging when that data is also of different quality or specifications. Therefore, the synchronization of video and audio has many applications in the modern world, from free-view video to the detection of human rights violations [26].

Techniques

Most standard techniques to synchronize two or more videos are based on tracking visual features [28,29]. Such methods require the same visual features to be visible in both videos, which is not always applicable as videos can be captured from a different perspective or location. Another technique is to mark the beginning of videos using clapping boards or by using jam sync, which synchronizes the camera clocks [30], but these techniques are not applicable “in the wild”, as both are professional techniques requiring not only expensive hardware but also a stable set up of cameras in a controllable environment.
Due to the visual features tracking limitations, audio synchronization is used for outdoor videos, and audio fingerprinting has proven a promising technique for synchronization. This, in turn, imposes new challenges, as microphones capturing the scene might be far apart, or the sound might cut on one of them. Furthermore, sound can lose quality from compression or noise, thus leading to deviations in pairwise matches. RANSAC or similar methods are regularly used to improve and form a more robust result.
According to the literature, bottom-up approaches are the most used [29,31]. This approach starts by matching single pairs and continues by merging them gradually until it reaches a global alignment. This perspective implements audio fingerprinting to match single pairs into larger clusters through reversed-indexing correlation evaluation. As in [32], many similar techniques apply clustering to the matched scores. However, bottom-up approaches have proven the frailty of outliers due to poor matches, which should be removed from the start. Otherwise, false data can be gathered throughout the process resulting in erroneous outcomes.

2.3. Data Visualization

Data visualization is a research field that studies how data can be visualized to be better understood by humans. It is known that for the human eye, it is easier to spot differences in shapes, for instance, what line is the longest or what colours are included in a canvas rather than in a table of numbers.
Therefore, data visualization can be traced back to the beginning of civilization when tables with the position of the stars and other celestial objects were used. Geometric diagrams have also been used for many centuries, as well as exploration and navigation maps [33]. In the 17th century, coordinates systems, analytic geometry, and theories of errors of measurement (Descartes, Fermat, Galileo) made their initial steps. Later in the 18th century, with the help of statistics, more information started to appear on maps as economics. At the start of the 19th century, modern graphics were established with the first histograms, bars, pie charts, and more. During the same century, the first 3-D surface plot appeared. The following century started with limited advancements only to give space in the second half that the leaf plots and boxplots materialized, better organization of data based on visual and perceptual elements, and finally, the FORTRAN programming language was developed which was the first high-level programming language. Since 1975 and after, data visualization has been a complete research area.
Many disciplines are contributing to data visualization [34]; one is psychology, which studies the impact of shapes, colours, sizes, and the perception of data. Computer science and statistics help to develop new techniques and technologies to handle data, such as machine learning and data mining. Additionally, infographics and dashboards are created using graphical and multimedia techniques using different shapes, colours, scales, and data.
The graphical representation of data makes it easier for the human eye to interpret the information. There are many techniques and diagrams to better suit the data that needs to be displayed. As stated before, shapes, colours, and sizes can help humans to understand the data, but the overuse of colours might be misleading, so it needs careful treatment to ensure the correct meaning is communicated. Another aspect that needs attention is highlighting unimportant information that can destruct from the critical data on the diagrams [34].
As data visualization is widely used nowadays, from marketing and economy to demographics, an increasing number of people are involved in this field. That leads to new challenges that need further study [35]. The first significant challenge is that people that need to use or produce data visualizations can have very varied backgrounds. Thus, there is a need for tools that will make it possible for people to create and understand data visualization from heterogeneous datasets that might contain noise or bad quality entities without the need for robust data science or I.T. background. Additionally, there is a need for tools that will allow data scientists to perform data exploration without requiring data manipulation or analytics skills.
Furthermore, as the data are increasing, a necessity for new techniques to provide fast results has arisen. For closure, with the advancements of artificial intelligence and machine learning, research on how to capitalize on those techniques to provide better graphs depending on the content of the data is promising. A cheat sheet for data visualization techniques is presented by Wang et al. [36].

2.4. Learning Analytics: The Experience API

Learning analytics is a recently developed discipline that focuses on using sophisticated analytic techniques in a learning environment to improve education. It draws on other fields of study, including game and web analytics, business intelligence, and web educational data mining, and is intimately linked to them. Learning analytics is based on the premise that learning is a product of interaction [37]. The idea behind this premise is to note each interaction and any usable information about it and then analyze the sum of interactions to produce information that can be used to evaluate learning.
Experience API (xAPI) is a framework that implements learning analytics standards. Through it, the authors facilitate data capturing, retrieval, and visual presentation of valuable information, utilizing data visualization techniques. It is used in learning technologies as a middleware for communication between software and Learning Record Store (LRS), the database where each action is recorded. This way, xAPI enables very different systems to communicate securely while capturing and sharing user experience data [36]. The strength of Experience API lies in its flexibility, which stems from its architecture. This architecture is comprised of statements that represent a single action. This action is sent to an LRS in JSON form through HTTP communications and retrieved from it when need be, using the same standard. Statements are in the form of “subject-verb-object”, or as the xAPI terms are, “actor-verb-object”, or, in layman’s terms, “Who-Did-What”. This structure gives the possibility of describing any situation imaginable during the creation of learning experiences. Verbs and objects can be retrieved from an official xAPI vocabulary or created by anyone to fulfil current needs, although the available vocabulary is quite extensive and can cover most possible situations.
Additionally, IOLAOS [38] has included a maturity level in which the inclusion of xAPI in educational activities is required. For IOALOS, the techniques provided by learning analytics, and xAPI, are crucial in extracting insightful knowledge and understanding of the digital learning procedure. The tools provided are helpful to game developers, teachers, and educational experts and thus are considered a necessity, and a discrete maturity level was created. Therefore, it is also considered crucial for analysis and orchestration in the system.

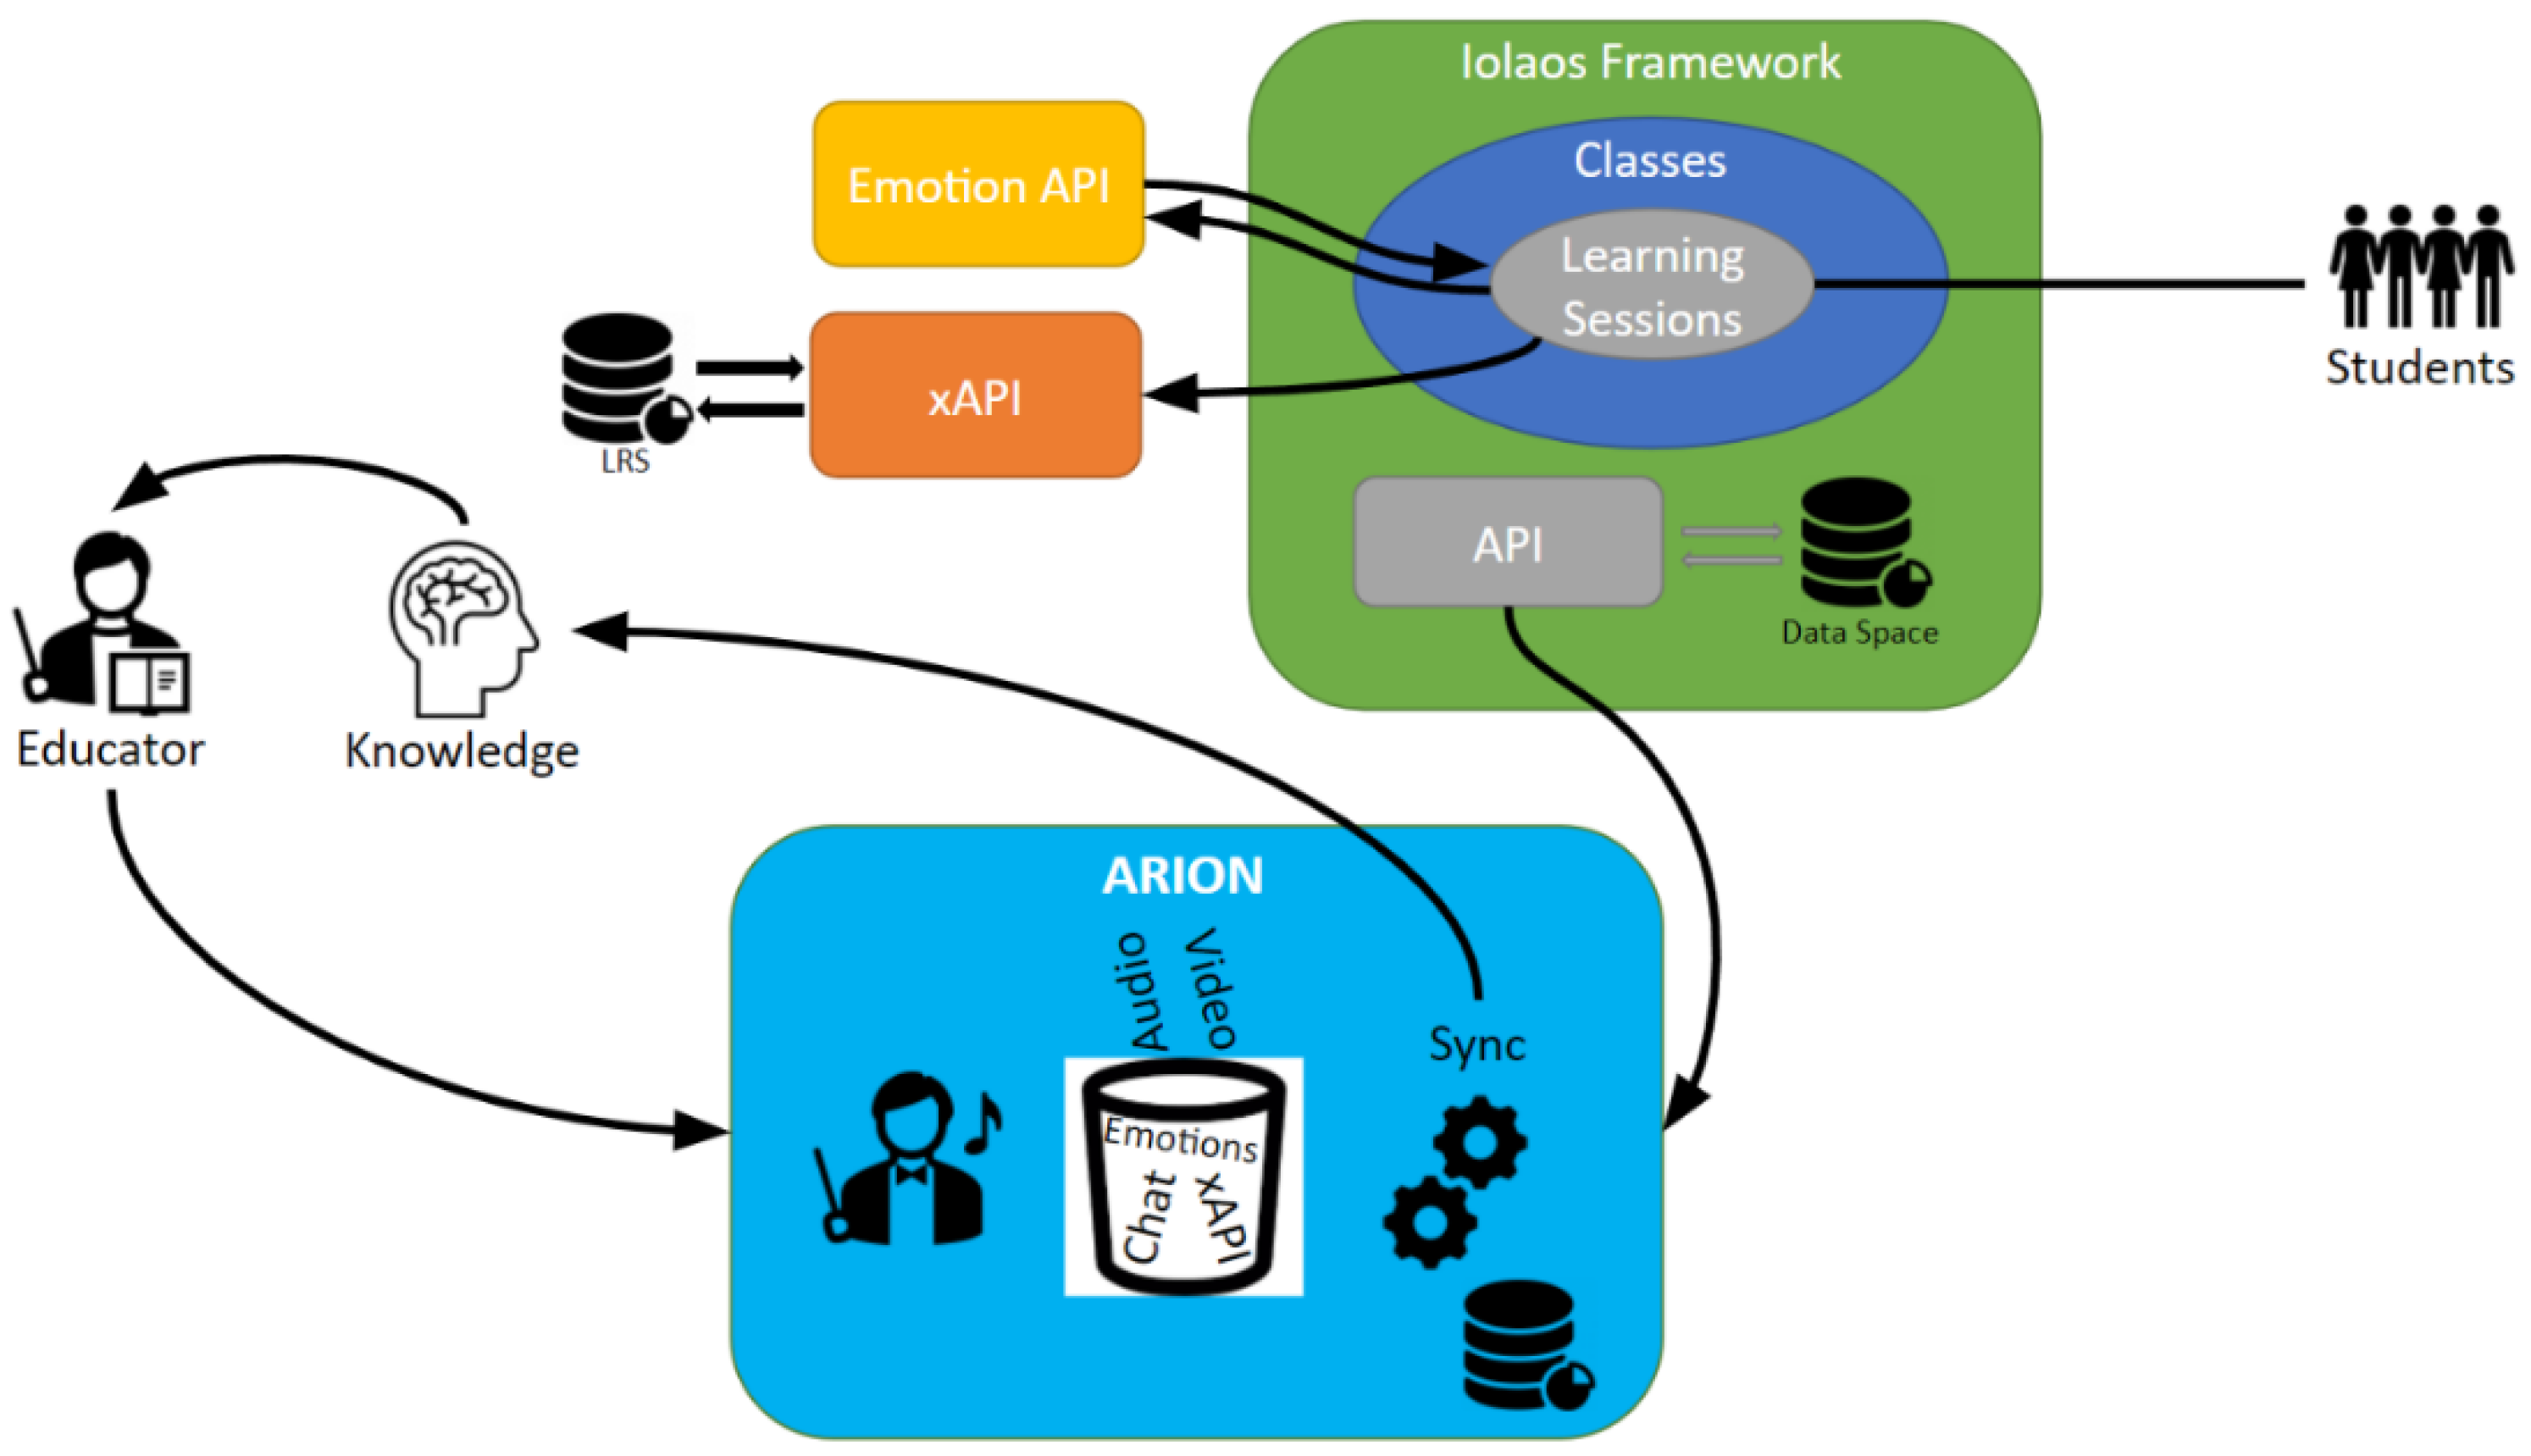
3. ARION: An Educational Data Orchestration Software

Through their research, the authors concluded that a system to unify logging data from multiple sources is necessary to identify weak and strong points in platforms, as well as the specific needs of students. The highly scattered nature of this logging data and the unimaginable numbers of formats and different representations make this a very challenging task. There are video feeds, proprietary and open-source action/logging formats, differing representations of written communications, good communications, and many more forms of data. All this data hides beneficial information for the educators, who unfortunately cannot sift and browse through this unstructured and scattered set of precise details. For this reason, a system was designed with the ability to retrieve data related to a specific learning session, wherever they may be stored and regardless of format. Subsequently, it presents them in a typical timeline that educators can study and gain insights into. This procedure would be impossible if the different sources were not combined; a necessary step is to define and use learning sessions technically. In this step, the theoretical and technical framework created by Vidakis and Charitakis [38] was adopted, in which learning sessions are thoroughly examined. Furthermore, utilizing the API created by the study mentioned above and complementary systems, such as ExperienceAPI [39] and EmotionAPI [40].
Figure 1: ARION System Overview illustrates a simplified view of the architecture. On the one end (top left corner), the students who interact with eLearning systems through the IOLAOS Framework [41,42] are illustrated. This can include virtual classrooms and serious games [43,44,45] in the current state of IOLAOS but can be expanded and populated with other technologies in the future. Any such change will not affect ARION as long as the logging systems remain the same. During this interaction, login data are created by students’ actions within the systems. If a serious game is played in a virtual classroom, for instance, the game will log all interactions in a Learning Record Store using xAPI, while the student’s screen and the video feed from her web camera will be stored in the IOLAOS Common Data Space. After the session, the Emotion API will query the Common Data Space and analyze all new videos, creating data about the emotions students experienced during play, categorized by seconds. At some other point, the educator has the time to review the results of this learning session, thus taking some time to visit ARION and sync the data for each student. At that moment, the ARION will query the IOLAOS API and retrieve any data for the specified learning session and student to present to the educator. Using the different modalities synced to the same timeline, the educator can make connections such as “At 01:30, student A lost some points due to an error, which made him feel angry, but at 02:00, he made his best score, probably motivated by his previous anger”. Thus, the interaction of the educator with the system has brought knowledge and comprehension of students and procedures that were currently unknown.

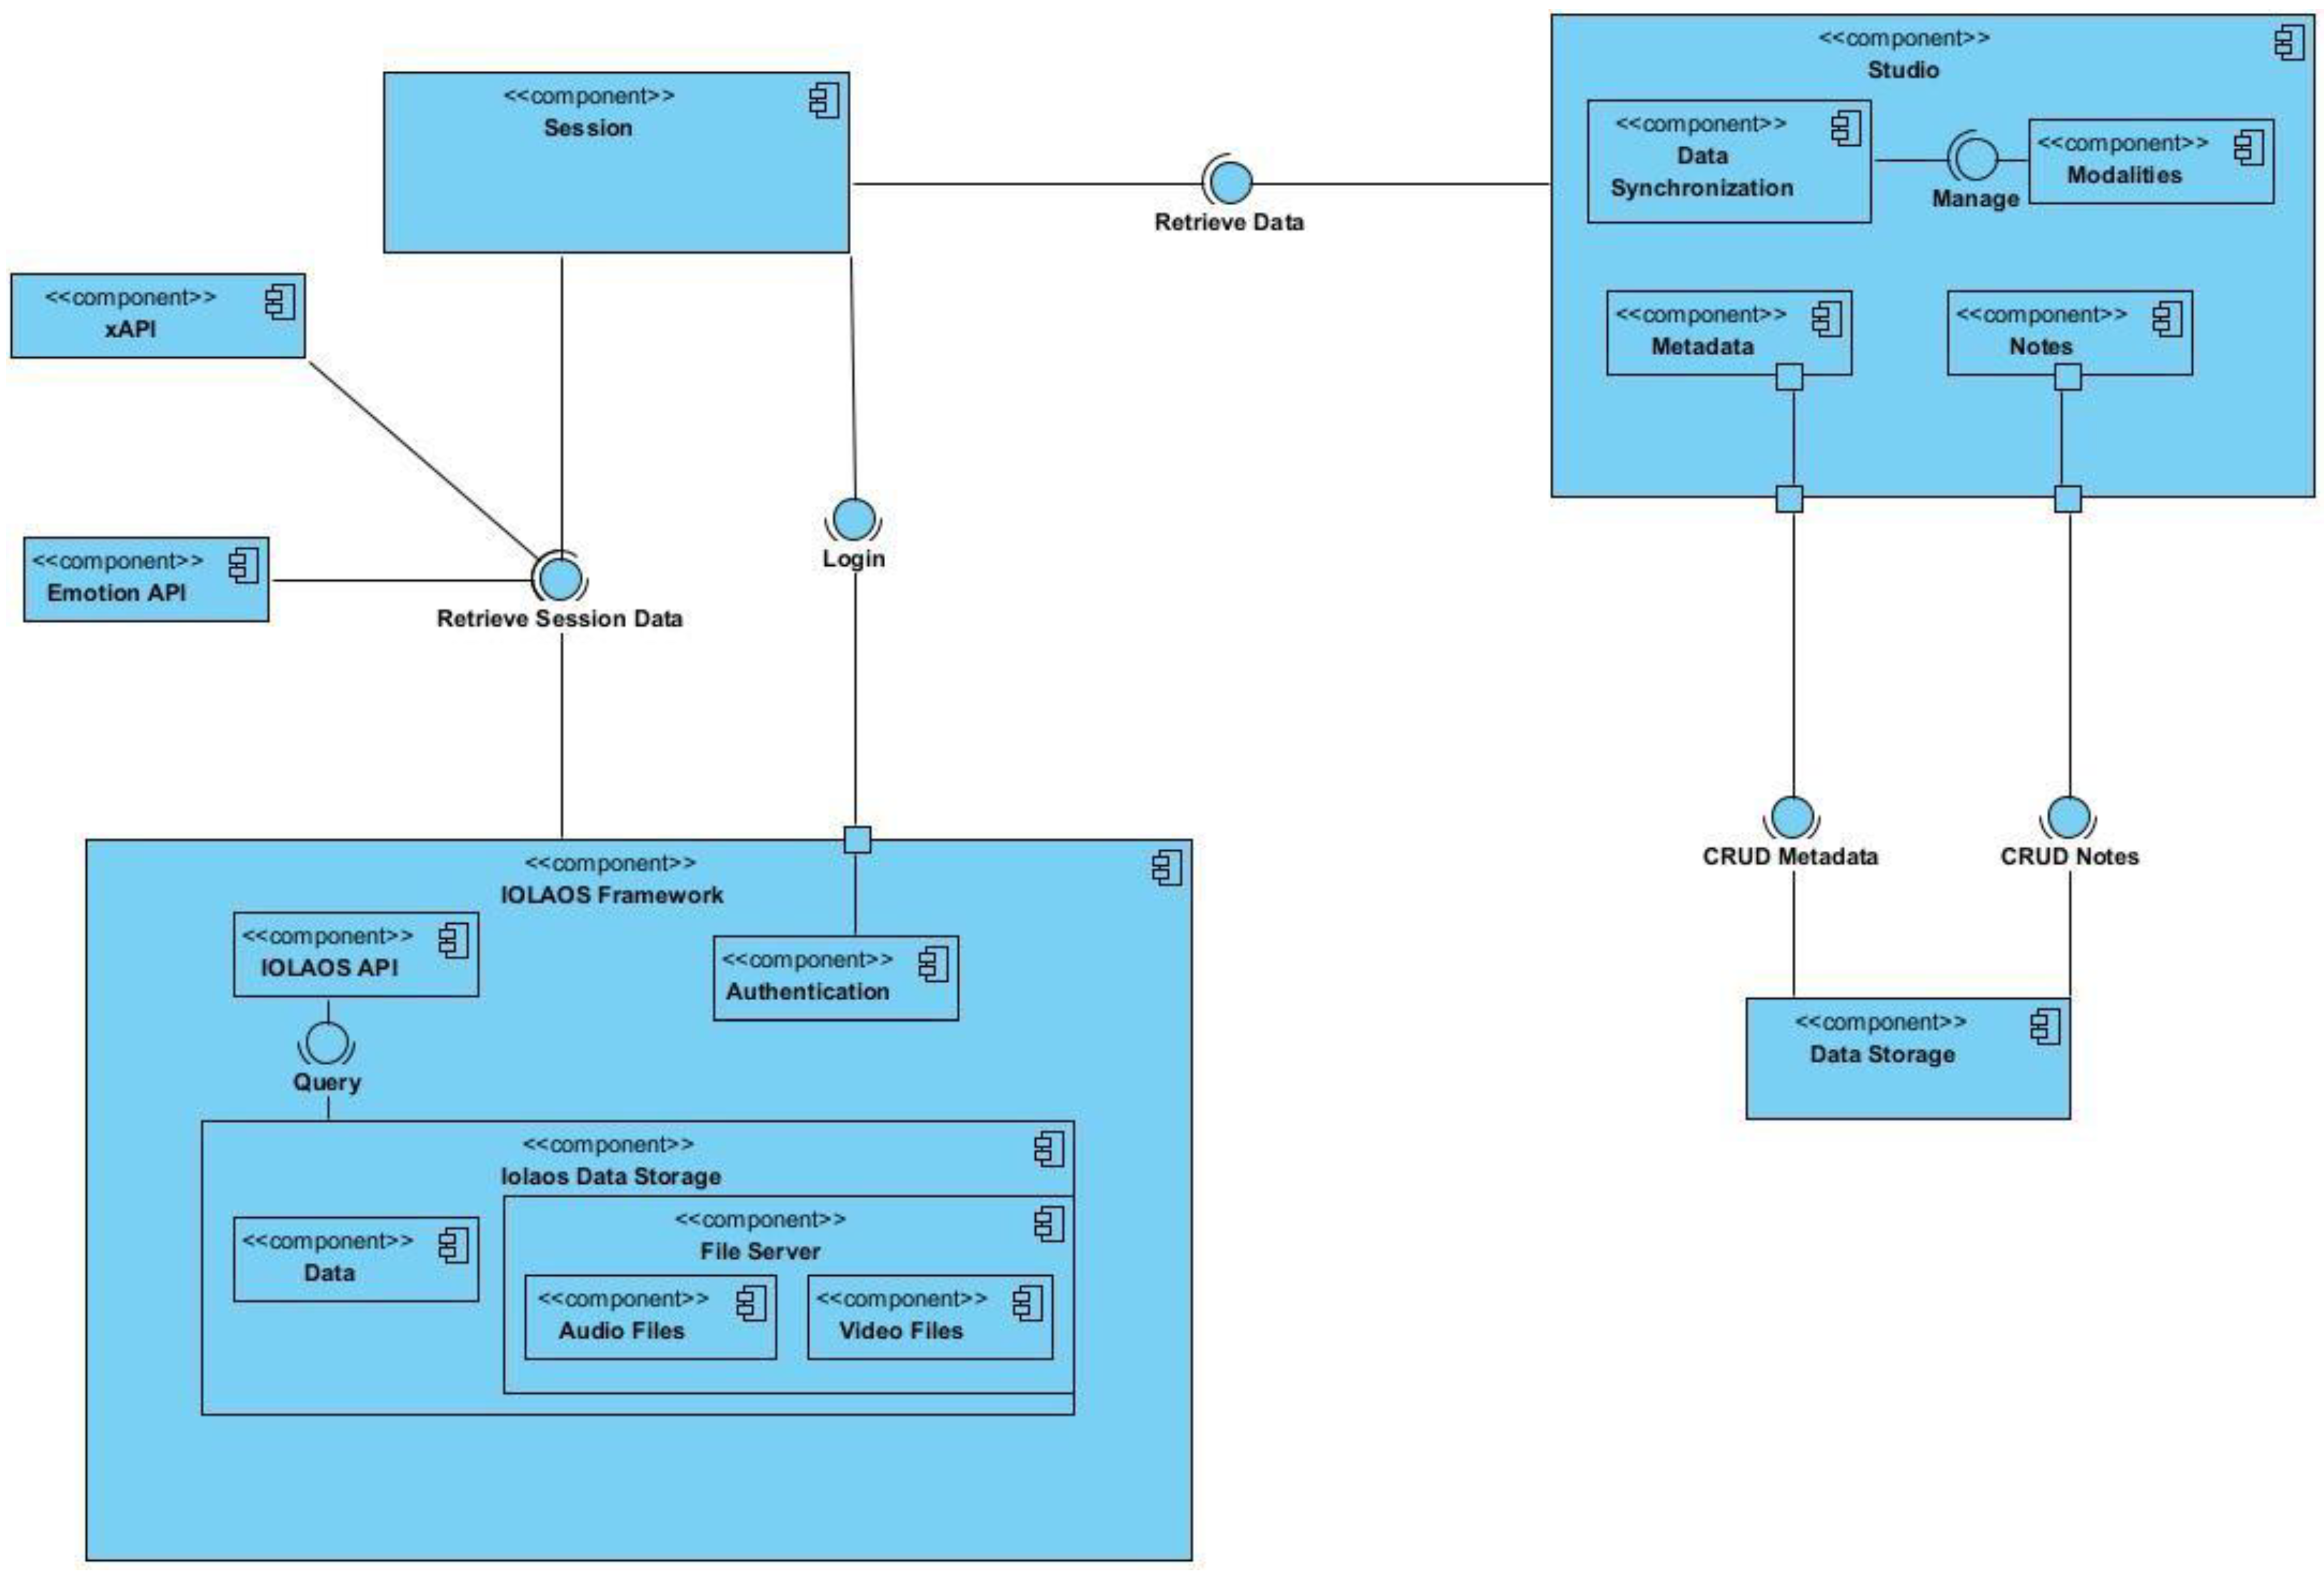
ARION Software Architecture

After doing the analysis and design described above, an architectural design for the ARION system was created, from which the component diagram of Figure 2: ARION Component Diagram was designed. In this, the main components of the system and communications with other systems, such as IOLAOS, are described. The Studio is introduced in the top left corner of the diagram, the part of the system that users will interact with. In this part of the system, Data Synchronization is included, which reflects the algorithms and procedures for retrieving and aligning all data into a typical timeline. To achieve this, it manages Modalities, another component of the system.
Additionally, through CRUD procedures, the Studio sends and receives data from the Data Storage modality, which is the remote storage of the system. The data saved on the Data Storage reflects two additional modalities: Metadata, which holds information on modalities, and Notes, which holds information and conclusions the educator wants to record in a written manner. For this part of the system to work, data needs to synchronize; thus, the data synchronization retrieves needed data from the Session component, which is the digital representation of learning sessions. Those sessions are introduced by the IOLAOS Framework [41,42] and are thus a shared component between the Studio and IOLAOS Framework. There are login and retrieval methods for each session, from which IOLAOS authentication is accessed and other valuable data from the shared data space or third parties. Through the IOLAOS API, access is granted to data stored in the IOLAOS Common Data Space: Audio and Video files, user profiles, etc. Third parties that will be supported on the first iteration of the ARION System are the Emotion API, which provides data on the emotions of students during learning sessions, extracted from videos stored on the IOLAOS common data space, and the interaction data stored in various LRSs, retrieved through xAPI, that might include virtual classroom data, game data and more.

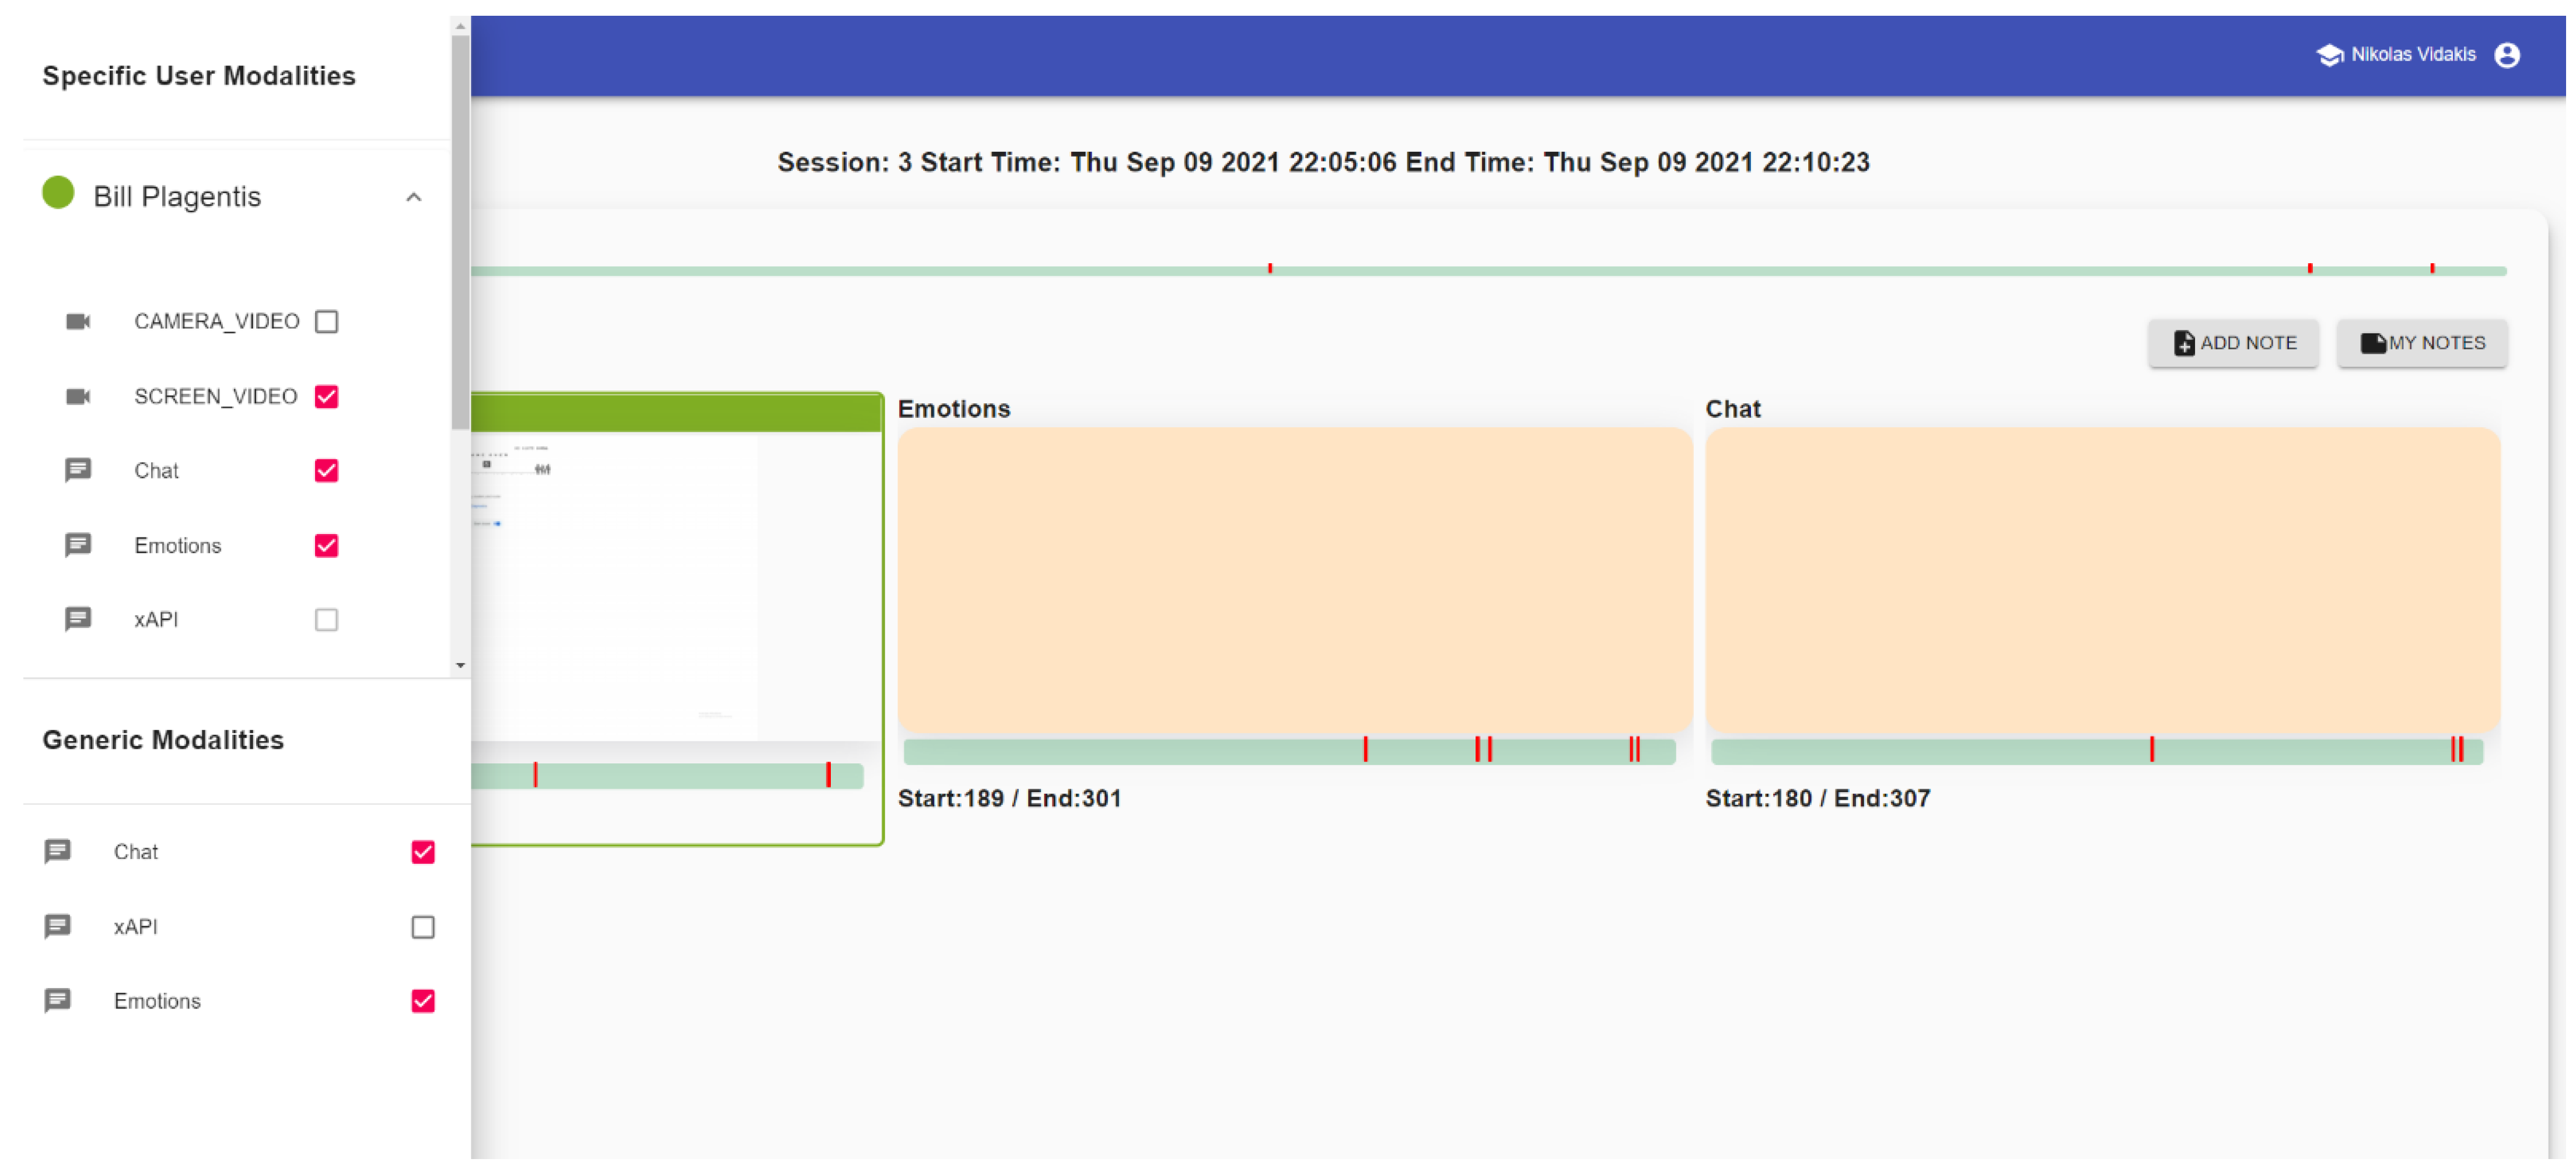
4. ARION: Experiment and Scenario of Use

The Pilot use case chapter is remarkable and showcases a descriptive scenario of the Arion platform. With this scenario, all aspects can be thoroughly illustrated, including the benefits and reasons for using the Arion platform.
An indicative scenario starts with a teacher whose schedule is a Learning session (an online version of a classroom lesson) on the IOLAOS platform for the GameHub [46] class. After the Learning Session is concluded, the Learning Analytics material generated by the IOLAOS platform, like screen or camera video and chat messages, are stored in the IOLAOS common data space [47]. The teacher’s goal is to assess his/her decisions regarding the learning preferences assigned to the students who participated in the Learning session. To achieve this goal, the teacher joins the Arion platform to evaluate the learning process [48,49] through the synchronization utility that the platform provides, utilizing the learning analytics materials stored by the IOLAOS platform during the learning session.
As the first step after wrapping up the learning session in the IOLAOS platform, the teacher starts the evaluation process through the Arion platform. The teacher goes to the Arion platform synchronization utility’s homepage and fills out the login form (Figure 3: Arion Platform login form. The teacher fills out the credentials needed to access the IOLAOS platform in that form, and authentication goes through the IOLAOS platform authentication system with the use of services. As it becomes apparent, every teacher (Arion user) must be registered on the IOLAOS platform at this implementation stage.
After successful login, the teacher is responsible for or acts as an assistant. With that view, the teacher has an organized view of all the classes and can easily navigate to the correct class for which he/she aims to evaluate one or more learning sessions. The classes are displayed as cards in a grid view, as shown in Figure 4: Available Classes View, and they can choose through the card button to see the available learning session.
Furthermore, after choosing the GameHub class from the available classes view Figure 4: Available Classes View, the teacher can see all the available learning sessions with some basic information about the creation date, the participants, the available videos, and chat messages like Figure 5: Available Class Learning sessions shows. After choosing our scenario’s latest learning session, the teacher presses the view button to load the synchronization view with the available data from the learning session.
Initially, the synchronization view (Open Studio) displays an empty player, similar to those found on video platforms such as YouTube, with two buttons that allow the teacher to create notes and view the notes he has already created. Additionally, as shown in Figure 6: Open Studio View, the top left corner appears to have a “burger” icon through which a menu of necessary tools is accessed.
That view is a canvas for all the modalities of the platform. The platform supports various modalities, with video being utilized for screen captures and camera video. The studio view has three modalities (shown in Figure 7a): the chat modality allows the platform to display the chat for all or specific participants. The xAPI modality, a collection of statistics from the game participants, played throughout the learning session, and the emotions modality derived from the emotion API, shows the results of the emotion analysis of all videos and chats from the learning session.
To access all those modalities, the user can click the burger icon from the top left of the U.I. interface, Figure 6. The user can enable the general modalities that he wishes, as shown in Figure 7a, and the user-specific modalities, as shown in Figure 7b, by selecting them. All users connected to the teacher are shown, and the teacher can enable their user-specific modalities such as the chat (if enabled), the camera, and the screen video modalities.
After selecting the platform’s available modalities, the U.I. places them in the central part of the open Studio and arranges them in a grid-like view where each modality is a tile, as shown in Figure 8: Open Studio with all the possible modalities.
The grid view at the current state supports a dynamic grid with a maximum size of 2 × 3. The grid also has dynamic features like drag and drop that allow changing the order of the available modalities. These enable a teacher to create a specific order of modalities, allowing him, for example, to have the videos of the users’ camera or screen, helping him to evaluate the learning process. After completing the process of adding modalities and ordering them, the teacher has a synchronized timeline based on the first and the last event from the enabled modalities, as seen in Figure 9: Open Studio with ordered modalities.
Furthermore, the teacher can start the timeline from the player of Open Studio and move the timeline to a specific time. For example, if the teacher wants to move the time at the start of the video, the teacher moves the timeline button. Every modality has a red indicator in the sub-timeline of the modality tile to help the user spot the available events and locate the video starting point, as shown in Figure 10: Camera Video modality with start and end event.
In addition to the timeline setup and the navigation, the teacher can note the timeline at specific times that he/she considers necessary. A red line appears in the timeline while a note is being created, indicating the note’s appearance. That indicator allows the teacher to recognize the frame in which the note was created and aids the teacher in remembering the remarkable events. The note creation is able through a button in the bottom right area of the U.I. (Figure 8: Open Studio with all the possible modalities) that opens a modal, as Figure 11: Note Creation Modal shows, and allows the teacher to type a message and save the note.
Finally, the teacher can access all the created notes and edit them through the My Notes bottom right area of the U.I. (Figure 8: Open Studio with all the possible modalities), which opens a modal (Figure 12: Available Notes Modal) that shows the available notes and provides the edit and delete functions.

5. Results and Discussion

This section summarizes the study’s purpose, method, and results and discusses the experiment’s outcomes.

5.1. The Purpose

The purpose of this study is to show how digital tools, such as the Arion platform—which gives possibilities to orchestrate learning session multichannel data—can assist educators and trainers in enhancing their understanding of the strengths and weaknesses of students. Furthermore, they assist them in critically looking at the available learning session data, including the learning material, the courses, and the educational process.

5.2. The Method

The experiment has been based on the Arion platform scenario of use.
The scenario of using the Arion platform starts with a teacher who schedules a Learning session (an online version of a classroom lesson) on the IOLAOS platform. After the Learning Session is concluded, the Learning Analytics material generated by the IOLAOS platform, like screen or camera video and chat messages, are stored in the IOLAOS common data space [47]. The teacher’s goal is to assess his/her decisions regarding the learning preferences assigned to the students who participated in the Learning session. To achieve this goal, the teacher joins the Arion platform to evaluate the learning process through the synchronization utility that the platform provides, utilizing the learning analytics materials stored by the IOLAOS platform during the learning session.
As described in Section 4, the experiment was conducted at the premises of the NILE laboratory of the Hellenic Mediterranean University, Estavromenos, 71410 Heraklion, Crete, Greece https://nile.hmu.gr/ and was involving seven participants (four male undergraduate students and three male postgraduate students). Before the experiment, there were four full laboratory academic hour trial sessions where the participants became acquainted with the learning objects. The experiment duration was a full laboratory academic hour which is 45 min. The experiment was divided into two sessions: (a) the learning session mainly supported by the IOLAOS platform and (b) the evaluation session supported by the ARION platform.

5.3. The Learning Session

The seven student participants interacted with the learning objects during the learning session. During their interaction, they created learning session data stored in IOLAOS’s repository in various forms such as video, ASCII files, RDB schema records, and the Learning Recording System L.L. for the xAPI triplets. In detail, the three different learning objects that were used are: (a) the Eurytus software that allows students to learn programming languages and software design patterns, (b) a 3D Educational Game for Recycling, and (c) a picture match memory game all designed and developed at the NILE Laboratory. At run time, these three learning objects have generated xAPI triplets, used the emotions API to identify and store emotions, utilized the IOLAOS’s chat facility to gather user comments, and employed IOLAOS’s repository for learners and learning session information.

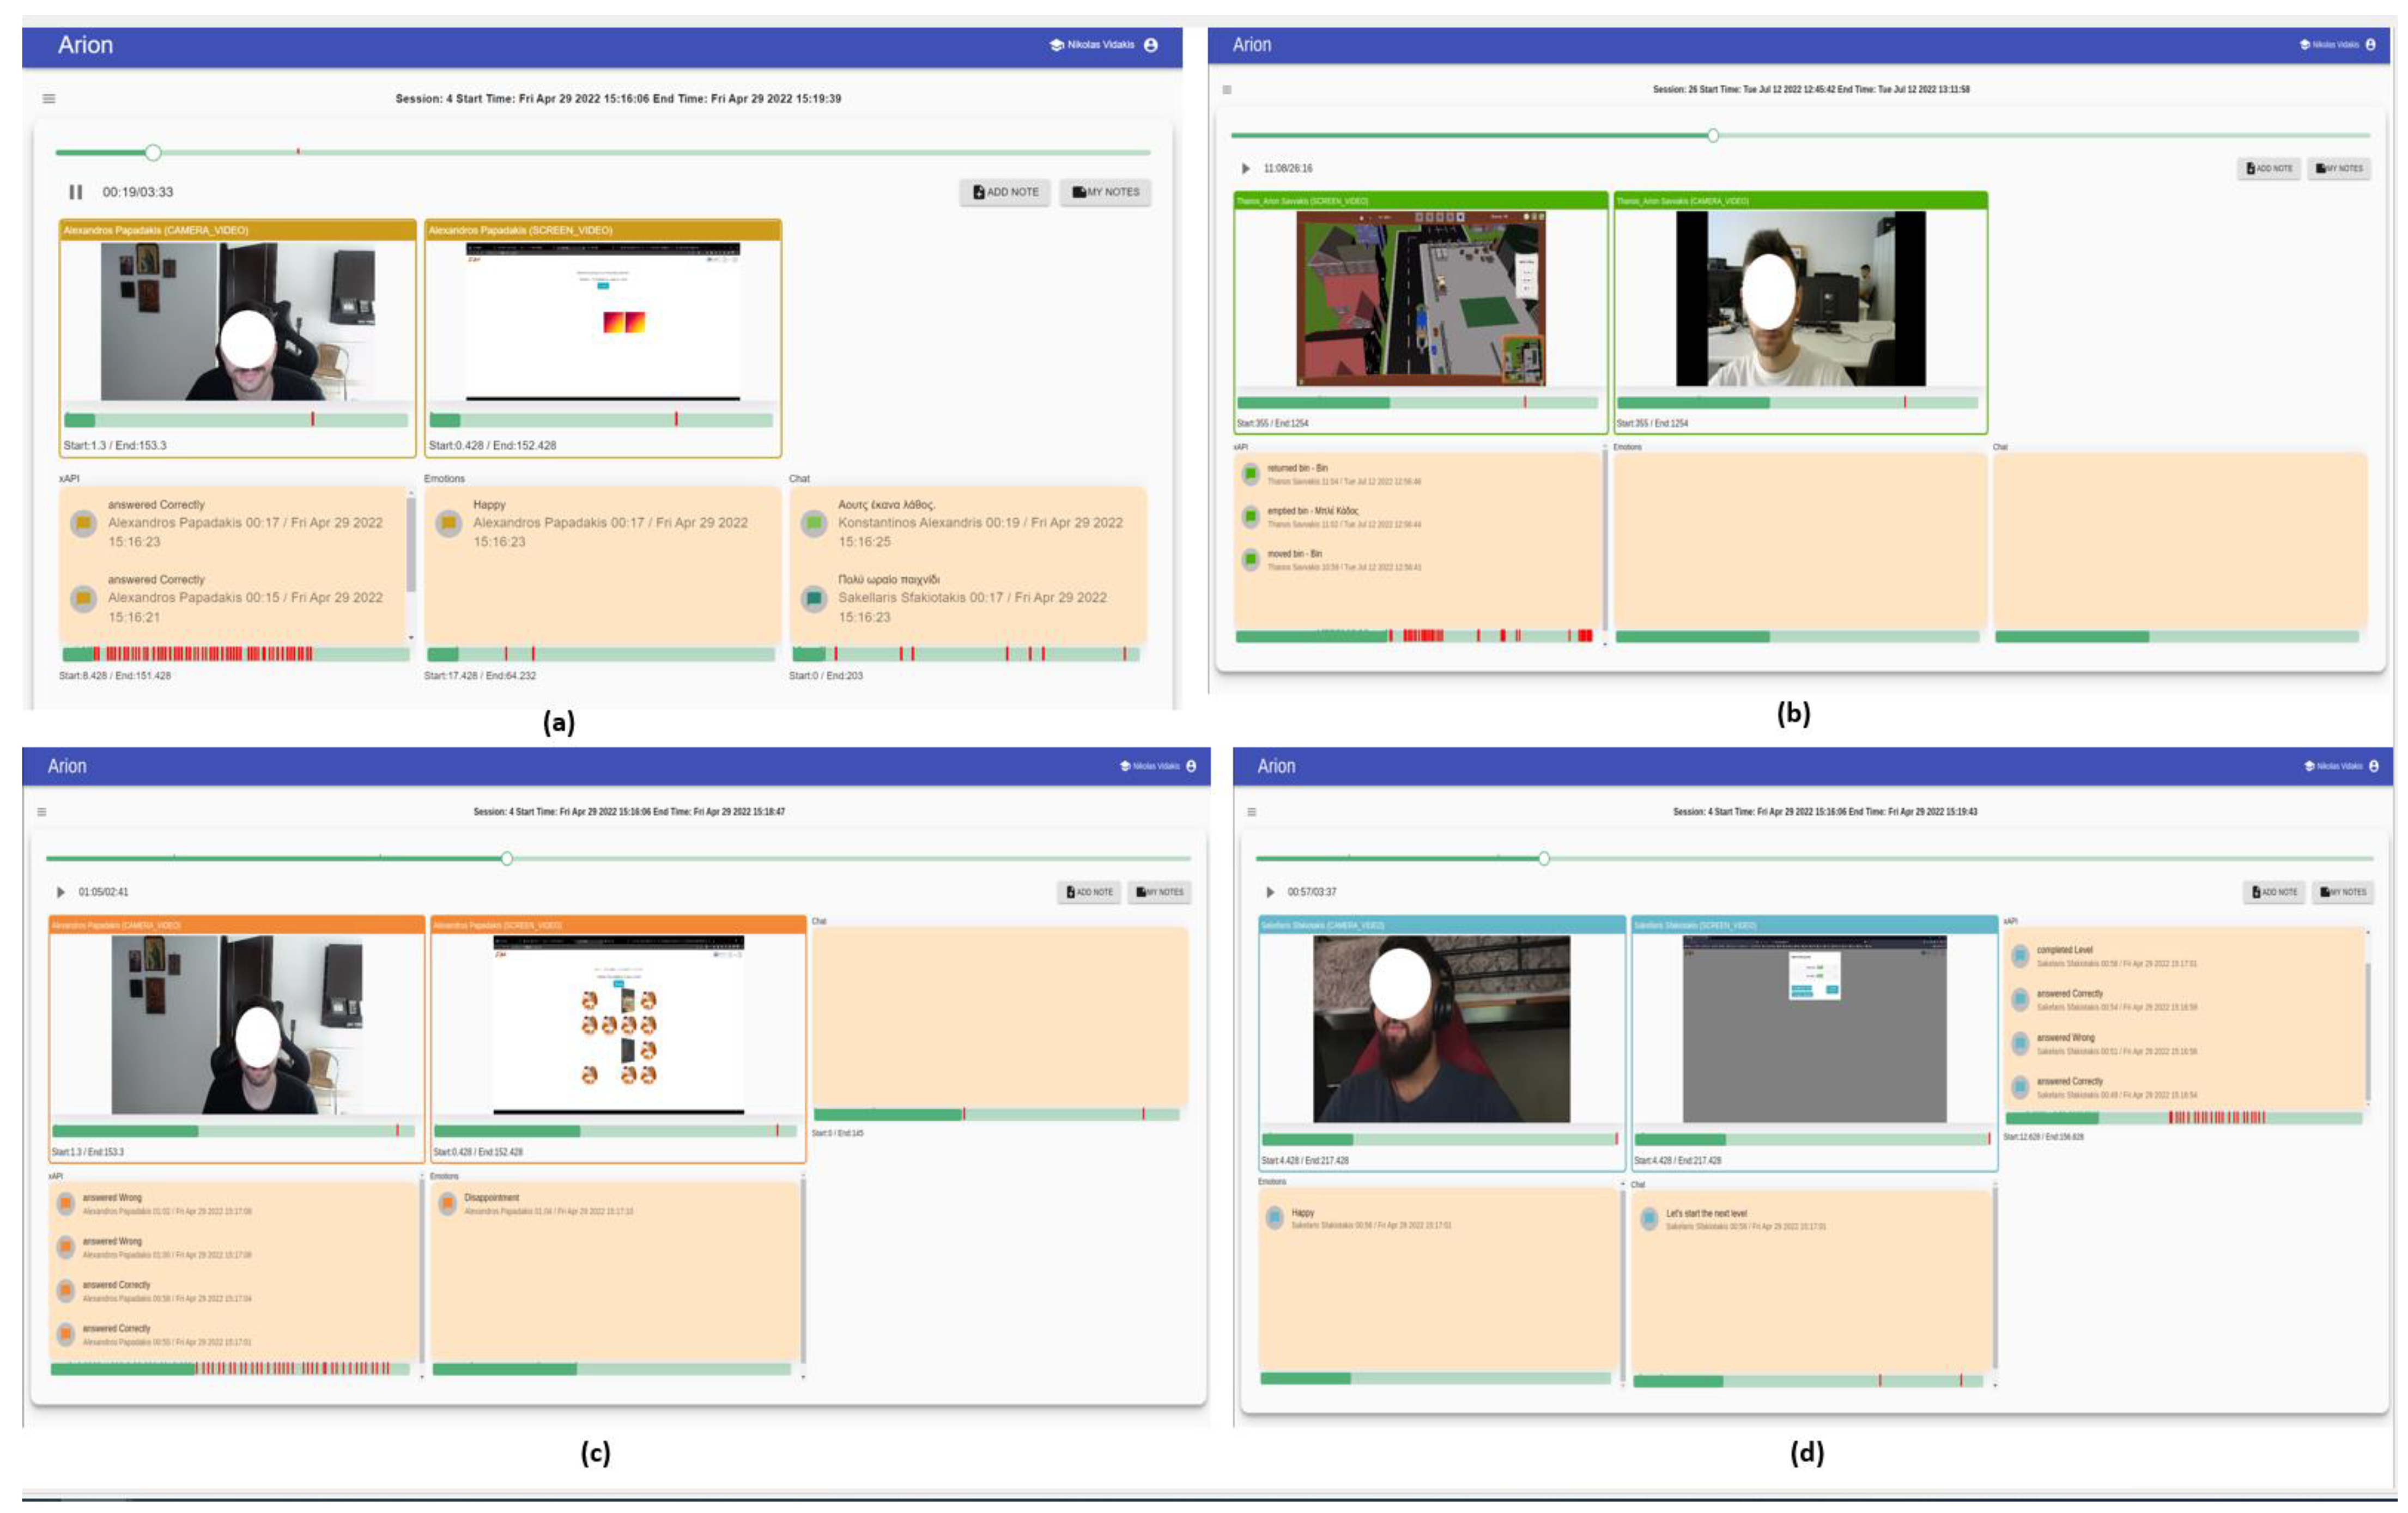
5.4. The Evaluation Session

During the evaluation session, the educator used the Arion platform to orchestrate the data produced at the learning session to evaluate the participants’ learning experiences.
Upon completion of the Arion platform scenario for evaluation of the participants’ learning experience, the educator has come up with essential conclusions (see “Result/Deduced Evaluation Statement” section further down) that would be extremely difficult or impossible to assemble with conventional methods. The Arion platform digital tools made it possible to amalgamate multichannel data and made it feasible for important evaluation outcomes to be deducted.

5.4.1. Result/Deduced Evaluation Statement for Figure 13a

“A.Papadakis” Learner at relative timestamp 17.428 s is (a) happy, according to the emotions API, (b) smiles according to the video camera modality, (c) has answered correctly according to the xAPI modality, (d) has matched two pictures at the memory game according to the screen video modality. Chat modality has no record for this timestamp.
Based on the above orchestrated leaner data extracted for the information repository, the learner has achieved the goal of matching two pictures and is happy about that.
Figure 13. Learner Evaluation with multimodal Data Validation. (a) Arion Evaluation Session for learner “A.Papadakis” happy; (b) Arion Evaluation Session for learner “T.Savvakis”; (c) Arion Evaluation Session for learner “A.Papadakis” disappointed; (d) Arion Evaluation Session for learner “S.Sfakiotakis”.
Applsci 12 08722 g013

5.4.2. Result/Deduced Evaluation Statement for Figure 13b

“T.Savvakis” Learner at relative timestamp 11.08 min has emptied the blue bin and returned it at its dock station according to the xAPI modality, (b) the screen video modality confirms the xAPI result according to the graphical environment of the game. The chat modality has no record for this timestamp, and the video modality has no record because the emotion at this timestamp was neutral, as confirmed at the camera video modality.

5.4.3. Result/Deduced Evaluation Statement for Figure 13c

“A.Papadakis” Learner at relative timestamp 1.05 min feels (a) disappointment, according to the emotions API, (b) he is unhappy according to the video camera modality, (c) has answered wrong according to the xAPI modality, (d) has chosen two different pictures at the memory game according to the screen video modality. Chat modality has no record for this timestamp.

5.4.4. Result/Deduced Evaluation Statement for Figure 13d

“S.Sfakiotakis” Learner at relative timestamp 0.57 min feels (a) happy, according to the emotions API, (b) smiles according to the video camera modality, (c) has finished a level of the memory game successfully according to the xAPI modality, (d) the level which completed was the level 2 of the memory game according to the screen video modality and finally (e) chat modality confirms the results of the above modalities.
The current state of eLearning is highly fragmented, which in many cases is a very positive reality, offering diversity and multiple capabilities. However, at the same time, it is almost impossible to study the effects and deeply understand the benefits and drawbacks and how to improve each approach. As shown above, ARION combines learning data into simple and understandable forms of information that allow the teacher to come up with a better understanding of the strengths and weaknesses of students, the lesson, and the educational process by providing a critical look at available data with aimed at a substantial improvement of all components of the learning path.

6. Conclusions

Education is an evolving area, and increasing numbers of researchers are studying new pedagogical methods, learning styles, etc. Many new technologies, such as serious games, MOOCs, and technologies for game-based learning, are booming alongside researchers. Based on previous experience with educational technologies such as the IOLAOS platform, the authors have discovered an area with plenty of space for new technologies to aid the education process. That area is more focused on the learning process evaluation as a critical process in education because it aids in preventing issues in the learning process and the appearance of improvements. With that idea in mind, a platform that aims to synchronize media like camera and screen video alongside other data like chat, xAPI data from game-based learning, and emotion data from the analyzed videos was designed and implemented. With all that material now synchronized, a fantastic tool that allows teachers that use the IOLAOS platform to assess and improve the learning process is now available.
In the future, the authors aim to improve the Arion platform in all its aspects. First and foremost, the supported media file types will be expanded to support more. Now, the platform only supports video. The next step is to add audio support and the ability to analyze audio, similar to how other platforms analyze the sound to generate emotion based on it. Furthermore, the platform supports video only through the IOLAOS platform, videos generated from the learning session, and can be camera or screen videos. Having only that way of importing media into the platform makes the platform only accessible to a small number of users. Therefore, the next goal is to make it accessible to a broad range of users and broaden the import options. To achieve this, the authors aim to support third-party platforms such as YouTube and the ability to import user videos. Finally, the U.I. usability will be improved, and specifically, the modalities grid, currently supporting only a maximum of 2 × 3 grids, will be modified into a dynamic grid size.

Author Contributions

Conceptualization, A.P.; Investigation, A.P., M.K. and S.P.; Methodology, A.B. and N.V.; Project administration, N.V.; Resources, A.B. and M.K.; Supervision, N.V.; Validation, S.P. All authors have read and agreed to the published version of the manuscript.

Funding

This research received no external funding.

Institutional Review Board Statement

Not applicable.

Informed Consent Statement

Not applicable.

Conflicts of Interest

The authors declare no conflict of interest.

References

  1. Kopp, M.; Gröblinger, O.; Adams, S. Five common assumptions that prevent digital transformation at higher education institutions. In Proceedings of the INTED 2019, Valencia, Spain, 11–13 March 2019; pp. 1448–1457. [Google Scholar] [CrossRef]
  2. Ustun, G. Determining depression and related factors in a society affected by COVID-19 pandemic. Int. J. Soc. Psychiatry 2020, 67, 54–63. [Google Scholar] [CrossRef]
  3. Carte, R.A.; Rice, M.; Yang, S.; Jackson, H.A. Self-regulated learning in online learning environments: Strategies for remote learning. Inf. Learn. Sci. 2020, 121, 311–319. [Google Scholar] [CrossRef]
  4. Favale, T.; Soro, F.; Trevisan, M.; Drago, I.; Mellia, M. Campus traffic and e-Learning during COVID-19 pandemic. Comput. Netw. 2020, 176, 107290. [Google Scholar] [CrossRef]
  5. George, M.L. Effective Teaching and Examination Strategies for Undergraduate Learning during COVID-19 School Restrictions. J. Educ. Technol. Syst. 2020, 49, 23–48. [Google Scholar] [CrossRef]
  6. García-Morales, V.J.; Garrido-Moreno, A.; Martín-Rojas, R. The Transformation of Higher Education after the COVID Disruption: Emerging Challenges in an Online Learning Scenario. Front. Psychol. 2021, 12, 616059. [Google Scholar] [CrossRef]
  7. Hodges, C.; Moore, S.; Lockee, B.; Trust, T.; Bond, A. The Difference between Emergency Remote Teaching and Online Learning. Educause Review. 2020. Available online: https://er.educause.edu/articles/2020/3/the-differencebetween-emergency-remote-teaching-and-online-learning (accessed on 25 January 2021).
  8. Abt, C.C. Serious Games; L.C. 79-83234; Viking: New York, NY, USA, 1970; 176p. [Google Scholar] [CrossRef]
  9. Ulicsak, M. Games in Education: Serious Games. In A FutureLab Literature Review; FutureLab: Kuala Lumpur, Malaysia, 2010; p. 139. [Google Scholar]
  10. Zyda, M. From visual simulation to virtual reality to games. Computer 2005, 38, 25–32. [Google Scholar] [CrossRef]
  11. Arnab, S.; Lim, T.; Carvalho, M.B.; Bellotti, F.; de Freitas, S.; Louchart, S.; Suttie, N.; Berta, R.; de Gloria, A. Mapping learning and game mechanics for serious games analysis. Br. J. Educ. Technol. 2015, 46, 391–411. [Google Scholar] [CrossRef]
  12. Bellotti, F.; Kapralos, B.; Lee, K.; Moreno-Ger, P.; Berta, R. Assessment in and of serious games: An overview. Adv. Hum. Comput. Interact. 2013, 2013, 1. [Google Scholar] [CrossRef] [Green Version]
  13. Paulsen, M. Online Education Systems in Scandinavian and Australian Universities: A Comparative Study. International Review of Research in Open and Distance Learning; NKI Distance Education: Oslo, Norway, 2002; Volume 3, pp. 1–8, Number 2; ISSN 1492-3831. [Google Scholar] [CrossRef]
  14. Hurtado, C.; Licea, G.; Garcia-Valdez, M. Integrating Learning Styles in an Adaptive Hypermedia System with Adaptive Resources. Stud. Syst. Decis. Control 2018, 143, 49–67. [Google Scholar] [CrossRef]
  15. Katsaris, I.; Vidakis, N. Adaptive e-learning systems through learning styles: A review of the literature. Adv. Mob. Learn. Educ. Res. 2022, 1, 124–145. [Google Scholar] [CrossRef]
  16. Lazarinis, F.; Boididis, I.; Kozanidis, L.; Kanellopoulos, D. An adaptable multi-learner serious game for learning cultural heritage. Adv. Mob. Learn. Educ. Res. 2022, 2, 201–215. [Google Scholar] [CrossRef]
  17. Brusilovsky, P. Adaptive Hypermedia for Education and Training. Adaptive Technologies for Training and Education; Cambridge University Press: Cambridge, UK, 2012; pp. 46–66. [Google Scholar] [CrossRef]
  18. Liu, X.; Liu, Y.; Song, H.; Liu, A. Big Data Orchestration as a Service Network. IEEE Commun. Mag. 2017, 55, 94–101. [Google Scholar] [CrossRef]
  19. Peltz, C. Web services orchestration and choreography. Computer 2003, 36, 46–52. [Google Scholar] [CrossRef]
  20. Tabak, I. Synergy: A Complement to Emerging Patterns of Distributed Scaffolding. J. Learn. Sci. 2004, 13, 305–335. [Google Scholar] [CrossRef]
  21. Ryan, S. What Is Data Orchestration. 2020. Available online: https://www.mparticle.com/blog/data-orchestration (accessed on 26 January 2022).
  22. Natriello, G. Imagining, seeking, inventing: The future of learning and the emerging discovery networks. Learn. Inq. 2007, 1, 7–18. [Google Scholar] [CrossRef]
  23. Prieto, L.P.; Dimitriadis, Y.; Asensio-Pérez, J.I.; Looi, C.K. Orchestration in learning technology research: Evaluation of a conceptual framework. Res. Learn. Technol. 2015, 23, 1–15. [Google Scholar] [CrossRef] [Green Version]
  24. Watts, M. The orchestration of learning and teaching methods in science education. Can. J. Sci. Math. Technol. Educ. 2003, 3, 451–464. [Google Scholar] [CrossRef]
  25. Dillenbourg, P.; Jermann, P. Designing Integrative Scripts. In Scripting Computer-Supported Collaborative Learning; Springer: Boston, MA, USA, 2007; pp. 275–301. [Google Scholar] [CrossRef]
  26. Liang, J.; Huang, P.; Chen, J.; Hauptmann, A. Synchronization for multi-perspective videos in the wild. In Proceedings of the 2017 IEEE International Conference on Acoustics, Speech and Signal Processing (ICASSP), New Orleans, LA, USA, 5–9 March 2017; IEEE: Piscataway, NJ, USA, 2017; pp. 1592–1596. [Google Scholar] [CrossRef]
  27. Kammerl, J.; Birkbeck, N.; Inguva, S.; Kelly, D.; Crawford, A.J.; Denman, H.; Kokaram, A.; Pantofa, C. Temporal synchronization of multiple audio signals. In Proceedings of the 2014 IEEE International Conference on Acoustics, Speech and Signal Processing (ICASSP), Florence, Italy, 4–9 May 2014; IEEE: Piscataway, NJ, USA, 2014; pp. 4603–4607. [Google Scholar] [CrossRef]
  28. Lu, C.; Mandal, M. An efficient technique for motion-based view-variant video sequences synchronization. In Proceedings of the 2011 IEEE International Conference on Multimedia and Expo, Barcelona, Spain, 11–15 July 2011; IEEE: Piscataway, NJ, USA, 2011; pp. 1–6. [Google Scholar] [CrossRef]
  29. Shrestha, P.; Weda, H.; Barbieri, M.; Sekulovski, D. Synchronization of multiple video recordings based on still camera flashes. In Proceedings of the 14th Annual ACM International Conference on Multimedia—MULTIMEDIA ’06, Santa Barbara, CA, USA, 23–27 October 2006; p. 137. [Google Scholar] [CrossRef]
  30. Shrstha, P.; Barbieri, M.; Weda, H. Synchronization of multi-camera video recordings based on audio. In Proceedings of the 15th International Conference on Multimedia—MULTIMEDIA ’07, Augsburg, Germany, 25–29 September 2007; p. 545. [Google Scholar] [CrossRef]
  31. Liang, J.; Burger, S.; Hauptmann, A.L.; Aronson, J.L. Video Synchronization and Sound Search for Human Rights Documentation and Conflict Monitoring; Carnegie Mellon University: Pittsburgh, PA, USA, 2018. [Google Scholar] [CrossRef]
  32. Su, K.; Naaman, M.; Gurjar, A.; Patel, M.; Ellis, D.P.W. Making a Scene. In Proceedings of the 2nd ACM International Conference on Multimedia Retrieval—ICMR ‘12, Hong Kong, China, 5–8 June 2012; p. 1. [Google Scholar] [CrossRef]
  33. Aparicio, M.; Costa, C.J. Data visualization. Commun. Des. Q. 2015, 3, 7–11. [Google Scholar] [CrossRef]
  34. Friendly, M. A Brief History of Data Visualization. In Handbook of Data Visualization; Springer: Berlin/Heidelberg, Germany, 2008; pp. 15–56. [Google Scholar] [CrossRef]
  35. Po, L.; Bikakis, N.; Desimoni, F.; Papastefanatos, G. Linked Data Visualization: Techniques, Tools, and Big Data; (Synthesis Lectures on the Semantic Web: Theory and Technology); Morgan & Claypool Publishers: Williston, VT, USA, 2020; Volume 10, pp. 1–157. [Google Scholar] [CrossRef]
  36. Wang, Z.; Sundin, L.; Murray-Rust, D.; Bach, B. Cheat Sheets for Data Visualization Techniques. In Proceedings of the 2020 CHI Conference on Human Factors in Computing Systems, Honolulu, HI, USA, 25–30 April 2020; pp. 1–13. [Google Scholar] [CrossRef]
  37. Lias, T.E. Learning Analytics: The Definitions, the Processes, and the Potential. 2011. Available online: http://learninganalytics.net/LearningAnalyticsDefinitionsProcessesPotential.pdf (accessed on 15 February 2021).
  38. Vidakis, N.; Charitakis, S. Designing the Learning Process. In Proceedings of the 10th International Conference on Subject-Oriented Business Process Management—S-BPM One ’18, Linz, Austria, 5–6 April 2018; pp. 1–11. [Google Scholar] [CrossRef]
  39. Rustici Software. Experience API. Available online: https://xapi.com/overview/ (accessed on 26 January 2018).
  40. Trampas, A.M. Extracting Learning Analytics from Game Based Learning Sessions Generated by Multimodal Data Sources. Master’s Thesis, Hellenic Mediterranean University, Heraklion, Greece, 7 July 2021. [Google Scholar]
  41. Vidakis, N.; Christinaki, E.; Serafimidis, I.; Triantafyllidis, G. Combining Ludology and Narratology in an Open Authorable Framework for Educational Games for Children: The Scenario of Teaching Preschoolers with Autism Diagnosis. In Lecture Notes in Computer Science; Springer International Publishing: Cham, Switzerland, 2014; pp. 626–636. [Google Scholar] [CrossRef]
  42. Vidakis, N.; Syntychakis, E.; Kalafatis, K.; Christinaki, E.; Triantafyllidis, G. Ludic Educational Game Creation Tool: Teaching Schoolers Road Safety. In Universal Access in Human-Computer Interaction. Access to Learning, Health and Well-Being; Springer International Publishing: Cham, Switzerland, 2015; pp. 565–576. [Google Scholar] [CrossRef]
  43. Mohammed, D.Y. The web-based behavior of online learning: An evaluation of different countries during the COVID-19 pandemic. Adv. Mob. Learn. Educ. Res. 2022, 2, 263–267. [Google Scholar] [CrossRef]
  44. Mamolo, L.A. Students’ evaluation and learning experience on the utilization of Digital Interactive Math Comics (DIMaC) mobile app. Adv. Mob. Learn. Educ. Res. 2022, 2, 375–388. [Google Scholar] [CrossRef]
  45. Zourmpakis, A.I.; Papadakis, S.; Kalogiannakis, M. Education of preschool and elementary teachers on the use of adaptive gamification in science education. Int. J. Technol. Enhanc. Learn. 2022, 14, 1–16. [Google Scholar] [CrossRef]
  46. Barianos, A.; Papadakis, A.; Vidakis, N. Content manager for serious games: Theoretical framework and digital platform. Adv. Mob. Learn. Educ. Res. 2022, 2, 251–262. [Google Scholar] [CrossRef]
  47. Vidakis, N.; Barianos, A.K.; Trampas, A.M.; Papadakis, S.; Kalogiannakis, M.; Vassilakis, K. In-Game Raw Data Collection and Visualization in the Context of the “ThimelEdu” Educational Game; Springer International Publishing: Cham, Switzerland, 2020; Volume 1220. [Google Scholar] [CrossRef]
  48. Papadakis, S.; Kalogiannakis, M. Evaluating the effectiveness of a game-based learning approach in modifying students’ behavioural outcomes and competence, in an introductory programming course. A case study in Greece. Int. J. Teach. Case Stud. 2019, 10, 235–250. [Google Scholar] [CrossRef]
  49. Papadakis, S.; Trampas, A.M.; Barianos, A.K.; Kalogiannakis, M.; Vidakis, N. Evaluating the Learning Process: The “ThimelEdu” Educational Game Case Study. In Proceedings of the 12th International Conference on Computer Supported Education (CSEDU 2020), Online, 2–4 May 2020; pp. 290–298. [Google Scholar] [CrossRef]
Figure 1. ARION System Overview.
Applsci 12 08722 g001
Figure 2. ARION Component Diagram.
Applsci 12 08722 g002
Figure 3. Arion Platform login form.
Applsci 12 08722 g003
Figure 4. Available Classes View.
Applsci 12 08722 g004
Figure 5. Available Class Learning sessions.
Applsci 12 08722 g005
Figure 6. Open Studio View.
Applsci 12 08722 g006
Figure 7. Arion Platform Modalities. (a) Generic View modalities; (b) User Specific Modalities.
Applsci 12 08722 g007
Figure 8. Open Studio with all the possible modalities.
Applsci 12 08722 g008
Figure 9. Open Studio with ordered modalities.
Applsci 12 08722 g009
Figure 10. Camera Video modality with start and end event.
Applsci 12 08722 g010
Figure 11. Note Creation Modal.
Applsci 12 08722 g011
Figure 12. Available Notes Modal.
Applsci 12 08722 g012
Publisher’s Note: MDPI stays neutral with regard to jurisdictional claims in published maps and institutional affiliations.

