Article

Seismic Liquefaction of Saturated Calcareous Sands: Dynamic Centrifuge Test and Numerical Simulation

1
CCCC Fourth Harbor Engineering Co., Ltd., Guangzhou 510290, China
2
Southern Marine Science and Engineering Guangdong Laboratory (Zhuhai), Zhuhai 519082, China
3
Department of Geotechnical Engineering, Tongji University, Shanghai 200092, China
4
State Key Laboratory for Disaster Reduction in Civil Engineering, Tongji University, Shanghai 200092, China
5
CCCC Fourth Harbor Engineering Institute Co., Ltd., Guangzhou 510230, China
6
School of Naval Architecture, Ocean and Civil Engineering, Shanghai Jiao Tong University, Shanghai 200240, China
*
Authors to whom correspondence should be addressed.
Appl. Sci. 2022, 12(17), 8701; https://doi.org/10.3390/app12178701
Submission received: 15 June 2022 / Revised: 10 August 2022 / Accepted: 15 August 2022 / Published: 30 August 2022
(This article belongs to the Special Issue Geotechnical Engineering Hazards)

Abstract

:
Both a dynamic centrifuge test and dynamic finite element analysis were carried out to assess the seismic liquefaction risk of a saturated-calcareous-sand site in a port project in Timor-Leste. Taking the in situ calcareous sands as the model material, two groups of horizontal free-field model tests for medium dense and dense saturated calcareous sands were completed based on the two-stage scaling law theory. Three natural earthquake records with varied peak accelerations were adopted as input motions. The experimental results indicate that the shallower the depth, the lower the relative density, the longer the seismic duration, the larger the peak acceleration, and the more susceptible the saturated site to liquefaction. The sands on site at a depth of five to ten meters is highly risky for liquefaction with the excess pore pressure ratio reaching up to about 1.0 under the seismic peak acceleration of 0.3 g. The risk of liquefaction for site sands is rather small under the seismic peak acceleration of 0.1 g. The study reveals the characteristics of the pore pressure development in sites of varied relative densities under different seismic loadings, which provides a scientific basis for the liquefaction risk assessment of the engineering site.

1. Introduction

Seismic-induced soil liquefaction can be destructive for infrastructures. History investigations have shown that seismic-induced soil liquefaction can cause large ground deformation or settlement, ground fissure, lateral spreading, etc. [1,2,3,4], as well as direct damage on structures including embankments, underground pipelines, and tunnels [5,6]. In recent years, catastrophes led by seismic-induced soil liquefaction took place worldwide, e.g., the 2008 Wenchuan earthquake, the 2011 Christchurch New Zealand earthquake, the 2011 east Japan earthquake, the 2016 southern Taiwan earthquake and the 2018 Sulawesi earthquake in Indonesia [7,8,9,10,11]. Significant soil liquefaction was observed during these earthquakes, which brought about destructive aftermath. Statistical investigations find that the economic loss caused by liquefaction can make up 15–30% of the total loss during an earthquake [12], which should be taken as one of the major hazards for earthquake damage.
Calcareous sand is widely spread in islands and coastal areas around the world. With the expansion of human society, the engineering projects confronting calcareous sand sites are increasing, and the seismic liquefaction risk of calcareous sand ground cannot be ignored. Differing from the commonly known quartzite sand, the calcareous sand possesses unique mechanical properties due to the distinct mesoscopic characteristics such as the angular grain shape, low stiffness, high particle breakage susceptibility, and high internal porosity [13,14]. While considerable progresses have been made on studies about sand liquefaction, the majority of the previous studies are conducted based on quartzite sand [15]. Disputes and blanks still remain on the mechanical properties and dynamic behavior of calcareous sand. According to laboratory test results, it is believed that calcareous sand has a higher liquefaction resistance than quartzite sand, i.e., it is generally more difficult for calcareous sand to liquefy in most of the cases [16,17]. However, the history investigations can still present cases of seismic-induced liquefaction in calcareous sand sites, such as the 1993 Guam earthquake, the 2006 Hawaii earthquake, and the 2010 Haiti earthquake [18,19,20]. Sand liquefaction had caused severe damage to infrastructure including embankments and ports during these earthquakes [21]. Therefore, the liquefaction mechanism and dynamic characteristics of calcareous sand still need to be further studied.
The conventional methods of studying the seismic response of sites include history investigation, in situ testing, laboratory testing, and numerical simulation. Among the various types of laboratory tests, the centrifuge test stands out with the advantage of generating Ng gravity via rotation and obtaining an identical or approximately identical stress field to the prototype in the model, which makes it capable to reproduce the deformation and failure mechanism of the prototype [22]. The centrifuge tests have been widely used in earthquake geotechnical engineering studies for more than three decades, providing a large amount of essential information through physical models and greatly contributing to the advancement of knowledge in this field [23]. The pioneering collaborative project VELACS (Verification of Liquefaction Analysis by Centrifuge Studies) carried out in the mid-1990s provided reliable experimental data for numerically modelling soil liquefaction, including nine centrifuge model tests of saturated sand materials [24,25,26,27]. Another notable international collaboration, LEAP-2017 (Liquefaction Experiments and Analysis Projects), initiated for validating constitutive and numerical modelling of soil liquefaction and its consequences using centrifuge tests, eventually built a high-quality database including twenty-four centrifuge model tests of liquefaction and lateral spreading [28,29,30]. The LIQUEFACT project within the EU Horizon 2020 program just ending in October 2019 carried out a total of thirty-seven dynamic centrifuge tests including benchmark tests of saturated sand under free field conditions [31,32]. Extensive research other than theses remarkable collaborative projects has been conducted to evaluate soil liquefaction through centrifuge tests and could not be listed exhaustively.
On the other hand, based on the well-documented experimental data, the state-of-the-art constitutive and numerical modelling methods for soil liquefaction are validated and further improved by researchers. Li et al. [33] assessed the seismic response of a layered liquefiable soil profile with granular columns through both numerical and centrifuge modeling. The numerical simulations are performed with PDMY and Manzari–Dafalias model in Opensees. Comparisons of numerical simulations with experimental results indicate a good prediction ability for both models on the peak value and generation of excess pore pressures during shaking. Similarly, implementing FE analyses with PDMY model in Opensees, Tang et al. [34] simulated the centrifuge test of the saturated silty site improved with granular columns and analyzed the dynamic characteristics such as ground acceleration and pore pressure. The results suggested a good agreement between the simulations with the experimental measurement. As one of the main work packages in LEAP-2017, eleven sets of Type-B predictions were implemented with PM4Sand model, PDMY, Hypoplastic model, Tsinghua constitutive model, etc. Manzari et al. [28] presents the comparisons of the Type-B simulations with the results of the centrifuge test and concluded that although similar trends can be achieved by a number of numerical simulations, predicting all the key quantities remains a challenge.
Ports are of high political and economic value, and their destructive consequences can be unbearable. The Tibar Bay Port Project (TBPP), located on the Circum-Pacific Belt, has a high seismic fortification intensity according to Chinese standards. The design seismic acceleration (475-year return period) of the wharf area reaches up to 0.53 g on the basis of the seismic hazard assessment report for TBPP. The site is mainly underlain by a mixed layer of sand and gravel with a maximum thickness of 40 m, which is very loose to loose, and a locally medium dense state.
A high proportion of fine sands can be found in local areas, and the average percentage of fines content smaller than 0.075 mm is 19% as shown in Figure 1. The layer has an average natural density of 1.65 g/cm3. The SPT value ranges from 0 to 18, with a mean value being 7, and the design relative density is 50%. The design permeability is 6.4 × 10⁻² cm/s.
In order to scientifically evaluate the liquefaction potential of the calcareous sand site, centrifuge tests are carried out in the centrifuge shaking table system of Tongji University. Saturated calcareous sand models are tested with different relative densities under excitations of sets of input ground motions with different peak accelerations. The development characteristics of excess pore pressure at different depths during the earthquake are investigated, and the factors affecting excess pore pressure are analyzed in the tests. Moreover, based on the Biot’s dynamic consolidation theory, seismic response analyses of the calcareous sand site are conducted on OpenSees. The dynamic pore pressure responses are simulated and compared with that in centrifuge models. The seismic liquefaction potential of calcareous sand sites is comprehensively evaluated.

2. Dynamic Centrifuge Tests

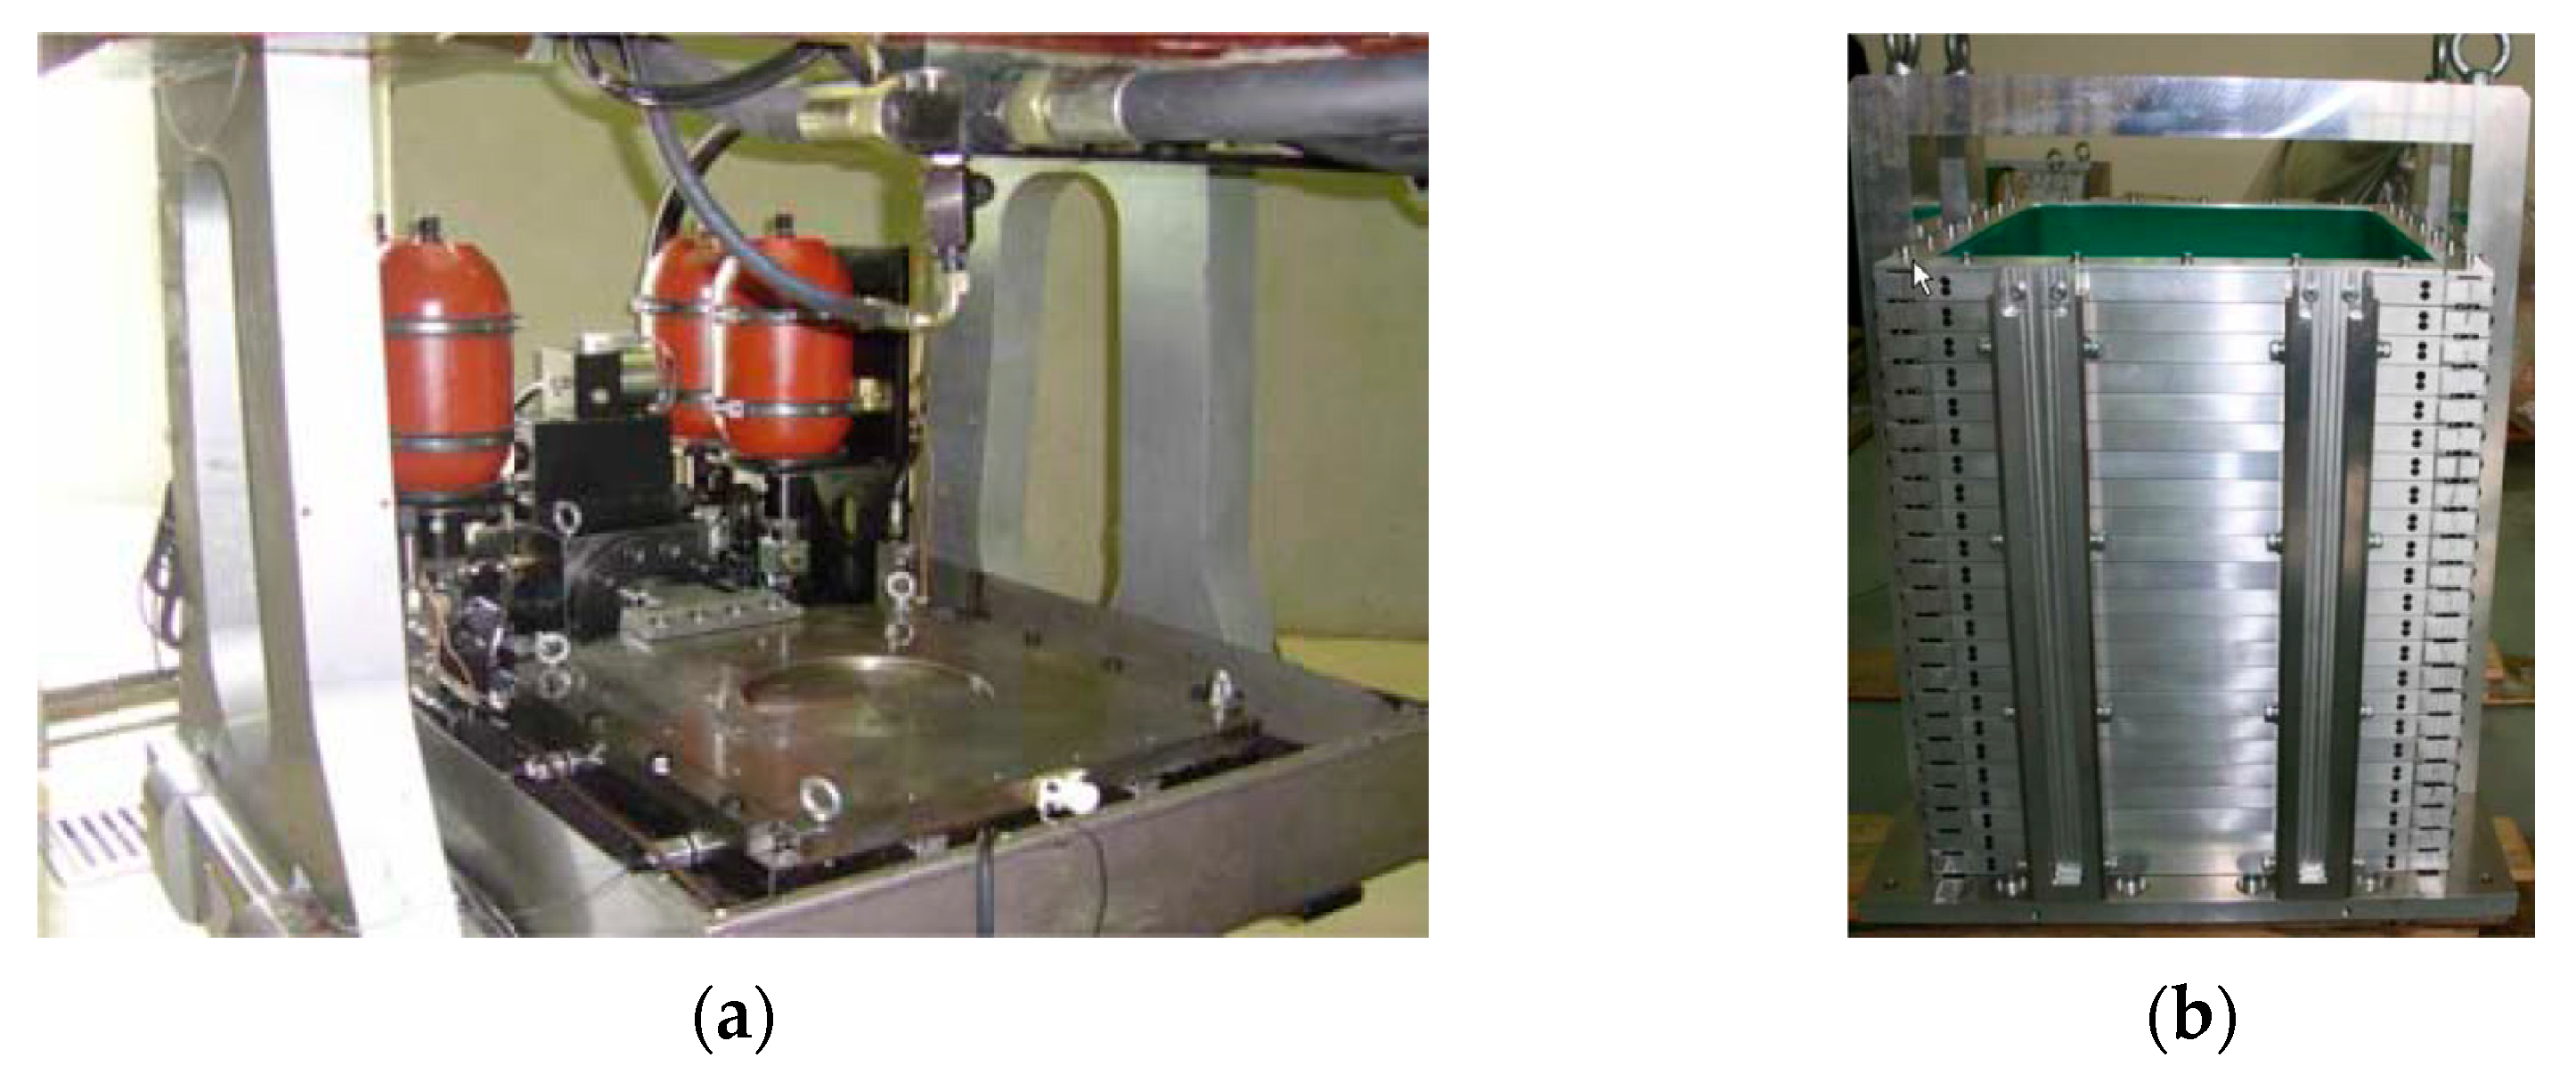
2.1. Test Facilities

The dynamic centrifuge tests were conducted using the TLJ-150 geotechnical centrifuge with matching electro-hydraulic shaking table (see Figure 2) at Tongji University, China. The major specifications of the experimental facilities are shown in Table 1. The facilities can stably generate a maximum rotational acceleration of 50 g with a payload of 300 kg during the dynamic model tests, and a maximum shaking acceleration of 20 g can be produced with models weighing up to 180 kg. A laminar shear model box, which is composed of 24 stacked rings of rectangular-section hollow aluminum square tubes, was used in the tests. The stacked rings are connected by guide rails and can slide freely in the horizontal shaking direction. The maximum relative displacement between each stacked ring is 6 mm. The internal dimensions of the model box are 500 × 400 × 550 mm (length × width × height). A 1 mm-thick high-durability membrane is set inside the box to prevent leakage from the gap between the stacked rings.

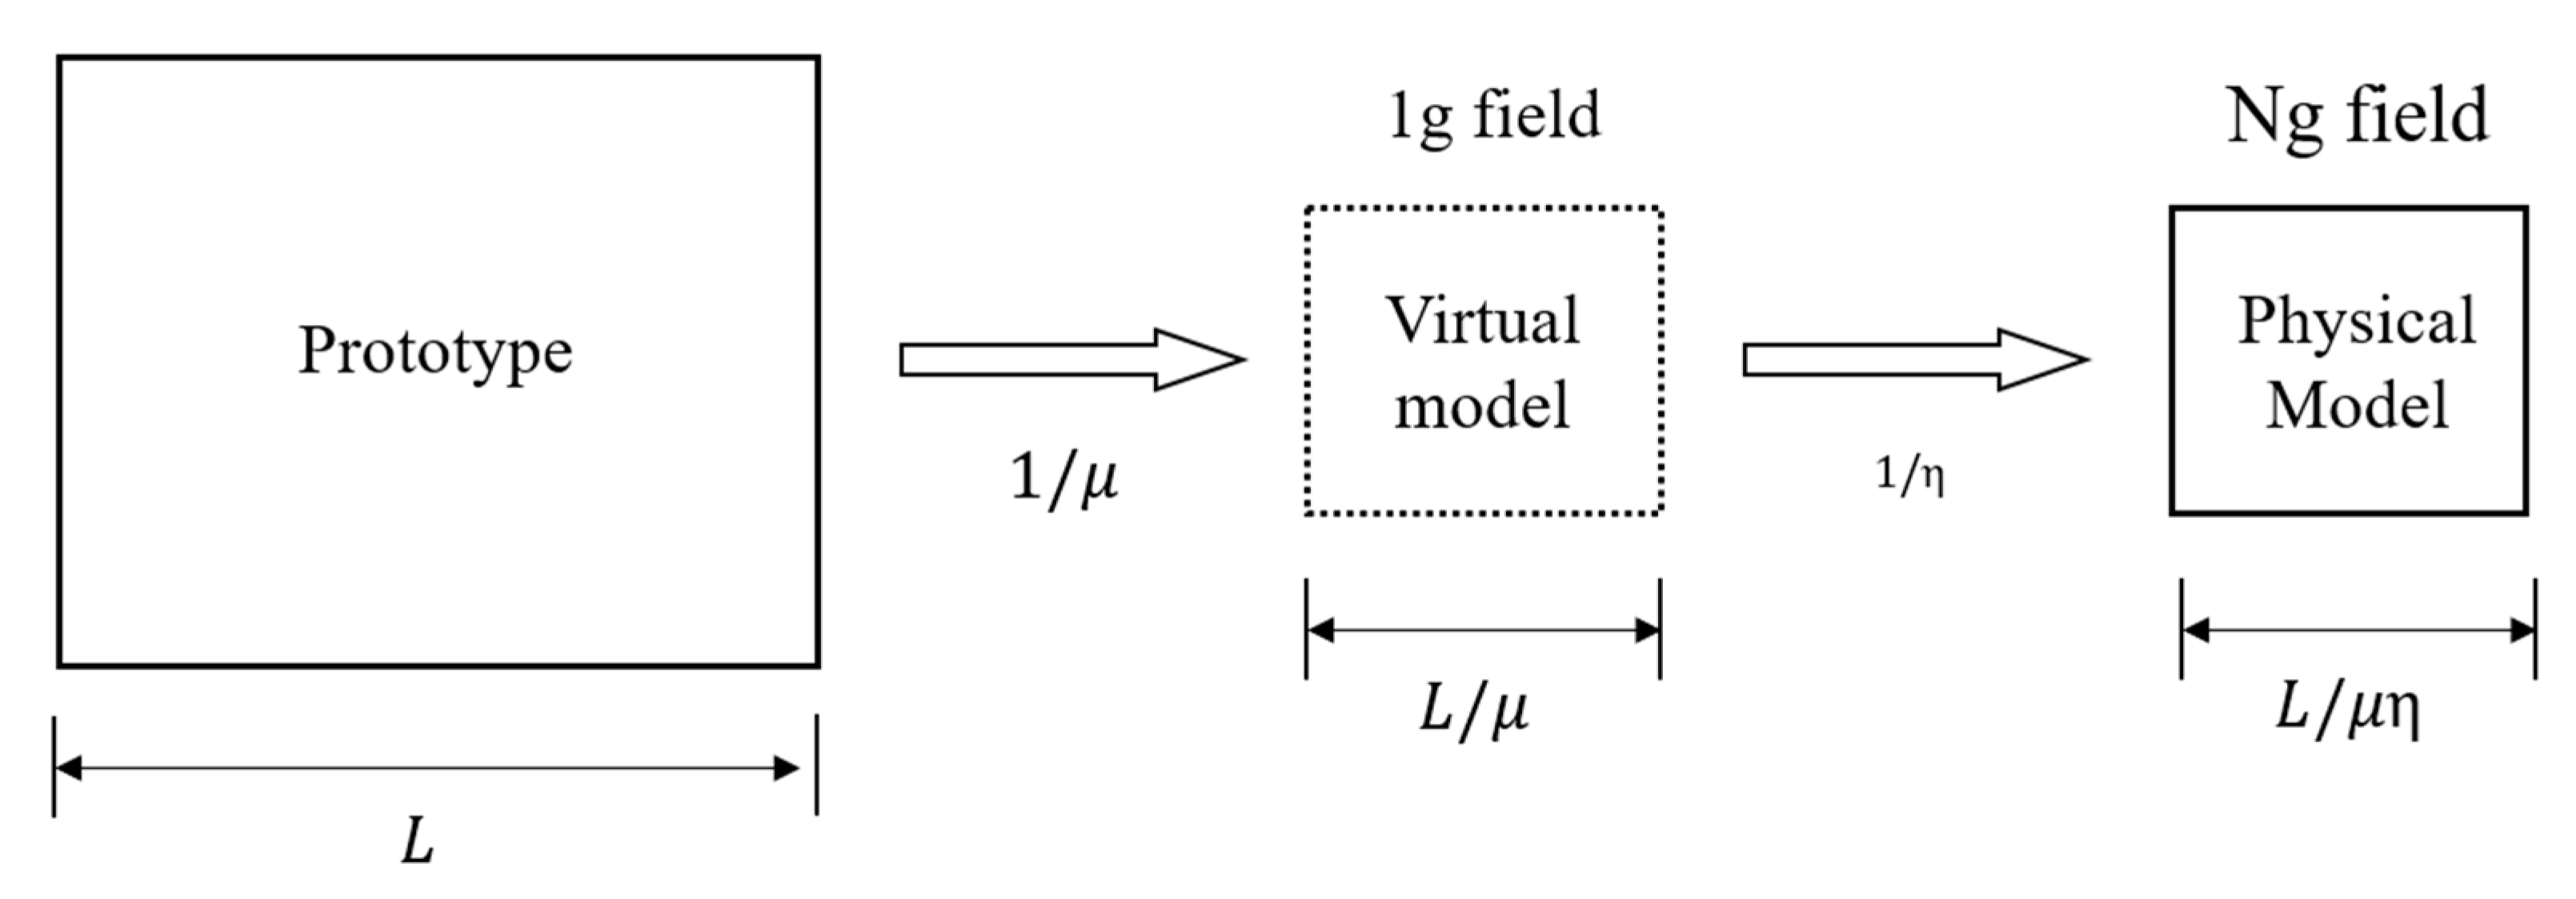
2.2. Scaling Law and Physical Models

To reproduce the same overburden stress in the scaled model as that in the prototype, the conventional scaling law for dynamic centrifuge tests is commonly established using the Buckingham π theorem. However, the shortcoming of the conventional scaling law is apparent: the set of scaling factors is built on the predetermined gravitational acceleration scaling factor with a relatively fixed relationship. Consequently, the large size engineering prototype could be difficult to model when the experiments are faced with restrictions of facility capacity. To overcome the limitation, Iai et al. proposed the concept of two-stage scaling and developed the generalized scaling law (GSL) in dynamic centrifuge tests [35]. As shown in Figure 3, μ is the dimensional scaling factor at the first stage, and η is the gravitational acceleration scaling factor at the second stage. The two-stage scaling and GSL extend the limits of the existing facilities and allow the dynamic centrifuge tests with a dimensional scaling factor reaching up to 100–1000 [35].
Due to the stress dependency of soil material, separate scales for stress and strain are needed to secure the kinetic and kinematic similarity between the model and the prototype. Iai and Sungano [36] developed three different types of GSL (Iai’s Type I, II, III GSL) within the framework forementioned, each based on a different strain scaling factor determination method. Iai’s type II GSL assumes that the tangential stiffness of sand is proportional to the square root of the confining pressure, and the relations between different scaling factors is presented in Equations (1)–(3):
μ σ = μ μ ρ
μ D = μ σ / μ ϵ = μ σ 0.5  
μ ε = μ σ / μ D = μ 0.5
where μ σ , μ ρ , μ D , μ ε are the scaling factors of stress, density, tangent stiffness, and strain, respectively.
The applicability of the two-stage scaling has been investigated and validated in previous research. Tobita et al. [37] and Zhou et al. [38] adopted Iai’s type II GSL in dynamic centrifuge tests of saturated sand and found that the model behaviors well mimic the prototype. In order to model the thick liquefiable calcareous sand layer in the engineering site, considering the limited amount of model material, the dimensions of the model container, and the capacity of the centrifuge, the two-stage scaling with Iai’s Type II GSL was adopted in the dynamic centrifuge tests, the scaling factors of which are shown in Table 2. During the experiments, rotational acceleration was set to be 40 g, and μ and η were 2 and 40, respectively. The length, width, and depth of the saturated level ground model are 500 × 400 × 250 mm, corresponding to the prototype of 40 × 32 × 20 m. Additionally, two free-field models, medium dense (M1) and dense (M2), are tested.

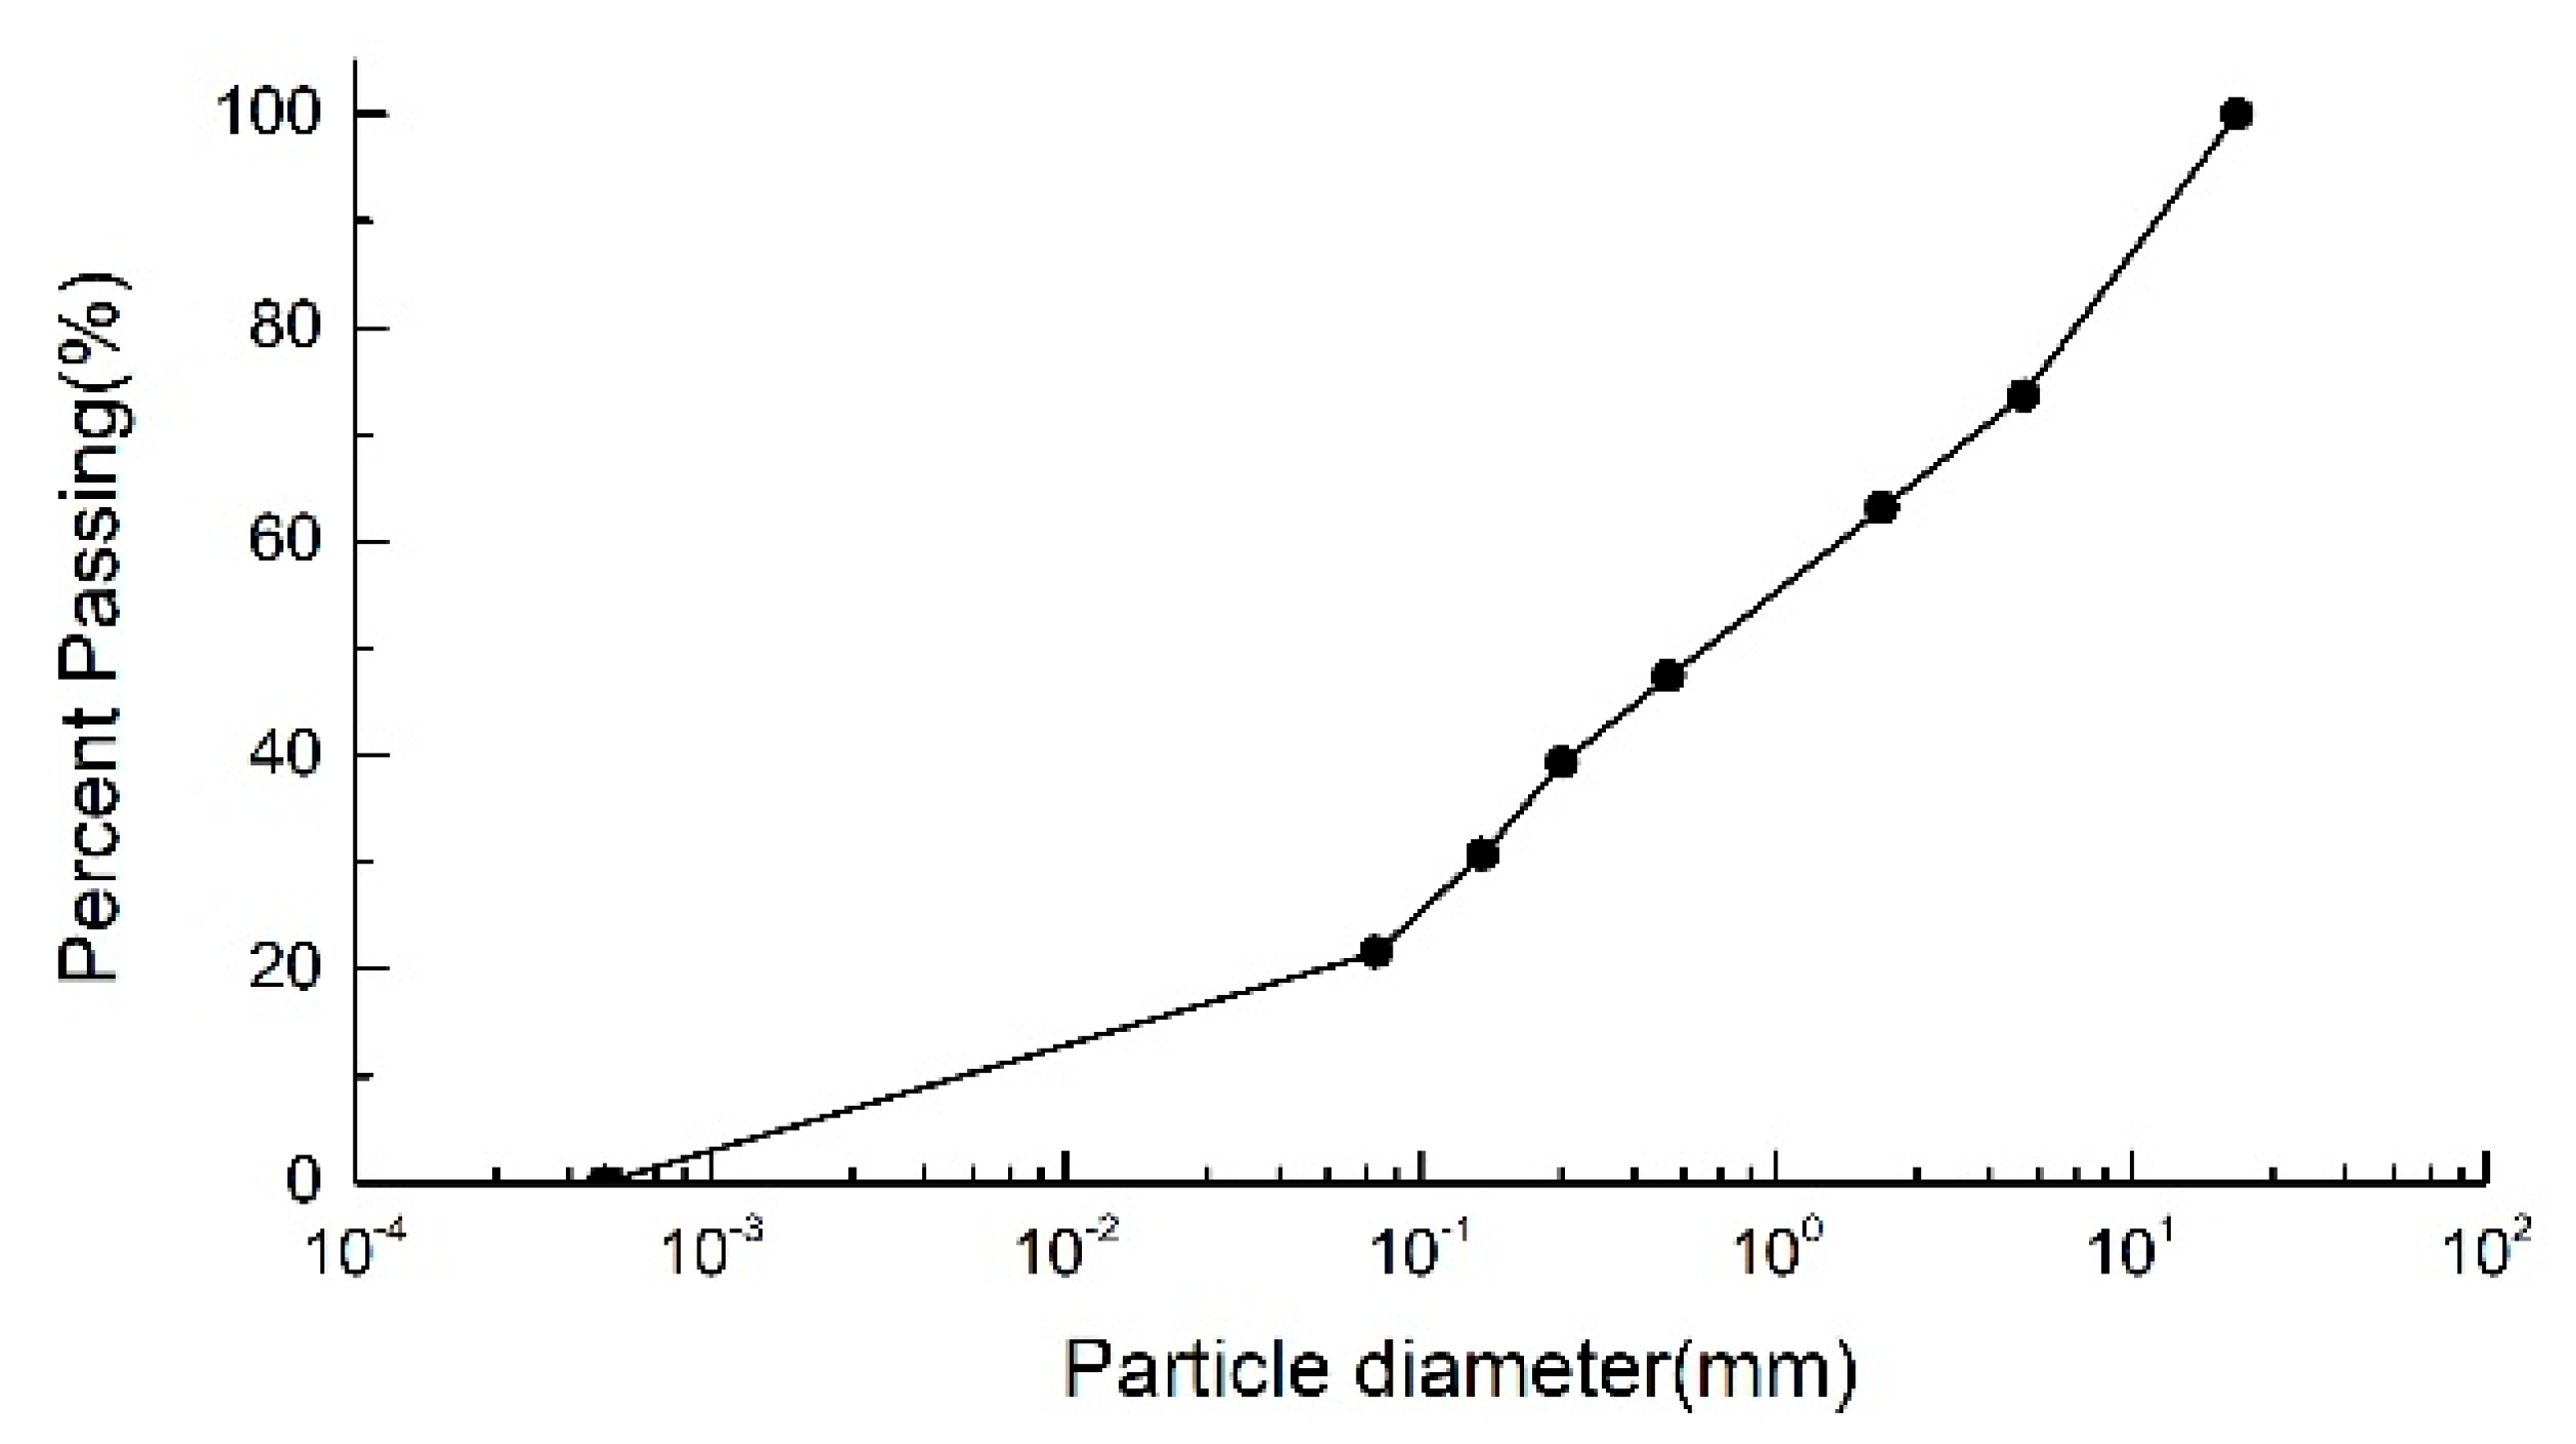
2.3. Test Materials and Model Preparation

Horizontal free-field models of saturated calcareous sand were tested. The sand material is taken originally from the project site, and its grain size distribution is adjusted to align with that in Figure 1. The primary physical properties are shown in Table 3. It should be noted that the scaling law requires a lower permeability in the model than that in the prototype to reflect the actual accumulation and dissipation process of EXPP in the model. As indicated in Table 2, the permeability of the model is 1 / μ 0.75 η of the prototype. It is realized in this study by using a carboxy methylcellulose (CMC) solution as a pore fluid substitute, which is transparent and has a close-to-water density. The CMC solution is obtained by mixing a predetermined amount of CMC powder with water to reach the desired viscosity. Therefore, the CMC solution with a viscosity of 67.3cst was adopted in the tests.
The dry sand models were prepared using the compaction method by 4 layers. The mass and height of each layer is determined by the relative density, which is calculated through the maximum and minimum dry density. The dry sand model is then saturated in a vacuum container by flooding the fluid from the bottom up. In order to achieve a high saturation degree, the flow rate of CMC solution is controlled to be as slow as possible. After saturation, the height of the ground model was measured at 9 different positions on the surface, and the relative density of the model was obtained by calculating the mean value. The relative densities of the two models (M1 and M2) are 53.1% and 67.7%, respectively.

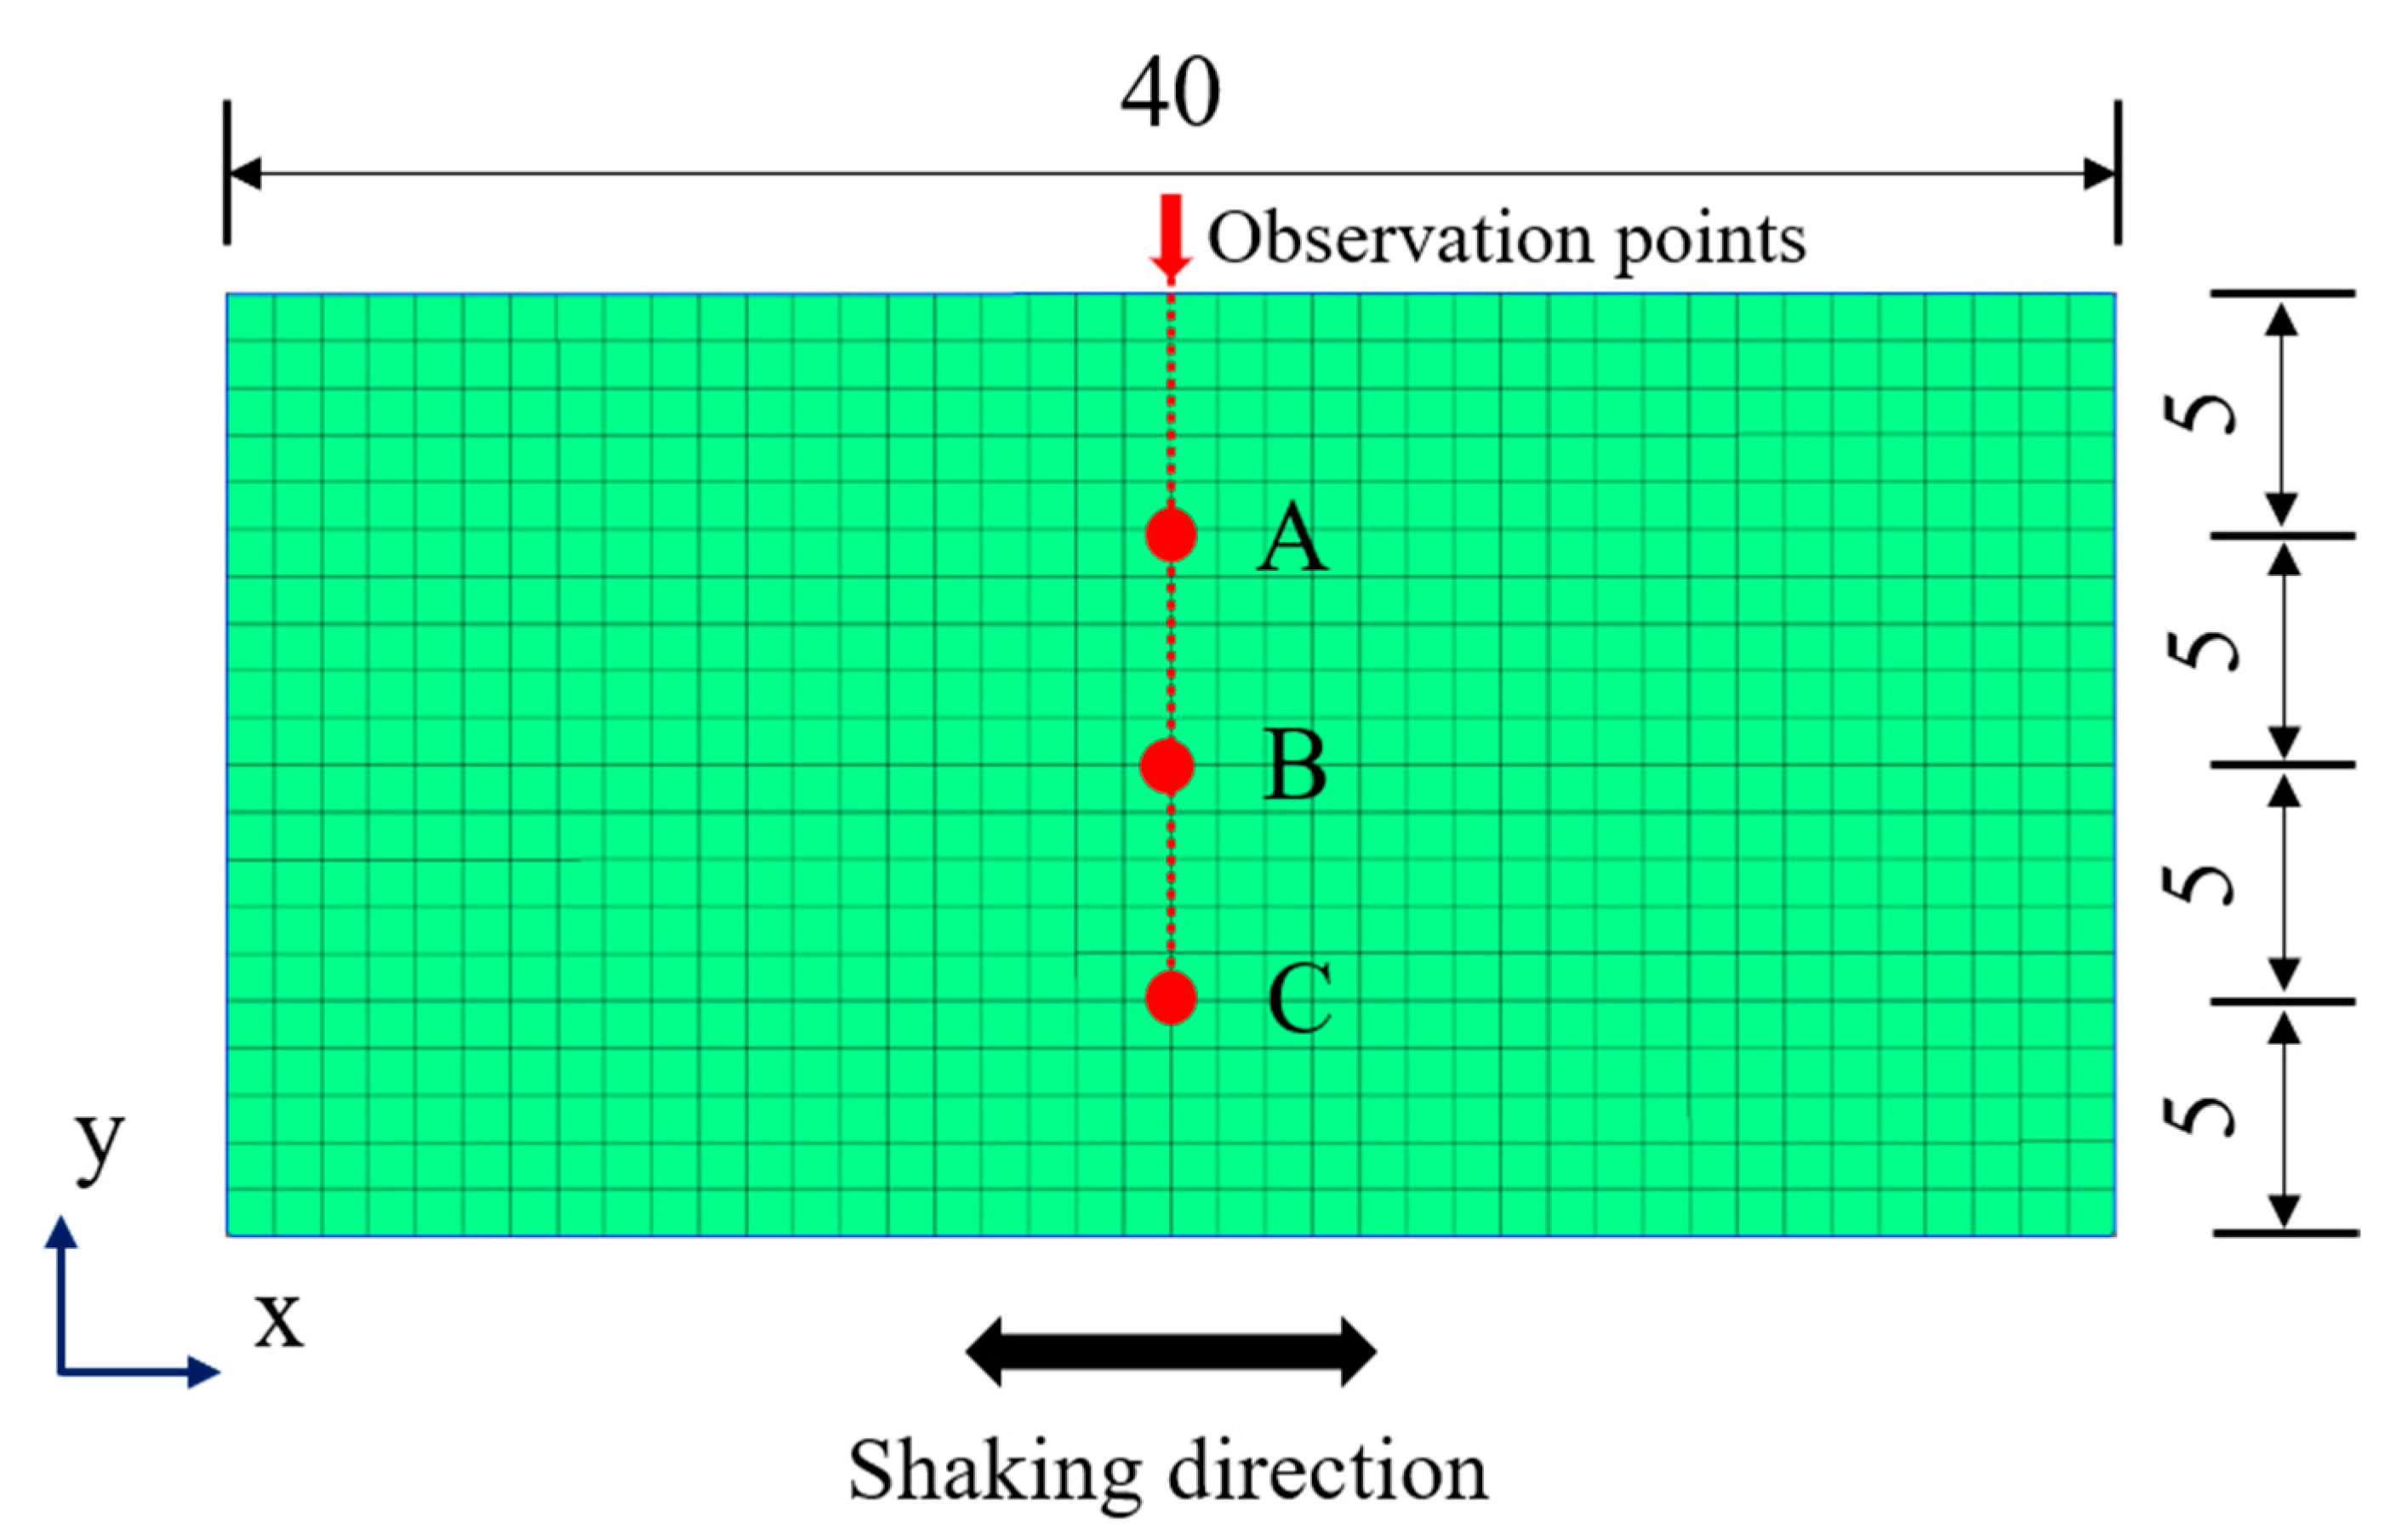
2.4. Instrumentation Layout

The study mainly focuses on the shaking acceleration of the sand, excess pore pressure, and ground settlement. Therefore, the instrumentations used include accelerometers, pore pressure transducers, and laser displacement transducers. As shown in Figure 4, the instrumentations are arranged by the following principles: (1) monitoring of the shaking table movement: accelerometers are placed on the shaking table surface to monitor the output motion of the table; (2) monitoring of the acceleration response of the sand: A row of single-axis accelerometers (A1–A5) are equally spaced on the left side of the model’s central axis, and placed as close to the center as possible. (3) monitoring of pore pressure response in the sand: a row of pore pressure transducers (P1–P4) is equally spaced on the right side of model’s central axis, and P1′, P3′ are placed at the same depth as P1, P3, respectively, for verification; (4) monitoring of ground settlement: a laser displacement transducer D1 is arranged in the center of the model to monitor the settlement of the model.

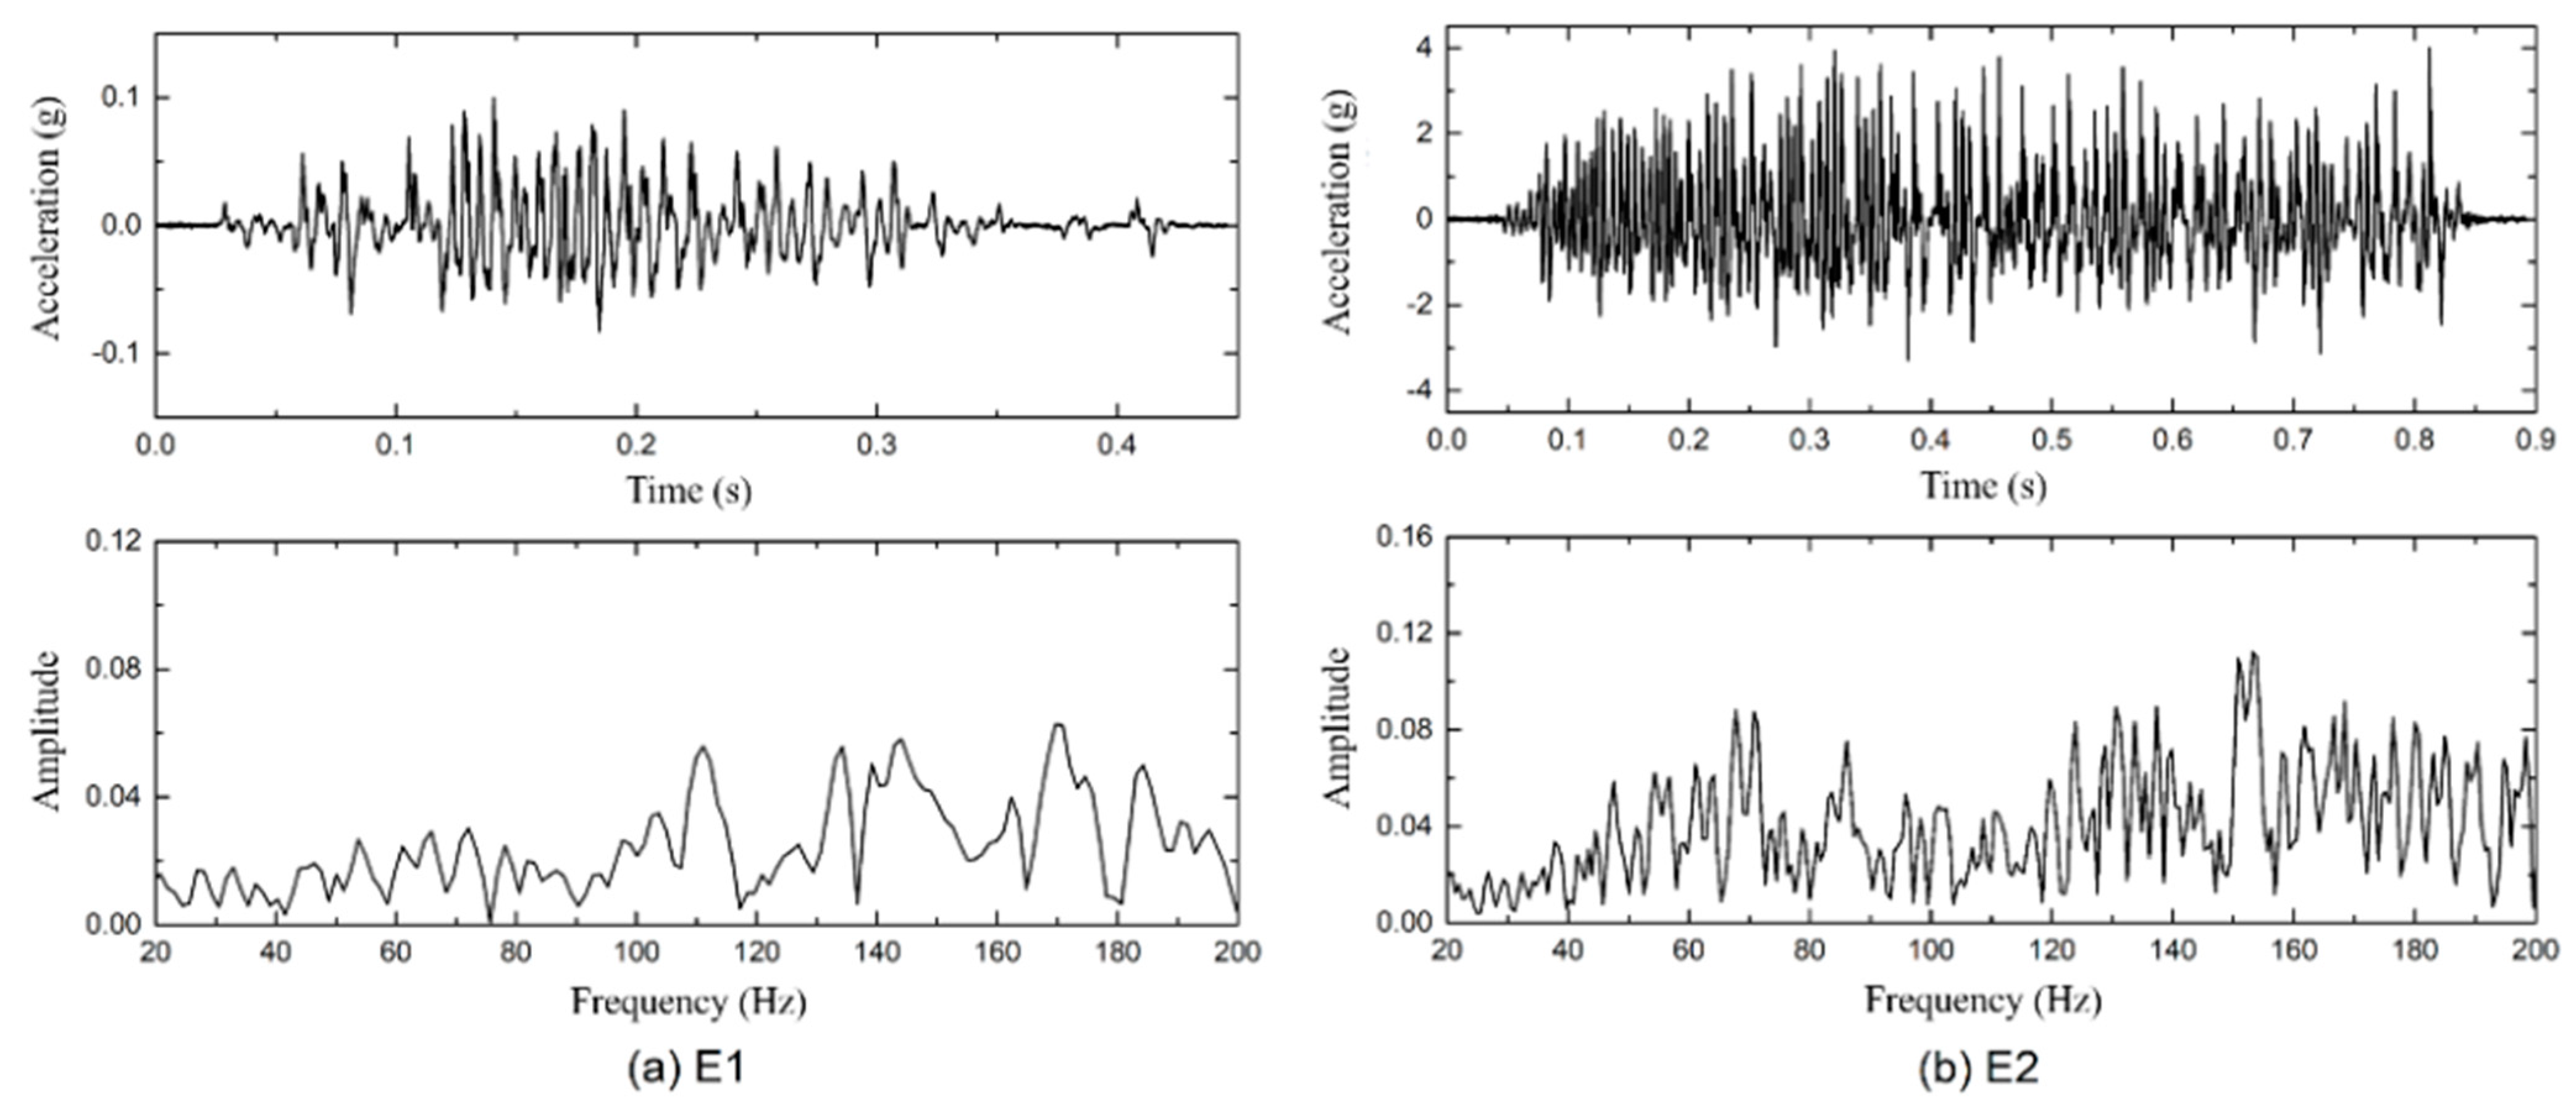
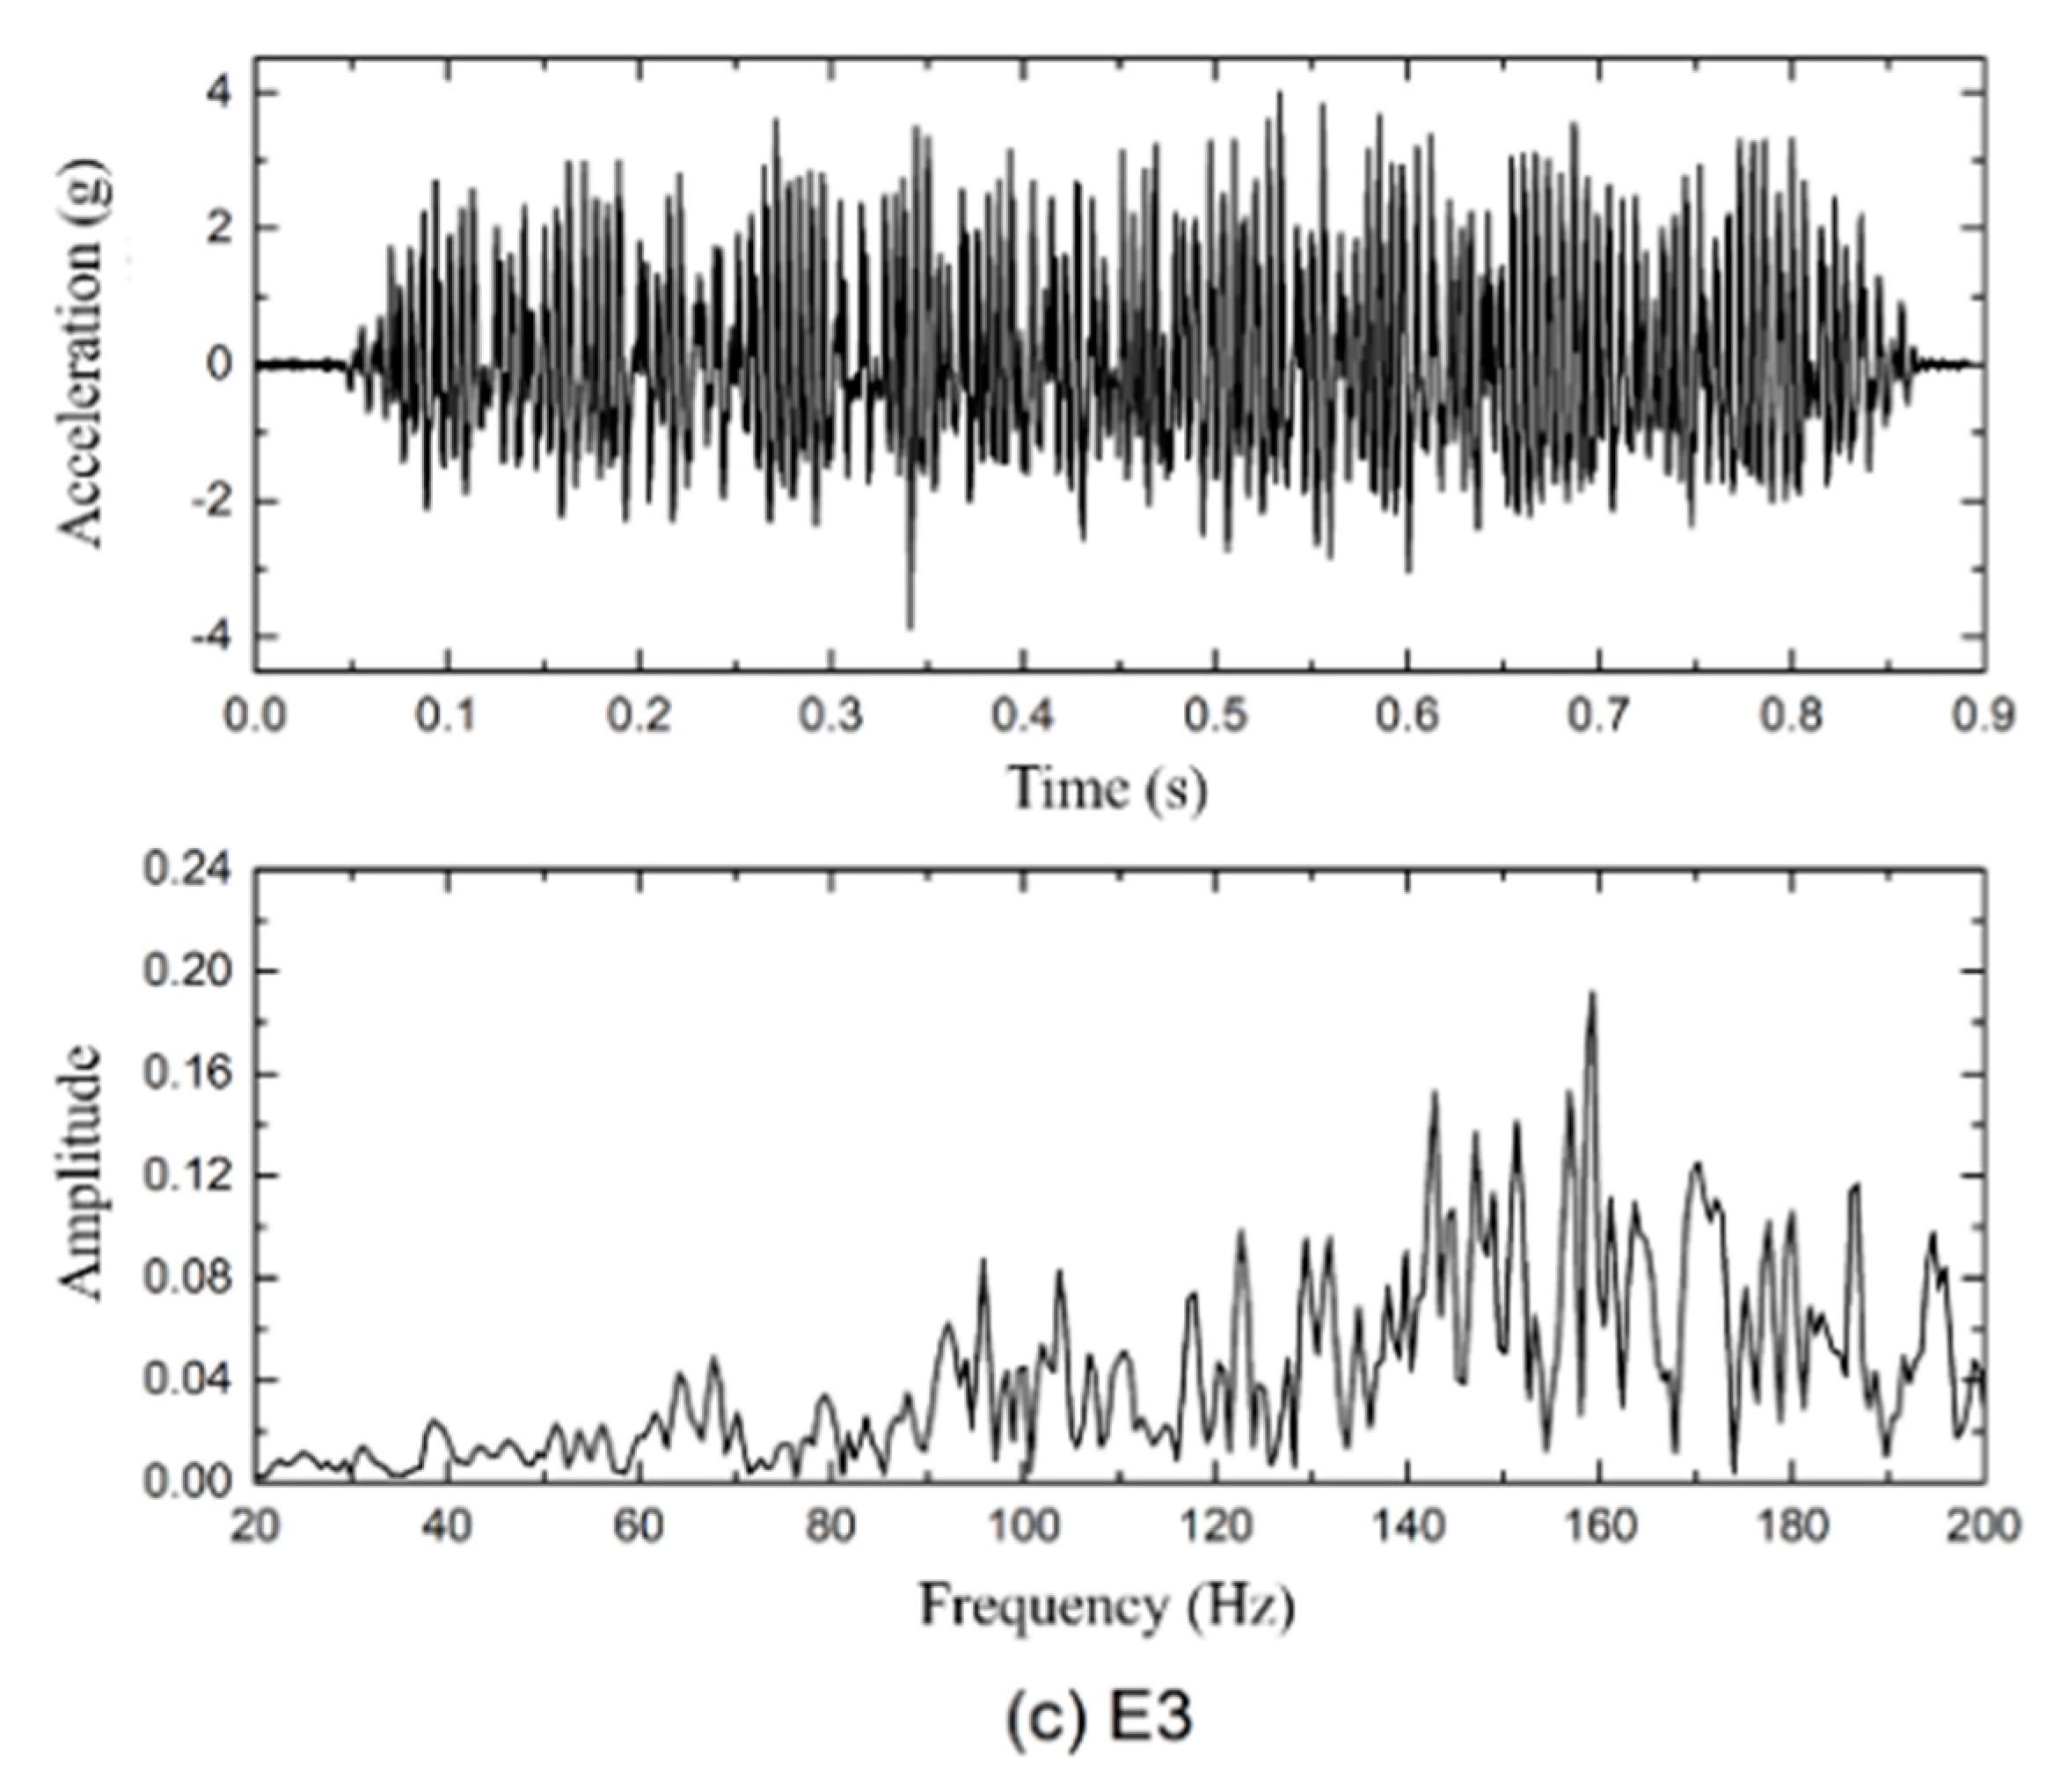
2.5. Input Ground Motions and Test Procedures

Three different earthquakes (E1, E2, and E3) defined in the seismic hazard assessment report for TBPP were selected as the input ground motions. These natural earthquake records have been adjusted to reflect the geological characteristics of the engineering site. The amplitude of acceleration for each input ground motion was linearly scaled to three levels of 0.1 g, 0.2 g, and 0.3 g, and the seismic loadings were input from the bottom of the model box along the lateral direction by a specified sequence as shown in Table 4. The white noise is applied to obtain any changes on the site’s frequency spectrum characteristics in the course of being subject to seismic loadings with increasing peak acceleration amplitudes. An adequately long interval between every single seismic loading was needed for a full dissipation of the excess pore pressure, for which the subsequent seismic waves were not input until approximately 60 s (model time) after precedent excitation. The M1 and M2 models were applied with the same loading condition.
Noted that the input motions of acceleration time histories must be scaled conforming to the scaling law. As indicated in Table 2, the time scaling factor is 1/67.3 (model/prototype, the same below), and the acceleration scaling factor is 40. Taking the actual input motions E1, E2, and E3 with a peak acceleration of 0.1 g as examples, the acceleration time histories and Fourier spectrums are shown in Figure 5. The durations of E1−1, E2−1, and E3−1 are 0.44 s, 0.89 s, and 0.89 s, respectively, and the Arias Intensity is 5.34 m/s, 16.1 m/s, and 19.74 m/s, respectively.

3. Experimental Results

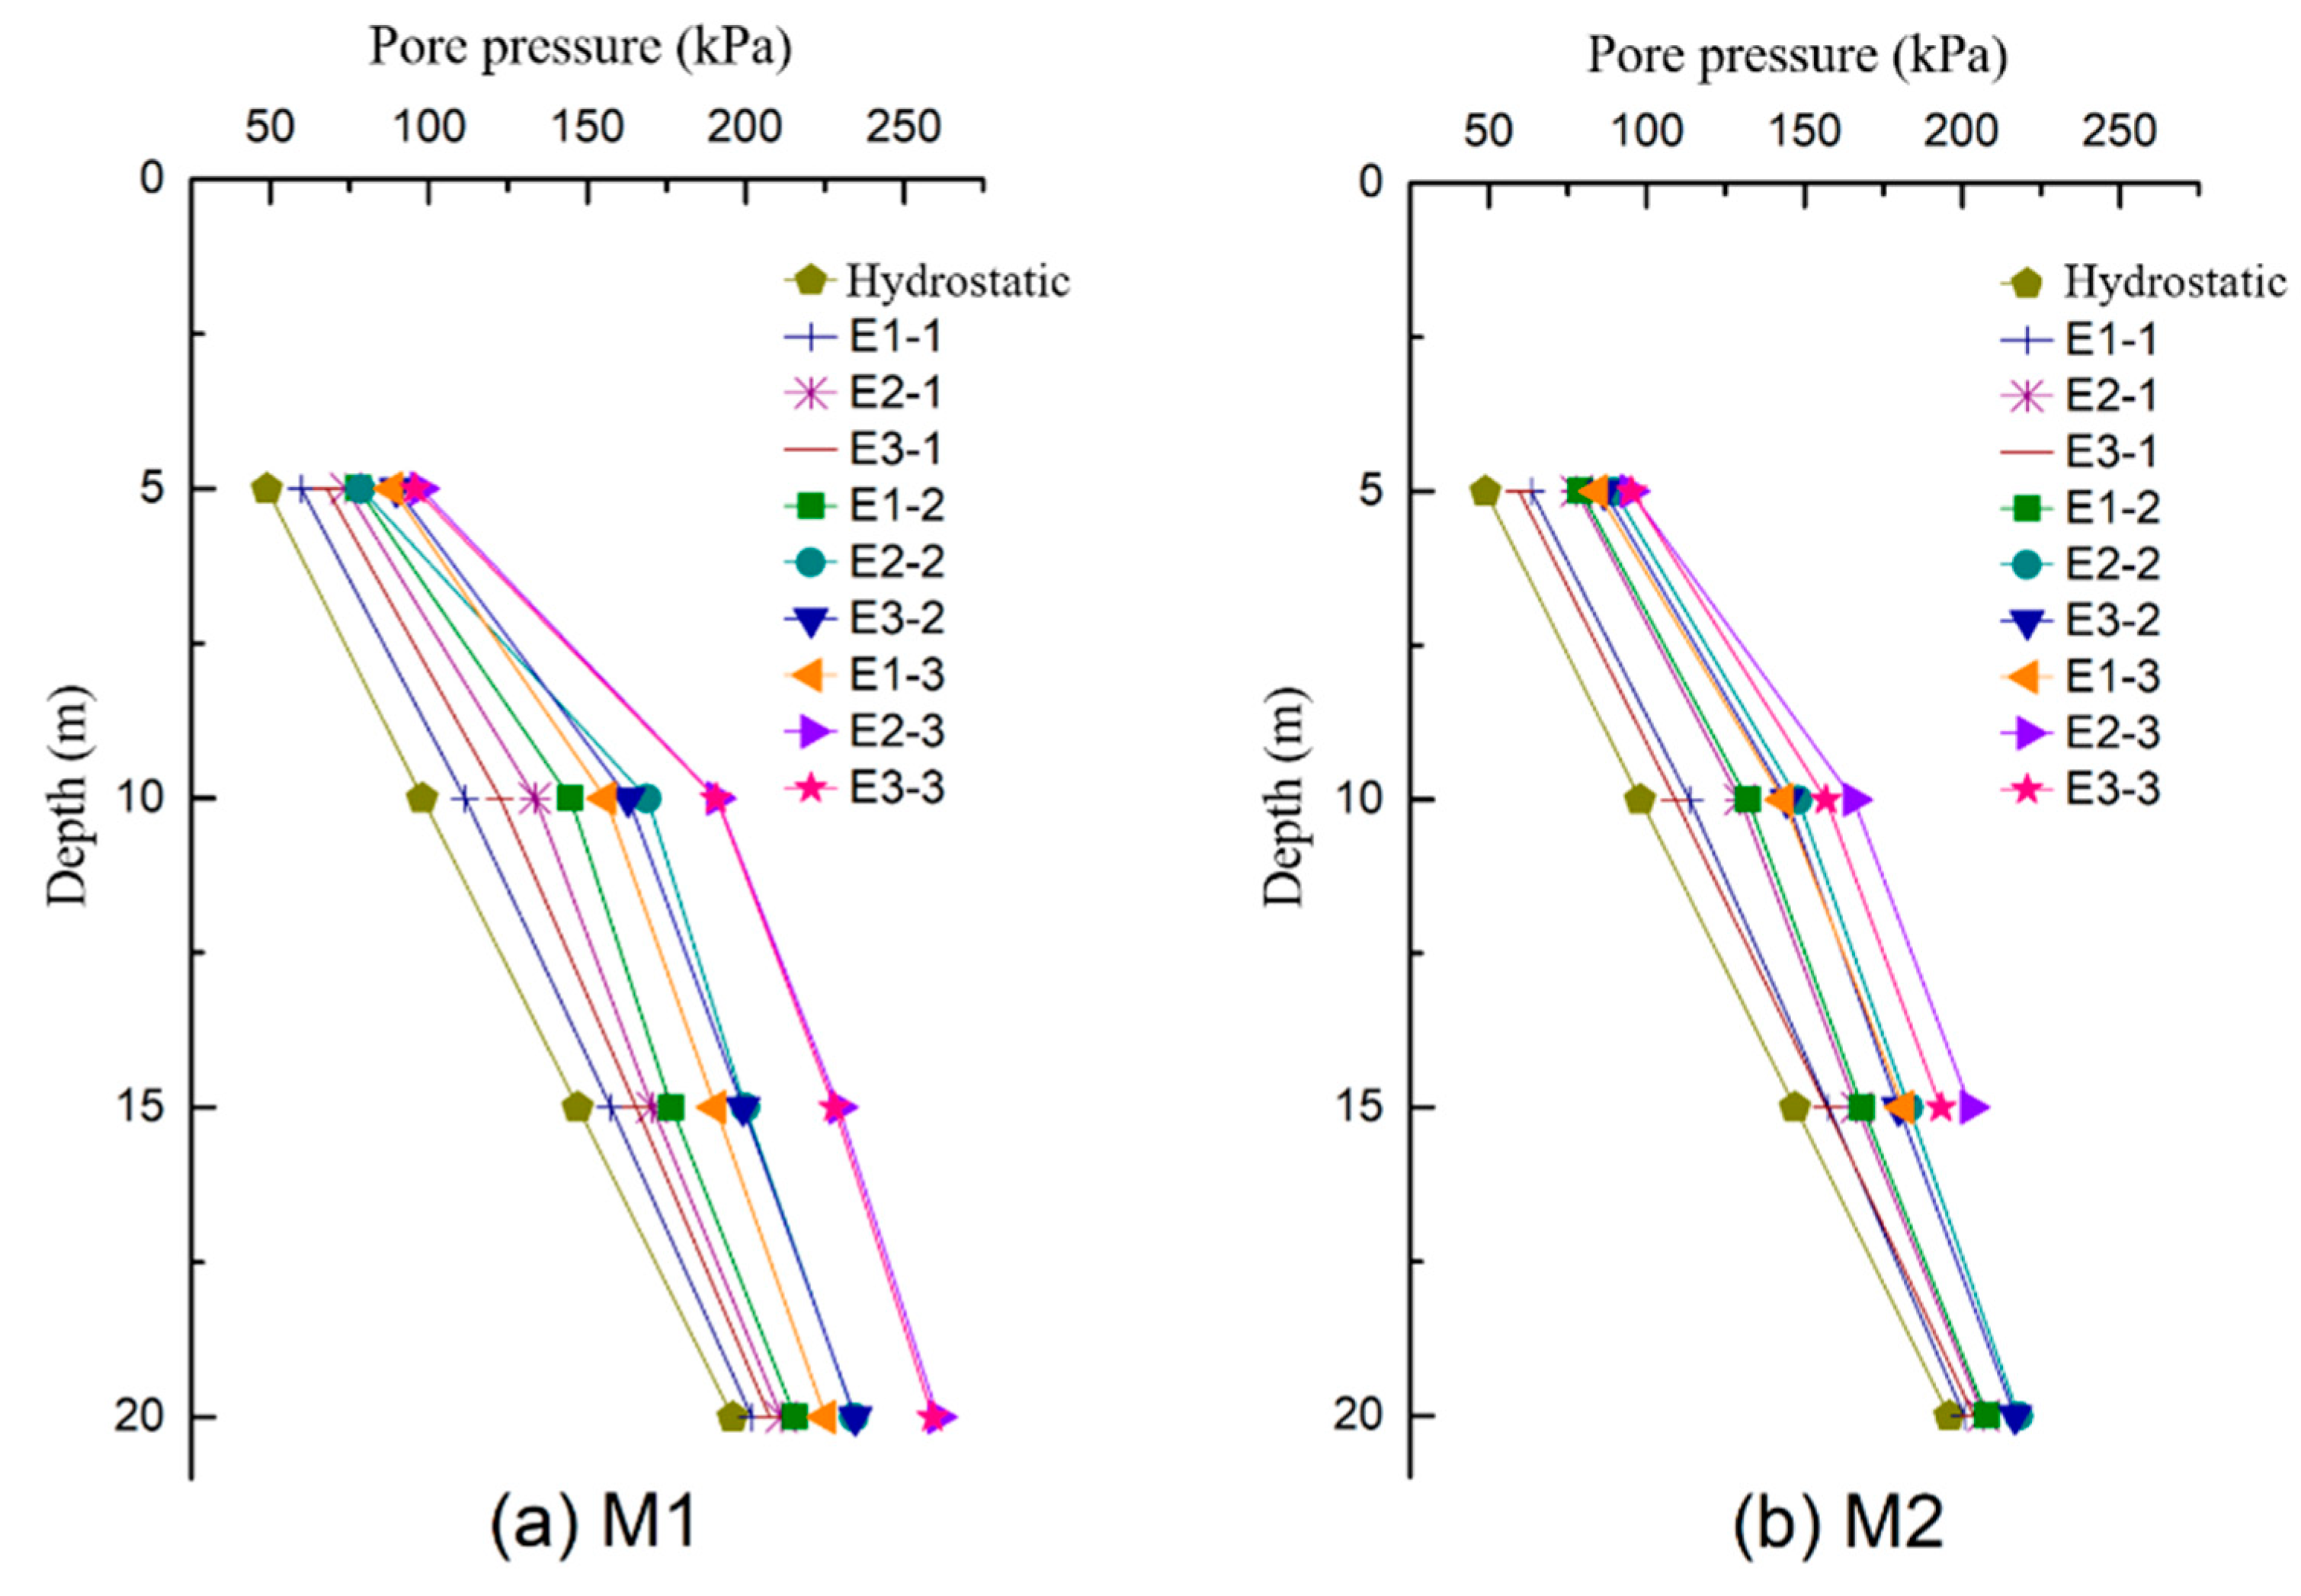
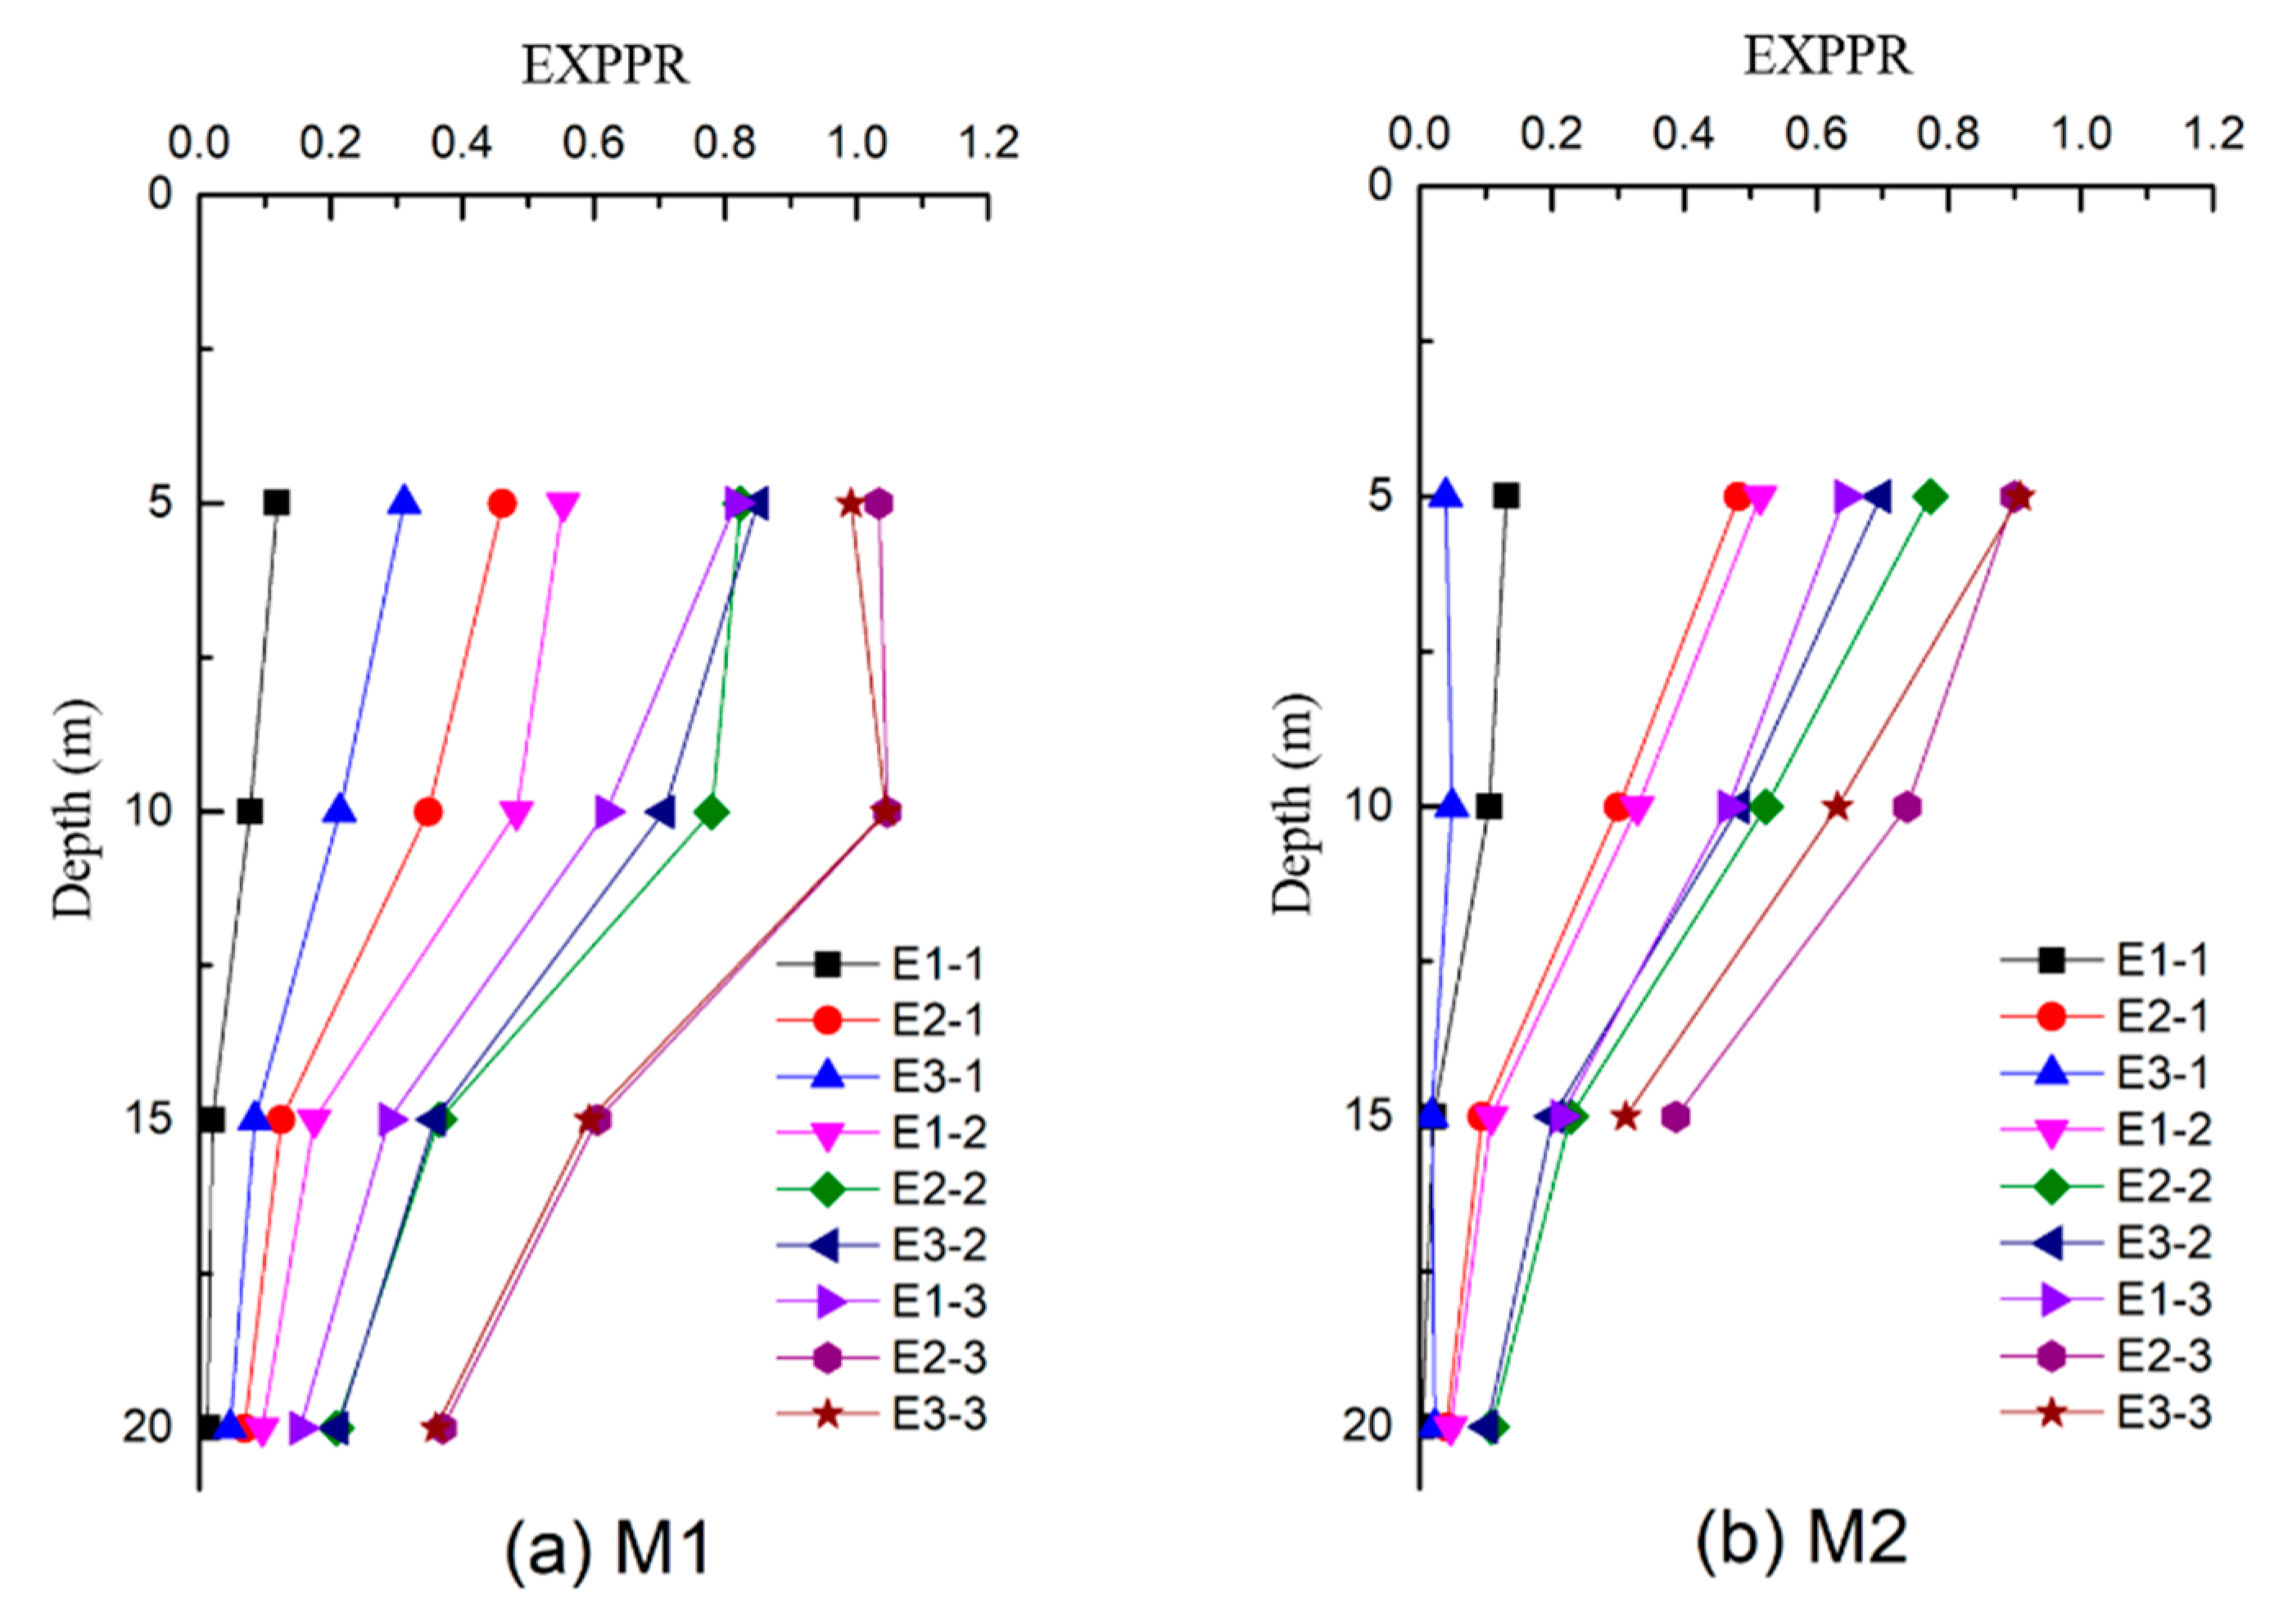
3.1. Excess Pore Pressure Response along the Depth

This study mainly focuses on the seismic response of pore pressure to evaluate the liquefaction potential of the saturated calcareous sand site. All the experimental results in this paper have been transformed to the prototype values through the scaling law. The excess pore pressure ratio (EXPPR) is defined as the ratio of excess pore pressure to the effective overburden stress. The maximum values of EXPP and EXPPR along the depth of the M1 and M2 model subjected to different earthquakes is plotted in Figure 6 and Figure 7. It is noted that the pore pressure time histories at a depth of 20 m for the M2 model was not completely recorded when subjected to the seismic loading with a peak acceleration of 0.3 g due to the damage.
As shown in Figure 6, the seismic responses of pore pressure for M1 and M2 models behave quite differently. When subjected to different earthquakes, the maximum values of EXPP at different depths for both M1 and M2 models rise with the increase of the peak acceleration, and the increments get smaller in the deeper soils. The maximum values of EXPP resulted from earthquakes E2 and E3 are significantly higher than that of E1, and there is trivial difference between responses of E2 and E3. Moreover, compared with M1, the maximum values of EXPP for M2 are smaller at every depth.
Similar phenomena can be more explicitly observed in the maximum values of EXPPR along the depth. As shown in Figure 7, on the excitation of E2 and E3 with a peak acceleration of 0.3 g (E2−3 and E3−3), the maximum values of EXPPR at the depths of 5 m and 10 m both reached up to around 1.0 for M1, indicating that the soils have completely liquefied; the E1 with the same peak acceleration (E1−3) can only lead to peak values of 0.8 and 0.6 for EXPPR at the same depth of soils in M1; and the peak value of EXPPR at the depth of 20 m in M1 is only about 0.4 in the cases of E2−3 and E3−3. Generally, for different input motions, E2 and E3 cause a higher maximum value of pore pressure with the same peak acceleration; and when subjected to the same seismic loading, the EXPPR in the shallower soils present higher maximum values. The stronger liquefaction resistance of deeper soils might be relevant to the higher confining pressure, which brings about higher dynamic strength of soils and more significant contraction and densification behavior.
Moreover, the maximum values of EXPPR at the depth of 5 m and 10 m are just about 0.9 and 0.6, respectively, for M2 in the loading cases of E2−3 and E3−3. The lower EXPPR implies soils with a stronger liquefaction resistance than that in M1 and could be explained by the higher relative density of M2.

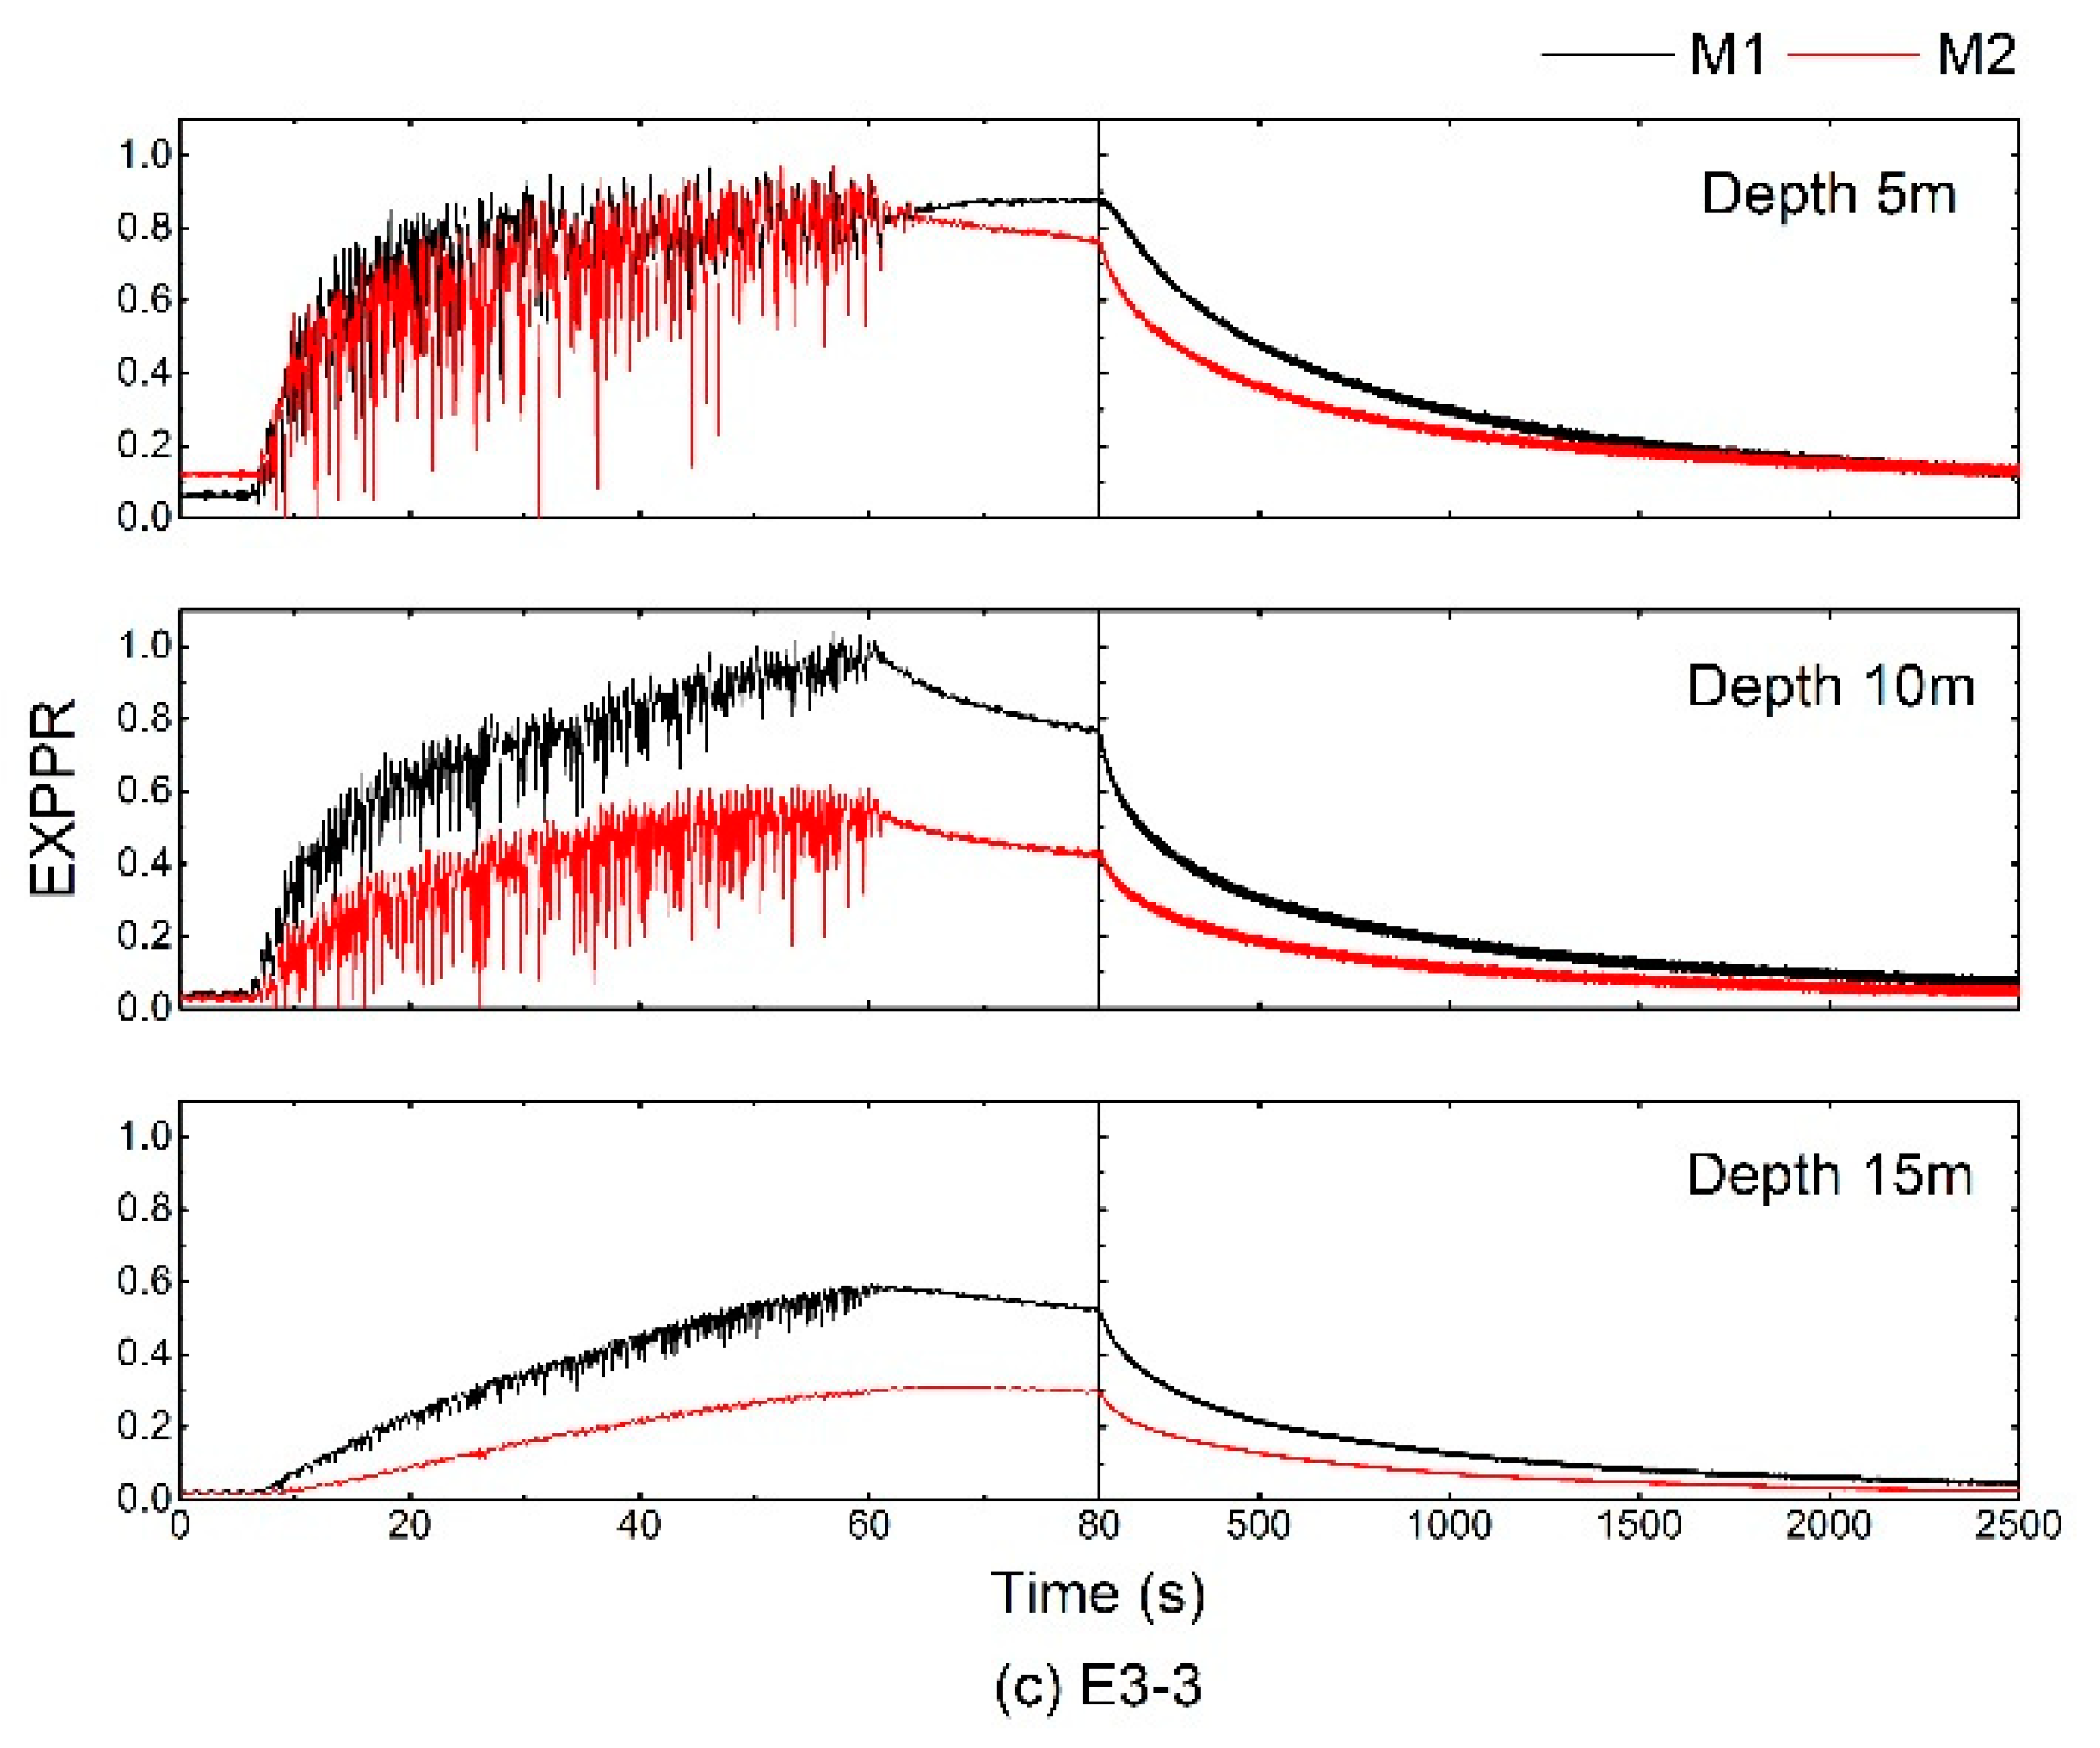
3.2. Excess Pore Pressure Time Histories during Strong Earthquakes

Further analysis is made on the EXPPR time histories during strong earthquakes. And the time histories of EXPPR at depths of 5 m, 10 m, and 15 m during the earthquakes of E1−3, E2−3, and E3−3 is plotted for both M1 and M2, which is shown in Figure 8.
It can be seen that for the same seismic loading and the same model, the peaks of the EXPPR of the soils decrease conspicuously with the increase of depth, and meanwhile the dissipation of pore pressure slightly accelerates; still for the same seismic loading, the peaks of EXPPR in M1 are significantly higher than that in M2. However, the dissipation rates of M1 and M2 are similar, with M2 being slightly faster in most of the cases. Moreover, it is worth noticing that during the earthquakes, the time histories of EXPPR in M2 exhibits more obvious “spikes”, which indicates that the high relative density calcareous sand of M2 is more easily able to dilate under dynamic loading. Among the earthquakes of E1, E2, and E3, E3 leads to the fastest accumulation of EXPP in the soils, while E1 leads to the slowest.
Apart from the aforementioned characteristic, it should also be noted that under the same seismic loading, the time histories of EXPPR at a depth of 15 m display significantly smaller “spikes” for both M1 and M2. The phenomenon might be explained by the fact that the soils under high confining pressure have a relatively stronger tendency toward contraction rather than dilation during the dynamic loading, which agrees with the discussion in last section.

4. Numerical Simulation

4.1. Constitutive Model and Parameters

The centrifuge tests could be inevitably restricted by realistic factors such as facility capacity, testing materials, and experiment costs, which pose difficulties in physically modelling the complex boundary value problems in engineering. With advantages in this aspect, the dynamic numerical analysis has become an important alternative to study the seismic response of saturated sites. Additionally, the FE analysis based on Biot’s dynamic consolidation equation, which fully couples the pore pressure with the dynamic response of the soil skeleton, is one of the most promising and renowned numerical approaches [39], within the framework of which the constitutive model of soil plays a critical role and determines its prediction capability. The multi-yield surface elastoplastic constitutive, PDMY02, was applied in this study to simulate the liquefiable calcareous sand material [40,41]. Additionally, the OpenSees, an open-source computation platform, was used to carry out the fully coupled FE analyses on the seismic response of saturated ground. The prediction capability of the numerical approach was also evaluated.
PDMY can well describe the cyclic mobility and irreversible shear strain accumulation behavior of liquefiable sand under seismic excitation, which has been verified in many research applications [33,34,42,43,44,45]. It is developed based on the multiple yield surface theory proposed by Prevost [46], and a combination of associative and non-associative flow rules is adopted. A total of 17 input parameters are needed for the model. Gingery et al. [47] calibrated the parameters of sand with different densities, the method of which is referred to in this paper for calibrating the sand materials, combined with the in-situ measurement. The parameters for constitutive model are listed in Table 5.

4.2. Finite Element Model and Computation Procedure

The 2D FE model of the saturated calcareous sand with relative density of 50% was established and analyzed. As shown in Figure 9, the dimensions of the FE model are 20 m × 40 m (height and width), the height of which is consistent with that of the centrifuge model. The sand material is modeled by QuadUP elements [48] following the u - p dynamic consolidation equation, and the thickness of elements is 1 m. According to the laboratory test results, the permeability k s a n d of sand materials is set to be 6.4 × 10⁻² cm/s. The boundary conditions are set as follows: (1) the displacement of nodes in left and right boundaries sharing the same elevation are forced to be equal in x -direction and y -direction; (2) The nodes at the base are fixed, and the input seismic loading is imposed on the base along the x -direction; (3) The pore pressure on the soil surface is fixed to be zero, and other boundaries are impervious. The earthquake E2 in the centrifuge tests are selected as the input seismic loading, and the peak acceleration is linearly scaled to 0.1 g, 0.2 g, and 0.3 g.
Uniform linear elastic mechanical properties were applied to all the materials in the model to establish the initial static stress condition as well as to avoid the stress concentration or arching effects. After that, the corresponding input parameters of sand materials were restored, and elastoplastic analysis was performed to obtain the initial stress field and pore pressure field. The ground motion was imposed on the base of the model by means of acceleration time history, namely the vibration method. During the computation, Rayleigh damping of 0.5% was applied to control high-frequency noise and ensure the damping energy dissipation of the soils under small strain condition.

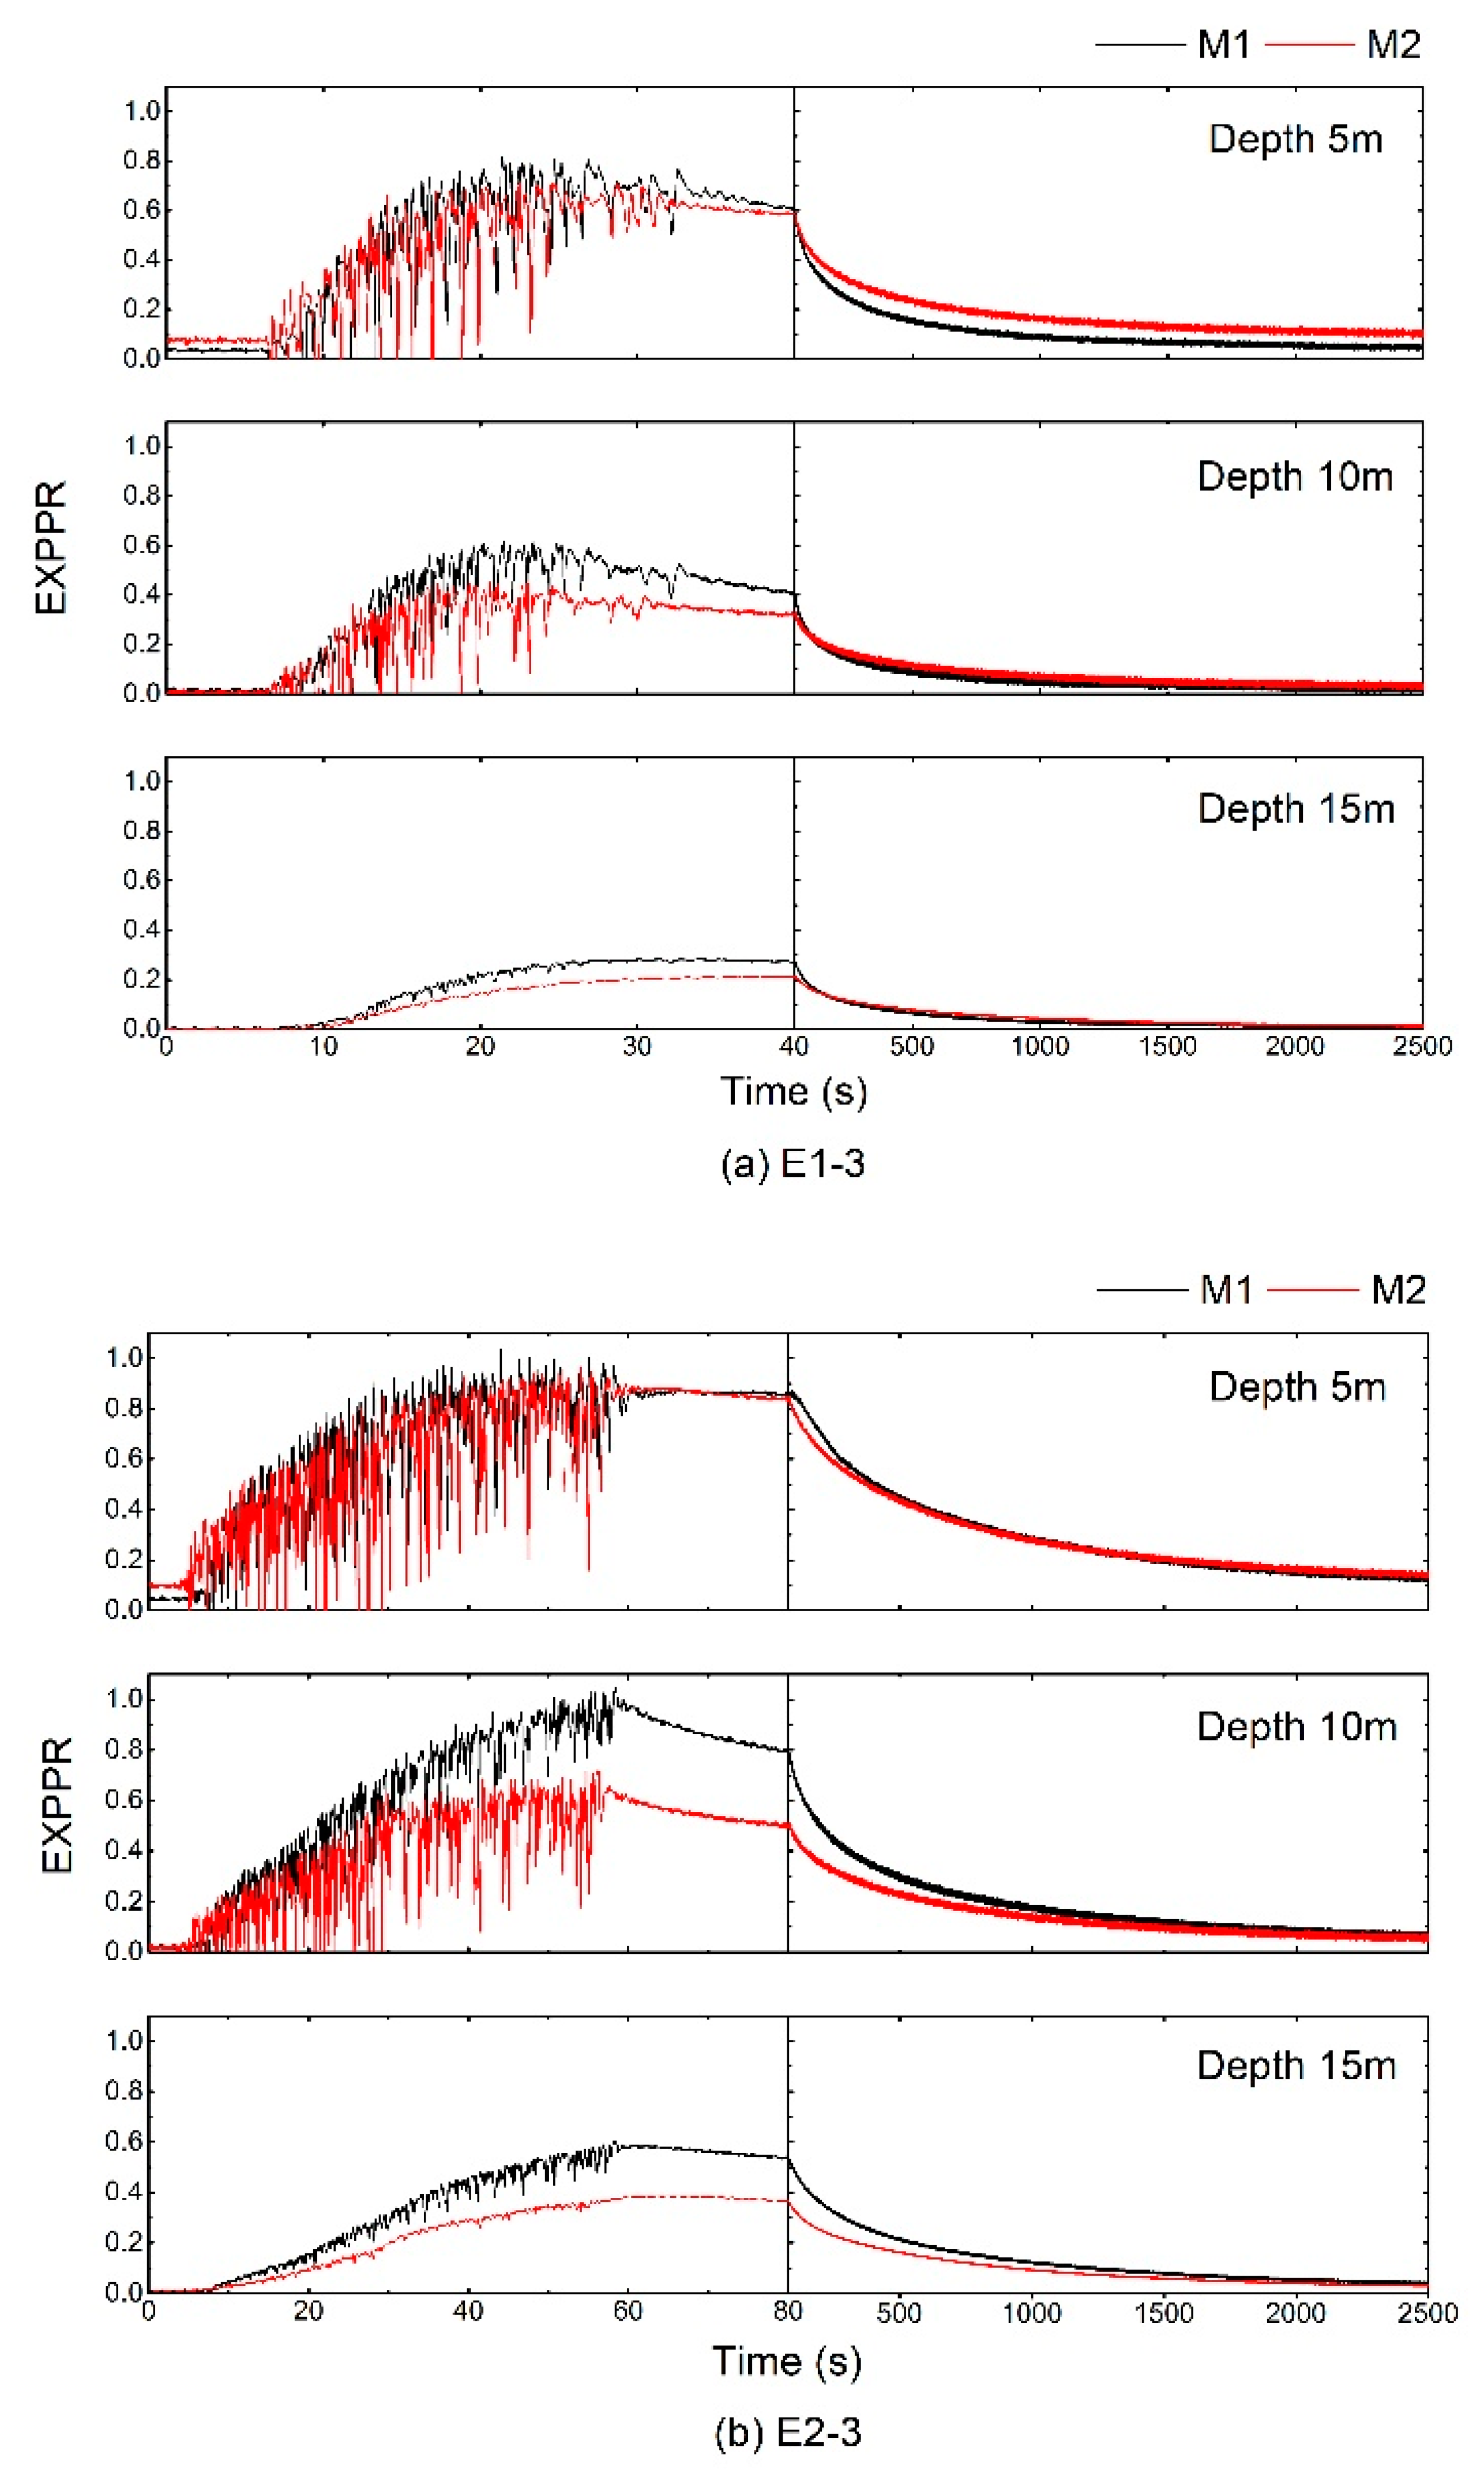
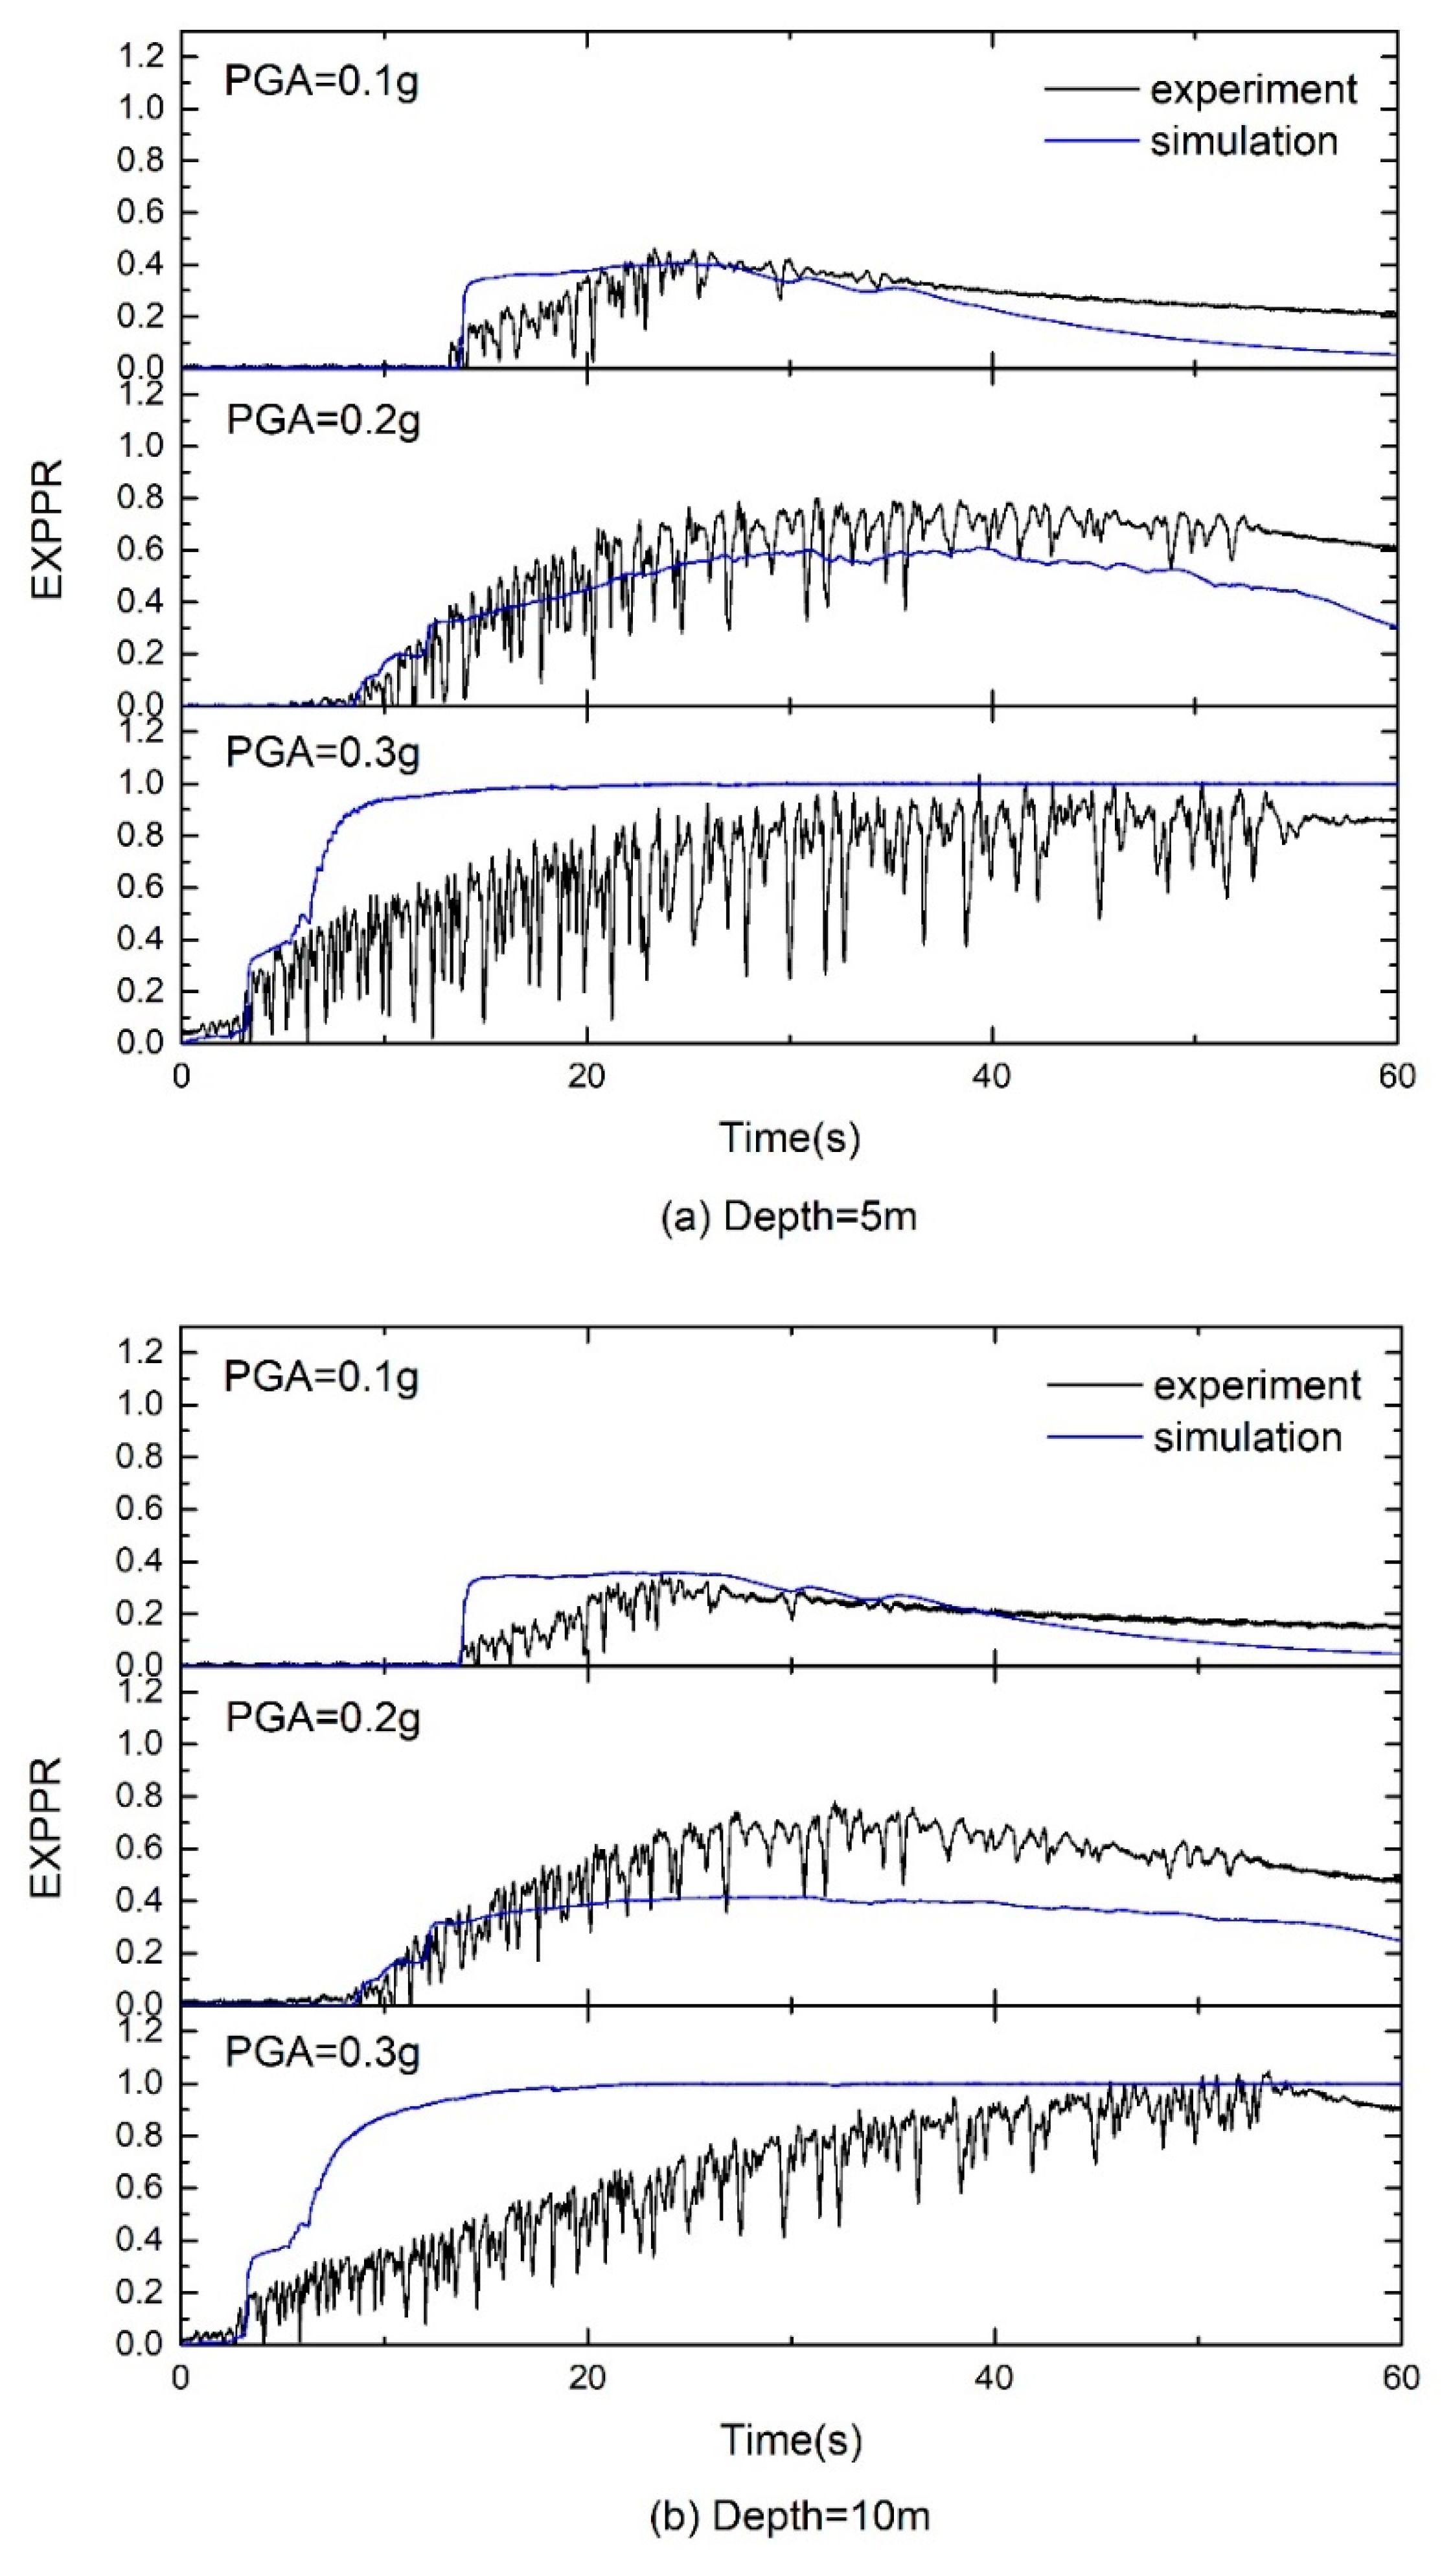
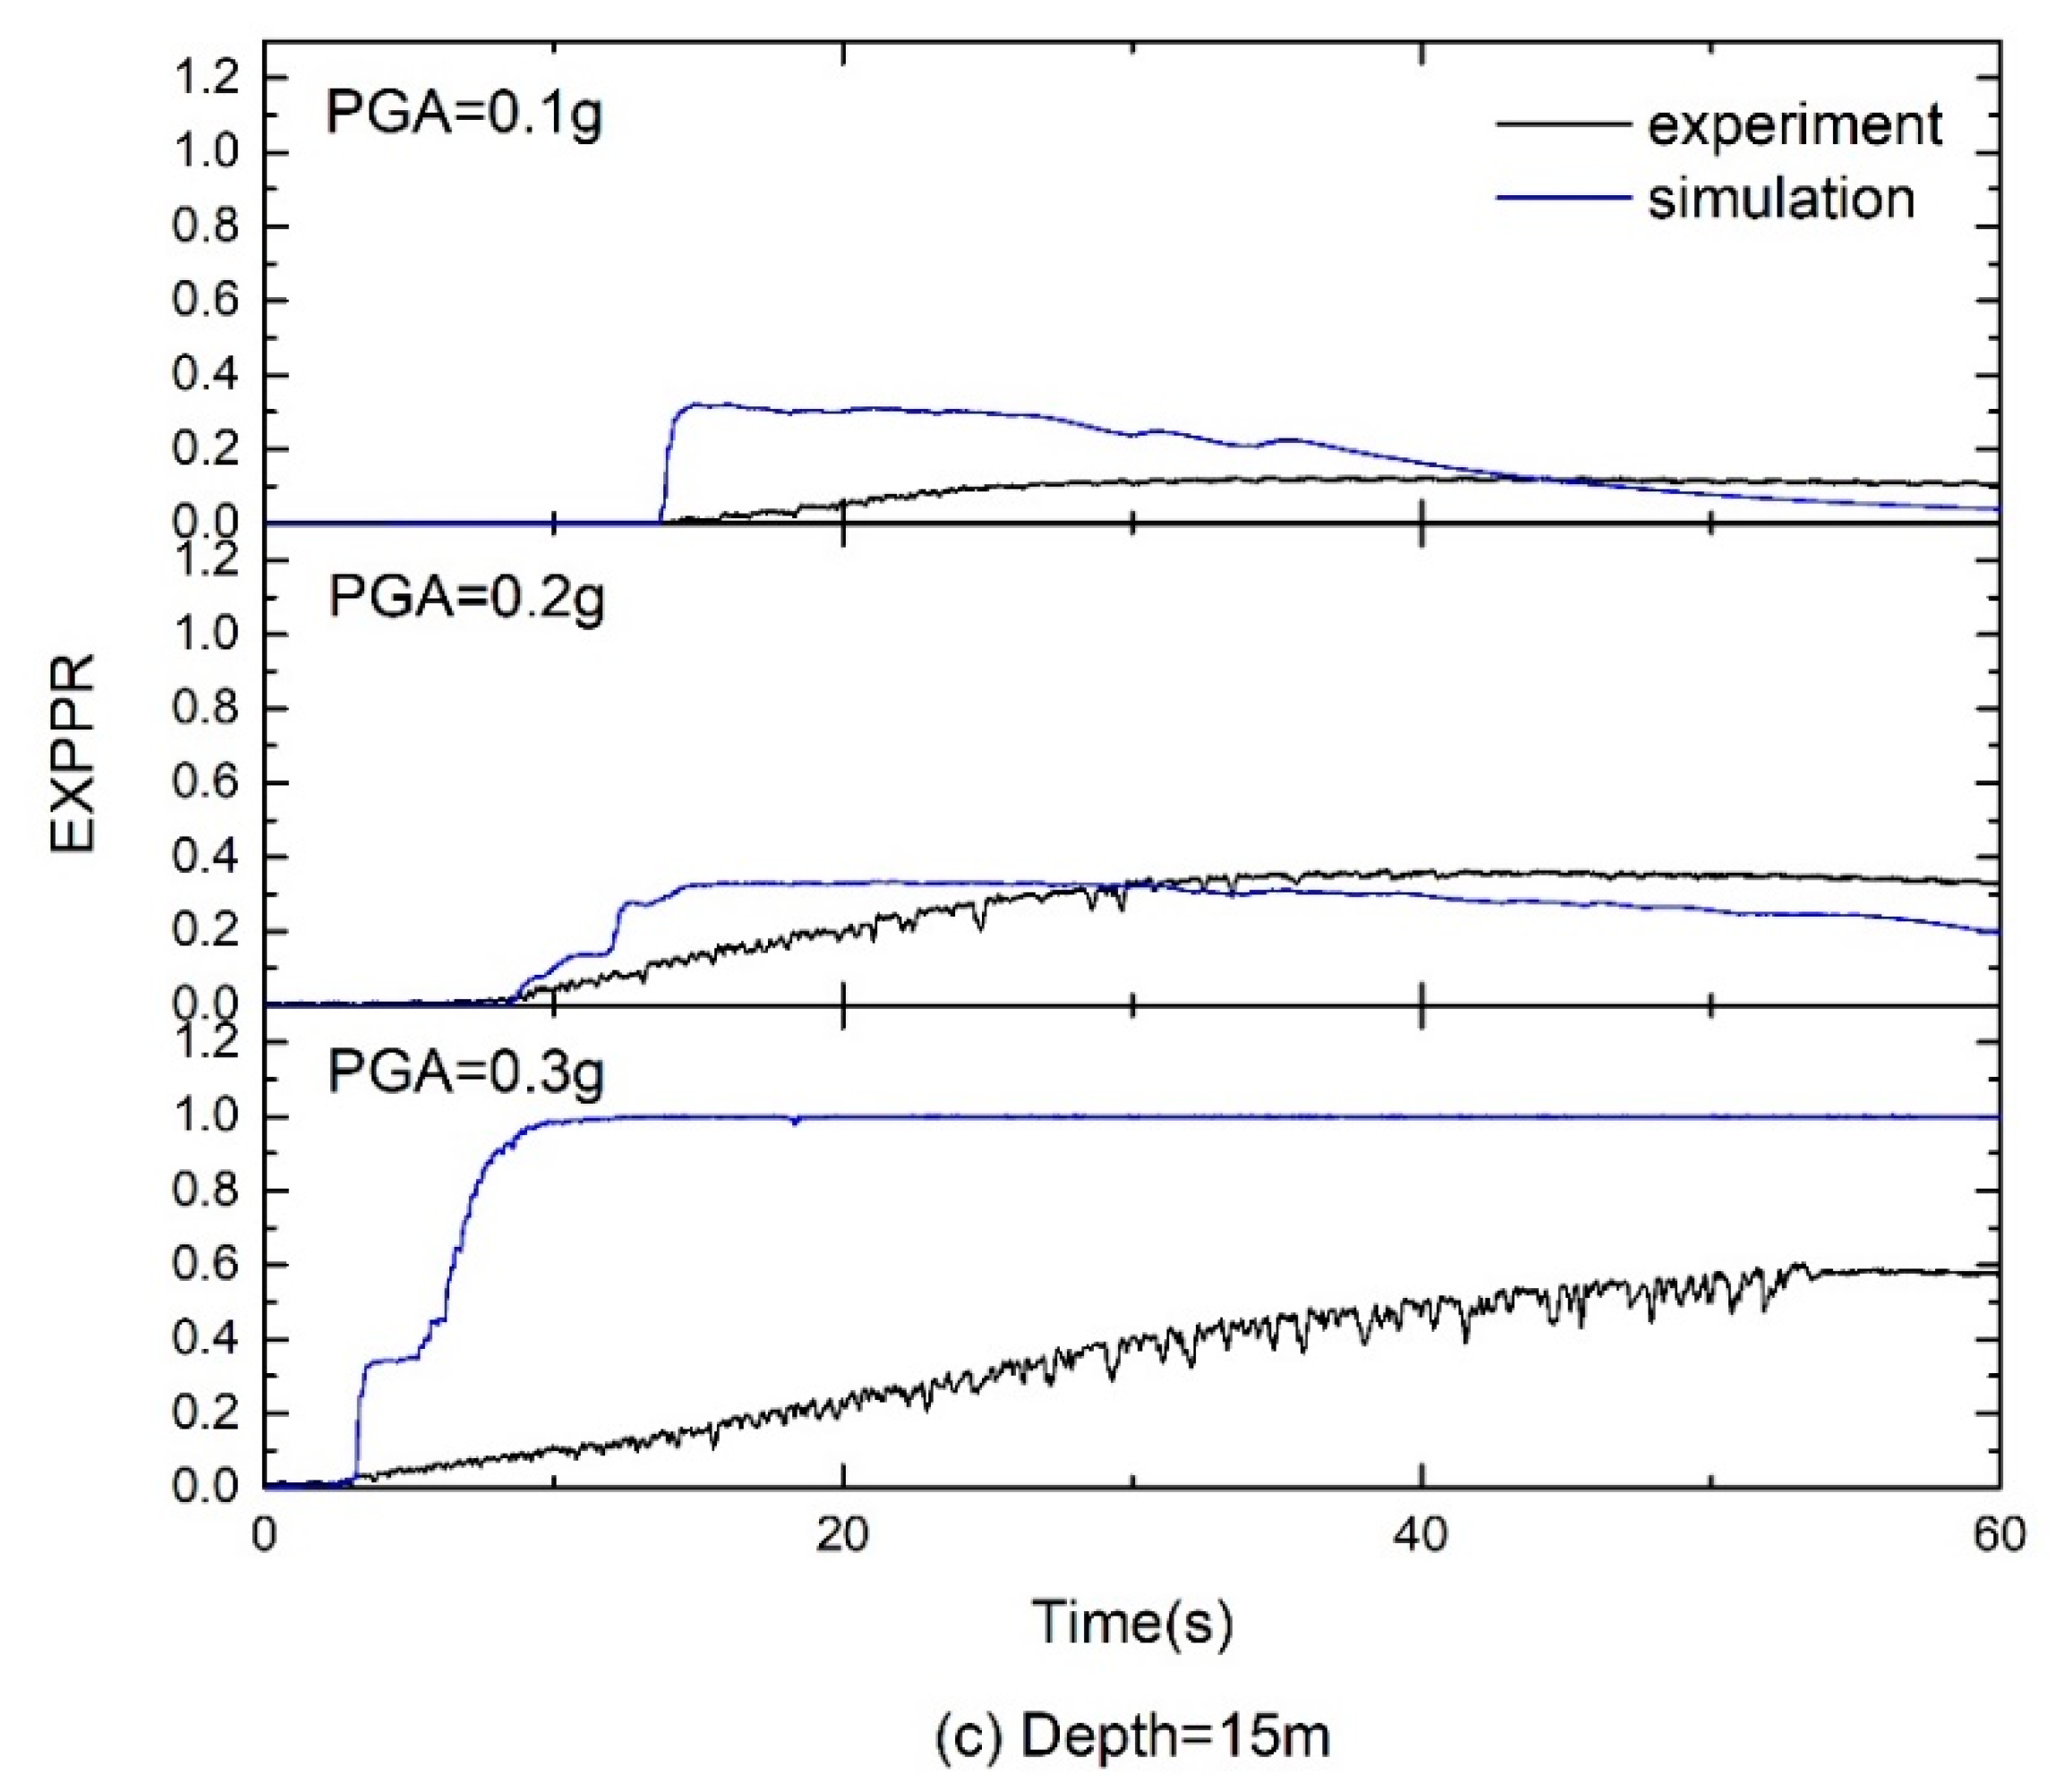
4.3. Simulation Results

Observation points A, B, and C were placed sequentially at a depth of 5 m, 10 m, and 15 m along the central axis of the model, as indicated in Figure 9. The seismic response of EXPPR at the observation points during earthquakes of different peak accelerations were plotted and compared with the measured results in the centrifuge model (see Figure 10).
With regard to the numerical results, it can be seen that with the increase of the peak acceleration of the input ground motion, the EXPPRs at all the depths reach up to a higher maximum value with faster accumulation and slower dissipation. Under the earthquake with peak acceleration of 0.3 g, the EXPPRs at all the observation points reach 1.0 after about 9 s, even for point C located at 15 m depth, implying a high risk of liquefaction for the simulated site. Moreover, the EXPPRs remain in a high platform and do not dissipate during the loading of the earthquake. The earthquakes with peak acceleration of 0.1 g and 0.2 g both result in EXPPRs at different depths lower than 0.6, indicating that the liquefaction potential of the site is relatively low.
Compared with the experimental results, the numerical results generally present a faster process in both accumulation and dissipation but relatively consistent peak values of the EXPPRs. The only noticeable discrepancy occurs at the depth of 15 m under PGA of 0.3 g. The numerical results largely overestimated the EXPPR, which may be attributed to the overburden stress effect that is not well incorporated in the constitutive model. Moreover, it is obvious that the numerical results hardly have the “spikes”, which is distinct in experiments. Generally, both the numerical and experimental results imply that the saturated calcareous sand site with relative density of 50% will have a high liquefaction potential for the sand at shallow depth when subjected to the earthquakes having peak acceleration of 0.3 g or even higher. In addition, the dynamic FE analysis framework adopting u - p formulation and PDMY02 was proved to effectively predict the peak values of EXPPR during earthquake.

5. Conclusions

In this paper, two-stage scaling law theory was adopted to carry out dynamic centrifuge tests on two calcareous sand models with different relative densities (M1 and M2) under three different earthquakes by means of stepwise loading. Moreover, dynamic FE analyses were conducted on a medium dense site subjected to strong earthquakes. The dynamic responses of the horizontal saturated free field during earthquakes were analyzed with a focus on the characteristics of pore pressure development. The liquefaction potential of the engineering site is comprehensively evaluated, and three major conclusions are drawn as follows:
(1)
The maximum value of EXPPR for the saturated calcareous sand ground will decrease with the increase of soil’s depth, while it will increase with the increase of the input ground motion’s peak acceleration and duration. The improvement of the relative density of can effectively strengthen the liquefaction resistance of the ground, reduce the peak pore pressure, and accelerate the dissipation process.
(2)
When subjected to earthquakes with 0.3 g peak acceleration, the saturated calcareous sand ground model witnessed the peak values of EXPPR reaching up to around 1.0 at the depth of 5–10 m, indicating a high potential of liquefaction under the same circumstances.
(3)
Based on Biot’s dynamic consolidation theory, the dynamic FE analysis using the PDMY constitutive model can well simulate the seismic response of the EXPP at the initial stage of pore pressure accumulation. However, generally, the pore pressure could build up and dissipate relatively faster in the numerical results.

Author Contributions

Conceptualization, W.L. and Y.Y.; methodology, P.C. and Y.Y.; software, X.L. and J.D.; validation, J.D. and Y.Y.; writing—original draft preparation, J.D.; writing—review and editing, Y.Y. and C.L.; visualization, J.D.; supervision, Y.Y. and C.L.; project administration, P.C. and X.L. All authors have read and agreed to the published version of the manuscript.

Funding

This research was funded by the National Natural Science Foundation of China (52061135112 and 51908425) and the Innovation Group Project of Southern Marine Science and Engineering Guangdong Laboratory (Zhuhai) (311020009).

Institutional Review Board Statement

Not applicable.

Informed Consent Statement

Not applicable.

Data Availability Statement

Not applicable.

Acknowledgments

The authors acknowledge the support from the Key Laboratory of Environment and Safety Technology of Transportation Infrastructure Engineering, CCCC.

Conflicts of Interest

The authors declare no conflict of interest.

References

  1. Avilés-Campoverde, D.; Chunga, K.; Ortiz-Hernández, E.; Vivas-Espinoza, E.; Toulkeridis, T.; Morales-Delgado, A.; Delgado-Toala, D. Seismically Induced Soil Liquefaction and Geological Conditions in the City of Jama due to the M7. 8 Pedernales Earthquake in 2016, NW Ecuador. Geosciences 2020, 11, 20. [Google Scholar] [CrossRef]
  2. Potter, S.H.; Becker, J.S.; Johnston, D.M.; Rossiter, K.P. An overview of the impacts of the 2010–2011 Canterbury earthquakes. Int. J. Disaster Risk Reduct. 2015, 14, 6–14. [Google Scholar] [CrossRef]
  3. Chiaro, G.; Koseki, J.; Kiyota, T. An Investigation on the Liquefaction-Induced Sloped Ground Failure during the 1964 Niigata Earthquake. In Geotechnical Hazards from Large Earthquakes and Heavy Rainfalls; Springer: Tokyo, Japan, 2017; pp. 133–143. [Google Scholar]
  4. Sassa, S.; Takagawa, T. Liquefied gravity flow-induced tsunami: First evidence and comparison from the 2018 Indonesia Sulawesi earthquake and tsunami disasters. Landslides 2019, 16, 195–200. [Google Scholar] [CrossRef]
  5. Rapti, I.; Lopez-Caballero, F.; Modaressi-Farahmand-Razavi, A.; Foucault, A.; Voldoire, F. Liquefaction analysis and damage evaluation of embankment-type structures. Acta Geotech. 2018, 13, 1041–1059. [Google Scholar] [CrossRef]
  6. Chian, S.; Tokimatsu, K.; Madabhushi, S.P.G. Soil liquefaction-induced uplift of underground structures: Physical and numerical modeling. J. Geotech. Geoenviron. Eng. 2014, 140, 04014057. [Google Scholar] [CrossRef]
  7. Cui, S.; Pei, X.; Jiang, Y.; Wang, G.; Fan, X.; Yang, Q.; Huang, R. Liquefaction within a bedding fault: Understanding the initiation and movement of the Daguangbao landslide triggered by the 2008 Wenchuan Earthquake (Ms = 8.0). Eng. Geol. 2021, 295, 106455. [Google Scholar] [CrossRef]
  8. Cubrinovski, M.; Bray, J.D.; Taylor, M.; Giorgini, S.; Bradley, B.; Wotherspoon, L.; Zupan, J. Soil liquefaction effects in the central business district during the February 2011 Christchurch earthquake. Seismol. Res. Lett. 2011, 82, 893–904. [Google Scholar] [CrossRef]
  9. Yasuda, S.; Towhata, I.; Ishii, I.; Sato, S.; Uchimura, T. Liquefaction-induced damage to structures during the 2011 great east Japan earthquake. J. JSCE 2013, 1, 181–193. [Google Scholar] [CrossRef]
  10. Tsai, C.C.; Hsu, S.Y.; Wang, K.L.; Yang, H.C.; Chang, W.K.; Chen, C.H.; Hwang, Y.W. Geotechnical reconnaissance of the 2016 ML6. 6 Meinong earthquake in Taiwan. J. Earthq. Eng. 2018, 22, 1710–1736. [Google Scholar] [CrossRef]
  11. Kiyota, T.; Furuichi, H.; Hidayat, R.F.; Tada, N.; Nawir, H. Overview of long-distance flow-slide caused by the 2018 Sulawesi earthquake, Indonesia. Soils Found. 2020, 60, 722–735. [Google Scholar] [CrossRef]
  12. Bird, J.F.; Bommer, J.J. Earthquake losses due to ground failure. Eng. Geol. 2004, 75, 147–179. [Google Scholar] [CrossRef]
  13. Shen, J.Y.; Wang, R. Study on engineering properties of calcareous sand. J. Eng. Geol. 2010, 18 (Suppl. S1), 26–32. (In Chinese) [Google Scholar]
  14. Zhu, C.Q.; Chen, H.Y.; Meng, Q.S.; Wang, R. Microscopic characterization of intra-pore structures of calcareous sands. Rock Soil Mech. 2014, 35, 1831–1836. (In Chinese) [Google Scholar]
  15. Seed, H.B.; Idriss, I.M. Simplified procedure for evaluating soil liquefaction potential. J. Soil Mech. Found. Div. ASCE 1971, 97, 1249–1273. [Google Scholar] [CrossRef]
  16. Rui, S.; Guo, Z.; Si, T.; Li, Y. Effect of particle shape on the liquefaction resistance of calcareous sands. Soil Dyn. Earthq. Eng. 2020, 137, 106302. [Google Scholar] [CrossRef]
  17. Xiao, P.; Liu, H.; Stuedlein, A.W.; Evans, T.M.; Xiao, Y. Effect of relative density and biocementation on cyclic response of calcareous sand. Can. Geotech. J. 2019, 56, 1849–1862. [Google Scholar] [CrossRef]
  18. Green, R.A.; Olson, S.M.; Cox, B.R.; Rix, G.J.; Rathje, E.; Bachhuber, J.; Martin, N. Geotechnical aspects of failures at Port-au-Prince seaport during the 12 January 2010 Haiti earthquake. Earthq. Spectra 2011, 27 (Suppl. S1), 43–65. [Google Scholar] [CrossRef]
  19. Shahnazari, H.; Jafarian, Y.; Tutunchian, M.A.; Rezvani, R. Undrained cyclic and monotonic behavior of Hormuz calcareous sand using hollow cylinder simple shear tests. Int. J. Civ. Eng. 2016, 14, 209–219. [Google Scholar] [CrossRef]
  20. Zhou, X.Z.; Chen, Y.M.; Liu, H.L.; Zhang, X.L. Experimental study on the cyclic behavior of loose calcareous sand under linear stress paths. Mar. Georesour. Geotechnol. 2020, 38, 277–290. [Google Scholar] [CrossRef]
  21. Yuan, X.M.; Zang, W.B.; Duan, Z.G.; Sun, R.; Wang, Y.L.; Zhang, W. Analysis for characteristics of seismic liquefaction in engineering sites of coralline soils. Chin. J. Rock Mech. Eng. 2019, 38 (Suppl. S2), 3799–3811. (In Chinese) [Google Scholar]
  22. Taylor, R.E. (Ed.) Geotechnical Centrifuge Technology; CRC Press: Boca Raton, FL, USA, 1994. [Google Scholar]
  23. Özcebe, A.G.; Giretti, D.; Bozzoni, F.; Fioravante, V.; Lai, C.G. Centrifuge and numerical modelling of earthquake-induced soil liquefaction under free-field conditions and by considering soil–structure interaction. Bull. Earthq. Eng. 2021, 19, 47–75. [Google Scholar] [CrossRef]
  24. Arulanandan, K.; Scott, R.F. Project VELACS—Control test results. J. Geotech. Eng. 1993, 119, 1276–1292. [Google Scholar] [CrossRef]
  25. Taboada-Urtuzuástegui, V.M.; Dobry, R. Centrifuge modeling of earthquake-induced lateral spreading in sand. J. Geotech. Geoenviron. Eng. 1998, 124, 1195–1206. [Google Scholar] [CrossRef]
  26. Popescu, R.; Prevost, J.H. Comparison between VELACS numerical ‘class A’ predictions and centrifuge experimental soil test results. Soil Dyn. Earthq. Eng. 1995, 14, 79–92. [Google Scholar] [CrossRef]
  27. Elgamal, A.; Zeghal, M.; Taboada, V.; Dobry, R. Analysis of site liquefaction and lateral spreading using centrifuge testing records. Soils Found. 1996, 36, 111–121. [Google Scholar] [CrossRef]
  28. Manzari, M.T.; Ghoraiby, M.E.; Zeghal, M.; Kutter, B.L.; Arduino, P.; Barrero, A.R.; Bilotta, E.; Chen, L.; Chen, R.; Chiaradonna, A.; et al. LEAP-2017: Comparison of the Type-B numerical simulations with centrifuge test results. In Model Tests and Numerical Simulations of Liquefaction and Lateral Spreading; Kutter, B., Manzari, M., Zeghal, M., Eds.; Springer: Cham, Switzerland, 2020. [Google Scholar]
  29. Kutter, B.L.; Carey, T.J.; Stone, N.; Bonab, M.H.; Manzari, M.T.; Zeghal, M.; Escoffier, S.; Haigh, S.K.; Madabhushi, G.S.P.; Hung, W.-Y.; et al. LEAP-UCD 2017 version 1.01 model specifications. In Model Tests and Numerical Simulations of Liquefaction and Lateral Spreading: LEAP-UCD-2017; Kutter, B., Manzari, M., Zeghal, M., Eds.; Springer: New York, NY, USA, 2019. [Google Scholar]
  30. Qiu, Z.; Elgamal, A. Numerical simulations of LEAP dynamic centrifuge model tests for response of liquefiable sloping ground. In Model Tests and Numerical Simulations of Liquefaction and Lateral Spreading; Springer: Cham, Switzerland, 2020; pp. 521–544. [Google Scholar]
  31. Lai, C.G.; Bozzoni, F.; Meisina, C.; Poggi, V.; Zuccolo, E.; Bonì, R.; Conca, D.; Famà, A.; Cosentini, R. Mapping the liquefaction hazard at different geographical scales. In Earthquake Geotechnical Engineering for Protection and Development of Environment and Constructions; CRC Press: Boca Raton, FL, USA, 2019; pp. 691–704. [Google Scholar]
  32. Meisina, C.; Bonì, R.; Bordoni, M.; Lai, C.G.; Famà, A.; Bozzoni, F.; Cosentini, R.M.; Castaldini, D.; Fontana, D.; Lugli, S.; et al. 3D Geological model reconstruction for liquefaction hazard assessment in the Po Plain. In Earthquake Geotechnical Engineering for Protection and Development of Environment and Constructions; CRC Press: Boca Raton, FL, USA, 2019; pp. 3837–3844. [Google Scholar]
  33. Li, P.; Dashti, S.; Badanagki, M.; Kirkwood, P. Evaluating 2D numerical simulations of granular columns in level and gently sloping liquefiable sites using centrifuge experiments. Soil Dyn. Earthq. Eng. 2018, 110, 232–243. [Google Scholar] [CrossRef]
  34. Tang, L.; Zhang, X.; Ling, X. Numerical simulation of centrifuge experiments on liquefaction mitigation of silty soils using stone columns. KSCE J. Civ. Eng. 2016, 20, 631–638. [Google Scholar] [CrossRef]
  35. Iai, S.; Tobita, T.; Nakahara, T. Generalised scaling relations for dynamic centrifuge tests. Geotechnique 2005, 55, 355–362. [Google Scholar] [CrossRef]
  36. Iai, S.; Sugano, T. Soil-structure interaction studies through shaking table tests. In Earthquake Geotechnical Engineering; A.A. Balkema, Brookfield: Rotterdam, The Netherlands, 1999; pp. 927–940. [Google Scholar]
  37. Tobita, T.; Iai, S.; Tann, L.; Yaoi, Y. Application of the generalised scaling law to saturated ground. Int. J. Phys. Model. Geotech. 2011, 11, 138–155. [Google Scholar] [CrossRef]
  38. Zhou, Y.G.; Ma, Q.; Liu, K.; Chen, Y.M. Centrifuge model tests at Zhejiang University for LEAP-Asia-2019 and validation of the generalized scaling law. Soil Dyn. Earthq. Eng. 2021, 144, 106660. [Google Scholar] [CrossRef]
  39. Wang, G.; Zhang, J.M. Advances in earthquake-induced liquefaction. Adv. Mech. 2007, 37, 575–589. (In Chinese) [Google Scholar]
  40. Yang, Z. Numerical Modeling of Earthquake Site Response Including Dilation and Liquefaction. Ph.D. Thesis, Columbia University, New York, NY, USA, 2000. [Google Scholar]
  41. Yang, Z.; Elgamal, A.; Parra, E. Computational model for cyclic mobility and associated shear deformation. J. Geotech. Geoenviron. Eng. 2003, 129, 1119–1127. [Google Scholar] [CrossRef]
  42. Elgamal, A.; Lu, J.; Forcellini, D. Mitigation of liquefaction-induced lateral deformation in a sloping stratum: Three-dimensional numerical simulation. J. Geotech. Geoenviron. Eng. 2009, 135, 1672–1682. [Google Scholar] [CrossRef]
  43. Asgari, A.; Oliaei, M.; Bagheri, M. Numerical simulation of improvement of a liquefiable soil layer using stone column and pile-pinning techniques. Soil Dyn. Earthq. Eng. 2013, 51, 77–96. [Google Scholar] [CrossRef]
  44. Rayamajhi, D.; Ashford, S.A.; Boulanger, R.W.; Ashford, S.A. Dense granular columns in liquefiable ground. I: Shear reinforcement and cyclic stress ratio reduction. J. Geotech. Geoenviron. Eng. 2016, 142, 04016023. [Google Scholar] [CrossRef]
  45. Rayamajhi, D.; Boulanger, R.W.; Ashford, S.A.; Elgamal, A. Dense granular columns in liquefiable ground. II: Effects on deformations. J. Geotech. Geoenviron. Eng. 2016, 142, 04016024. [Google Scholar] [CrossRef]
  46. Prevost, J.H. A simple plasticity theory for frictional cohesionless soils. Int. J. Soil Dyn. Earthq. Eng. 1985, 4, 9–17. [Google Scholar] [CrossRef]
  47. Gingery, J.R.; Elgamal, A.; Bray, J.D. Liquefaction model calibration: Element-level versus 1-D site response. In Proceedings of the 6th International Conference on Earthquake Geotechnical Engineering, Christchurch, New Zealand, 1–4 November 2015; pp. 1–4. [Google Scholar]
  48. Yang, Z.; Lu, J.; Elgamal, A. OpenSees Soil Models and Solid-Fluid Fully Coupled Elements: User’s Manual. Available online: http://www.soilquake.net/opensees/OSManual_UCSD_soil_models_2008.pdf (accessed on 1 July 2021).
Figure 1. Grain−size distribution curve of calcareous sand layer.
Applsci 12 08701 g001
Figure 2. Test facilities: (a) electro-hydraulic shaking table; (b) laminar shear model box.
Applsci 12 08701 g002
Figure 3. Concept of two-stage scaling.
Applsci 12 08701 g003
Figure 4. Schematic of instrumentations layout.
Applsci 12 08701 g004
Figure 5. Actual input ground motions into the shaking table: (a) E1; (b) E2; (c) E3.
Applsci 12 08701 g005aApplsci 12 08701 g005b
Figure 6. Maximum excess pore pressure along the depth: (a) medium dense model, M1; (b) dense model, M2.
Applsci 12 08701 g006
Figure 7. Maximum excess pore pressure ratio along the depth: (a) medium dense model, M1; (b) dense model, M2.
Applsci 12 08701 g007
Figure 8. Time histories of excess pore pressure ratio at different depths during different input motions: (a) E1−3; (b) E2−3; (c) E3−3.
Applsci 12 08701 g008aApplsci 12 08701 g008b
Figure 9. Diagram of FE model for level ground of saturated calcareous sand.
Applsci 12 08701 g009
Figure 10. Time histories of EXPPR at different observation points: (a) depth = 5 m; (b) depth = 10 m; (c) depth = 15 m.
Applsci 12 08701 g010aApplsci 12 08701 g010b
Table 1. Specifications of TLJ-150 centrifuge shaking table.
IndicatorsSpecifications
Maximum acceleration20 g
Maximum velocity38 cm/s
Maximum displacement±6 mm
Frequency range20~200 Hz
Bearing capacity300 kg
Maximum shaking duration 1 s
Shaking table dimensions1400 × 1000 mm
Input loadingSinusoidal or earthquake waves
Table 2. Scaling factors of centrifuge modeling.
QualityModelPrototype
Length1   μ η
Area1 ( μ η ) 2
Volume1 ( μ η ) 3
Density11
Strain1 μ 0.5
Stress1 μ
Stiffness1 μ 0.5
Acceleration1 1 / η
Velocity1 μ 0.75
Time 1 μ 0.75 η
Frequency1 μ 0.75 η 1
Permeability1 μ 0.75 η
Table 3. Physical properties of calcareous sand.
G s ρ m a x ρ m i n e m a x e m i n D 50
2.371.65 g/cm31.26 g/cm30.880.440.62 mm
Table 4. Excitation sequence of input ground motions.
No.Loading ConditionPeak Acceleration
1White noise0.01 g
2E1−10.1 g
3E2−10.1 g
4E3−10.1 g
5White noise0.01 g
6E1−20.2 g
7E2−20.2 g
8E3−20.2 g
9White noise0.01 g
10E1−30.3 g
11E2−30.3 g
12E3−30.3 g
13White noise0.01 g
Table 5. Parameters of PDMY02 material.
ParametersMedium Dense Sand
Dr = 50%
Density/(t · m −3)1.85
Void ratio0.7
Shear modulus/kPa1.21 × 105
Bulk modulus/kPa− *
Friction angle/( ° )37
PT angle/( ° )32
Peak shear strain0.1
Reference confining pressure/kPa101
Pressure dependent coefficient0.5
Contraction parameter0.006/5.5/0.2
Dilation parameter0.45/1.5/0.0
Liquefaction parameter1.0/0
* The bulk modulus is calculated according to the shear modulus and Poisson’s ratio, B r = 2 G r ( 1 + ϑ ) / ( 3 ( 1 2 ϑ ) ) . The Poisson’s ratio is set to be 0.499 and 0, respectively, for the stress field initialization and dynamic computation.
Publisher’s Note: MDPI stays neutral with regard to jurisdictional claims in published maps and institutional affiliations.

