Article

Layer Orientation Effect on Fracture Mode and Acoustic Emission Characteristics of Continental Shale

1
College of Civil Engineering, Liaoning University of Technology, Jinzhou 121001, China
2
School of Mechanics and Civil Engineering, China University of Mining and Technology (Beijing), Beijing 100083, China
3
Key Laboratory of Shale Gas and Geoengineering, Institute of Geology and Geophysics, Chinese Academy of Sciences, Beijing 100029, China
*
Author to whom correspondence should be addressed.
Appl. Sci. 2022, 12(17), 8683; https://doi.org/10.3390/app12178683
Submission received: 22 July 2022 / Revised: 28 August 2022 / Accepted: 28 August 2022 / Published: 30 August 2022

Abstract

:
Based on the Brazilian tests of continental shale with different layer orientations, combined with AE monitoring, the influence of layer orientation on the anisotropy of mechanical properties, fracture mode, and fracture mechanism of continental shale was analyzed. The results show that the tensile strength and deformation at the peak stress decrease with the increase of layer orientation at a constant deformation loading rate of 0.06mm/min, and the splitting modulus decreases first and then increases. The tensile strength was 90° > 60° > 45° > 30° > 0°, and the maximum and minimum tensile strengths were 5.154 MPa and 0.669 MPa, respectively. Under the action of splitting load, the samples with 30°, 45°, and 60° layer orientations mainly undergo shear failure along the layer orientation, while the samples with 0° and 90° layer orientations undergo tensile failure. In addition, the crack propagation in the 0° and 30° samples penetrated the bedding. These characteristics have important reference significance for the study of the mechanism of hydraulic fracture communication, propagation, and activation of structural planes.

1. Introduction

In recent years, a boom in shale oil exploitation has been set off across the world. For example, Bakken and Duvernay in Canada; Golfo San Jorge and the Austral Basins in Argentina; Cooper, Maryborough, Perth, Canning, Georgina, and Beetaloo in Australia; the Junggar, Tarim, and Songliao basins in China; and Akita Prefecture in Japan, are all shale oil-producing areas in production. Many countries and regions with abundant shale oil reserves are preparing for development. Most of these shale oil-producing areas are mainly marine or lacustrine shale. However, most of China’s production areas are dominated by continental shale. At present, the exploitation of shale oil mainly adopts hydraulic fracturing technology. During the sedimentation and diagenesis process of continental shale, the lamination planes are more developed than the marine shale. Under complex stress conditions, the lamination planes will be more prone to damage and lead to unexpected situations. Especially in formations with large dips, the anisotropy of continental shale will be more significant. More importantly, in the process of deep oil and gas drilling, layer orientation will directly affect the stability of the borehole wall and the safety of stimulation. Therefore, the Brazilian acoustic emission experiments of continental shales with different layer orientations are of indirectly representative significance, for understanding the propagation characteristics of hydraulic fractures during the hydraulic fracturing process, and also have important practical significance for the increase of shale oil storage and production [1].
So far, there are few reports on the anisotropy of continental shale, mostly focusing on marine shale. As a classical method to estimate the tensile strength, the Brazilian test with different layer orientations is broadly adopted to consider the textural anisotropy in petroleum rock mechanics. Through Brazilian tests and PFC numerical simulations, He et al. found that the layer orientation and interlaminar cohesion of marine shale have significant effects on the fracture strength and fracture mode; an increase in interlaminar cohesion reduces the number of microcracks and directly leads to a reduction in anisotropic behavior [2]. Wang et al. have preliminarily confirmed the consistency of the fracture morphology of marine shale with the spatial distribution of AE signals through the Brazilian tests and acoustic emission (AE) monitoring. At the same time, they have observed that the fracture modes and AE characteristics of marine shale were greatly affected by different stratified angles [3]. Hou et al. found, through the Brazilian tests, that the tensile strength, splitting modulus, and other mechanical parameters of marine shale have obvious anisotropy characteristics, and they further verified that the anisotropy of the failure mode of marine shale changes significantly with layer orientation [4]. Microcracks induced by stress have a significant effect on mechanical properties of continental shale, a typical brittle rock. The connection of microcracks leads to macroscopic fracture. Stress-induced microcracks usually include tensile cracks and shear cracks. In addition, the greater the number of tensile cracks is, the greater the number of shear cracks. Shear cracks are the main cause of rocks fracturing and crushing [5]. Wang et al. carried out the Brazilian tests on the organic-rich continental shale in the Sichuan Basin, China, where the lamination plane was perpendicular or parallel to the loading direction. They found the tensile strength of different depths showed a high degree of dispersion, and it shows a very strong anisotropy in the longitudinal section [6]. Huang et al. used the miniature tensile instrument–light microscope (MTI–LM) real-time loading–observation–acquisition test system to carry out uniaxial compression tests on continental shale. They found the meso-compressive strength, failure time, and fracture surface roughness are consistent with the change of the lamination angle. The homogeneous mineral composition and structure make the shale produce different sizes and numbers of rock bridges during the compression failure process, which may be the internal reason for the anisotropy of rock mesomechanics in shale [7]. Brittleness is a critical parameter for risk analysis of rock explosion and stability of the borehole-wall in the shale gas industry. It is also vital in the design of hydraulic fracturing and many other rock engineering applications [8]. Although preliminary explorations have been made on the anisotropy of continental shales, it is still unclear whether the anisotropy characteristics, fracture mode, and fracture mechanism of continental shales are consistent with those of marine shales, due to the great differences between marine and continental shales in structure and mechanical properties.
Based on the above analysis, this paper mainly studies the effect of layer orientation on the mechanical properties, fracture mode, and fracture mechanism of continental shale by carrying out the Brazilian splitting acoustic emission test. This will be helpful to indirectly characterize the propagation characteristics of hydraulic fractures during the hydraulic fracturing process.

2. Experimental Setup and Method

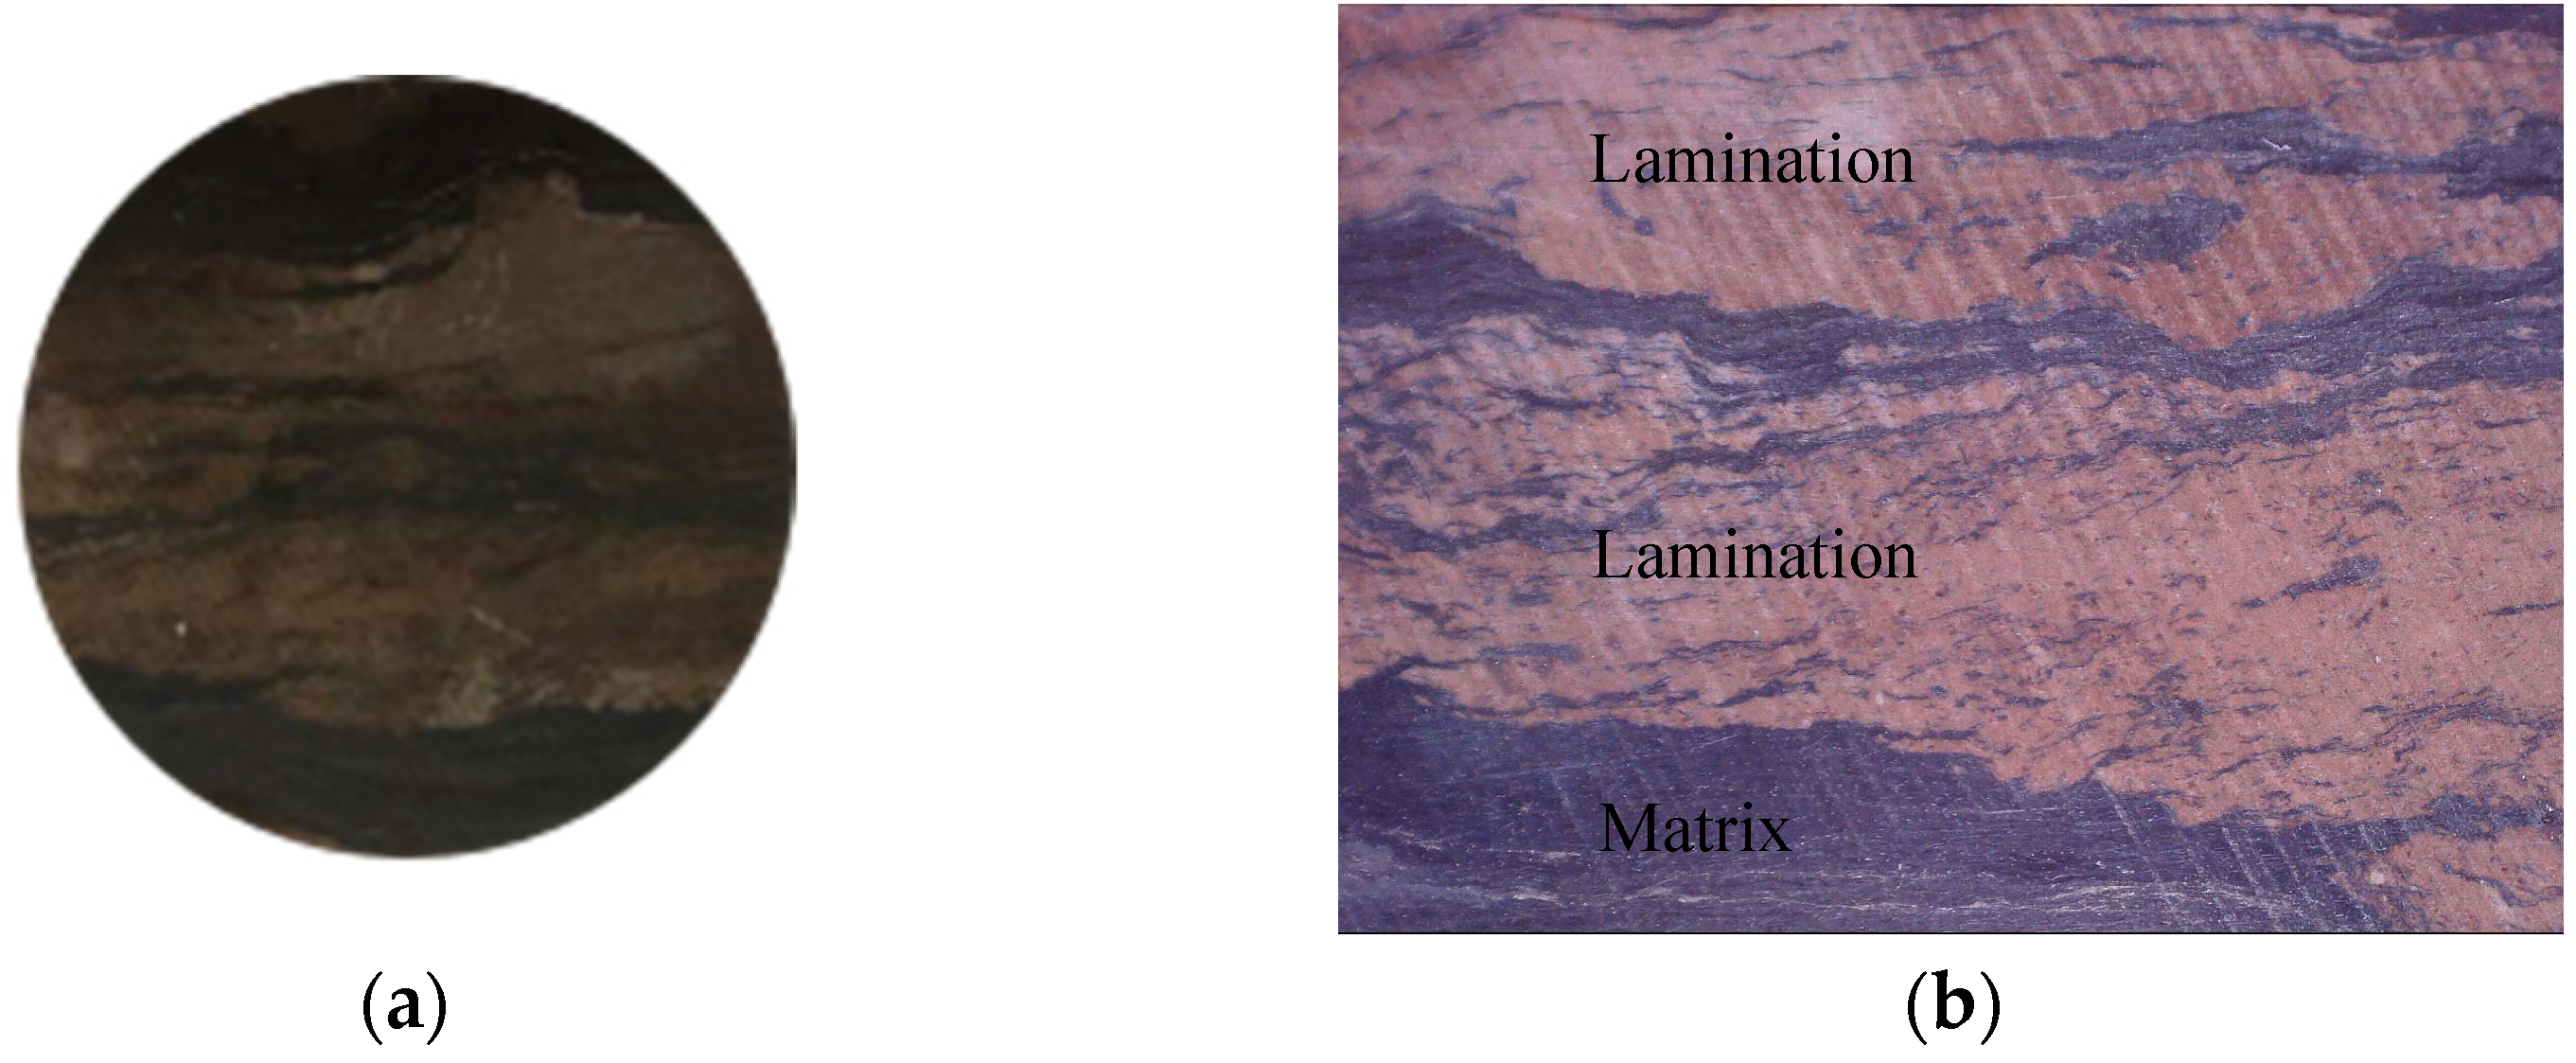
2.1. Sample Preparation

The continental shale samples used in this study were taken from the Jinke 4 Well of the Chang 7 section of the Yanchang Group of the Upper Triassic in the Ordos Basin, China. The main composition of the sample is black and gray-black oil shale and shale, mixed with irregular brown tuff and thin layers of tuff and sandstone, containing liquefied sandstone veins, pyrite, and asphalt. Making thin slices of rock and magnifying the lamination structure with a digital microscope, it is found that the sample has a weaker dense parallel lamination, and the distribution is more uniform. The laminations have a thickness of approximately 3 mm (Figure 1). The presence of relatively weak laminar plane can result in a remarkable anisotropic effect on the mechanical behavior and strength of the shale.
A core with a diameter of 50 mm was drilled along the lamination using a wire-cut method, and then the cylinder was cut every 25 mm into a disc of Φ50 mm × H25 mm. According to the standards of the International Society of Rock Mechanics, the parallelism of the upper and lower surfaces of the Brazilian disc sample is controlled to 0.5 mm, and the flatness of the surface is controlled to 0.1 mm.

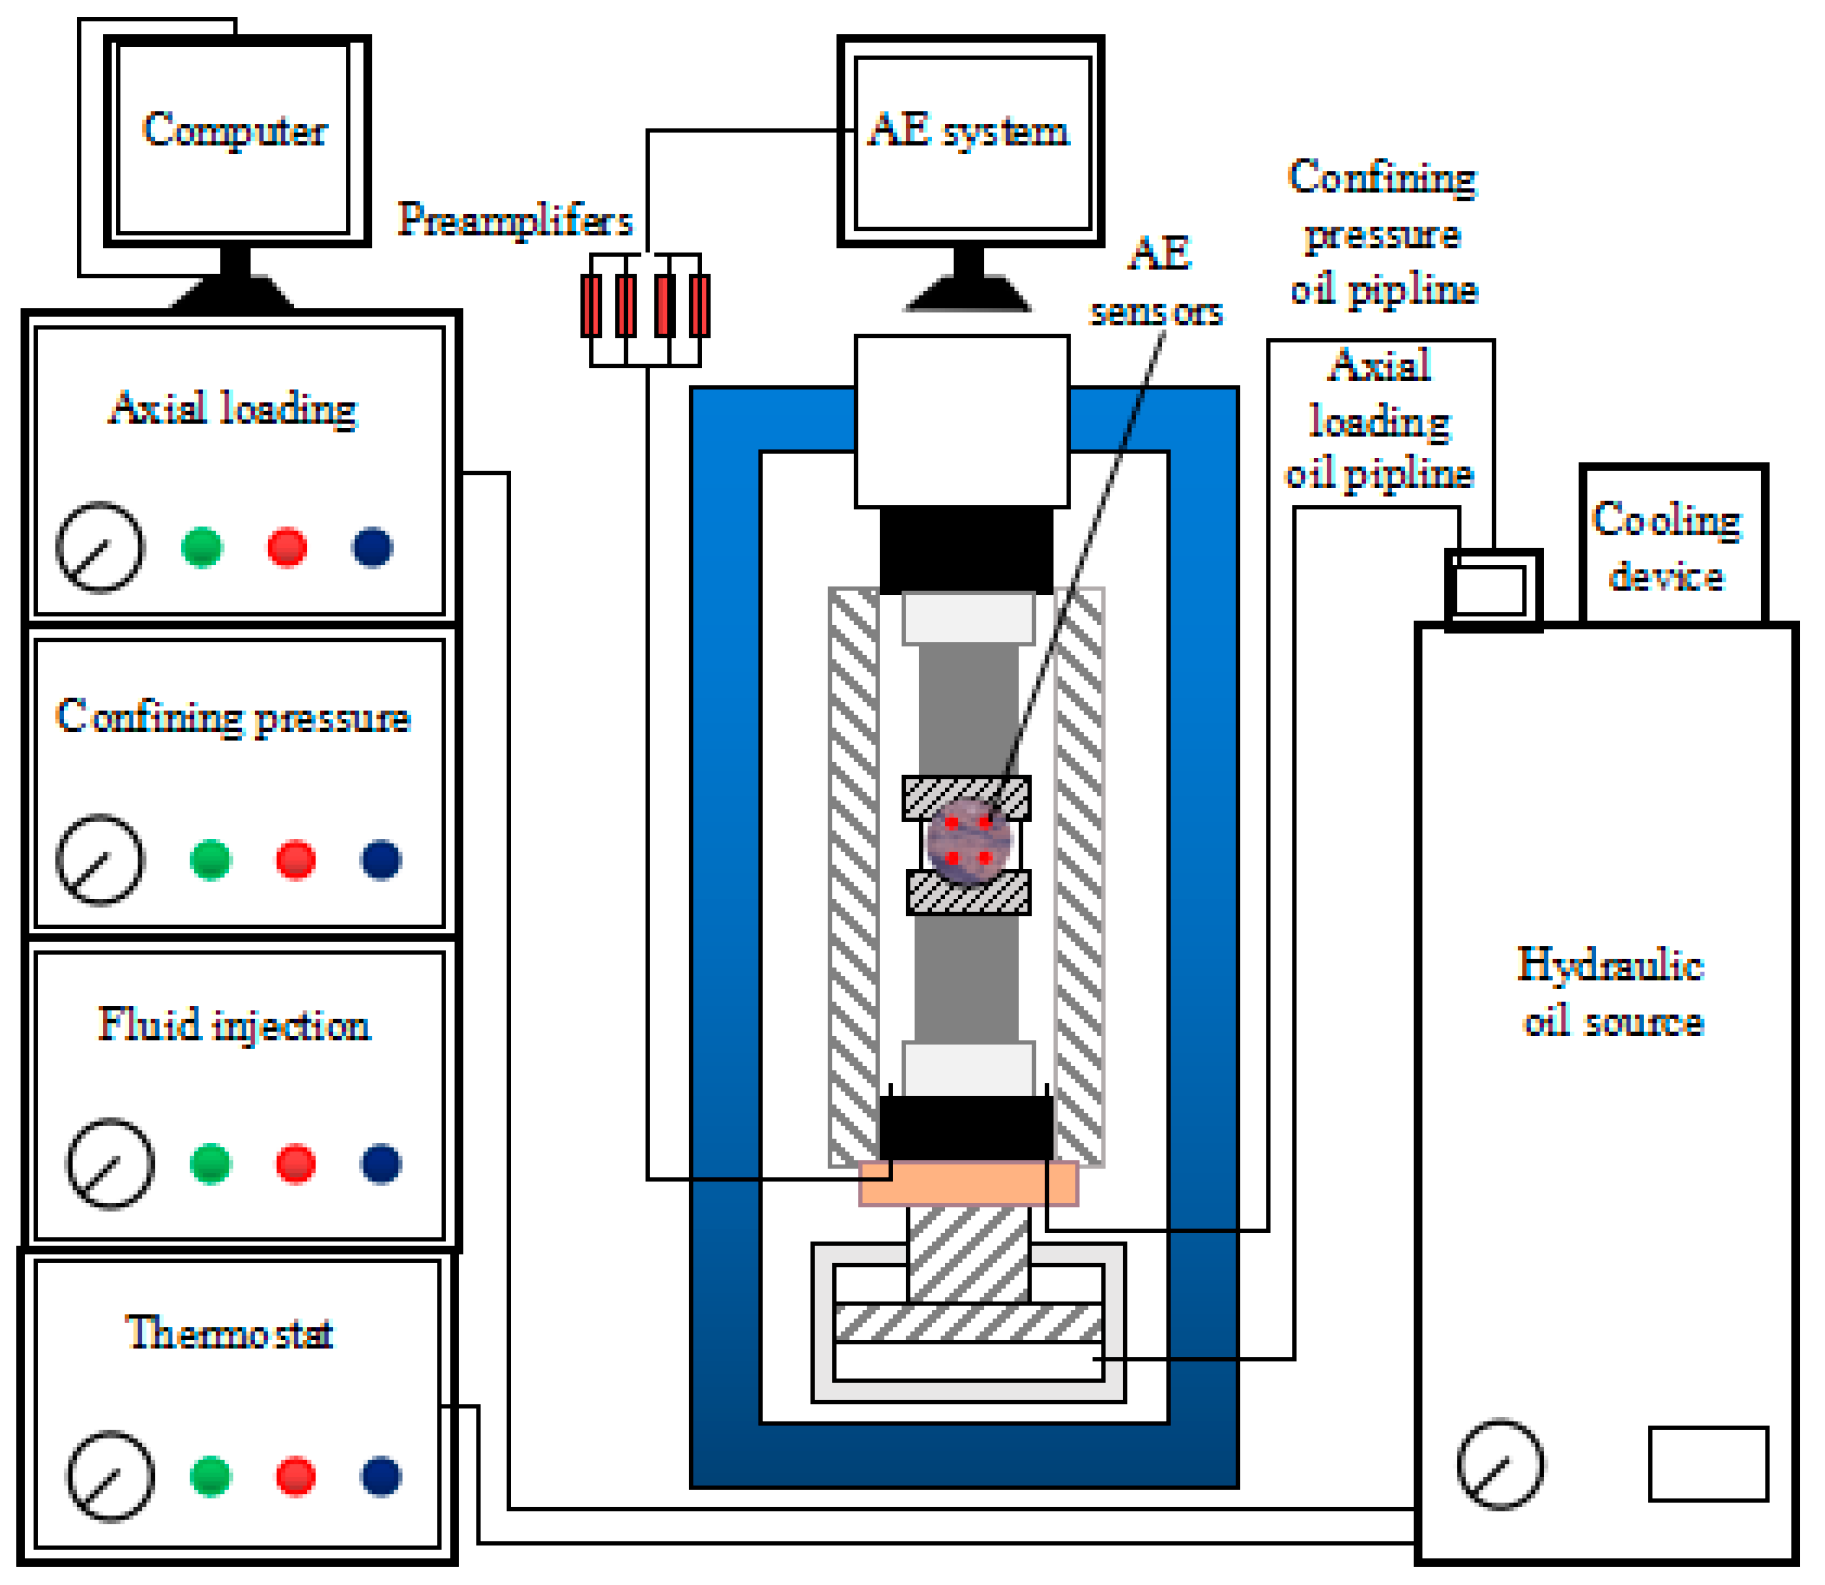
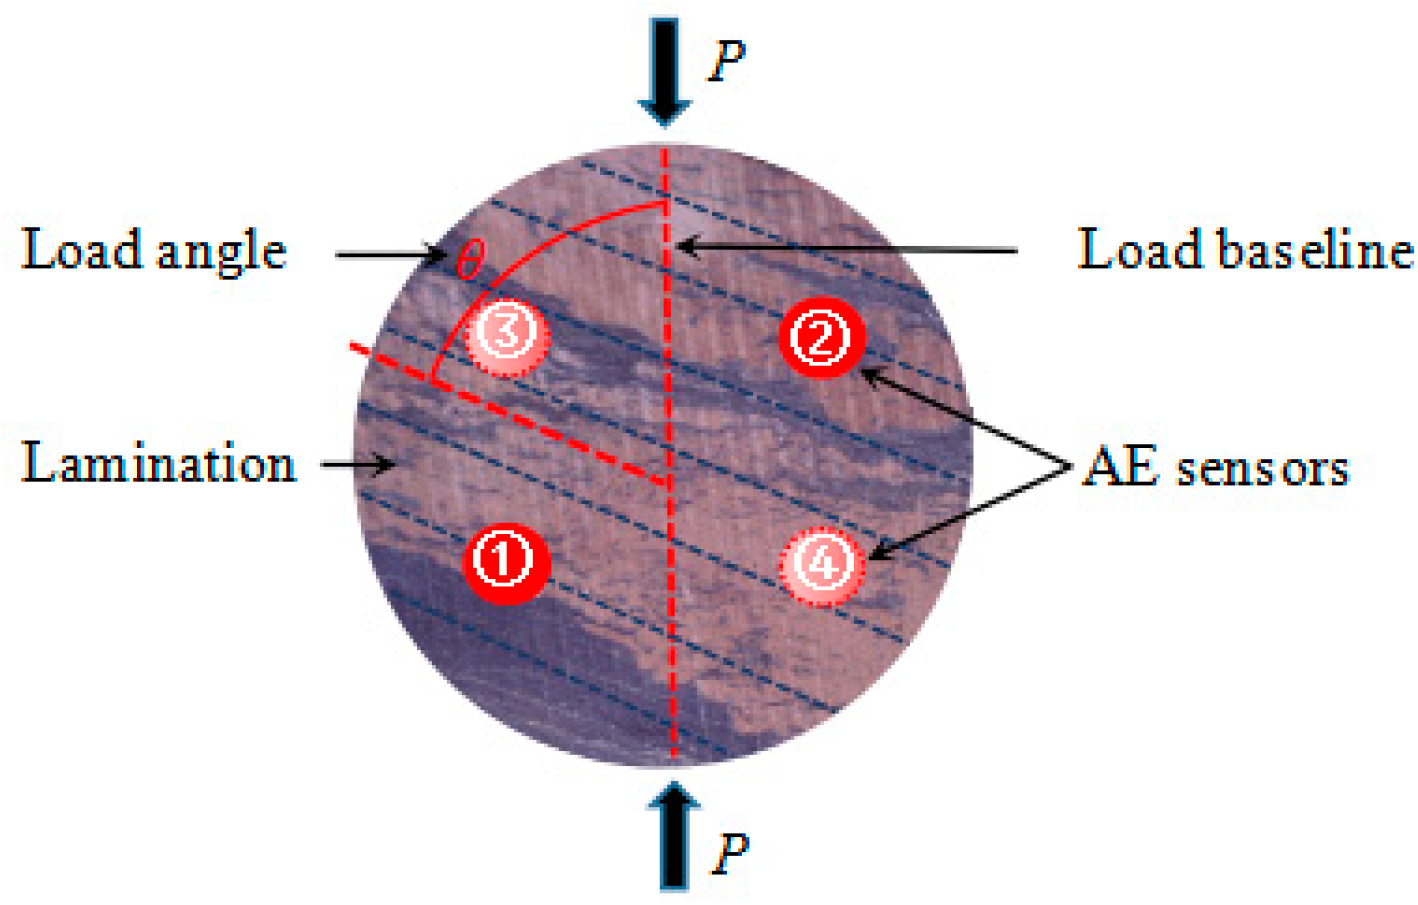
2.2. Setup and Method

Tests were carried out using TAW-2000 electro-hydraulic servo rock triaxial testing machine, from Key Laboratory of Shale Gas and Geological Engineering, Institute of Geology and Geophysics, Chinese Academy of Sciences, at ambient temperature (25 °C). Some equipment and operating principles involved in the test are shown in Figure 2. At the same time, the PAC AE system of the American Physical Acoustics Company is used for monitoring. The system adopts 18-bit A/D conversion technology and PCI card with low acquisition noise, which can realize the real-time acquisition of AE signals as well as real-time acquisition and storage of waveform signals.
Different loading angles (θ = 0°, 30°, 45°, 60°, 90°) were used to carry out acoustic emission tests on the samples under splitting load. When the layer orientation is parallel to the loading direction, it is defined as 0°. A pair of AE sensors are, respectively, arranged on the two faces of the disc, which are arranged diagonally. The loading method and the arrangement of AE sensors are shown in Figure 3.

3. Experimental Results

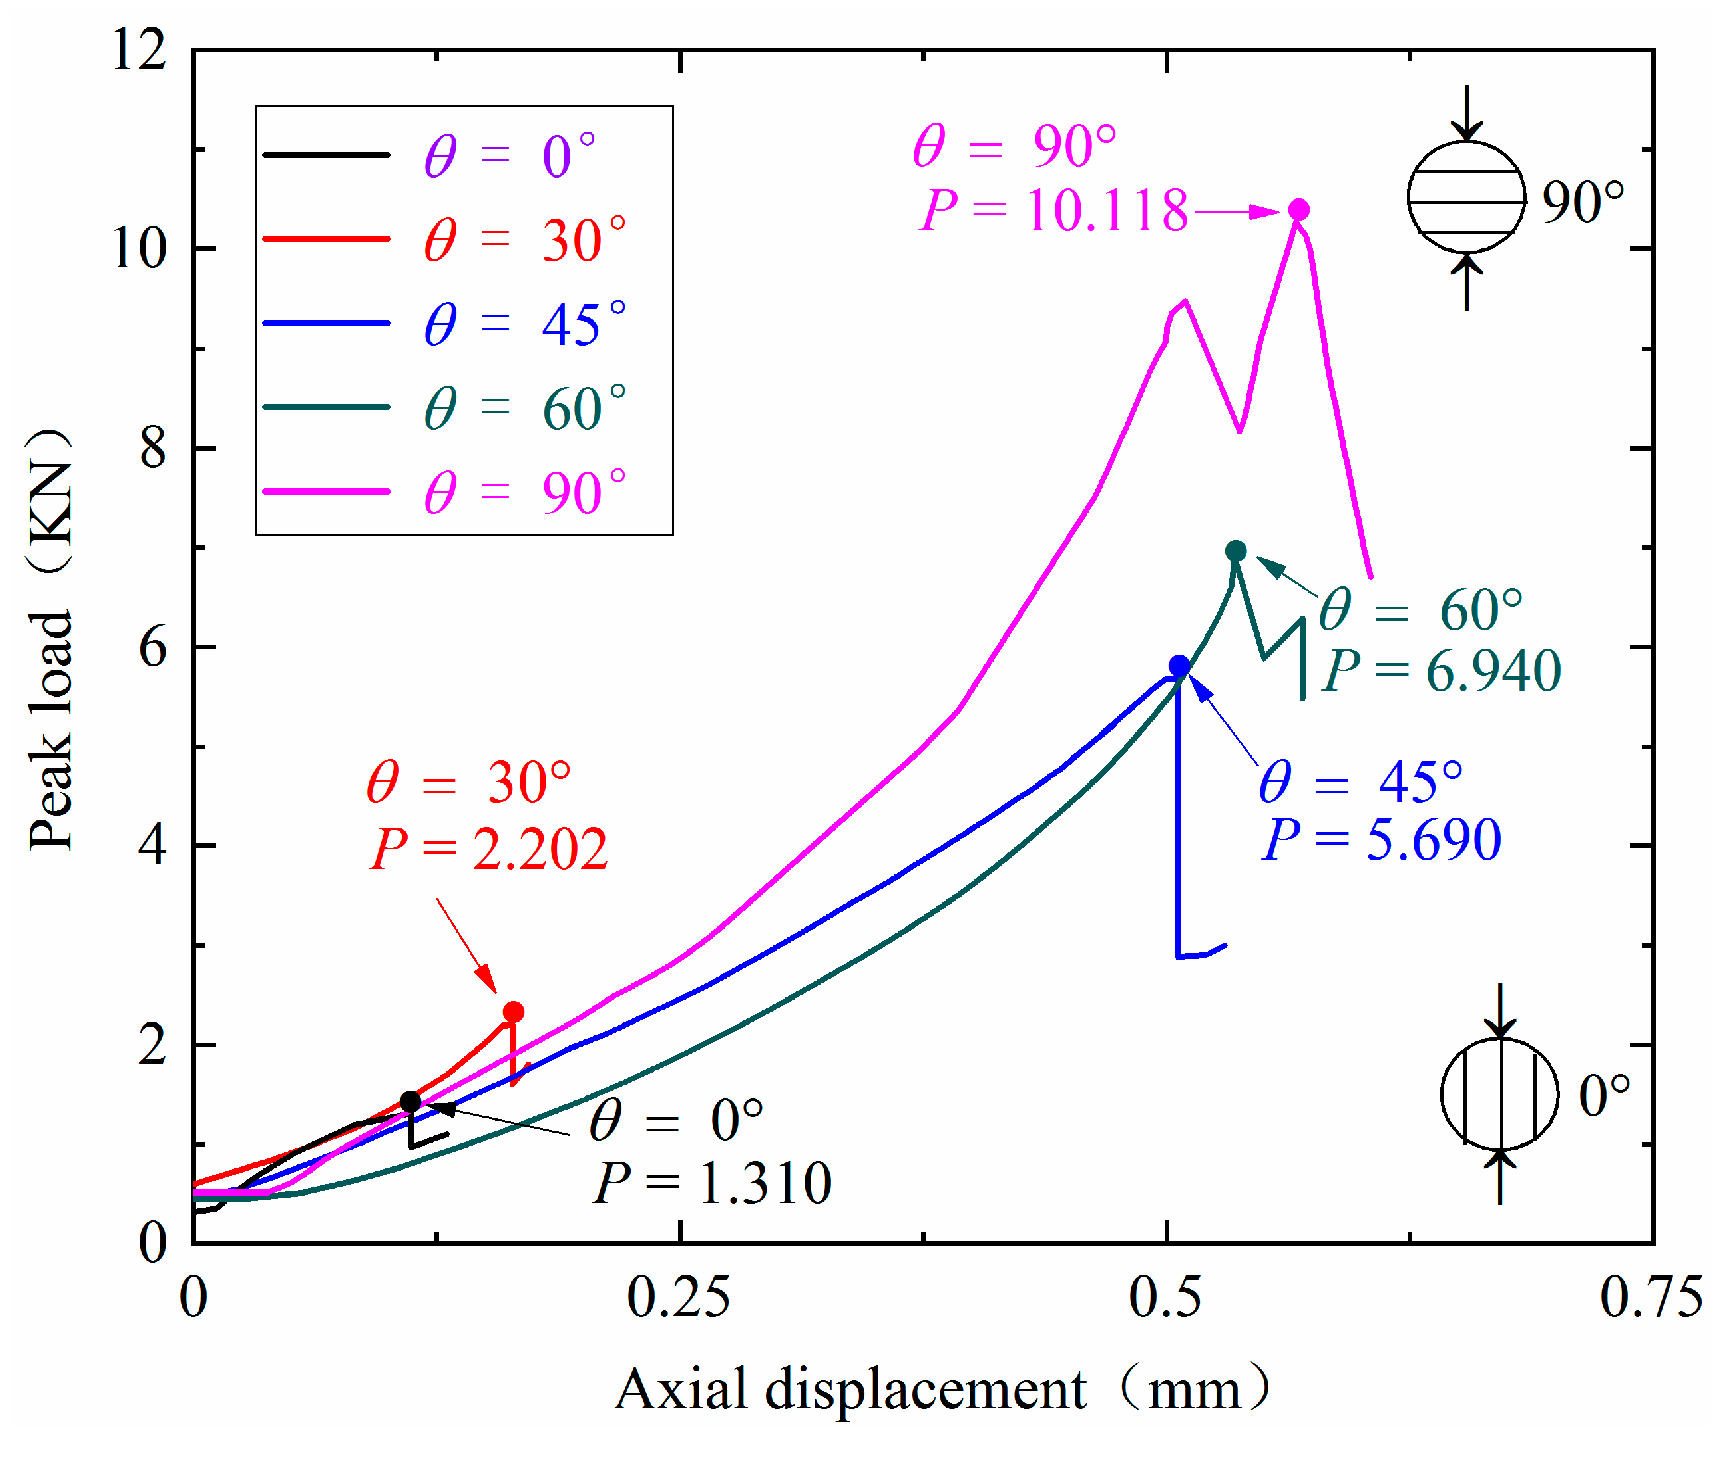
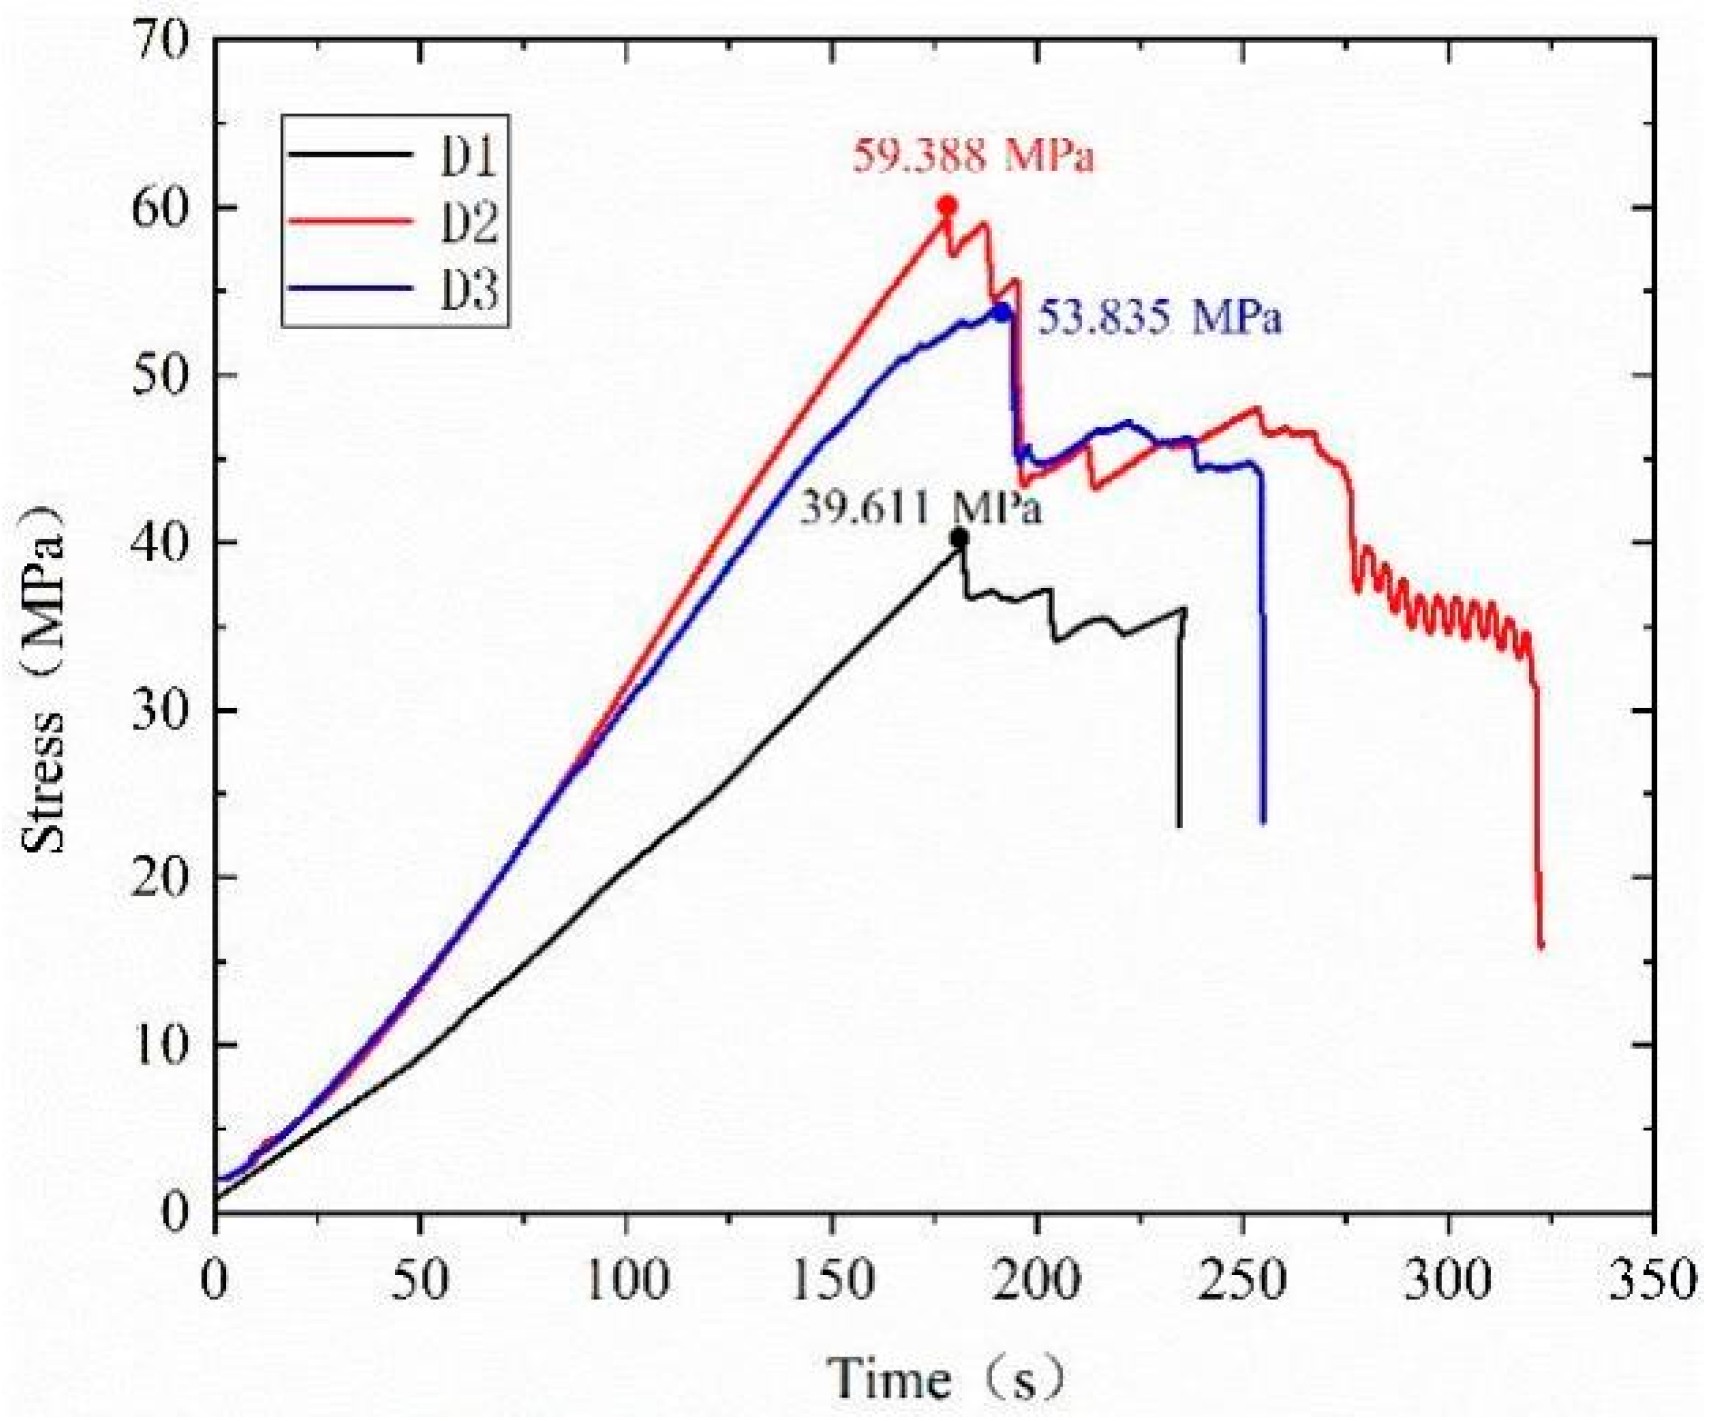
3.1. Mechanical Response Characteristics of Continental Shale with Different Layer Orientations

Since a single sample may not be sufficient to represent the failure behavior of shale under the corresponding loading angle, three samples were tested for each loading angle. The statistical results of the tests are shown in Table 1, and the displacements and loads evolution monitored are shown in Figure 4.
As shown in Table 1 and Figure 4, the layer orientation has a significant effect on the peak load strength of continental shale. The peak load strength of continental shale increases with the increase of layer orientation. The displacement-peak load curve shows that, unlike the uniaxial compression deformation characteristics (Figure 5), the mechanical action stages of the Brazilian test of continental shale with different layer orientations are approximately the same, and all have experienced three stages of compaction, elasticity, and failure. The lack of yield stage is due to the higher brittleness index of continental shale and more developed lamination.
In the initial stage of loading, the pores or micro-cracks inside the sample are compressed and deformed under the action of the load. Subsequently, under the continuously increasing loading, the deformation curve showed a concave upward trend and then is transformed into a nearly linear growth, which showed good elastic characteristics. When the loading has reached the peak, subsequently, it turns into a sharp drop in a straight, which is accompanied by the crisp sound of the sample fracturing and a little bit of debris splashing, thus, the sample is damaged. The test results and phenomena further verify that continental shale has high brittleness and poor ductility. Through the response characteristics of the characteristic point threshold value, for the load in each mechanical action stage under different layer orientations (Table 2), we found that the layer orientation has an important influence on the load response of the sample. Each characteristic threshold tends to increase with the increase of layer orientation. This is due to the lamination plane becoming closer to the horizontal distribution with the increase of layer orientation. In this case, the microcracks and pore spaces are not easy to be compacted, and the strength of the lamination is significantly lower than the strength of the matrix, which is a larger layer orientation (close to the horizontal), so it is not easy to be destroyed.

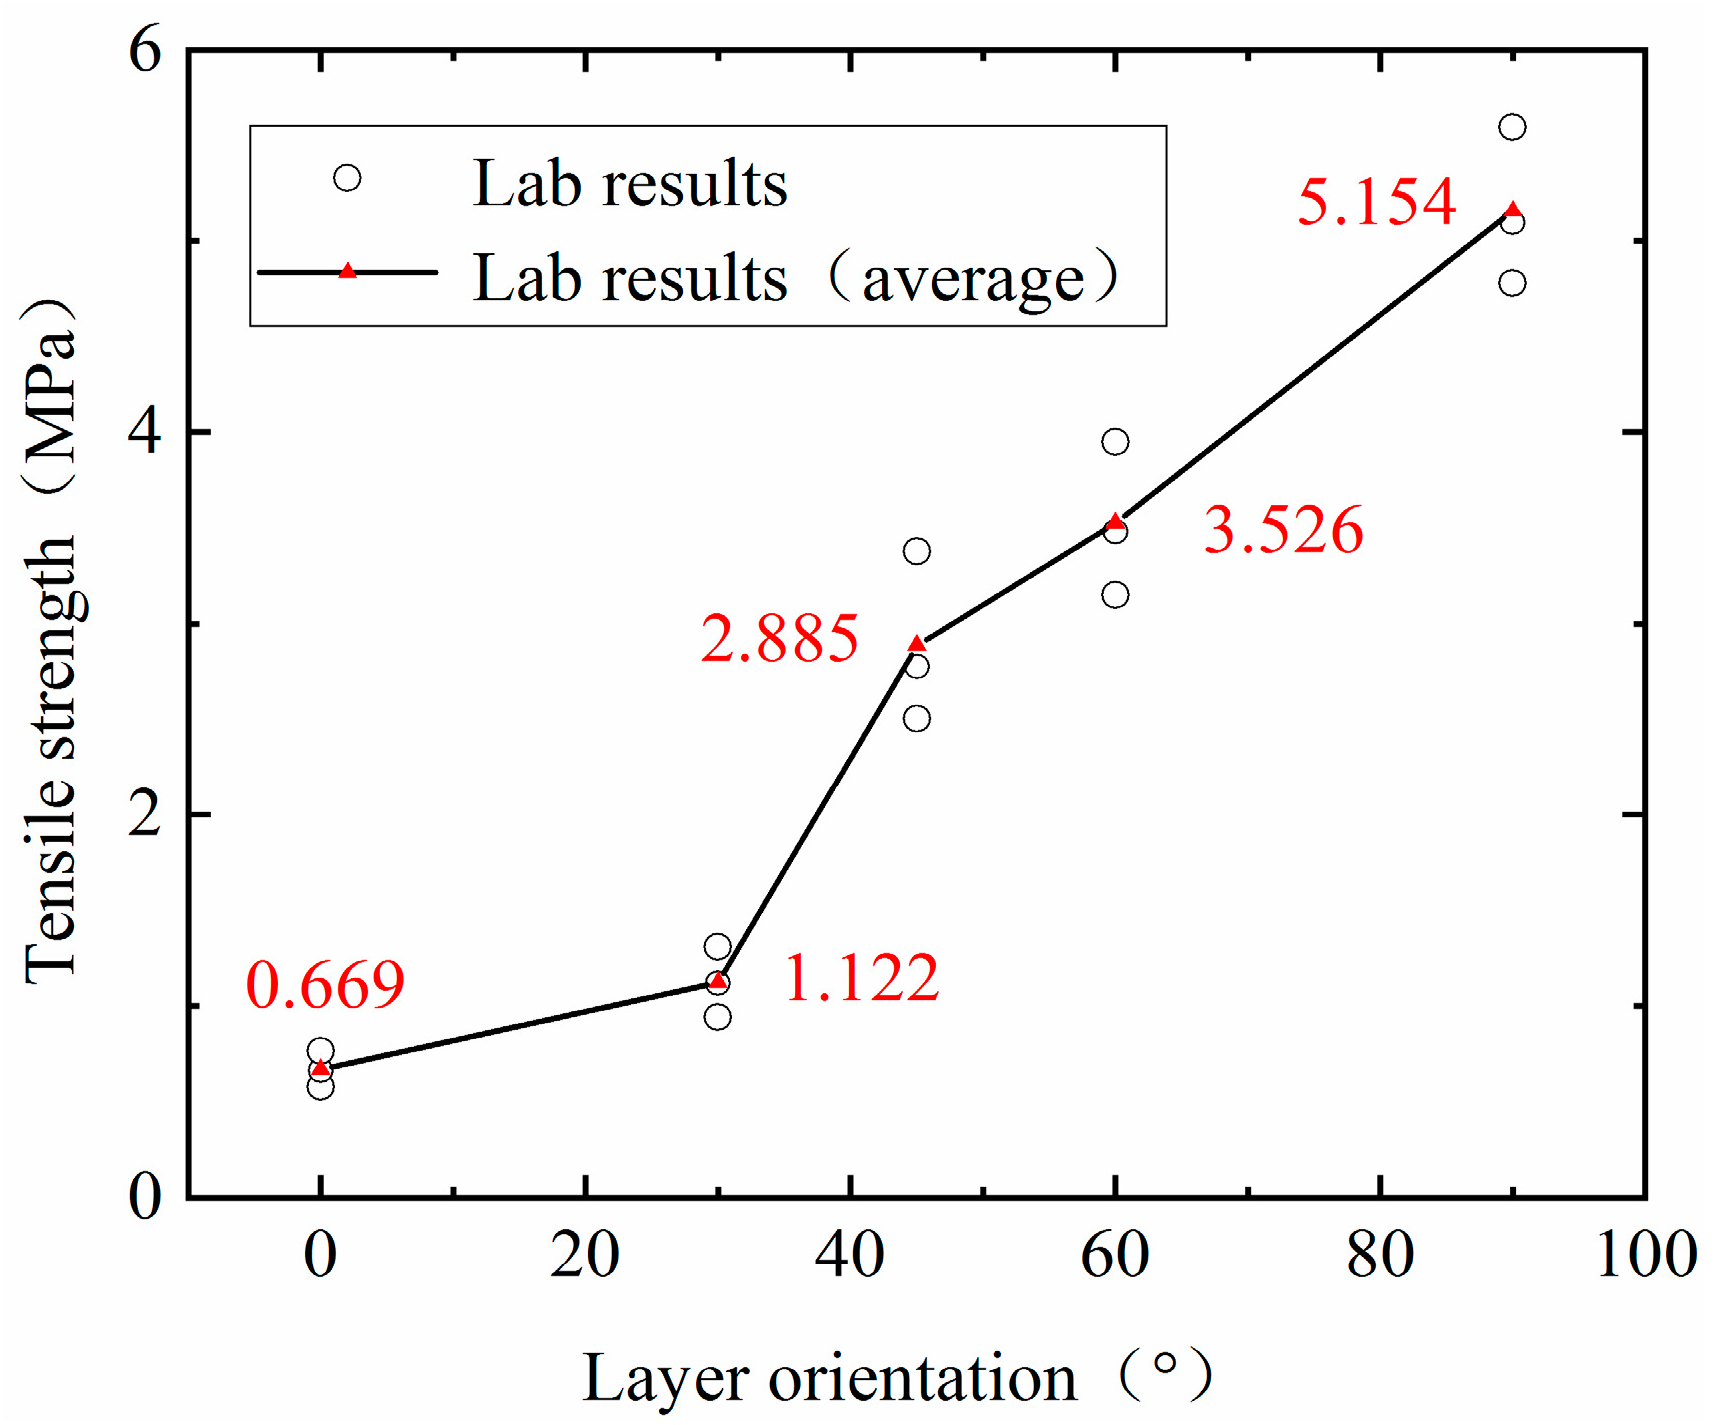
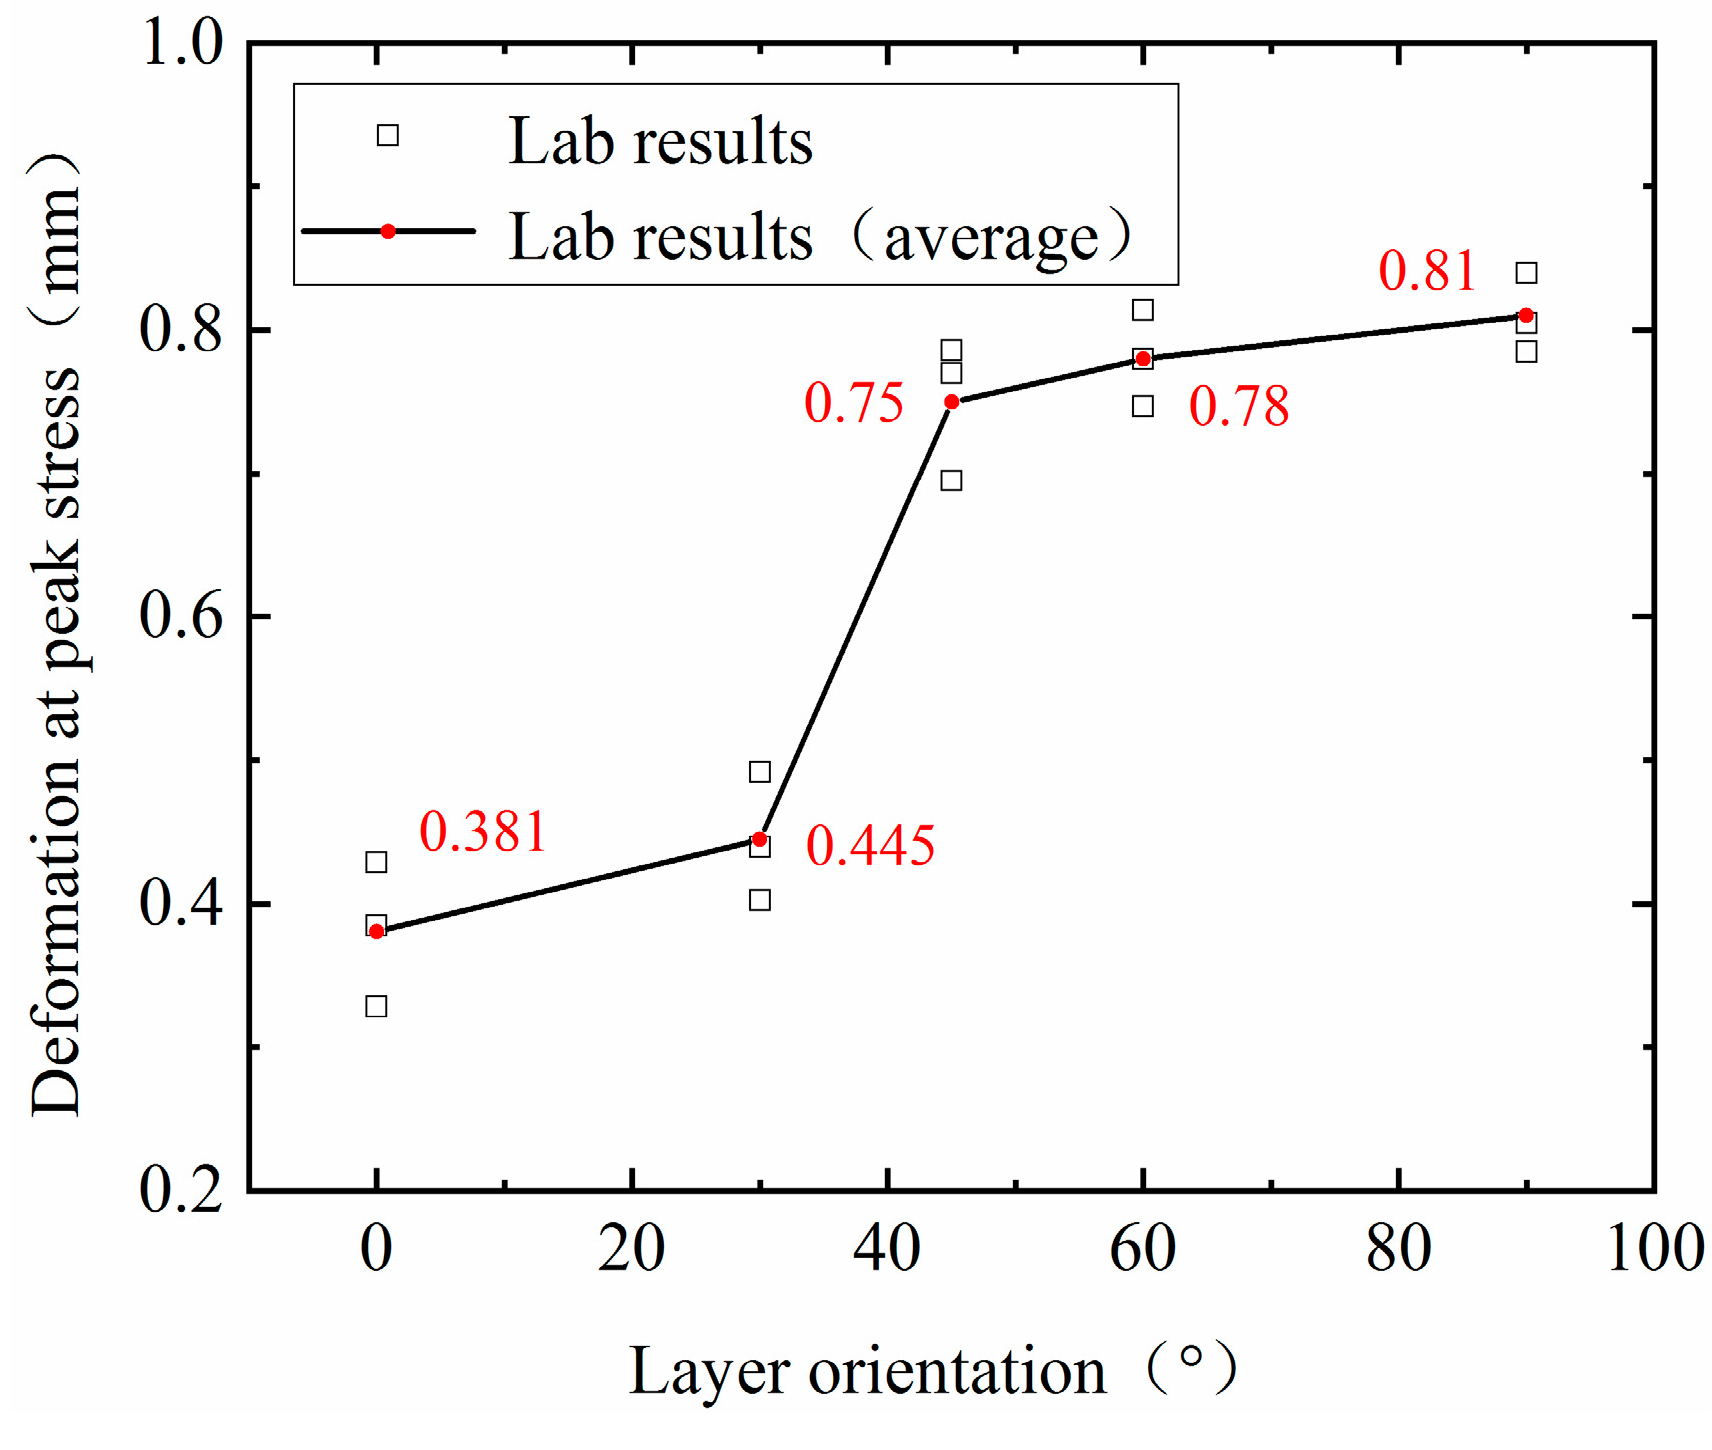
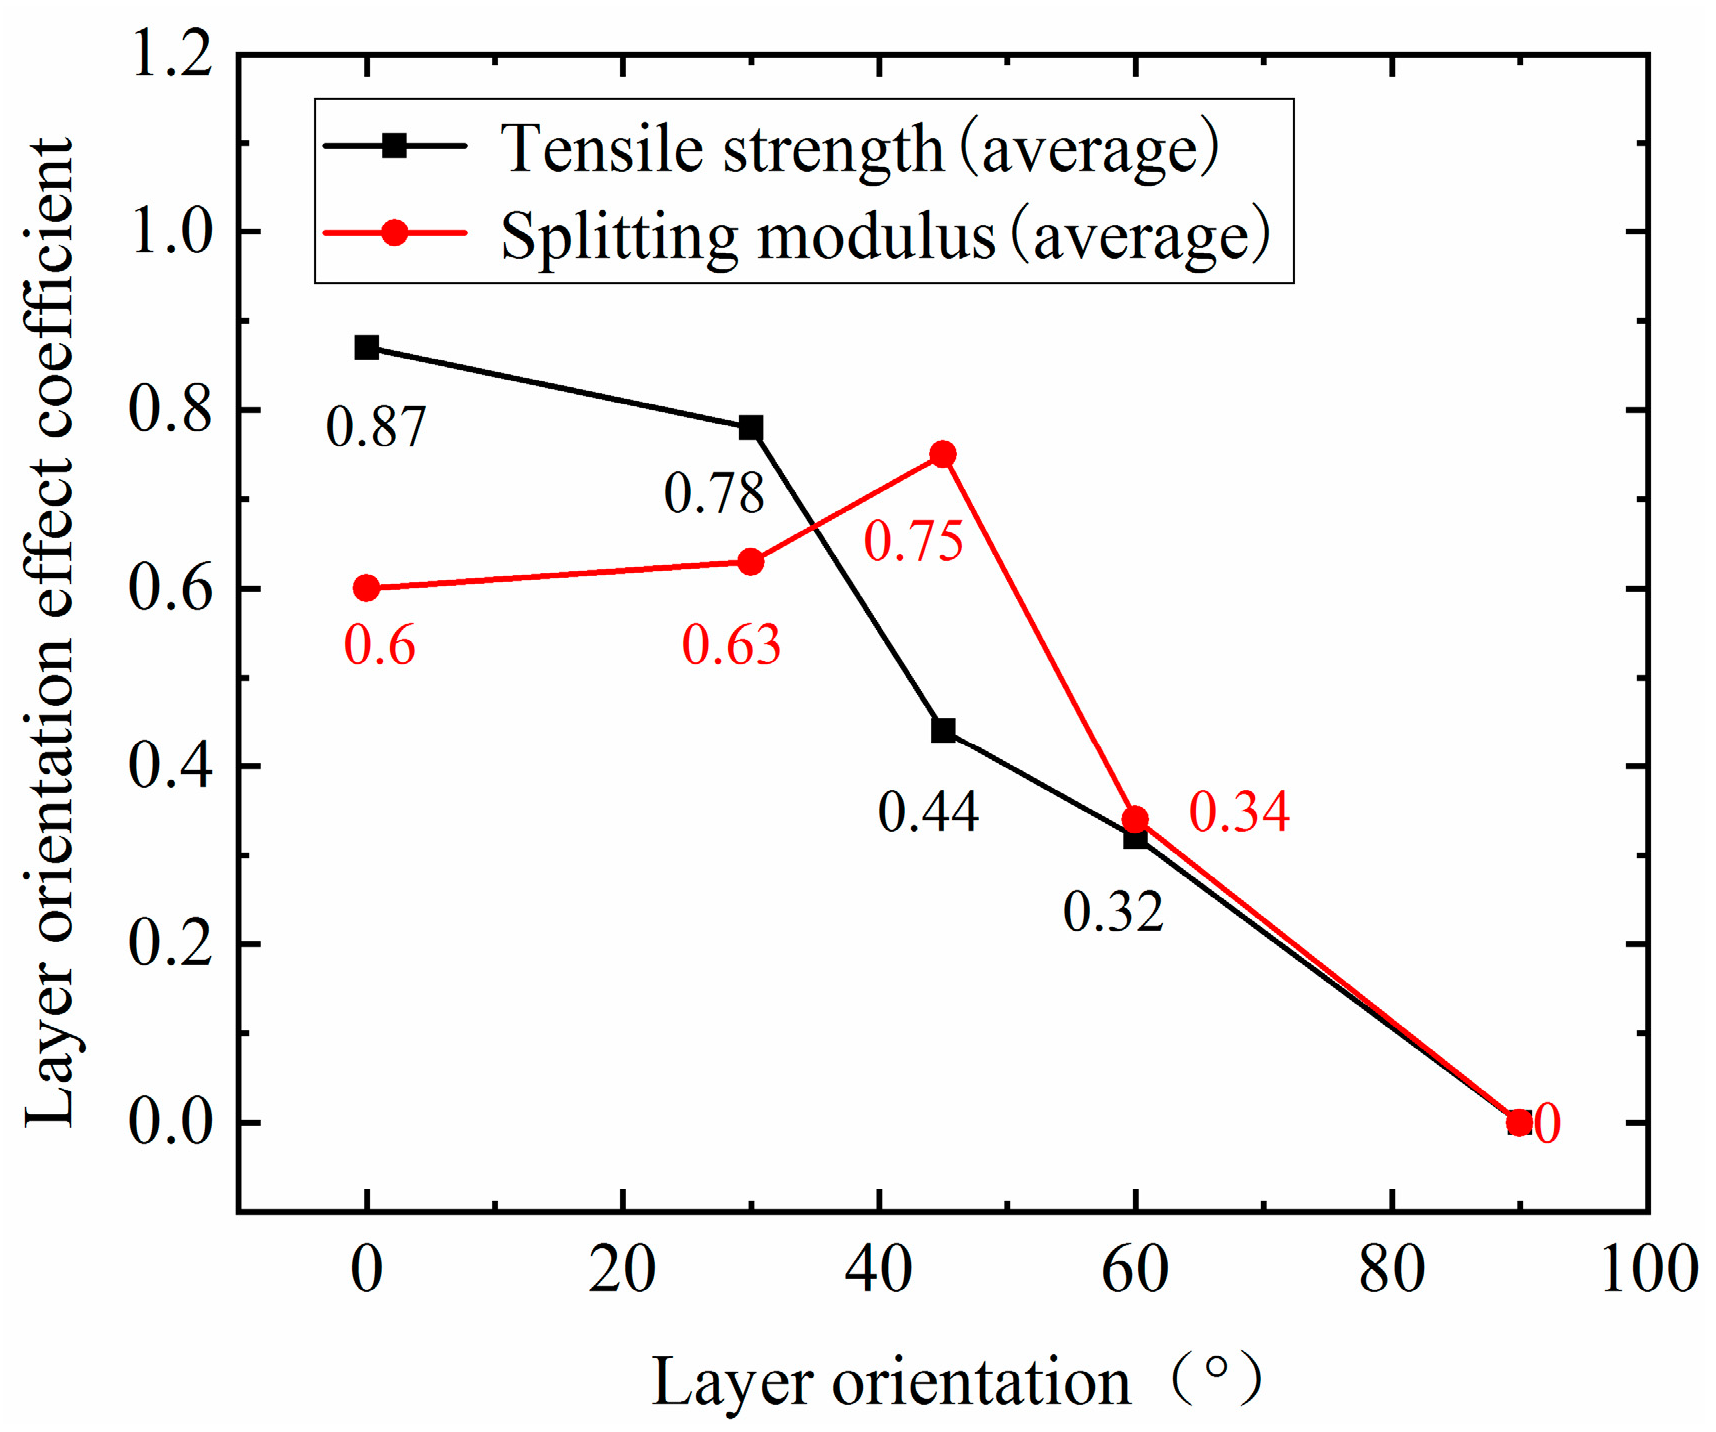
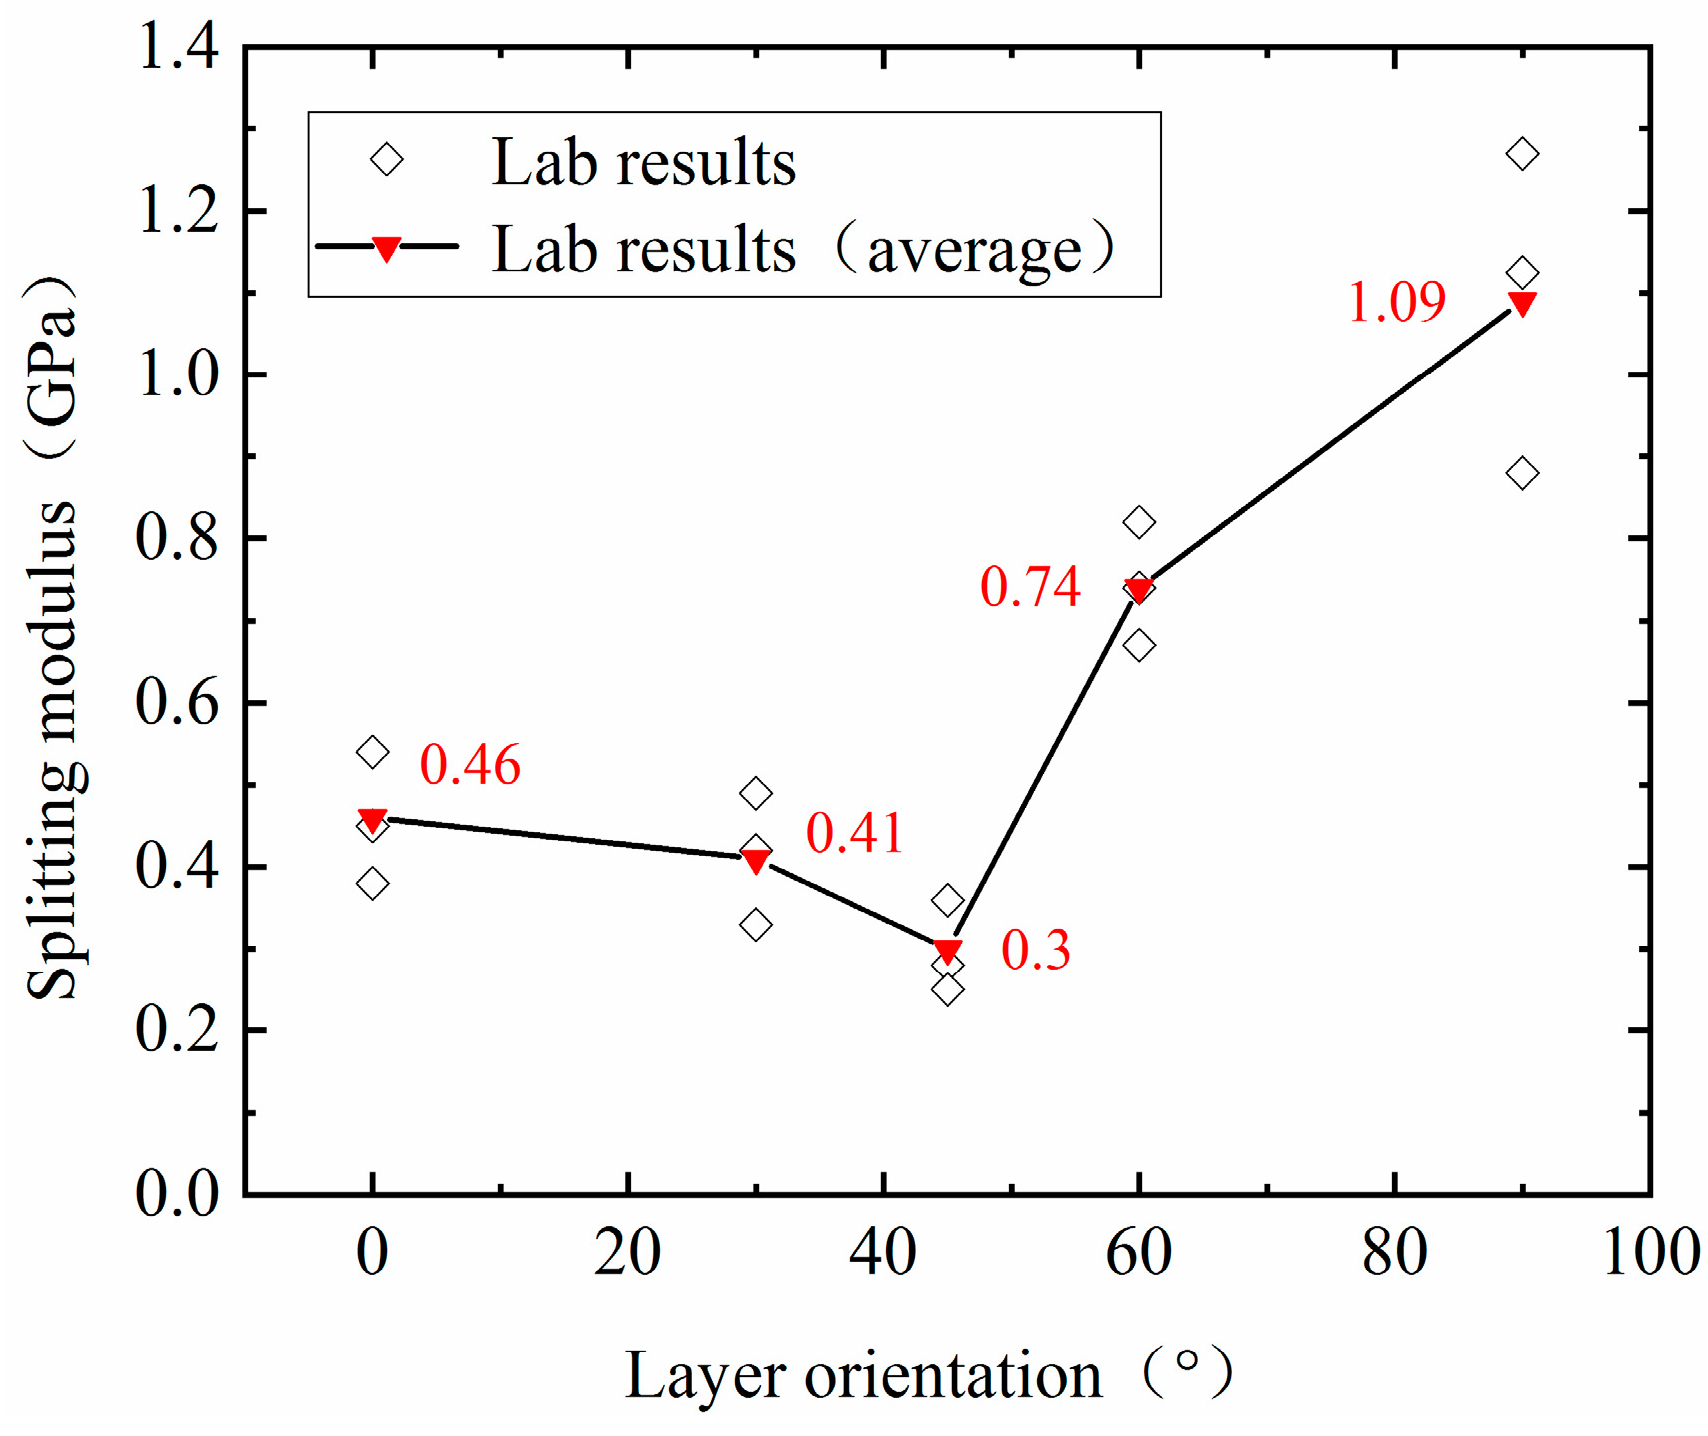
3.2. Influence of Layer Orientation Effect on Mechanical Parameters

The tensile strength, deformation, and splitting modulus are important parameters for the fracturing reformation of oil shale reservoirs. According to classical elastic mechanics, the tensile strength of the sample is calculated by Formula (1), and the calculation results are shown in Table 3.
σ t = 2 P π D t = 0.636 P / D t
where σt is the tensile strength (MPa), P is the failure load (N), and Dt is the diameter (mm) and thickness (mm) of the sample, respectively.
Table 3 and Figure 6 show the tensile strength values of continental shale with different layer orientations. The test results show that, on the one hand, the tensile strength of continental shale with the same layer orientation is discrete to a certain extent. The dispersion of tensile strength increases with the increase of layer orientation. Compared with the average tensile strength, the maximum deviation of the tensile strength of continental shale with different layer orientations is less than 17.1%. On the other hand, the tensile strength of continental shale with different layer orientations is significantly different. The tensile strength of continental shale increases with the increase of layer orientation. The tensile strength is the smallest when θ = 0° (that is, the layer orientation is parallel to the loading direction), and the maximum is when θ = 90°. When θ = 0°–30°, the tensile strength increases slowly, when θ = 30°–45°, the tensile strength increases the fastest, and when θ = 45°–90°, the tensile strength is close to a linear increase.
Figure 7 shows the deformation characteristics of the stress peak at different layer orientations. It can be seen that the deformation at the peak of the stress presents an overall increasing trend with the increase of layer orientation. Among them, the deformation growth rate is faster in the interval θ = 0°–45°, and the largest in the interval θ = 30°–45°. However, the deformation growth rate slows down in the interval θ = 45°–90° and is the smallest in the interval θ = 60°–90°. Obviously, as the layer orientation increases, the anisotropy between the lamination gradually increases, and the anisotropy exhibits the characteristics of first increasing and then slowing down.
To quantify the layer orientation effect, the layer orientation effect coefficient λ (θ), defined by Wang X.L., is used to characterize it, as shown in Formula (2) [9]. Table 3 and Figure 8 show the calculation results of the mean layer orientation effect coefficient of the mechanical parameters of continental shale with different layer orientations.
λ ( θ ) = 1 χ ( θ ) χ ( 90 ° )
where χ ( θ ) represents the mechanical parameters of continental shale under different layer orientations, and χ ( 90 ° ) represents the mechanical parameters when the layer orientation θ = 90°.
It can be seen from Figure 8 and Figure 9 that the layer orientation effect coefficient of tensile strength decreases with the increase of layer orientation. As an important parameter to measure the elastic deformation resistance of continental shale, the splitting modulus decreases first and then increases with the increase of layer orientation, with a varied range of 0.28–1.125 GPa. The mean splitting modulus at θ = 45° is the lowest (0.28 GPa), and the mean splitting modulus at θ = 90° is the highest (1.125 GPa), which is 4.02 times the mean splitting modulus at θ = 45°. In addition, the layer orientation effect coefficient of the mean splitting modulus increases first and then decreases with the increase of layer orientation, and the layer orientation effect is the most obvious at θ = 45°.

3.3. Influence of Layer Orientation Effect on Crack Growth and Fracture Mode

3.3.1. Morphological Characterization of Crack

Table 4 shows the fracture characteristics of continental shale at all different layer orientations under the Brazilian test.
It can be seen from Table 4 that the fracture modes of samples with the same layer orientation are not the same. When θ = 0°, the three groups of tests showed different crack propagation characteristics: starting from multiple points at both ends, penetrating, and deflecting the center of the disc. The main crack morphology is a straight or crescent shape, accompanied by a secondary crack. Interestingly, almost all crack propagation directions are distributed along the lamination direction. It is worth mentioning that the crescent-shaped cracks in the third set of tests indicate that deflection occurred during the propagation stage and not through the center of the disc, which may be due to the layer orientation not being the ideal vertical alignment. When θ = 30°, the three groups of tests showed deviating-center propagation characteristics of single-point or double-point cracking. The crack morphology is a crescent shape or nearly straight, and the crack propagation path was simple without a visible secondary crack. At the initial stage of loading, the sample cracks along the lamination direction first and then deviates from the center of the disc to the two sides, but the deflection angle is small. When θ = 45°, the crack morphology is slightly more complex than that of when θ = 30°. The crack starts from both ends and propagates along the lamination plane or deviates from the center of the disc at a certain angle with the lamination. Obvious secondary cracks can be observed near the main crack, and the secondary cracks propagate at a certain angle with the lamination plane. When θ = 60°, the three groups of tests all showed the characteristics of straight or crescent-shaped deviating-center propagation with multiple cracks. At the same time, secondary cracks were generated in each test and connected to the two adjacent main cracks, which indicated that the secondary cracks’ propagation is along the lamination plane direction. When θ = 90°, all samples show a single-crack morphology. The sample cracks from both ends, and the cracks were propagated in a folded or crescent shape, through-center, or slightly deviating-center. Due to the existence of primary microcracks in the lamination plane of the first and second samples, the microcracks were propagated along the microcrack direction (near the horizontal direction) during the crack propagation stage and then continue to be propagated along the vertical direction through the lamination plane until the whole disc was penetrated. The crack morphology is a crescent shape or a folded shape between the adjacent lamination plane, and there are occasional minor secondary cracks.

3.3.2. Influence of Layer Orientation Effect on Fracture Mode

To sum up, layer orientation has a significant effect on the fracture mode of continental shale. In this paper, Table 4 shows the typical fracture morphology of continental shale with different layer orientations under the Brazilian test conditions. The classification standards of Tavallali and Vervoort are used to classify the influence of layer orientation on the fracture mode of continental shale [10], as shown in Table 5.
It can be seen from Table 4 and Table 5 that the samples with different layer orientations show compound fracture modes, such as through-center or deviating-center, in different morphologies and positions. We noticed that when θ = 0°, θ = 45°, and θ = 60°, obvious secondary cracks were produced. Among them, when θ = 0° and θ = 45°, the secondary cracks only connect the adjacent main cracks, and the secondary cracks propagate along the lamination direction and deviate from the lamination direction, respectively. When θ = 60°, the secondary cracks can propagate along the lamination direction and connect the two adjacent main cracks. It is, particularly, noteworthy that when θ = 0° and θ = 90°, the cracks have only a single fracture mode, while the samples of the other three-layer orientations all have compound fracture modes. When θ = 30°, there are no obvious secondary cracks along the lamination direction.
The results of previous studies have shown that the degree of cementation of lamination is the main factor that influences the anisotropy of shale strength [11]. In addition, layer orientations and primary cracks have a significant influence on the crack morphology and fracture mode of continental shale. It is very important to analyze the mechanics mechanism of the fracture mode, by integrating the cohesive force and layer orientation.

4. Discussions

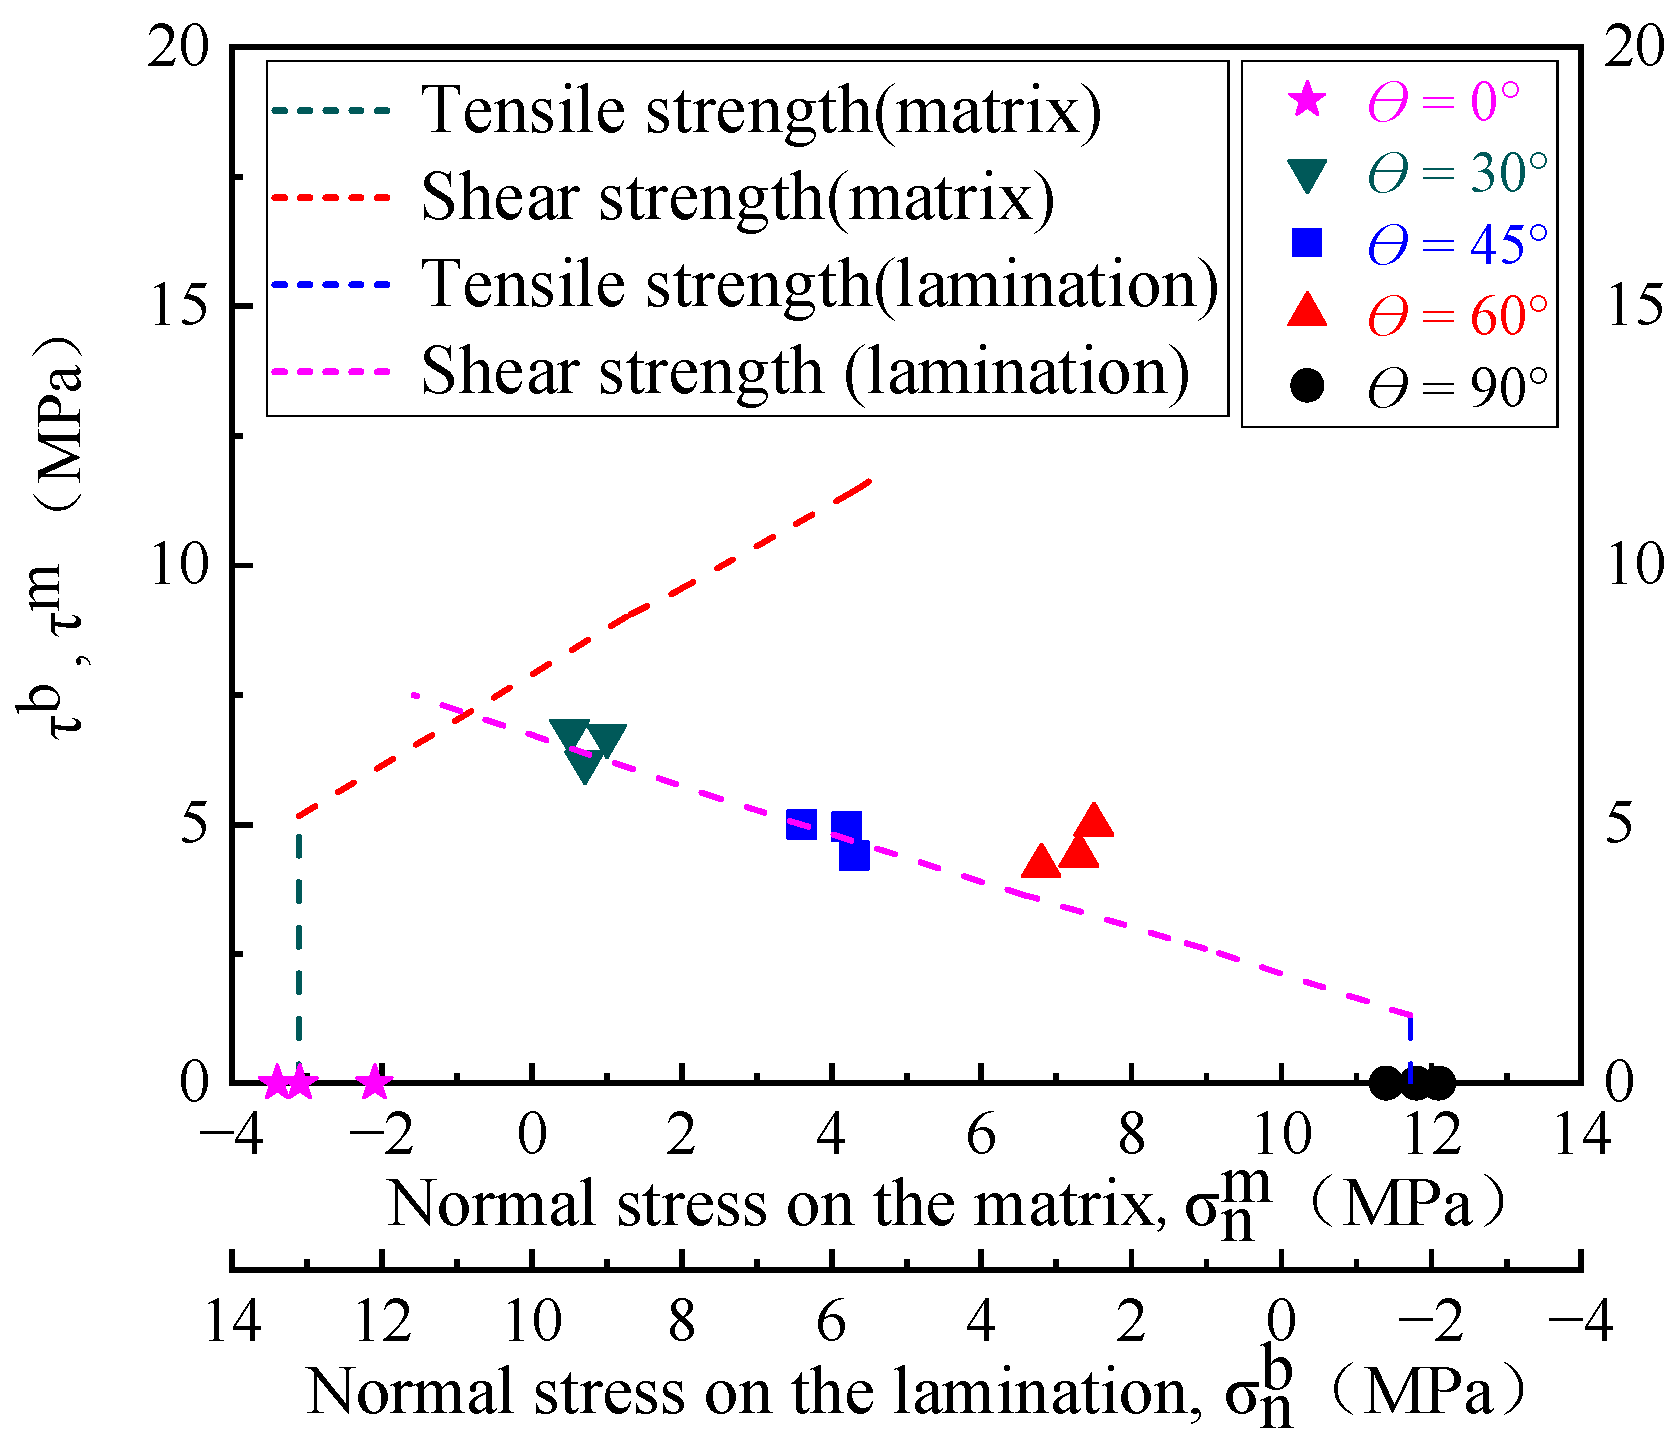
4.1. Mechanical Analysis of Fracture Mode

In this paper, the method proposed by Claesson et al. (Formulas (3) and (4)) to calculate the stress magnitude at the center of the transversely isotropic Brazilian disc is used to analyze the mechanical mechanism of fracture modes of samples with different layer orientations [12].
The tensile stress at the center point of the disc is:
σ t = 2 P π D t [ ( E / E 4 ) cos ( 2 θ ) cos ( 4 θ ) 4 ( b 1 ) ]
The compressive stress at the center point of the disc is:
σ p = 6 P π D t [ ( E / E 4 ) cos ( 2 θ ) + cos ( 4 θ ) 4 ( b 1 ) ]
where b = E E 2 ( 1 G 2 υ E ) .
Where E is the elastic modulus of the vertical isotropic plane; E is the elastic modulus of the parallel isotropic surface; υ is the Poisson’s ratio perpendicular to the isotropic plane; and G is the shear modulus perpendicular to the isotropic plane. Through the uniaxial compression test, the values of E , E, and υ can be obtained. G and the characteristic parameters of shear strength of the lamination and matrix are obtained according to the literature [13], and the results are shown in Table 6.
The normal stress and shear stress on the lamination can be calculated by Formulas (5) and (6), respectively.
σ n = 1 2 ( σ P + σ t ) + 1 2 ( σ P σ t ) cos 2 θ
τ = 1 2 ( σ P σ t ) sin 2 θ
Assuming that the strength of lamination and matrix conforms to the Mohr– Coulomb criterion, and the compressive and tensile stresses are specified as positive and negative, respectively, the fracture conditions of the lamination and matrix are as follows:
σ n b R t b τ b c b + σ n b tan φ b }
σ n m R t m τ m c m + σ n m tan φ m }
where σ n b , τ b , σ n m , and τ m are the normal stress and shear stress on the matrix and lamination, respectively; R t b is the tensile strength value of the lamination calculated by Formula (1), R t b = 1.31 MPa; and R t m is the matrix tensile strength value calculated by Formula (1), R t m = 5.154 Mpa. c b , φ b , c m and φ m are the cohesive force and internal friction angle of the lamination and the matrix, respectively.
Figure 10 shows the relationship between stress and strength of samples with different layer orientations, when 0° ≤ θ ≤ 90°.
It can be seen from Figure 10 that when θ = 90°, σn = σt and τ = 0 can be calculated from Formulas (5) and (6), respectively, indicating that there is no shear stress on the lamination, and the sample will not undergo shear failure along the lamination. The tensile stress at the center of the sample was calculated to be 4.54 MPa, which was larger than the tensile strength of the lamination (Formula (7)). Therefore, tensile failure occurred along the lamination. When θ = 0°, there is also only normal stress but no shear stress on the lamination. The calculated tensile stress at the center of the sample is 6.29 MPa, which is larger than the tensile strength of the matrix (Formula (8)), so the matrix suffers tensile failure. Due to the different degrees of defects distributed on the lamination surface of continental shale, fractures spread along the defects after communicating with the lamination surface. Therefore, it was observed in the test that fractures spread along the lamination for a short distance and then spread through the lamination. When θ = 30°, 45°, and 60°, the shear stress of the samples is larger than the shear strength of the lamination but smaller than the shear strength of the matrix. Therefore, the samples with these three lamination inclinations all undergo shear failure along the lamination. In addition, the tensile stress of the sample with 30° lamination is greater than the tensile strength of the matrix, so the matrix also suffers tensile failure.

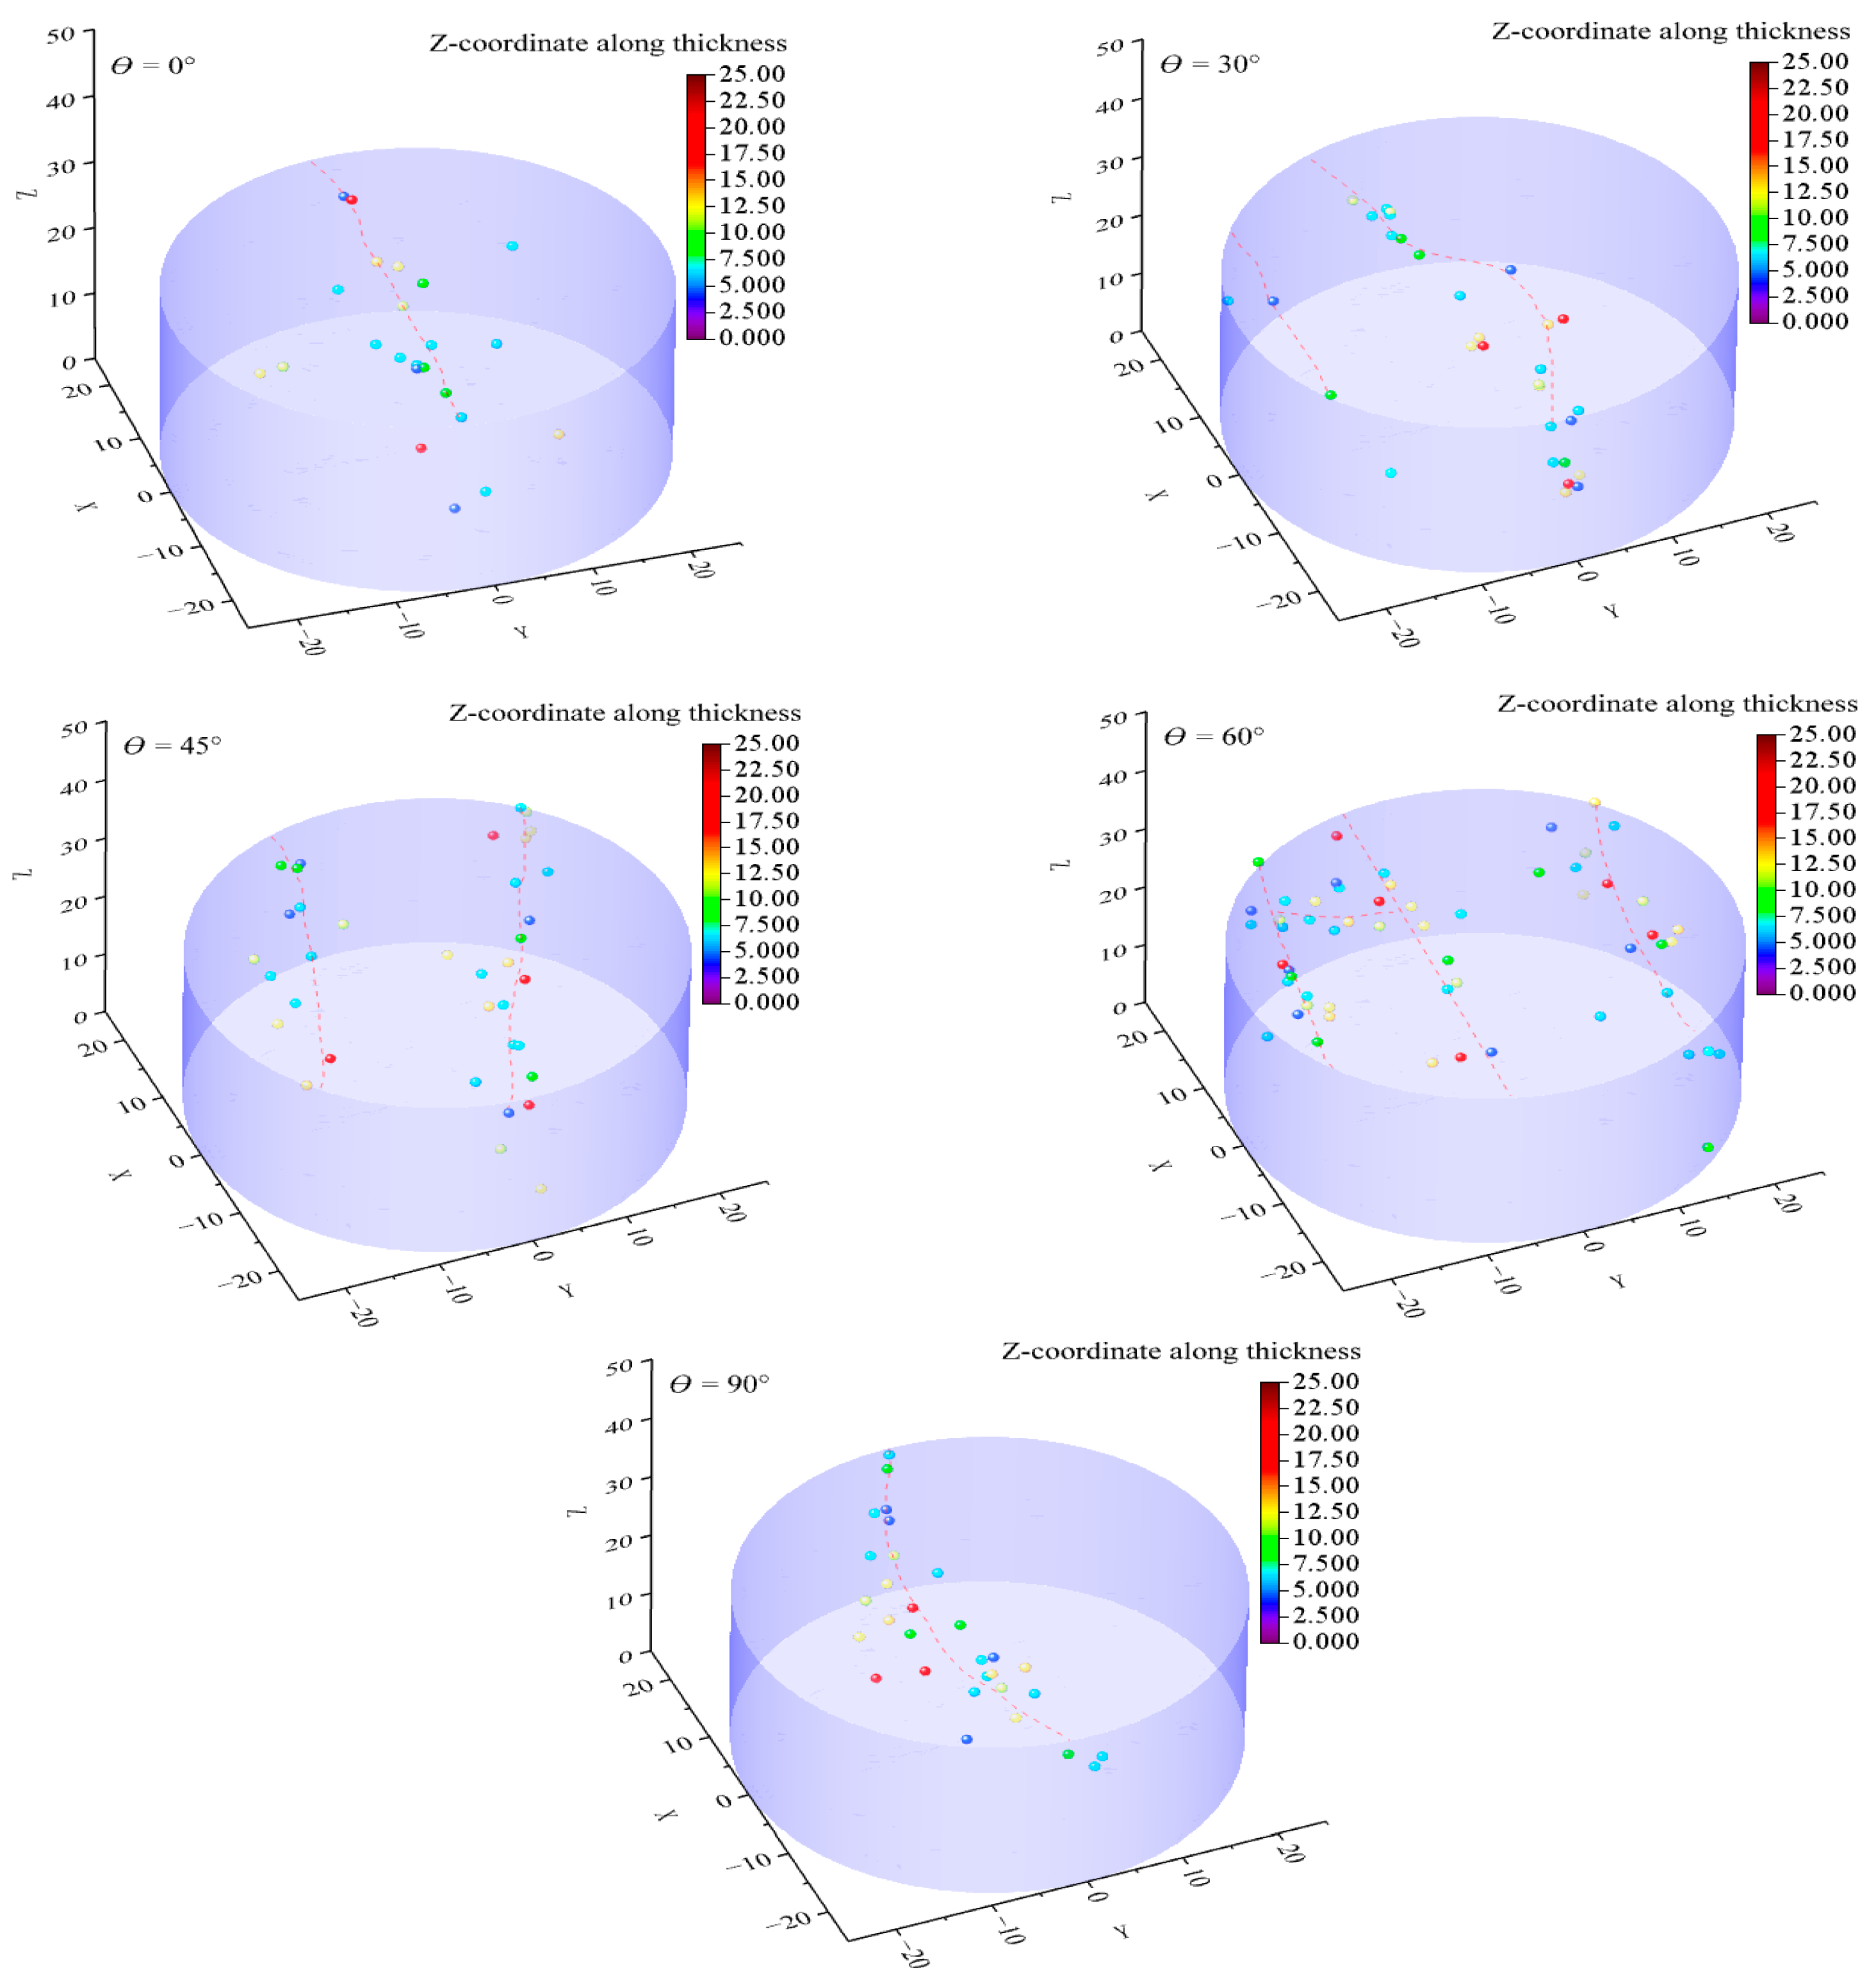
4.2. AE Evolution Process and Spatial Distribution Characteristics

AE energy release is an important indicator reflecting the evolution of microcrack damage. Figure 11 shows the overall spatial distribution characteristics of AE signals in the Brazilian test. As can be seen from Figure 11, most AE signals are distributed near the fracture surface, which is consistent with the fracture path. AE signals gradually deviate from the center of the disc with the increase of layer orientation, and the number of signals has an increasing trend, which is especially prominent when θ = 60°. When θ = 0°, the disc is mainly subjected to compressive stress, which induces fewer microcracks in the lamination, sparse AE signals, and, therefore, fewer secondary cracks. On the contrary, when θ = 90°, the weaker lamination plane is subjected to horizontal tensile stress, which is more likely to induce micro-cracks in the lamination, and the AE signals are distributed in a crescent-shape on the side deviating from the meridian of the disc. When θ = 30°–60°, the layer orientations lead to a more complex stress transfer path and a larger deviation of the fracture path from the disc meridian. AE signals also show complex spatial distribution characteristics and are generated around and on the edge of the meridian of the disc. More AE signals mean more fracture points and more micro-cracks initiation, so the fracture path is more complicated.

5. Conclusions

In this paper, the anisotropy characteristics, fracture mode, and fracture mechanism of continental shale are analyzed based on the Brazilian tests with different layer orientations and the AE monitoring results. The main conclusions are as follows:
(1) The lamination structure of continental shale is obvious and the cementation degree is weak. The mechanical parameters such as tensile strength and splitting modulus of matrix and lamination are weaker than those of marine shale. Layer orientations have a significant effect on the anisotropy of continental shale. The tensile strength of continental shale increases gradually with the increase of layer orientation, reaching a peak of 5.595 MPa at θ = 90°. The growth rate is slow at θ = 0°–30°, the fastest at θ = 30°–45°, and close to linear growth at θ = 45°–90°. In addition, the splitting modulus at θ = 45° is the smallest and the layer orientation effect is the most obvious. The splitting modulus at θ = 90° is the largest, which is 4.02 times the minimum splitting modulus.
(2) The layer orientation effect has a significant influence on the fracture mode of continental shale. The fracture modes of θ = 0° and θ = 90° are mainly the tensile failure of lamination and matrix, respectively. The cracks are in the form of straight through-center and crescent-shaped deviating-center. The crack morphology of θ = 30°–60° is straight and crescent-shaped, through-center or deviating-center compound modes. In particular, the crack morphology of θ = 60° is the most complex, with secondary cracks connecting two adjacent main cracks, which indicates that the layer orientation of 60° seems to be more conducive to the formation of a fracture network. The mechanical analysis results show that the strength of the θ = 30°–60° samples are distributed within the envelope of tensile strength, and the fracture mode is a compound fracture of matrix and lamination.
(3) AE monitoring results show that the AE location points are obviously deflected with the change of the layer orientations, and the spatial distribution of the AE location points are the same as the fracture path of the crack. AE signals gradually deviate from the center of the sample with the increase of the layer orientation, and the number of signals has an increasing trend. This is particularly prominent at θ = 60°, which further verifies that the crack morphology of θ = 60° is the most complex.

Author Contributions

Conceptualization, X.W. and X.L.; methodology, X.W. and Q.G.; software, X.W.; validation, X.W., Q.G. and X.L.; formal analysis, X.W.; investigation, Q.G. and X.L.; resources, X.W.; data curation, X.W., Q.G. and X.L.; writing—original draft preparation, X.W.; writing—review and editing, X.W. and Q.G.; visualization, Q.G.; supervision, X.L.; project administration, X.W. and Q.G.; funding acquisition, X.W. All authors have read and agreed to the published version of the manuscript.

Funding

This research was funded by Doctoral Research Start-up Fund project of Liaoning University of Technology (grant number XB2022022), and the APC was funded by Liaoning University of Technology.

Institutional Review Board Statement

Not applicable.

Informed Consent Statement

Not applicable.

Data Availability Statement

For more information regarding data availability, please reach out to the corresponding author.

Acknowledgments

The authors would like to thank the anonymous reviewers for the constructive comments, which helped improve this article. Special thanks to the support of the Doctoral Research Start-up Fund project of Liaoning University of Technology (grant number XB2022022).

Conflicts of Interest

The authors declare no conflict of interest.

References

  1. Guo, P.; Li, X.; Li, S.; Yang, W.; Wu, Y.; Li, G. Quantitative analysis of anisotropy effect on hydrofracturing efficiency and process in shale using X-ray computed tomography and acoustic emission. Rock Mech. Rock Eng. 2021, 54, 5715–5730. [Google Scholar] [CrossRef]
  2. He, J.M.; Afolagboye, L.O. Influence of layer orientation and interlayer bonding force on the mechanical behavior of shale under Brazilian test conditions. Acta Mech. Sin. 2018, 34, 349–358. [Google Scholar] [CrossRef]
  3. Wang, J.; Xie, L.; Xie, H.; Ren, L.; He, B.; Li, C.; Yang, Z.; Gao, C. Effect of layer orientation on acoustic emission characteristics of anisotropic shale in Brazilian tests. J. Nat. Gas Sci. Eng. 2016, 36, 1120–1129. [Google Scholar] [CrossRef]
  4. Hou, P.; Gao, F.; Yang, Y.G.; Zhang, Z.; Gao, Y.N.; Zhang, X.X.; Zhang, J. Effect of bedding plane direction on acoustic emission characteristics of shale in Brazilian tests. Rock Soil Mech. 2016, 37, 1604–1612. [Google Scholar] [CrossRef]
  5. Noori, M.; Khanlari, G.; Sarfarazii, V.; Rafiei, B.; Nejati, H.R.; Schubert, W. Experimental test and numerical simulation of the effect of brittleness on the microfracturing of sandstone. Bull. Eng. Geol. Environ. 2022, 81, 309. [Google Scholar] [CrossRef]
  6. Wang, L.; Guo, Y.; Yang, C.; Xiao, J.; Lu, C.; Song, Y. Mechanical characterization of continental shale in Sichuan Basin of China and its potential impact on reservoir stimulation. J. Nat. Gas Sci. Eng. 2020, 79, 103346. [Google Scholar] [CrossRef]
  7. Huang, B.X.; Li, L.H.; Tan, Y.F.; Hu, R.; Li, X. Investigating the Meso-Mechanical anisotropy and fracture surface roughness of continental shale. J. Geophys. Res. Solid Earth 2020, 125, e2019JB017828. [Google Scholar] [CrossRef]
  8. Noori, M.; Khanlari, G.; Rafiei, B. Estimation of Brittleness Indexes from Petrographic Characteristics of Different Sandstone Types (Cenozoic and Mesozoic Sandstones), Markazi Province, Iran. Rock Mech. Rock Eng. 2022, 55, 1955–1995. [Google Scholar] [CrossRef]
  9. Wang, X.L. Experimental Study on Bedding Structure Effect of Soft Rock. Ph.D. Thesis, China University of Mining and Technology (Beijing), Beijing, China, 2013. [Google Scholar]
  10. Tavallalia, A.; Vervoort, A. Effect of layer orientation on the failure of layered sandstone under Brazilian test conditions. Int. J. Rock Mech. Min. Sci. 2010, 47, 313–322. [Google Scholar] [CrossRef]
  11. Heng, S.; Yang, C.H.; Guo, Y.T. Influence of bedding planes on hydraulic fracture propagation in shale formations. Chin. J. Rock Mech. Eng. 2015, 34, 228–237. [Google Scholar] [CrossRef]
  12. Claesson, J.; Bohloli, B. Brazilian test: Stress field and tensile strength of anisotropic rocks using an analytical solution. Int. J. Rock Mech. Min. Sci. 2002, 39, 991–1004. [Google Scholar] [CrossRef]
  13. Zhao, Z.H. Characteristics of Fracture Propagation Caused by Supercritical Carbon Dioxide and Hydraulic Fracturing in Shale. Ph.D. Thesis, Institute of Geology and Geophysics, Chinese Academy of Sciences, Beijing, China, 2018. [Google Scholar]
Figure 1. Digital microscope magnifies sample section. (a) Sample section. (b) Magnified view of sample section.
Applsci 12 08683 g001
Figure 2. TAW-2000 electro-hydraulic servo rock triaxial testing machine and operation principle.
Applsci 12 08683 g002
Figure 3. Schematic diagram of lamination angle loading and AE sensors’ layout.
Applsci 12 08683 g003
Figure 4. Peak load-displacement curves of continental shale with different layer orientations.
Applsci 12 08683 g004
Figure 5. Uniaxial compressive strength of continental shale.
Applsci 12 08683 g005
Figure 6. Tensile strength of samples with different layer orientations.
Applsci 12 08683 g006
Figure 7. Deformation characteristics of stress peaks.
Applsci 12 08683 g007
Figure 8. Layer orientation effect coefficient.
Applsci 12 08683 g008
Figure 9. Splitting modulus of samples with different layer orientations.
Applsci 12 08683 g009
Figure 10. The relationship between stress and strength at different layer orientations.
Applsci 12 08683 g010
Figure 11. AE signal spatial distribution characteristics with different layer orientations.
Applsci 12 08683 g011
Table 1. Statistical table of Brazilian test data of continental shale.
No.Layer Orientation (°)
030456090
P (KN)Φ × H (mm)P (KN)Φ × H (mm)P (KN)Φ × H (mm)P (KN)Φ × H (mm)P (KN)Φ × H (mm)
11.12649.66 × 24.951.83749.94 × 24.894.96450.02 × 25.226.20849.96 × 25.099.34549.73 × 25.02
21.30049.86 × 24.972.19550.01 × 24.985.48350.08 × 25.096.87350.10 × 25.0710.02850.05 × 25.03
31.50449.94 × 25.022.57449.98 × 25.036.62349.98 × 24.957.73949.96 × 24.9510.98149.97 × 24.98
Mean1.31049.82 × 24.982.20249.98 × 24.975.69050.03 × 25.096.94050.01 × 25.0410.11849.92 × 25.01
SD0.1540.118 × 0.0290.3010.029 × 0.0580.6930.041 × 0.1100.6270.066 × 0.0620.6710.136 × 0.022
Table 2. Mechanical action stages and threshold values of characteristic points of samples with different layer orientations.
Mechanical Response Characteristics Feature Point Feature Point Threshold/KN
0° ≤ θ ≤ 30°30° ≤ θ ≤ 60°60° ≤ θ ≤ 90°
Compaction stageCompaction closure point ≤1.001.00–3.753.75–5.24
Elastic stage Crack cracking point ≤1.801.80–6.056.05–8.93
Failure stageStrength failure point 1.310–2.2022.202–6.9406.940–10.118
Table 3. Tensile strength and layer orientation effect coefficient of continental shale.
Layer Orientation θ (°)σt (MPa)Layer Orientation Effect CoefficientAverage Splitting Modulus
(GPa)
T1T2T3MeanSDLargest Deviation (%)Average Tensile StrengthAverage Splitting Modulus
00.5780.6640.7660.6690.07714.50.870.600.45
300.9401.1171.3091.1220.15116.70.780.630.42
452.5032.7753.3782.8850.36617.10.440.750.28
603.1503.4803.9493.5260.32812.00.320.340.74
904.7775.0915.5955.1540.3378.60.000.001.125
Table 4. Typical fracture morphology of continental shale with different layer orientations under Brazilian test.
No.Layer Orientation θ (°)
30°45°60°90°
1 Applsci 12 08683 i001 Applsci 12 08683 i002 Applsci 12 08683 i003 Applsci 12 08683 i004 Applsci 12 08683 i005
2 Applsci 12 08683 i006 Applsci 12 08683 i007 Applsci 12 08683 i008 Applsci 12 08683 i009 Applsci 12 08683 i010
3 Applsci 12 08683 i011 Applsci 12 08683 i012 Applsci 12 08683 i013 Applsci 12 08683 i014 Applsci 12 08683 i015
Table 5. Effect of layer orientation on fracture mode of continental shale.
Layer Orientation θ (°)Typical Fracture MorphologyCharacteristics of Secondary CracksFracture Mode
0 Applsci 12 08683 i0161. The secondary crack connects to the single main crack.
2. Secondary cracks propagate along the lamination direction.
Straight through-center fracture mode.
30 Applsci 12 08683 i017Invisible to the naked eye.Straight and crescent-shaped deviating-center compound fracture mode.
45 Applsci 12 08683 i0181. The secondary crack connects to the single main crack.
2. The secondary cracks deviate from the lamination direction and propagate vertically.
Straight, crescent-shaped and folded-shape deviating-center compound mode.
60 Applsci 12 08683 i0191. Secondary cracks connect adjacent double main cracks.
2. Secondary cracks propagate along the lamination direction.
Straight and crescent-shaped, through-center, and deviating-center compound mode.
90 Applsci 12 08683 i020Invisible to the naked eye.1. Crescent-shaped deviating-center mode.
2. Fold-shaped through-center or deviating-center
through-layer fracture mode (with primary crack).
Table 6. Transversely isotropic mechanical parameter values of continental shale.
E (GPa) E   ( Gpa ) υ G   ( Gpa ) MatrixLamina
φ (°)c (Mpa)φ (°)c (Mpa)
31.315.80.28.735.9416.8827.025.01
Publisher’s Note: MDPI stays neutral with regard to jurisdictional claims in published maps and institutional affiliations.

