Article

Analysis of Acoustic Emission Energy from Reinforced Concrete Sewage Pipeline under Full-Scale Loading Test

1
National Center for Materials Service Safety, University of Science and Technology Beijing, No. 30, Xueyuan Road, Beijing 100083, China
2
School of Environmental, Civil, Agricultural and Mechanical Engineering, College of Engineering, University of Georgia, Athens, GA 30602, USA
*
Author to whom correspondence should be addressed.
Appl. Sci. 2022, 12(17), 8624; https://doi.org/10.3390/app12178624
Submission received: 1 July 2022 / Revised: 24 July 2022 / Accepted: 25 July 2022 / Published: 28 August 2022

Abstract

:
External load is one of the important reasons for structural damage and failure of reinforced concrete sewage pipelines, causing pipe leaks, pipe explosions, and even road collapses. In this paper, three-point loading experiments on full-size reinforced concrete pipes were carried out, and the damage state of the pipes was monitored by acoustic emission technology; the evolution trend of the mechanical properties and acoustic emission monitoring indexes under load was investigated. The experimental results showed that: (1) According to the change of acoustic emission energy and accumulated energy during loading, the mechanical response of the pipeline can be divided into an elastic compression phase, a plastic damage phase, and a residual strength phase; (2) The accumulated acoustic emission energy (∑E) and the maximum value of a single acoustic emission energy (Emax) can effectively characterize the different damage states of the loaded pipe; (3) A “double-peak” was observed in AF/RA data within the loading process. The appearance of the two peaks corresponds to the change of the loading phase of the pipeline and the occurrence of the major damage. Thus, the AF/RA index can effectively characterize the loading state and the damage degree of the pipeline. This study provides a valuable reference for pipeline health monitoring by using AE technology.

1. Introduction

The underground pipe network is an essential part of the urban infrastructure and plays an important role in the daily operation of the city, as it is responsible for many tasks such as energy transmission, sewage discharge, and water supply [1]. In recent years, accidents such as an explosion of reinforced concrete sewage pipes, road collapse, and environmental pollution caused by corrosion and leakage have become increasingly frequent [2]. Structural damage and corrosion are the most common types of defects in pipelines in service. The external stresses on the pipeline mainly originate from traffic, soil, and fluid, of which traffic load, as the most common type of load, is also one of the important design indicators of the pipeline structure. Research on the mechanical properties of the pipeline under different loads shows that underground pipelines are prone to accidents such as pipe bursting and road collapse under the long-term action of loads (e.g., traffic loads, surcharge loads, soil loads and fluid loads). Meesawasd et al. [3] investigated the effects of burial depth, load, and vehicle speed parameters on the mechanical properties of buried service pipes using the finite element method. Fang et al. [4] investigated the effects of corrosion depth, corrosion width, traffic load, and protective layer thickness on the mechanical property parameters of buried corroded concrete pipes under traffic load based on corrosion experiments conducted on buried pipes under vehicle action. Zhang et al. [5] studied the effect of construction loads on the stress and deformation of nearby buried municipal pipelines. Ma [6] employed an AE system to detect the compactness of the sleeve grouting connection, and analyze the AE signal characteristics under different concrete strengths, compactness, and hollow sleeve positions. The results showed that the amplitude of C30 concrete is higher than that of C40 concrete, while the amplitude of the dense grouting sleeve is higher than that of the hollow sleeve. Li et al. [7] used AE technology to detect cracks in concrete hollow slab bridges. By studying the relationship between crack propagation and AE signals, it is concluded that low-amplitude signals are generated due to the propagation of microcracks and the mutual friction of old crack fracture surfaces. The high amplitude signals are generated by the further propagation of macro cracks. Zheng et al. [8]. summarized seven nondestructive testing methods for reinforced concrete. They point out the application of acoustic emission technology in concrete structure damage detection, and also put forward the disadvantages of acoustic emission technology such as the existence of many sources of noise interference, the immaturity of quantitative research, and the inconsistency of structural damage evaluation indexes.
Therefore, it is necessary to study the mechanical response characteristics of pipelines under external loads. On this basis, effective pipeline damage characterization methods and monitoring indicators are further explored. This is important because the monitoring and early warning of the concrete pipeline loading damage process is of great significance to ensuring the maintenance and safe operation of the pipeline network system [9].
For this paper, a full-scale loading test was designed for the damage monitoring of reinforced concrete sewer pipes, analyzed by AE signals. The damage monitoring indexes for reinforced concrete pipes are proposed and expected to be used in practical projects as a more accurate method.

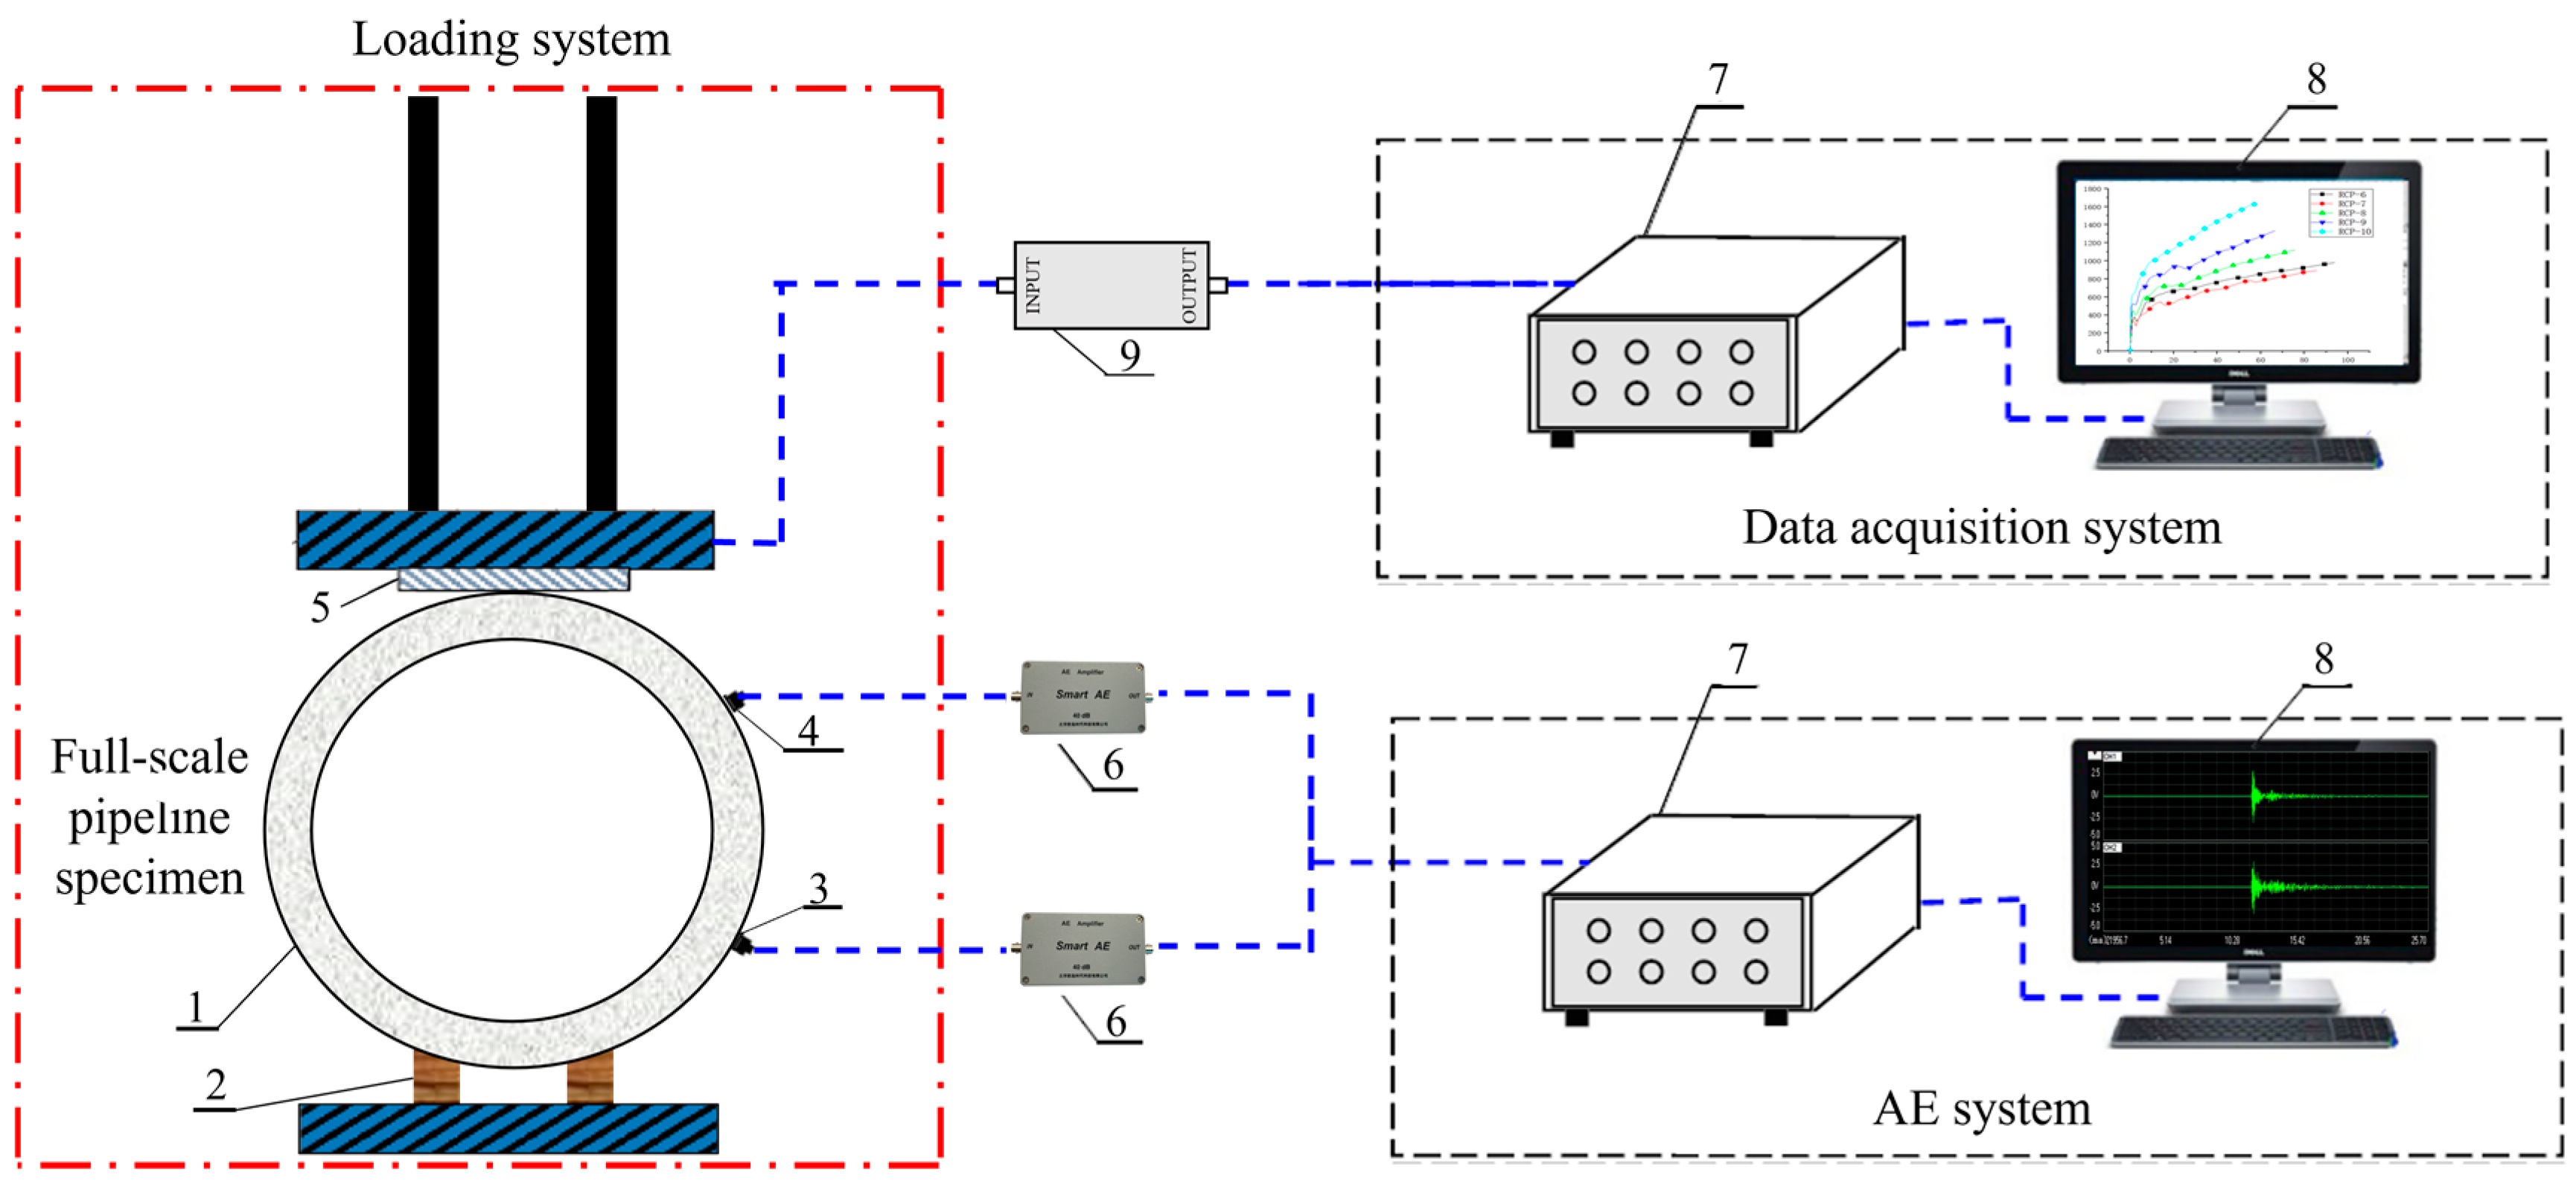
2. Experimental System
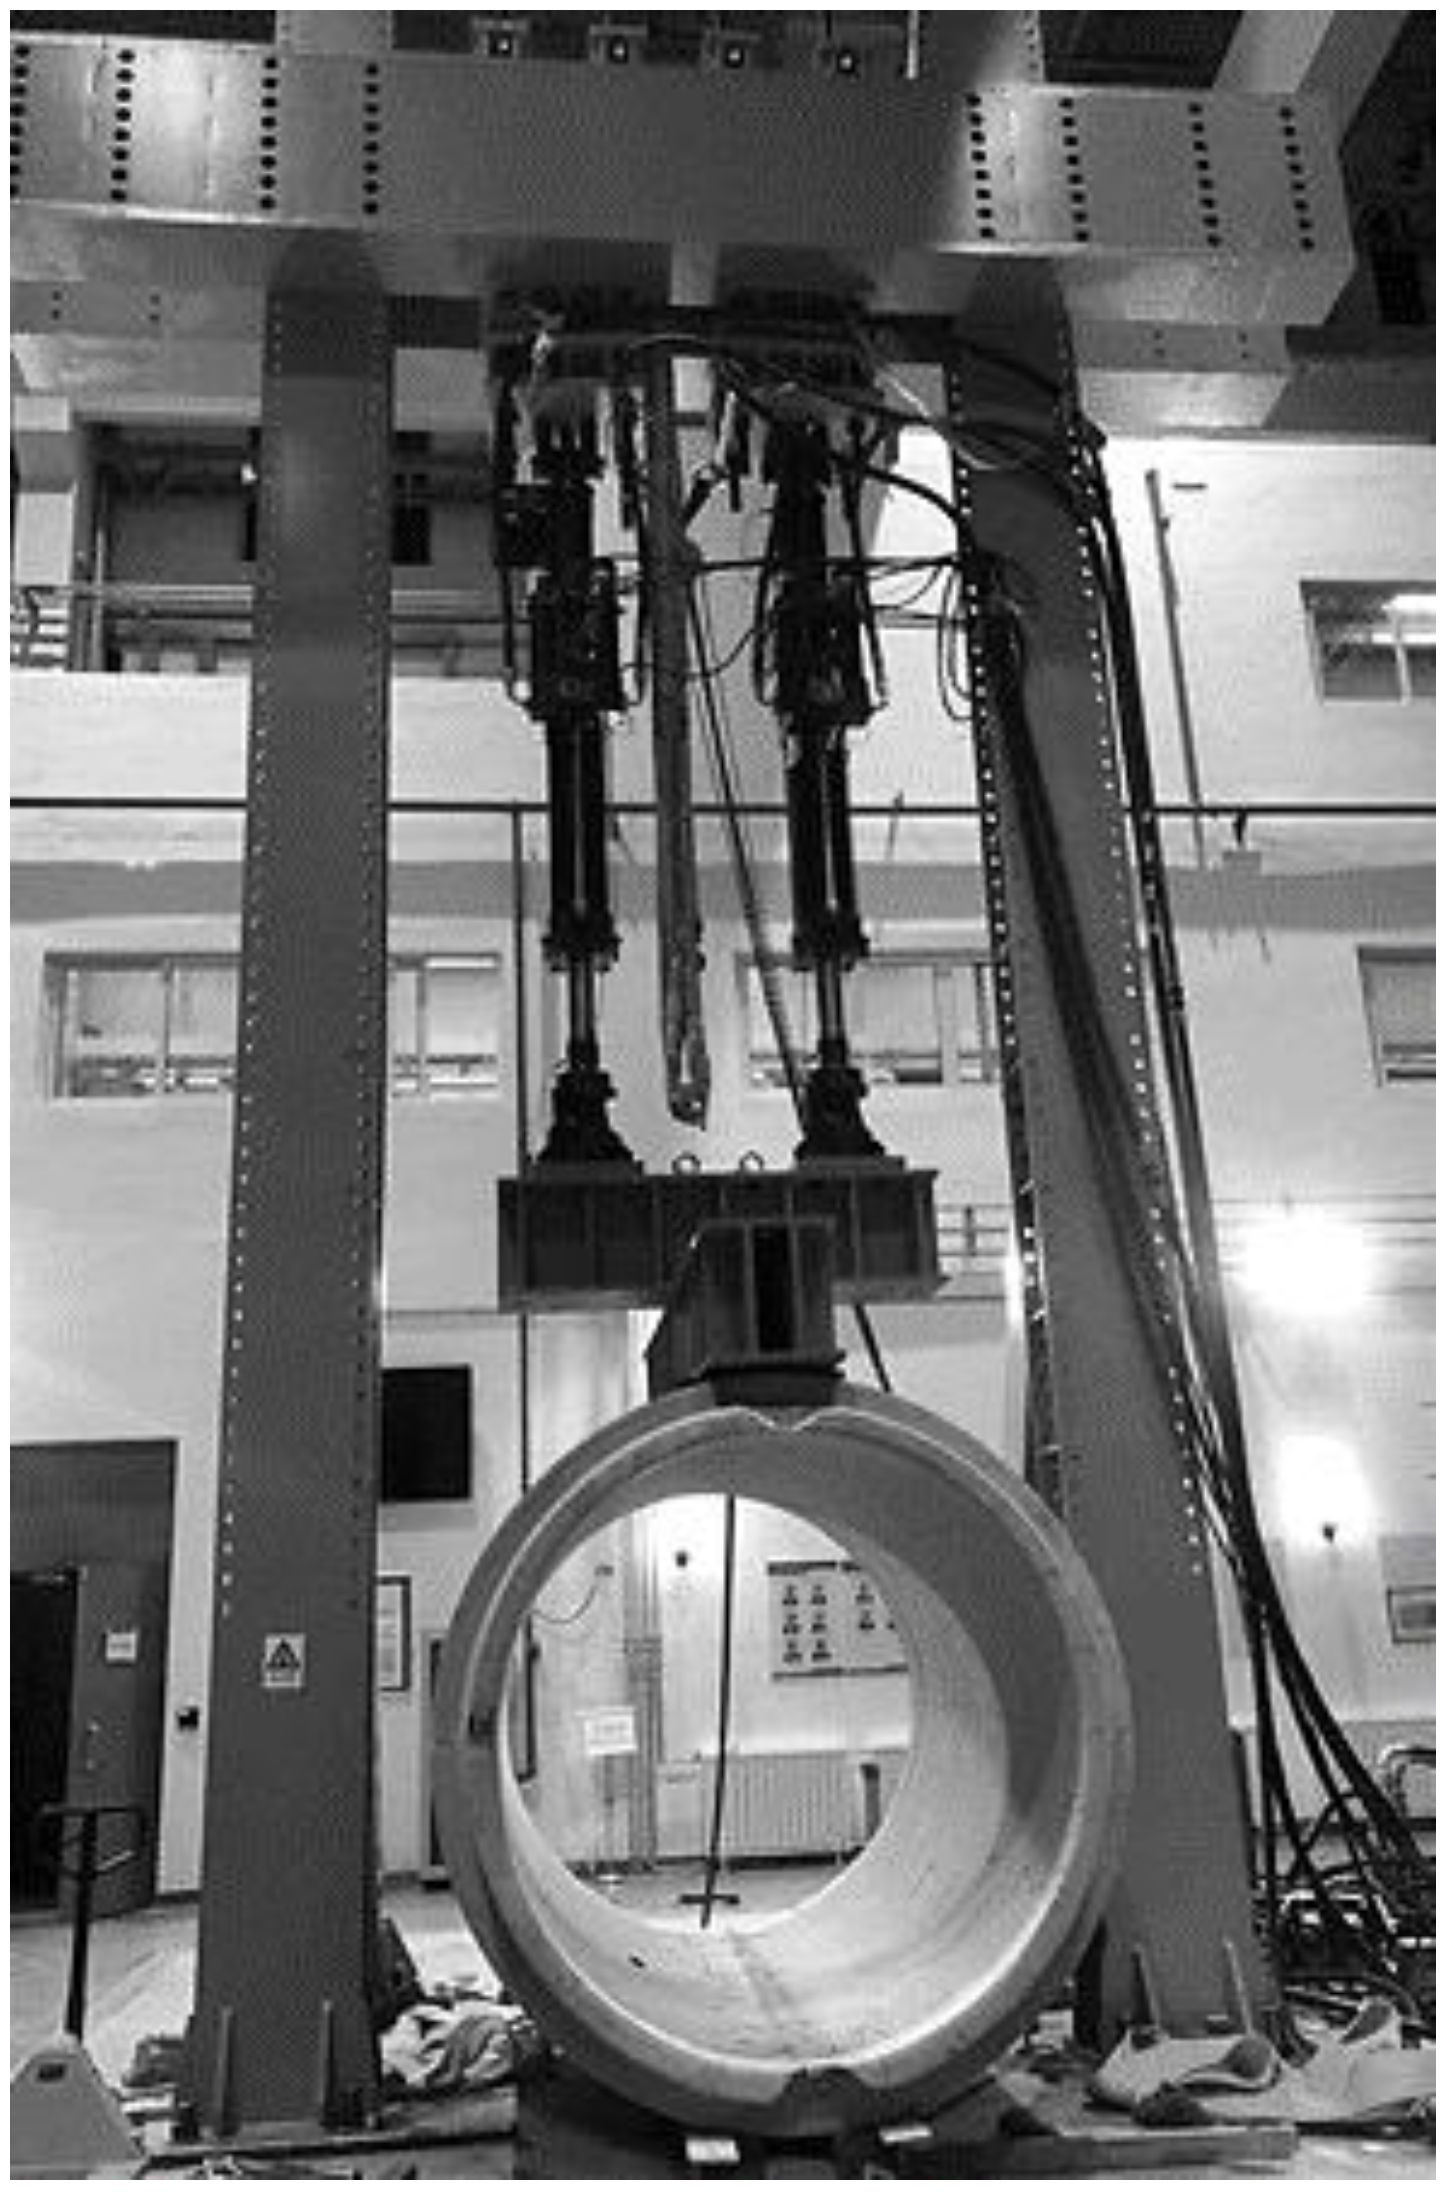
The designed experimental system mainly consists of a loading system, AE monitoring system, data acquisition system, and full-scale pipeline specimen. The full-scale loading test is shown in Figure 1.

2.1. Loading System

The system consists of two MTS actuators with an ultimate load of 50 t. The actuators are connected to the loading beam through the adapter plate and the adapter crossbeam; the loading system layout is shown in Figure 2.

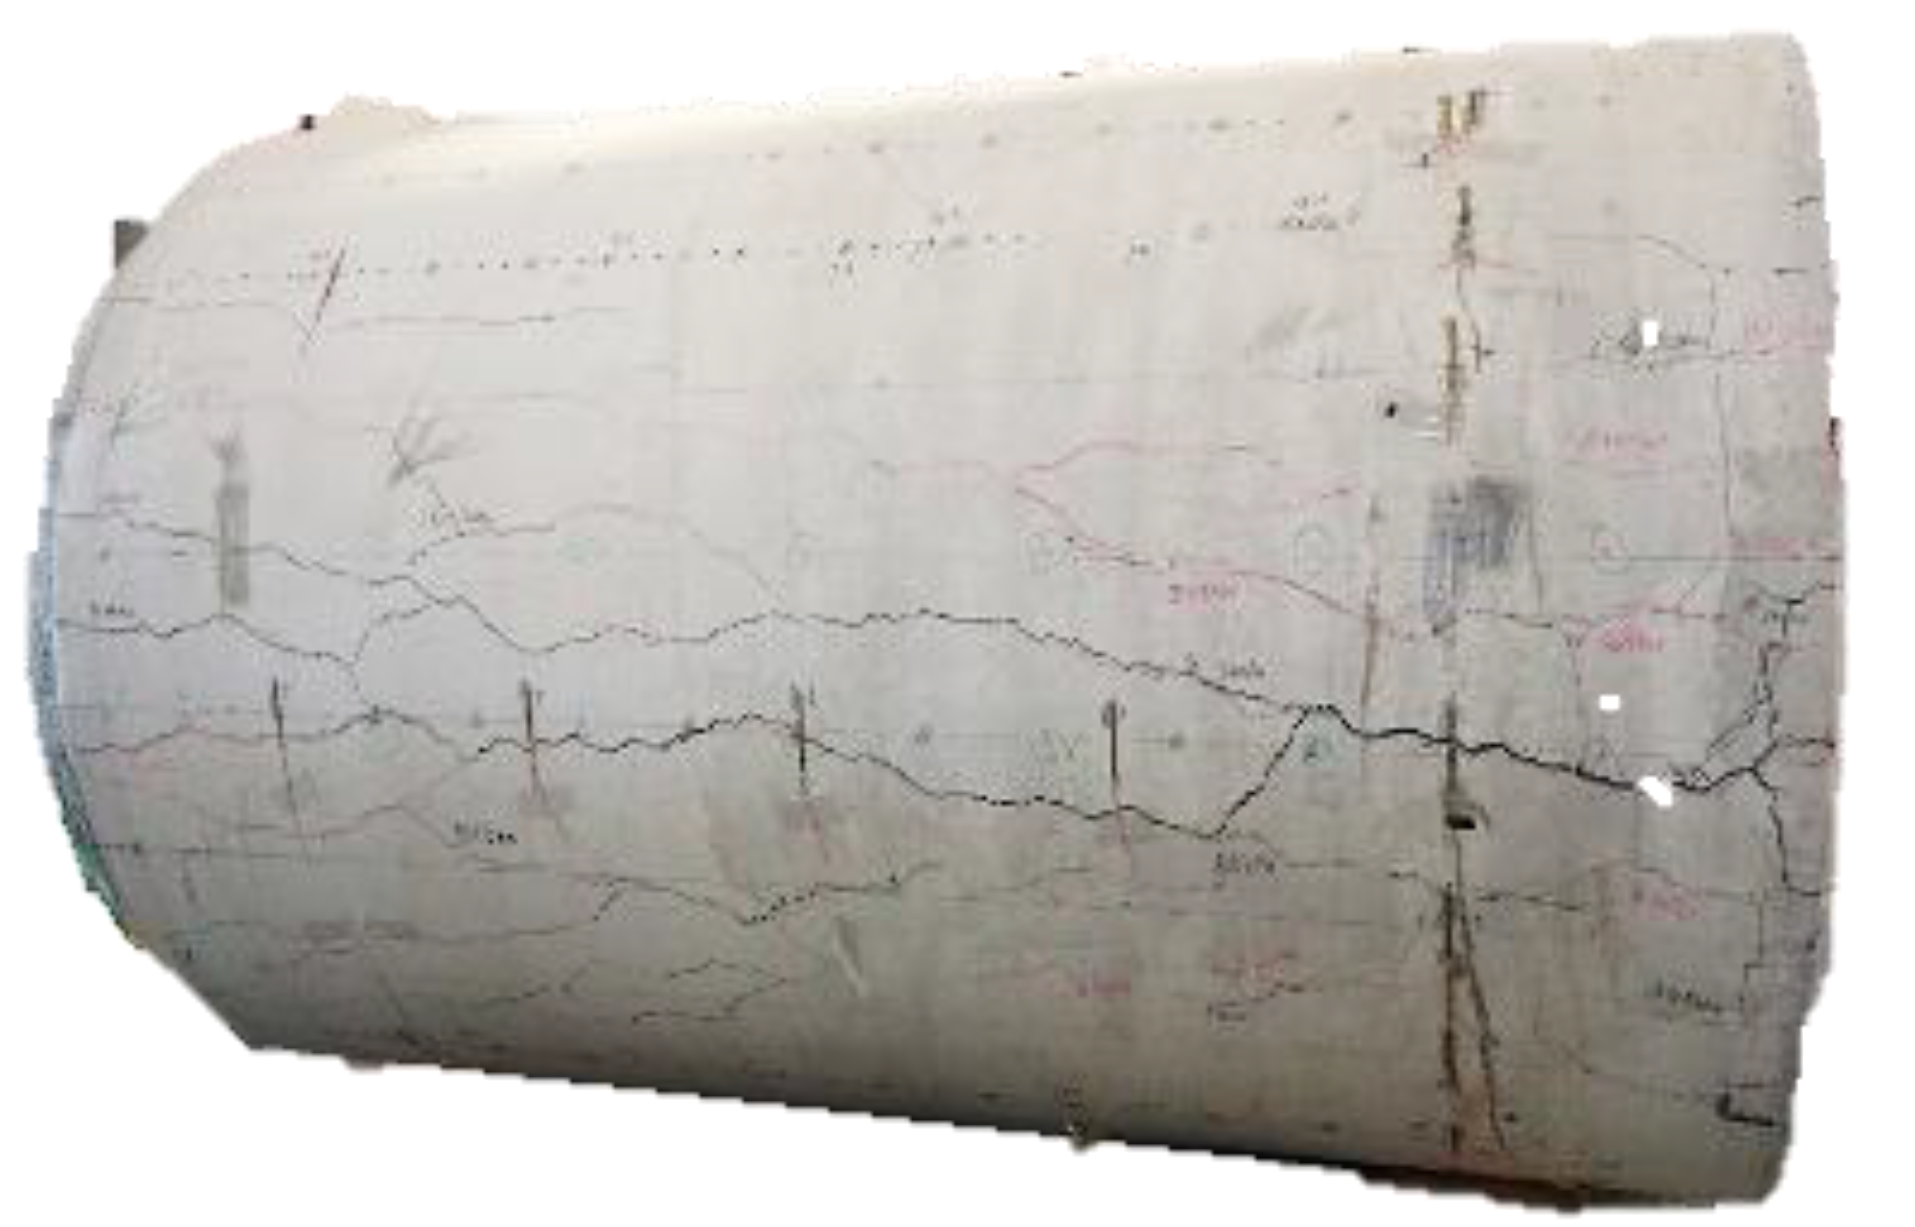
2.2. Pipeline Specimen

In order to simulate the actual load state of the service pipe, three specifications of reinforced concrete sewer pipe with inner diameters of 1000, 1500 and 2000 mm and an adequate length of 3000 mm were customized; the specific design and production parameters are shown in Table 1.

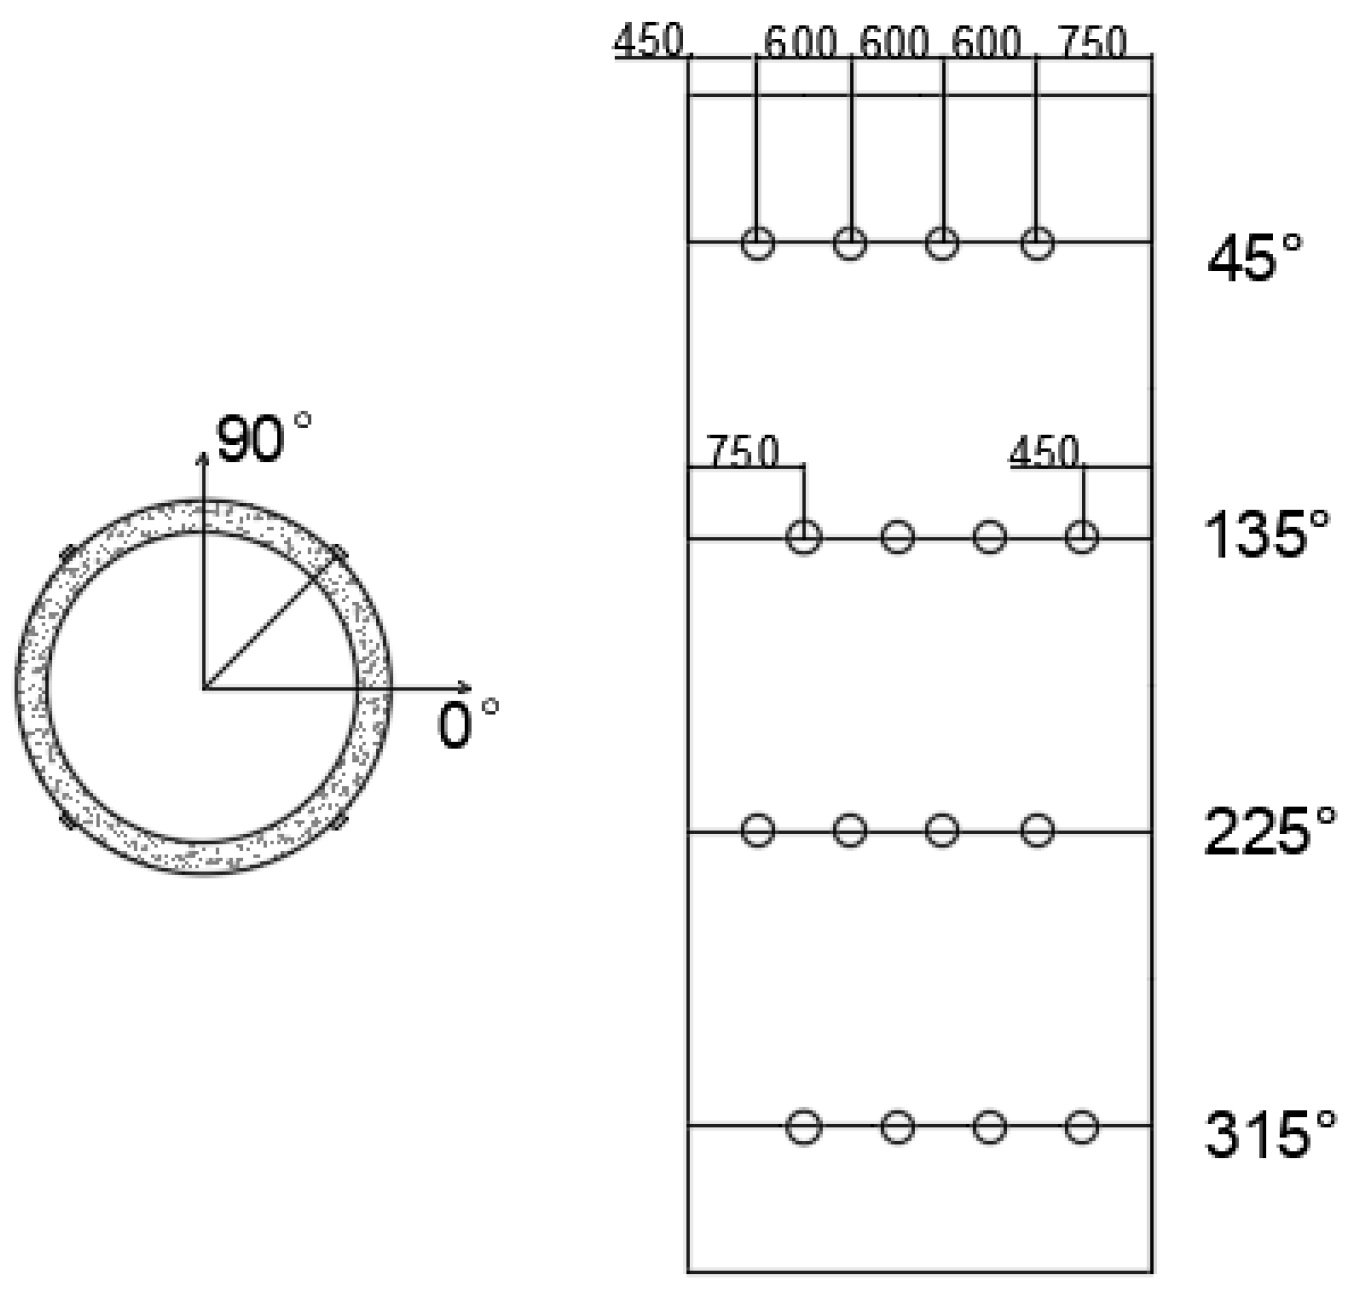
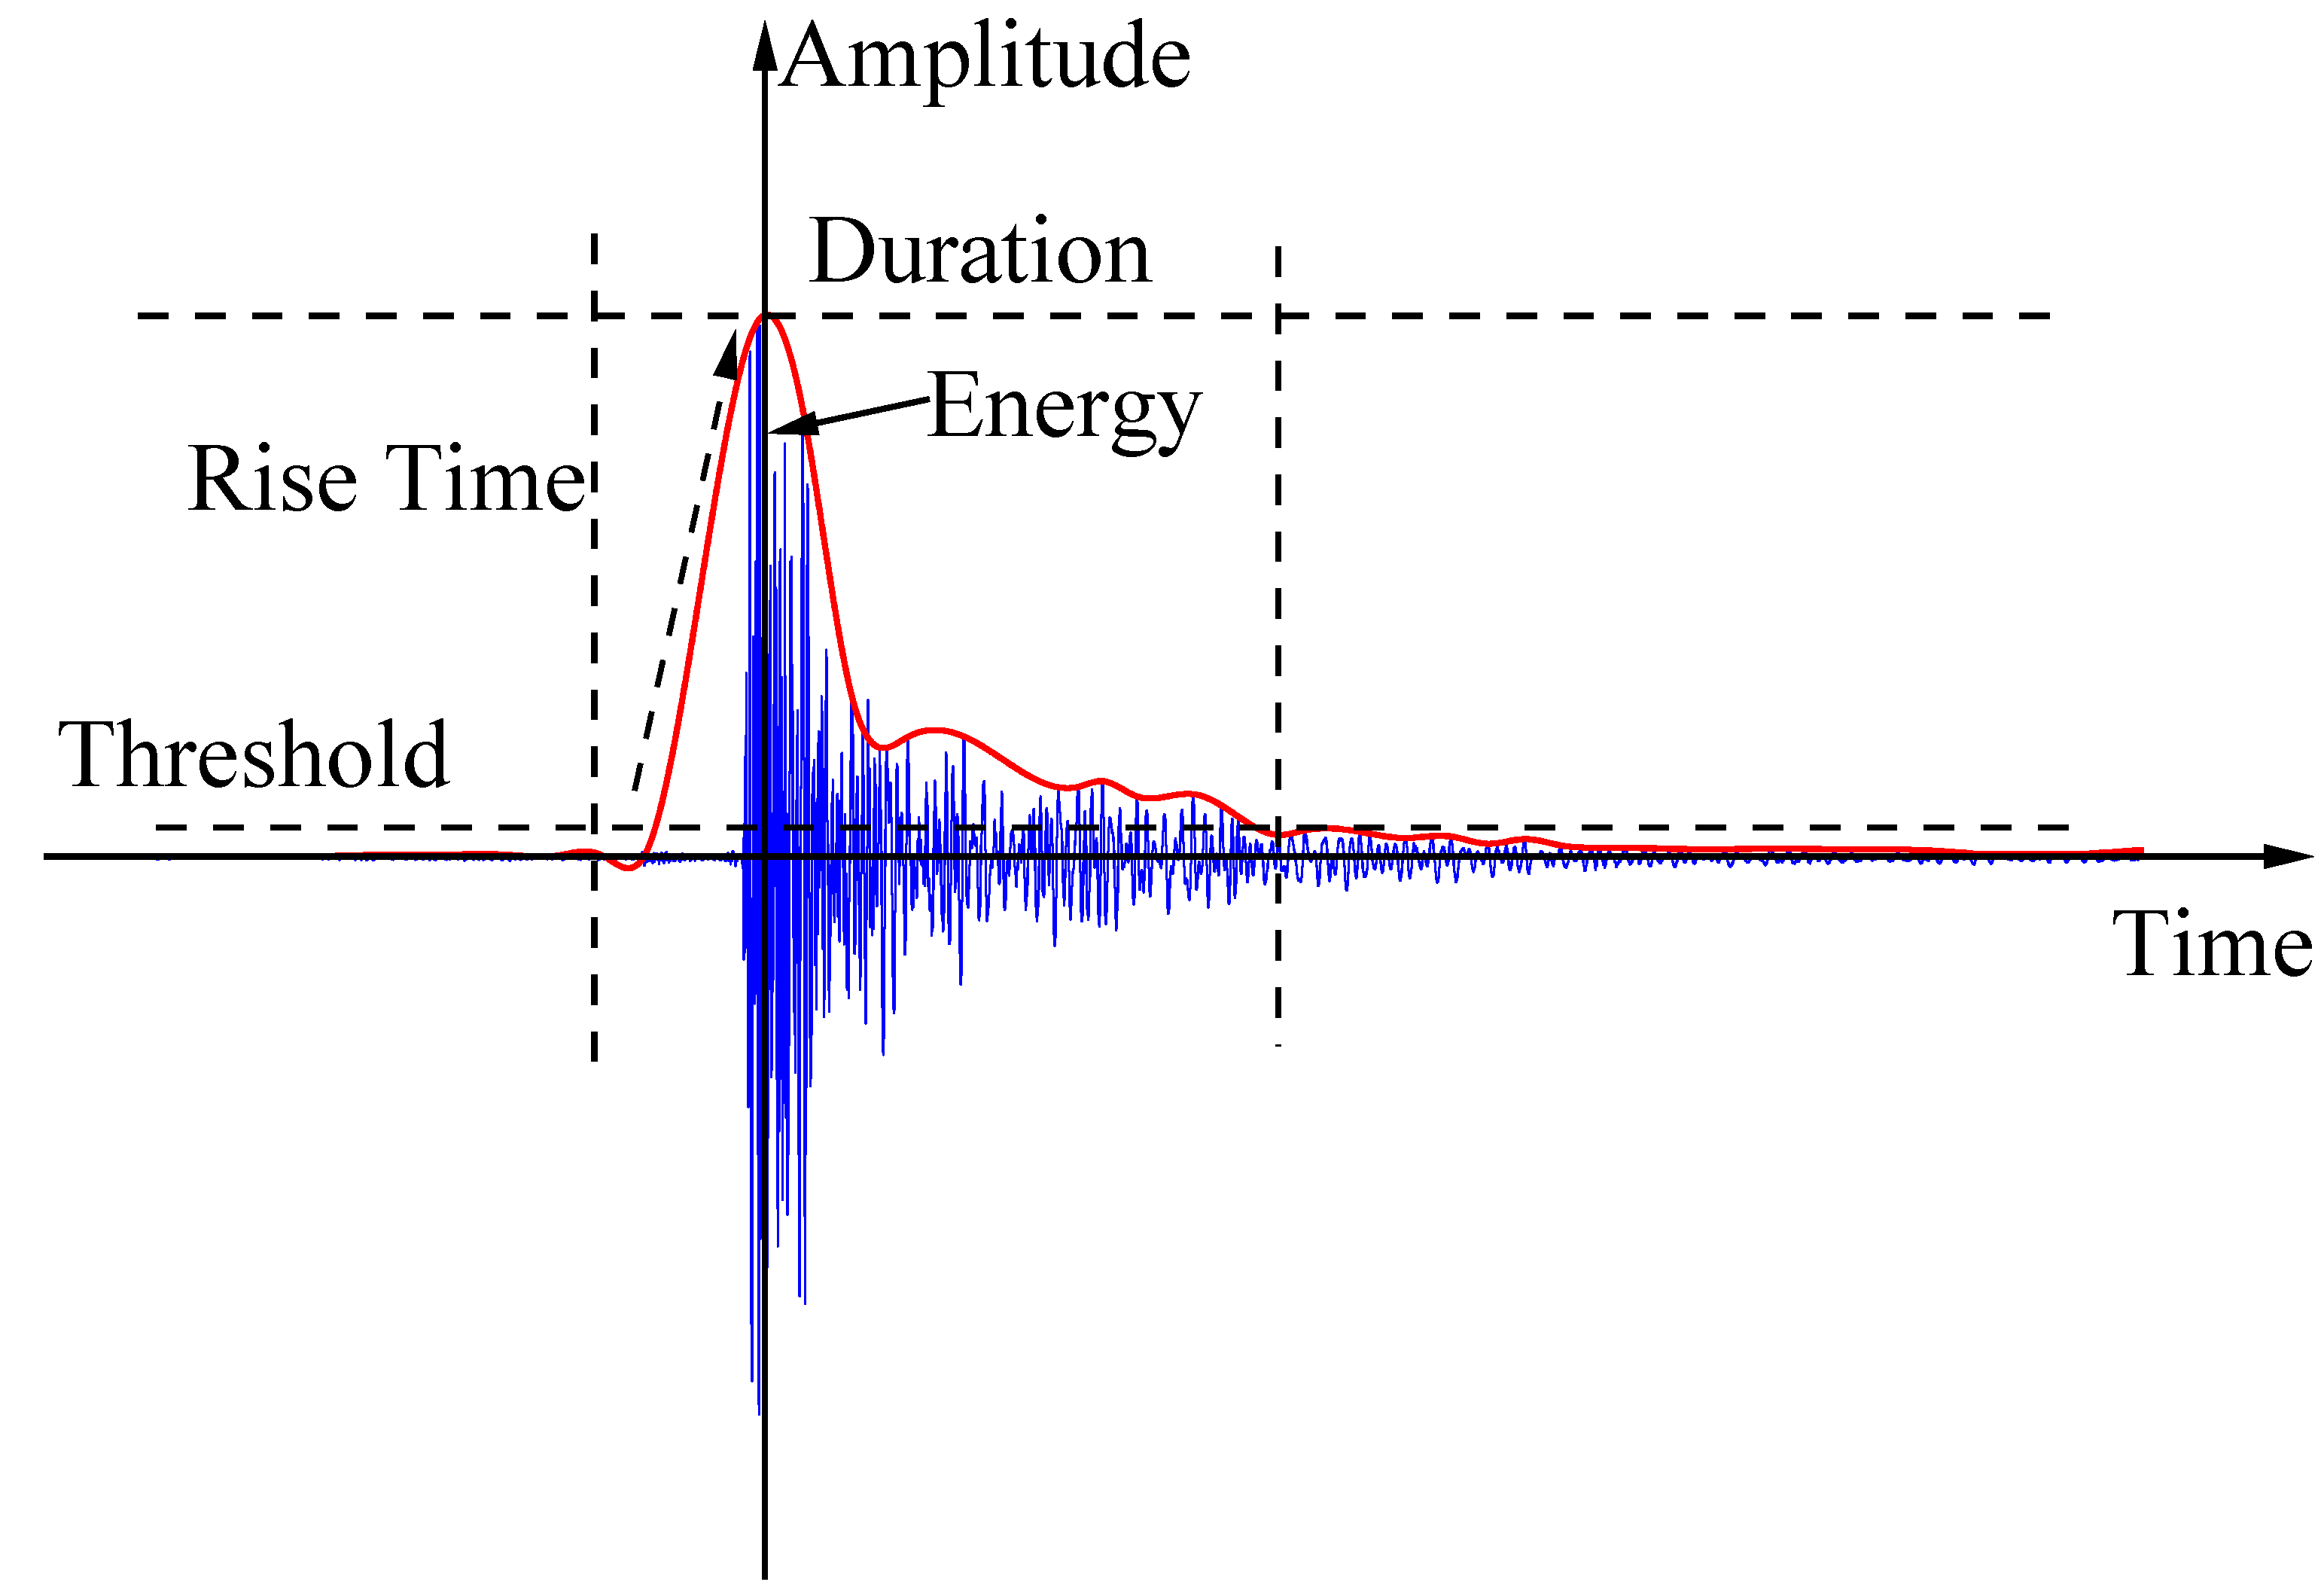
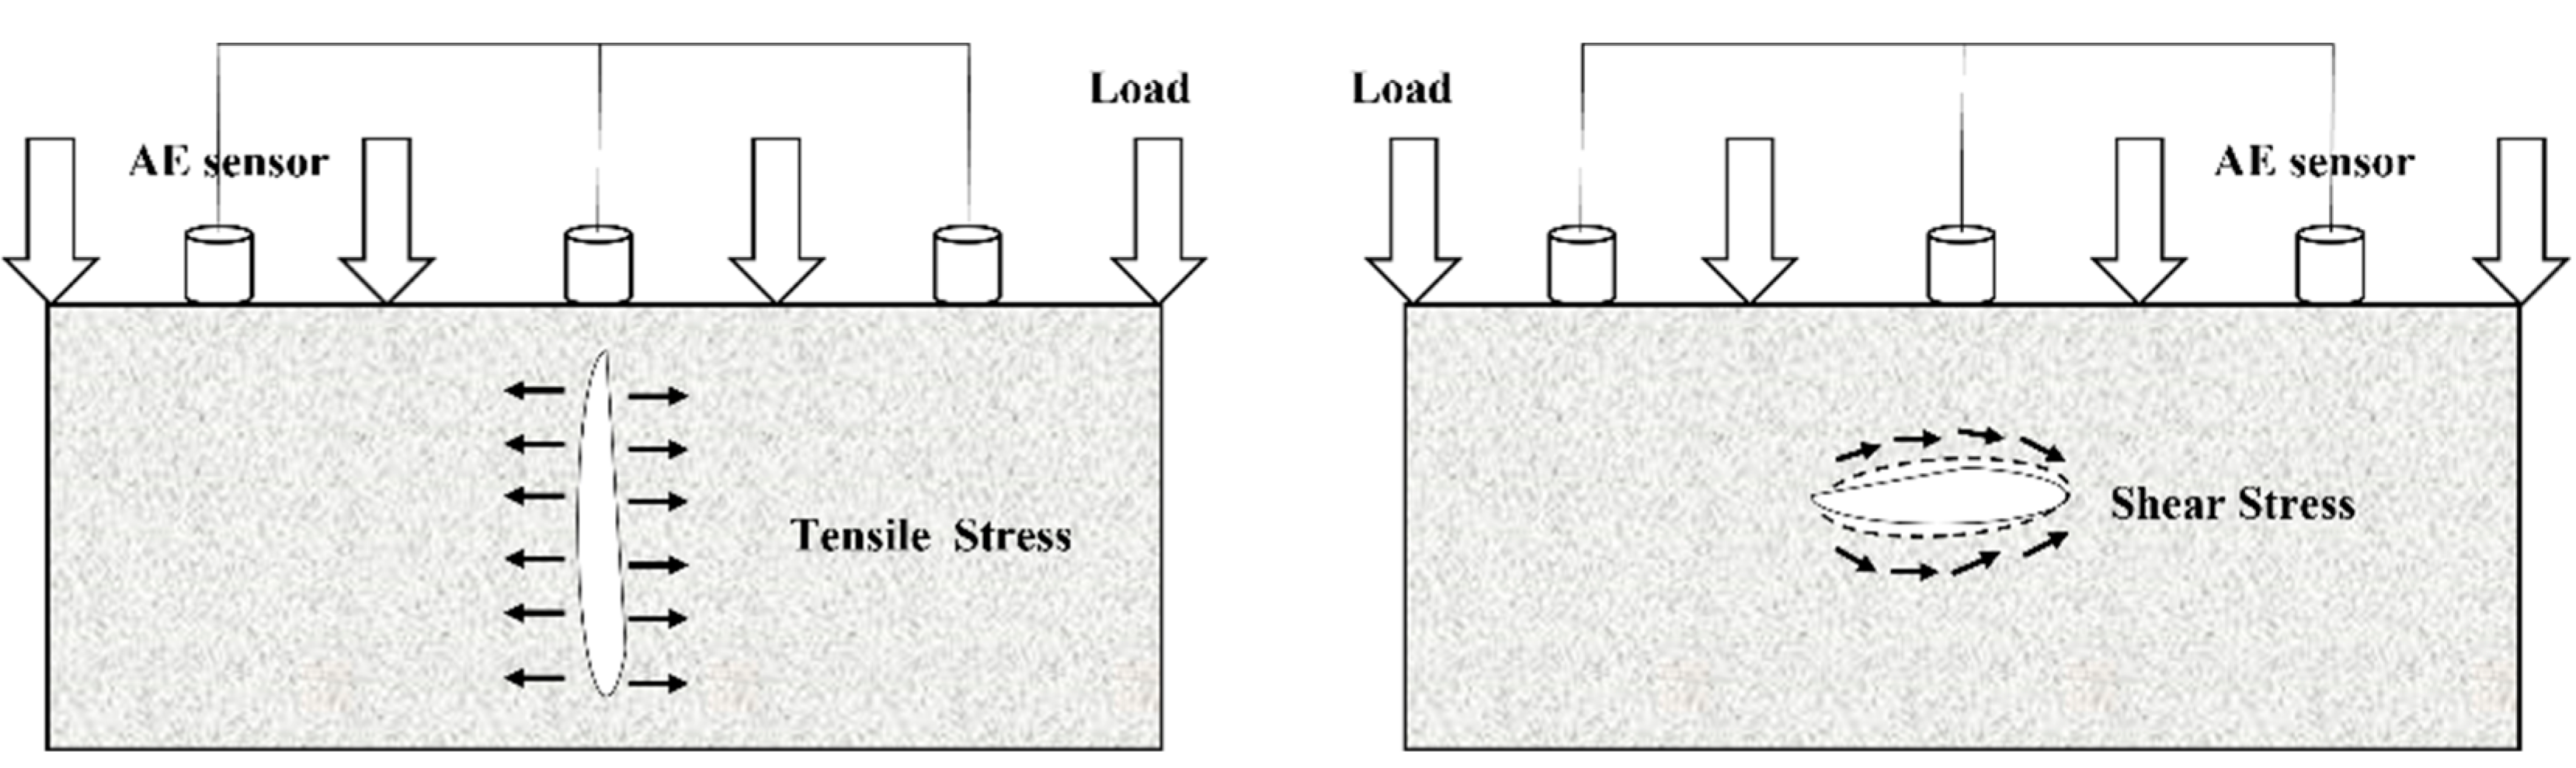
2.3. AE Monitoring System

The monitoring system consists of AE sensors, amplifiers, and data collectors, which can realize multi-channel, high acquisition frequency, and full-waveform data acquisition simultaneously. The response frequency range of the AE sensor is 50–400 kHz, and the input and output impedances are above 10 MΩ and 50 Ω, respectively. Its magnification can be adjusted by 20, 40 and 60 dB. A total of 16 AE sensors in 4 rows are arranged linearly in the longitudinal direction on the outer surface of the cross-section at 45°, 135°, 225° and 315°, respectively, and the arrangement adopts a uniform staggering of adjacent angles, which can ensure the integrity of the acquisition effect. Figure 3 shows the arrangement.

2.4. Data Acquisition System

The data acquisition system was mainly composed of a high-speed data acquisition instrument and a data storage and analysis computer. A 16-channel data acquisition system was used to synchronously collect the AE signals and the load of the pressure tester. This system has the highest sampling frequency of 10 MHz, a 16-bit A/D converter, and an input signal voltage range of ±5 V. AE data and load data is transmitted to the host control computer via a shielded cable, which can display the load-deformation curves, and load-time curves in real-time.

3. Full-Scale Loading Test

3.1. Experimental Procedure

This experiment was developed in accordance with the American Standard Specification for Concrete ASTM-C118M and the Chinese Test Method for Concrete and Reinforced Concrete Drainage Pipe (GB/T-16752-2017), and adjusted according to practical reality. The load when a crack of 0.2 mm in width and not less than 30 cm in length appears on the surface of the pipe is defined as the crack load; the maximum load that the pipe is subjected to before it loses its load-bearing capacity is recorded as the failure load.
In this experiment, the crack load and damage load during the loading of the pipe were measured by the three-point external pressure method. Before the test started, the pipe’s crack load and ultimate load were predicted according to the code to determine the graded loading load values; the specific data are shown in Table 2. The experiments were conducted by displacement-controlled loading with a loading speed of 0.1 mm/s, and the loading process was graded loading for 1 min per level of load retention. Before the experiment started, three preloads and unloads were carried out first—with preload values not exceeding 5% of the crack load—while checking the status of the monitoring equipment and the stability of the loading device.
(1)
After placing the pipe specimens, alignment and leveling were carried out by laser level to prevent the pipe from tipping under the load during the loading process.
(2)
The AE sensor was arranged on the surface of the sample, and the contact zone between the sensor and the amplifier was coated with the coupling agent. The AE sensor was arranged on the surface of the sample, and the contact zone between the sensor and the sample was coated with a coupling agent to reduce the attenuation of the AE signal.
(3)
After confirming that the sensor lines were connected correctly, the sampling frequency of the AE collector was set to 3 MHz, the MTS actuator was started, and the AE data collected simultaneously.
(4)
Loading and data acquisition were stopped simultaneously when transverse through cracks appeared in the pipe specimen, and the experiment was ended.

3.2. Mechanical Characteristics of the Pipe Load

In this paper, three sets of mechanical loading experiments of reinforced concrete sewage pipes with different pipe diameters were carried out, and the loading curves of the pipes with different pipe diameters are shown in Figure 4. According to the slope of the loading curve and load fluctuation of the pipe, the loading damage process of the pipe can be divided into three stages:
In the line elastic stage (OA stage), the internal pore structure of concrete, the concrete, and the reinforcement skeleton between the pore is compacted and closed under the action of the load. At this stage, the pipe mainly undergoes elastic deformation with a small number of microscopic cracks occurring. With the increase of load, the specimen gradually changes from linear elastic stage to plastic damage stage (AB stage) under the action of the load. In the early phase of this stage, cracks sprout on both sides of the pipe, a large number of cracks steadily expand, and irreversible deformation occurs; at the late stage, a large number of cracks rapidly expand, cross, and gather, and finally form macroscopic large-scale through cracks and reach the damage load. At this stage, due to the intensive frequency of crack sprouting and expansion activities, the slope of the loading curve is significantly lower than that of the previous stage, and the overall loading process is more gentle. After the through damage of the pipe specimen, the specimen enters the residual strength stage (BC stage); at this time, due to the support of the internal steel skeleton, the specimen still has a certain structural strength, and the load does not drop to zero rapidly, but shows a fluctuating downward trend along with a small amount of concrete cracks, and the yielding of the internal steel reinforcement under load, and finally the load drops rapidly to zero due to the shutdown of the hydraulic press.
The loading experimental results of reinforced concrete sewage pipes with different pipe diameters show that the crack load increases with the increase of pipe diameter. The damage load decreases first and then increases; it is non-linear with the pipe diameter, and the pipe cracks load increases with the increase of pipe diameter.

4. AE Signal Analysis and Application

In recent years, acoustic emission technology has been used to detect concrete structural defects, and has achieved good results. The significant advantage of acoustic monitoring is the availability of real-time information on the deterioration rate of the pipe, which can achieve full-cycle, real-time, continuous monitoring of the pipeline service status, greatly improving the operation and maintenance efficiency of the drainage network system. The AE monitoring technique can be applied to reinforced concrete applications such as bridges, viaducts, dams, and buildings [10,11,12,13,14,15,16].

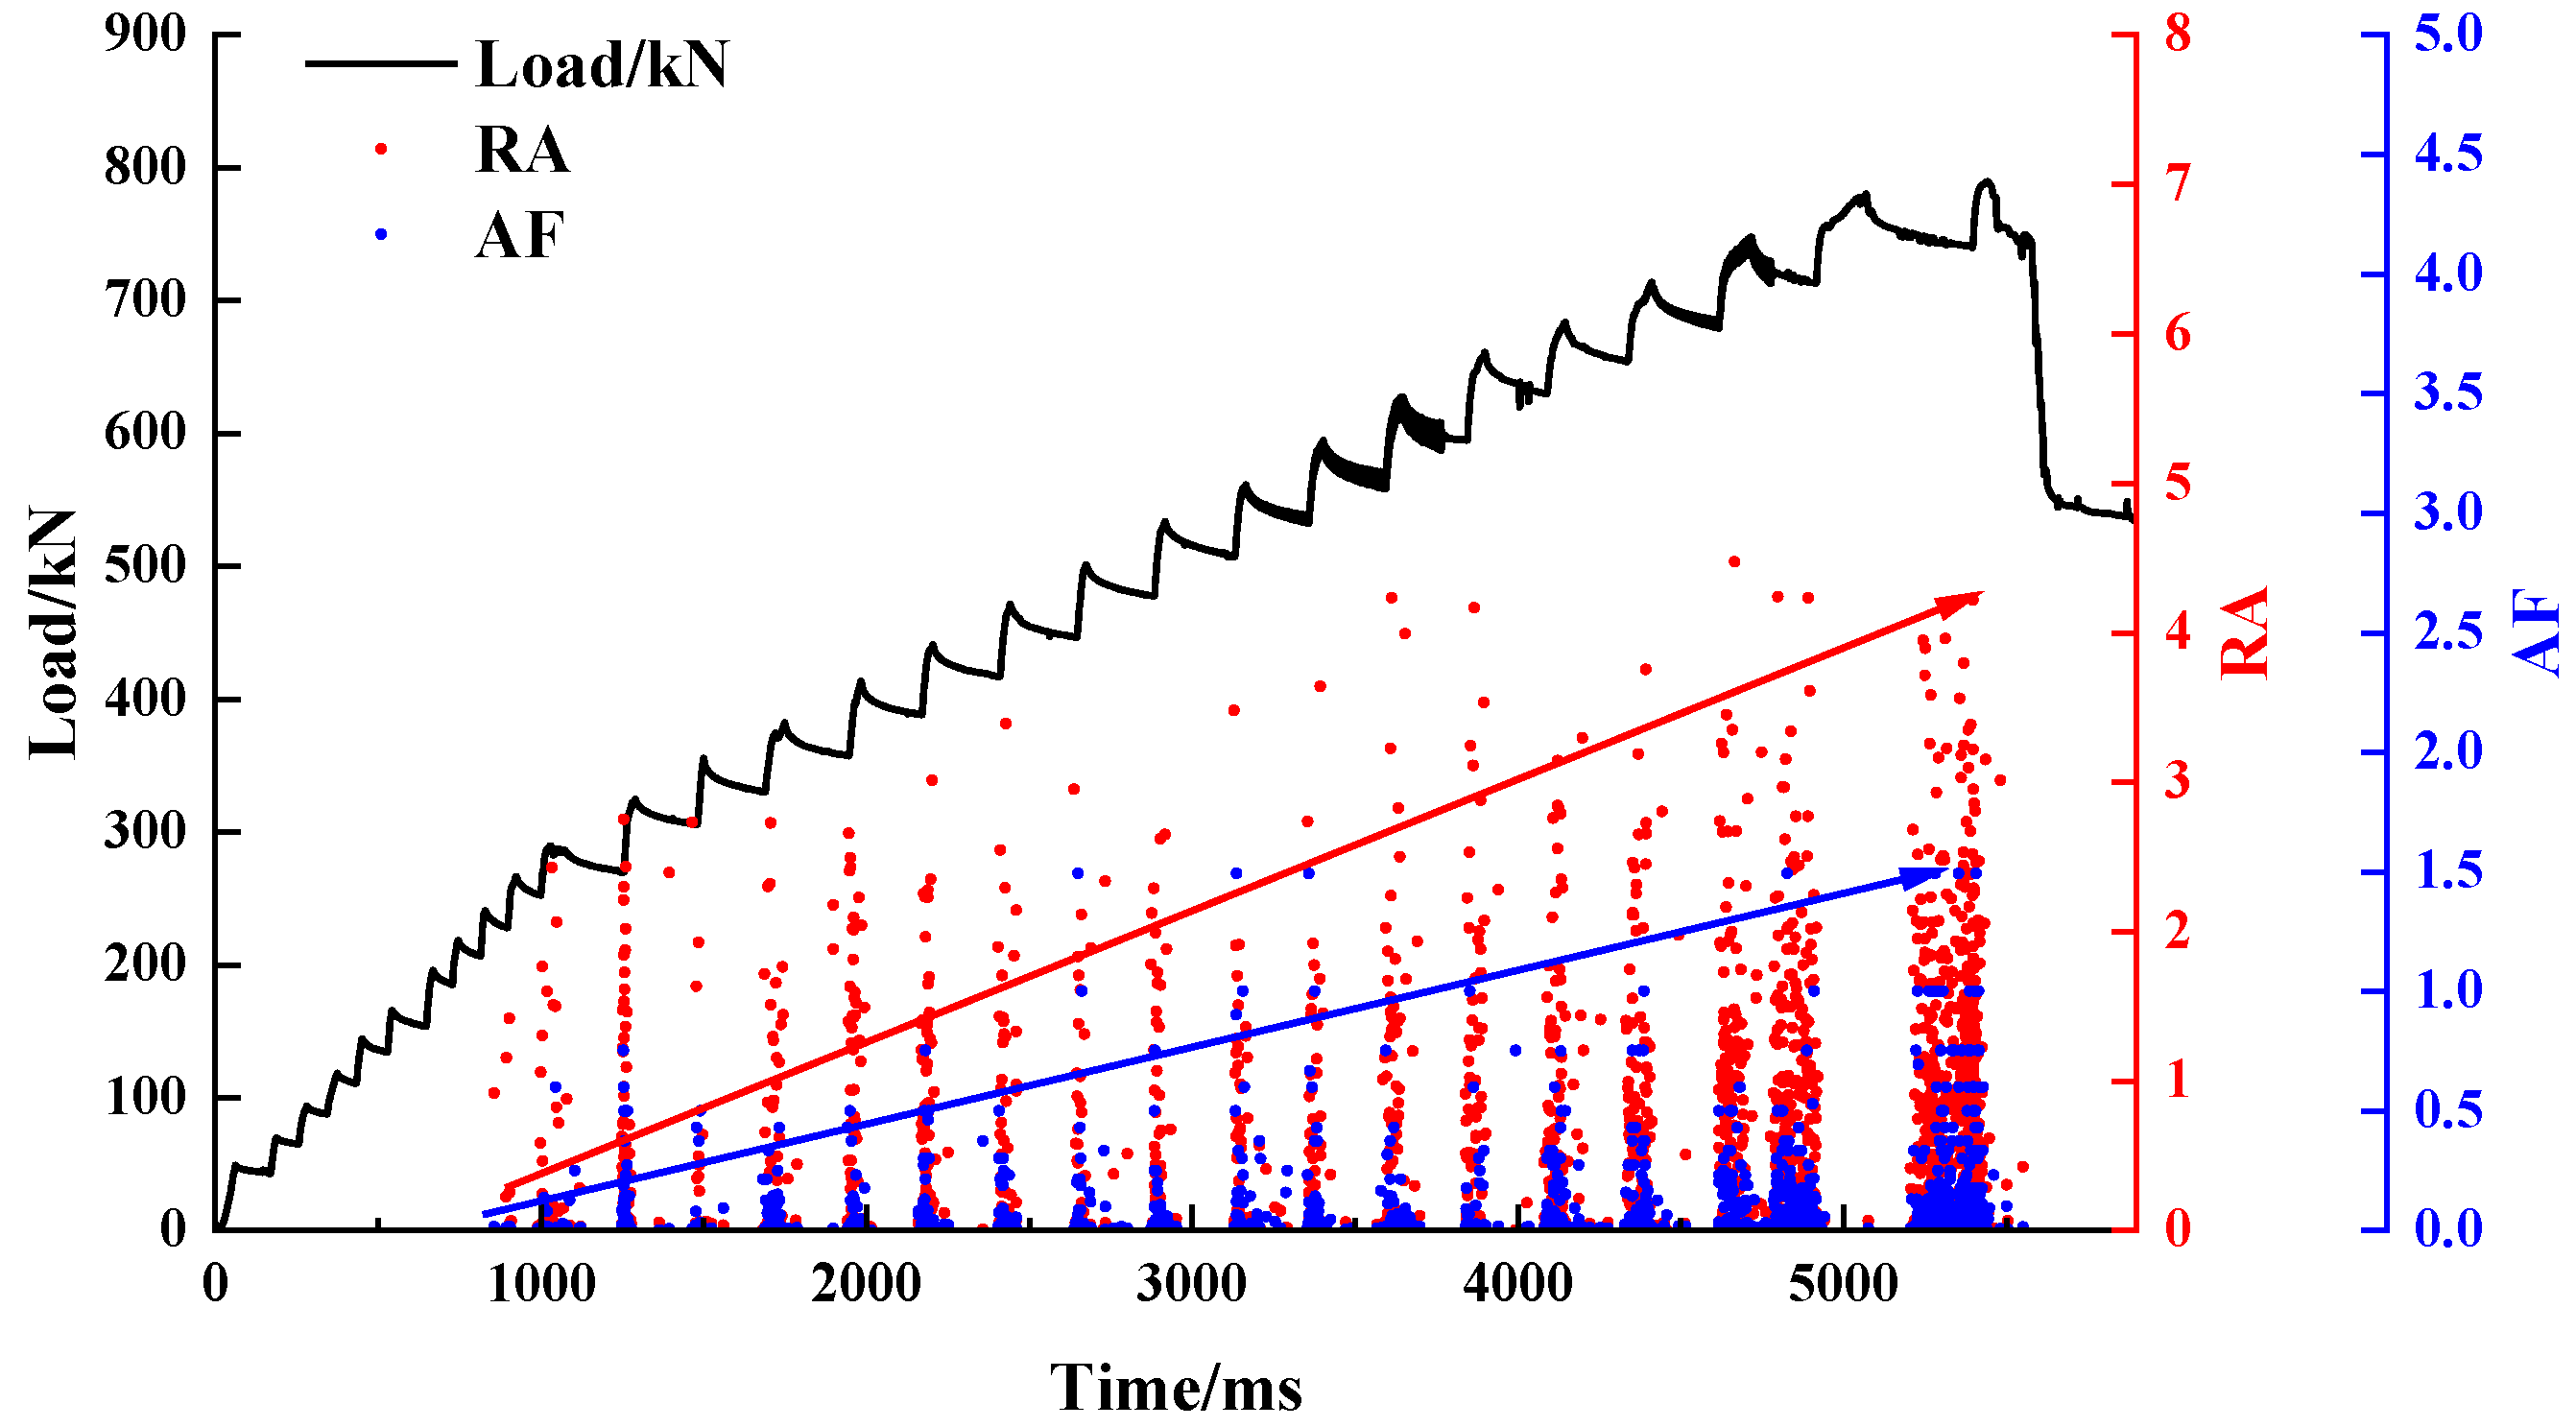
4.1. AE Energy Evolution during the Loading Process

Since the experimental results are similar, the following loading experiment on a reinforced concrete sewage pipe with 1500 mm pipe diameter is selected to analyze the mechanical response law of the AE signal.
Figure 5 shows the characteristic curves of AE signal response during the concrete sewage pipe loading process. In the online elastic compression stage (OA), the AE signal is sparse, and the amplitude presents a low level overall due to the fewer damage activities occurring inside the specimen. With the increase of the load, the pipe loading enters the plastic damage stage (AB), many cracks expand and develop, irreversible plastic damage occurs, and cracks are still generated in the load retaining stage. The internal structure of the specimen continuously undergoes “destabilization–equilibrium–destabilization”, and the load shows simultaneous fluctuation changes. When the load reaches the peak load level, the specimen cracks accumulate and penetrate the main damage—and the load decreases significantly—then the AE amplitude reaches the peak. When the sample enters the post-load peak stage (BD), the failure degree of the sample is gradually reduced, and the amplitude of the AE signal gradually decreases until it finally disappears altogether.
The generation of AE signals is closely related to the deformation and damage of materials. AE signals can effectively characterize the internal damage and damage degree of concrete materials, and AE energy, as one of the basic parameter indicators, can reflect the material damage evolution process in real-time. The cumulative AE energy reflects the superposition of the material structure damage on the time series. The more severe the material damage, the faster the cumulative AE energy increases, and the greater the slope of the curve. The response curves of AE energy and cumulative energy versus load during the pipeline loading process are shown in Figure 6. It can be found that the evolution trend of the cumulative AE energy curve corresponds to the characteristics of each loading stage of the pipeline specimen, and the AE energy is excited in a cluster in the time domain. When the specimen is loaded into the plastic damage stage, the number of AE activities triggered by internal damage activities is significantly increased, and the energy level of the AE signal changes synchronously with the loading process, showing a gradual step-up trend. In the residual strength stage, the AE energy and cumulative energy curves rise rapidly when the peak load is reached, after which the AE energy starts to decrease until it finally disappears along with the decrease in the number and degree of damage activities. After the peak load is reached, the cumulative AE energy stops rising and remains stable.

4.2. AE Energy Release in the Process of Stress Change

Figure 7 shows the AE activity curves corresponding to the two loading activities in the plastic damage stage. It can be found that the generation of the AE signal in the loading process of the full-scale pipe is closely related to the loading state of the pipe, and whether the pipe is stressed or not is a necessary condition for the generation of the AE signal; however, the change of the loading state of the pipe is the direct cause of the generation of the AE signal. In the two-load loading process shown by the black frame line, the cumulative acoustic emission energy curve also climbs while the load gradually increases. When the load stopped increasing at t2 and t4, the cumulative AE energy curve also tended to be stable synchronously. When the load is in the holding stage, the pipeline is still under pressure, but the acoustic emission signal disappears, and the cumulative acoustic emission energy curve tends to be stable.
The pipe is subjected to a load level of 426 kN at the t > t4 stage and 454 kN at the t2–t4 stage, and the load level is increased by 6.5%; the raw AE activity is in the calm period at both stages, and the AE signal count and energy are both 0, which further indicates that the generation of the AE signal is not related to the load level to which the specimen is subjected. The change of load (stress) is the direct cause of AE signal generation.
In order to quantitatively study the evolutionary characteristics of the AE signal and the amount of load variation in the pipe specimen, statistical and correlation analyses were performed on the amount of load variation ΔF, the accumulated AE energy ∑E, and the maximum value of single AE energy Emax during the 18 loading activities in the plastic damage stage. The statistical characteristics are shown in Figure 8. The Figure 9 shows the correlation coefficients between the two indicators; the direction of the oval shape represents positive and negative, and the color is the corresponding coefficient correlation.
The above phenomenon proves that the AE energy index and cumulative AE energy index can effectively characterize the loading stage and damage degree of the full-scale pipe, and the AE energy and cumulative AE energy can directly reflect the change of stress in the pipe specimen, which can monitor the damage process of the pipe.

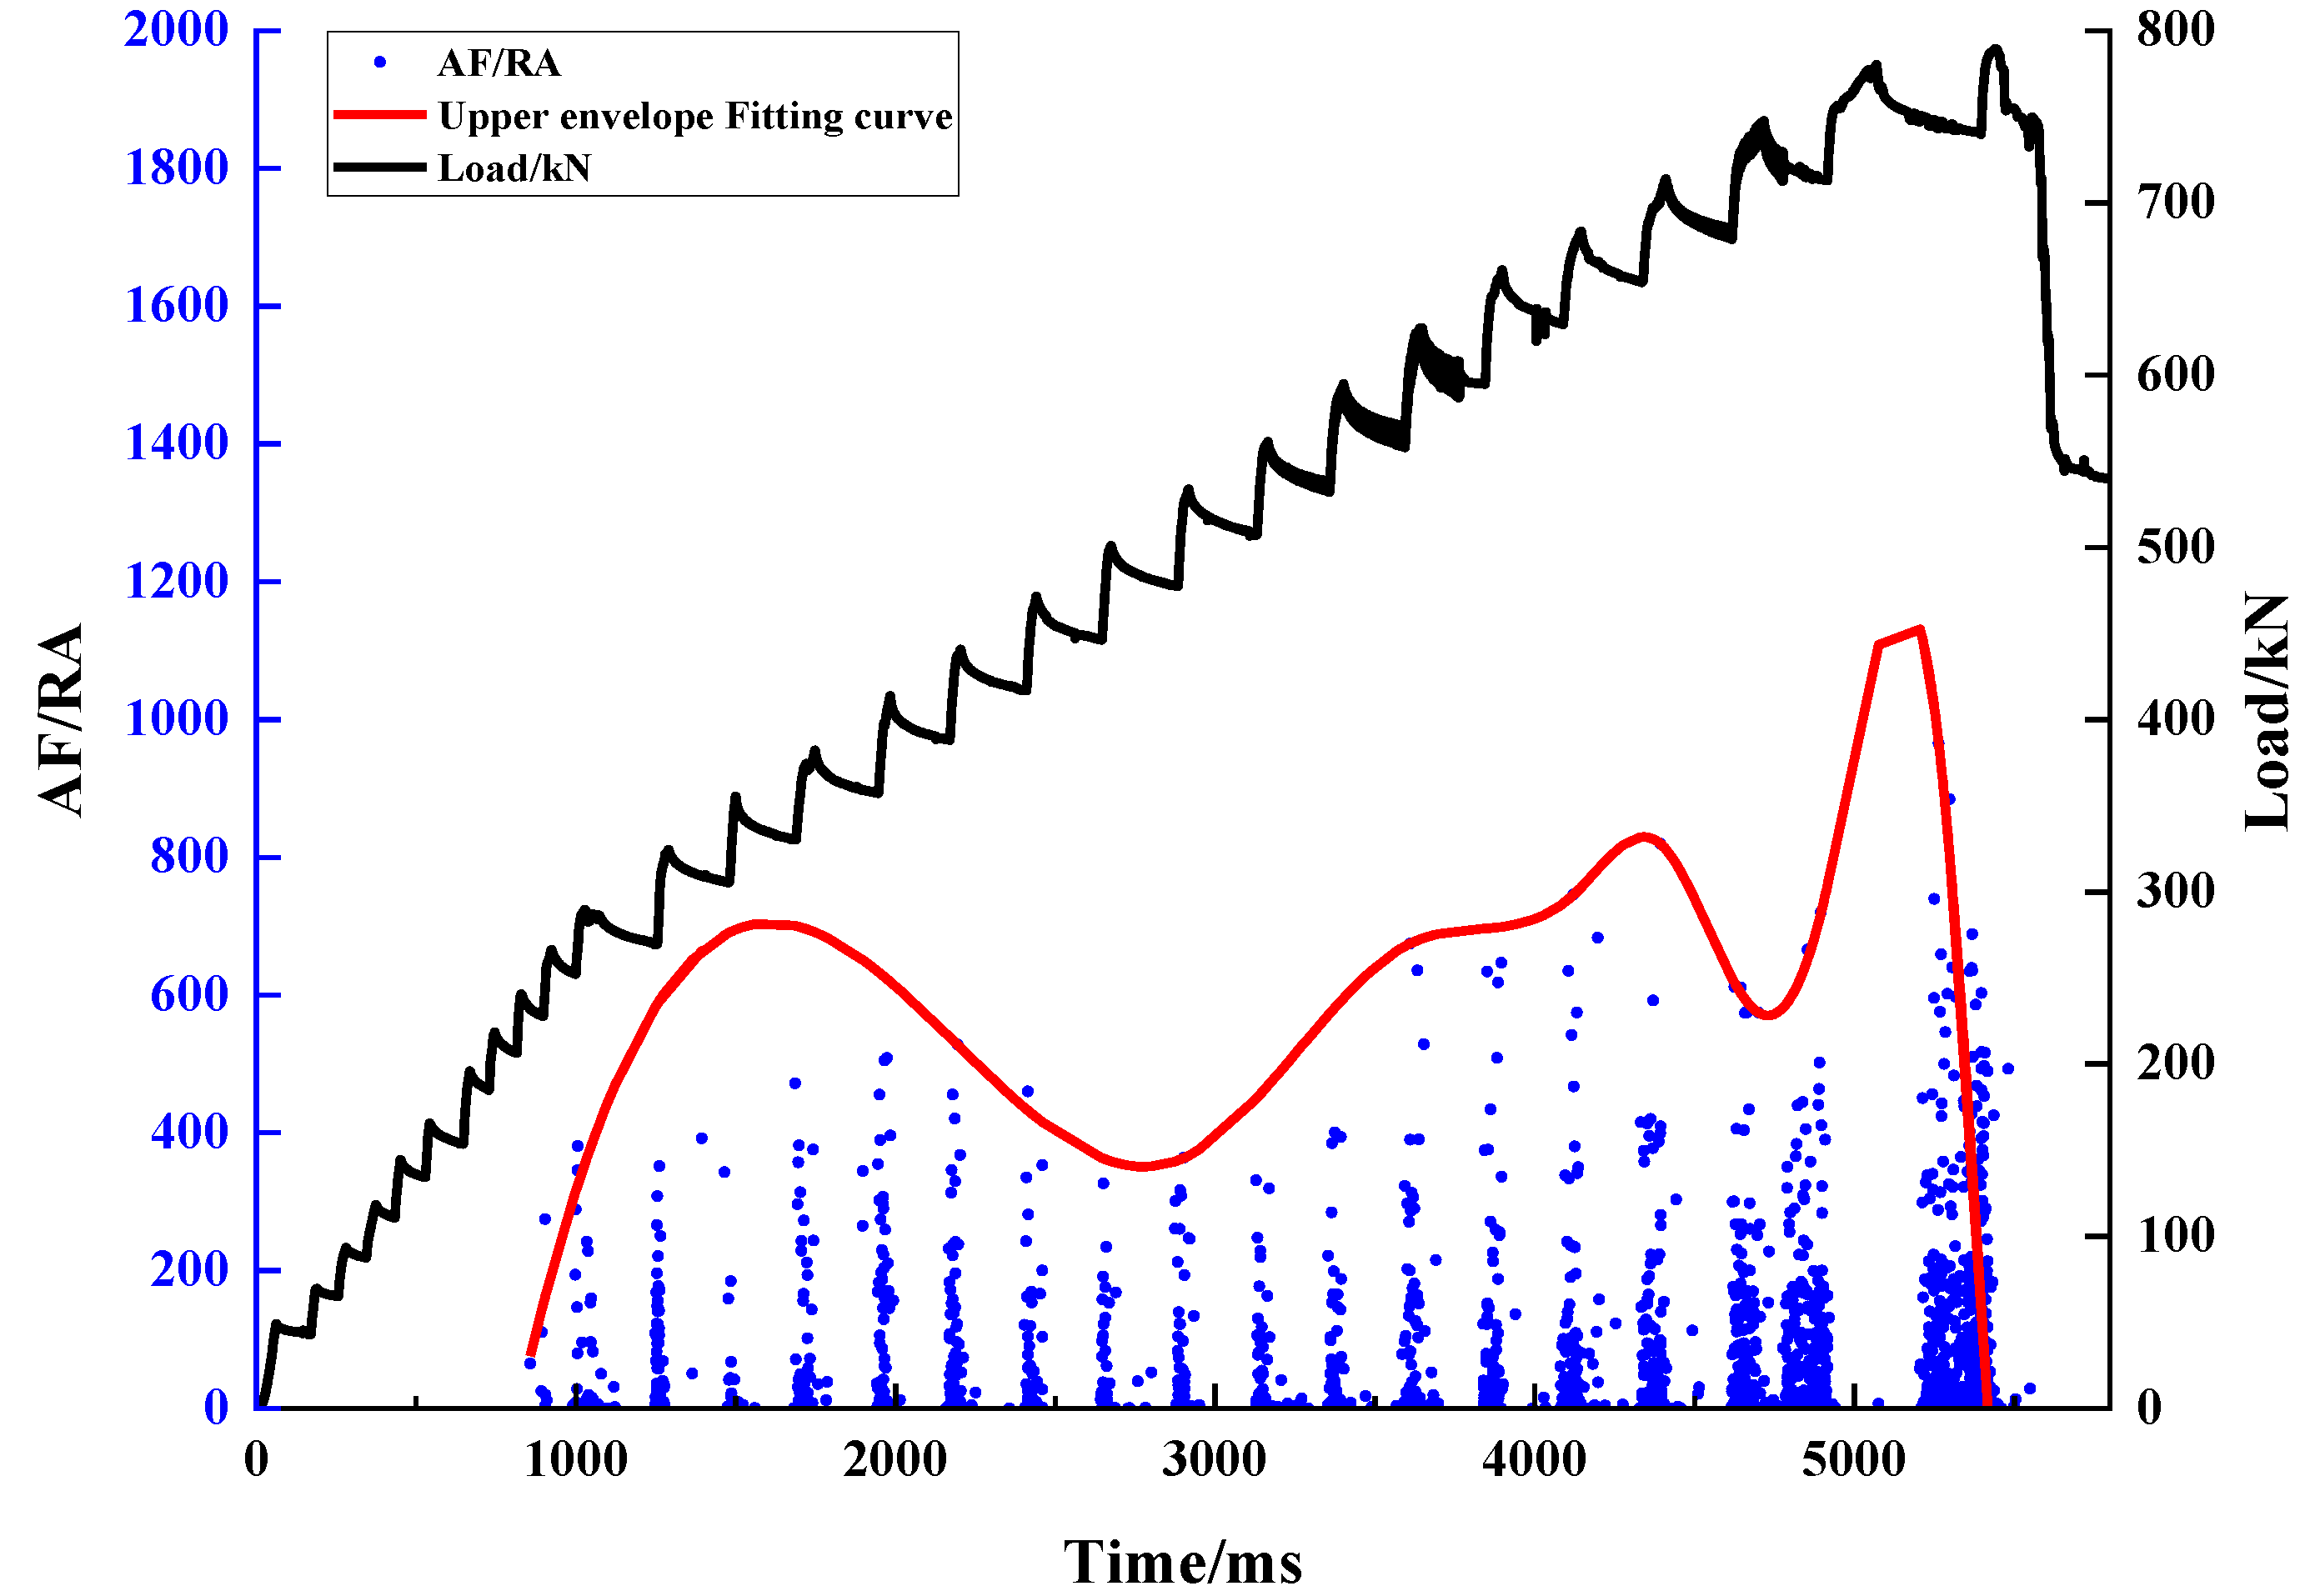
4.3. AE Energy Parameters for Pipeline Damage Identification

Many studies have shown that the number of shear rupture activities will increase significantly when the specimen approaches the destabilization stage in the experimental processes of the rock triaxial compression test, cubic compression test with cracks, strain-type rock explosion, and the specimen damage process [17,18,19,20,21,22,23,24,25,26,27,28,29]. However, tensile fracture is the main failure mode in concrete bending and barite direct tensile tests. AE parameter analysis is a basic method to identify the type of structural damage, and its basic parameters are shown in Figure 10. Moreover, many researchers have found that the relationship between RA and AF can effectively characterize the type of concrete structural damage [30,31,32,33]. The RA value (rise angle) and AF value (average frequency) can be calculated by the following formulas:
RA = RT/A
AF = C/D
where RT is the rise time, A is the maximum amplitude, D is the duration of an AE waveform, and C is the total number of threshold crossings for an AE waveform.
When the ratio AF/RA is small, shear damage mainly occurs in the material; when the ratio AF/RA is large, tensile-type damage mainly occurs, and the difference in the damage mechanism is the fundamental reason for the significant difference between the AF and RA ratios. During the pipe loading process, the expansion and development process of the pipe cracks on the side walls were marked according to the time series at the same time, as shown in Figure 11. The cracks on both sides of the pipe gradually sprouted, expanded, and developed in the plastic damage stage, and the crack form was mainly transverse cracks at this stage. As the loading proceeds, longitudinal cracks begin to appear, but the overall the number of longitudinal cracks is significantly lower than that of transverse cracks. When the load reaches the pipe’s damaged load, many transverse cracks expand and connect. After calculating and analyzing the AF and RA parameters of the AE signal during the loading process of the pipe, the evolution characteristics of RA and AF parameters during the loading process of the pipe were plotted as shown in Figure 12. In the pipeline linear elastic compression loading stage, the AE signal is sparse due to there being less damage and damage behavior of the concrete material at this stage; the RA and AF fluctuate in two intervals of 0–0.5 and 0–3, respectively, and overall, the RA and AF values of the AE signal are generally low. After entering the plastic damage stage, the two indices show the pulse characteristics of the “growth period–quiet period” alternately, which stays synchronized with the changes in the specimen load. The levels of the two indicators increased significantly compared with the previous stage, indicating that frequent structural damage occurred in the pipe during this stage. As the load level increase, the extreme values of the two parameters increase, the AE signal is abundant, and the dense distribution of the two index points increases, indicating that the number and degree of damage activities occurring in the pipeline are increasing.
To further study the damage form of the pipe specimen during the loading process, the characteristic evolutionary curve of the AF to RA ratio was plotted, as shown in Figure 13. The red curve in the figure is the envelope of AF/RA data, and it can be found from the figure that the overall AF/RA shows “bimodal” characteristics during the whole process of pipe loading. Firstly, it increases and then decreases with the increase of the load, and then starts to increase gradually when the load is close to the damage load of the pipe; the first peak corresponds to the critical point of the pipe loading from the linear elastic compression stage to the plastic damage stage, and the second “peak” corresponds to the load reaching the damage load. The appearance of the two peaks indicates the critical point of the transition of the pipeline loading stage and the appearance of the main damage. Therefore, the evolution law of the AF/RA index can effectively characterize and identify the load stage and damage degree of the pipeline, and then realize the monitoring and early warning of the service condition of the pipeline. Many previous experimental studies have proved that when the value of AF/RA is small, the material mainly undergoes shear damage, and when the value of AF/RA is large, the material mainly undergoes tensile damage, schematic diagram of the principle of AE signal to identify crack types is shown in Figure 14. During the pipeline loading process, transverse cracking occurs mainly due to the extrusion deformation of structural units of the pipeline by external stresses, and shear damage occurs at the weak structural surface. The longitudinal cracks appear in the time scale after the transverse cracks sprout; in terms of spatial location distribution, the two ends of the longitudinal cracks must be connected with the transverse cracks in the neighboring areas, and the new cracks expand in the vertical direction from the weak position of the transverse cracks under the action of tensile stress. In terms of the number of cracks, there are significantly more transverse cracks than longitudinal cracks, and the expansion rate of transverse cracks is faster than that of longitudinal cracks. In the plastic damage stage, the development and expansion of transverse cracks mainly occurred in the pipe, and the number of new cracks was significantly reduced. In the online elastic compression stage, the elastic deformation of the concrete material mainly occurs in the pipe. The stress concentration area is formed due to the uneven structure of the pipe surface. The extrusion deformation of each stress unit finally occurs in the weak structural surface with shear damage forming transverse cracks, and the AF/RA value of the AE signal is generally small; with the increase of the load, the resulting fine-scale transverse cracks are subjected to tensile stress and start to expand and crack continuously. The maximum value of AF/RA corresponds to the same time as the crack load; after entering the plastic damage stage, a large number of new transverse cracks are generated in the early stage, and the value of AF/RA( the ratio of AF to RA )starts to increase. After entering the plastic damage stage, a large number of new transverse cracks are generated in the early stage, and the AF/RA value starts to decline. When the load reaches the failure load of the pipe, the crack completely penetrates under the action of shear stress, making the pipe lose its load-bearing capacity. Through the observation of the crack category, number, and sequence of cracks in the foot pipe loading experiment, it is shown that AF/RA can effectively characterize the damage mechanism of the whole process of pipe loading in real-time, and the “double peaks” presented in the loading process correspond to the crack load and failure load of the pipe loading.

5. Conclusions

This study proposes an acoustic emission-based method to identify the damage to pipelines using the designed full-scale loading test. The main results are as follows:
(1)
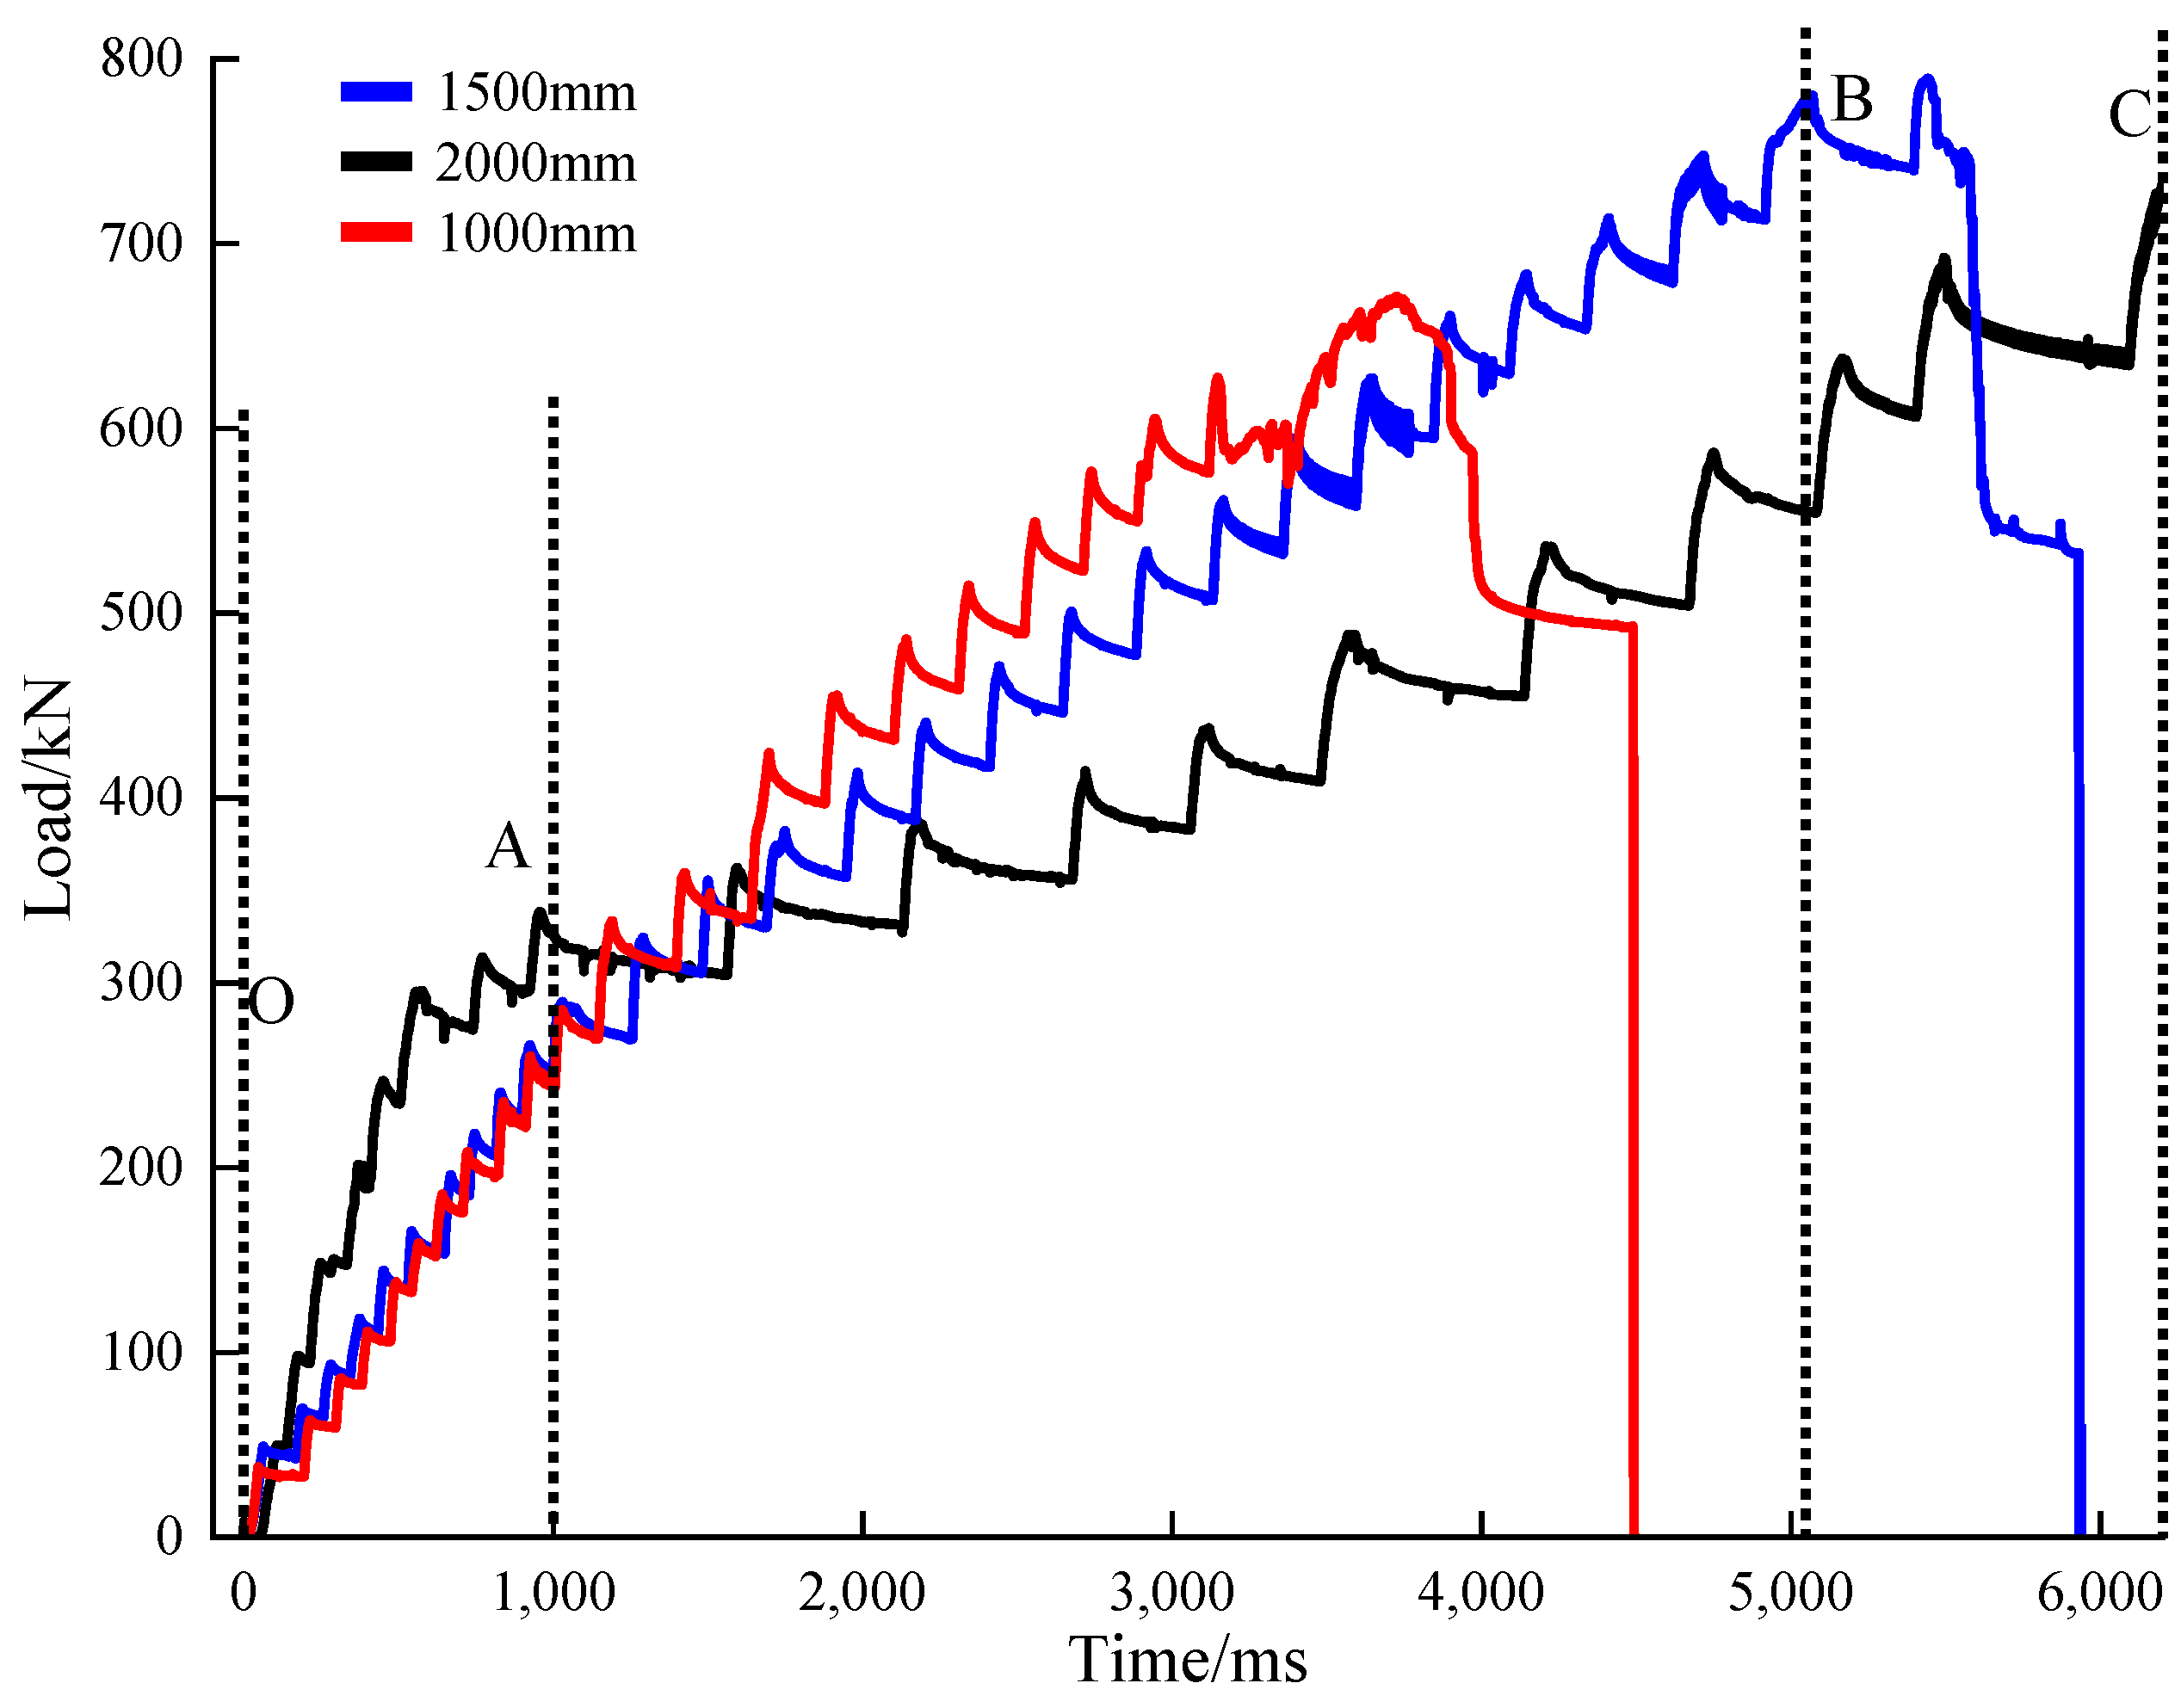
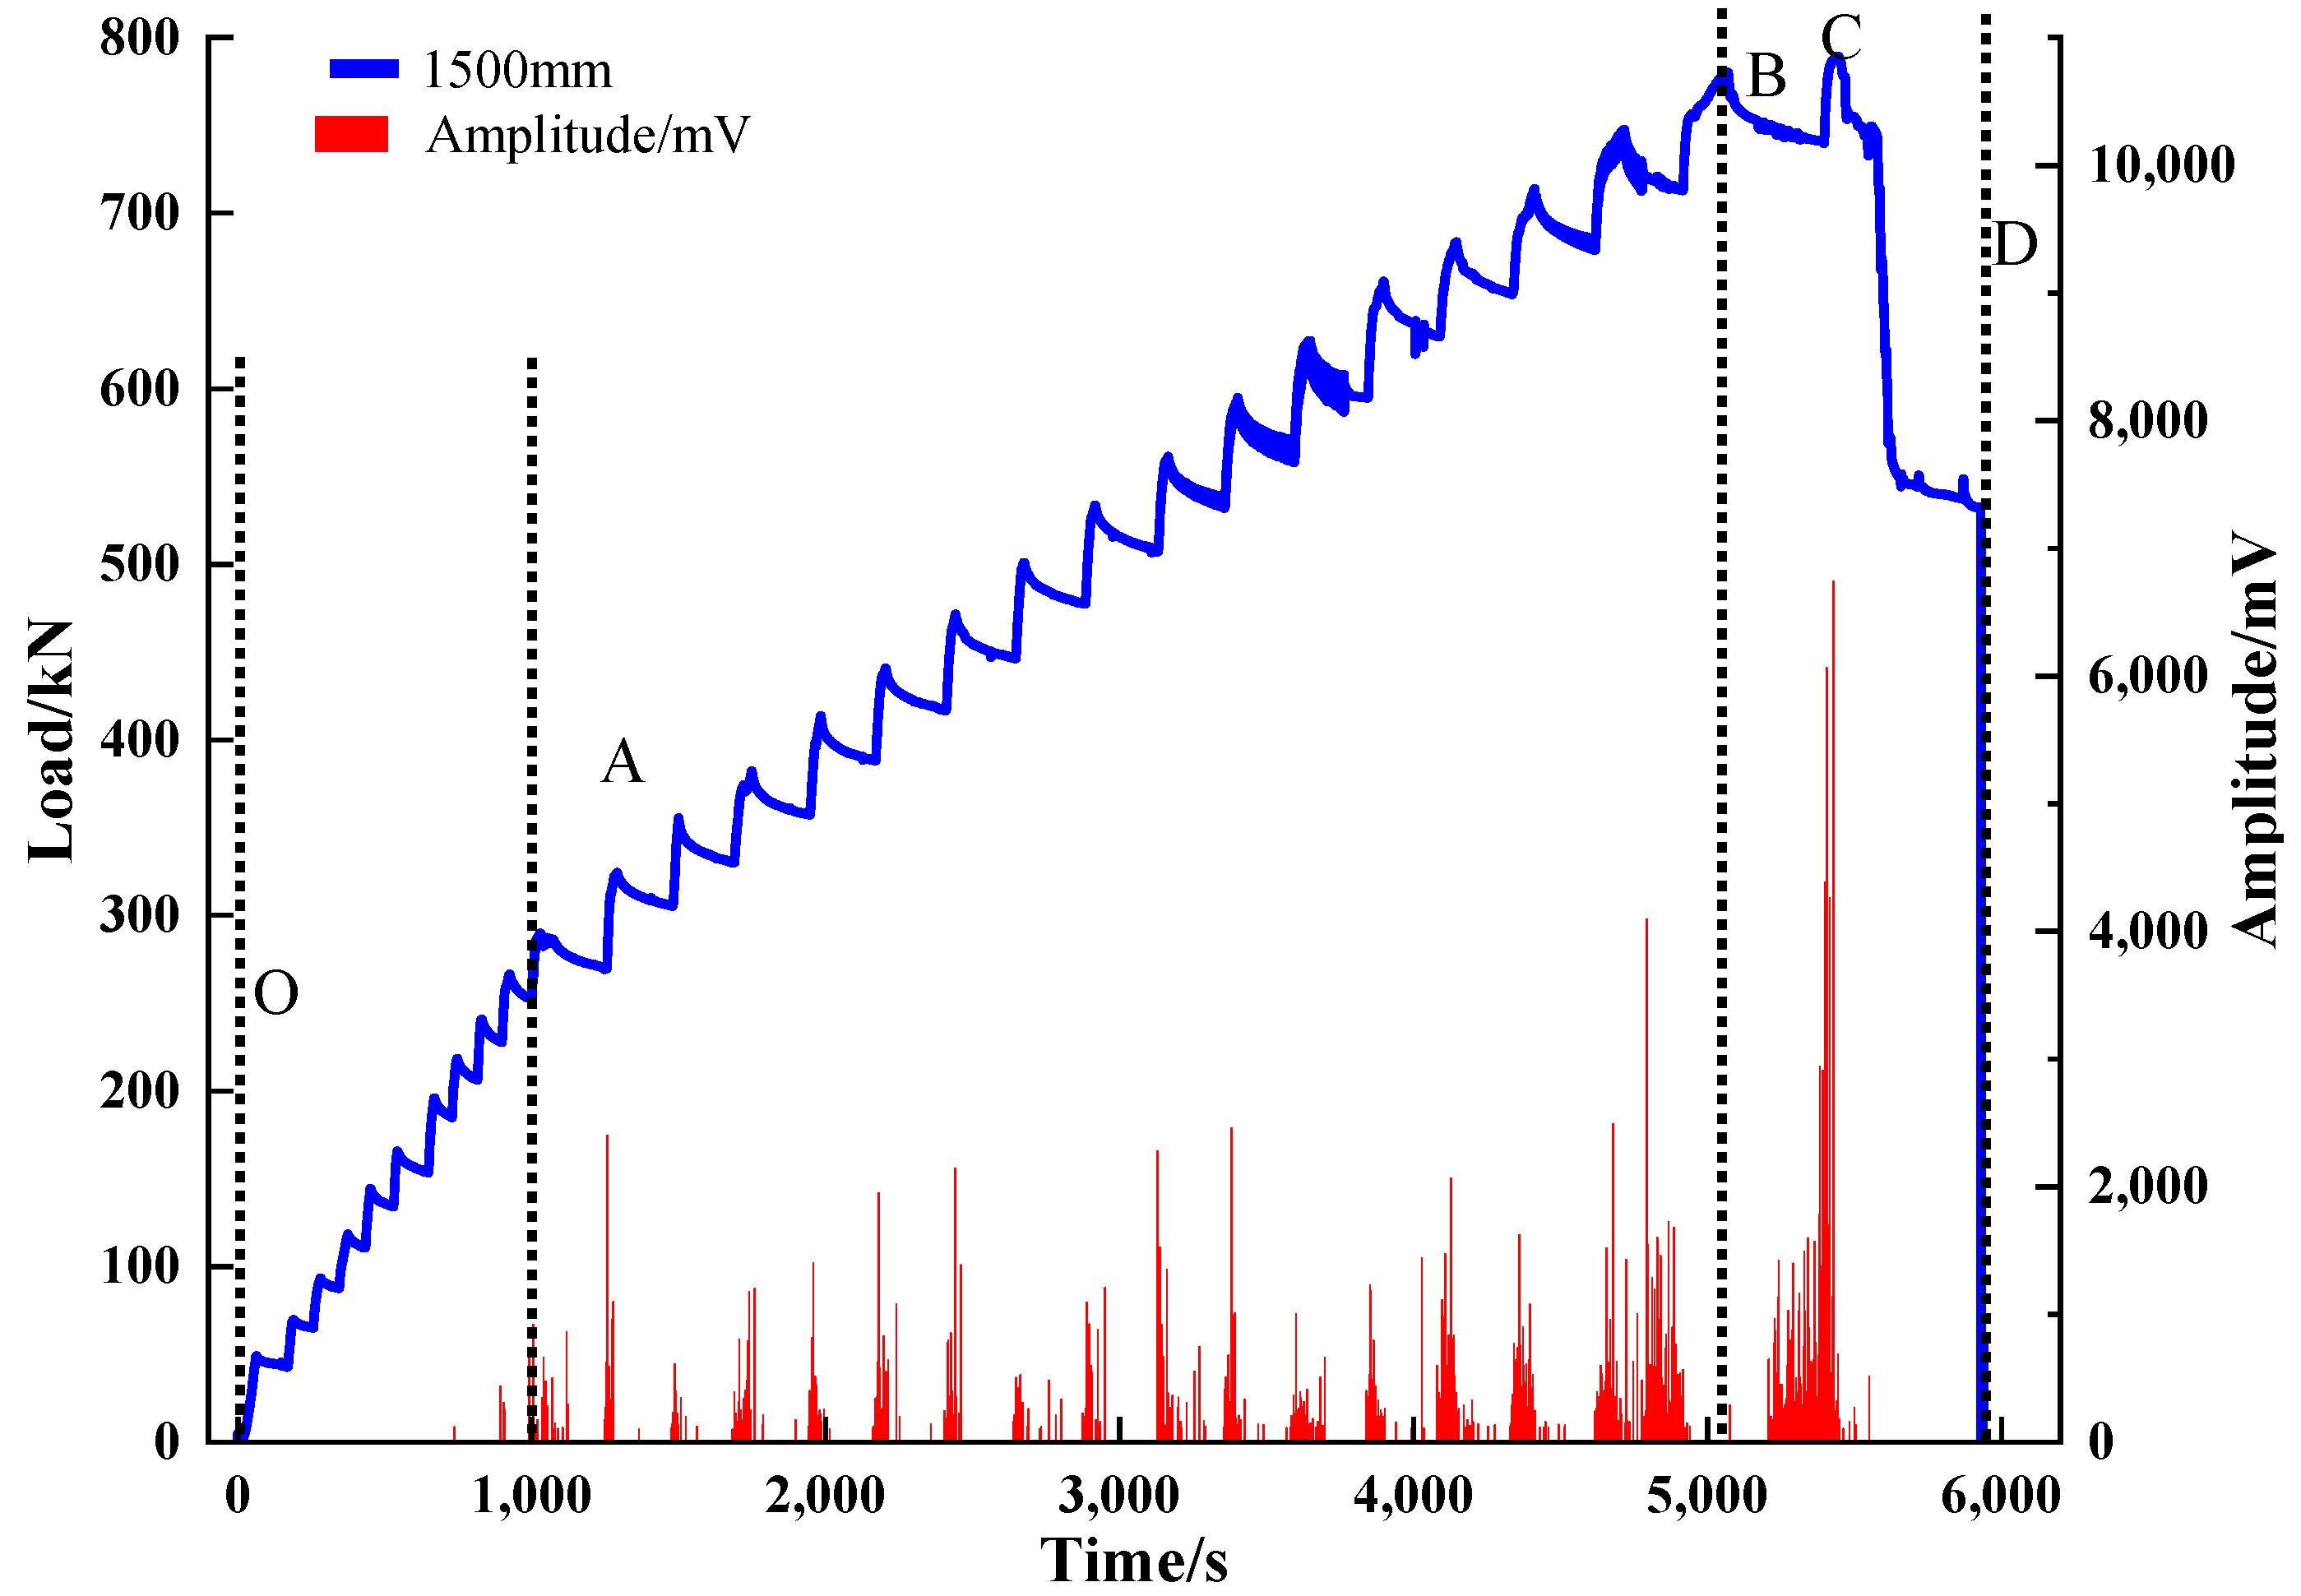
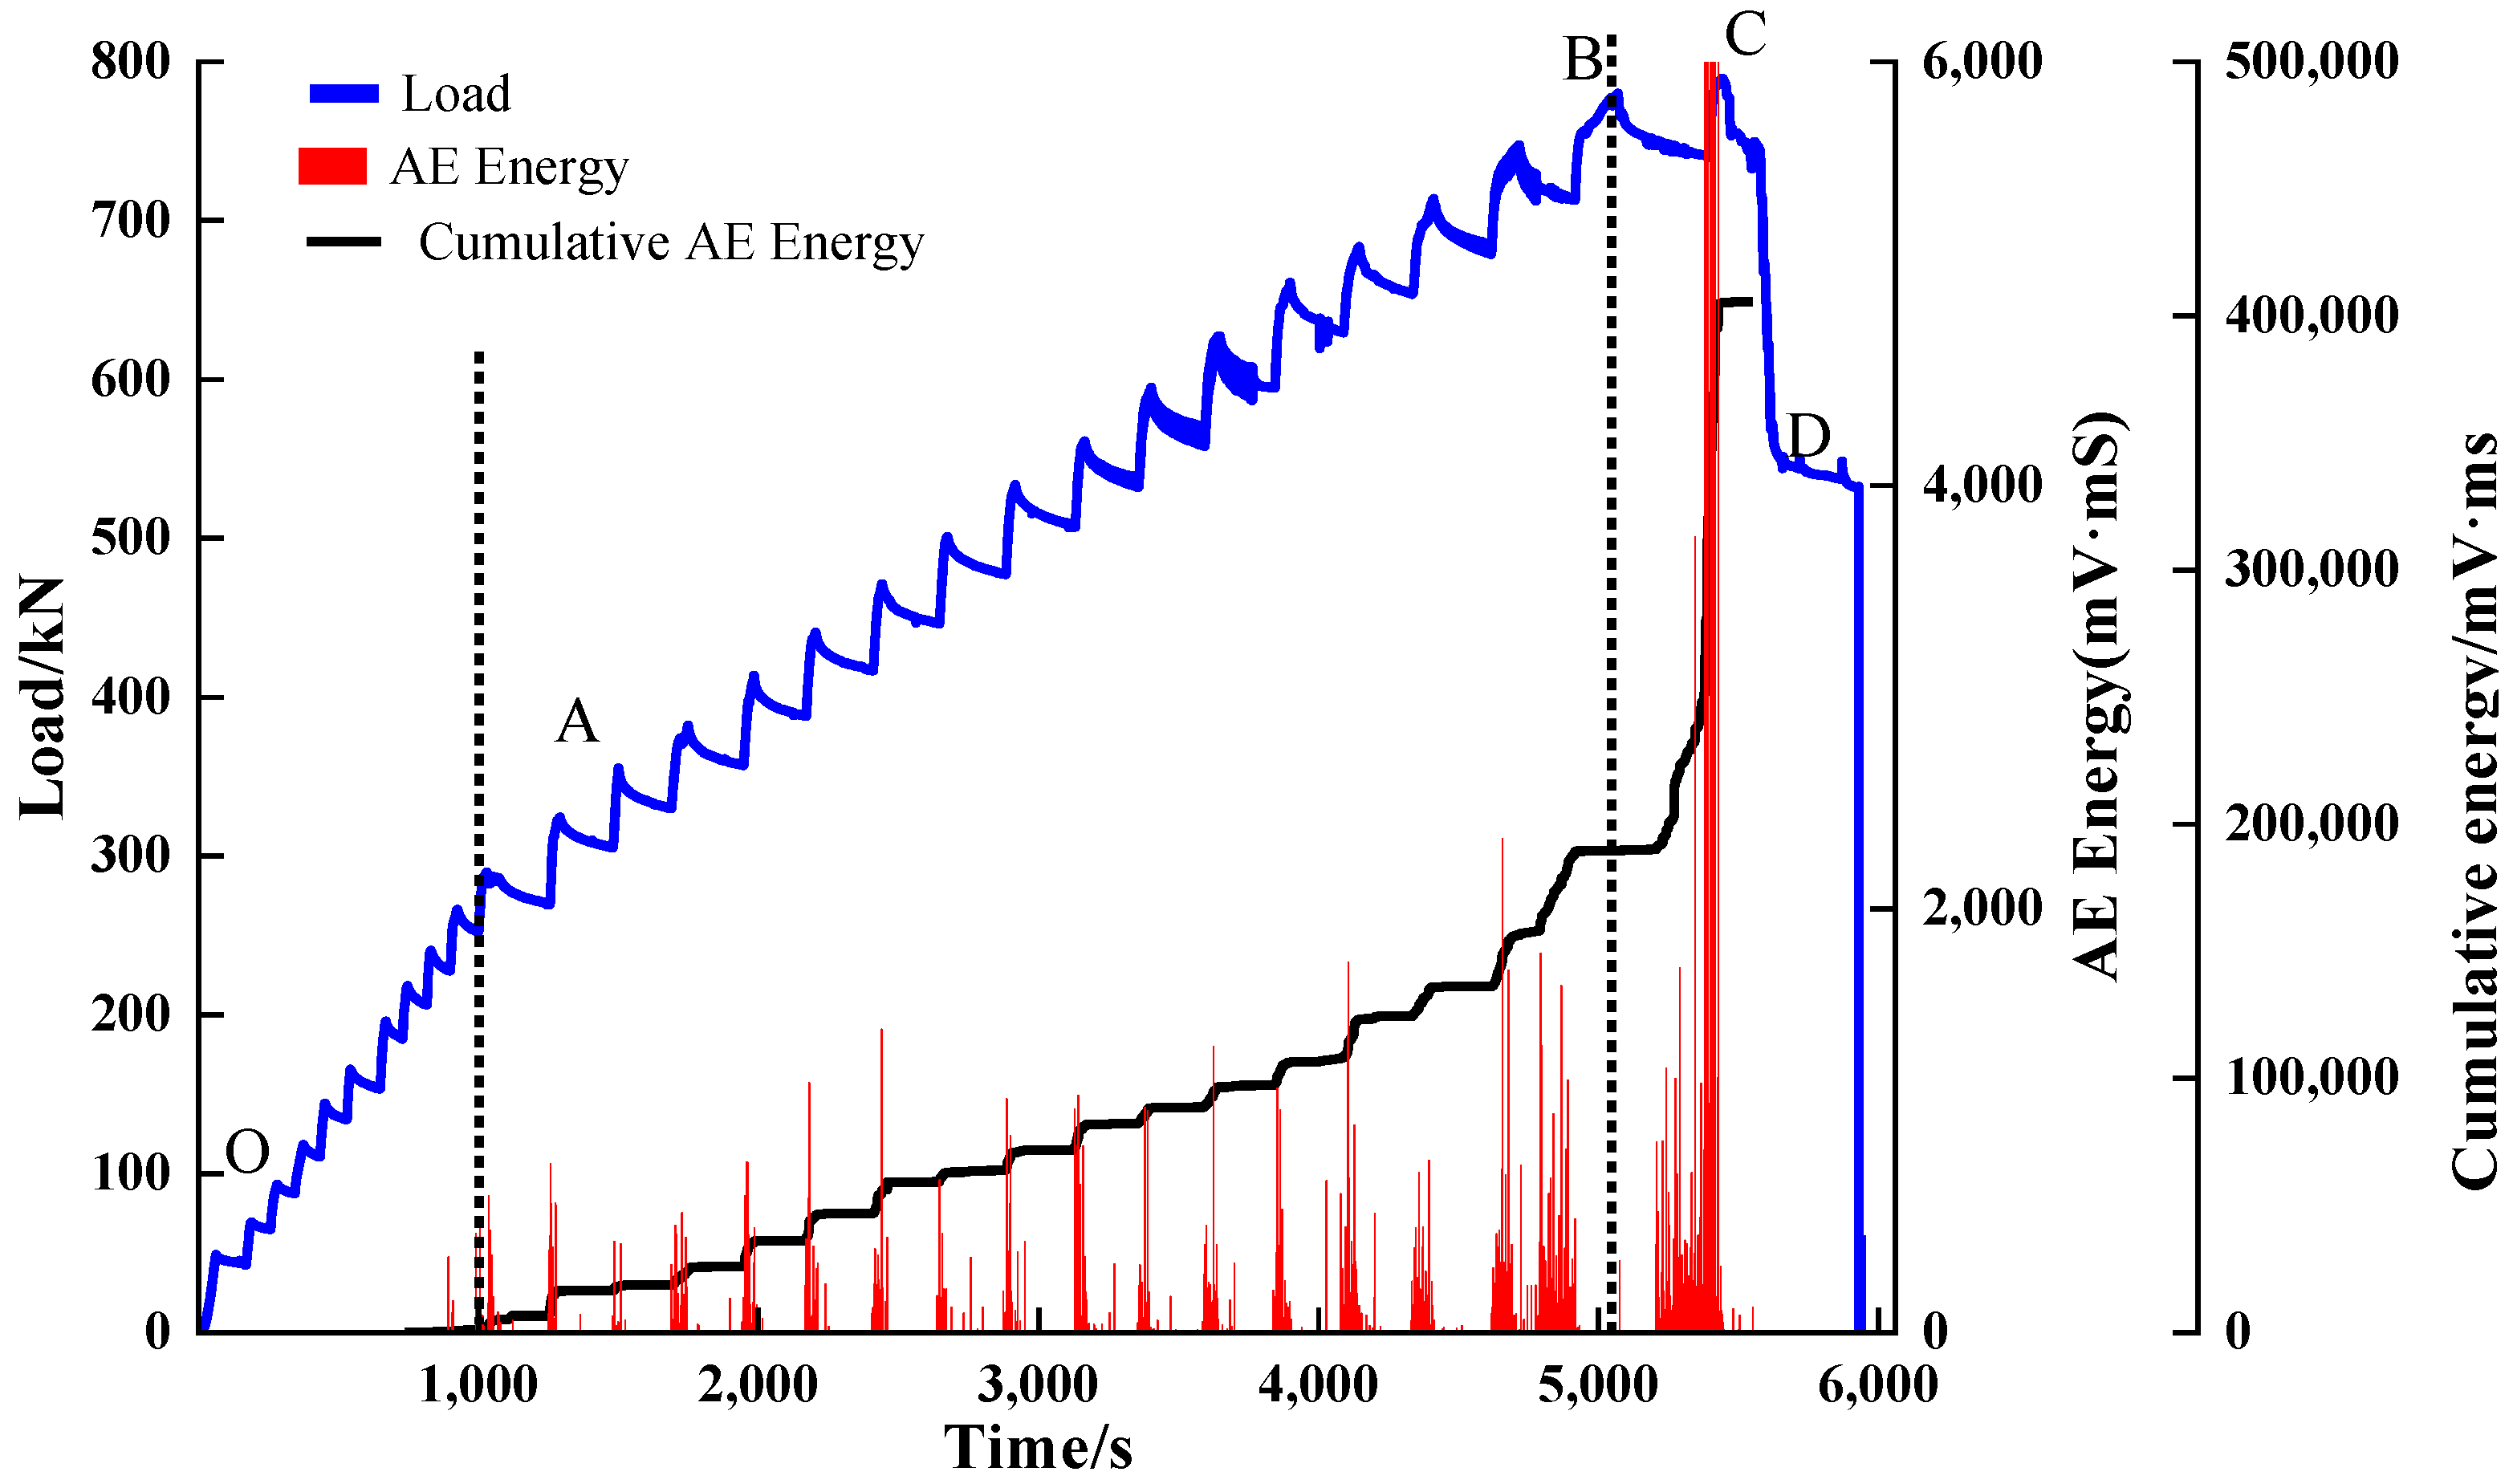
Reinforced concrete sewage pipe will produce different AE signal characteristics in the different loading processes. The loading can be divided into three stages. In the online elastic compression stage (OA stage), the concrete undergoes elastic deformation with less structural failure, while the AE signal is relatively calm. In the plastic damage stage (AB stage), the cracks sprout and expand, and the number of AE activities triggered by internal structural damage increases significantly; AE energy increases with the increase of the damage degree. In the residual strength stage (BC stage), the AE signal and cumulative energy rise sharply when the load reaches the damage load, and then gradually decrease.
(2)
The generation of the AE signal during the loading process is closely related to the changes in the loading state of the pipe; the generation of the AE signal is not related to the size of the load it is subjected to, but the change in load (stress) is the direct cause of the generation of the AE signal. In the loading stage (the amount of load/stress change), the AE signal appears, the cumulative AE energy curve begins to rise, and in the load retention stage (load/stress change is 0), the AE activity enters a quiet period, the AE signal energy drops to 0, the cumulative AE signal energy stops rising to maintain a stable state.
(3)
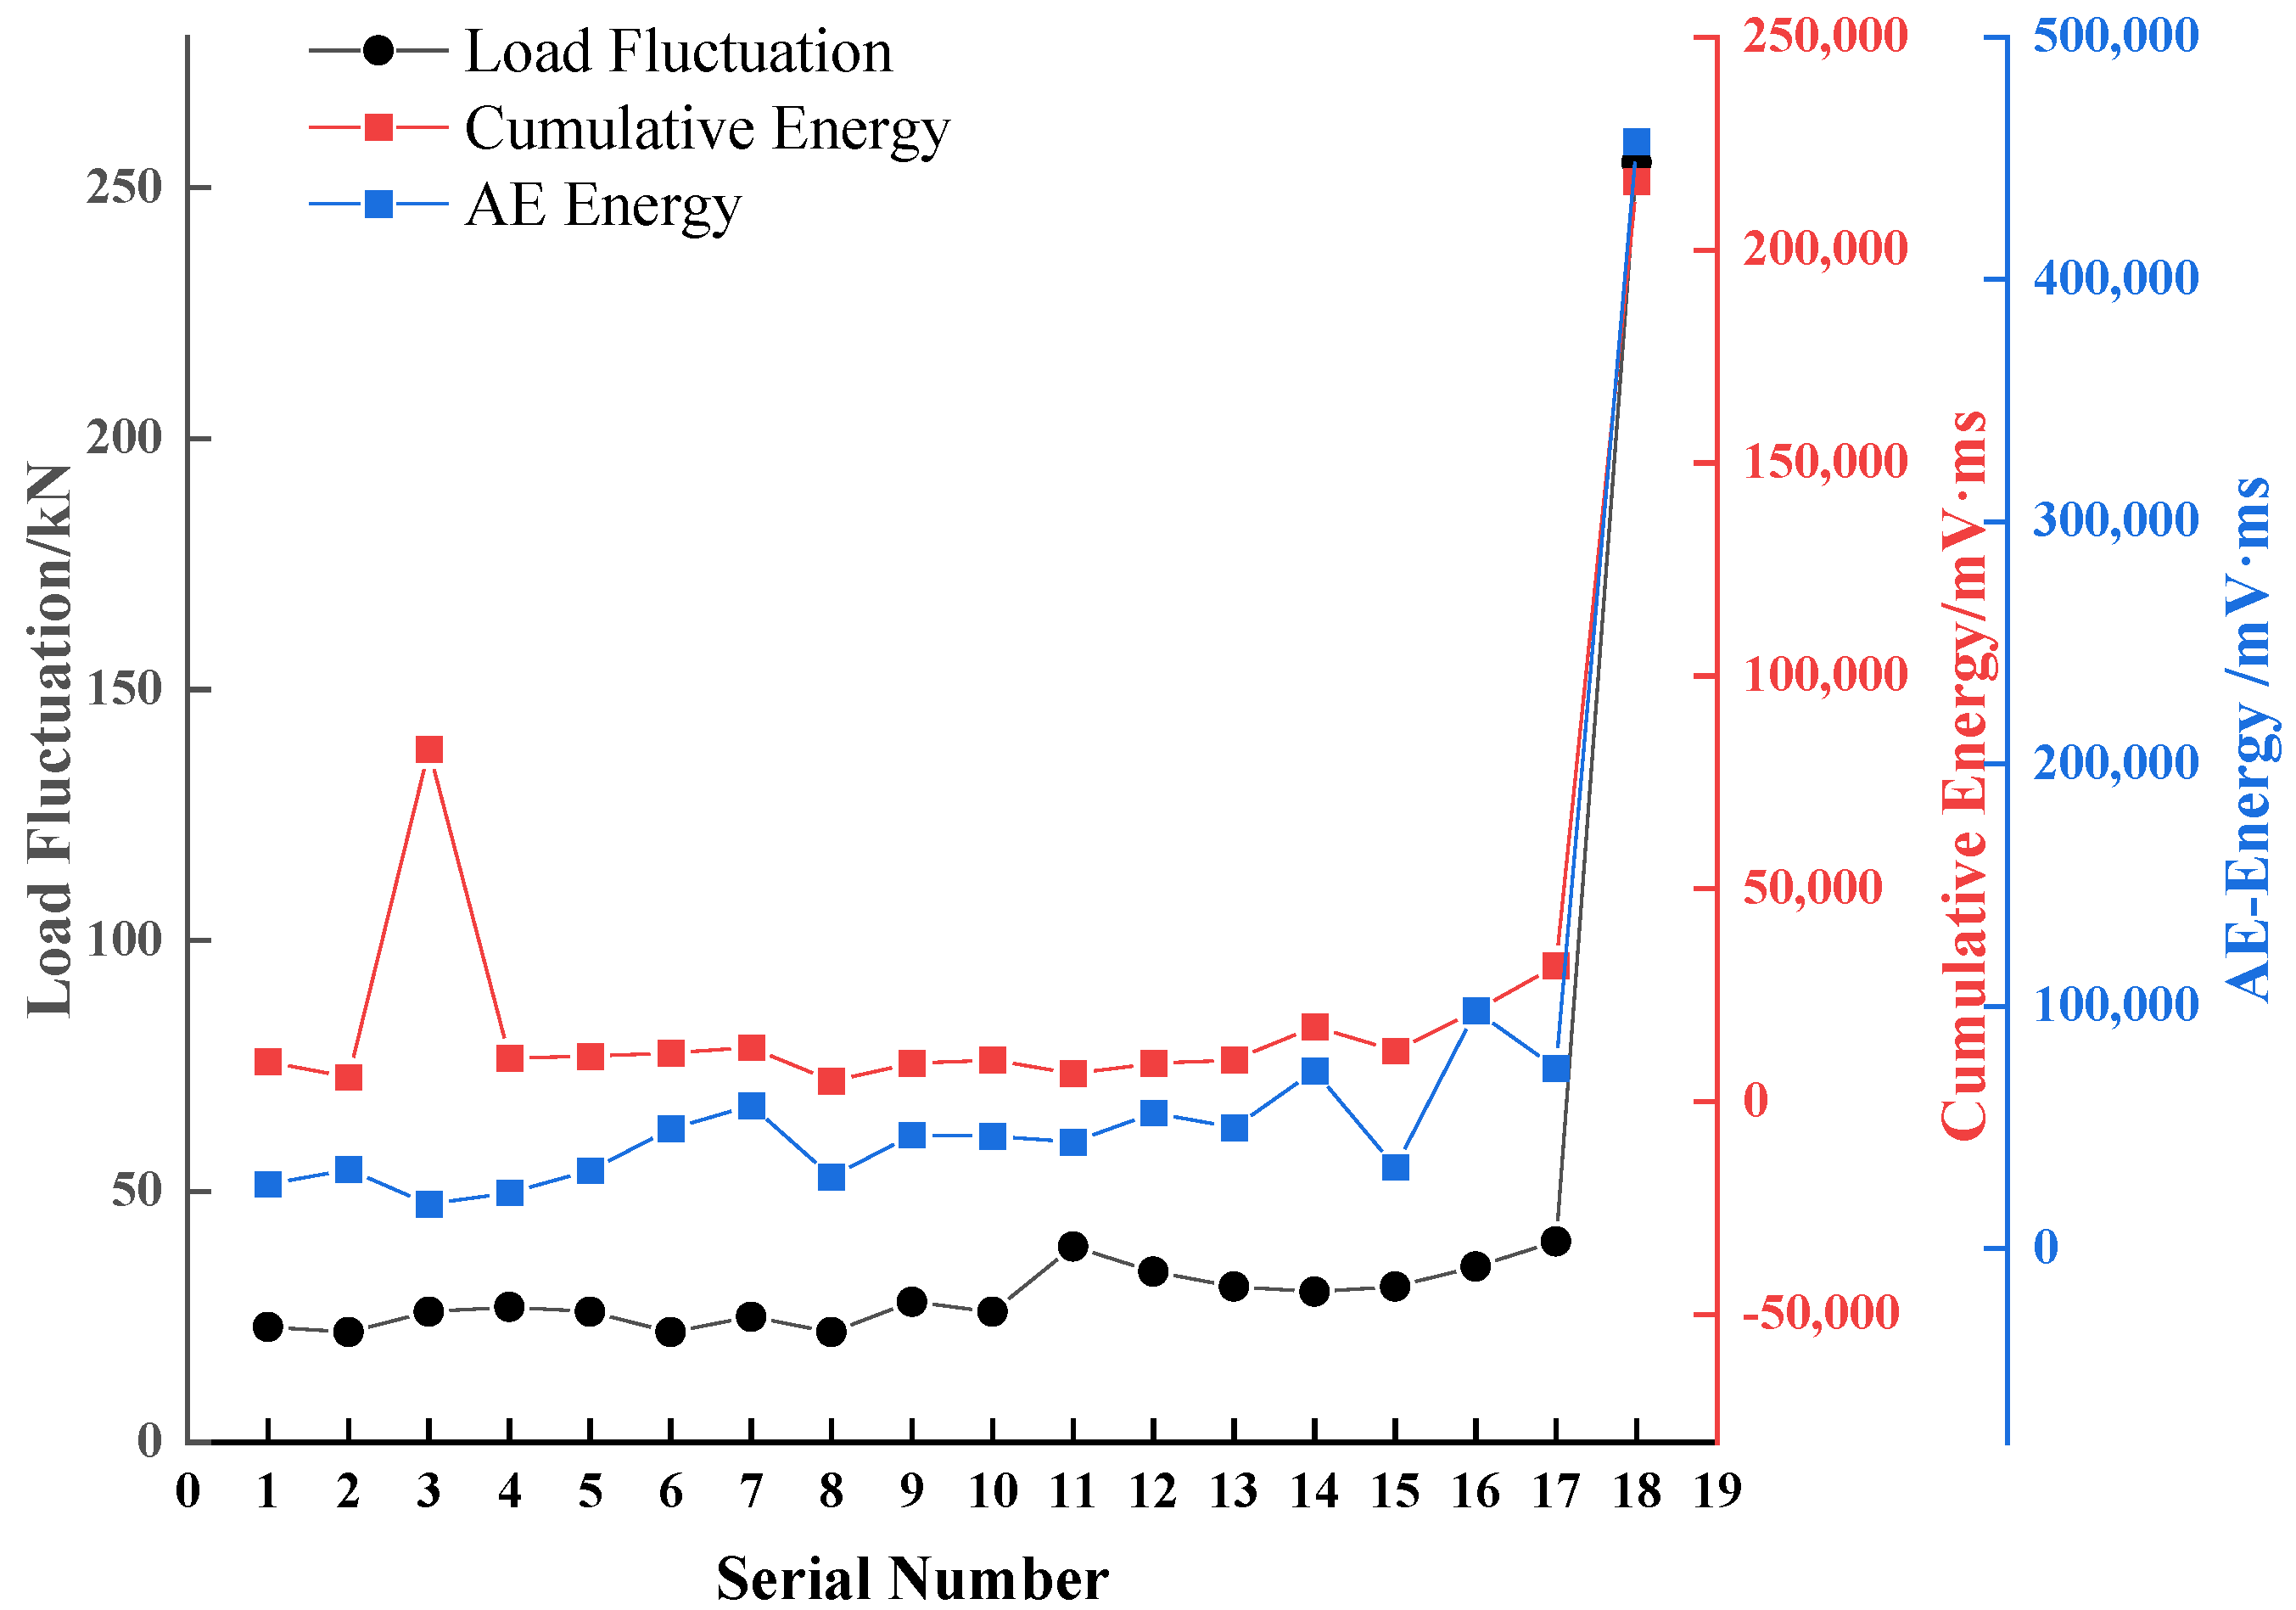
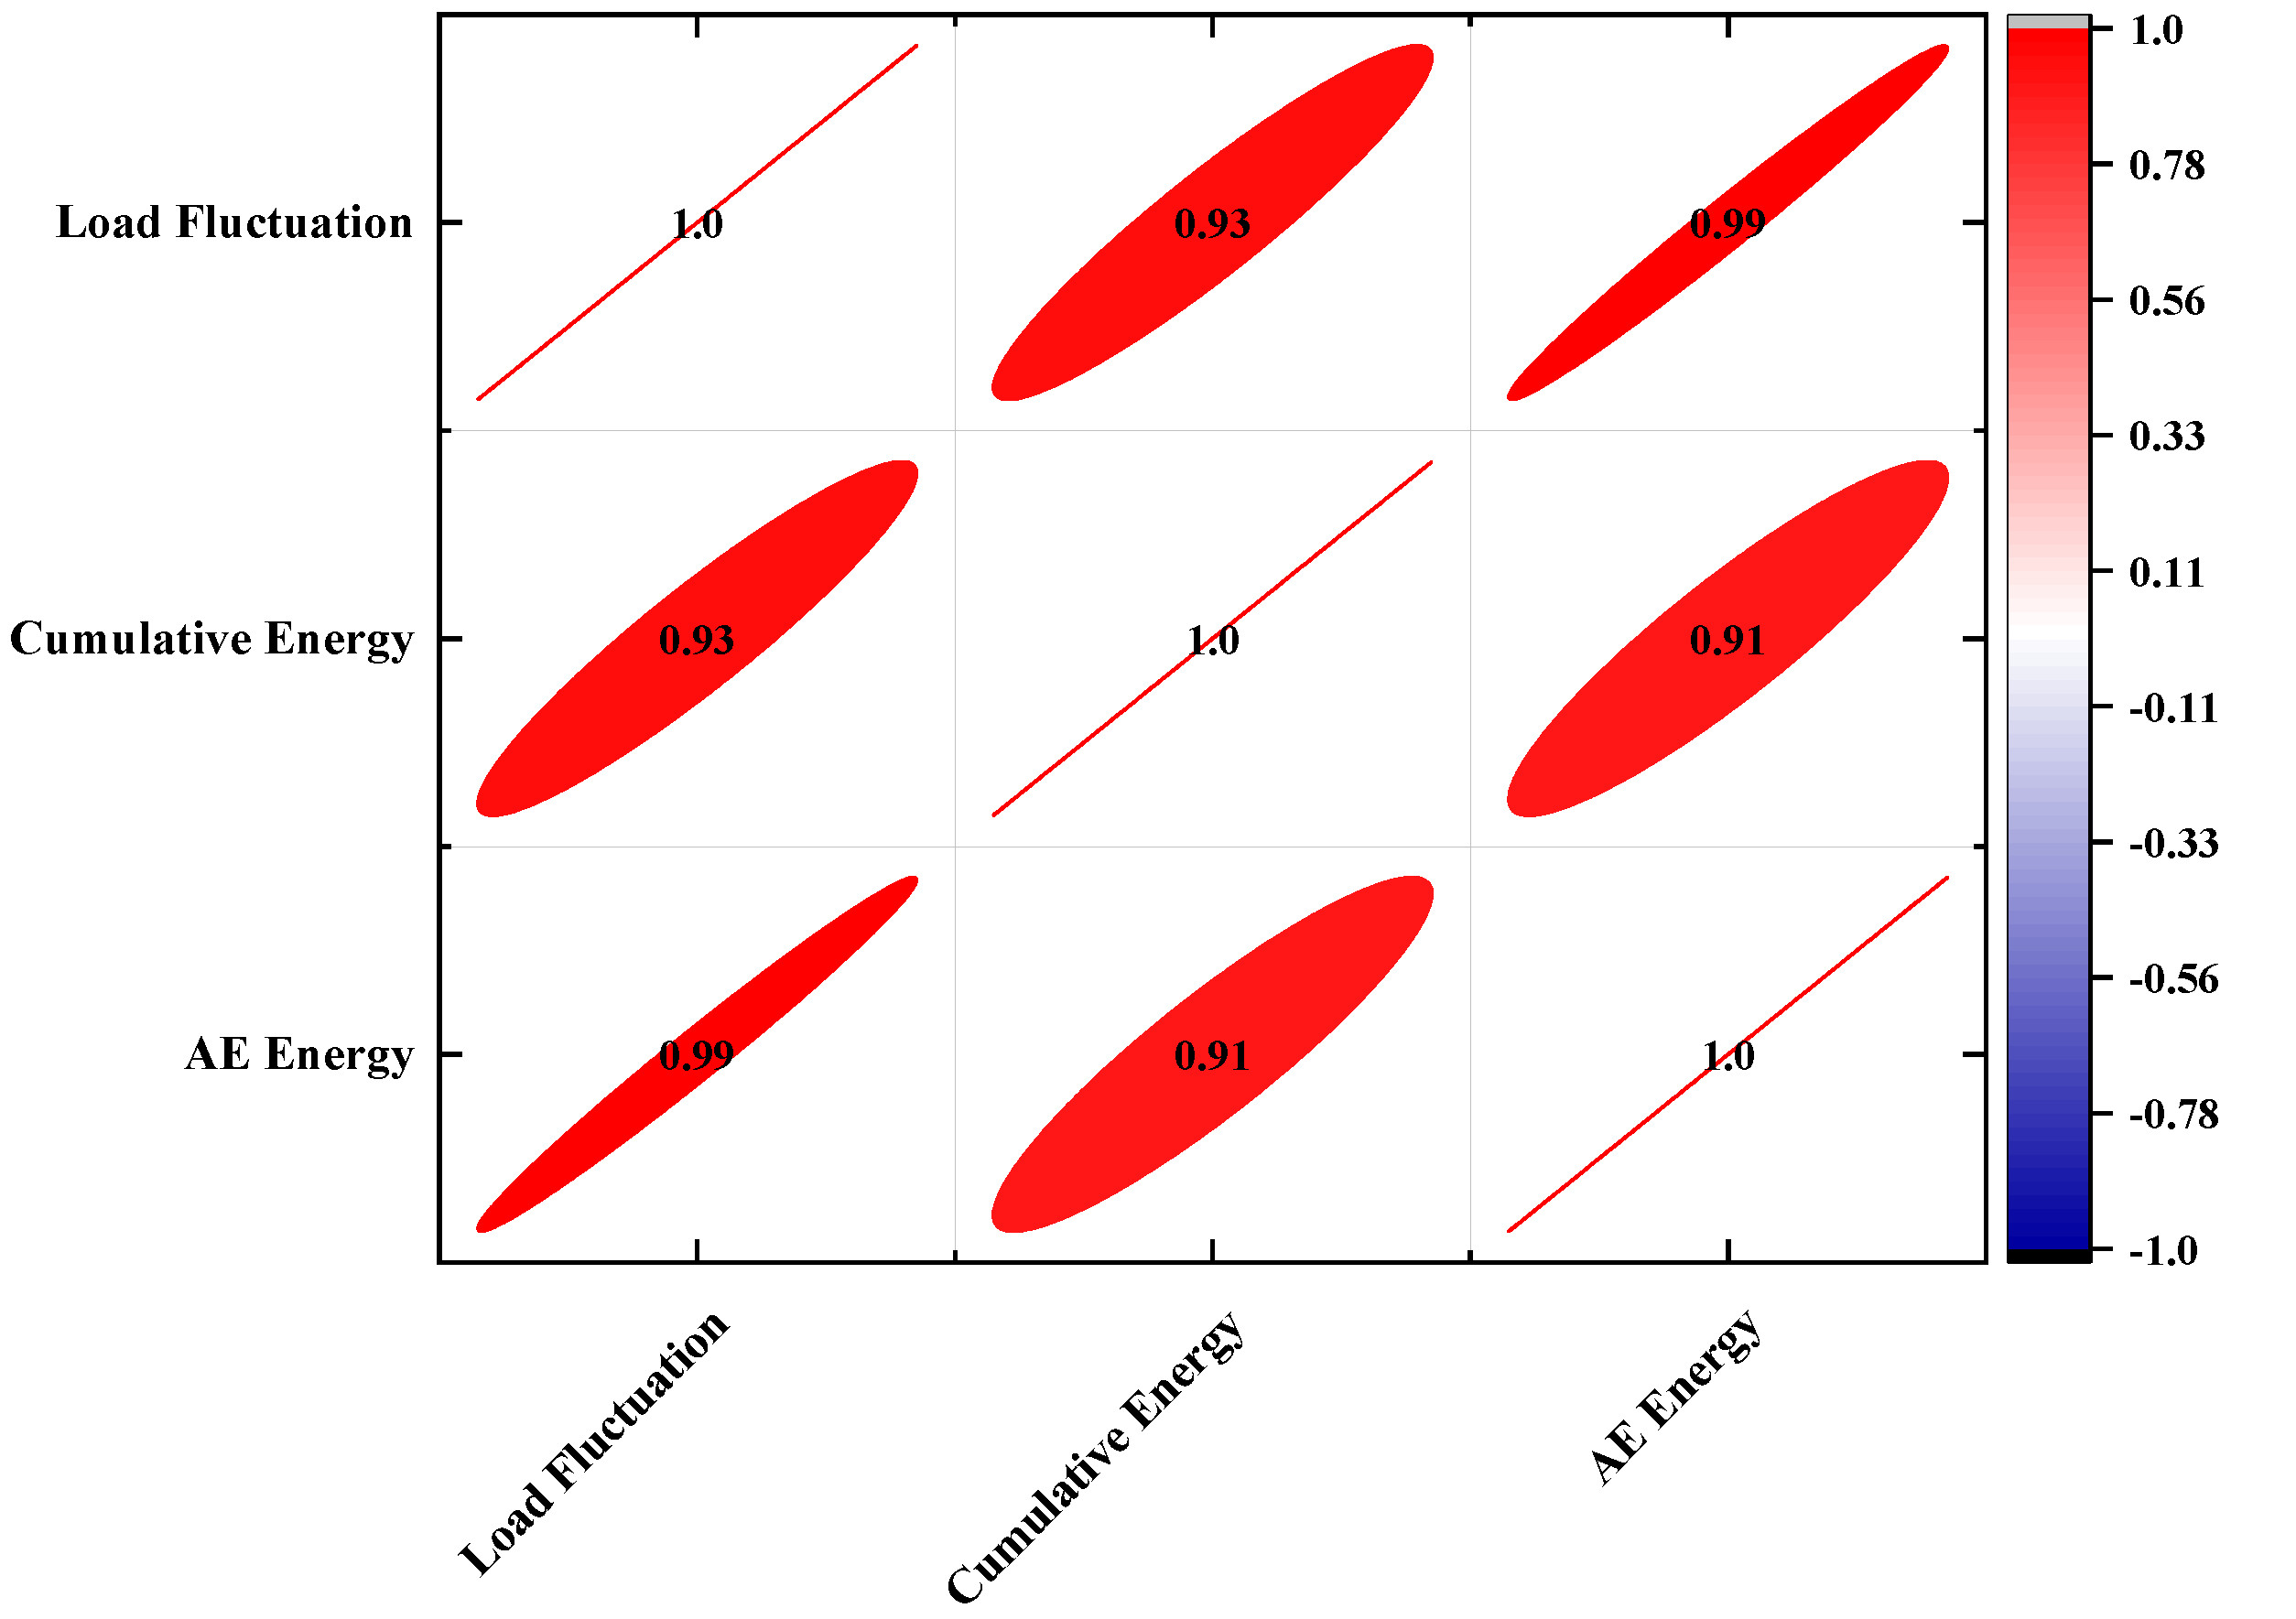
AE energy and cumulative AE energy can be used as effective monitoring indicators to characterize the loading stage and damage level of full-size pipes, and AE energy and cumulative AE energy vary with the stresses applied to the pipe. The correlation analysis of the load variation ΔF, the accumulated AE energy ∑E, and the single AE energy maximum Emax during the plastic damage phase shows that there is a positive correlation between any two indicators, and the correlation coefficients are greater than 0.9, which is a strong correlation.
(4)
The AF/RA index can effectively characterize the loading state and the damage degree of the pipeline. The value of AF/RA gradually increases when the main damage is approaching, and then starts to decrease after the main damage occurs, showing the characteristics of “double peaks”. The appearance of the first peak corresponds to the appearance of the crack load, and the second “peak” appears when the load reaches the damage load. The appearance of the two peaks corresponds to the change of the loading phase of the pipeline, and the occurrence of the major damage.
This study is of great significance in evaluating the damage level and instability of the reinforced concrete sewage pipeline. It is found that cumulative AE energy and the AF/RA value can be used as effective indicators for pipeline damage monitoring, but the quantitative relationship between the two indicators and the degree of pipeline damage still needs further study.

6. Discussion

AE technology has been widely used in the field of engineering testing. There are also some external factors that can affect the experimental results. For example, the characteristics of acoustic emission are sensitive to materials, and susceptible to interference from electromechanical noise and the vibration of the experimental equipment. In addition, due to the irreversibility of acoustic emission, the acoustic emission signal in the experimental process cannot be obtained repeatedly through multiple loading. The acoustic emission characteristics of various materials vary greatly with different experimental conditions. In order to establish the relationship between the received acoustic emission signal and the sound source, more research is needed on the acoustic emission characteristics of various materials. To effectively characterize the evolution trend of mechanical properties of concrete sewage pipelines under load, this study presents a full-scale loading test on reinforced concrete sewage pipelines with acoustic emission (AE) technology. The monitoring method proposed in this paper is biased towards qualitative research, and the quantitative monitoring indexes are less studied. In the future, the quantitative evaluation indexes and methods of pipeline damage based on the research of this paper will be further studied.

Author Contributions

Writing—original draft, P.L.; Writing—review & editing, W.Z., Z.Y., Y.W., S.Y. and L.W. All authors have read and agreed to the published version of the manuscript.

Funding

This work was financially supported by the Beijing major science and technology projects (No. Z191100008019002).

Institutional Review Board Statement

Not applicable.

Informed Consent Statement

Not applicable.

Data Availability Statement

The data presented in this study are available on request from the corresponding author. The data are not publicly available due to project requirements.

Conflicts of Interest

The authors declare no conflict of interest.

References

  1. Fang, H.Y.; Li, B.; Wang, F.M.; Wang, Y.K.; Cui, C. The mechanical behaviour of drainage pipeline under traffic load before and after polymer grouting trenchless repairing. Tunn. Undergr. Space Technol. 2018, 74, 185–194. [Google Scholar] [CrossRef]
  2. Xu, M.; Shen, D.W.; Rakitin, B. The longitudinal response of buried large-diameter reinforced concrete pipeline with gasketed bell-and-spigot joints subjected to traffic loading. Tunn. Undergr. Space Technol. 2017, 64, 117–132. [Google Scholar] [CrossRef]
  3. Meesawasd, N.; Boonyasiriwat, C.; Kongnuan, S.; Chamchod, F. Finite element modeling for stress analysis of a buried pipeline under soil and traffic loads. In Proceedings of the 2016 IEEE International Conference on Industrial Engineering and Engineering Management (IEEM), Bali, Indonesia, 4–7 December 2016; pp. 4–7. [Google Scholar]
  4. Fang, H.Y.; Yang, K.J.; Li, B.; Tan, P.L.; Wang, F.; Du, X.M. Experimental and Numerical Study on Mechanical Analysis of Buried Corroded Concrete Pipes under Static Traffic Loads. Appl. Sci. 2019, 9, 5002. [Google Scholar] [CrossRef]
  5. Zhang, C.; Zhu, J.; Huang, M.; Yu, J. Winkler load-transfer analysis for pipelines subjected to surface load. Comput. Geotech. 2019, 111, 147–156. [Google Scholar] [CrossRef]
  6. Ma, Y.; Li, S.; Wu, Y.; Wang, D.; Liu, M. Acoustic emission testing method for the sleeve grouting compactness of fabricated structure. Constr. Build. Mater. 2019, 221, 800–810. [Google Scholar] [CrossRef]
  7. Li, S.L.; Shi, H.S.; Wu, G.M.; Wang, D.W. Application of Acoustic Emission Technique to Crack Detection of Concrete Hollow Slab Bridges. Bridge Constr. 2017, 47, 83–88. [Google Scholar]
  8. Zheng, Y.; Wang, S.; Zhang, P.; Xu, T.; Zhuo, J. Application of Nondestructive Testing Technology in Quality Evaluation of Plain Concrete and RC Structures in Bridge Engineering: A Review. Buildings 2022, 12, 843. [Google Scholar] [CrossRef]
  9. Hong, X.B.; Liu, Y.; Lin, X.H.; Luo, Z.Q.; He, Z.W. Nonlinear Ultrasonic Detection Method for Delamination Damage of Lined Anti-Corrosion Pipes Using PZT Transducers. Appl. Sci. 2018, 8, 2240. [Google Scholar] [CrossRef]
  10. Ma, G.F.; Du, Q.J. Structural health evaluation of the prestressed concrete using advanced acoustic emission (AE) parameters. Constr. Build. Mater. 2020, 250, 118860. [Google Scholar] [CrossRef]
  11. Hassani, S.; Mousavi, M.; Sharif-Khodaei, Z. Smart bridge monitoring. In The Rise of Smart Cities; Elsevier: Amsterdam, The Netherlands, 2022; pp. 343–372. [Google Scholar]
  12. Verstrynge, E.; Lacidogna, G.; Accornero, F.; Tomor, A. A review on acoustic emission monitoring for damage detection in masonry structures. Constr. Build. Mater. 2021, 268, 121089. [Google Scholar] [CrossRef]
  13. De Santis, S.; Tomor, A.K. Laboratory and field studies on the use of acoustic emission for masonry bridges. NDT E Int. 2013, 55, 64–74. [Google Scholar] [CrossRef]
  14. Shigeishi, M.; Colombo, S.; Broughton, K.J.; Rutledge, H.; Batchelor, A.J.; Forde, M.C. Acoustic emission to assess and monitor the integrity of bridges. Constr. Build. Mater. 2001, 15, 35–49. [Google Scholar] [CrossRef]
  15. Calabrese, L.; Campanella, G.; Proverbio, E. Noise removal by cluster analysis after long time AE corrosion monitoring of steel reinforcement in concrete. Constr. Build. Mater. 2012, 34, 362–371. [Google Scholar] [CrossRef]
  16. Alexakis, H.; Liu, H.; DeJong, M.J. Damage identification of brick masonry under cyclic loading based on acoustic emissions. Eng. Struct. 2020, 221, 110945. [Google Scholar] [CrossRef]
  17. Das, A.K.; Suthar, D.; Leung, C.K.Y. Machine learning based crack mode classification from unlabeled acoustic emission waveform features. Cem. Concr. Res. 2019, 121, 42–57. [Google Scholar] [CrossRef]
  18. Du, K.; Liu, M.H.; Yang, C.Z.; Tao, M.; Feng, F.K.; Wang, S.F. Mechanical and Acoustic Emission (AE) Characteristics of Rocks under Biaxial Confinements. Appl. Sci. 2021, 11, 769. [Google Scholar] [CrossRef]
  19. Du, F.Z.; Li, D.S.; Li, Y.Y. Fracture Mechanism and Damage Evaluation of FRP/Steel-Concrete Hybrid Girder Using Acoustic Emission Technique. J. Mater. Civ. Eng. 2019, 31, 04019111. [Google Scholar] [CrossRef]
  20. Han, Q.H.; Yang, G.; Xu, J.; Fu, Z.W.; Lacidogna, G.; Carpinteri, A. Acoustic emission data analyses based on crumb rubber concrete beam bending tests. Eng. Fract. Mech. 2019, 210, 189–202. [Google Scholar] [CrossRef]
  21. Hou, Z.Q.; Li, C.H.; Song, Z.Y.; Xiao, Y.G.; Qiao, C.; Wang, Y. Investigation on Acoustic Emission Kaiser Effect and Frequency Spectrum Characteristics of Rock Joints Subjected to Multilevel Cyclic Shear Loads. Geofluids 2021, 2021, 5569525. [Google Scholar] [CrossRef]
  22. Li, J.S.; Lian, S.L.; Huang, Y.S.; Wang, C.L. Study on Crack Classification Criterion and Failure Evaluation Index of Red Sandstone Based on Acoustic Emission Parameter Analysis. Sustainability 2022, 14, 5143. [Google Scholar] [CrossRef]
  23. Liu, X.L.; Liu, Z.; Li, X.B.; Gong, F.Q.; Du, K. Experimental study on the effect of strain rate on rock acoustic emission characteristics. Int. J. Rock Mech. Min. Sci. 2020, 133, 104420. [Google Scholar] [CrossRef]
  24. Niu, Y.; Zhou, X.P.; Berto, F. Evaluation of fracture mode classification in flawed red sandstone under uniaxial compression. Theor. Appl. Fract. Mech. 2020, 107, 102528. [Google Scholar] [CrossRef]
  25. Lv, H.; Peng, K.; Shang, X.-Y.; Wang, Y.-Q.; Liu, Z.-P. Experimental research on the mechanical and acoustic emission properties of layered sandstone during tensile failure. Theor. Appl. Fract. Mech. 2022, 118, 103225. [Google Scholar] [CrossRef]
  26. Sharma, G.; Sharma, S.; Sharma, S.K. Monitoring structural behaviour of concrete beams reinforced with steel and GFRP bars using acoustic emission and digital image correlation techniques. Struct. Infrastruct. Eng. 2022, 18, 167–182. [Google Scholar] [CrossRef]
  27. Shi, D.D.; Chen, X.D.; Zhang, J.H.; Cheng, X.Y.; Li, W.T.; Shi, Z.X.; Wu, C.G. Experimental Study on Post-peak Cyclic Characteristics of Self-compacting Concrete Combined with AE and DIC Technique. J. Adv. Concr. Technol. 2020, 18, 386–395. [Google Scholar] [CrossRef]
  28. Tra, V.; Kim, J.Y.; Jeong, I.; Kim, J.M. An Acoustic Emission Technique for Crack Modes Classification in Concrete Structures. Sustainability 2020, 12, 6724. [Google Scholar] [CrossRef]
  29. Wang, C.Y.; Chang, X.K.; Liu, Y.L. Experimental Study on Fracture Patterns and Crack Propagation of Sandstone Based on Acoustic Emission. Adv. Civ. Eng. 2021, 2021, 8847158. [Google Scholar] [CrossRef]
  30. Wang, Y.; Meng, H.J.; Long, D.Y. Experimental investigation of fatigue crack propagation in interbedded marble under multilevel cyclic uniaxial compressive loads. Fatigue Fract. Eng. Mater. Struct. 2021, 44, 933–951. [Google Scholar] [CrossRef]
  31. Xu, J.; Niu, X.L.; Yao, Z.Y. Mechanical properties and acoustic emission data analyses of crumb rubber concrete under biaxial compression stress states. Constr. Build. Mater. 2021, 298, 123778. [Google Scholar] [CrossRef]
  32. Zaki, A.; Ibrahim, Z. Corrosion assessment of pre-corrosion concrete specimens using acoustic emission technique. J. Eng. Technol. Sci. 2021, 53, 210111. [Google Scholar] [CrossRef]
  33. Zhang, H.; Wang, Z.Z.; Song, Z.L.; Zhang, Y.Z.; Wang, T.T.; Zhao, W.C. Acoustic emission characteristics of different brittle rocks and its application in brittleness evaluation. Geomech. Geophys. Geo-Energy Geo-Resour. 2021, 7, 48. [Google Scholar] [CrossRef]
Figure 1. Schematic diagram of the experimental system: 1—reinforced concrete sewage pipeline; 2—ground brace; 3, 4—AE sensor; 5—rubber mat; 6—AE amplifier; 7—data-acquisition instrument; 8—host computer; 9—a/d convertor.
Applsci 12 08624 g001
Figure 2. Experimental loading system.
Applsci 12 08624 g002
Figure 3. AE sensor arrangement scheme.
Applsci 12 08624 g003
Figure 4. Load curves for different sizes of pipe specimens.
Applsci 12 08624 g004
Figure 5. Characteristic curve of pipeline loaded AE signal.
Applsci 12 08624 g005
Figure 6. Characteristics of AE energy response during pipe loading.
Applsci 12 08624 g006
Figure 7. Stress–AE response curve during loading.
Applsci 12 08624 g007
Figure 8. The evolution of AE parameters in the process of stress change line graph.
Applsci 12 08624 g008
Figure 9. Thermal diagram of the correlation coefficient of AE parameters during the stress change.
Applsci 12 08624 g009
Figure 10. AE waveform parameters.
Applsci 12 08624 g010
Figure 11. Crack distribution map of pipeline damage under load.
Applsci 12 08624 g011
Figure 12. The evolution characteristics of RA and AF parameters during loading.
Applsci 12 08624 g012
Figure 13. The evolution characteristics of AF/RA parameters during loading.
Applsci 12 08624 g013
Figure 14. Schematic diagram of the principle of AE signal to identify crack types.
Applsci 12 08624 g014
Table 1. Reinforced concrete sewer pipe parameters.
Inner DiameterThicknessOuter DiameterSkeleton Layer PositionCircumferential Reinforcement BarsLongitudinal Reinforcement
DiameterInner DiameterNumber of RingsPitchDiameterQuantity
10001401140Single332113.37553
15001651665Single332113.37553
20002102210Single332113.27553
Table 2. Estimated load for different sizes of pipes with graded loading.
Specification (mm)Crack Load (kN)80% Crack Load (kN)10% Crack Load (kN)5% Crack Load (kN)Failure Load (kN)80% Failure Load (kN)10% Failure Load (kN)5% Failure Load (kN)
1000 × 140 × 300020716520103002403015
1500 × 165 × 300030024030154503604522
2000 × 210 × 300040232140206004806030
Publisher’s Note: MDPI stays neutral with regard to jurisdictional claims in published maps and institutional affiliations.

