Abstract
This study presents a color digital holography (CDH) detection system that includes the optical path and a numerical calculation program to detect tooth erosion under different acid-etching conditions. Etched cattle enamel samples were pressurized within the elastic interval, and the CDH detection system was used to rebuild the three-dimensional deformation field of these samples. Young’s modulus of these samples was employed to evaluate the mechanical properties of enamels by statistical methods. The results show that Young’s modulus of enamel decreases with the increase in etching time, while it decreases slightly with the increase in the etching temperature, and the etching temperature has no effect on the non-etched enamels. Moreover, the detection process proves the CDH detection system has the advantages of high precision, full-field detection, and being non-destructive, fast, and stable. It is expected to have broad application potential for CDH detection systems in the detection of tooth erosion.
1. Introduction
Tooth erosion is a kind of dental disease in which teeth surface substances are chemically eroded by acidic substances or acidic chelates, resulting in the loss of the shallow surface of the tooth’s original compact structure [1]. Tooth erosion is mainly caused by exogenous acid and endogenous non-bacterial acid. Exogenous acid plays a significant role in tooth erosion disease, with sources including carbonated drinks [2], acidic foods [3,4], alcohol [5], and long-term exposure to acidic environments [6]. With the improvement in people’s living standards, the global consumption of carbonated drinks has significantly increased [7,8,9], and the excessive drinking of carbonated drinks has become the primary factor in tooth erosion [10]. Statistics show that dental diseases caused by excessive carbonated drinks are increasing annually [11,12]. Thus, it is of great significance to study the effect of carbonated drinks on tooth erosion.
The key step in the study of tooth erosion is to detect the teeth and obtain the data of deformation and structural strength changes. Common detection methods are mainly divided into physical methods, chemical methods, and microscopic evaluation methods. The physical detection methods mainly include surface profilometry [13,14,15,16] and nano-indentation [13,17]. Using these methods, the tiny probe of the surface profilometry instrument can generate scratches and nano-indentation can produce many indentations on the surface of the tooth [15]. Thus, both of these methods cause non-etching damage to the tooth surface, resulting in a high degree of experimental error and low experimental accuracy [13]. Chemical methods are indirect detection methods that evaluate the change in acid etching by the PH value, trace element content, and buffering capacity of the acid-etching medium [15,18]. These methods are easily affected by experimental conditions and cannot detect the change in tooth mechanical properties and morphology [13]. Microscopic evaluation methods include scanning electron microscopy (SEM) [16,19,20], atomic force microscopy (AFM) [21], confocal laser scanning microscopy (CLSM) [20,22], ordinary optical microscopy [13], and surface 3D focus variation scanning microscopy [16]. These methods have the disadvantages of complex equipment and high cost, and apply only to qualitative research. In addition, the detection accuracy of ordinary optical microscopy is low, the single detection area of AFM is only [13], and surface 3D focus variation scanning microscopy is time-consuming and suffers from low repeatability [13,16]. Therefore, there is an urgent need to study new detection methods of tooth erosion.
Digital holography (DH) is a new optical detection method. DH generally uses a single wavelength laser to irradiate objects. A digital image sensor is used to collect holograms, and to reconstruct the wavefront, before and after the object changes [23]. The results of the two reconstructions are subtracted to calculate the phase difference. The change information of the object deformation can be obtained by numerical calculation based on the phase difference. DH has been widely used in three-dimensional shape detection [24], temperature field detection [25,26], the measurement of small vibrations of the strain of transparent objects [27], and other fields [28]. DH has high detection accuracy and a straightforward system structure, and is a non-destructive and non-contact method.
Color digital holography (CDH) uses three different wavelengths of laser to illuminate the object to form three non-coplanar change vectors, and then uses a color digital image sensor to collect the three-channel color hologram [29,30]. The three-dimensional change information of the object is obtained by processing the hologram [30,31,32]. CDH can directly reconstruct the three-dimensional deformation field of the object compared with ordinary DH, and has greater acquisition efficiency and real-time reproduction, and a wider application range [33,34,35]. However, there is no literature report on the application of DH to the study of tooth etching, and no relevant report on CDH.
In this study, a CDH detection system was built, and bovine enamel was acid etched by carbonated drinks. The deformation field of the bovine enamel samples under different acid-etching conditions was detected by the CDH detection system, and Young’s modulus of these samples was obtained. The influences of different acid-etching conditions on the mechanical properties of bovine enamel were quantitatively analyzed.
2. Materials and Methods
2.1. Color Digital Holography
In the process of light propagation, each spatial coordinate has its corresponding phase. DH can record the phase information of the illuminated object, and the object deformation information can be calculated by the phase difference [32]. Single wavelength DH can only detect the deformation and displacement in the direction of the light wave. The relationship between the phase difference and deformation can be expressed as Equation (1) [36].
where is the phase difference, is the wavelength, is the light path difference, is the illumination vector from the light source to the object, is the observation vector from the object to the charge-coupled device (CCD ) direction, is the induction vector corresponding to the deformation direction, and is the object deformation.
CDH uses three different wavelengths of the laser to irradiate an object. The three-dimensional deformation or displacement field can be reconstructed by vector synthesis using Equation (1). The obtained equations can be written as [34]:
Equation (2) can also be expressed as matrix form:
Matrix A in Equation (3) can be shown as:
Matrix A is reversible when the three-color light is not coplanar; then, Equation (3) can be expressed as:
where can be measured by CDH, and the three-dimensional deformation field of the object can be calculated numerically based on the Equation (5).
2.2. The CDH Optical Path
We designed a detection system for this research according to the principle of CDH. The optical path of the experiment is shown in Figure 1; the wavelengths of the blue, green, and red lasers in the system were , and , respectively. Three beams of reference light were combined into NPBS4, then extended and collimated by a spatial filter (SF4), and modulated to parallel light 1 by a Fourier lens (FL3). The three beams of object light were extended and collimated by a spatial filter (SF1, SF2, SF3), then modulated to parallel light by a Fourier lens (FL1, FL2, FL3, and the surface of the object was irradiated from different angles to form diffuse reflection light. The diffuse reflection light 1 included three color lights and parallel light 1 produced interference at NPBS5, and CCD recorded the hologram produced by the interference.
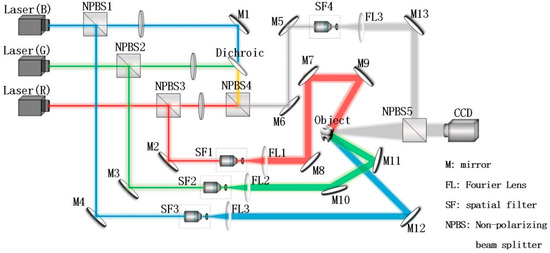
Figure 1.
Optical path of the CDH detection system.
The pixel size of color CCD used for image acquisition was 3.25 . The distance from the object to the CCD acquisition surface was 230 . The position of the object was based on the origin of the Cartesian rectangular coordinate system. The coordinate of the red mirror (M9) was (11, 0, −6), and the incident angle was 4.5140°. The coordinate of the green mirror (M11) was (38, 17, 3), and the incident angle was 24.0360°. The coordinate of the blue mirror (M12) was (28, 0, 21), and the incident angle was 36.8699°.
2.3. Samples Preparation
Cattle teeth can be used to replace human teeth in in vitro studies of teeth because they are easy to obtain, the jaw of the cattle is wide, and the teeth are similar to human teeth [22,37]. The degree of tooth erosion can be divided into three grades: enamel wear, dentin shallow wear, and a large area of complete wear of enamel and dentin [38]. According to clinical statistics, tooth enamel wear is the most common [39]. Therefore, this research selected cattle enamel as the research object.
We collected 35 incisors from healthy adult buffaloes. Fresh bovine teeth were collected from the slaughterhouse and stored in normal saline with a concentration of 0.9%, They were sterilized with hypochlorate solution before experiment and cut into rectangular enamel slices (6 mm length, 6 mm width, 1 mm thickness) [40]. Test samples were taken from maxillofacial regions and divided into seven groups by a completely random method, with five samples per group [41]. The experimental conditions and the nomenclature of these samples are shown in Table 1. The enamel surface was polished successively with 600 #, 800 #, and 1200 # sandpaper to remove impurities.

Table 1.
The group of Samples.
These samples were soaked in artificial saliva (Dongguan Xinheng technology company, Dongguan) with pH 6.7 for 10 min [42], rinsed with distilled water, and then dried naturally for 30 min. Acid-erosion experiments were carried out as specified in Table 1, and the enamel was placed in a closed constant-pressure vessel. The carbonated drink used in the experiment was Sprite (Coca Cola beverage Co. Ltd., Kunming, China). A PH detector (Simari PH828) was used to measure the temperature and PH value, with a detection accuracy of 0.1. During acid erosion, the PH value changed less than 0.1.
2.4. Load Infliction
The minimum loading accuracy of the loading system (Shenzhen, China, ZQ-21B-1) was 0.1 N, and the loading range was 0–500 N. The pressure on the samples was in the vertical direction.
The elastic interval of cattle enamel samples was tested, and the load–deformation curve is shown in Figure 2. The range of the load was 0~190 N and the deformation of cattle enamel was measured; thus, it can be concluded that the elastic range of bovine enamel was 30~120 N. In order to verify the accuracy of the CDH detection system, the range of 40~50 N was selected as the loading range, the pressure interval was 1 N, and the stability time was 10 s.
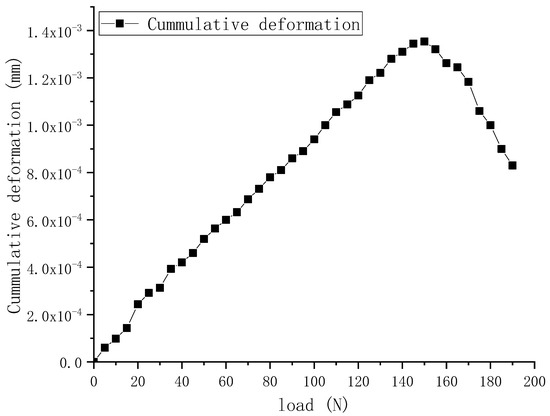
Figure 2.
Load–deformation Curve.
2.5. Calculation of Phase Difference and Young’s Modulus
The hologram of each cattle enamel sample was recorded three times under each load, then their corresponding phase differences were calculated, and the final phase difference was the average of the three calculated phase differences. These phase differences were within the range of , and the true information of the phase difference needed a large number for the use of the windowed Fourier transform.
Young’s modulus can well characterize the deformation resistance of teeth. Young’s modulus for the seven groups of samples is an excellent quantitative evaluation index for studying the mechanical properties of teeth. The calculation formula of Young’s modulus of samples is:
where is the force applied to the object, S is the area of the force, and L is the object’s length. represents the elongation of the object in the direction of force under the force F.
3. The Detection Process of the CDH Detection System
The numerical calculation program of the CDH detection system was written according to the following steps. Firstly, the image plane filtering method is used to eliminate the zero-order image and conjugate image. Secondly, the constructed object images of three wavelengths are obtained using the controllable magnification reconstruction algorithm, and the phase difference can be obtained by subtracting the two images. Thirdly, windowed Fourier transform is used to reduce the noise of phase difference images. Fourthly, the mask and iterative least square method are used for phase unwrapping. Finally, the three-dimensional displacement field is calculated according to Equation (5). All 35 bovine enamel samples were numerically calculated according to the above steps.
Under the same load, the deformation of nonacid-etched samples was smaller than that of acid-etched samples, so a nonacid-etched sample in group A was selected to demonstrate the detection process of the CDH detection system.
The color holograms of the nonacid etching sample in group A are shown in Figure 3, with load = 45 N for Figure 3a and load = 46 N for Figure 3b. These figures were directly collected by CCD and were not processed by the numerical calculation program. Many interference fringes can be observed in Figure 3, and are produced by the interference of the object light and the reference light. A few spots in the hologram are speckle noise and were caused by a small amount of dust in the optical system. These could be eliminated by subsequent numerical calculation. Although the load only changed by 1 N, the interference fringe spacing and the intensity of the image changed significantly. This shows that the detection system can measure the subtle changes in the sample under a small external force. The color holograms contain the information of the whole sample surface, whereas the atomic force microscope detection system can only detect a small part of the sample surface [13].
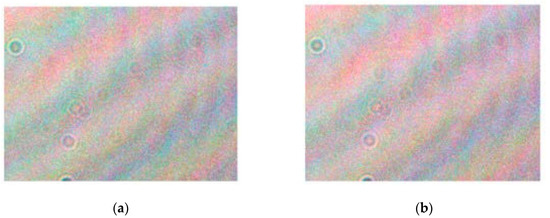
Figure 3.
Color holograms: (a) load = 45 N and (b) load = 46 N.
The wrapping phase differences and real phase differences for the three-color laser are shown in Figure 4. Figure 4a–c represents the wrapping phase differences for the red laser, the green laser, and the blue laser, respectively. Figure 4d–f represents the real phase differences for the red laser, the green laser, and the blue laser, respectively. These figures were obtained from holograms by the numerical calculation program, and the numerical calculation time was less than 1 s from the holograms to the reconstruction of the three-dimensional deformation field. It can be seen that the phase difference of the three images (Figure 4a–c) is small; this is because the anti-tangent function was used to calculate the phase difference, resulting in the phase difference of the unwrapped phase (Figure 4a–c) being in the range of . By comparison, the actual phase differences after unwrapping (Figure 4d–f) vary greatly, which is due to the large difference in the wavelength and the incident angle of the three-color laser.
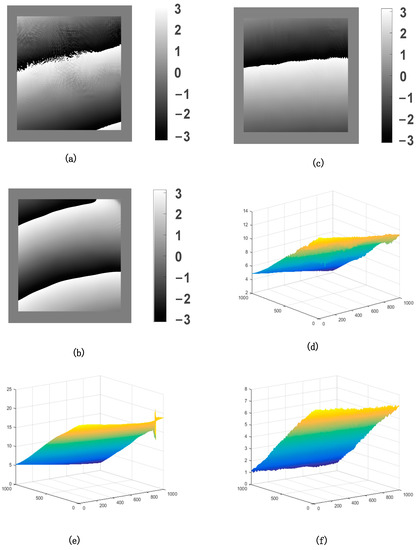
Figure 4.
Wrapping phase differences for (a–c) and real phase differences for (d–f) of the three-color laser.
The three-dimensional deformation field of the sample is shown in Figure 5. Figure 5a–c shows the full-field deformation of the sample surface, and Figure 5d–f shows the averaged deformation of the sample in the stress direction. The X direction is from the sample to the CCD, the Y direction is the vertical direction, and the Z direction is the horizontal direction. The sample of cattle enamel lies in the YZ plane. Substituting the calculated data in Figure 4 into Equation (5), we find that the deformation of X, Y, and Z directions is , , and , respectively. The samples of cattle enamel have a pressure varying by 1 N in the Y direction, so the deformation in the Y direction is largest. There is no load pressure in X and Z directions, so the deformation was smaller. These deformation data indicate the CDH detection system can measure the nano-scale deformation, and its detection accuracy is higher than that of nano-indentation and surface profilometry detection [13].
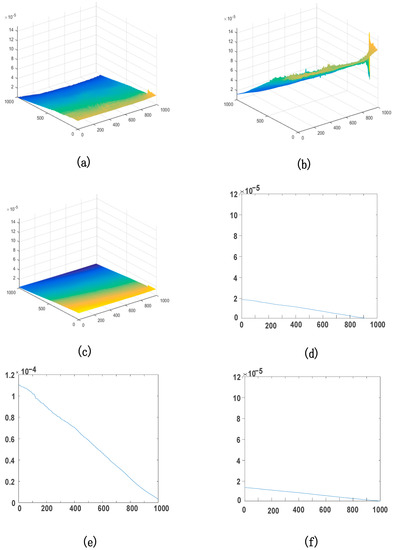
Figure 5.
The full-field deformation of the sample in X, Y, and Z directions for (a–c) and the average of directions for (d–f).
Therefore, the CDH detection system can obtain the deformation of the sample from its holograms, and has the advantages of being fast, highly accurate, and non-destructive in the detection of tooth erosion. However, its limitations mainly lie in the miniaturization of the detection system.
4. Discussion
4.1. The Effect of Acid Etching Times on the Tooth Erosion
Young’s modulus is an important index for quantitative evaluation of enamel erosion, and is helpful in the pathological study of tooth erosion, external treatment, and the development of acid-resistant dental materials [42]. Young’s modulus of samples could be calculated by Equation (6) based on the results of the deformation in Figure 5.
The effect of acid-etching time on the enamels is shown in Figure 6. It can be found from Figure 6a that the three curves almost have no change with the increase in load. This is because the values on the right side of Equation (6) are constant under the condition of elastic deformation. In addition, the data points of Young’s modulus in the figure are the average values of five samples in every group, and the Shapiro–Wilk (SW) normal distribution test of Young’s modulus was carried out with the load increasing [43]. The results of p = 0.37216 for Group B, p = 0.68516 for Group E, and p = 0.2348 for Group G show they meet the normal distribution at the 0.05 level [44], It was also found that the fluctuation in the three curves with the increase in load is very small. Figure 6a also shows that there is a great difference in Young’s modulus among the three curves. Figure 6b shows that the average values of Young’s modulus in Group B, Group E, and Group G were 100.7, 83.0, and 25. 7 GPa, respectively. Thus, Young’s modulus of cattle enamel decreased with increased acid-immersion time. It can be concluded the tooth erosion of cattle enamel increases with increasing acid-immersion time, and the acid-immersion time has a great influence on the tooth erosion.
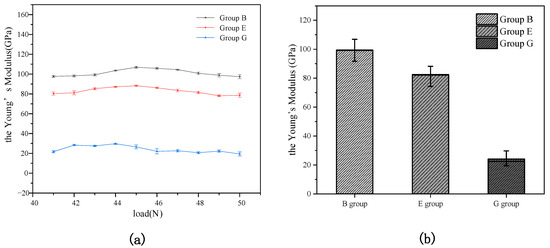
Figure 6.
Young’s modulus Change curve of Group B, Group E, and Group G for (a) and Young’s modulus average value of Group B, Group E, and Group G for (b).
The variance homogeneity of Young’s modulus for the three was tested; the value p = 0.175 > 0.05 shows that the variances of the three groups were equal and significant. Therefore, a single-factor analysis of variance (ANOVA) for multiple comparisons was used to analyze the differences among these groups [44]. Post hoc analysis uses the Tukey method; as shown in Table 2, the values of significance were less than 0.05. Previous studies have shown that, with the increase in acid-erosion time, the resistance of tooth enamel to deformation decreases significantly [15,45], and Young’s modulus of enamel also decreases. Based on Young’s modulus of tooth enamel samples of different acid-etching times and the ANOVA results in Table 2, it can be concluded that the erosion time has a great impact on enamel erosion, but the decrease in Young’s modulus is not proportional to the increase in time. This is because, after the surface layer of tooth enamel is eroded by acid, the trace elements in the solution increase, and the rate of deep acid erosion decreases [45,46].
Table 2.
ANOVA multiple comparisons among Group B, Group E, and Group G.
4.2. The Effect of Temperature on the Tooth Erosion
The effect of temperature on the enamel’s erosion is shown in Figure 7. The six curves almost have no change with the increase in load, and the results of the Shapiro–Wilk (SW) normal distribution test are as follows [43]: p = 0.96199 for Group A, p = 0.37216 for Group B, p = 0.68516 for Group C, p = 0.055081 for Group D, p = 0.055081 for Group E, and p = 0.43614 for Group F [44]. These results indicate they meet the normal distribution at the 0.05 level, and that the fluctuation of the six curves is very small with the increase in the load. There is a small difference among Groups A, B, and C, indicating the temperature has a minimal impact on the non-acid-etched enamels. Furthermore, there is a non-negligible difference among Groups D, E, and F, indicating the temperature has a greater impact on the etching of enamels by acid.
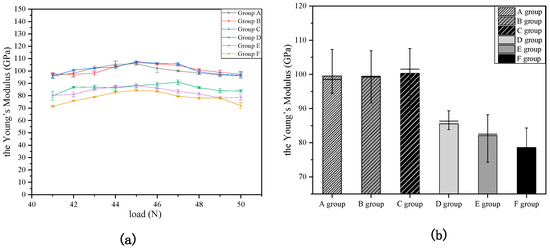
Figure 7.
Young’s modulus Change curve of Groups A–F for (a) and Young’s modulus average value of Groups A–F for (b).
Figure 7b shows that the average values of Young’s modulus were 99.8, 100.7, 100.1, 86.3, 83.0, and 78.5 GPa for Groups A-F. Compared with the non-acid-etched enamels, the temperature has a greater influence on the etching of enamels by acid.
The variance homogeneity of Young’s modulus for the six groups was tested. The value p = 0.919 > 0.05 of Group A–C shows that the variances are equal and significant, and the value p = 0.718 > 0.05 of Group D–F shows that the variances are equal and significant. The ANOVA multiple comparisons test was also used to analysis the difference among the six Groups [44], as shown in Table 3.
Table 3.
ANOVA multiple comparisons of different acid-etching temperatures.
The value of Sig. more than 0.05 indicates that the temperature has no significant impact on non-acid-etched enamel, whereas the value of Sig. less than 0.05 indicates that the temperature has no significant impact on etched enamel. According to the experimental results of different temperatures and the ANOVA results in Table 3, it can be concluded that the acid-etching temperature has an effect on the acid etching of tooth enamel, and that this effect is significant when the temperature changes by more than 20 °C. The relevant literature indicates that, as the temperature rises, the irregular motion of the molecules accelerates, and acid-etching reactions occur faster [41,45]. This is consistent with our results.
5. Conclusions
A CDH detection system including the optical path and the numerical calculation program was built to detect the erosion of etched bovine enamel samples. The experimental and statistical results show that Young’s modulus and the mechanical properties of enamel decrease with the increase in the etching time, whereas they decrease slightly with the increase in the etching temperature. In addition, the etching temperature has no effect on the non-etched enamels. The CDH detection system has many advantages and can be efficiently used in the study of tooth erosion. This research provided a high-precision evaluation index for the exploration of the tooth etching principle and the development of dental anti-etching bionic materials.
Author Contributions
H.L.: Conceptualization; Writing—original draft. G.H.: Conceptualization; Writing—review and editing. Q.S.: Funding acquisition; Writing—review and editing. H.X.: Funding acquisition; Validation. Z.L., T.L.: Data curation; J.L.: Software. All authors have read and agreed to the published version of the manuscript.
Funding
This research was supported by the National Natural Science Foundation of China (62165007) and the National Natural Science Foundation of China (11862008).
Institutional Review Board Statement
Not applicable.
Informed Consent Statement
The study was conducted in accordance with the Declaration of Helsinki, and the protocol was approved by the Ethics Committee of Kunming University of science and technology.
Data Availability Statement
The data presented in this study are available on request from the corresponding author. The data are not publicly available because the data also form part of an ongoing study.
Conflicts of Interest
The authors declare no potential conflicts of interest with respect to the authorship and/or publication of this article.
References
- Imfeld, T. Dental erosion. Definition, classification and links. Eur. J. Oral Sci. 1996, 104, 151–155. [Google Scholar] [CrossRef] [PubMed]
- Zimmer, S.; Kirchner, G.; Bizhang, M.; Benedix, M. Influence of various acidic beverages on tooth erosion. Evaluation by a new method. PLoS ONE 2015, 10, e0129462. [Google Scholar] [CrossRef] [PubMed]
- Sato, T.; Fukuzawa, Y.; Kawakami, S.; Suzuki, M.; Tanaka, Y.; Terayama, H.; Sakabe, K. The Onset of Dental Erosion Caused by Food and Drinks and the Preventive Effect of Alkaline Ionized Water. Nutrients 2021, 13, 3440. [Google Scholar] [CrossRef] [PubMed]
- Salas, M.M.; Nascimento, C.C.; Varaas-Ferreira, F.; Tarquinio, S.B.; Huvsmans, M.C.; Demarco, F.F. Impact of diet on tooth erosion. Br. Dent. J. 2016, 220, 40. [Google Scholar]
- Zupo, R.; Castellana, F.; de Nucci, S.; Dibello, V.; Lozupone, M.; Giannelli, G.; de Pergola, G.; Panza, F.; Sardone, R.; Boeing, H. Beverages Consumption and Oral Health in the Aging Population: A Systematic Review. Front. Nutr. 2021, 8, 762383. [Google Scholar] [CrossRef]
- Chen, W.L.; Chen, Y.Y.; Wu, W.T.; Lai, C.H.; Sun, Y.S.; Wang, C.C. Examining relationship between occupational acid exposure and oral health in workplace. BMC Public Health 2020, 20, 1371. [Google Scholar] [CrossRef]
- Septalita, A.; Bahar, A.; Agustanti, A.; Rahardjo, A.; Maharani, D.A.; Rosalien, R. Dental erosion in 12-year-old school children living in Jakarta. J. Phys. Conf. Ser. 2017, 884, 012040. [Google Scholar] [CrossRef]
- Kirthiga, M.; Poornima, P.; Praveen, R.; Sakeena, B.; Disha, P. Dental Erosion and Its Associated Factors IN 11–16-Year Old School Children. J. Clin. Pediatri. Dent. 2015, 39, 336–342. [Google Scholar] [CrossRef]
- Uzma, S.; Fauzia, Q.; Tasleem, H. Determination of Prevalence of Dental Erosion in 12–14 Years School Children and Its Relationship with Dietary Habits. J. Coll. Physicians Surg. Pak. 2016, 26, 553–556. [Google Scholar]
- Samman, M.; Kaye, E.; Cabral, H.; Scott, T.; Sohn, W. Dental Erosion: Effect of Diet Drink Consumption on Permanent Dentition. JDR Clin. Transl. Res. 2021, 23800844211048478. [Google Scholar] [CrossRef]
- Shroff, P.; Gondivkar, S.M.; Kumbhare, S.P.; Sarode, S.; Gadbail, A.R.; Patil, S. Analyses of the Erosive Potential of Various Soft Drinks and Packaged Fruit Juices on Teeth. J. Contemp. Dent. Pract. 2018, 19, 1546–1551. [Google Scholar] [PubMed]
- Cheng, R.; Yang, H.; Shao, M.Y.; Hu, T.; Zhou, X.D. Dental erosion and severe tooth decay related to soft drinks: A case report and literature review. J. Zhejiang Univ.-Sci. B Int. Biomed. Biotechnol. J. 2009, 10, 395–399. [Google Scholar] [CrossRef] [PubMed]
- Attin, T.; Wegehaupt, F.J. Methods for assessment of dental erosion. Monogr. Oral Sci. 2014, 25, 123–142. [Google Scholar]
- Rios, D.; Honório, H.M.; Magalhães, A.C.; Wiegand, A.; Machado, M.A.D.A.M.; Buzalaf, M.A.R. Light cola drink is less erosive than the regular one: An In Situ/Ex Vivo study. J. Dent. 2008, 37, 163–166. [Google Scholar] [CrossRef]
- Ablal, M.; Kaur, J.; Cooper, L.; Jarad, F.; Milosevic, A.; Higham, S.M.; Preston, A.J. The erosive potential of some alcopops using bovine enamel: An In Vitro study. J. Dent. 2009, 37, 835–839. [Google Scholar] [CrossRef] [PubMed]
- Ren, Y.; Zhao, Q.; Malmstrom, H.; Barnes, V.; Xu, T. Assessing fluoride treatment and resistance of dental enamel to soft drink erosion In Vitro: Applications of focus variation 3D scanning microscopy and stylus profilometry. J. Dent. 2008, 37, 167–176. [Google Scholar] [CrossRef]
- Cuy, J.; Mann, A.; Livi, K.; Teaford, M.; Weihs, T. Nanoindentation mapping of the mechanical properties of human molar tooth enamel. Arch. Oral Biol. 2002, 47, 281–291. [Google Scholar] [CrossRef]
- Alexandre, O.T.; Ernesto, A.B.; Vieira, A.I.; Taís, S.; Pita, S.M.A. Chemical and mechanical resistance of novel experimental hybrid coatings on dentin permeability. Microsc. Res. Tech. 2020, 84, 163–170. [Google Scholar]
- Roque-torres, G.D.; Kwon, S.R.; Oyoyo, U.; Li, Y. Measurement of erosion depth using microcomputed tomography and light microscopy. Microsc. Res. Tech. 2020, 83, 1450–1455. [Google Scholar] [CrossRef]
- Zentner, A.; Duschner, H. Structural changes of acid etched enamel examined under confocal laser scanning microscope. J. Orofac. Orthop. 1996, 57, 202–209. [Google Scholar] [CrossRef]
- Heurich, E.; Beyer, M.; Jandt, K.D.; Reichert, J.; Herold, V.; Schnabelrauch, M.; Sigusch, B.W. Quantification of dental erosion—A comparison of stylus profilometry and confocal laser scanning microscopy (CLSM). Dent. Mater. 2009, 26, 326–336. [Google Scholar] [CrossRef] [PubMed]
- Min, J.; Kwon, H.; Kim, B. The addition of nano-sized hydroxyapatite to a sports drink to inhibit dental erosion-In Vitro study using bovine enamel. J. Dent. 2011, 39, 629–635. [Google Scholar] [CrossRef] [PubMed]
- Motoharu, F.; Kohhei, S.; Ryosuke, K.; Yoshiharu, M. Strain distribution measurement by digital holographic interferometry using three spherical waves. Wakayama Univ. (Jpn.) 2008, 7063, 70630G-9. [Google Scholar]
- Quan, C.; Chen, W.; Tay, C. Shape measurement by multi-illumination method in digital holographic interferometry. Opt. Commun. 2008, 281, 3957–3964. [Google Scholar] [CrossRef]
- Sharma, S.; Sheoran, G.; Shakher, C. Investigation of temperature and temperature profile in axi-symmetric flame of butane torch burner using digital holographic interferometry. Opt. Lasers Eng. 2012, 50, 1436–1444. [Google Scholar] [CrossRef]
- Rastogi, V.; Agarwal, S.; Kumar, V.; Shakher, C. Holographic optical element based digital holographic interferometer for the study of macro flames, micro flames and their temperature instability. Opt. Lasers Eng. 2019, 122, 29–36. [Google Scholar] [CrossRef]
- Stetson, K.; Weaver, G. A study of pseudo-free mounting of turbine blades for digital holographic vibration analysis and modal assurance criteria calculations. Exp. Tech. 2011, 35, 80–85. [Google Scholar] [CrossRef]
- Manoj, K.; Chandra, S. Experimental characterization of the hygroscopic properties of wood during convective drying using digital holographic interferometry. Appl. Opt. 2016, 55, 960–968. [Google Scholar]
- Li, J.C.; Tankam, P.; Peng, Z.J.; Picart, P. Digital holographic reconstruction of large objects using a convolution approach and adjustable magnification. Opt. Lett. 2009, 34, 572–574. [Google Scholar] [CrossRef]
- Mathieu, L.; Picart, P.; Guillaume, P.; Vincent, T. Investigation of 3D surface acoustic waves in granular media with 3-color digital holography. J. Appl. Phys. 2017, 121, 045112. [Google Scholar]
- Picart, P.; Fages, M.; Slangen, P.; Xia, H.; Montresor, S.; Guo, R.; Li, J.; Solieman, O.Y.; Durand, J.-C. A review on optical methods to assess dental behavior under stress. Opt. Metrol. 2019, 11060, 110600B-9. [Google Scholar]
- Tankam, P.; Song, Q.; Karray, M.; Li, J.-C.; Desse, J.M.; Picart, P. Real-time three-sensitivity measurements based on three-color digital Fresnel holographic interferometry. Opt. Lett. 2010, 35, 2055–2057. [Google Scholar] [CrossRef] [PubMed]
- Kulkarni, R.; Rastog, P. Three-dimensional displacement measurement from phase signals embedded in a frame in digital holographic interferometry. Appl. Opt. 2015, 54, 3393–3397. [Google Scholar] [CrossRef] [PubMed]
- Karray, M.; Poilane, C.; Gargouri, M.; Picart, P. Mechanical behavior study of laminate composite by three-color digital holography. J. Eur. Opt. Soc.-Rapid Publ. 2017, 13, 26. [Google Scholar] [CrossRef][Green Version]
- Song, Q.; Liu, Z.; Yang, W.; Lou, Y.; Gui, J. Investigation of Measuring the Young′s Modulus with Color Digital Holography. Acta Photonica Sin. 2018, 47, 109001. [Google Scholar] [CrossRef]
- Durand, J.C.; Slangen, P.; Montresor, S.; Desoutter, A.; Solieman, O.Y.; Fages, M.; Picart, P. Behavior of CAD/CAM ceramic veneers under stress: A 3D holographic study. J. Mech. Behav. Biomed. Mater. 2021, 118, 104436. [Google Scholar] [CrossRef]
- Dias, M.M.; Cestari, F.T.; Eduardo, B.; Fraga, B.A.L.; Henrique, D.S.P. Comparison of In Vitro erosion protocols in bovine teeth to simulate natural erosion lesion: Analysis of mechanical properties and surface gloss. J. Appl. Oral Sci. 2019, 27, e20180107. [Google Scholar]
- Zheng, J.; Zhou, Z.; Zhang, J.; Li, H.; Yu, H. On the friction and wear behaviour of human tooth enamel and dentin. Wear 2003, 255, 967–974. [Google Scholar] [CrossRef]
- Lucas, P.W.; Omar, R.; Al-Fadhalah, K.; Almusallam, A.; Henry, A.; Michael, S.; Thai, L.A.; Watzke, J.; Strait, D.S.; Atkins, A.G. Mechanisms and causes of wear in tooth enamel: Implications for hominin diets. J. R. Soc. Interface 2013, 10, 20120923. [Google Scholar] [CrossRef]
- Zhao, J.K.; Li, J.H. Comparative study on enamel microstructure of mammals and humans with different feeding habits. Sichuan J. Zool. 2009, 28, 505–508. [Google Scholar]
- Stenhagen, K.R.; Holme, B.; Tveit, A.B.; Lussi, A.; Carvalho, T.S. Analytical strategies for clinical studies on dental erosive wear. BMC Oral Health 2019, 19, 167. [Google Scholar] [CrossRef] [PubMed]
- Kato, M.T.; Italiani, F.D.M.; Araújo, J.J.D.; Garcia, M.D.; Salesperes, S.H.D.C.; Buzalaf, M.A.R. Preventive effect of an iron varnish on bovine enamel erosion In Vitro. J. Dent. 2008, 37, 233–236. [Google Scholar] [CrossRef] [PubMed]
- Pearson, E.S.D.; Agostino, R.B.; Bowman, K.O. Tests for Departure from Normality: Comparison of Powers. Biometrika 1977, 64, 231–246. [Google Scholar] [CrossRef]
- Faillace, K.E.; Bethard, J.D.; Marks, M.K. The applicability of dental wear in age estimation for a modern American population. Am. J. Phys. Anthropol. 2017, 164, 776–787. [Google Scholar] [CrossRef] [PubMed]
- de Carvalho Sales-Peres, S.H.; Magalhes, A.C.; Machado, M.A.D.A.M. Evaluation of the erosive potential of soft drinks. Eur. J. Dent. 2007, 1, 3–10. [Google Scholar] [CrossRef]
- Beatriz, M.; Larissa, R.P.S.; Mayara, S.S.; Marília, A.R.B.; Ana, C.M. Effect of an experimental mouth rinse containing NaF and TiF 4 on tooth erosion and abrasion In Situ. J. Dent. 2018, 73, 45–49. [Google Scholar]
Publisher’s Note: MDPI stays neutral with regard to jurisdictional claims in published maps and institutional affiliations. |
© 2022 by the authors. Licensee MDPI, Basel, Switzerland. This article is an open access article distributed under the terms and conditions of the Creative Commons Attribution (CC BY) license (https://creativecommons.org/licenses/by/4.0/).