Article

Breast Geometry Characterization of Young American Females Using 3D Image Analysis

1
Department of Textile and Apparel, Technology and Management, North Carolina State University, Raleigh, NC 27606, USA
2
Department of Clothing and Fashion, Pai Chi University, Daejeon 35345, Korea
*
Author to whom correspondence should be addressed.
Appl. Sci. 2022, 12(17), 8578; https://doi.org/10.3390/app12178578
Submission received: 14 July 2022 / Revised: 15 August 2022 / Accepted: 22 August 2022 / Published: 27 August 2022
(This article belongs to the Special Issue Computational Intelligence in Image and Video Analysis)

Abstract

:
The current research deals with the characterization of breast geometries in young American populations. Breast measurements using 3D image analysis tools are focused on spatial assessments, such as quadrant evaluations of angle, surface area, and volume, together with traditional linear measurements. Through the statistical analysis, different types of breast shapes and placements are clustered, and characteristic breast anthropometry was identified for each cluster. The research findings indicate that there are four shape clusters and three placement clusters. Among the American females aged 26 to 35, four different breast shapes are identified: droopy breasts (31%), small/flat breasts (19%), upward breasts (24%), and large/inward breasts (26%). Taking 36%, 44%, and 20% of the population, respectively, their breast placement characteristics are either high, medium, or low/open. Breast shapes and placement are highly associated with each other. Larger breasts are located relatively lower, while most smaller/flat breasts are positioned relatively high.

1. Introduction

Overlying pectoral muscles on the ribcage, female breasts are one of a few external organs not supported by the skeletal structure. There are no muscles in the breast either, as they are made of glandular and adipose tissue. The number of glandular tissues is not much different from person to person, and adipose tissues form the major mass of the breast. Flexible connective tissues, called ligaments, provide support to the breast, give it its shape, and hold the breast tissue in place [1,2,3].
There have been diverse aesthetic and functional concerns associated with breast dimension and shape. The common aesthetic concern is saggy breasts because their shape and movement are considered unattractive to see. Large-breasted women suffer more from this problem since breast mass is greatly associated with this [4,5]. They often experience functional discomfort such as pains in the back, neck, and shoulders [6]. On the other hand, the opposite issues are of concern for many women as well because small breasts are perceived as lacking feminine attractiveness regardless of the times and culture.
Named after the famous breast anatomist Astley Paston Cooper, the Cooper suspensory ligament plays an important role in having breasts adhere to the ribcage and shaping them in a unique way. Being composed of closely packed collagen fibers oriented in parallel, the ligaments are highly stable in structure [7]. However, the elastic characteristics of the ligaments are known to diminish by repeated intense breast displacements as well as over time [1].
Serving as external support to a breast, a brassiere re-shapes the bustline and controls breast movements [8,9]. It is also known to be one of the preventive tools to avoid breasts becoming sagged [4]. It is important to ensure bra cup size and fit for engineered support and discomfort reduction [10,11], and therefore, it is helpful to understand the diverse shapes of breasts prevailing in specific populations [12,13]. Recently, there have been an increasing number of studies in some countries, specifically in Australia, China, and South Korea, but few studies have been completed for American populations.
Scholarly interests in breast size and shape were initiated from the surgical concerns related to breast augmentation and reduction. This effort aimed to develop reliable methods to quantify breast geometry [14] and to establish standardized criteria on ideal breast size and shapes preferred in general [15,16]. This could help plastic surgeons to minimize subjective perspectives in assessing cosmetic effects and maximize aesthetically pleasing outcomes.
Plastic surgeons have used the relevant position of breasts over the ribcage as an important landmark providing useful tools to appraise breast aesthetics. The breast position could be easily quantified by the distance between a suprasternal notch to a nipple. Penn [17] claimed 21 cm to be most desirable, and that was close to the average distance, ~20 cm, found in females in their twenties [18]. According to Brown et al. [19], there was about a 3 cm length difference in nipple placement between large-breasted women with a breast mass of 500 g or more (19.5 cm) and small-breasted women of 500 g or less (16.5 cm). Charles-de-sa [20] reported the dimensional increase from 5.9 cm to 8.6 cm in lower breast arc and from 10.5 cm to 13.7 cm in breast depth after breast augmentation. The augmentation led to a change in the distance between a suprasternal notch to a nipple from 19.12 cm to 19.87 cm. In the case of breast reduction, the removal of ~1200 g in breast mass resulted in nipples being lifted by ~13.5 cm [21].
Affecting the fit of upper garments, body shape variations in the chest and shoulder areas have been of great interest to flat pattern designers as well. Joseph-Armstrong [22] advised that the aesthetically pleasing body proportions are with ~21.59 cm girth differences between the bust and waist; and ~31.75 cm between the waist and hip. She emphasized that this is suggested to be ideal for Western people, and the body proportion is never universal because of the variety of anatomical figure types. In terms of the chest–bust structure, five different shapes were specified, namely, harmoniously protrude, large bust with small back, small bust with full back, hollow-inward, and pigeon [22]. However, this categorization came from the author’s experience and the insights of a fashion designer and was not supported by any anthropometric data or scientific evidence.
More systematic approaches have been taken actively by northeastern Asian researchers. Sohn [4] studied the breast shapes of Korean females in their twenties and classified them into four clusters. Each cluster was characterized to be flat, spheric, protruded, and drooped in the breast shapes. These four types of breast shapes were supported by other studies [23,24], while the populations of each type clearly differ between generations (Table 1). Cha [25,26] investigated Chinese women and concluded with the four clusters of dome-shaped, cone-shaped, flat, and protruded breasts. The classification does not look much different from Korean studies, but considering the prevalence of each cluster (Table 1), there were differences between ethnicities.
Earlier than these, Hiraoka [27] identified four breast types among Japanese populations, which were described as pigeon shape, cat-back shape, protruding scapula, and protruding stomach. These approaches seemed to be meaningful as one of the earliest studies that advanced the understanding of breast geometries. Being published locally by the proprietary institute, however, those research findings were not globally disseminated and were unavailable to international scholars.
In the study of Coltman et al. [5], where the breasts of ~350 Australian females were evaluated, the researchers categorized the breast shapes into four groups. Those groups were described as very-ptotic, ptotic, mildly-ptotic, and non-ptotic breasts, while each coincided with extra-large, large, medium, and small breast sizes, respectively. Five torso measurements were considered for the group identification, which were breast volume, surface area, the distance between sternal notch and nipple, and underbust girth. This study emphasized how breast size dominated the vertical location but did not illustrate shape variations other than breast dimension.
Age and body mass index (BMI) are known to be highly associated with breast shapes. There was a tendency that larger and droopier breasts were found more in the population 65 years or older [5]. It was also reported that the breast size became significantly larger with higher BMI [4,24]. Among the plus-sized groups of females whose BMI was larger than 25, the most breast volume was present in the upper inner quadrant, which was about one-third of the entire volume, while the least volume was found from the lower outer quadrant. These breasts were also observed to be downward and outward [12]. Despite their high BMIs, the bra cup size was diverse from sizes A to F, where most were in B (24%), C (28%), and D (23%) sizes [12].
Breast measurements considered in prior research are summarized in Table 1. Various lengths, angles, and volumes were taken into account when identifying breast shape clusters, but none of the research employed all scopes of those measurements. Moreover, since human breasts are highly three-dimensional and nonlinear in their shape, most measurements relying on linear evaluations, such as length, width, and depth, do not look to represent the breast shape well [16]. Breast volume has been actively engaged in some studies [4,5], which is useful for estimating overall breast size. However, the volume measurement would not be sufficient to detail breast shape variations in a geometrical sense. More comprehensive approaches are necessary to suggest the impactful breast measurements characterizing breast geometries and defining breast shapes.
The current research proposes a comprehensive analysis of breast geometry by employing all-encompassing measurements. The measurements include angles, volumes, surface areas, and cross-sectional areas, as well as length, width, and depth. Each measurement is evaluated at the quadrantal sides to focus more on shapes and geometries than dimensions. Another methodological improvement is to separate the breast placement aspects from their shapes. Placement specifies the relative location of breasts to upper body structures, which could be independent of the breast shapes. This approach enables spatial assessments with an emphasis on three-dimensional characteristics.
Young American females were selected because this population has never been studied for breast geometry characterization. Considering that the anatomical figures and body proportions vary according to demographic characteristics [22], it would be valuable to investigate how this specific group differs from other populations. The target population was selected and screened from the Size USA database, and individual body scan files were three-dimensionally inspected using 3D image analysis tools. Through the statistical analysis, different types of breast shapes and placements were clustered, and characteristic breast anthropometry was identified for each cluster. A meaningful relationship between breast shapes and placements was also investigated.

2. Materials and Methods

2.1. Body Scan Data

The body scan files were obtained from the Size USA database. There was a total of 1550 scan files available in the age range of 26 to 35, which were classified into five different ethnic groups, white, African American, Hispanic, Mexican American, and Asian. Since breast shapes are known to vary significantly depending on race, the research scope was narrowed down to white people, and 678 scan files became available. This number was further screened by removing the extreme cases. Referring to the means and standard deviations of height, weight, bust girth, waist girth, and upper body length (Table 2), 298 scans were selected, which stayed within the standard deviations from the averages. The purpose of this screening was to better represent the average body build of young females as well as to reduce the number of scans into reasonable numbers for individual image analysis. The descriptive summaries of this selected group are given in Table 2.
The number of selections decreased to 156 people because there were considerable cases of unexpected errors and flaws associated with the body scans. Due to the cramped armpit area between the upper chest and under arms, scanning accuracy might have been limited in this region. The inaccessibility caused troubles while the meshes were generated over the lateral surface of breasts, leading to the meshes missing across large areas, in significant distortion, and connected to the upper arms. Out of the 298 files selected as described above, only 156 files were reasonably processible for 3D image analysis. The height, weight, bust girth, waist girth, and upper body length of the final group are described in Table 2.

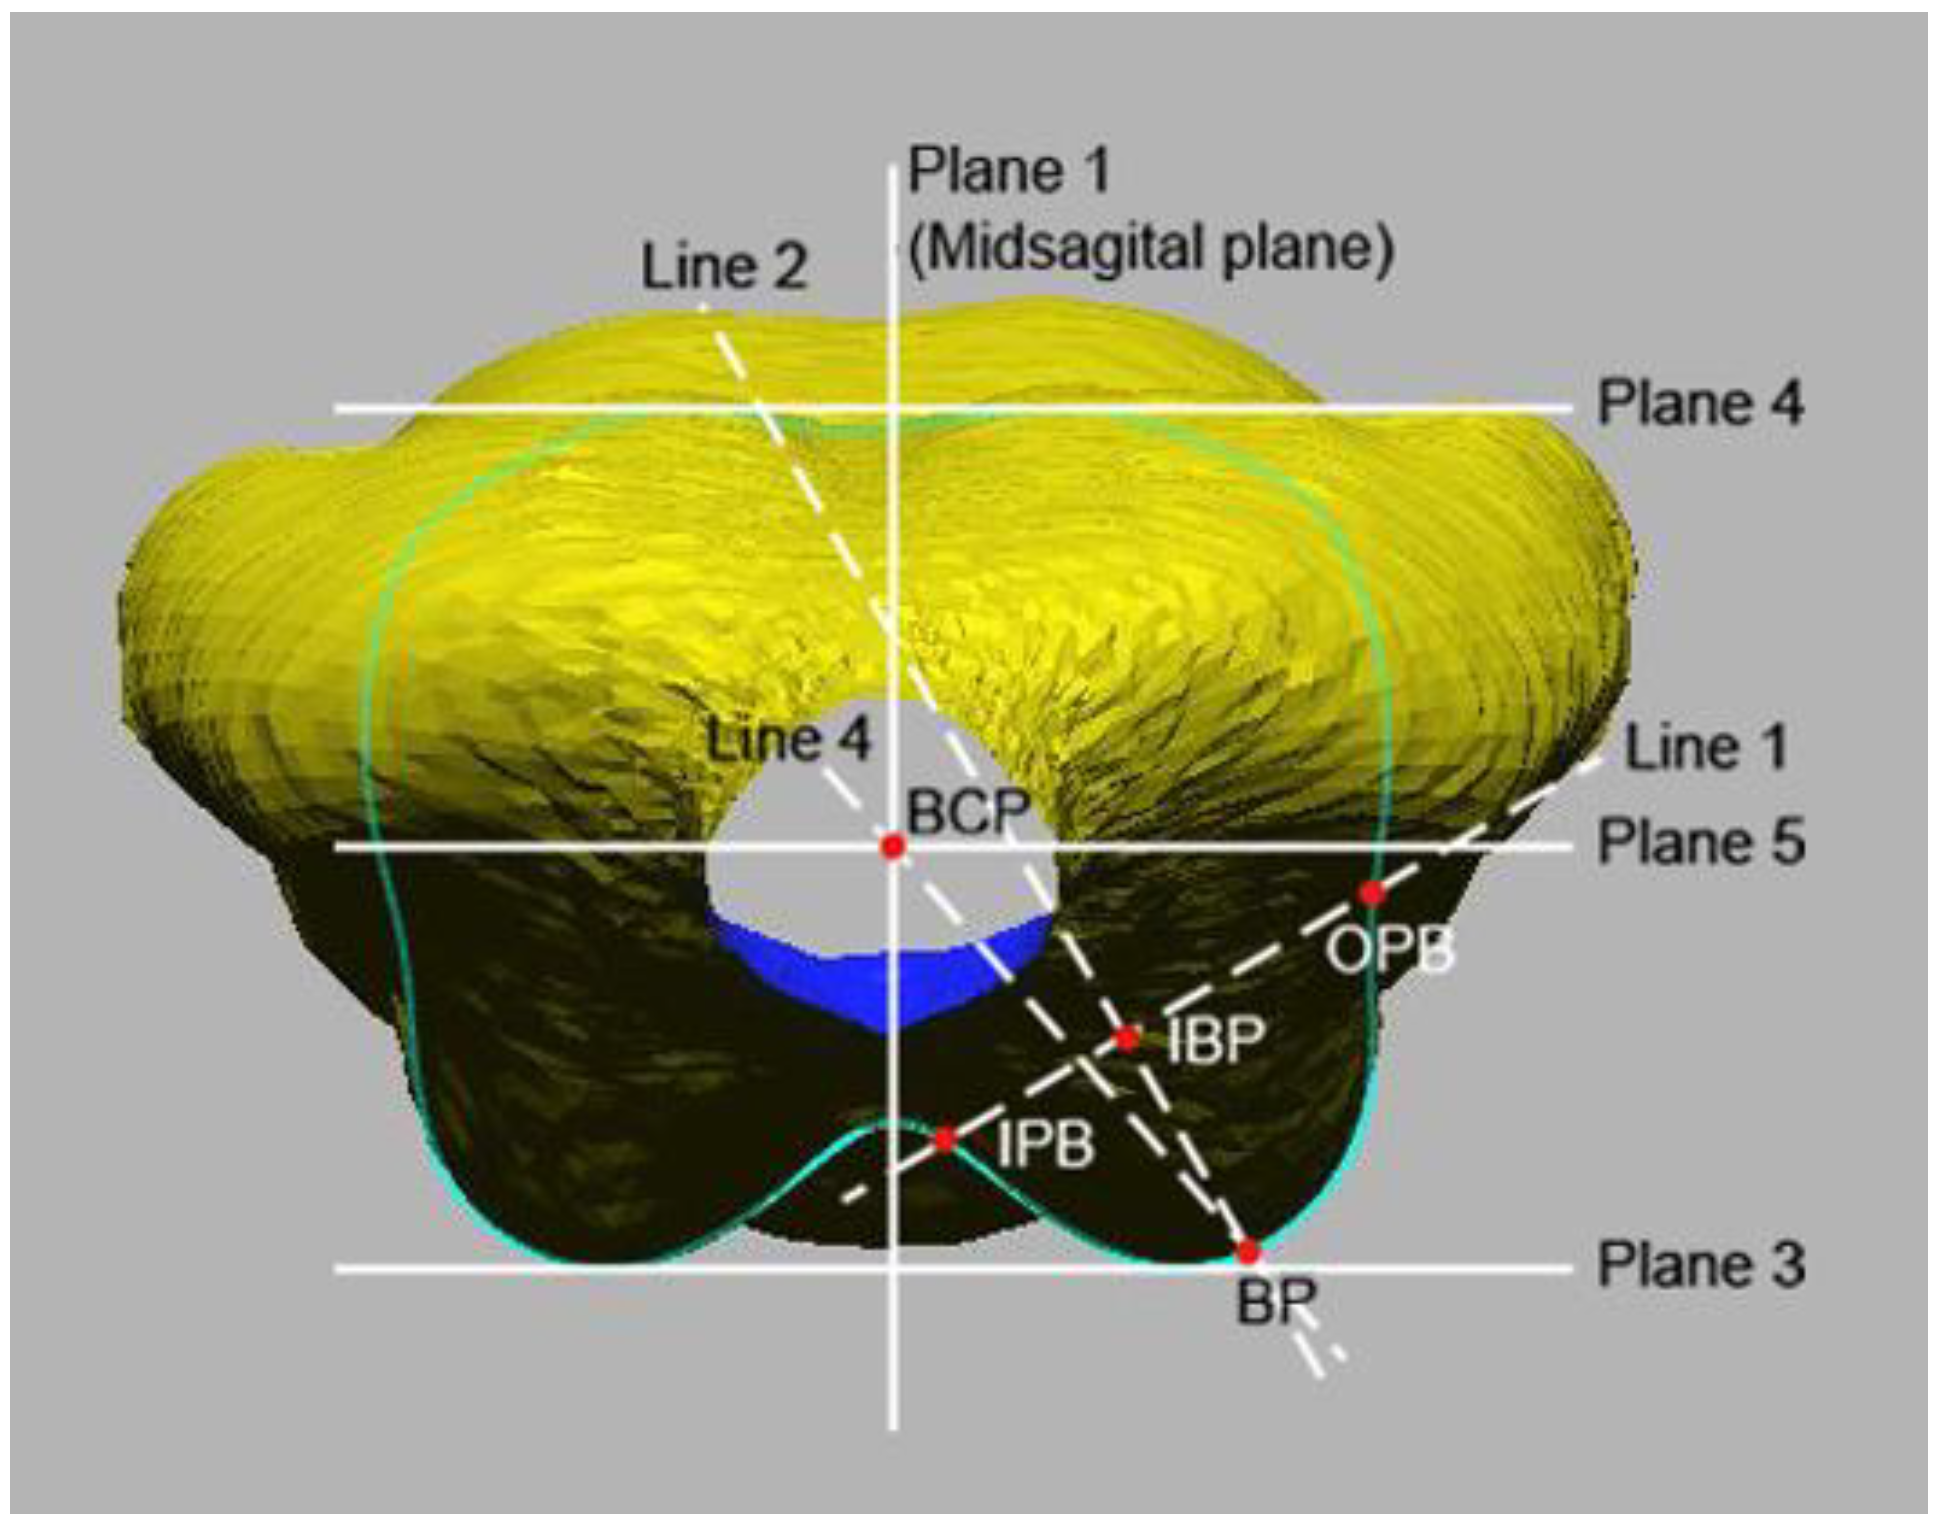
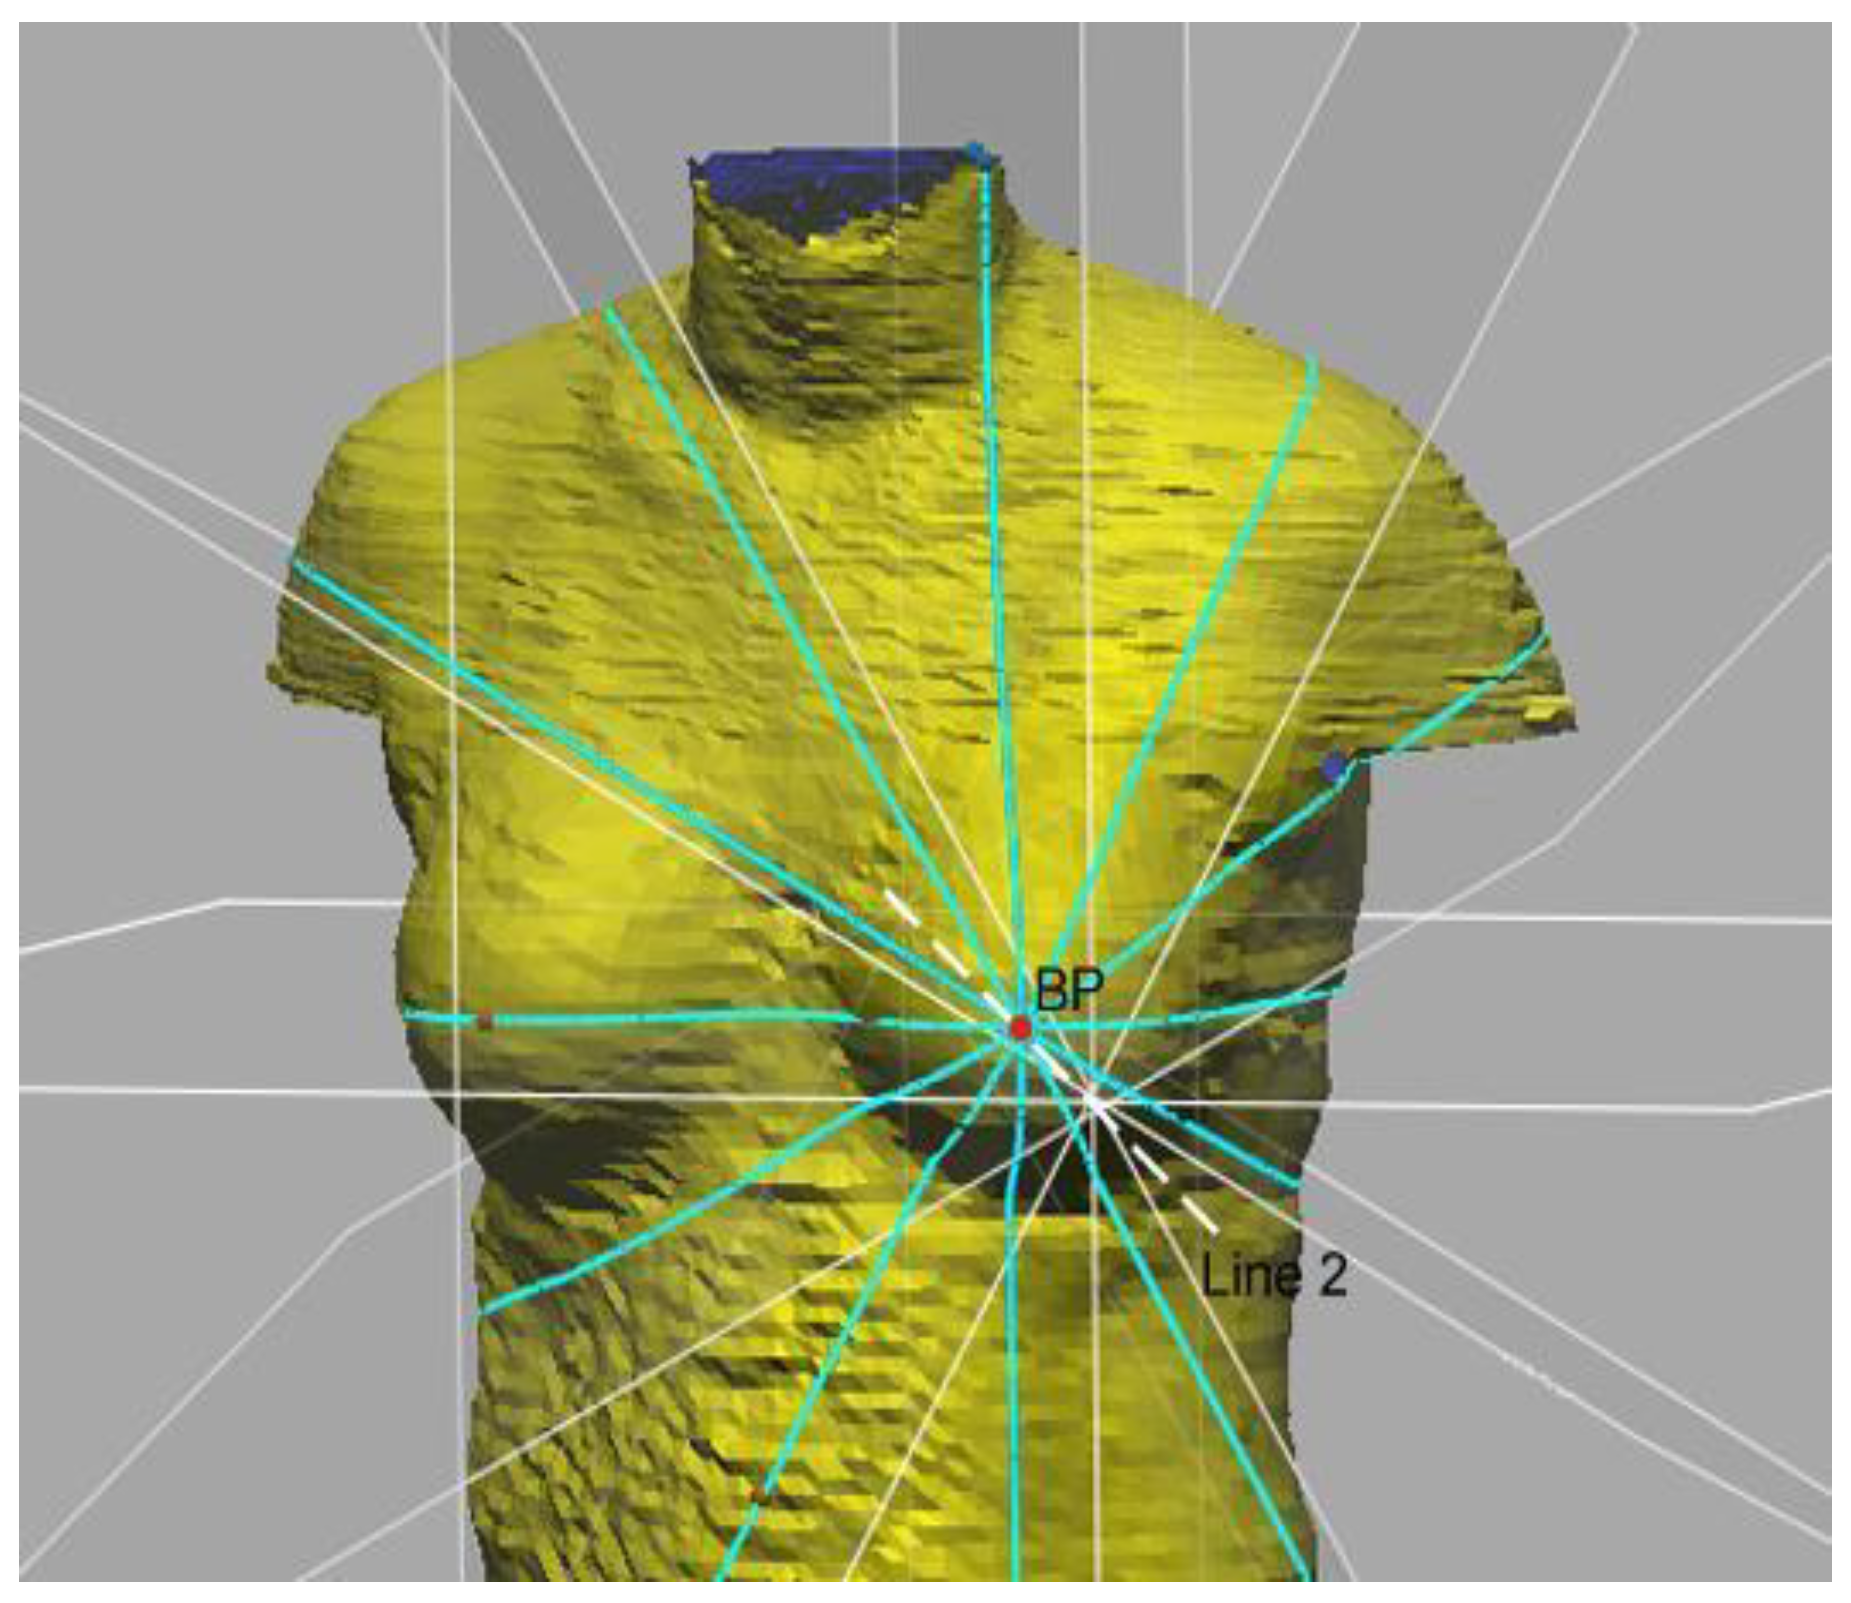
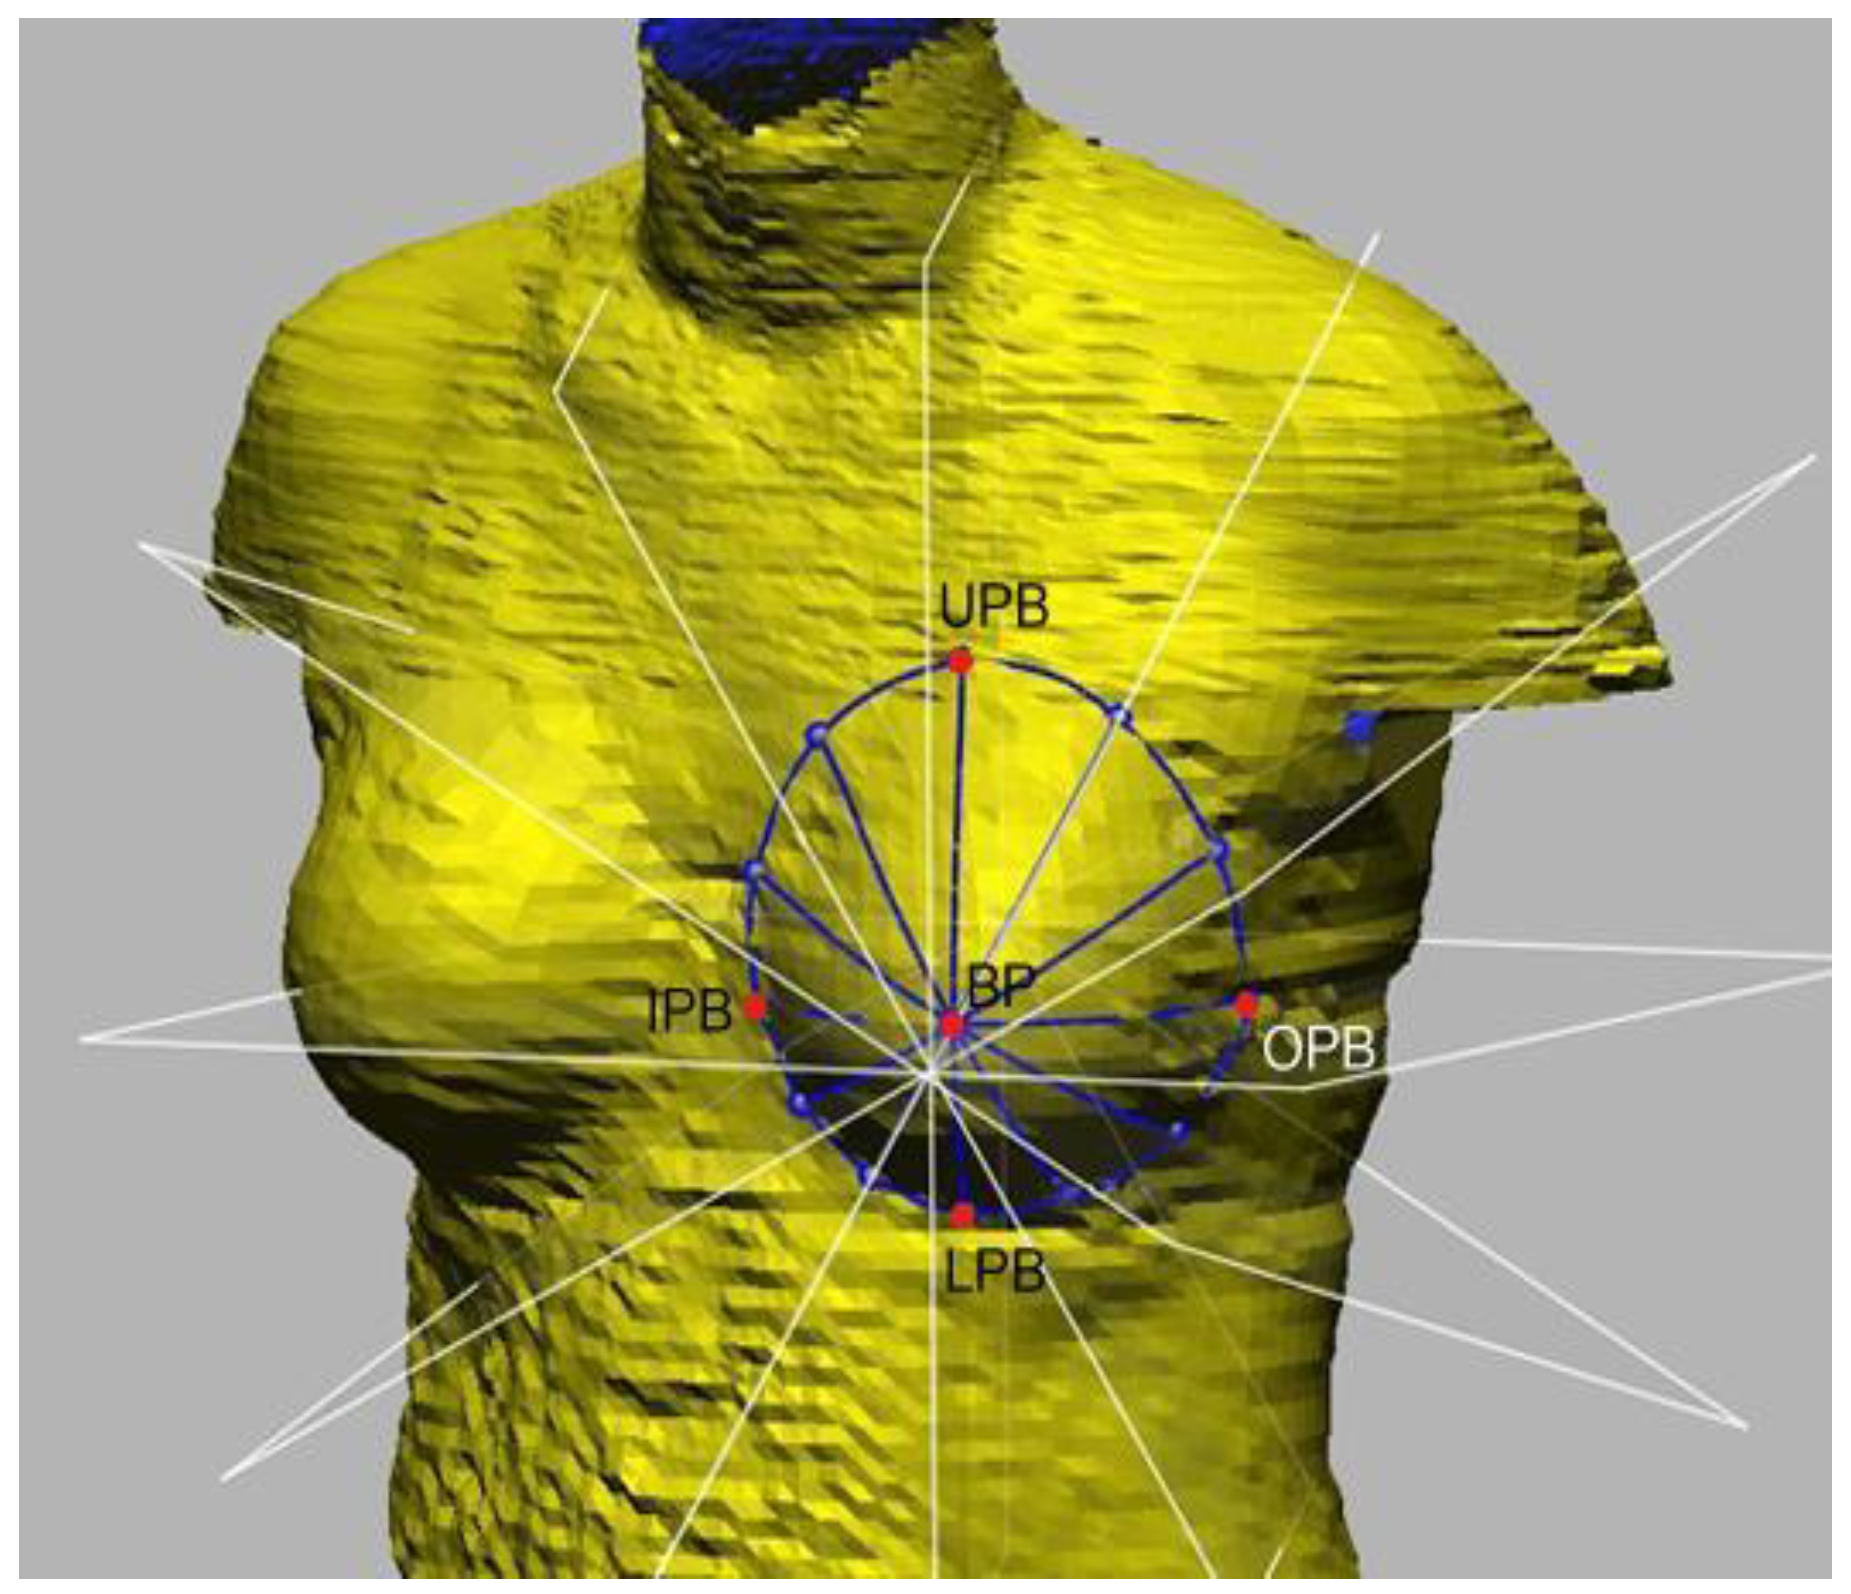
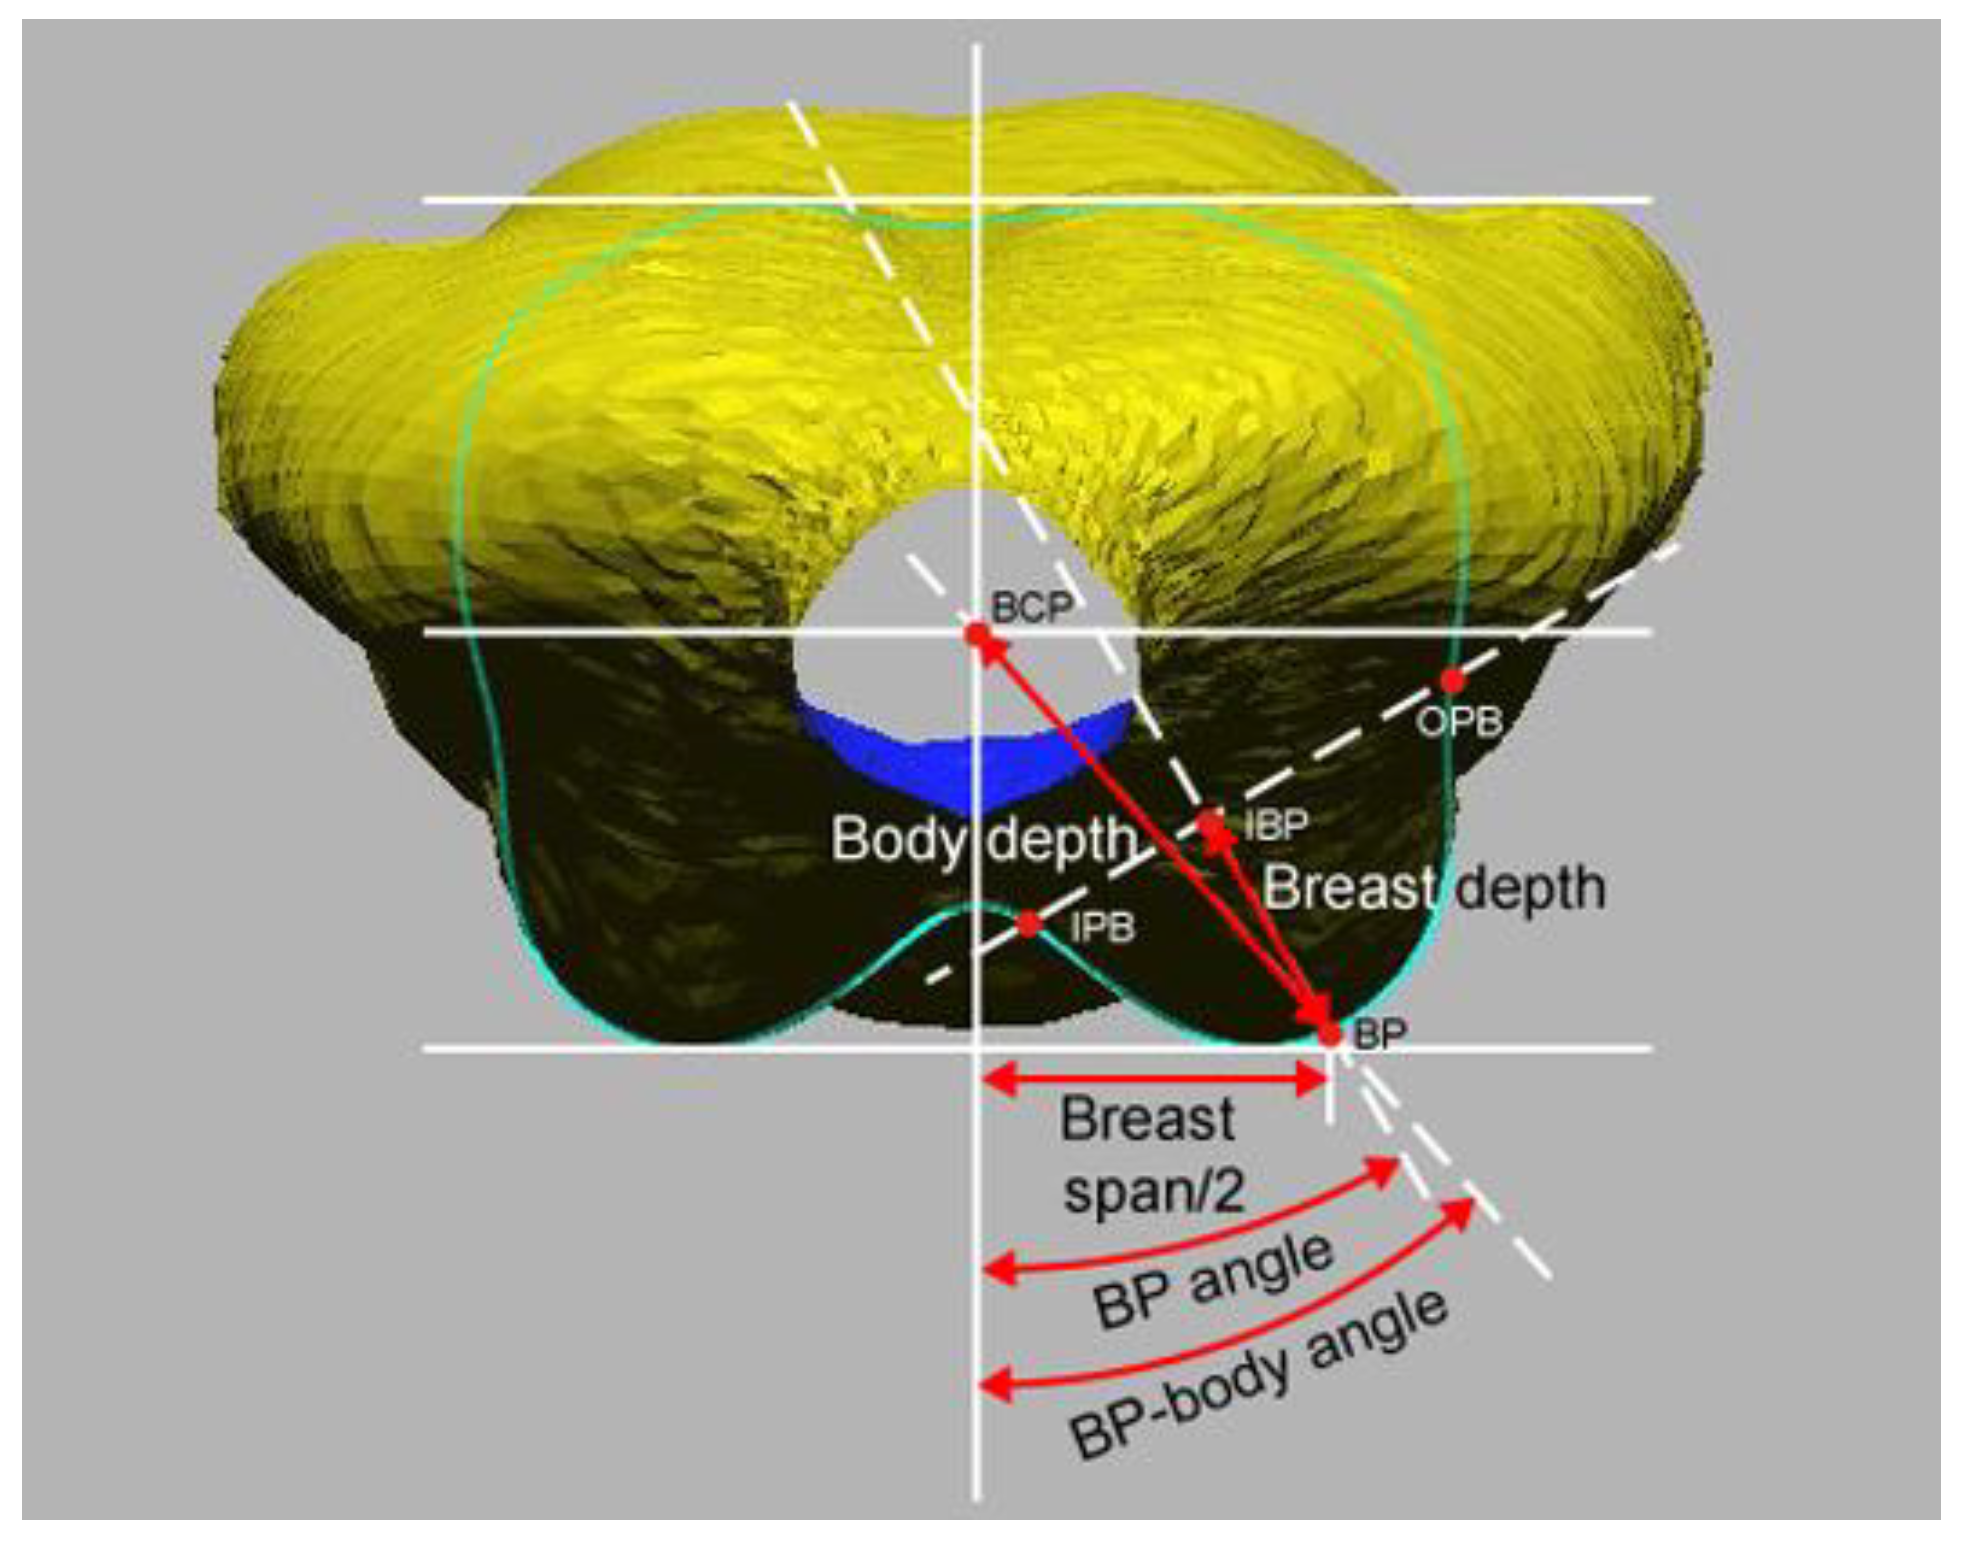
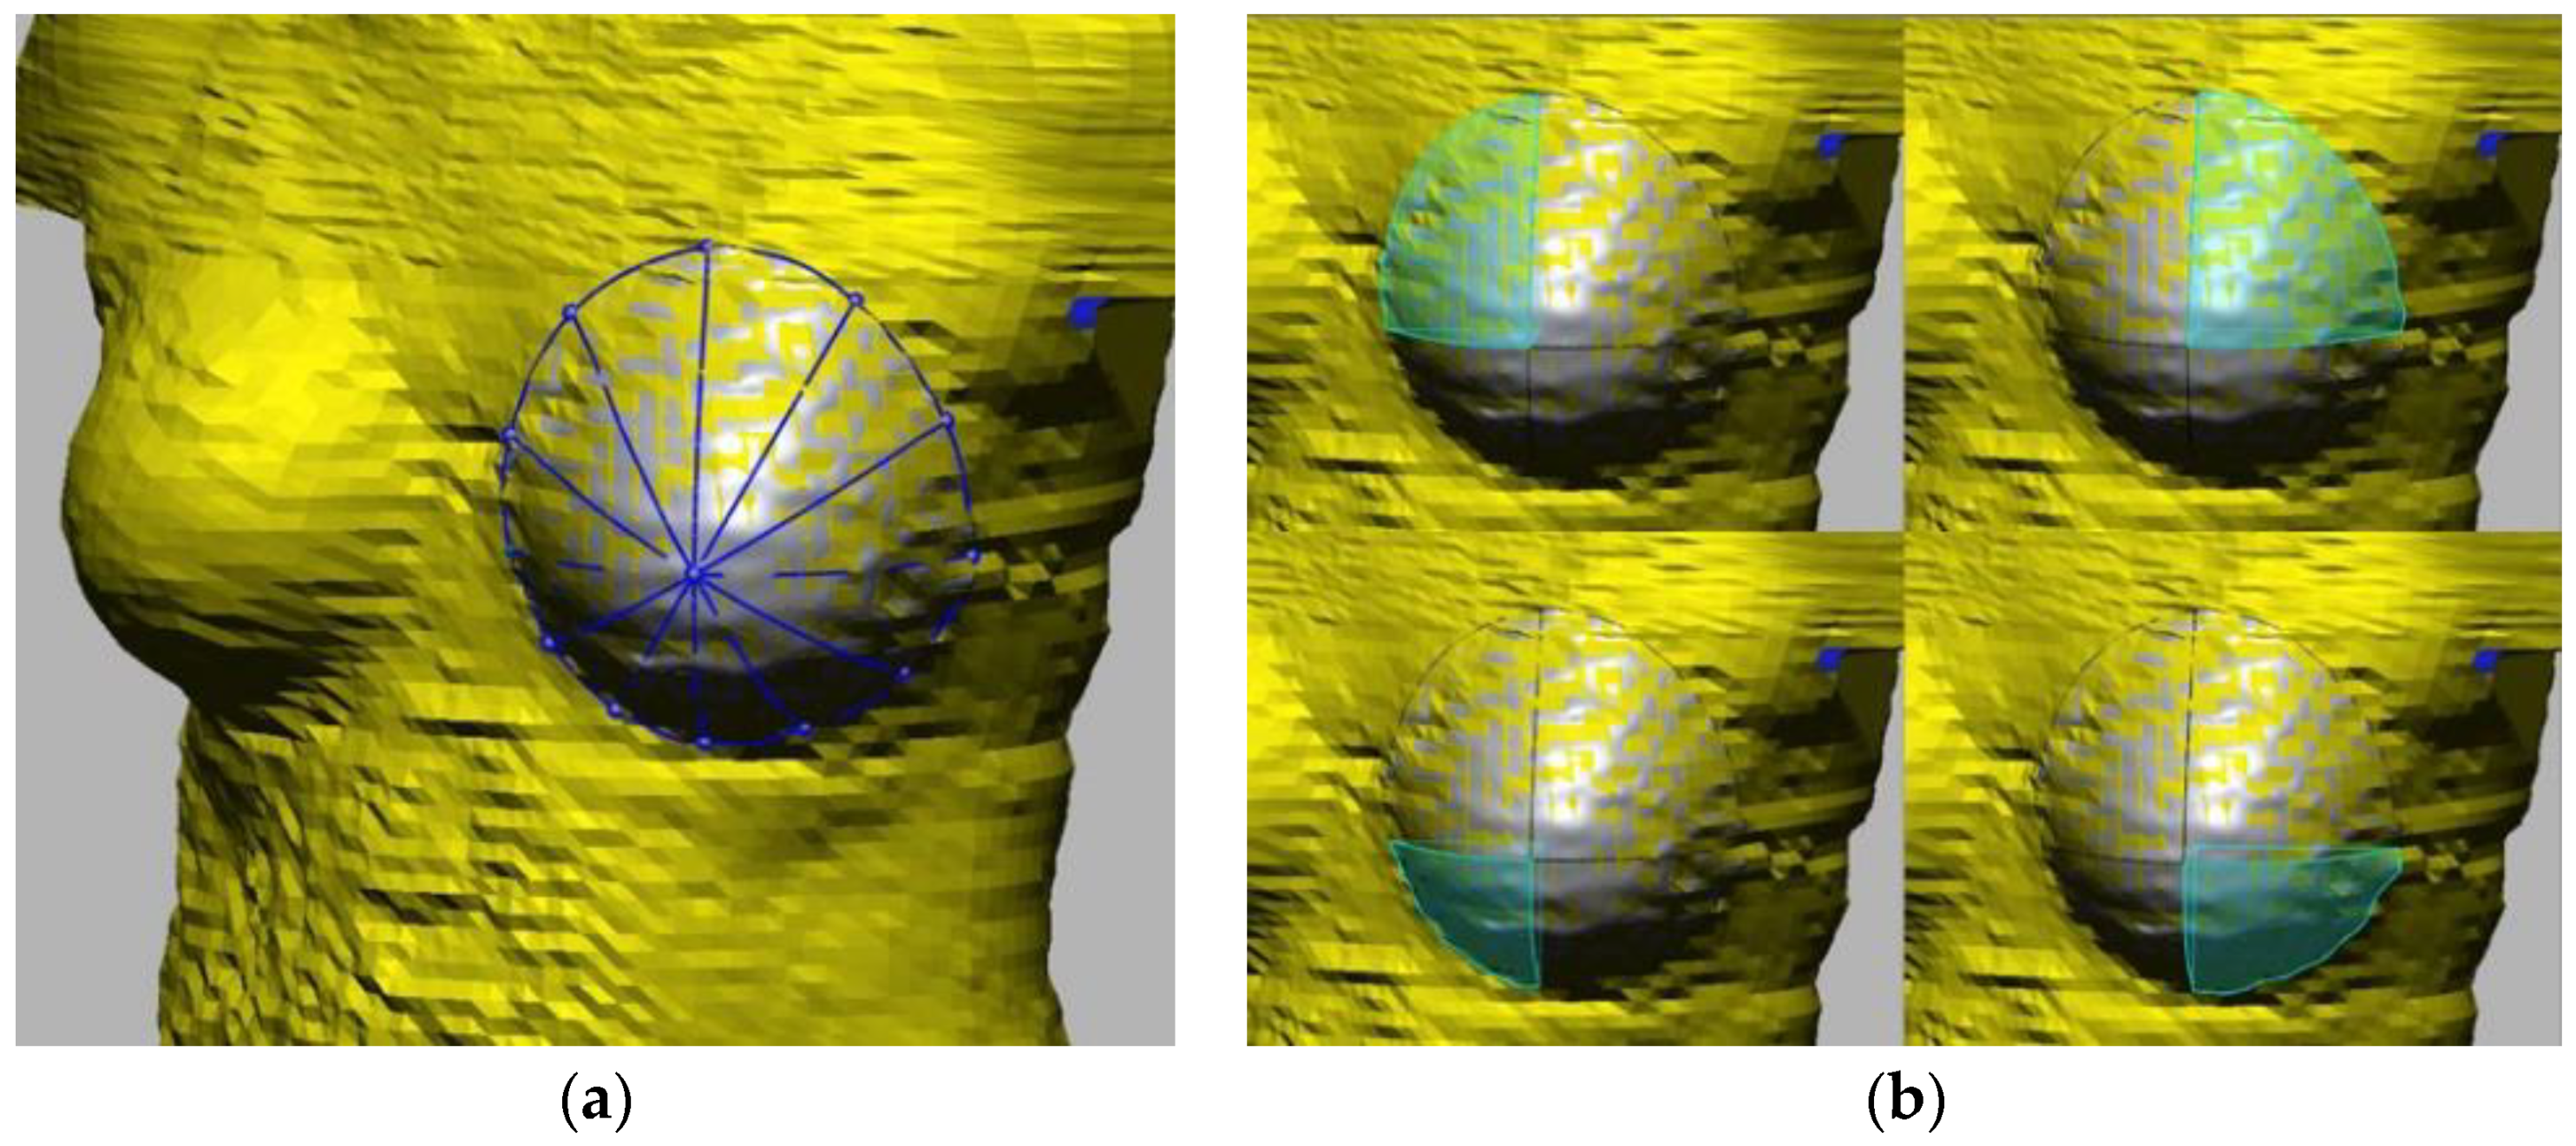
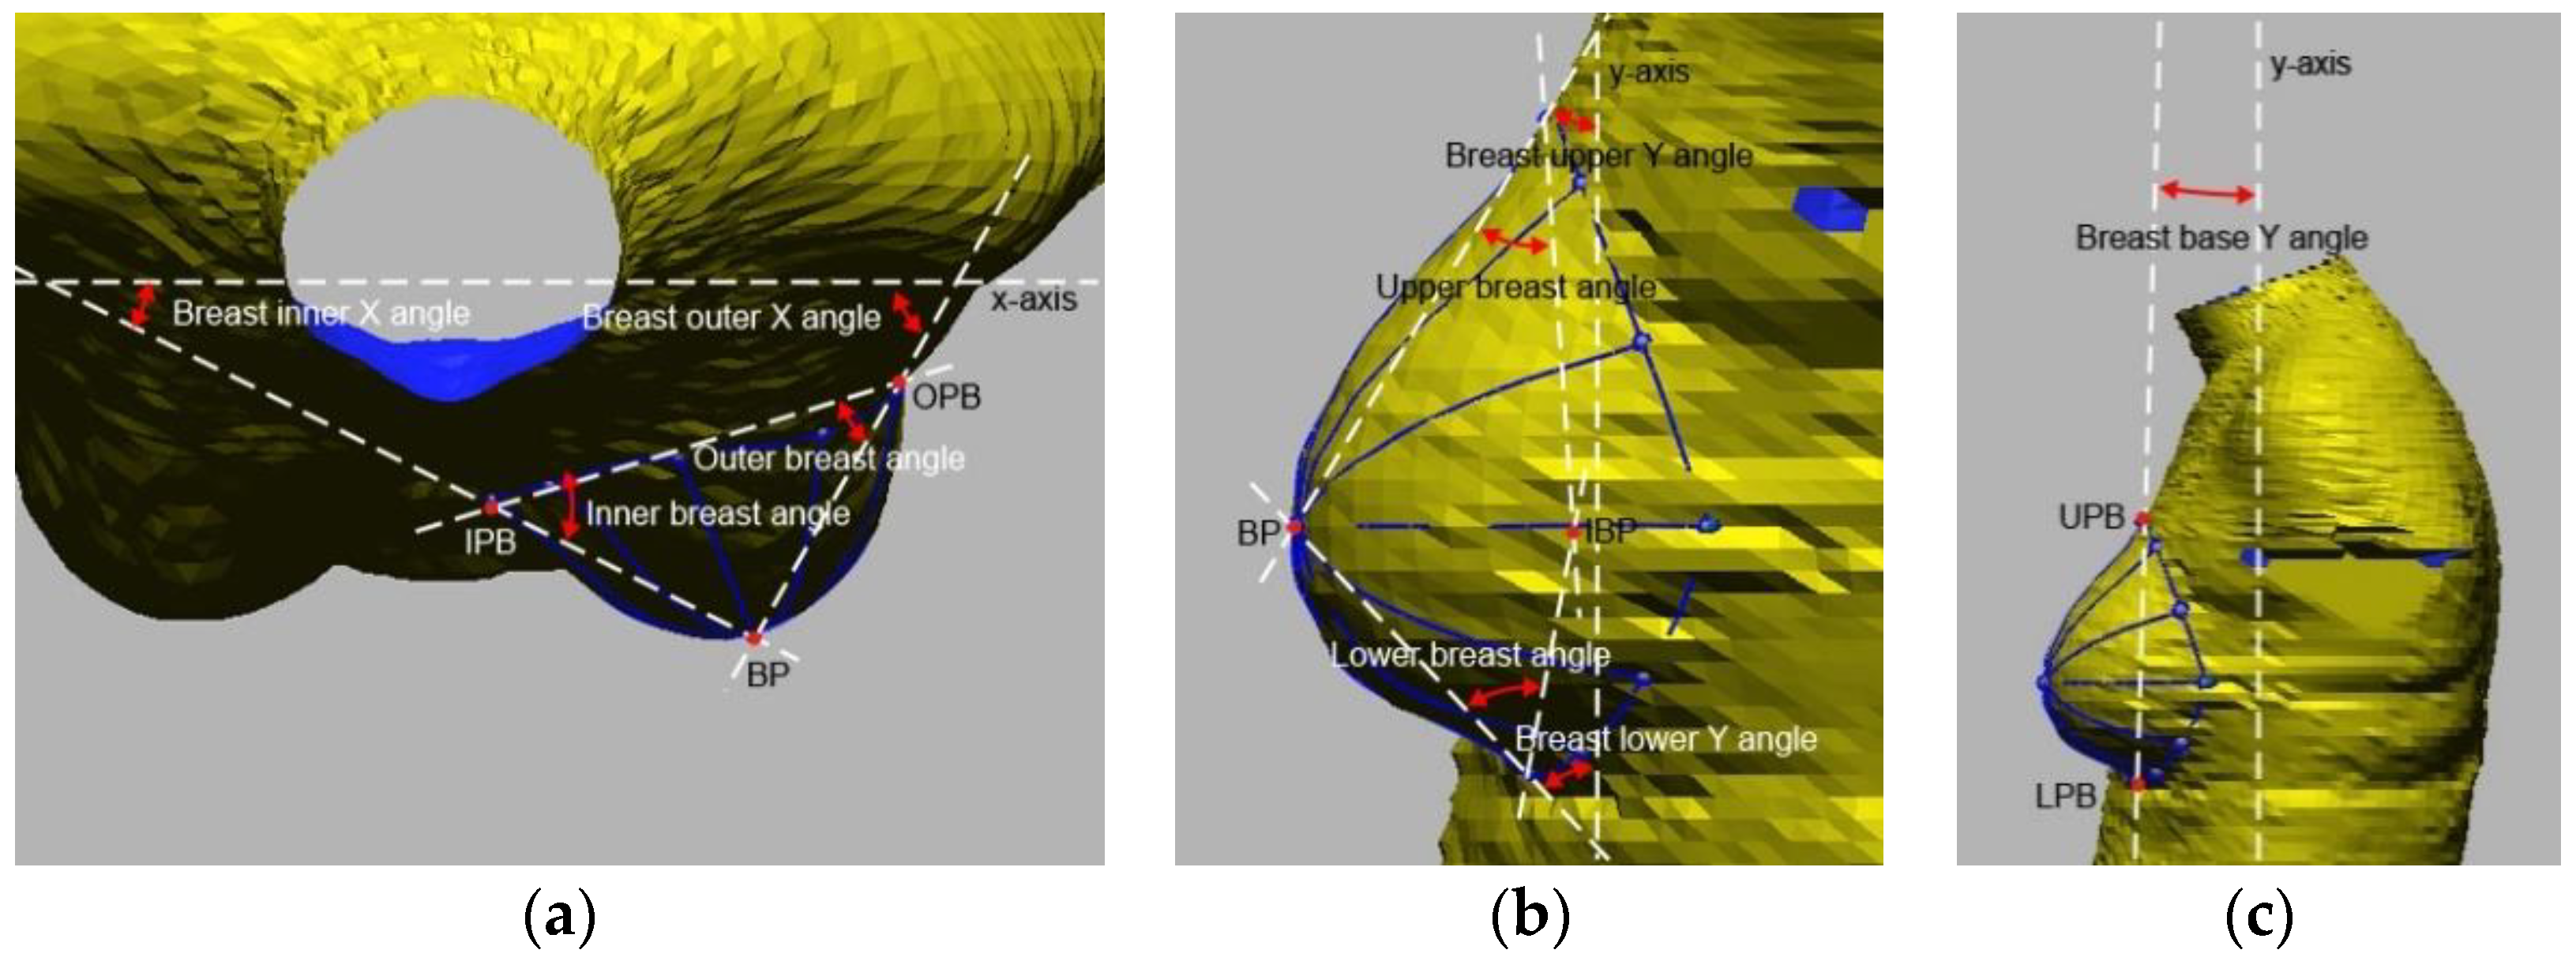
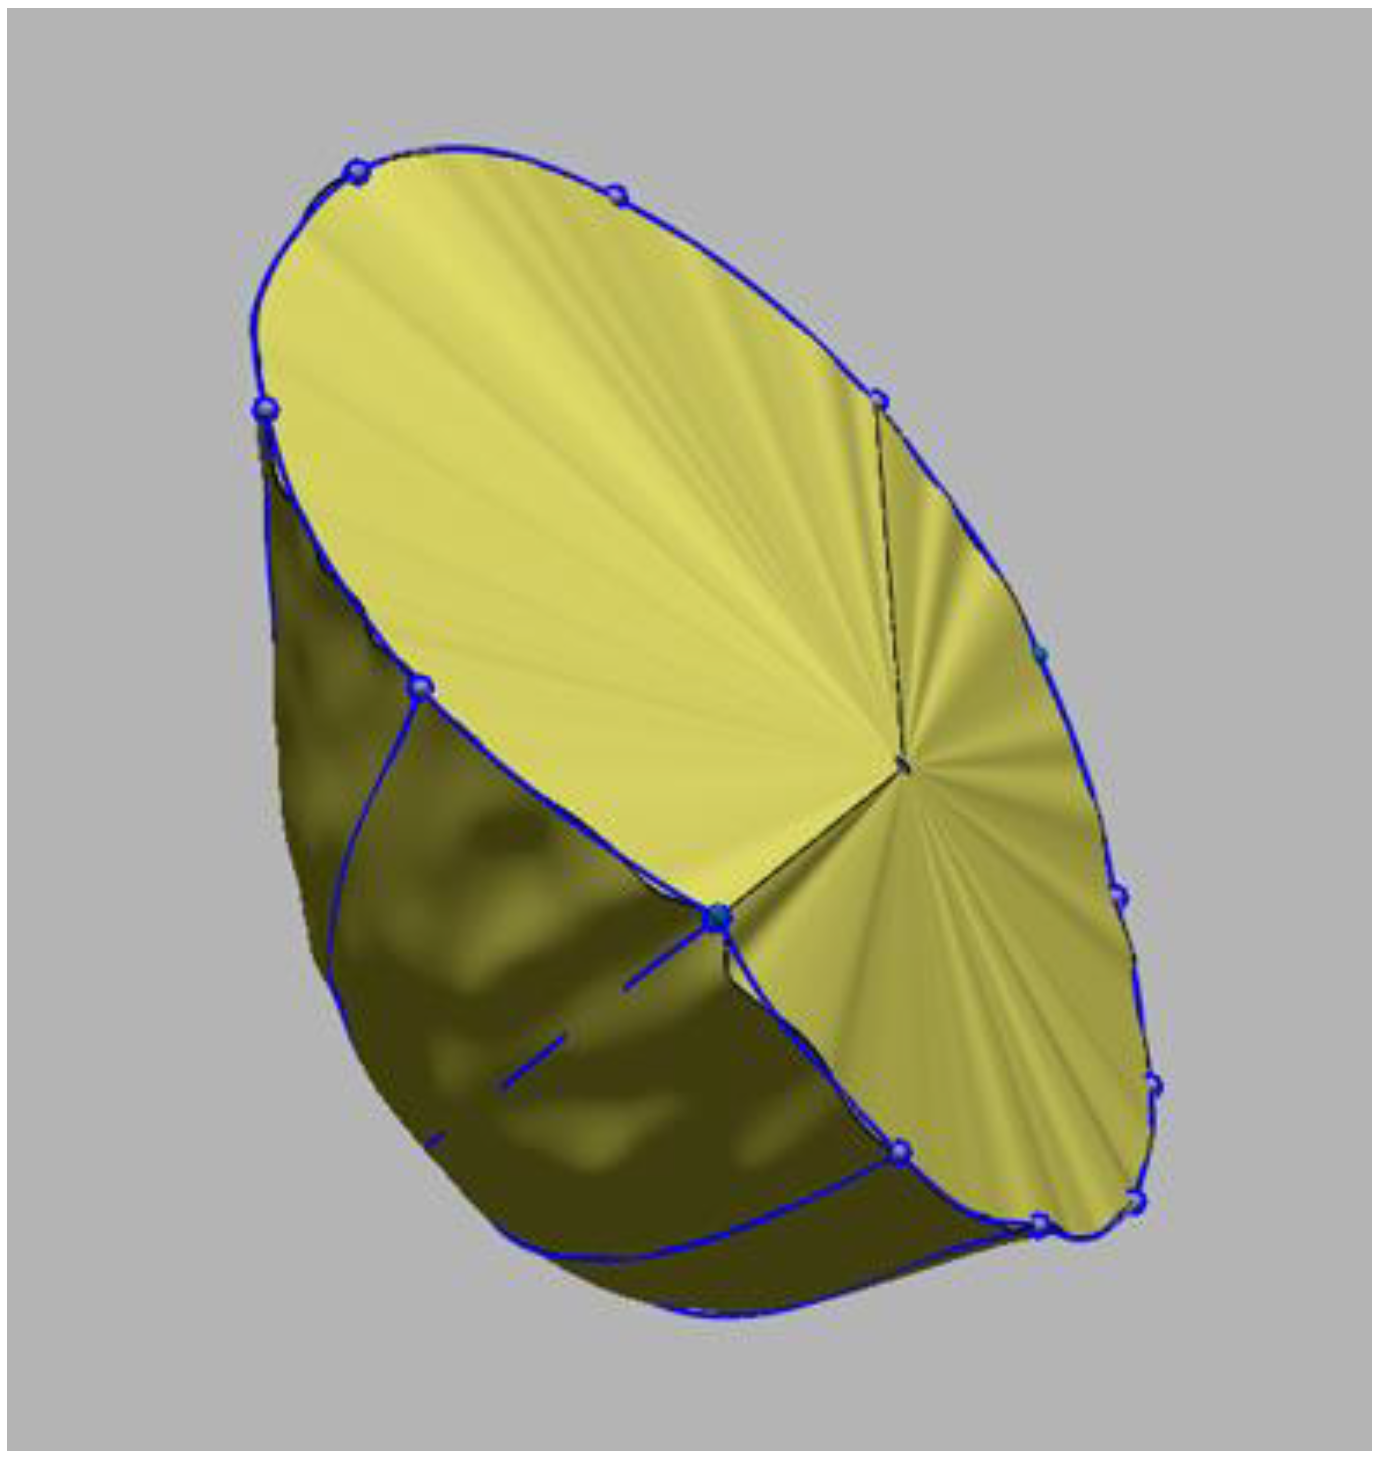
2.2. 3D Image Analysis

After screening the SizeUSA database, 156 scan files were imported to a 3D image analysis tool, GeoMagic Design X (3D System), and processed to extract the breast measurements. The basic reference points were defined, and they are summarized in Table 3. A bust point (BP) was located after a visual assessment of the most prominent point of the breast. An inner bust point (IBP) was declared as an additional important reference for the further investigation of breast geometry, which was the bust point projected on the breast base (Figure 1). The breast base was placed along the ribcage that separated the breast cup from the body. The body center point (BCP) was defined as the sagittal/transverse midpoint of a body at the BP level. The upper, lower, inner, and outer points of the breast (UPB, LPB, IPB, OPB) were located to define the breast boundary. The procedures to identify the reference points are as follows.
IPB and OPB were placed first at the BP level after reviewing the cross-sectional body contour along the transversal plane (Figure 1). The inner bust point (IBP) was located on the line connecting IPB and OPB, where the normal line from BP landed. Based on this line, the transversal plane at the BP level was rotated every 30°, and 12 radial lines were formed around the BP where the body mesh met each rotated plane (Figure 2). Twelve breast boundary points were located on each radial line after reviewing its shape, where the curvature of the breast cup started to dim. Four major boundary points were named UPB, IPB, LPB, and OPB in 12, 9, 6, and 3 o’clock directions, respectively. By connecting these 12 boundary points, the breast boundary was defined (Figure 3).
The breast-specific measurements were extracted based on those reference points, lines, and planes. The total number of measurements was as many as 39 (Table 4), including various lengths, angles, areas, and volumes. The length measurements were either contour lengths measured along the meshes or linear lengths across the space. Breast depth was the distance between BP and IBP, and body depth was defined between BP and BCP (Figure 4). Several measurements were converted into ratios when proportions were considered more meaningful than absolute dimensions because some dimensions were substantially dependent on breast size or body build. For example, the distances between BP and shoulder points were divided by the upper body length and expressed as percentages.
Breast volume could be calculated after creating the breast base. The breast base was established by modeling a surface that started from the breast boundary and converged into the inner bust point (Figure 5). Using UPB, LPB, IPB, and OPB, the breast volume was divided into quadrantal sections (Figure 6), and relative volume distributions were estimated in percentage for each quadrant. The surface areas of the breast cup and base were calculated accordingly. The angles between the breast cup and the base surface at UPB, LPB, IPB, and OPB locations were measured as breast angles (Figure 7). To understand how the breast cups were located on the body in relation to the slope of the ribcage, those angles were re-estimated toward the body axes and noted separately as X- or Y-angles (Table 4).
Not all measurements were used for breast shape and placement cluster analyses. The measurements were sorted into 26 shape-relevant aspects and 15 placement-relevant aspects, as indicated in the far-right columns of Table 4. For shape analysis, all the measurements of contour lengths, linear lengths, areas, and volumes were included, but body depth and breast-body depth ratio were excluded since they are not sole breast measurements but are associated more with body dimensions. In addition, for the same reason, only upper/lower/inner/outer breast angles were adopted from angular measurements for shape analysis. Placement-relevant measurements took 4 shoulder distances, 4 linear lengths, and 7 angles, including those excluded from shape analysis. Breast depth and span were the only 2 measurements that were used in both analyses.

2.3. Statistical Analysis

Four different statistical methods were used to meet the research objectives. Factor analysis assisted in distinguishing meaningful breast measurements that can characterize different breast shapes and placements. Based on the factor analysis, reasonable groups were classified by non-hierarchical K-means cluster analysis. The number of clusters was decided considering apparent characteristic features between clusters and the even distribution of data for each cluster. Analysis of variance (ANOVA) and the post-hoc study were followed to identify the unique geometric characteristics of each cluster for the breast shapes and placement. Finally, the relationship between breast shape and placement was evaluated through chi-square tests. IBM SPSS Statistics for Windows, version 17.0 (IBM Corp., Armonk, NY, USA) was used for statistical analysis.

3. Result and Discussion

Through factor analysis and cluster analysis, breast shapes and placements were classified into four and three clusters, respectively. As the number of clusters increases, more detailed segmentation becomes possible, but this leads to the problem of unrepresentative clusters with an extremely low number of cases assigned. Each breast measurement was compared between the clusters, and the geometrical characteristics were identified cluster by cluster. The correlations between the shape and placement clusters were investigated as well.

3.1. Breast Shape Analysis

As Table 5 illustrates, five shape components were extracted from 26 measurements by principal component analysis. Varimax rotation was used, and the rotation converged in seven iterations. The first component consisted of most of the measurements, which were related to breast dimensions, including total volume, arc, and linear lengths. The second and third components were represented by widthwise and height-wise ratios, respectively. The fourth component was explained by breast angles. From multiple perspectives, the inner breast measurements were found to belong to unusual components. Unlike other widths/heights and angles, the inner width and angle settled in the second component. The ratio between breast width and height solely formed the fifth component.
Factor analysis allowed factor scores to be calculated for each component, and these scores assisted in distributing the 156 breasts into four shape clusters. A total of 156 cases were split into 48, 30, 37, and 41 cases to form each cluster. One-way ANOVA supported the classification, where all measurements had meaningful F-values at p = 0.000 significance level. Scheffe’s post-hoc analysis was followed to see the unique geometrical characteristics of each cluster.
The post-hoc results are summarized in Table 6. Clusters 2 and 4 had obvious geometrical features being significantly small and large, respectively. Most arc, width, height, and depth measurements, as well as areas and volumes, recorded largest with cluster 4 and smallest with cluster 2. Cluster 4 had an average breast volume of 726 cm3 with a breast base area of 220 cm2 and a breast depth of 71 mm. In contrast, the average breast volume of cluster 2 was less than half of cluster 4, 324.552 cm3, with a breast base area of 150 cm2 and a breast depth of 50 mm.
Clusters 2 and 4 were characterized for additional features in addition to being small and large. The smallest angle measurements suggested that cluster 2 had flat breasts. In particular, the inner and outer angles were measured to be significantly smaller than other clusters (Table 6). In the case of cluster 4, their breast shapes were inward, as indicated by the lowest inner-outer width ratio and largest inner breast angle. A low inner–outer width ratio means that inner breast width is relatively short compared to outer breast width. This happens when the bust point leans to the medial side, which coincides with having the largest inner breast angle. This characteristic in the shape was also supported by the longest outer width (Table 6).
The breast shapes of cluster 1 could be explained as droopy and long. This was evidenced by the lower–upper height ratio and width-height ratio being significantly smaller than the other clusters. Size-wise, cluster 1 was neither small nor big but showed as small volume percentages as cluster 2 in the lower breast quadrants. Cluster 1 had approximately 40% breast volumes in lower quadrants, which indicated the bust point leaning downwards. Relatively long upper breast height also supported the droopy characteristics of cluster 1 (Table 6).
Similar to cluster 1, cluster 3 was neither small nor big in size, but its upper breast height was recorded as small as cluster 2. Furthermore, the lower volume percentage was as large as cluster 4. With the upper breast angle larger than other clusters, cluster 3 seemed to be in upward shapes. While all other clusters had large breast volume, the early 30s in percentage, in the upper outer quadrant, cluster 3 had an exceptionally low volume percentage in the upper outer area. The lower inner volume percentage was abnormally high instead. The lower–upper height ratio was the largest although it was not statistically significant (Table 6).

3.2. Breast Placement Analysis

In breast placement factor analysis, four components were extracted from 15 measurements by principal component analysis (Table 7). The component matrix was rotated by the Varimax method in five iterations. The first component was explained by the measurements related to longitudinal placement, represented by distances between BP and shoulder points. In contrast, the second and third components were associated with sagittal and transverse characteristics, respectively. The last component could be explained by the breast base angle against the longitudinal axis of the body.
There were three placement clusters established, having 56, 68, and 32 cases each. One-way ANOVA supported the classification at a p = 0.000 significance level, except for the BP-body angle and breast base angle showing the F-value of 2.270 (p = 0.107) and 0.083 (p = 0.920), respectively. Scheffe’s post-hoc analysis was followed to see the unique geometrical characteristics of each cluster.
The post-hoc results are described in Table 8. Longitudinal placements showed a clearly strong tendency; superior placement for cluster 3, inferior placement for cluster 2, and cluster 1 was in the middle. The average proportions of the distance between BP and the front neck point were measured at 58%, 61%, and 65% for each cluster. The actual distances between BP and the front neck point were 24.39 cm, 22.67 cm, and 21.44 cm, respectively, while the average upper body length was 40.17 cm (Table 2). These were measured 1.4 to 4.4 cm longer than what was reported by Eisenmann-Klein (2010). The difference might have come from the placement of BP. In this study, BP was located at the most prominent points of the breast, which was visually assessed and might be different from the actual location of the nipple.
The sagittal characteristics looked similar to the longitudinal tendency. Cluster 2 was ranked for the highest ratio between breast depth and body depth (Table 8), indicating that their breasts were located sagittally-prominent compared to their trunk dimension. The depth measurements were included in the placement analysis in terms that the characteristics of the breasts were investigated in relation to the body. However, considering breast depth and span measurements, these characteristics looked closely associated with the relative breast size to the trunk dimension rather than its unique placement on the chest.
In transverse directions, a significantly large BP angle was verified with cluster 2 (Table 8). Cluster 2 has already been ranked for the largest breast span measurement, but it was not clear with the breast span whether this was because of the placement or size of the breast. The large BP angle confirmed that cluster 2 was placed transversely wide, which is typically called open breasts.
Although the angle of the breast base did not seem to play a critical role in breast placement (F = 0.083, p = 0.920), it was found that the average chest plane leaned backward for about 5–6° when standing straight (Table 8). The breast placement angles against body axes were large at the outer breast edge in cluster 2 and small at the lower and inner edges in cluster 3. The upper angle showed the most distinction between clusters.

3.3. Shape and Placement Relationship

The chi-square test was followed to see whether there is any significant relationship between four shape clusters and three placement clusters. The outcomes are summarized in Table 9, indicating that breast shapes and placements were strongly associated (p = 0.000).
Post-hoc analysis indicated which shape and placement group was associated with each other, and the resulting contingency table analysis is shown in Table 10. The significance was determined based on the p-value corrected by the Bonferroni method, which was 0.0042. According to the post-hoc analysis, large breasts were located significantly lower than other breast types (p = 0.0000), and small breasts were located higher than others (p = 0.0000). The droopy breasts were found not to take low placement (p = 0.0000). The shape cluster 3 did not show any significance in terms of their placement. Considering each cluster’s breast dimensions (Table 6), it could be concluded that longitudinal breast placement is highly correlated with breast size.
One of the notable observations was that drooped breast shapes were clearly distinguishable from low breast placement. It was evidenced by the fact that there was no drooped breast located significantly low. In addition, the upward breasts were not always located high as well (Table 10). The breast placement clusters had a strong correlation with dimensional characteristics of breasts but were irrelevant to the vertical skewedness of the breast shapes. This indicates that drooping may need to be understood differently from being inferiorly located. This finding strongly supports the necessity to investigate the breast placement separated from its shapes.
The proportion of the population belonging to each shape and placement cluster is also shown in Table 10. Breast shape analysis concluded that there are 31% of droopy breasts, 19% of small/flat breasts, 24% of upward breasts, and 26% of large/inward breasts in young American females aged 26 to 35. The proportion of small and large breasts was lower than 26% (small) and 40% (large and extra-large) reported in Australian studies, where the entire generation (18–84) was involved (Table 1). Detailed direct comparisons were not possible since the current research included other shape factors beyond the breast size.
The breast shape was clustered differently compared to Korean studies (Table 1). Drooped and flat/small breasts were characterized in common, but spheric and protruded features do not look prevailing in young American females [4,23,24]. Sharing certain characteristics, upward shapes might be comparable to spheric breasts, such as relatively more developed upper quadrants than lower quadrants. Protruded characteristics were not significantly identified among Americans, but large breasts were configured instead, which also appeared as a significant attribute in the Australian study [5].
In terms of prevalence, more populations of droopy breasts and less of small/flat breasts were found among Americans. It needs to be noted that our age group (26–35) has a number of populations between their age groups of 20–25 [4] and 30–39 [23].

4. Conclusions

Using the Size USA database, the breast geometries of young American females were characterized in terms of their breast shape and placement. Individual body scans were processed in a 3D image analysis tool for spatial assessments, and detailed geometrical measurements were extracted, including the linear, angular, areal, and volumetric dimensions. Each case was analyzed statistically and categorized into four shape clusters and three placement clusters. Among the American females aged 26 to 35, four different breast shapes were identified: droopy breasts (31%), small/flat breasts (19%), upward breasts (24%), and large/inward breasts (26%). Taking 36%, 44%, and 20% of the population, respectively, their breast placement characteristics were either high, medium, or low/open. The breast placement clusters had a strong correlation with the dimensional characteristics of the breasts but were irrelevant to the vertical skewedness of the breast shapes.
Being collected more than 15 years ago, the Size USA database may not perfectly reflect the breast dimensions of current American populations, but it is the most recent anthropometric survey completed with a huge number of diverse populations. There was a critical limitation in terms of the availability of body scans. Approximately one-third of the data were not three-dimensionally processable due to missing cloud points or meshes around the armpit area.
Further investigations are recommended to study other populations of different ages and ethnicities. Especially, it would attract significant attention from industry and academia to investigate elderly populations over 65 years, who become more and more active in communities with strong opinions and purchasing power. The investigations across ethnic groups would also be beneficial for industries targeting diverse global market sectors. A similar concept of 3D geometrical evaluation and spatial assessment could be applied to other regions of human bodies, such as faces. For example, the structures of noses, cheekbones, and chins are possible to quantify for face coverings with enhanced protection and comfort.
The significance of this research was to pioneer breast anthropometric studies for American populations. Unlike other research, breast shape and placement characteristics were distinguished and investigated separately. The breast shape dealt with a hemispheric form of the breast itself, and the placement was interpreted into the spatial relationship between breasts and the body. Focusing on the geometrical assessment of the space inside and outside of breasts, the researchers suggested new referential points, such as inner breast points. Comprehensive analysis of breast geometry was achieved by considering all-encompassing measurements, including quadrant angles, volumes, surface areas, and cross-sectional areas. This contributed to taking more scientific approaches toward breast geometries. The research findings will assist the underwear industry in identifying the diverse styles of breast shape and placement prevailing in the US market and accommodate consumer needs with well-targeted product development.

Author Contributions

Conceptualization, M.S. and J.H.P.; methodology, M.S. and J.H.P.; software, J.H.P.; validation, M.S. and J.H.P.; formal analysis, M.S.; investigation, M.S.; resources, M.S. and J.H.P.; data curation, M.S.; writing—original draft preparation, M.S.; writing—review and editing, M.S. and J.H.P.; visualization, J.H.P.; supervision, J.H.P.; project administration, J.H.P.; funding acquisition J.H.P. All authors have read and agreed to the published version of the manuscript.

Funding

This work was supported by the research grant of Pai Chai University in 2021 (No. 2021A0025).

Data Availability Statement

Restrictions apply to the availability of these data. Data were obtained from [TC]2 Labs and are available through North Carolina State University database with the permission of [TC]2 Labs.

Conflicts of Interest

The authors declare no conflict of interest. The funders had no role in the design of the study; in the collection, analyses, or interpretation of data; in the writing of the manuscript; or in the decision to publish the results.

References

  1. Bistoni, G.; Farhadi, J. Anatomy and physiology of the breast. In Plastic and Reconstructive Surgery Approaches and Techniques; Farhadieh, R., Bulstrode, N., Cugno, S., Eds.; Wiley: Blackwell, NJ, USA, 2015; pp. 479–485. [Google Scholar]
  2. McGhee, D.E.; Steele, J.R. Breast biomechanics: What do we really know? Physiology 2020, 35, 144–156. [Google Scholar] [CrossRef] [PubMed]
  3. Mayo Clinic. Female Breast Anatomy. Mayo Foundation for Medical Education and Research. Available online: https://www.mayoclinic.org/healthy-lifestyle/womens-health/multimedia/breast-cancer-early-stage/sls-20076628 (accessed on 13 November 2020).
  4. Sohn, B.H. A study on breast type classification & discrimination using manual measurement-focusing on Korean women in their 20s. J. Korea Soc. Comput. Inf. 2020, 25, 137–146. [Google Scholar]
  5. Coltman, C.E.; Steele, J.R.; McGhee, D.E. Effects of age and body mass index on breast characteristics: A cluster analysis. Ergonomics 2018, 61, 1232–1245. [Google Scholar] [CrossRef]
  6. Coltman, C.E.; Brisbine, B.R.; Steele, J.R. Bra-body armour integration, breast discomfort and breast injury associated with wearing body armour. Ergonomics 2021, 64, 1623–1633. [Google Scholar] [CrossRef]
  7. Gefen, A.; Dilmoney, B. Mechanics of the normal woman’s breast. Technol. Health Care 2007, 15, 259–271. [Google Scholar] [CrossRef]
  8. Suh, M. Breast size and anthropometric changes through brassieres. J. Text. Appar. Technol. Manag. 2021, 12, 1–15. [Google Scholar]
  9. Brisbine, B.R.; Steele, J.R.; Phillips, E.J.; McGhee, D.E. Breast pain affects the performance of elite female athletes. J. Sports Sci. 2020, 38, 528–533. [Google Scholar] [CrossRef]
  10. Pei, J.; Fan, J.; Ashdown, S.P. A novel optimization approach to minimize aggregate-fit-loss for improved breast sizing. Text. Res. J. 2020, 90, 1823–1836. [Google Scholar] [CrossRef]
  11. Sun, Y.; Yick, K.L.; Cai, Y.; Yu, W.; Chen, L.; Lau, N.; Zhang, S. Finite element analysis on contact pressure and 3D breast deformation for application in women’s bras. Fibers Polym. 2021, 22, 2910–2921. [Google Scholar]
  12. Pandarum, R.; Yu, W.; Hunter, L. 3-D breast anthropometry of plus-sized women in South Africa. Ergonomics 2011, 54, 866–875. [Google Scholar]
  13. Brisbine, B.R.; Steele, J.R.; Phillips, E.J.; McGhee, D.E. Breast and torso characteristics of female contact football players: Implications for the design of sports bras and breast protection. Ergonomics 2020, 63, 850–863. [Google Scholar] [CrossRef] [PubMed]
  14. Catanuto, G.; Taher, W.; Rocco, N.; Catalano, F.; Allegra, D.; Milotta, F.; Stanco, F.; Gallo, G.; Nava, M. Breast shape analysis with curvature estimates and principal component analysis for cosmetic and reconstructive breast surgery. Aesthetic Surg. J. 2019, 39, 164–173. [Google Scholar]
  15. Hsia, H.; Thomson, J. Differences in breast shape preferences between plastic surgeons and patients seeking breast augmentation. Cosmetic 2003, 122, 312–320. [Google Scholar] [CrossRef] [PubMed]
  16. Tepper, O.; Unger, J.; Small, K.; Feldman, D.; Kumar, N.; Choi, M.; Karp, N. Mammometrics: The standardization of aesthetic and reconstructive breast surgery. Plast. Reconstr. Surg. 2010, 125, 393–400. [Google Scholar] [CrossRef]
  17. Penn, J. Breast reduction. Plast. Reconstr. Surg. 1954, 7, 357–371. [Google Scholar] [CrossRef]
  18. Eisenmann-Klein, M. Breast reduction and mastopexy. In Plastic and Reconstructive Surgery; Siemionow, M., Eisenmann-Klein, M., Eds.; Springer Specialist Surgery Series; Springer: London, UK, 2010; pp. 49–53. [Google Scholar]
  19. Brown, N.; White, J.; Milligan, A.; Risiu, D.; Ayers, B.; Hedger, W.; Scurr, J. The relationship between breast size and anthropometric characteristics. Am. J. Hum. Biol. 2012, 24, 158–164. [Google Scholar] [CrossRef]
  20. Charles-de-Sá, L.; de Aguiar Valladão, T.; Vieira, D.M.L.; Aboudib, J.H. Anthropometric aspects in the breast augmentation. Aesthetic Plast. Surg. 2020, 44, 1498–1507. [Google Scholar] [CrossRef]
  21. Heine, N.; Eisenmann-Klein, M.; Prantl, L. Gigantomasty: Treatment with a short vertical scar. Aesthetic Plast. Surg. 2008, 32, 41–47. [Google Scholar] [CrossRef]
  22. Joseph-Armstrong, H. Patternmaking for Fashion Design; Prentice Hall: Upper Saddle River, NJ, USA, 2010. [Google Scholar]
  23. Cho, S.H.; Kim, M.S. Brassiere pattern development based on 3D measurements of upper body—Focused on women in their 30’s. Res. J. Costume Cult. 2008, 16, 488–501. [Google Scholar]
  24. Cho, S.H.; Kim, M.S. Brassiere pattern development based on 3D measurements of upper body for women in their 40’s. Res. J. Costume Cult. 2008, 16, 502–517. [Google Scholar]
  25. Cha, S. The uplifting effect of a prototype brassiere. Int. J. Cloth. Sci. Technol. 2012, 24, 154–169. [Google Scholar] [CrossRef]
  26. Cha, S.; Son, H. Comparison of brassiere pattern according to breast shape on China adult females. J. Fash. Bus. 2011, 15, 63–79. [Google Scholar]
  27. Hiraoka, T. My Foundation, the Way to Choose Right Underwear; Wacoal Human Science Research Center: Tokyo, Japan, 1990. [Google Scholar]
Figure 1. Location of reference points in breast geometry.
Applsci 12 08578 g001
Figure 2. Radial lines projected around BP and IBP.
Applsci 12 08578 g002
Figure 3. Breast boundary points and lines.
Applsci 12 08578 g003
Figure 4. Location of breast measurements.
Applsci 12 08578 g004
Figure 5. Breast base for volume calculation.
Applsci 12 08578 g005
Figure 6. Breast volume analysis: (a) Breast cup defined and its volume; (b) Quadrantal volumes.
Applsci 12 08578 g006
Figure 7. Angles associated with breasts: (a) Inner and outer breast angles; (b) Upper and lower breast angles; (c) Breast base Y angle.
Applsci 12 08578 g007
Table 1. Summary of breast shape clusters reported in literature [4,5,23,24,25].
Subjects (Age)Measurements ConsideredBreast Shape ClustersPrevalence
[4]182 Korean females (20–25)breast girth
breast volume
(1) spheric14%
(2) flat 41%
(3) drooped 34%
(4) protruded11%
[23]174 Korean females (30–39)45 types of breast lengths
5 types of breast angles
body weight
(1) drooped29%
(2) spheric28%
(3) protruded22%
(4) flat20%
[24]83 Korean females (40–49)45 types of breast lengths
5 types of breast angles
body weight
(1) drooped34%
(2) spheric31%
(3) protruded19%
(4) flat16%
[25]208 Chinese females (18–24)34 types of lengths
4 types of angles
height and weight
(1) dome-shaped35%
(2) cone-shaped28%
(3) flat28%
(4) protruded19%
[5]345 Australian females (18–84)breast volume
breast surface area
sternal notch-nipple length
underbust girth
(1) extra-large, very ptotic 12%
(2) large, ptotic 28%
(3) medium, mildly ptotic 34%
(4) small, not ptotic26%
Table 2. Descriptive summary of body builds in the age of 26–35.
678 White Females298 White Females156 White Females
Meanst.dev.Meanst.dev.Meanst.dev.
height (cm)164.70±6.54164.57±6.34162.93±5.56
weight (kg)70.01±18.1566.37±8.3865.56±7.87
bust girth (cm)101.88±13.0899.80±6.0299.23±5.93
waist girth (cm)85.12±14.0182.35±6.3882.40±6.16
upper body length (cm)40.24±2.7940.21±1.4640.17±1.49
Table 3. List of reference points in breast geometry.
Reference PointAbbr.Description
Bust pointBPMost prominent point on the breast cup
Inner bust pointIBPBP projected on breast base
Body center pointBCPMidpoint sagittally and transversely defined at BP level
Upper point of breastUPBSuperior-most point on the breast boundary
Lower point of breastLPBInferior-most point on the breast boundary
Inner point of breastIPBMedial-most point on the breast boundary
Outer point of breastOPBLateral-most point on the breast boundary
Table 4. List of measurements in breast geometry.
MeasurementUnitShape 1Placement 2
Contour lengthUpper breast arcmm
Lower breast arcmm
Inner breast arcmm
Outer breast arcmm
Breast rootmm
Linear lengthUpper breast heightmm
Lower breast heightmm
Lower-upper height ratio 3%
Inner breast widthmm
Outer breast widthmm
Inner-outer width ratio 3%
Width-height ratio 3%
Breast depthmm
Body depthmm
Breast-body depth ratio 3%
Breast span halfmm
Shoulder distanceMid-shoulder to BP %%
Shoulder-neck to BP %%
Shoulder tip to BP %%
Front neck to BP %%
AngleBP angle°
BP-body angle°
Upper breast angle°
Lower breast angle°
Inner breast angle°
Outer breast angle°
Breast base Y angle°
Upper breast Y angle°
Lower breast Y angle°
Inner breast X angle°
Outer breast X angle°
AreaBreast surface areacm2
Breast base areacm2
VolumeTotal volumecm3
Upper inner volume %%
Lower inner volume %%
Upper outer volume %%
Lower outer volume %%
1 This cell indicates if each measurement is considered for shape characterization. 2 This cell indicates if each measurement is considered for placement characterization. 3 The ratios are defined as follows: lower-upper height ratio = (lower height/upper height) × 100; inner-outer width ratio = (inner width/outer width) × 100; width-height ratio = (breast width/breast height) × 100; breast-body depth ratio = (breast depth/body depth) × 100.
Table 5. Shape factor analysis—rotated component matrix.
Component
12345
Breast base area0.9740.154
Breast surface area0.9690.191
Total volume0.9480.227 0.116
Inner breast arc0.901−0.1970.1300.330
Upper breast arc0.876 −0.282 −0.266
Breast root0.8690.1600.399 0.110
Breast depth0.8170.262 0.499
Outer breast arc0.8020.543 0.1680.120
Upper breast height0.771 −0.442 −0.395
Breast span half0.768−0.2090.137 0.301
Lower breast height0.7400.1260.602−0.158−0.111
Lower breast arc0.7390.1890.3570.185−0.115
Outer breast width0.7110.614 0.252
Inner–outer width ratio−0.291−0.906 −0.128
Upper inner volume %−0.223−0.801−0.439 −0.161
Inner breast width0.568−0.7320.141−0.1070.147
Upper outer volume % 0.664−0.628−0.136
Inner breast angle0.4020.664 0.540
Lower outer volume %0.4050.6010.564
Lower–upper height ratio 0.924 0.220
Lower volume %0.2460.1540.916 0.107
Lower inner volume %−0.147−0.5410.7070.114
Outer breast angle −0.455 0.769−0.366
Upper breast angle 0.2340.4570.7380.314
Lower breast angle 0.147−0.5470.7380.210
Width–height ratio 0.1650.192 0.923
Table 6. Geometric characterization of the shape clusters.
Shape Clusters and Cluster AveragesScheffe’s Post-Hoc Analysis
Cluster 1 aCluster 2 bCluster 3 cCluster 4 d
(n = 48)(n = 30)(n = 37)(n = 41)
Upper breast arc (mm)116.3460100.3637105.6795127.4434b, c < a < d
Lower breast arc (mm)79.445466.664082.561194.7085b < a, c < d
Inner breast arc (mm)91.614281.278096.5486101.3263b < a < c < d
Outer breast arc (mm)99.722793.0010102.3122125.6661b, a, c < d
Breast root (mm)197.2569189.9823208.9854231.2951b, a, c < d
Upper breast height (mm)94.529481.340083.394398.4932b, c < a, d
Lower breast height (mm)57.045853.371760.345466.7968b, a, c < d
Lower–upper height ratio (%)37.6539.6741.9740.41a < b, d, c
Inner breast width (mm)63.546361.030367.427866.2766b, a, d, c
Outer breast width (mm)72.116373.094774.058493.7429a, b, c < d
Inner–outer width ratio (%)46.7945.7747.8141.49d < b, a, c
Width–height ratio (%)89.0099.8099.3297.24a < d, c, b
Breast depth (mm)60.254650.294063.207070.9993b < a, c < d
Breast span half (mm)95.842794.7063101.9638106.6222b, a < c < d
Upper breast angle (°)32.181730.922737.570834.7388b, a < d < c
Lower breast angle (°)52.495649.440052.893851.7341b, d, a, c
Inner breast angle (°)43.048339.559343.011447.1993b < c, a < d
Outer breast angle (°)39.894234.577340.499736.8285b < d < a, c
Breast surface area (cm2)245.179195.931241.675326.912b < c, a < d
Breast base area (cm2)172.812149.685168.593219.827b < c, a < d
Total volume (cm3)458.367324.552469.893725.836b < a, c < d
Upper inner volume (%)28.6326.8726.8123.00d < c, b, a
Lower inner volume (%)18.0417.8321.4317.20d, b, a < c
Upper outer volume (%)31.1333.1727.1132.20c < a, d, b
Lower outer volume (%)22.4222.2724.7327.66b, a < c < d
Lower volume (%)40.4240.0346.1444.80b, a < d, c
The superscripts a, b, c, and d indicate each shape cluster denoted in the far-right column.
Table 7. Placement factor analysis—rotated component matrix.
Component
1234
Mid-shoulder to BP0.9530.150
Shoulder-neck to BP0.9450.181
Shoulder tip to BP0.9070.125
Front neck to BP0.8940.188
Body depth0.7510.2650.2100.208
Breast span half0.5770.1790.5710.143
Breast–body depth ratio0.1970.9100.143
Breast depth0.5250.7870.2190.129
Inner breast X angle 0.771−0.573
Lower breast Y angle0.3310.696 −0.461
Breast–body depth ratio0.1970.9100.143
BP angle0.162 0.823
Outer breast X angle0.1300.4090.812
BP-body angle−0.254−0.1180.634−0.135
Breast base Y angle −0.256−0.1710.906
Upper breast Y angle0.3010.265 0.867
Table 8. Geometric characterization of the placement clusters.
Placement Clusters and Cluster AveragesScheffe’s Post-Hoc Analysis
Cluster 3 aCluster 1 bCluster 2 c
(n = 56)(n = 68)(n = 32)
Mid-shoulder to BP (%)53.307156.488561.0803a < b < c
Shoulder-neck to BP (%)62.927766.451371.1484a < b < c
Shoulder tip to BP (%)56.708660.643465.0497a < b < c
Front neck to BP (%)57.609860.983464.7953a < b < c
Breast depth (mm)53.338063.168574.0087a < b < c
Body depth (mm)150.9157162.9482179.4178a < b < c
Breast–body depth ratio (%)35.380738.831241.2641a < b < c
Breast span half (mm)93.538699.9116111.0519a < b < c
BP angle (°)23.8400 23.016936.9816b, a < c
BP-body angle (°)38.636237.890038.2584a, b, c
Breast base Y angle (°)5.90635.63855.6125a, b, c
Upper breast Y angle (°)32.621235.432238.5525a < b < c
Lower breast Y angle (°)34.941339.275941.4175a < b, c
Inner breast X angle (°)17.158019.980920.8213a < b, c
Outer breast X angle (°)61.089361.938565.3587a, b < c
The superscripts a, b, and c indicate each placement cluster denoted in the far-right column.
Table 9. Chi-square tests.
ValuedfAsymptotic Significance
(2-Sided)
Pearson Chi-square102.73960.000
Likelihood ratio118.22660.000
Linear-by-linear association6.93310.008
N of valid cases156
Table 10. Contingency table analysis.
Placement ClustersTotal
312
(High)(Medium)(Low/Open)
Shape clusters1count21 (43.8%)27 (56.3%)0 (0.0%)48 (30.8%)
(drooped)χ21.9 (p = 0.1615)4.5 (p = 0.0357)17.9 (p = 0.0000)
2count27 (90.0%)3 (10.0%)0 (0.0%)30 (19.2%)
(small/flat)χ26.9 (p = 0.0000)17.0 (p = 0.0000)0.49 (p = 0.0000)
3count8 (21.6%)22 (59.5%)7 (18.9%)37 (23.7%)
(upward)χ24.3 (p = 0.0357)5.0 (p = 0.0278)0.1 (p = 0.7642)
4count0 (0.0%)16 (39.0%)25 (61.0%)41 (26.3%)
(large)χ231.1 (p = 0.0000)0.5 (p = 0.4839)55.8 (p = 0.0000)
Total56 (35.9%)68 (43.6%)32 (20.5%)156 (100%)
Publisher’s Note: MDPI stays neutral with regard to jurisdictional claims in published maps and institutional affiliations.

