Article

Method for 2D-3D Registration under Inverse Depth and Structural Semantic Constraints for Digital Twin City

PLA Strategic Support Force Information Engineering University, Zhengzhou 450001, China
*
Author to whom correspondence should be addressed.
Appl. Sci. 2022, 12(17), 8543; https://doi.org/10.3390/app12178543
Submission received: 27 July 2022 / Revised: 17 August 2022 / Accepted: 24 August 2022 / Published: 26 August 2022
(This article belongs to the Special Issue AI-Based Image Processing)

Abstract

:
A digital twin city maps a virtual three-dimensional (3D) city model to the geographic information system, constructs a virtual world, and integrates real sensor data to achieve the purpose of virtual–real fusion. Focusing on the accuracy problem of vision sensor registration in the virtual digital twin city scene, this study proposes a 2D-3D registration method under inverse depth and structural semantic constraints. First, perspective and inverse depth images of the virtual scene were obtained by using perspective view and inverse-depth nascent technology, and then the structural semantic features were extracted by the two-line minimal solution set method. A simultaneous matching and pose estimation method under inverse depth and structural semantic constraints was proposed to achieve the 2D-3D registration of real images and virtual scenes. The experimental results show that the proposed method can effectively optimize the initial vision sensor pose and achieve high-precision registration in the digital twin scene, and the Z-coordinate error is reduced by 45%. An application experiment of monocular image multi-object spatial positioning was designed, which proved the practicability of this method, and the influence of model data error on registration accuracy was analyzed.

Graphical Abstract

1. Introduction

A digital twin city rebuilds a corresponding virtual city in cyberspace by digitizing all elements of a physical city, forming a pattern of coexistence and blending of a physical city and digital city in the information dimension [1]. Digital twin cities are widely used in urban management, planning, and navigation. In recent years, with the maturity of tilt photography and unmanned aerial vehicle (UAV) technology, the local orthophoto, tilt, or LIDAR point cloud data of the city can be accurately obtained, and the urban entity can be comprehensively measured from the land and sky so as to obtain a virtual 3D city model that is very similar to the real world [2]. The digital twin city maps the model to the geographic information system (GIS) system, builds a virtual world, and then integrates real sensor data, achieving the goal of virtual–real fusion. Among numerous sensor types, the vision sensor is one of the most common sensor devices in the digital twin city, such as surveillance cameras, mobile portable devices, and vehicles. Vision sensor integration occurs with the high-accuracy registration of a 2D image taken by a camera and the digital twin virtual 3D scene, which is one of the key technologies of the digital twin city.
The purpose of 2D-3D vision sensor registration is to estimate or optimize the 6-DOF pose of the vision sensor in a virtual digital twin scene and obtain the spatial position of any object in the image. Hence, 2D-3D registration is one of the key technologies for applications such as augmented reality (AR) [3] and Video GIS [4]. It has attracted extensive attention in recent years. Generally, 2D-3D registration methods are divided into hardware-based and vision-based registration methods [5]. The registration method based on hardware generally obtains the position and orientation of the equipment in space through GPS positioning, acceleration, and geomagnetic sensors, identifying the positioning of ground objects. It is significantly affected by the sensor accuracy and outdoor environment, and the accuracy has difficulty meeting the requirements of 2D-3D registration in the outdoor environment. Vision-based registration technology uses the image obtained by the vision sensor to optimize the camera’s 6-DOF pose and then achieves the fusion of the image and virtual scene. Because of seasonal and weather changes, in digital twin applications, sensor image and virtual scene appearances often vary significantly, which makes matching the virtual and real images difficult. Additionally, because a city scene image often contains a sky background and has a large depth range, its feature points are unevenly distributed in the vertical direction, resulting in inaccurate positioning. In addition, urban outdoor scenes have typical Manhattan-world [6] characteristics, containing rich structural semantic features. For more accurate and robust camera pose estimation, semantic features can be used as constraints. However, only a few works have applied structural features to the outdoor environment.
This study focused on the accuracy problem of vision sensor registration in the virtual digital twin city scene. Regarding the characteristics of the city scene with structural semantic information, we propose a 2D-3D registration method for the real image and virtual scene under inverse depth and structural semantic constraints. First, perspective view and inverse-depth nascent technology (PDNT) is used to obtain the perspective and inverse depth images of digital twin scenes, and the plumb line, which contains structural semantic information, is extracted from the vision sensor image. Based on the general vision-based framework, we also propose a simultaneous feature matching and pose estimation method utilizing inverse depth coordinate and structural semantic constraints (MP-IDSSC) to optimize the position and orientation of the vision sensor, which effectively solves the pose error caused by the uneven distribution of feature points. Finally, we use the ray intersection method to obtain the location of any object in the real image and achieve the registration of the vision sensor.
The main contributions of this study are as follows:
  • We developed a 2D-3D registration method with constraints of structural semantics and inverse depth coordinates, which effectively solves the problem of the large error caused by the uneven distribution of feature points in the vertical direction and achieves high-accuracy registration of monocular images in the digital twin scene.
  • The proposed method seamlessly integrates with existing digital twin platforms. This method utilizes PDNT technology, which can be directly implemented using the basic functions of digital twin applications.
The remainder of this paper is arranged as follows: Section 2 outlines 2D-3D registration methods. Section 3 introduces the proposed method and framework, and Section 4 describes the experiments that we conducted. Finally, Section 5 summarizes the study and discusses potential future research directions.

2. Related Works

The 2D-3D registration process is different from traditional image registration because it consists of two parts: camera pose estimation and object positioning. The related work is introduced from these two aspects.

2.1. Pose Estimation

Pose estimation is used to estimate the camera’s own position and orientation by registering the image acquired by the camera device with the virtual model data. Application scenarios can be divided into indoor and outdoor scenarios. Ma et al. [7] presented an indoor 2D-3D registration method based on scene recognition, which detects and recognizes the target scene in a video frame image to track targets and estimate the camera pose. Li et al. [8] developed a novel camera localization workflow based on a highly accurate 3D prior map optimized by the RGB-D SLAM method. Outdoor pose estimation is more difficult than indoor pose estimation. The indoor environment is small, so binocular cameras and RGB-D can be used because the distance is relatively close. However, the outdoor area is larger, and the image appearance is highly affected by the environment. Wu et al. [9] presented a 3D registration method for mobile augmented reality of a building environment based on SURFREAK and KLT. Yue et al. [10] presented an image matching method for distorted buildings with automatic viewpoint correction and fusion. Huang et al. [11] proposed an outdoor AR system registration mechanism based on 3D GIS. Most of the existing methods make use of natural outdoor features, but they do not adequately mine the structural features of cities. Additionally, in practice, we find that because street view images often contain a sky background and have a large depth range, they have an uneven distribution of features in the vertical direction, resulting in errors in camera pose estimation in the vertical direction, which affects the camera pose accuracy.
From the view of technology, the traditional framework of the pose estimation system has three steps: feature extraction, feature matching, and pose calculation. The focus of research is feature extraction and matching. Presently, difficulties are encountered in practical application. First, the appearance of images often differs significantly with a change in season and weather. The key to solving this problem is having a local feature extraction method with high discrimination, such as SIFT [12]. To address the aforementioned shortcomings of traditional feature extraction methods, scholars have applied the convolution neural network (CNN) to image feature extraction, gradually evolved from using handcrafted and deep convolutional features, and successively proposed several methods, including SuperPoint [13] and D2-Net [14]. Deep convolutional features use high-level semantic information for feature point extraction, have strong generalizability, and ultimately show great potential in solving image matching in changing scenes. Second, repeated texture leads to difficulty in matching. There are many repeated texture features, especially in building targets, which place feature point matching requirements on the algorithm. The random sample consensus (RANSAC) algorithm is a widely used matching method, and, while its basic idea is simple and effective, there are two prerequisites for using it [15]: (1) The proportion of interior points must be at a high level because, if less than 50%, the RANSAC method requires a large number of iterations [16] and may fail or become very time-consuming [17]. (2) An assumed model must be given and then satisfied by the interior points [18]. In [19], the spatial constraints of the Delaunay triangulation were used to improve the robustness of feature point matching, but the method was time-consuming. Bian et al. [20] proposed a feature point extraction algorithm that could run in real time; however, its accuracy failed to meet localization requirements. Achieving good performance in challenging environments is difficult when using the existing mainstream feature point matching methods.

2.2. Object Positioning

Regarding the outdoor object positioning problem, the multi-view location method is mainstream and has been applied to a variety of scenes, such as with UAVs and handheld devices. With the popularization of UAV applications, using UAVs to achieve target localization has attracted some attention [21,22]. These types of methods usually require the vision sensor to move along a desired track and take multiple photographs or videos of the target; thereafter, it uses a multi-view method to achieve target localization. Zhang et al. [23] studied the yaw angular errors and relative height estimation problems of two flight scenarios (flyover and wandering) and identified 3D target geolocation. Using vehicle platforms to achieve short-range target localization in an outdoor environment [24,25,26,27] is a popular topic. Additionally, Tekaya et al. [28] introduced an algorithm to estimate the distance from a target in super stereo images using mobile devices, but it was only used for relative target localization. These methods essentially use other means to obtain high-precision camera poses and multi-view methods for target localization, requiring the camera to move in a fixed pattern. Moreover, in urban areas with many buildings, multi-view localization methods are used for target positioning but are limited in practical application because of the occlusion of buildings.

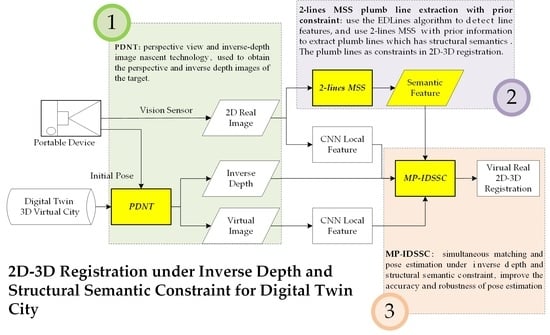
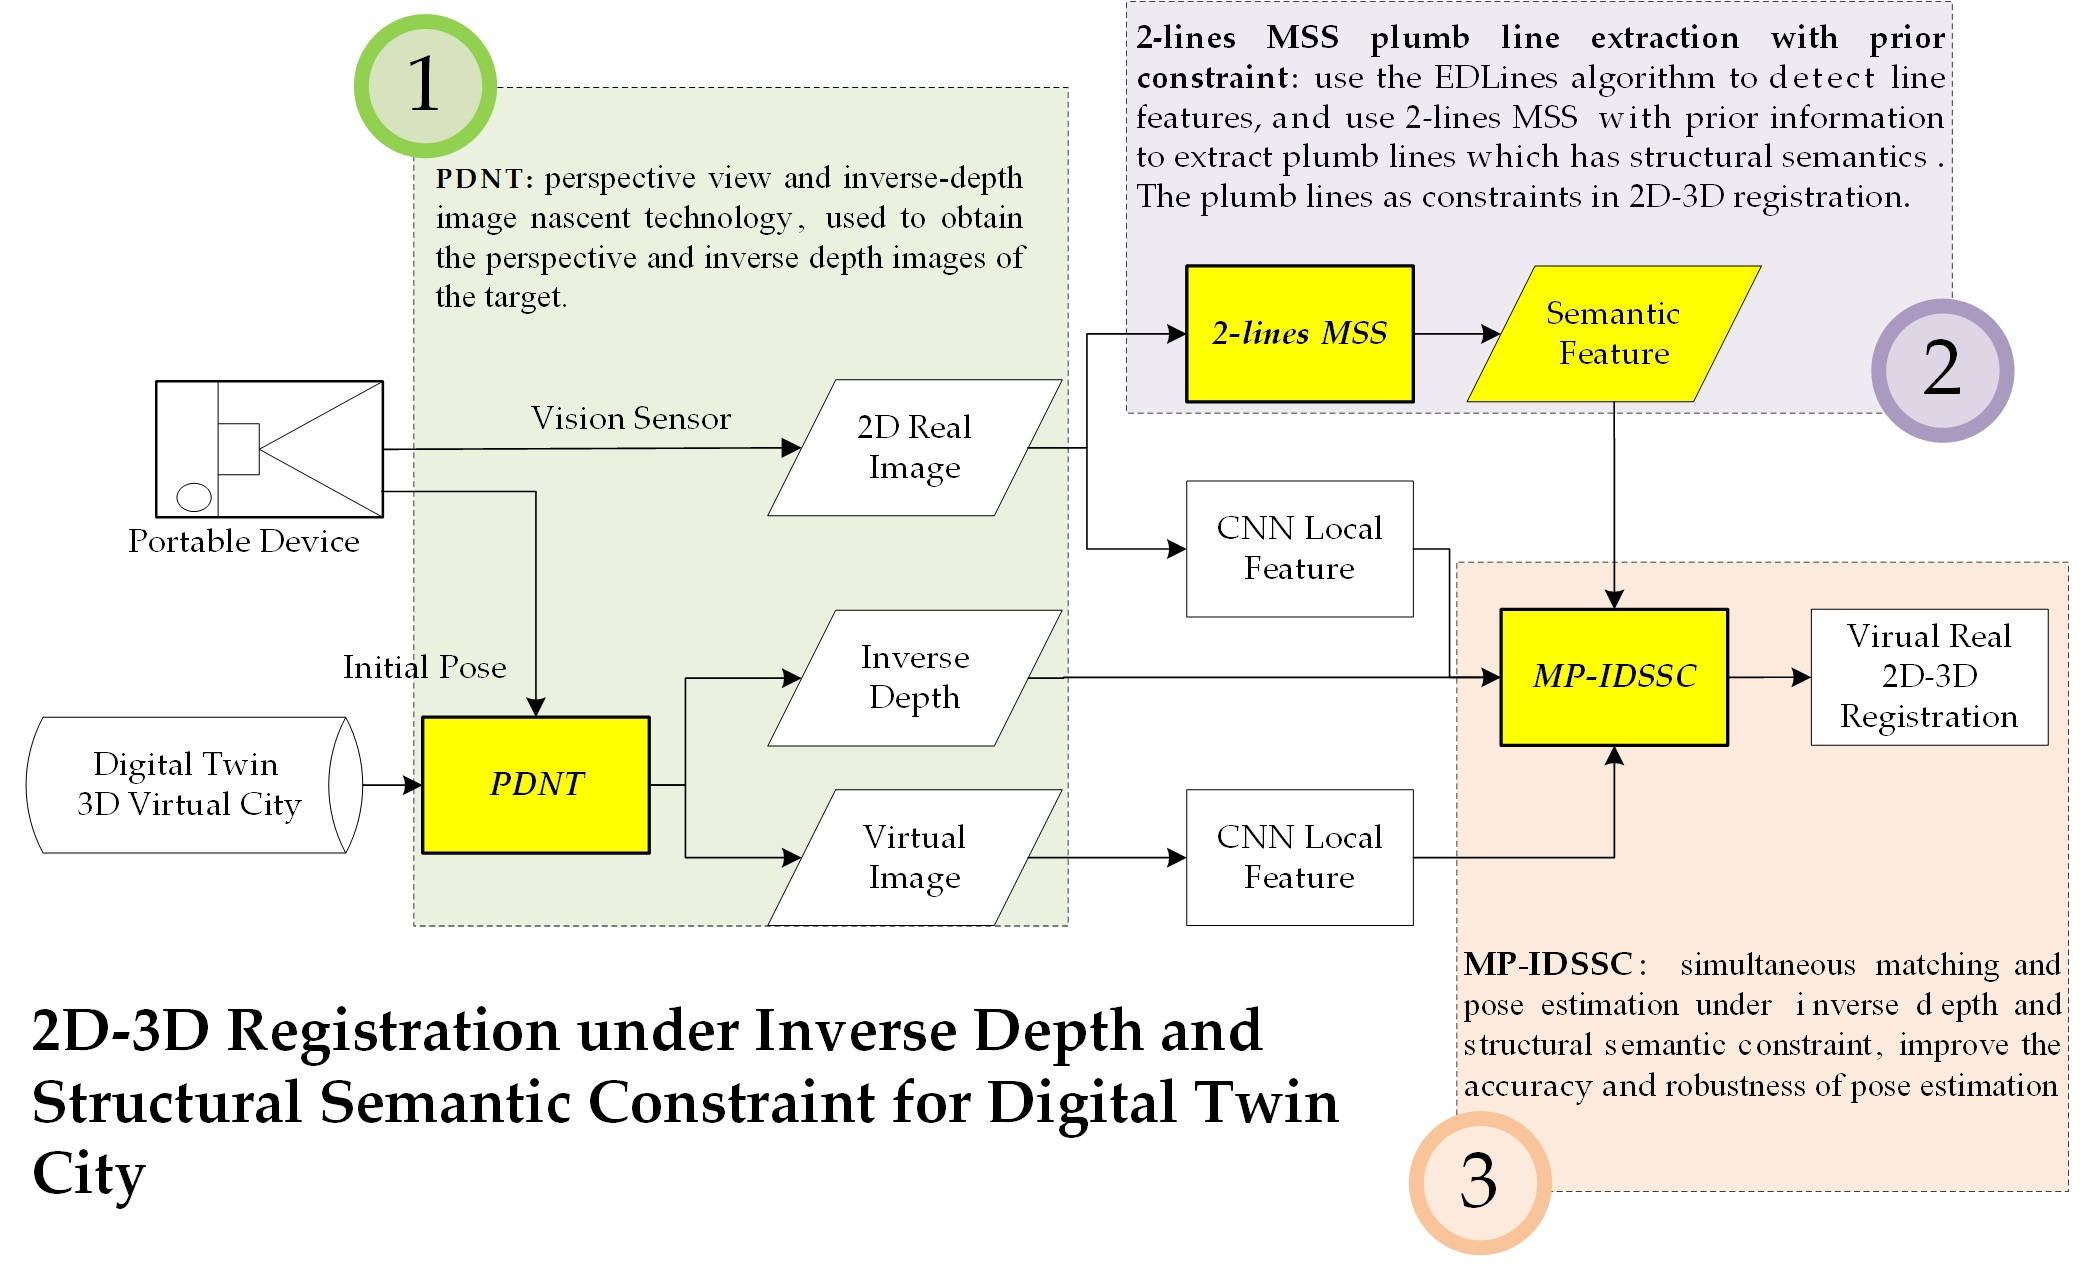
3. Materials and Methods

The framework for the 2D-3D registration of virtual and real images in the digital twin city is shown in Figure 1. The first step was to employ PDNT according to the initial positions and orientations to obtain the virtual perspective and inverse depth images of the digital twin scene. Then, the CNN feature point extraction method was adopted to improve the discrimination and consistency of feature extraction. The 3D point coordinate information in the inverse depth map was used to establish the 2D-2D-3D triplet correspondence, and semantic features, such as the plumb line, were extracted from the real image by the 2-line minimal solution set (MSS) method. Under the constraints of inverse depth coordinates and structural semantics, the MP-IDSSC method was proposed. This method improves the matching accuracy and corrects the pose of the vision sensor. Finally, the ray intersection method was used to achieve 3D registration between a real image and a virtual scene.

3.1. PDNT: Perspective View and Inverse-Depth Image Nascent Technology

The position and orientation information obtained from portable devices was used as the initial values. The perspective images and inverse depth images of the virtual digital twin scene in the current view were obtained based on the spatial relationship between the scene and camera pose. The virtual perspective image was used to match the real image, and the inverse depth image provided 3D coordinates for each image point. The formula used to calculate these coordinates is:
[ x y z ] = [ M a t m ] [ M a t c ] [ M a t p r o j ] [ u 0 v 0 w 0 ]
where [ u 0 v 0 w 0 ] is the coordinate vector for the normalized image point, and [ x y z ] is the position vector of the calculated target. [ M a t m ] is the model transformation matrix, and [ M a t c ] is the transformation matrix from the world coordinate system to the camera coordinate system. [ M a t p r o j ] is the projection transformation matrix.
The significance of generating a virtual perspective image is to establish a triplet (2D-2D-3D) correspondence between the real, perspective, and inverse depth images. In addition, under the constraint of the initial pose, perspective images have a high spatial similarity to the real image, which reduces the difficulty in image matching caused by geometric differences. An inverse depth image stores the inverse depth coordinates of the current scene and can easily convert each feature point into world coordinates. Because the simulated orientation was accurate, the real-world coordinates of each pixel could be calculated, and the sensor position and orientation could be corrected using the pose estimation method.

3.2. Structural Semantic Feature Extraction

Urban scenes often have typical Manhattan-world characteristics. The Manhattan world is the abbreviation for a structured scene that conforms to the Manhattan hypothesis. It has strong structural regularity; thus, it contains rich structural semantic features. The plumb line is a typical structural semantic feature contained in city scene images. As a type of global information, it reflects the spatial relationship between the camera coordinate system and the world coordinate system. An accurate and robust estimation of the camera pose is likely with the use of the semantic feature of the plumb line. This study first used the EDLines [29] algorithm to extract line features and then used the 2-line MSS [30] method constrained by prior information to extract plumb lines and, finally, the spatial characteristics of plumb lines as constraints in 2D-3D registration.

3.2.1. EDLines Line Feature Detection

Presently, the EDLines algorithm is one of the most popular line detection algorithms. Compared with the traditional line feature extraction methods, such as Hough [31] and LSD [32], EDLines can detect the line features in an image with high accuracy. The principle of the algorithm is to use the edge drawing algorithm to generate a clean and continuous edge pixel chain and then generate a straight-line segment based on the edge pixels. This algorithm is efficient and fast. In comparison, the detection speed of EDLines is 10 times higher than that of LSD.

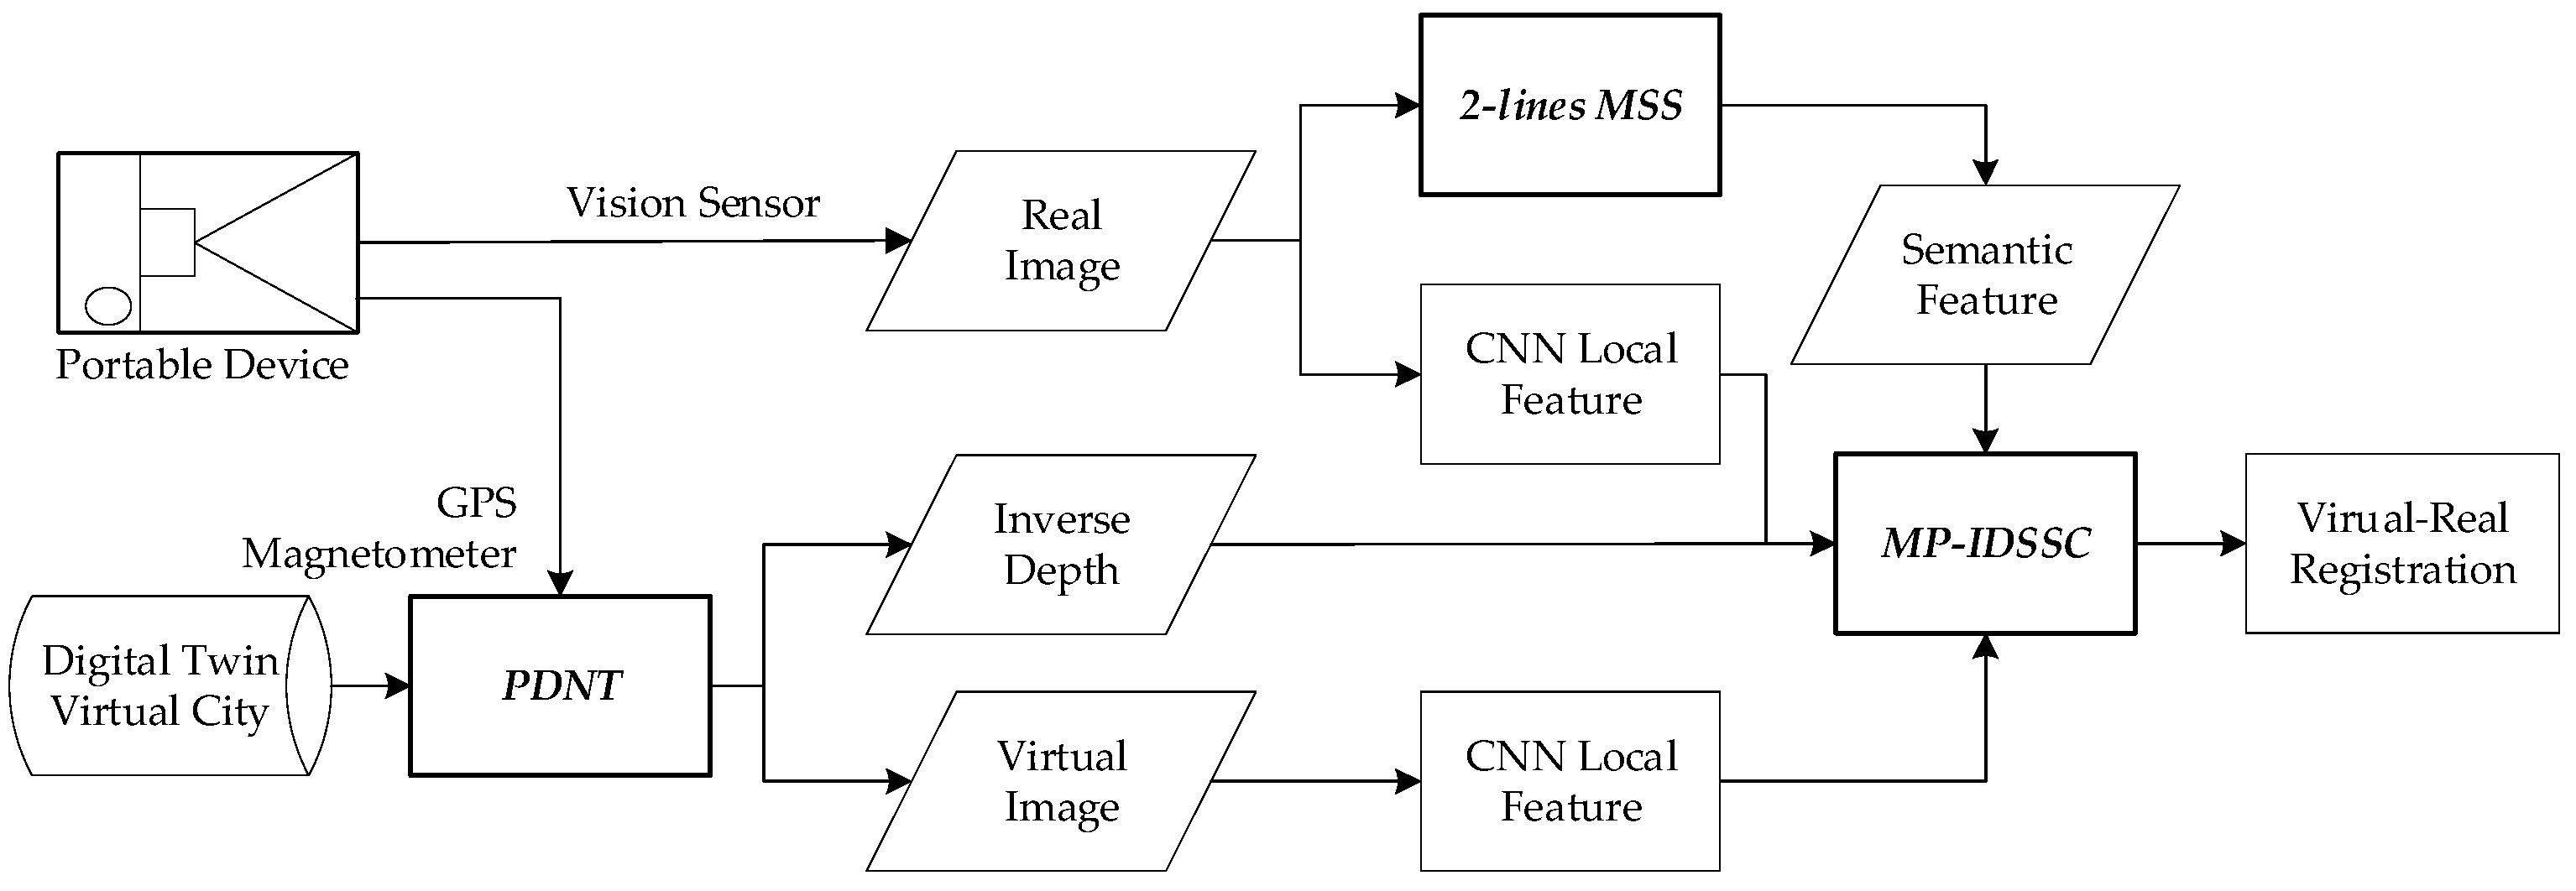
3.2.2. Two-Line MSS Plumb LINE Extraction with Prior Constraint

The direction of gravitational acceleration is obtained with the help of inertial measurement elements or when the initial values of the position and attitude are known. The gravitational acceleration g c in the camera coordinate system is obtained by using inertial measurement elements. Among the three orthogonal vanishing points in the Manhattan world, only the vertical vanishing point is parallel to the direction of gravitational acceleration. The vertical vanishing point provides an a priori constraint for the extraction of the plumb line. Using this prior constraint, we can first conduct a preliminary screening before comparing the evaluation value of the candidate hypothesis with the current optimal result. Because the angle between the vertical vanishing vector and vector of gravity is close to zero, the vector cross product is calculated, and the fault-tolerant threshold τ 1 is set as follows::
| m i n { a r c c o s ( l i × g c g c ) } | < τ 1 ,   i = 1 , 2 , 3
The candidate set of the plumb line can be screened out from the extracted line segments, and the vertical vanishing point can be calculated by using the 2-line MSS method. Assuming that the proportion of segments belonging to the vertical vanishing point in the candidate set of segments is 0.5, the probability of randomly selecting two segments belonging to the vertical vanishing point is p = μ 0.5 2 . μ is the regulating factor. At a confidence coefficient of 0.9999, the number of iterations required to obtain at least one inner 2-line MSS is:
i t c = l o g ( 1 0.9999 ) / l o g ( 1 p )
Any i t c line segment pairs are selected, and the plane coordinates of the intersection image of the line segments are calculated and then converted to the equivalent spherical coordinates:
{ ϕ = a c o s ( Z / X 2 + Y 2 + Z 2 ) λ = a t a n 2 ( X , Y ) + π
where ( x , y ) are the image plane coordinates of the endpoint of the line segment. f is the principal length of the camera. [ X Y Z ] are spherical coordinates:
{ X = x x 0 Y = y y 0 Z = f
With candidate points, the optimal estimation of the position of the vertical vanishing point is calculated by using the threshold value τ 2 , and the set of vertical line segments is extracted.
a r g m a x i = 1 n V P l i < τ 2

3.3. MP-IDSSC: Matching and Pose Estimation under Inverse Depth and Structural Semantic Constraints

The traditional vision system framework has three steps: feature extraction, feature matching, and pose estimation. Each step depends on the result of the previous step. In challenging conditions, there may not be enough matching point pairs for the pose estimation step. To solve this problem, we propose a simultaneous feature matching and pose estimation method under the constraints of inverse depth coordinates and structural semantics. Because all pixels in perspective images correspond to 3D coordinates in the map data, the correspondence between 3D point coordinates and 2D pixel coordinates in the target image can be established. The pose estimation algorithm can now be used directly to calculate the real image’s pose, and the 3D point coordinate image plane projection error and plumb line error can be used to constrain feature point matching. Thus, the feature point matching and pose estimation algorithm are completed in one step, and the pose estimation no longer depends on the result of the feature matching, which improves the robustness of the algorithm.

3.3.1. Cross-Validation of Dynamic Adaptive Threshold

To improve the efficiency and accuracy of the algorithm, this study adopted the cross-validation method of a dynamic adaptive threshold based on the selected initial value. The fast library for approximate nearest neighbors (FLANN) algorithm was used to seek the matching point pairs for screening, which generally included a first matching point with the closest Euclidean distance and a second matching point with the second closest Euclidean distance. It is generally believed that, for a certain matching point pair to be screened, the smaller the distance d i s of the closest matching point compared with the distance d i s of the second closest matching point, the better the matching quality. Traditional algorithms generally use a fixed scale factor t as the threshold. In particular, when d i s < t · d i s is satisfied, the matching point pair is used as a candidate. However, because of the radiation difference, the distribution range of the Euclidean distance difference between point features is unpredictable, and it is generally necessary to manually adjust the threshold t to select a better matching point pair. To solve this problem, we designed a cross-validation method for a dynamic adaptive threshold. First, the FLANN cross-nearest neighbor search was used to calculate the average distance difference between the closest and second closest matching point in the cross search.
d i s a v g = ( i = 1 N ( d i s d i s ) ) N
When the distance difference between the closest and second closest points is less than d i s a v g , the matching point pair in the cross search is used as the initial candidate. Using the average distance difference as a comparison criterion can adapt to the distance between feature points, retain high-quality matching points, and improve the stability of the RANSAC algorithm.

3.3.2. Fast P5P Method

The pose of the image was used to constrain image matching and incorporate the pose estimation algorithm into RANSAC. Therefore, it was necessary to improve the computing speed as much as possible while still ensuring estimation algorithm accuracy. However, the number of points involved in the computation must not be excessive. Therefore, this study adopted the P5P fast pose estimation method to solve the problem.
The mathematical relationship for the standard central projection is expressed as follows:
s u = K P X
where K is the intrinsic camera parameter matrix, and the intrinsic camera parameters can be obtained by calibration; s is an unknown scale parameter; u = [ u v 1 ] ; and P = [ R | t ] is a 3 × 4 matrix that contains rotation and translation information, expressed as follows:
P = [ R | t ] = [ r 1 r 2 r 3 t 1 r 4 r 5 r 6 t 2 r 7 r 8 r 9 t 3 ]
Using u i u i = 0 and eliminating the scale variable s , we obtain:
[ 0 1 v 1 0 u v u 0 ]   [ r 1 r 2 r 3 t 1 r 4 r 5 r 6 t 2 r 7 r 8 r 9 t 3 ]   [ X Y Z 1 ] = 0
Expanding the third row yields:
v ( r 1 X + r 2 Y + r 3 Z + t 1 ) + u ( r 4 X + r 5 Y + r 6 Z + t 2 ) = 0
where r i   a n d   t i are unknown variables to be determined. Each feature point provides a linear constraint equation; five points construct a 5 × 8 coefficient matrix. Let w = [ r 1 , r 2 , r 3 , t 1 , r 4 , r 5 , r 6 , t 2 , ] T . Through the above system of linear equations, we can obtain a solution consisting of three non-zero basis vectors:
w = λ 1 n 1 + λ 2 n 2 + λ 3 n 3
Let λ 3 = 1 ; based on the constraint that R is an orthogonal matrix, we can quickly obtain four groups of candidate solutions [33]. For each solution group, we can further solve [ r 7 , r 8 , r 9 , t 3 ] T . From
{ r 1 r 7 + r 2 r 8 + r 3 r 9 = 0 r 4 r 7 + r 5 r 8 + r 6 r 9 = 0
r 7 and r 8 can be linearly represented by r 9 , indicating that only r 9 and t 3 are real unknowns. Using the first or second row of (10),
( r 1 X + r 2 Y + r 3 Z + t 1 ) u ( r 7 X + r 8 Y + r 9 Z + t 3 ) = 0
We can construct a system of linear equations with a coefficient matrix of size 5 × 2 and finally obtain the optimal solution by minimizing the projection error.
[ α 1 u 1 u 1 α i u i u i ] [ r 9 t 3 ] = [ β 1 β i ]
where α i = r 2 r 6 r 3 r 5 r 1 r 5 r 2 r 4 X i + r 2 r 6 r 3 r 5 r 1 r 5 r 2 r 4 Y i + Z i , and β i = r 1 X i + r 2 Y i + r 3 Z i + t 1 .
Random point selection is a key part in this process. We adopted a uniform random sampling method for the image plane. First, the image plane was evenly divided into 2 × 2 grids, and each rectangle covered exactly one-quarter of the image. Thereafter, a region of equal size was placed at the center of the image, and the image plane was divided into regions named from A to E, as shown in Figure 2. During sampling, five points were randomly selected from these five regions.

3.3.3. Error Function Combined with Structural Semantic Constraint

Because the plumb line contains special semantic information, it can be used as a constraint in 3D registration. For integrating point and plumb line features, the error function model of the image pose solution is:
δ = i = 1 n a r g m i n δ p i + δ l
where δ p i and δ l are the point characteristic error and plumb line constraint error, respectively. The point characteristic error, δ p i , consists of two parts: camera pose error and projection error. First, the camera pose error was calculated, and the projection error was only calculated when the error was less than the threshold. The optimal solution often has the largest number of interior points, and the core method for determining interior points was to calculate the projection error. For each feature point, when the calculated projection error was less than the threshold, it was recorded as an interior point. When the number of interior points was the largest, the pose parameter was optimal, and the corresponding point pair was the matching result. The calculation formula for the projection error is:
σ p = i = 1 n a r g m i n k = 1 m u i k K P X i 2 2 < ε
where σ p is the projection error, u i k is the image point, and X i represents the corresponding 3D point coordinates.
For the calculation of δ l , the vertical line segment is mapped to the virtual perspective image by the feature mapping results, and then the vertical line segment in the image is mapped to the 3D model space according to the spatial relationship between the virtual and real images, as shown in Figure 3, to obtain the 3D vertical line segment. The error of the vertical line segment in 3D model space is used as a constraint, and its error is calculated by:
σ l = i = 1 m a t a n 2 ( d X i 2 + d Y i 2 , d Z i )
where d X i ,   d Y i , d Z i are the coordinate difference between the two endpoints of the i -th 3D space segment in the direction of the three coordinate axes.
In the process of mapping the line segment on the image to the 3D model space, the mapping may fail, for example, by mapping the edge line of a building to the sky background without depth coordinates. To avoid this problem, this study adopted the random drift algorithm. After mapping the image line segment to the inverse depth space, it determines whether the inverse depth value of the two endpoints of the line segment is valid and whether the difference between the two is less than the threshold. If it is greater than the threshold, it indicates that there is a mapping failure, and the line segment must be randomly shifted by k pixels until a valid mapped line segment is obtained. Since there is often a plane near the edge line, the random offset does not affect the calculation of the final error.

4. Results and Discussion

In order to verify this method, a 2D-3D registration experiment was designed, and the performance of this method in multi-target localization of a monocular image was analyzed with target localization as an application case. To evaluate the influence of the accuracy of the digital twin city model on registration, this study also designed a simulation experiment.

4.1. Experiment of 2D-3D Registration

4.1.1. Experimental Environment

We used images captured using a smartphone in the 2D-3D registration experiment. A Huawei Meta 30 smartphone was used because it has built-in general-purpose GPS and geomagnetic sensors, which were necessary for this experiment. Two photos were used as real images for the experiment, named P1 (Figure 4a) and P2 (Figure 4c), which were taken in September 2021. The estimated and actual poses are presented in Table 1, and the coordinates are described by the ECEF coordinate system. The estimated pose was obtained using the CamPOS application. CamPOS is an image acquisition program developed in this study. While shooting photos, it can acquire GPS and geomagnetic sensor information without redundant optimization processing. The virtual digital twin scenes (Figure 4b,d) are oblique photography 3D models generated from UAV aerial images. The images were captured in December 2020. Because of the difference in seasons and time, the texture of the virtual scene 3D model was different from the appearance of the test image, which increased the difficulty of image matching.

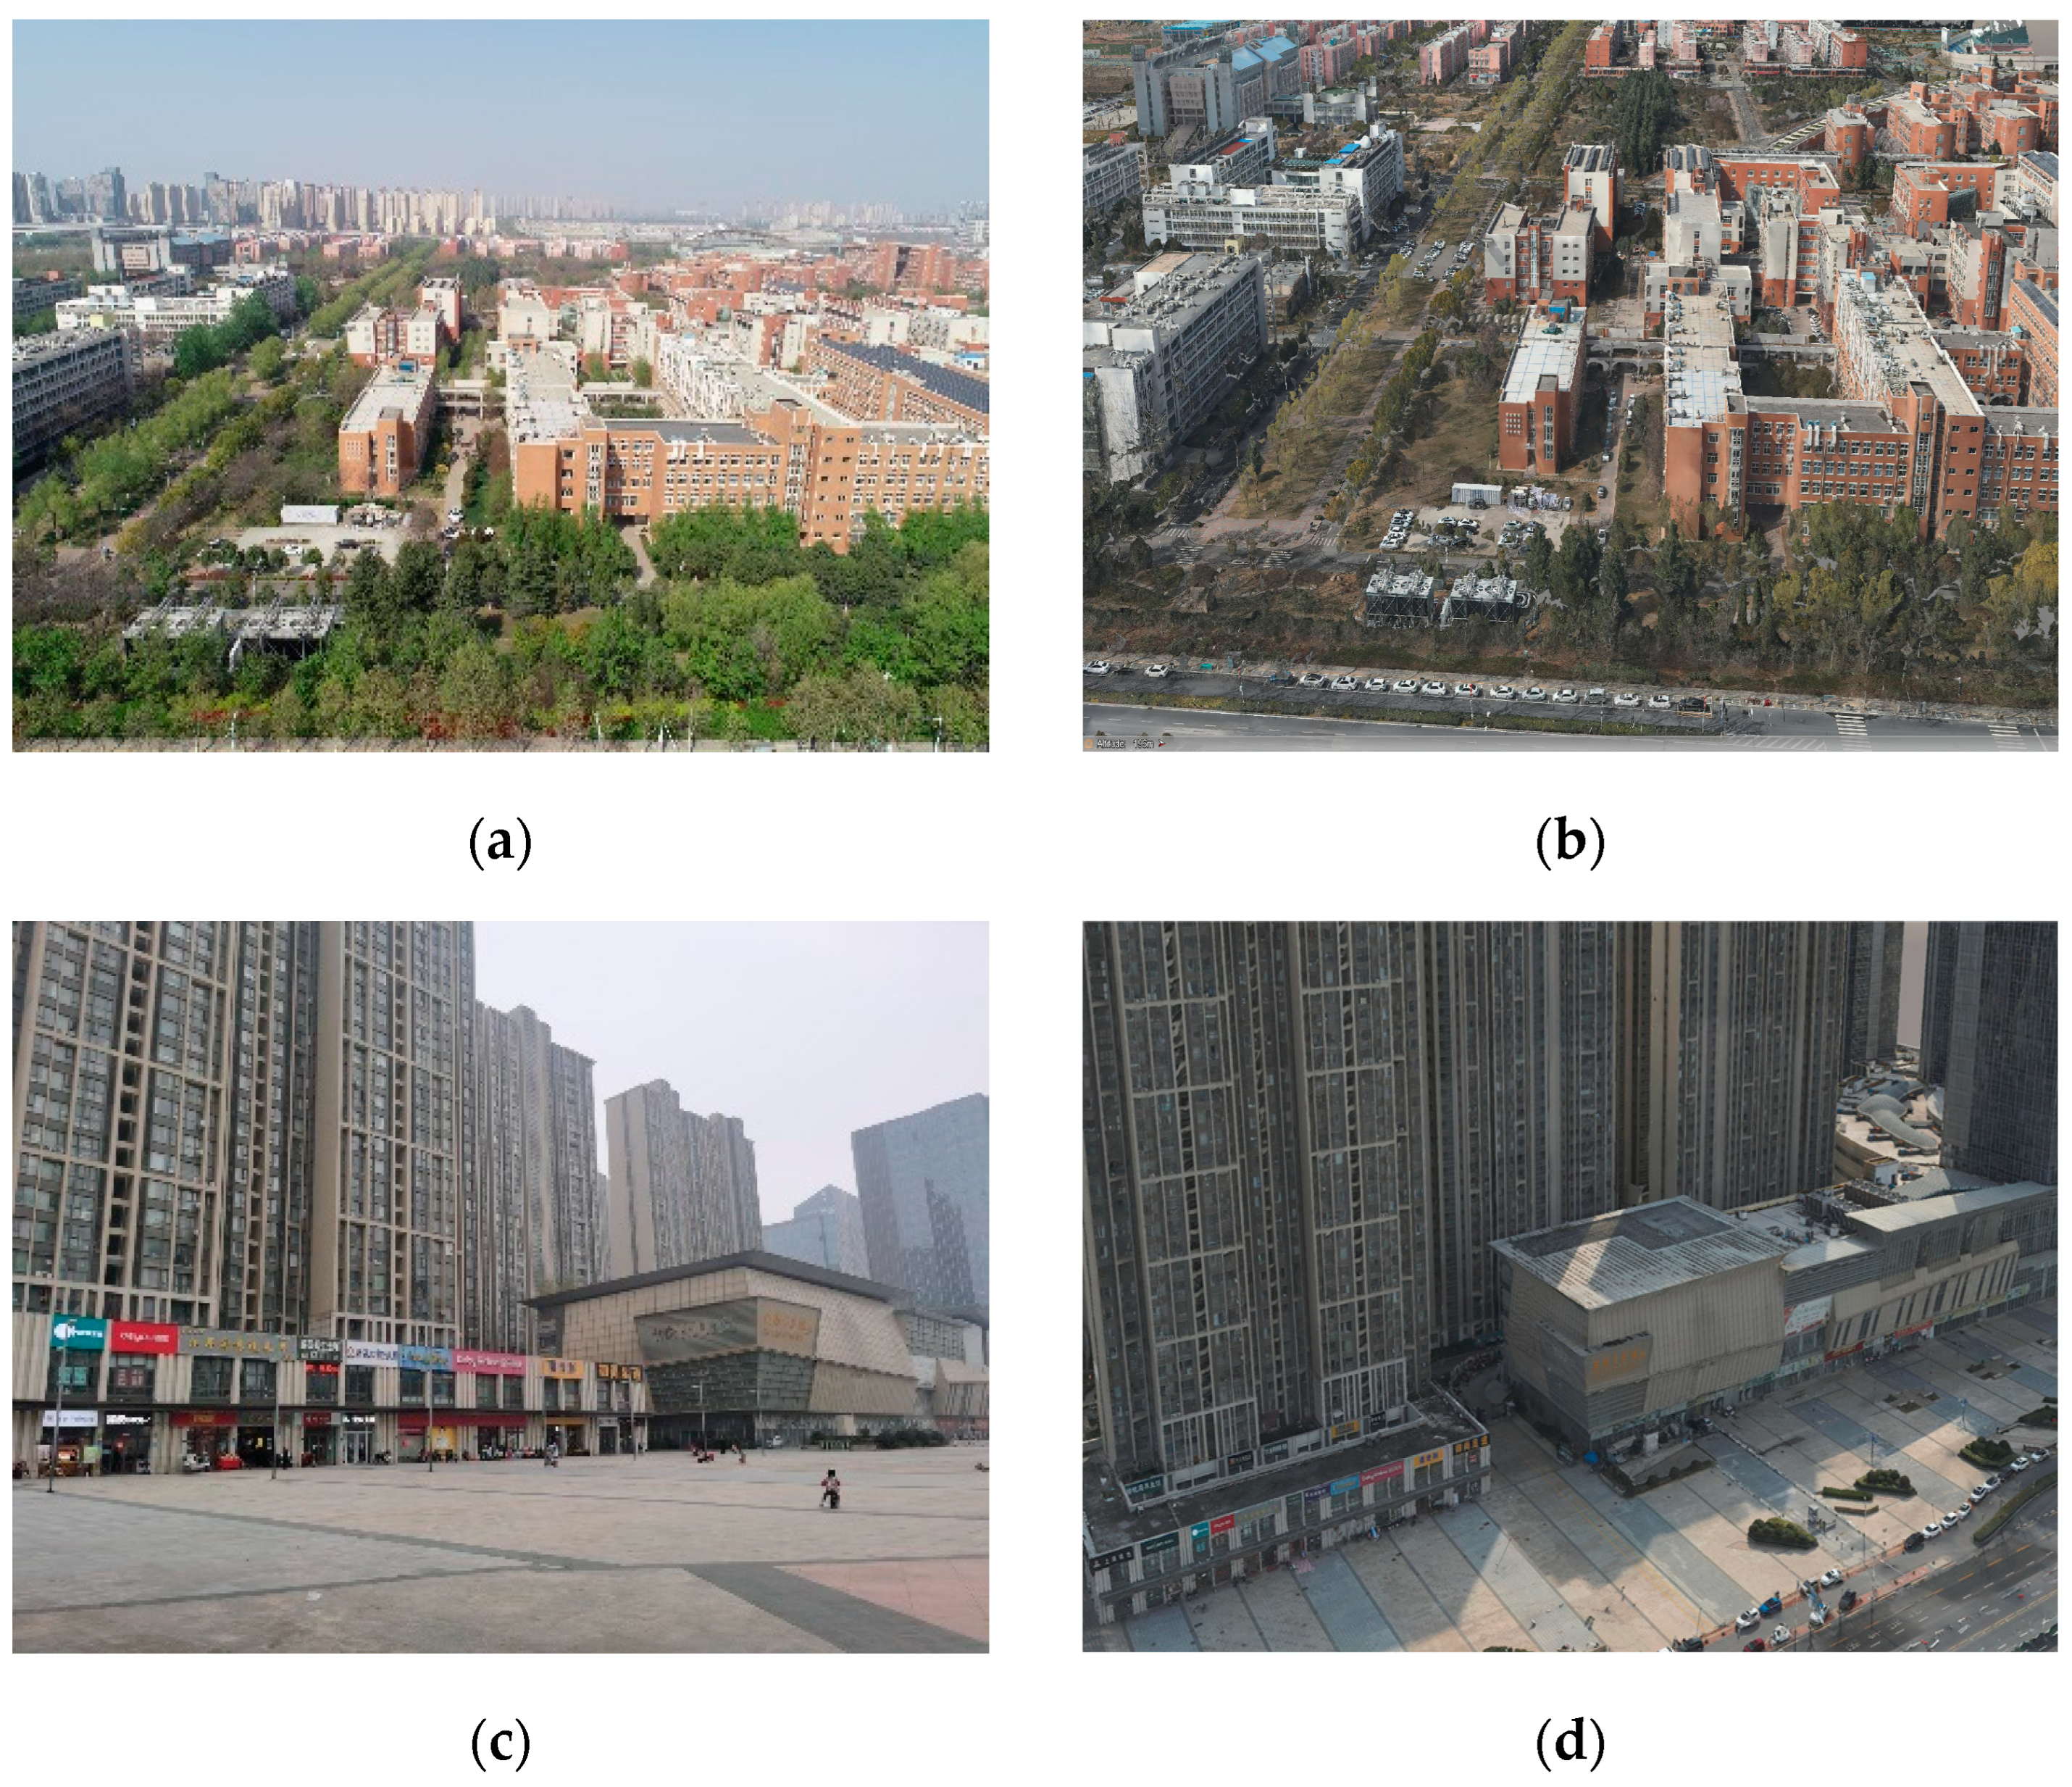
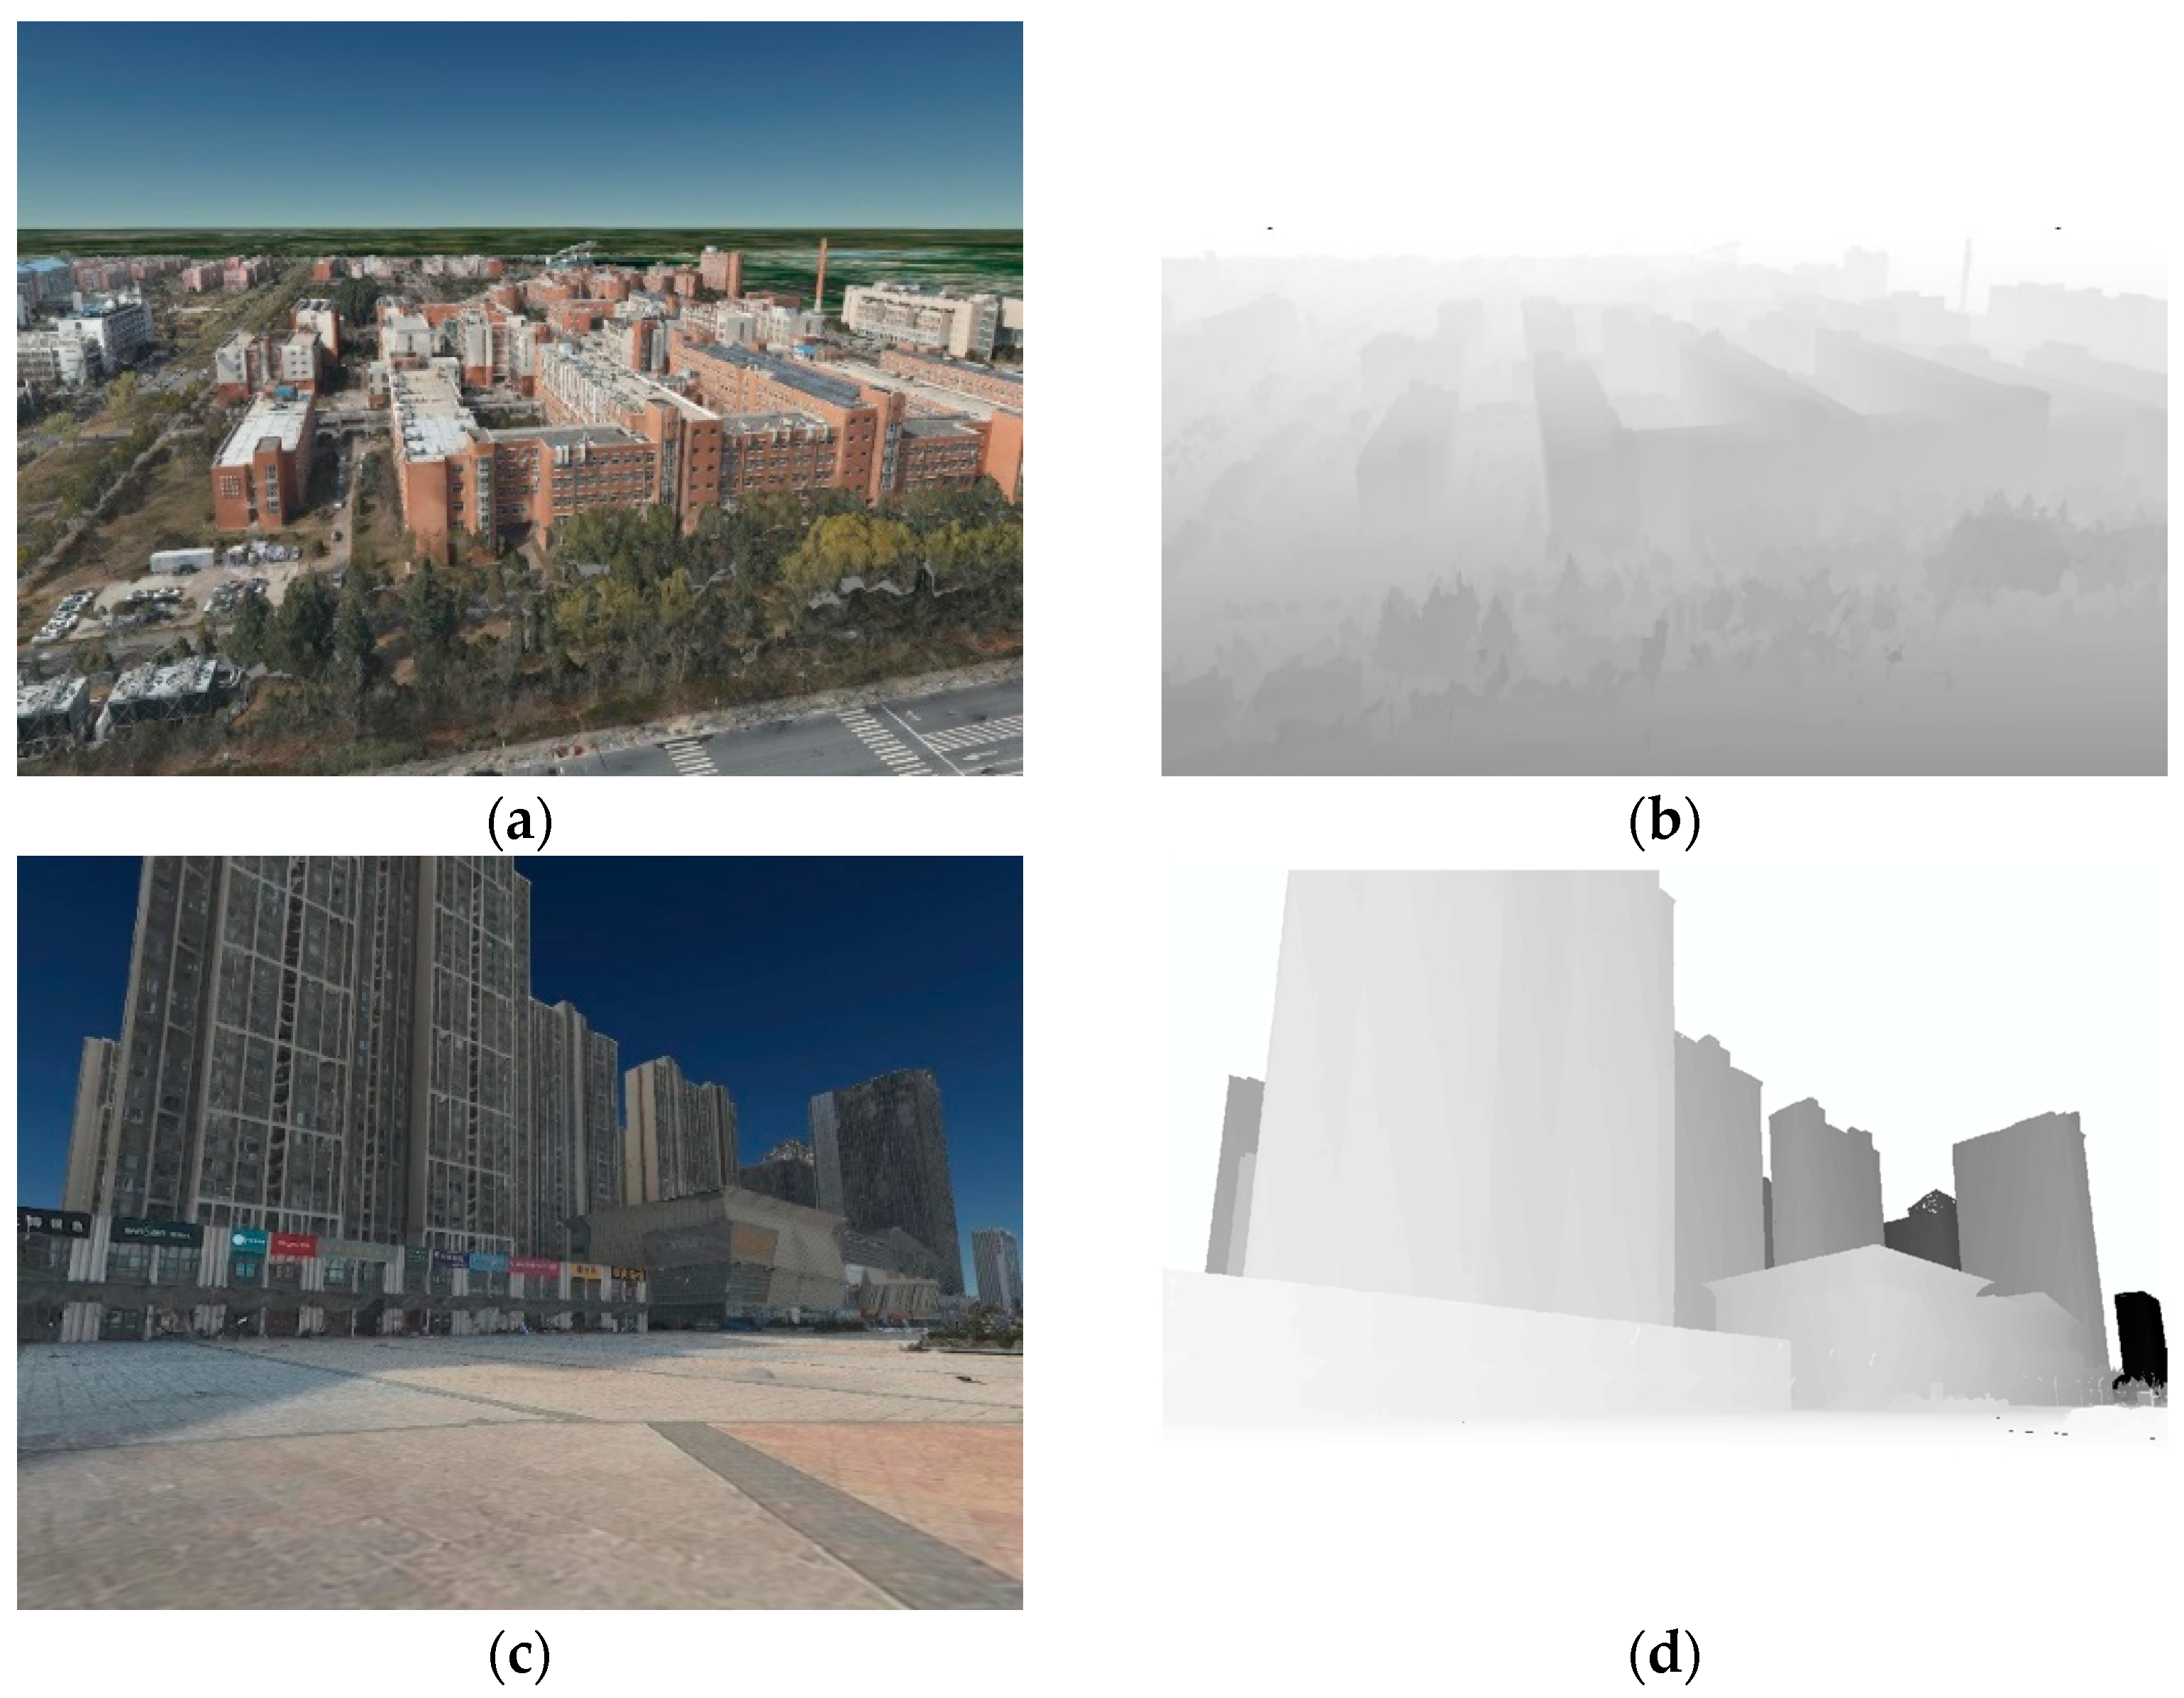
4.1.2. PDNT Experiment

According to the proposed method, the Cesium digital earth platform was used as the 3D GIS system in the application of the digital twin city, and the virtual perspective and inverse depth maps of the digital twin city model were generated according to the estimated pose, as shown in Figure 5. The perspective image was matched with the real image, and 3D coordinates for the feature points were obtained from the inverse depth image.

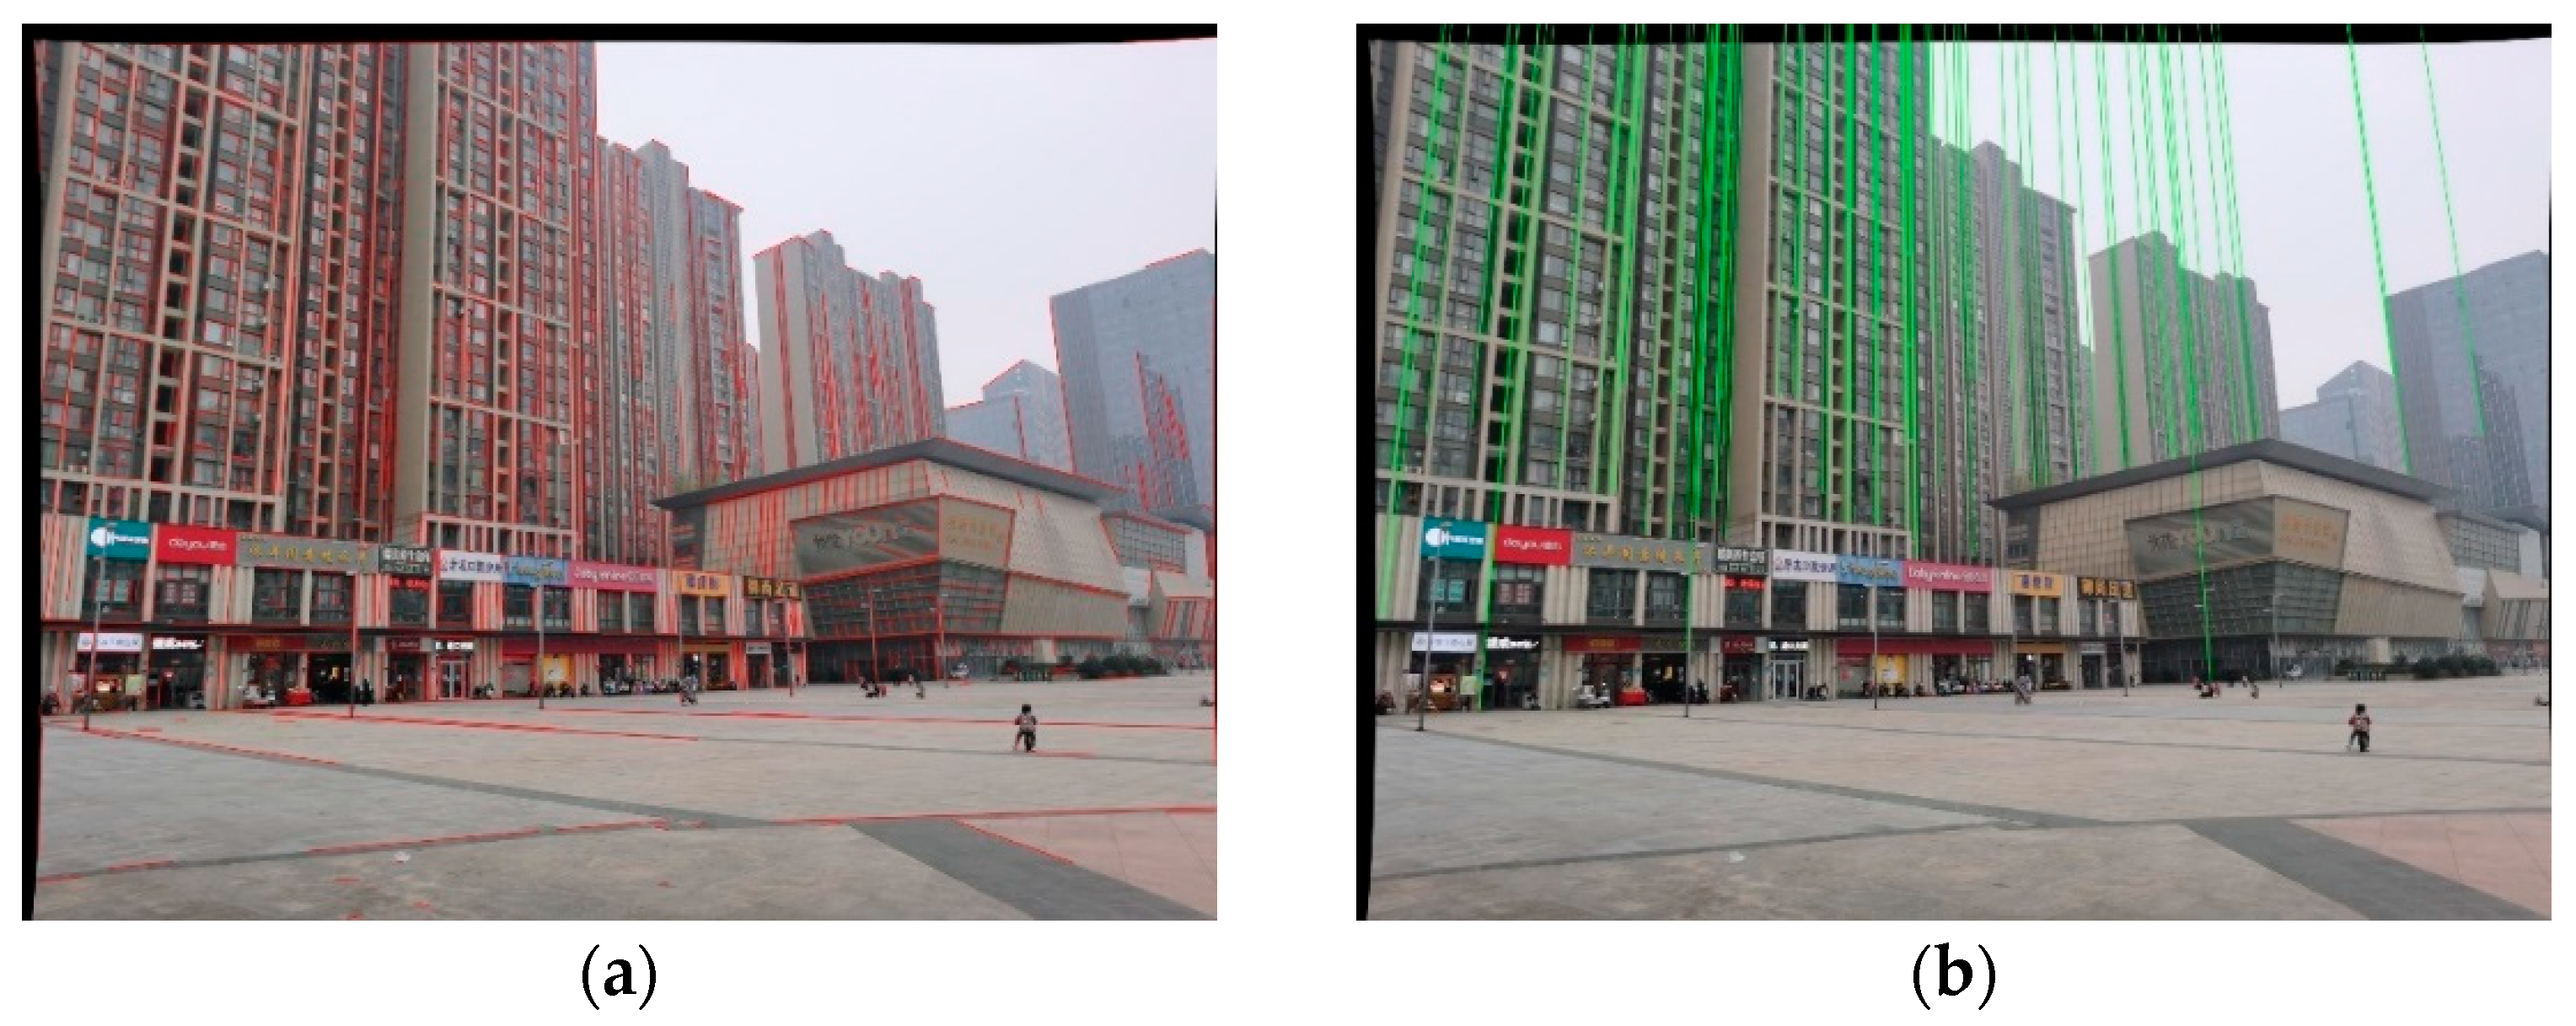
4.1.3. Structural Semantic Feature Extraction Experiment

EDLines was used to extract the line feature of the image. According to the direction of gravitational acceleration, the candidate plumb line set was obtained: set μ   = 0.5, i t c   = 105. The vanishing point was calculated by the two-line MSS method, and the plumb line was extracted. The experimental results are shown in Figure 6.

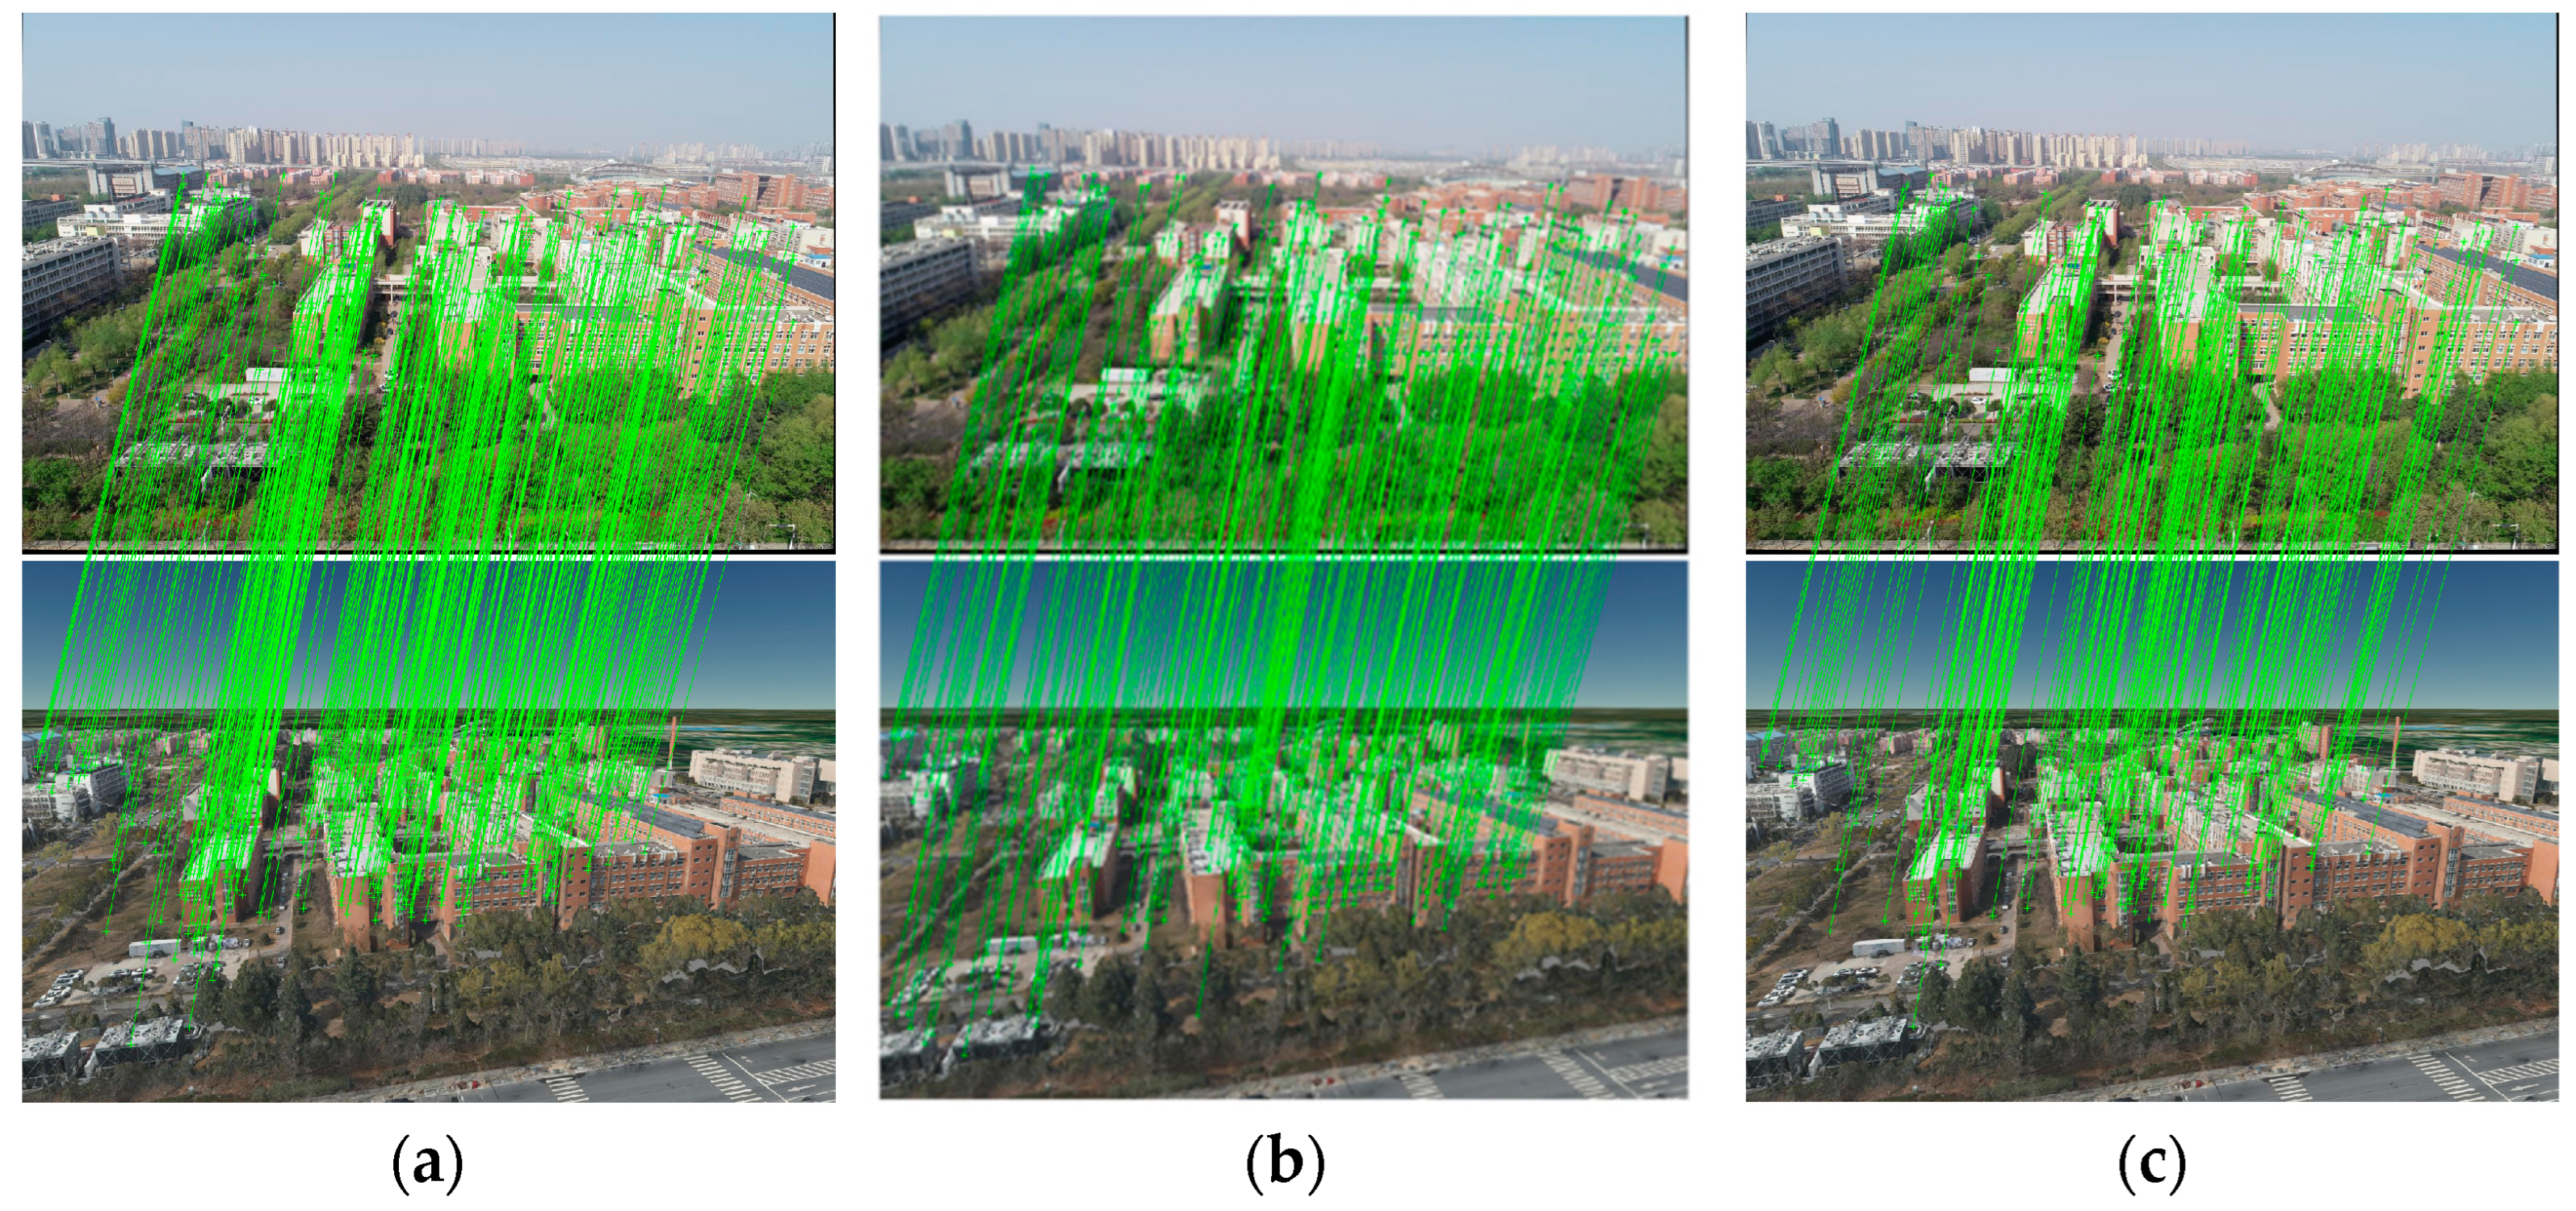
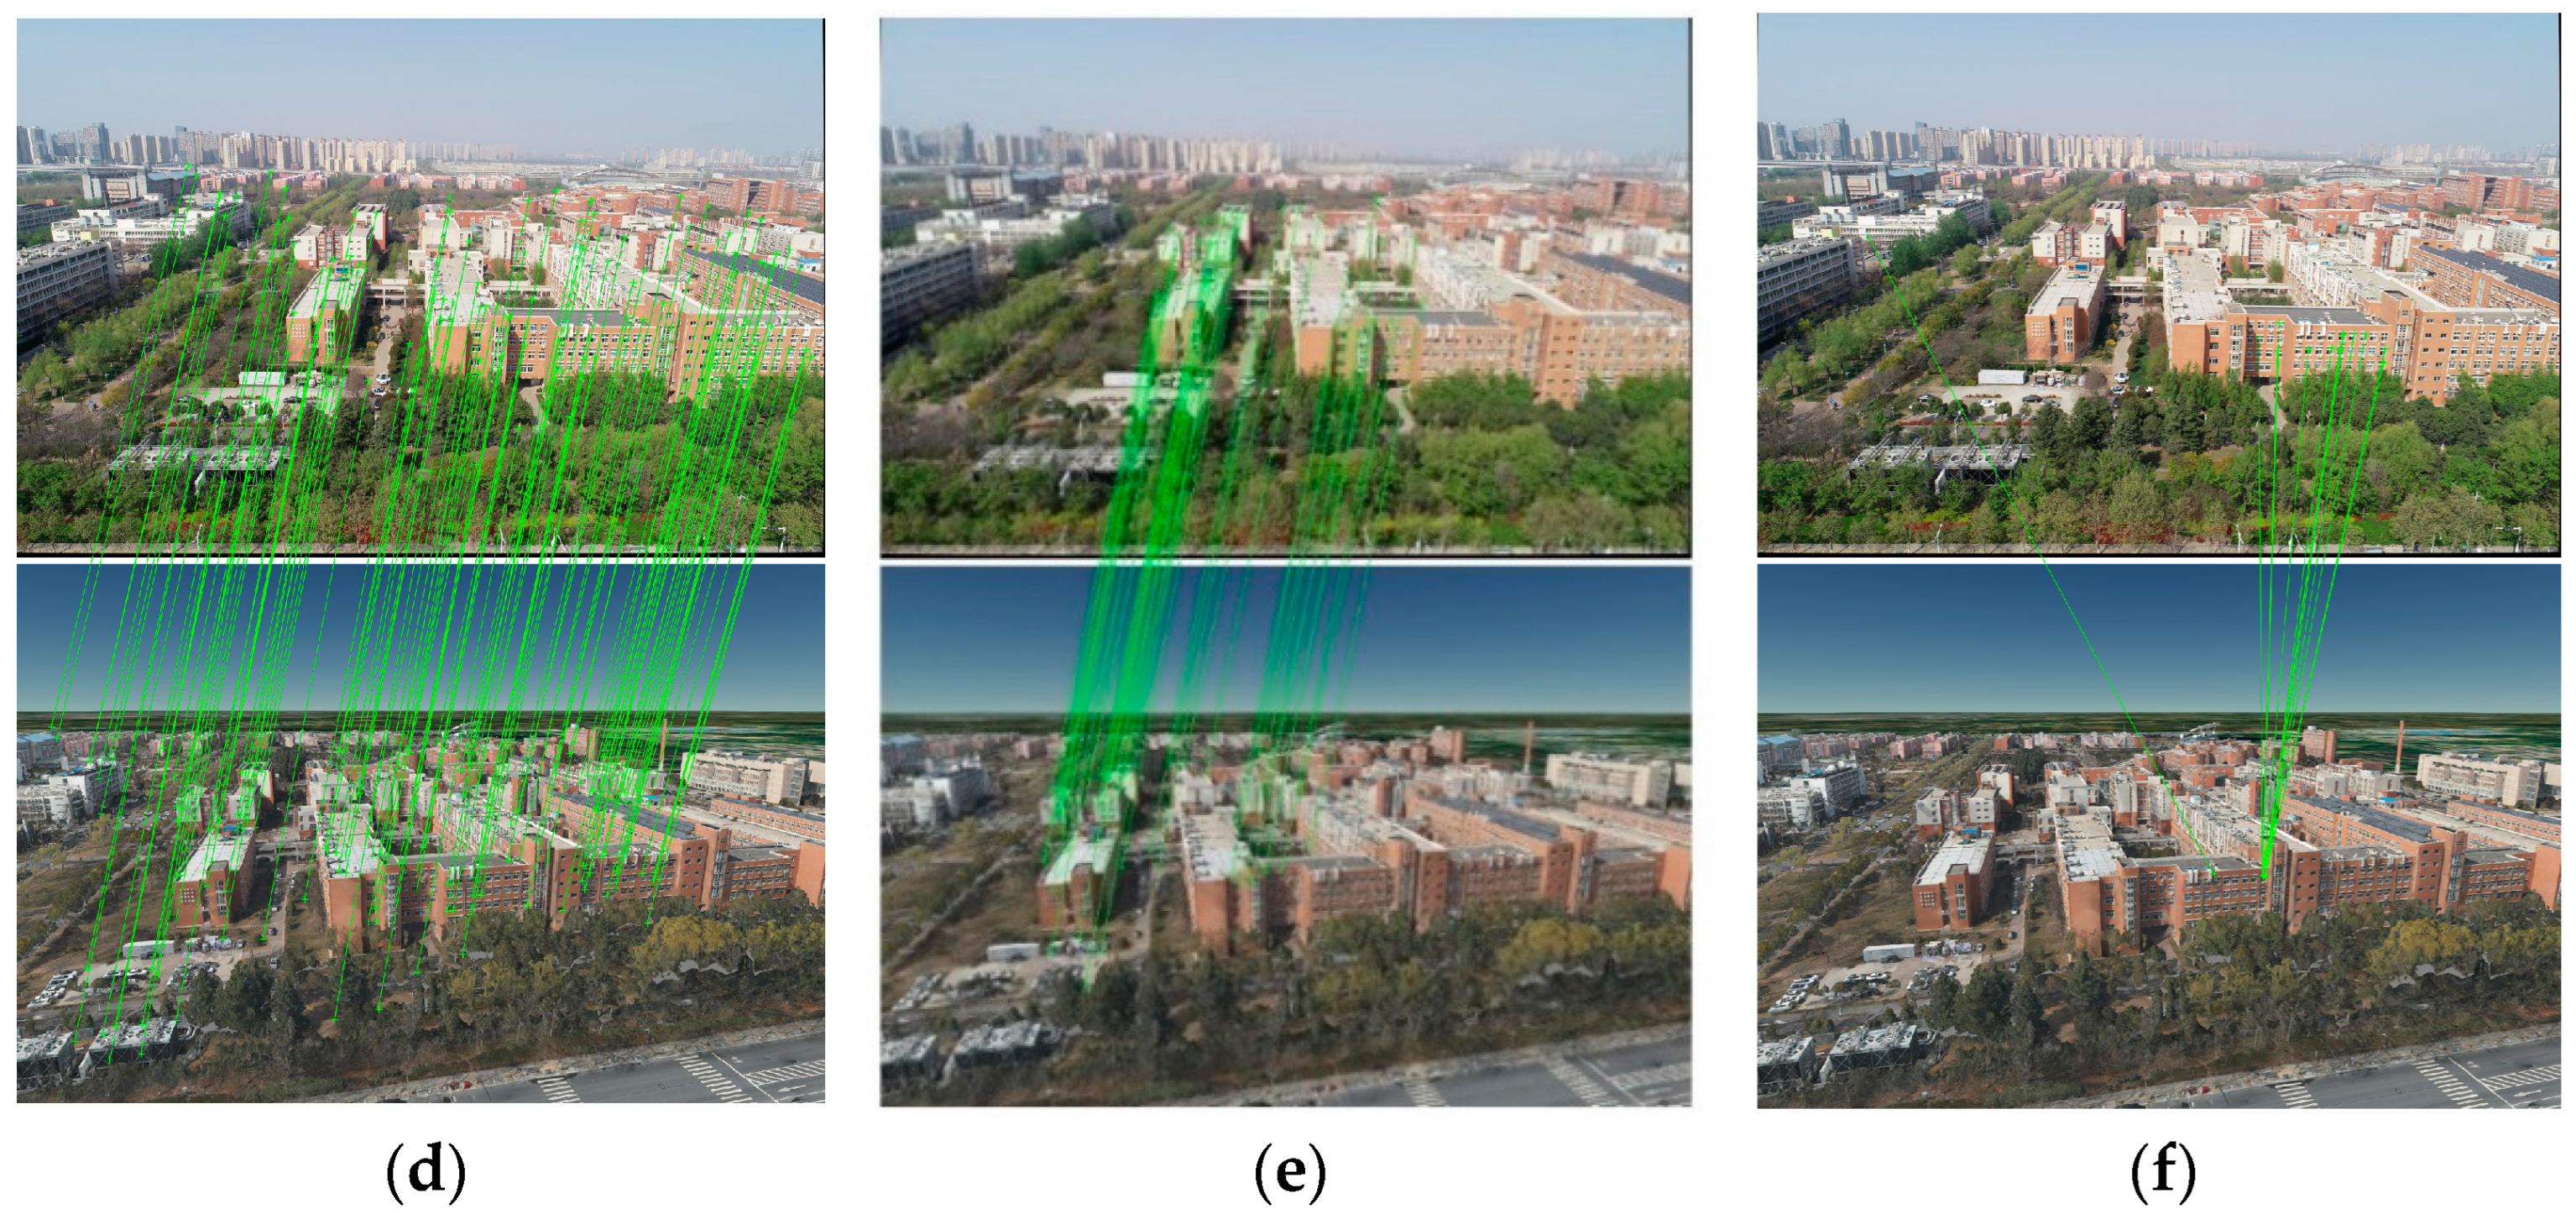
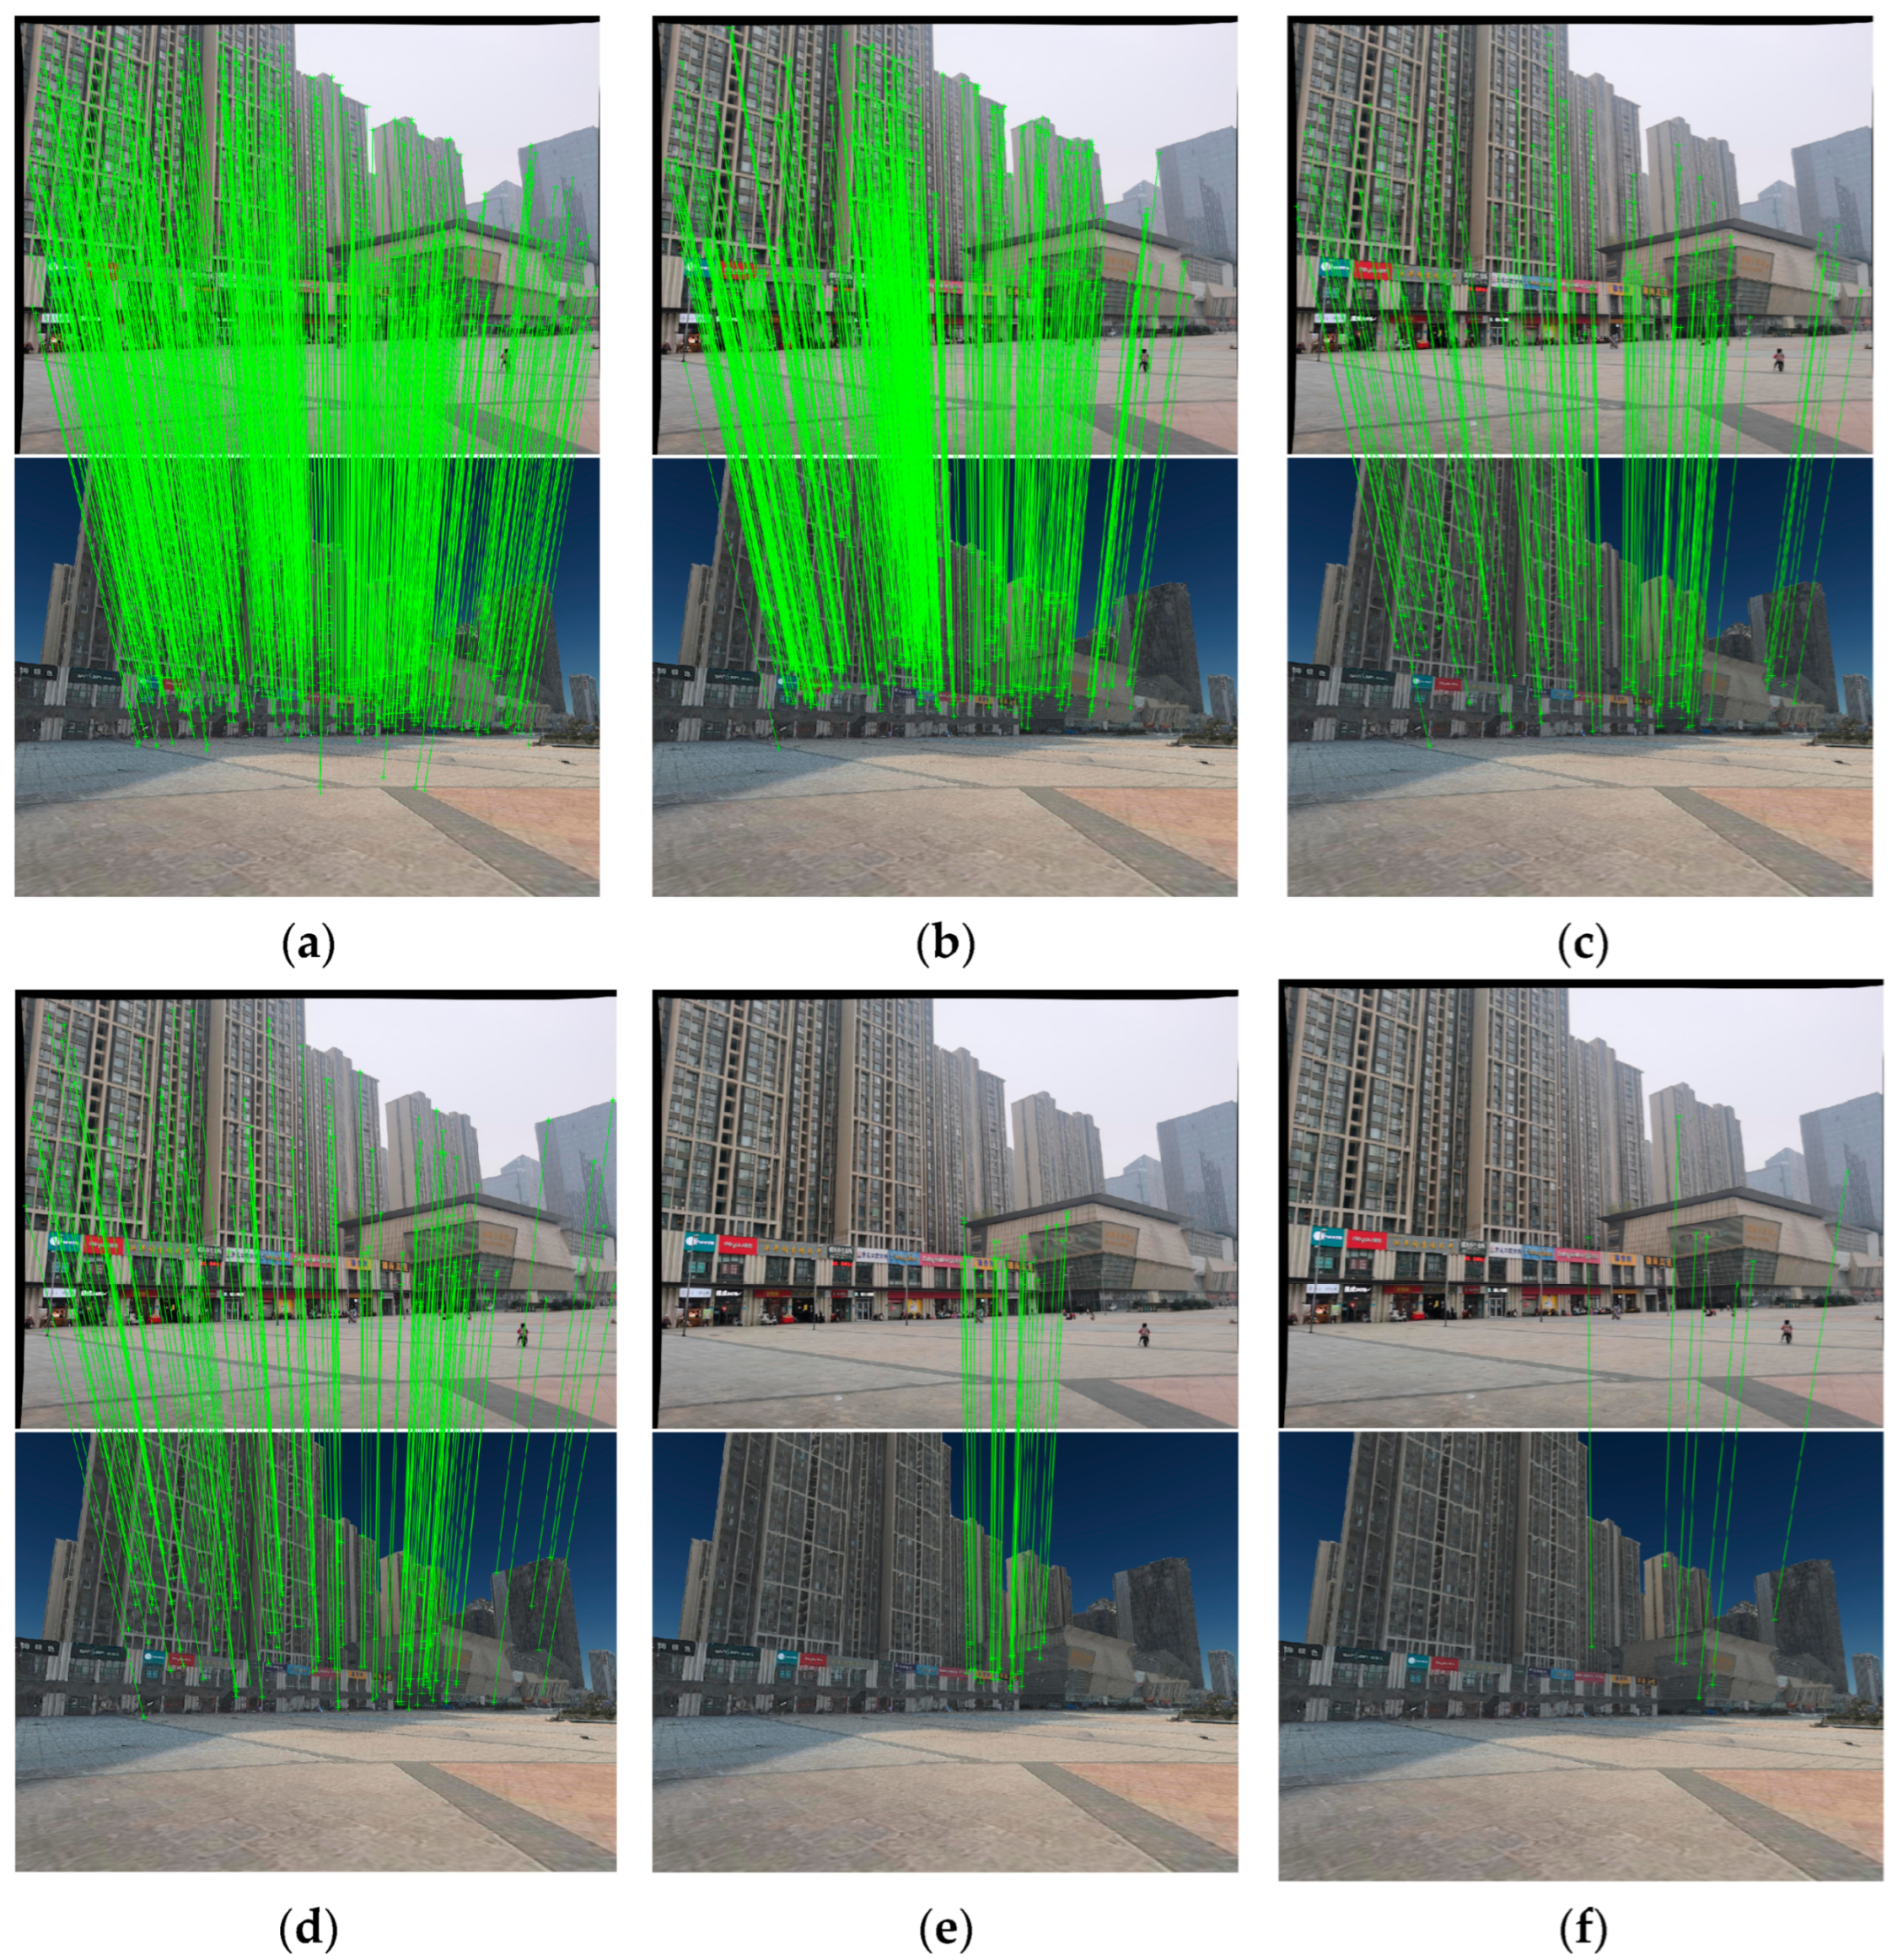
4.1.4. MP-IDSSC Experiment

To achieve accurate camera positioning and orientation, one must establish as many correct matching relationships as possible. To verify the effectiveness of the proposed method, we set up several experimental groups (Table 2). Each experimental group used a different combination of feature extraction and pose estimation methods. This study used the D2-Net, SuperPoint, and SIFT feature extraction methods for comparative experiments. SIFT is an artificially designed feature description and extraction method that is widely used. D2-Net can extract similar scale-invariant features from different images and has strong adaptability and robustness, and SuperPoint is a feature point detection and descriptor extraction method based on self-supervised training. To improve the feature extraction time performance and ensure the same conditions in the experiment, the number of feature points extracted was set to 1000. Then, to validate the performance of our IDSSC-MP algorithm, we selected three advanced algorithms for comparison in terms of feature point matching: SuperGlue [34], GMS, and RANSAC. Their source codes can be downloaded from the internet, and the default parameters were used in the settings.
  • Evaluation Metrics
The experimental results are presented in Table 3. In this experiment, six quantitative evaluation metrics were adopted: number of correct matches (NCM), root mean square error (RMSE), camera position (CP), camera position error (CPE), camera orientation (CO), and camera orientation error (COE). The NCM and RMSE are the two main metrics used to evaluate registration performance. The NCM represents the number of matching point pairs used for the pose calculation; the higher the number, the better the registration performance. RMSE is a metric for evaluating the accuracy of the matching point position; the smaller the RMSE, the higher the matching accuracy. CP denotes the camera coordinates calculated from experiments in the ECEF coordinate system, and CPE is the error value of CP compared with the actual camera coordinates. CO denotes the camera orientation calculated from experiments in the yaw/pitch/roll system, and the unit is degree. COE is the orientation error value of the CO compared with the actual camera orientation. The unit is mrad, and 1 mrad is about 0.057 degrees. This means an error of about 1 meter beyond 1000 m.
2.
Results Analysis
The results show that the camera pose estimated by using the traditional point feature matching method (SuperGlue and GMS) has a larger vertical error because the Z-coordinate error is larger than the X, Y coordinate error, and the pitch angle error is larger than the yaw and rolling angle error. This is because real images contain sky, trees, and barren ground, resulting in an uneven vertical distribution of feature points in the image. It can also be seen in Figure 7 and Figure 8 that in the image matching results, there are more feature points in the middle of the image, while there are fewer feature points in the upper and lower parts. This leads to insufficient constraints in the vertical direction, resulting in a large vertical error. In Trials 1-2, because this method uses the structural semantic information in the image and the direction of the plumb line to constrain, the error in the vertical direction is significantly reduced. Comparing Trials 4-5, our IDSSC-MP method obtains better results when the same feature point extraction algorithm is used. In Trials 4-5, the average error of the Z-coordinate is 5.26 m, but 2.88 m in Trials 1-2, which is 45% less than that in Trials 4-5. In Trials 1-2, the accuracy of the NCM and RMS is also higher, and the calculated camera position and attitude errors are smaller, which shows the effectiveness of the MP-IDSSC method.
In order to further illustrate the effectiveness of structural semantic constraints, we designed Trial 3. In Trial 3, there is only the constraint of inverse depth coordinates, and there is no constraint of structural semantics. The results show that the vertical error is also high, but compared with Trials 4-5, the experimental results still have advantages. This is because the SuperGlue and GMS methods only restrict the spatial position relationship of feature points in the image plane using a relative graph structure and may not be able to find an accurate matching relationship. For the most accurate correspondence to reduce false matching caused by similar multiple feature points, Trial 3 used the inverse depth coordinates of feature points and the 3D–2D projection relationship as constraints.
Comparing Trials 1 and 4, the SuperPoint method is better than the D2-Net method when the MP-IDSSC is used as the feature matching method. Although D2-Net performs better than SuperPoint in the cross-modality image environment, the positioning accuracy of the D2-Net feature point is lower. After eliminating the feature points with large projection errors using IDSSC constraints, the remaining feature points participating in the camera pose estimation are fewer, and the RMS accuracy of the feature points is still low. In Trial 6, the results of matching and pose estimation are obviously wrong, which indicates that the traditional artificial feature extraction and RANSAC matching methods are not effective for images with large differences in appearance.
Considering the above experimental results, this method can optimize the initial vision sensor pose effectively, utilizes the constraints of inverse depth and structure semantic information to estimate the camera pose more accurately, and reduces the Z-coordinate error caused by the uneven distribution of feature points in the vertical direction. In addition, the proposed method is more accurate, has stronger adaptability than existing algorithms, and performs effectively in challenging conditions.

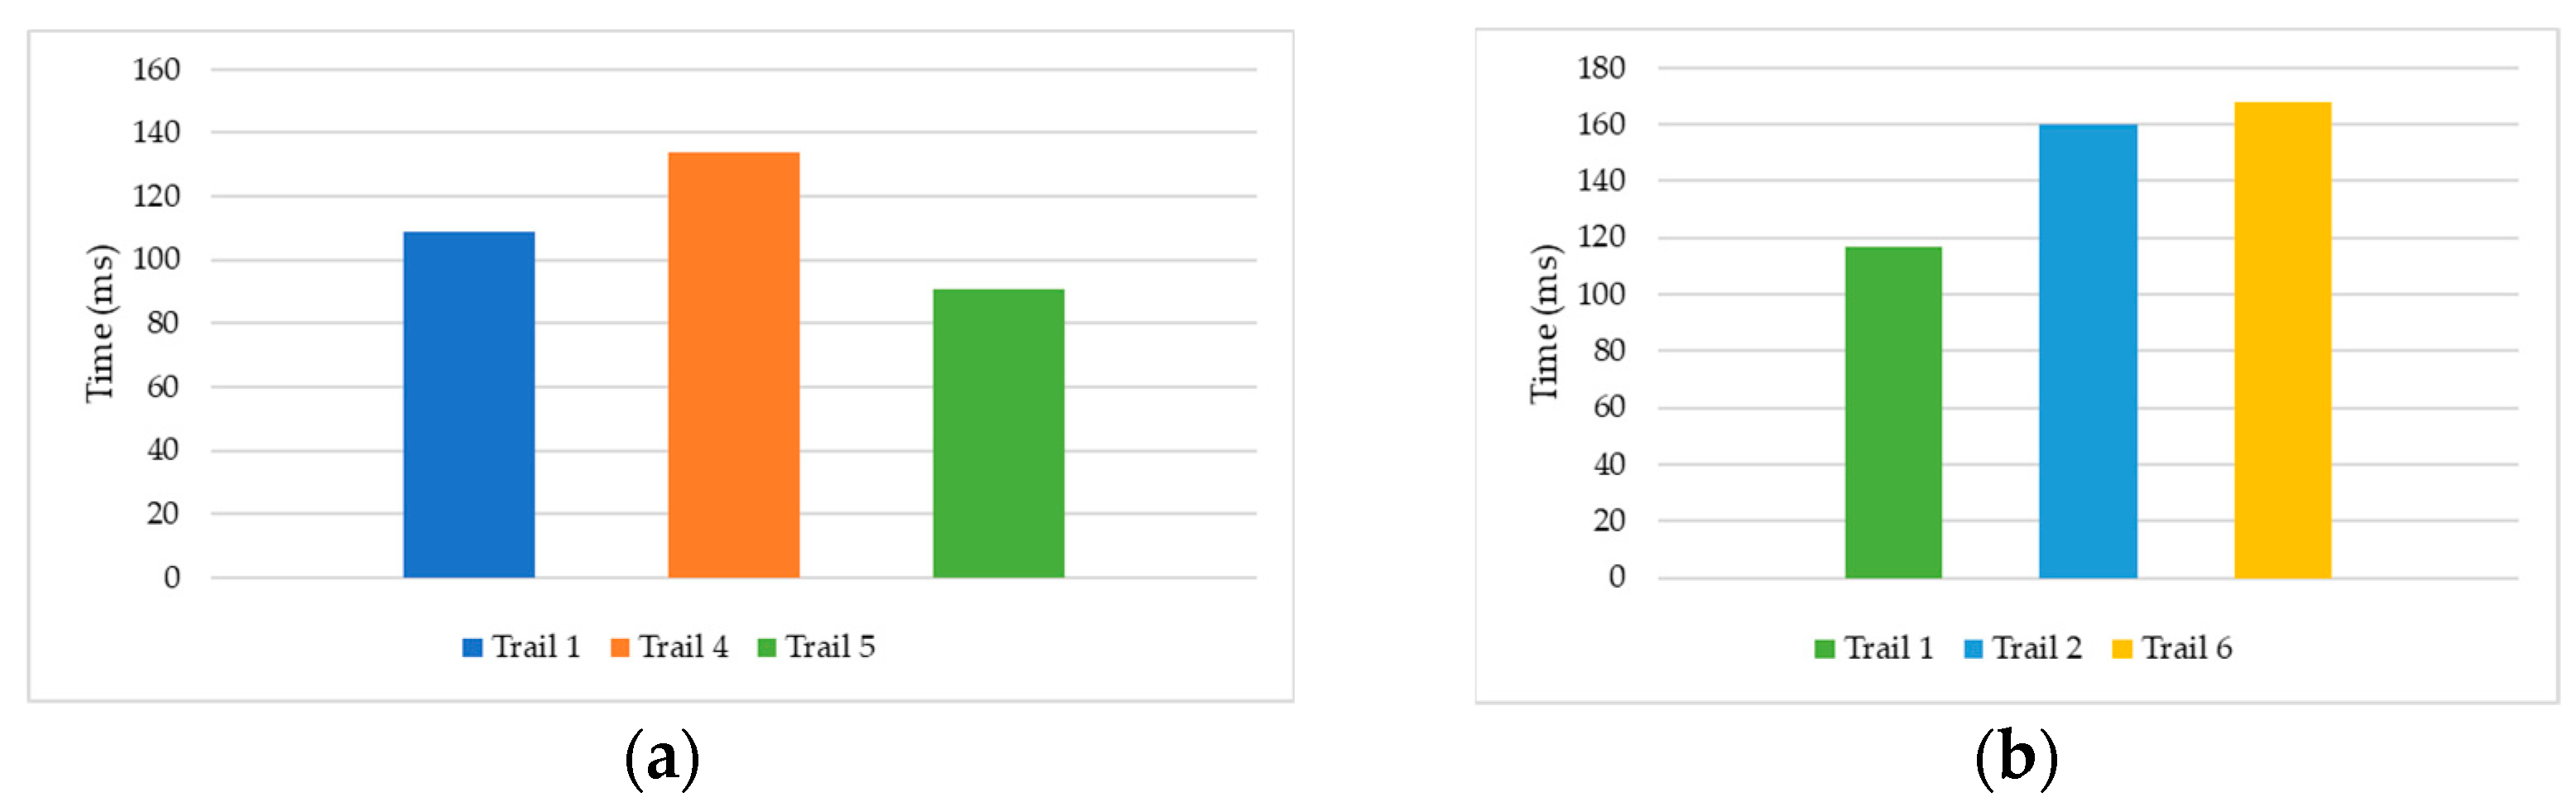
4.1.5. Time Efficiency Analysis Experiment

Figure 9 shows the time efficiency of the proposed method. The runtime of the algorithm is largely affected by the computer configuration. In this experiment, the computer was configured with a Windows 10 64-bit operating system on an Intel Core i9-9980XE 3.0 GHz CPU, with 64 GB of RAM and an NVIDIA GeForce RTX™ 3090 graphics card.
Figure 9a shows the time performance of the feature matching and pose estimation methods under the constraint of inverse depth coordinates. The results show that the proposed method has advantages in Trial 1 in terms of time performance compared with the results of Trial 4. In Trial 5, the GMS method was used, which reduces the matching step time, but its feature point location accuracy is low. Figure 8b compares the time performance of different feature extraction methods and shows that the SuperPoint method took the shortest time.

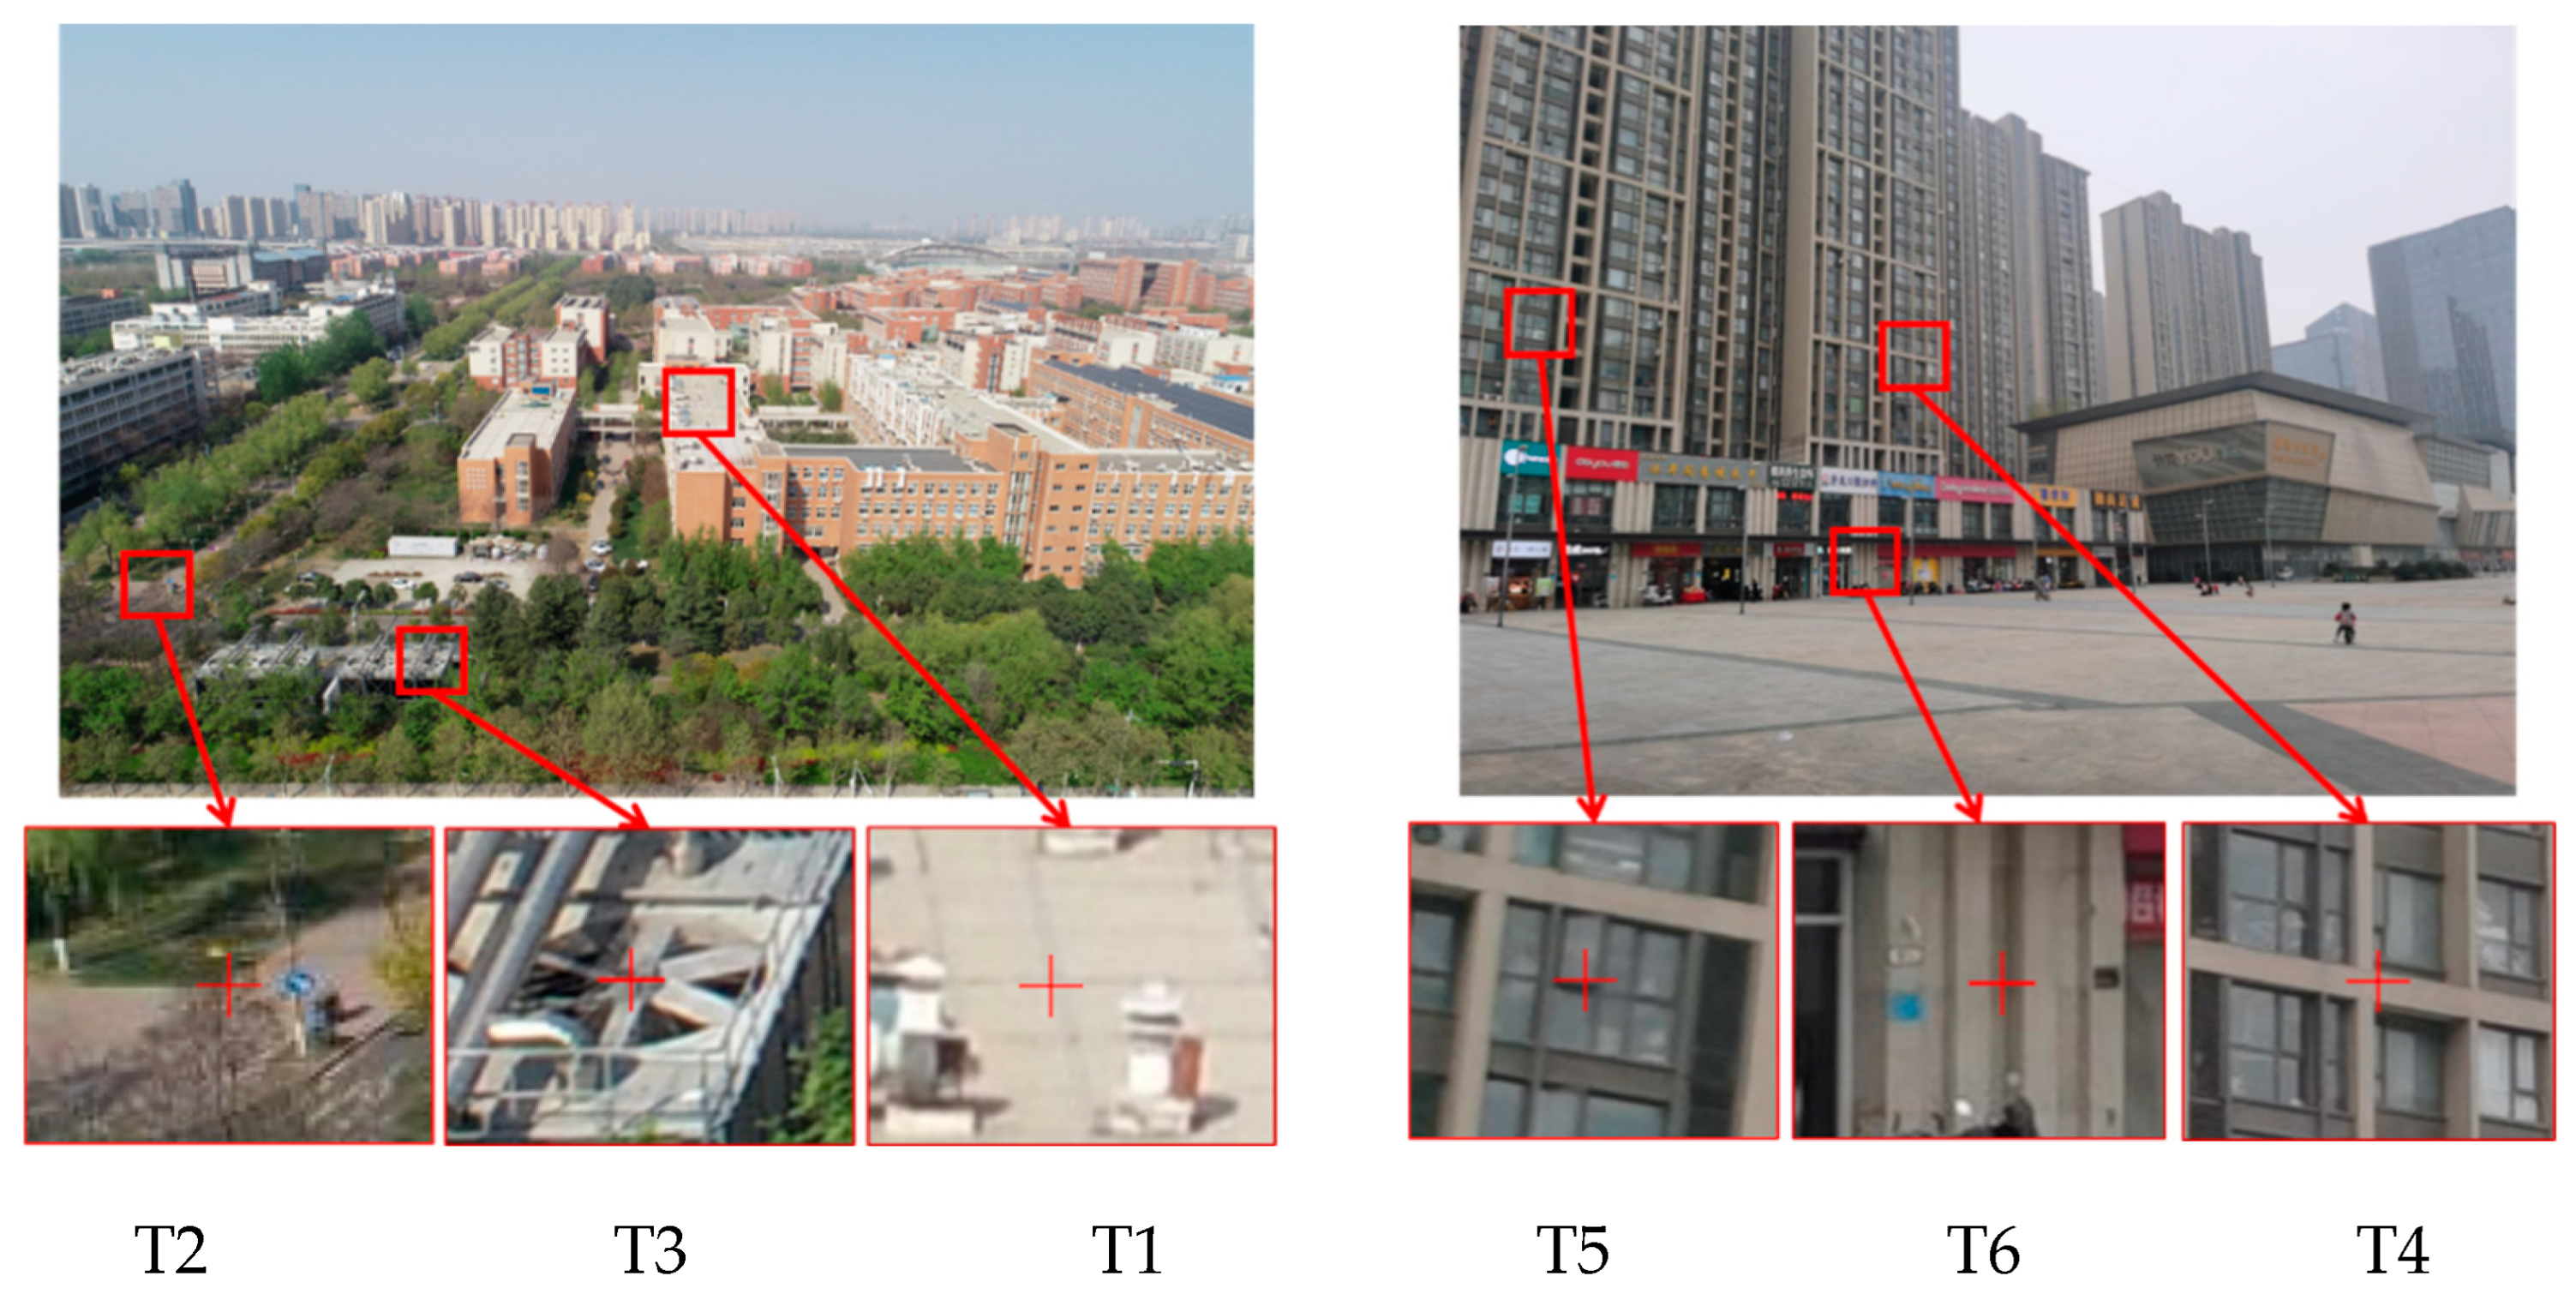
4.2. Application Experiment of Multi-Object Positioning for Monocular Image

Object positioning is commonly used in digital twin applications. This study designed a multi-object spatial positioning application experiment based on a monocular image to verify the effectiveness of this method in object positioning. Once the pose of the camera is computed, the object target can be located. This experiment was conducted using the digital twin city model data. The error between the result of object geolocation and that obtained from the model data was analyzed. Three different points in each image were selected as target points in the image; the position of each point in the image is shown in Figure 10. The coordinates of the points were calculated based on Trials 1, 4, and 5 and the coordinates of the target points corresponding to the model data as true values.
Table 4 lists the basic information for each target point, and Table 5 lists the different experimental results obtained. In the target point information, target distance (TD) refers to the distance between the target point and the camera in meters, and radial distance (RD) refers to the radial distance of the target point on the image from the principal point in pixels. Base coordinates (BC) refer to the coordinates of the target point in the base geographic data, which are used to evaluate the errors of the coordinates of the target point calculated in different trials. The evaluation index includes the position error (PE), absolute position error (APE), and relative position error (RPE). The PE refers to the error of the target point in the ECEF system. The APE is the L2 distance of the PE. The RPE is the relative error calculated using RPE   =   APE / TD .
Experiments show that this method can alleviate the uneven distribution of target position errors. In Trials 4 and 5, targets T1, T4, and T5 are located near the image center with an average relative error of 0.3%, while T3 and T6 are located near the edge of the image with an average relative error of 3.84%. This is because the camera pose error is larger in the vertical direction, resulting in a target position error in the image, which also presents the problem of uneven distribution in the vertical direction. Because of the error in the calculated camera position, the calculated principal optical axis direction differs significantly from the true principal optical axis pitch angle, which results in a small position error near the image principal point and a large position error at the image edge in the vertical direction. In Trial 1, the target position error at the edge of the image is reduced because of the constraints of inverse depth and structure semantics, which alleviates the problem.
It also can be seen from the experiment that the absolute error of object registration accuracy of this method is 0.66 m, while the average error of the camera’s own pose is 3.36 m. This is because, although the camera pose error is larger, after position correction, the two main optical axes can intersect near the image center target point, so the target positioning accuracy is higher than the camera’s pose. This indicates that this method does not need to rely on the camera’s own high-precision pose when locating the object, and our method can achieve high-precision registration.

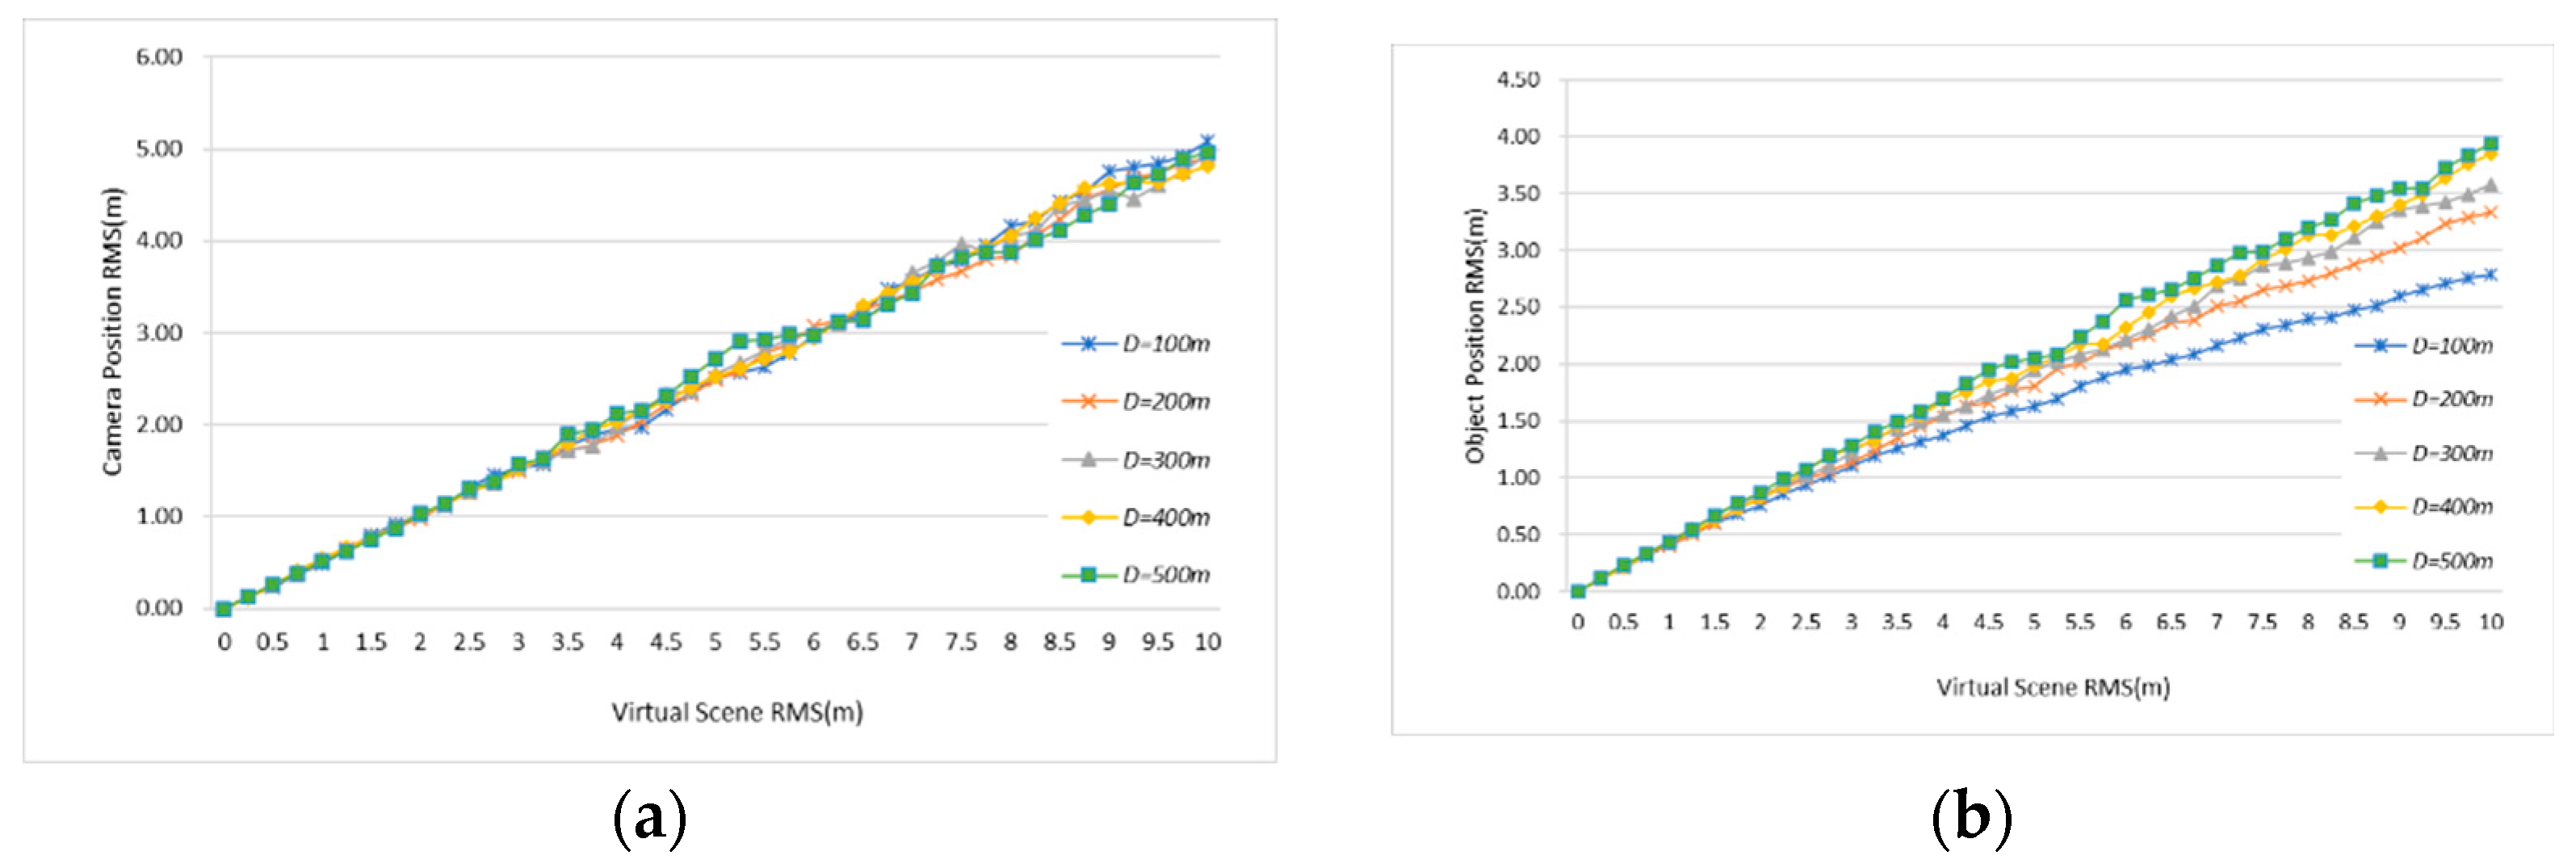
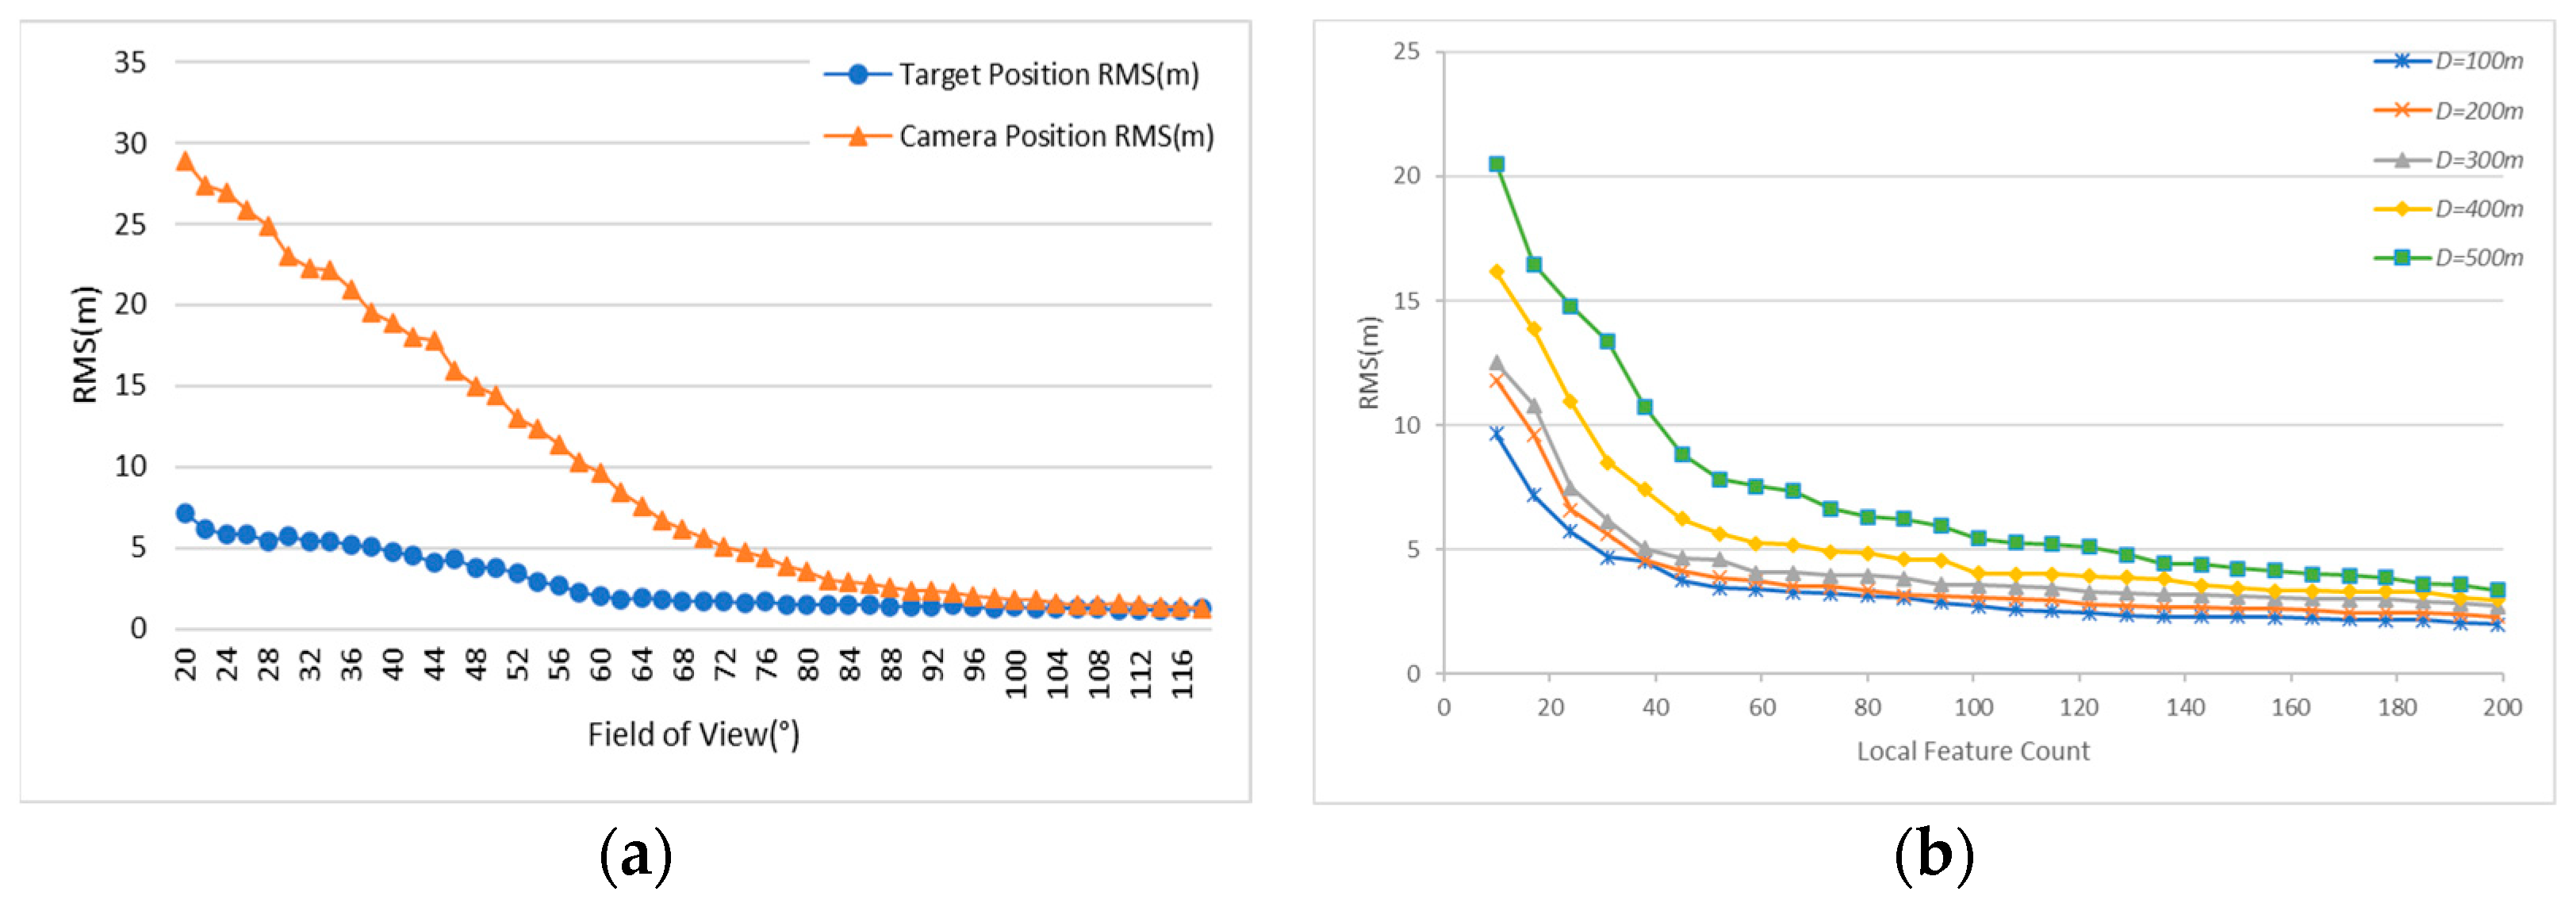
4.3. Simulation Experiments and Analysis

Due to differences in modeling methods and data sources, the accuracy of 3D models used in digital twin applications is often different, and different devices and environments have an impact on 2D-3D registration. To further analyze the impact of 2D-3D registration accuracy, simulation experiments were carried out in this study. The error factors affecting the registration algorithm are divided into systematic and random errors. The systematic error can be compensated for in the algorithm by measuring the camera calibration in the laboratory; therefore, the random error from various sensor measurements was the main factor causing the localization error. Table 6 lists the commonly used error terms and their distributions.
The impact of the parameters in Table 5 on registration accuracy requires in-depth analysis. The literature [35,36,37] has analyzed and performed experiments on parameters such as image distortion and camera pose. Hence, we adopted the Monte Carlo [38] method to analyze the impact of virtual scene errors on camera positioning and object positioning accuracy. The Monte Carlo method, also known as the stochastic simulation method, uses computers to generate qualified random data that can replace data that are difficult to obtain in experiments. Figure 11a shows the relationship between virtual scene data errors and calculated camera position root mean square (RMS) errors when the camera distance D is from 100 m to 500 m. Taking the center point of the image as the object position, Figure 11b describes the relationship between the RMS object position error and the virtual scene data error.
The results show that the camera position error increases with the increase in virtual scene errors, but at different distances D, the RMS camera position errors remain approximately the same. When analyzing the object position error, the virtual scene data error increases when the RMS target position error increases. Additionally, when D increases, the incremental proportion of the RMS object position error is smaller than the incremental proportion of the distance D.
These experimental results show that: (1) The camera position can be used as a constraint condition for image matching. If only the virtual scene data error needed to be considered, when the virtual scene data error was 10 m and the object distance was 500 m, the calculated RMS camera position error was only 5 m. (2) The result of object localization was better than the calculated result for the camera position. When D = 100 m, the calculated RMS object position error was only half of the camera position error. This is because when the camera direction was aimed at the target, a more accurate target localization result could be obtained.
Figure 12 illustrates the impact of the field of view and feature count on the calculation accuracy of the camera pose and target position. The results show that when the field of view increases, the camera position error and target position error gradually decrease and that the field of view has a greater impact on the accuracy of the camera position. The feature count also has an impact on the target localization results. We used random sampling to uniformly select different numbers of feature points from an image for comparative experiments. The figure shows that when the feature count decreases, the RMS error of target localization increases continuously. Notably, when the feature count is less than 50, the RMS error of localization greatly increases.

5. Conclusions

This paper proposes a virtual–real 2D-3D registration method under the constraints of inverse depth and structural semantics. First, the perspective and inverse depth images of the virtual scene are obtained by using PDNT technology, and the structural semantic features are extracted by the two-line MSS plumb line extraction method. Then, we estimate the camera pose under the constraints of inverse depth information and structural semantics and accurately achieve the registration of the real image and the virtual scene. The experimental results show that the proposed method can achieve high-precision vision sensor registration in a digital twin scene and solves the large vertical error problem effectively. The application experiment of monocular image multi-object spatial positioning proves the practicability of this method.
This study obtained the 2D-3D registration of static images. Future studies will include ways to use digital twin scenes to achieve dynamic target tracking and real-time localization based on monocular images. Because the manual selection of measurement targets has a negative impact on user experience, achieving target capture in an outdoor environment is an important issue that will likely be included in future research.

Author Contributions

Conceptualization, X.H. and Y.Z.; methodology, X.H. and Q.S.; software, X.H.; validation, Q.S.; formal analysis, X.H. and Y.Z.; investigation, Q.S.; resources, X.H. and Q.S.; data curation, X.H.; writing—original draft preparation, X.H. and Y.Z.; writing—review and editing, X.H.; visualization, Q.S.; supervision, Y.Z.; project administration, Q.S. All authors have read and agreed to the published version of the manuscript.

Funding

The Natural Science Foundation of Henan Province (No. 202300410536).

Institutional Review Board Statement

Not applicable.

Informed Consent Statement

Not applicable.

Data Availability Statement

Not applicable.

Acknowledgments

The authors appreciate the editors and reviewers for their comments, suggestions, and valuable time and effort in reviewing this manuscript.

Conflicts of Interest

The authors declare no conflict of interest.

References

  1. Deng, T.; Zhang, K.; Shen, Z.-J. A systematic review of a digital twin city: A new pattern of urban governance toward smart cities. J. Manag. Sci. Eng. 2021, 6, 125–134. [Google Scholar] [CrossRef]
  2. Gao, Z.; Song, Y.; Li, C.; Zeng, F.; Wang, P. Research on the Application of Rapid Surveying and Mapping for Large Scare Topographic Map by UAV Aerial Photography System. Remote Sens. 2017, 42, 121. [Google Scholar] [CrossRef]
  3. Billinghurst, M.; Clark, A.; Lee, G.J. A survey of augmented reality. Found. Trends Hum.-Comput. Interact. 2015, 8, 73–272. [Google Scholar] [CrossRef]
  4. Li, C.; Liu, Z.; Zhao, Z.; Dai, Z. A fast fusion method for multi-videos with three-dimensional GIS scenes. Multimed. Tools Appl. 2020, 80, 1671–1686. [Google Scholar] [CrossRef]
  5. Xu, Z.; Wang, G. Research on the Method of 3D Registration Technology. IOP Conf. Ser. Earth Environ. Sci. 2020, 440, 032139. [Google Scholar] [CrossRef]
  6. Coughlan, J.M.; Yuille, A.L. Manhattan World: Compass Direction From a Single Image by Bayesian Inference. In Proceedings of the Seventh IEEE International Conference on Computer Vision, Kerkyra, Greece, 20–27 September 1999; pp. 941–947. [Google Scholar]
  7. Ma, W.; Xiong, H.; Dai, X.; Zheng, X.; Zhou, Y. An Indoor Scene Recognition-Based 3D Registration Mechanism for Real-Time. AR-GIS Vis. Mob. Appl. 2018, 7, 112. [Google Scholar]
  8. Li, J.; Wang, C.; Kang, X.; Zhao, Q. Camera localization for augmented reality and indoor positioning: A vision-based 3D feature database approach. Int. J. Digit. Earth 2019, 13, 727–741. [Google Scholar] [CrossRef]
  9. Wu, Y.; Che, W.; Huang, B.G.T. An Improved 3D Registration Method of Mobile Augmented Reality for Urban Built Environment. Int. J. Comput. Games Technol. 2021, 2021, 1–8. [Google Scholar] [CrossRef]
  10. Yue, L.; Li, H.; Zheng, X.J.S. Distorted Building Image Matching With Automatic Viewpoint Rectification and Fusion. Sensors 2019, 19, 5205. [Google Scholar] [CrossRef]
  11. Huang, W.; Sun, M.; Li, S. A 3D GIS-Based Interactive Registration Mechanism for Outdoor Augmented Reality System. Expert Syst. Appl. 2016, 55, 48–58. [Google Scholar] [CrossRef]
  12. Lowe, D.G. Distinctive image features from scale-invariant keypoints. Int. J. Comput. Vis. 2004, 60, 91–110. [Google Scholar] [CrossRef]
  13. DeTone, D.; Malisiewicz, T.; Rabinovich, A. Superpoint: Self-Supervised Interest Point Detection and Description. In Proceedings of the IEEE Conference on Computer Vision and Pattern Recognition Workshops, Salt Lake City, UT, USA, 18–22 June 2018; pp. 224–236. [Google Scholar]
  14. Dusmanu, M.; Rocco, I.; Pajdla, T.; Pollefeys, M.; Sivic, J.; Torii, A.; Sattler, T. D2-Net: A Trainable cnn for Joint Description and Detection of Local Features. In Proceedings of the IEEE/CVF Conference on Computer Vision and Pattern Recognition, Long Beach, CA, USA, 15–20 June 2019; pp. 8092–8101. [Google Scholar]
  15. Li, J.; Hu, Q.; Ai, M. 4FP-Structure: A Robust Local Region Feature Descriptor. Photogramm. Eng. Remote Sens. 2017, 83, 813–826. [Google Scholar] [CrossRef]
  16. Liu, Z.; Marlet, R. Virtual Line Descriptor and Semi-local Matching Method for Reliable Feature Correspondence. In Proceedings of the Machine Vision Conference, Surrey, UK, 3–7 September 2012; Volume 2012, pp. 16.1–16.11. [Google Scholar]
  17. Chum, O.; Matas, J. Matching With PROSAC-Progressive Sample Consensus. In Proceedings of the Computer Vision and Pattern Recognition (CVPR05), San Diego, CA, USA, 20–26 June 2005; pp. 220–226. [Google Scholar]
  18. Sattler, T.; Leibe, B.; Kobbelt, L. SCRAMSAC: Improving RANSAC’s Efficiency With a Spatial Consistency Filter. In Proceedings of the International Conference on Computer Vision, Kyoto, Japan, 29 September–2 October 2009; pp. 2090–2097. [Google Scholar]
  19. Jiang, S.; Jiang, W. Reliable Image Matching via Photometric and Geometric Constraints Structured by Delaunay Triangulation. ISPRS J. Photogramm. Remote Sens. 2019, 153, 1–20. [Google Scholar] [CrossRef]
  20. Bian, J.; Lin, W.; Liu, Y.; Zhang, L.; Yeung, S.; Cheng, M.; Reid, I. GMS: Grid-Based Motion Statistics for Fast, Ultra-Robust Fea-ture Correspondence. Int. J. Comput. Vis. 2020, 128, 1580–1593. [Google Scholar] [CrossRef]
  21. Pai, P.; Naidu, V.P.S. Target Geo-localization Based on Camera Vision Simulation of UAV. J. Opt. 2017, 46, 425–435. [Google Scholar] [CrossRef]
  22. Fu, Q.; Quan, Q.; Cai, K.-Y. Robust Pose Estimation for Multirotor UAVs Using Off-Board Monocular Vision. IEEE Trans. Ind. Electron. 2017, 64, 7942–79511. [Google Scholar] [CrossRef]
  23. Zhang, L.; Deng, F.; Chen, J.; Bi, Y.; Phang, S.K.; Chen, X.; Chen, B.M. Vision-Based Target Three-Dimensional Geolocation Using Unmanned Aerial Vehicles. IEEE Trans. Ind. Electron. 2018, 65, 8052–8061. [Google Scholar] [CrossRef]
  24. Roig, G.; Boix, X.; Shitrit, H.B.; Fua, P. Conditional Random Fields for Multi-camera Object Detection. In Proceedings of the International Conference on Computer Vision, Barcelona, Spain, 6–13 November 2011; Volume 2011, pp. 563–570. [Google Scholar]
  25. Shi, J.; Zou, D.; Bai, S.; Qian, Q.; Pang, L. Reconstruction of dense three-dimensional shapes for outdoor scenes from an image sequence. Opt. Eng. 2013, 52, 123104. [Google Scholar] [CrossRef]
  26. Sánchez, A.; Naranjo, J.M.; Jiménez, A.; González, A. Analysis of Uncertainty in a Middle-Cost Device for 3D Measurements in BIM Perspective. Sensors 2016, 16, 1557. [Google Scholar] [CrossRef]
  27. Ma, J.; Bajracharya, M.; Susca, S.; Matthies, L.; Malchano, M. Real-Time Pose Estimation of a Dynamic Quadruped in GPS-Denied Environments for 24-Hour Operation. Int. J. Robot. Res. 2016, 35, 631–653. [Google Scholar] [CrossRef]
  28. Tekaya, S.B. Distance Estimation Using Handheld Devices; Naval Postgraduate School: Monterey, CA, USA, 2013. [Google Scholar]
  29. Akinlar, C.; Topal, C. EDLines: A real-time line segment detector with a false detection control. Pattern Recognit. Lett. 2011, 32, 1633–1642. [Google Scholar] [CrossRef]
  30. Lu, X.; Yaoy, J.; Li, H.; Liu, Y.; Zhang, X. 2-Line Exhaustive Searching for Real-Time Vanishing Point Estimation in Manhattan World. In Proceedings of the IEEE Winter Conference on Applications of Computer Vision (WACV), Santa Rosa, CA, USA, 31 March 2017; Volume 2017, pp. 345–353. [Google Scholar]
  31. Mukhopadhyay, P.; Chaudhuri, B.B. A survey of Hough Transform. Pattern Recognit. 2015, 48, 993–1010. [Google Scholar] [CrossRef]
  32. Von Gioi, R.G.; Jakubowicz, J.; Morel, J.M.; Randall, G. LSD: A Line Segment Detector. Image Processing Line 2012, 2, 35–55. [Google Scholar] [CrossRef]
  33. Fotiou, I.A.; Rostalski, P.; Parrilo, P.A.; Morari, M. Parametric Optimization and Optimal Control Using Algebraic Geometry Methods. Int. J. Control 2006, 79, 1340–1358. [Google Scholar] [CrossRef]
  34. Sarlin, P.-E.; DeTone, D.; Malisiewicz, T.; Rabinovich, A. Superglue: Learning Feature Matching With Graph Neural Networks. In Proceedings of the IEEE/CVF Conference on Computer Vision and Pattern Recognition, Seattle, WA, USA, 13–19 June 2020; pp. 4938–4947. [Google Scholar]
  35. Deng, F.; Zhang, L.; Gao, F.; Qiu, H.; Gao, X.; Chen, J. Long-Range Binocular Vision Target Geolocation Using Handheld Electronic Devices in Outdoor Environment. IEEE Trans. Image Process. 2020, 29, 5531–5541. [Google Scholar] [CrossRef]
  36. Cai, Y.; Ding, Y.; Xiu, J.; Zhang, H.; Qiao, C.; Li, Q. Distortion Measurement and Geolocation Error Correction for High Altitude Oblique Imaging Using Airborne Cameras. J. Appl. Remote Sens. 2020, 14, 014510. [Google Scholar] [CrossRef]
  37. Qiao, C.; Ding, Y.; Xu, Y.; Xiu, J. Ground Target Geolocation Based on Digital Elevation Model for Airborne Wide-Area Reconnaissance System. J. Appl. Remote Sens. 2018, 12, 016004. [Google Scholar] [CrossRef]
  38. Collings, B.J.; Niederreiter, H. Random Number Generation and Quasi-Monte Carlo Methods. J. Am. Stat. Assoc. 1993, 88, 699. [Google Scholar] [CrossRef]
Figure 1. Flowchart of the algorithm used in the proposed method. PDNT is used to obtain virtual perspective and inverse depth images. The 2-line MSS method is used to extract structural semantic features. MP-IDSSC achieves 2D-3D registration between the real image and virtual scene.
Applsci 12 08543 g001
Figure 2. Random sampling distribution.
Applsci 12 08543 g002
Figure 3. Mapping the vertical line segment to 3D model space. l is the vertical line segment extracted from the real image. l is the corresponding segment in the virtual perspective image, which is mapped to L . L i n v is the true plumb line of l; due to the existence of error, L will not be a plumb line.
Applsci 12 08543 g003
Figure 4. Real images and virtual scenes. (a,c) Real images taken with a vision sensor; (b,d) digital twin virtual scene.
Applsci 12 08543 g004
Figure 5. Perspective images and inverse depth images: (a) perspective image of P1; (b) inverse depth image of P1; (c) perspective image of P2; and (d) inverse depth image of P2.
Applsci 12 08543 g005
Figure 6. EDLines features and plumb lines: (a) red line segments are the EDLines features of P1; (b) green lines are the plumb lines of P1; (c) red line segments are the EDLines features of P2; (d) green lines are the plumb lines of P2.
Applsci 12 08543 g006aApplsci 12 08543 g006b
Figure 7. Image matching experiment results of image P1: (af) results of Trails 1-6. Green lines indicate correct matches when considering a threshold value of 2 pixels. The feature points are unevenly distributed in the vertical direction.
Applsci 12 08543 g007aApplsci 12 08543 g007b
Figure 8. Results of image matching experiment result of image P2: (af) results of Trails 1-6. Green lines indicate correct matches when considering a threshold value of 2 pixels. The feature points are unevenly distributed in the vertical direction.
Applsci 12 08543 g008
Figure 9. Experimental results of time performance test: (a) time performance comparison of image matching algorithm; (b) time performance comparison of feature extraction.
Applsci 12 08543 g009
Figure 10. Target object points in P1 and P2.
Applsci 12 08543 g010
Figure 11. Influence of virtual scene error on 2D-3D registration accuracy: (a) influence on camera pose accuracy; and (b) influence on object positioning accuracy.
Applsci 12 08543 g011
Figure 12. Analysis of the influence of the field of view (a) and the feature count (b).
Applsci 12 08543 g012
Table 1. Poses of the Real Images.
ImageCamPOSActualError
Position (m)
(X/Y/Z)
Orientation (°)
(Y/P/R)
Position (m)
(X/Y/Z)
Orientation (°)
(Y/P/R)
Position(m)
(X/Y/Z)
Orientation (°)
(Y/P/R)
P1−2093390.42284.9−2093394.17269.673.7515.23
4806197.15−13.54806194.13−5.783.02−7.72
3621100.70360.03621107.46353.68−6.766.32
P2−2093850.41217.2−2093851.67222.461.26−5.26
4806374.773.14806372.5810.632.18−7.53
3620496.15359.03620501.331.39−5.18−2.39
Table 2. Experimental Groups.
TrialFeature ExtractionPose Estimation Method
Trial 1SuperPointIDSSC-MP
Trial 2D2-NETIDSSC-MP
Trial 3SuperPointIDC
Trial 4SuperPointSuperGlue
Trial 5SuperPointGMS
Trial 6SIFTRansac
Table 3. Experimental Results of MP-IDSSC.
TrialsImageNCMRMSECP
X/Y/Z(m)
CPE(m)CO
Y/P/R(°)
COE   ( m r a d )
Trial 1P13320.60−2093392.022.15270.8119.89
4806196.972.83−7.3928.18
3621103.693.77354.8720.76
P23730.59−2093851.70.44221.3319.63
4806372.580.899.4820.07
3620501.741.180.7012.13
Trial 2P12231.83−2093390.583.59271.3729.67
4806196.992.85−7.7834.99
3621102.494.97355.8337.61
P22731.66−2093851.790.56221.2920.42
4806372.71.019.1625.56
3620501.781.600.7311.51
Trial 3P11730.86−2093392.052.18271.3128.53
4806197.183.05−10.0274.00
3621100.776.69356.4047.56
P22190.67−2093851.840.61221.2820.68
4806372.320.638.6035.34
3620501.882.230.8110.03
Trial 4P11820.82−2093392.951.22271.3328.97
4806197.723.58−10.0374.17
3621100.536.93356.3847.21
P21460.96−2093851.60.40221.3319.72
4806372.821.138.45537.96
3620500.331.790.68512.30
Trial 5P1301.89−2093391.173.00271.5532.81
4806196.712.57−9.7569.37
3621098.409.06356.1342.84
P2331.33−2093851.70.43221.2521.11
4806373.892.208.3439.88
3620498.873.240.712.04
Trial 6P1131.05−2093246.81147.36183.381506.04
4806182.1012.03−34.71504.92
3621131.5724.1176.591447.05
P271.69−2093842.58.77218.8623.38
4806368.513.1717.66162.83
3620501.051.077.16124.96
Table 4. Basic Information for Each Target Point.
T1T2T3T4T5T6
TD(m)225.08172.251191038264
RD(728,435)(111,655)(423,755)(696,534)(138,433)(751,863)
BC−2093175.39−2093268.12−2093291.67−2093828.59−2093861.08−2093831.16
4806240.404806242.664806203.834806463.964806437.854806415.05
3621093.203621000.583621049.343620461.023620453.393620457.80
Table 5. Experimental Results of Multi-Object Positioning.
TargetIndexTrial 1Trial 4Trial 5
T1PE(m)−0.31/−0.36/0.13−0.27/0.64/−0.410.18/−0.38/0.5
APE(m)0.500.800.65
RPE0.25%0.39%0.32%
T2PE(m)−0.25/−0.32/0.31−0.98/0.88/−1.68−2.88/0.21/−2.06
APE(m)0.682.133.54
RPE0.4%1.2%2.0%
T3PE(m)−1.52/0.19/−0.66−0.72/0.72/1.97−1.31/−1.64/1.56
APE(m)1.662.212.61
RPE1.5%1.90%2.37%
PE(m)0.1/0.07/0.10.07/0.12/0.010.01/0.12/−0.05
T4APE(m)0.160.150.13
RPE0.15%0.14%0.12%
PE(m)0.27/0.12/0.110.21/0.14/0.05−0.32/0.22/0.02
T5APE(m)0.320.250.40
RPE0.4%0.49%0.35%
PE(m)−0.05/1.54/−1.71−0.1/2.32/−2.391.01/2.27/−2.86
T6APE(m)2.303.333.79
RPE3.5%5.2%5.9%
Table 6. Parameters affecting target localization accuracy.
DataError ModelUnit
Camera Position ErrorNormal Distribution φ A / ( ° )
Camera Orientation ErrorNormal Distribution ψ / ( ° )
Pixel Measurement ErrorNormal Distribution u / ( p i x e l )
Feature Matching ErrorNormal Distribution/
Image Distortion Error /
Virtual Scene RMS ErrorNormal Distribution m
Feature Count//
Field of View//
Publisher’s Note: MDPI stays neutral with regard to jurisdictional claims in published maps and institutional affiliations.

