
Holistic Interpretation of Public Scenes Using Computer Vision and Temporal Graphs to Identify Social Distancing Violations

 , , , , , ,
  and
and
Abstract
:1. Introduction
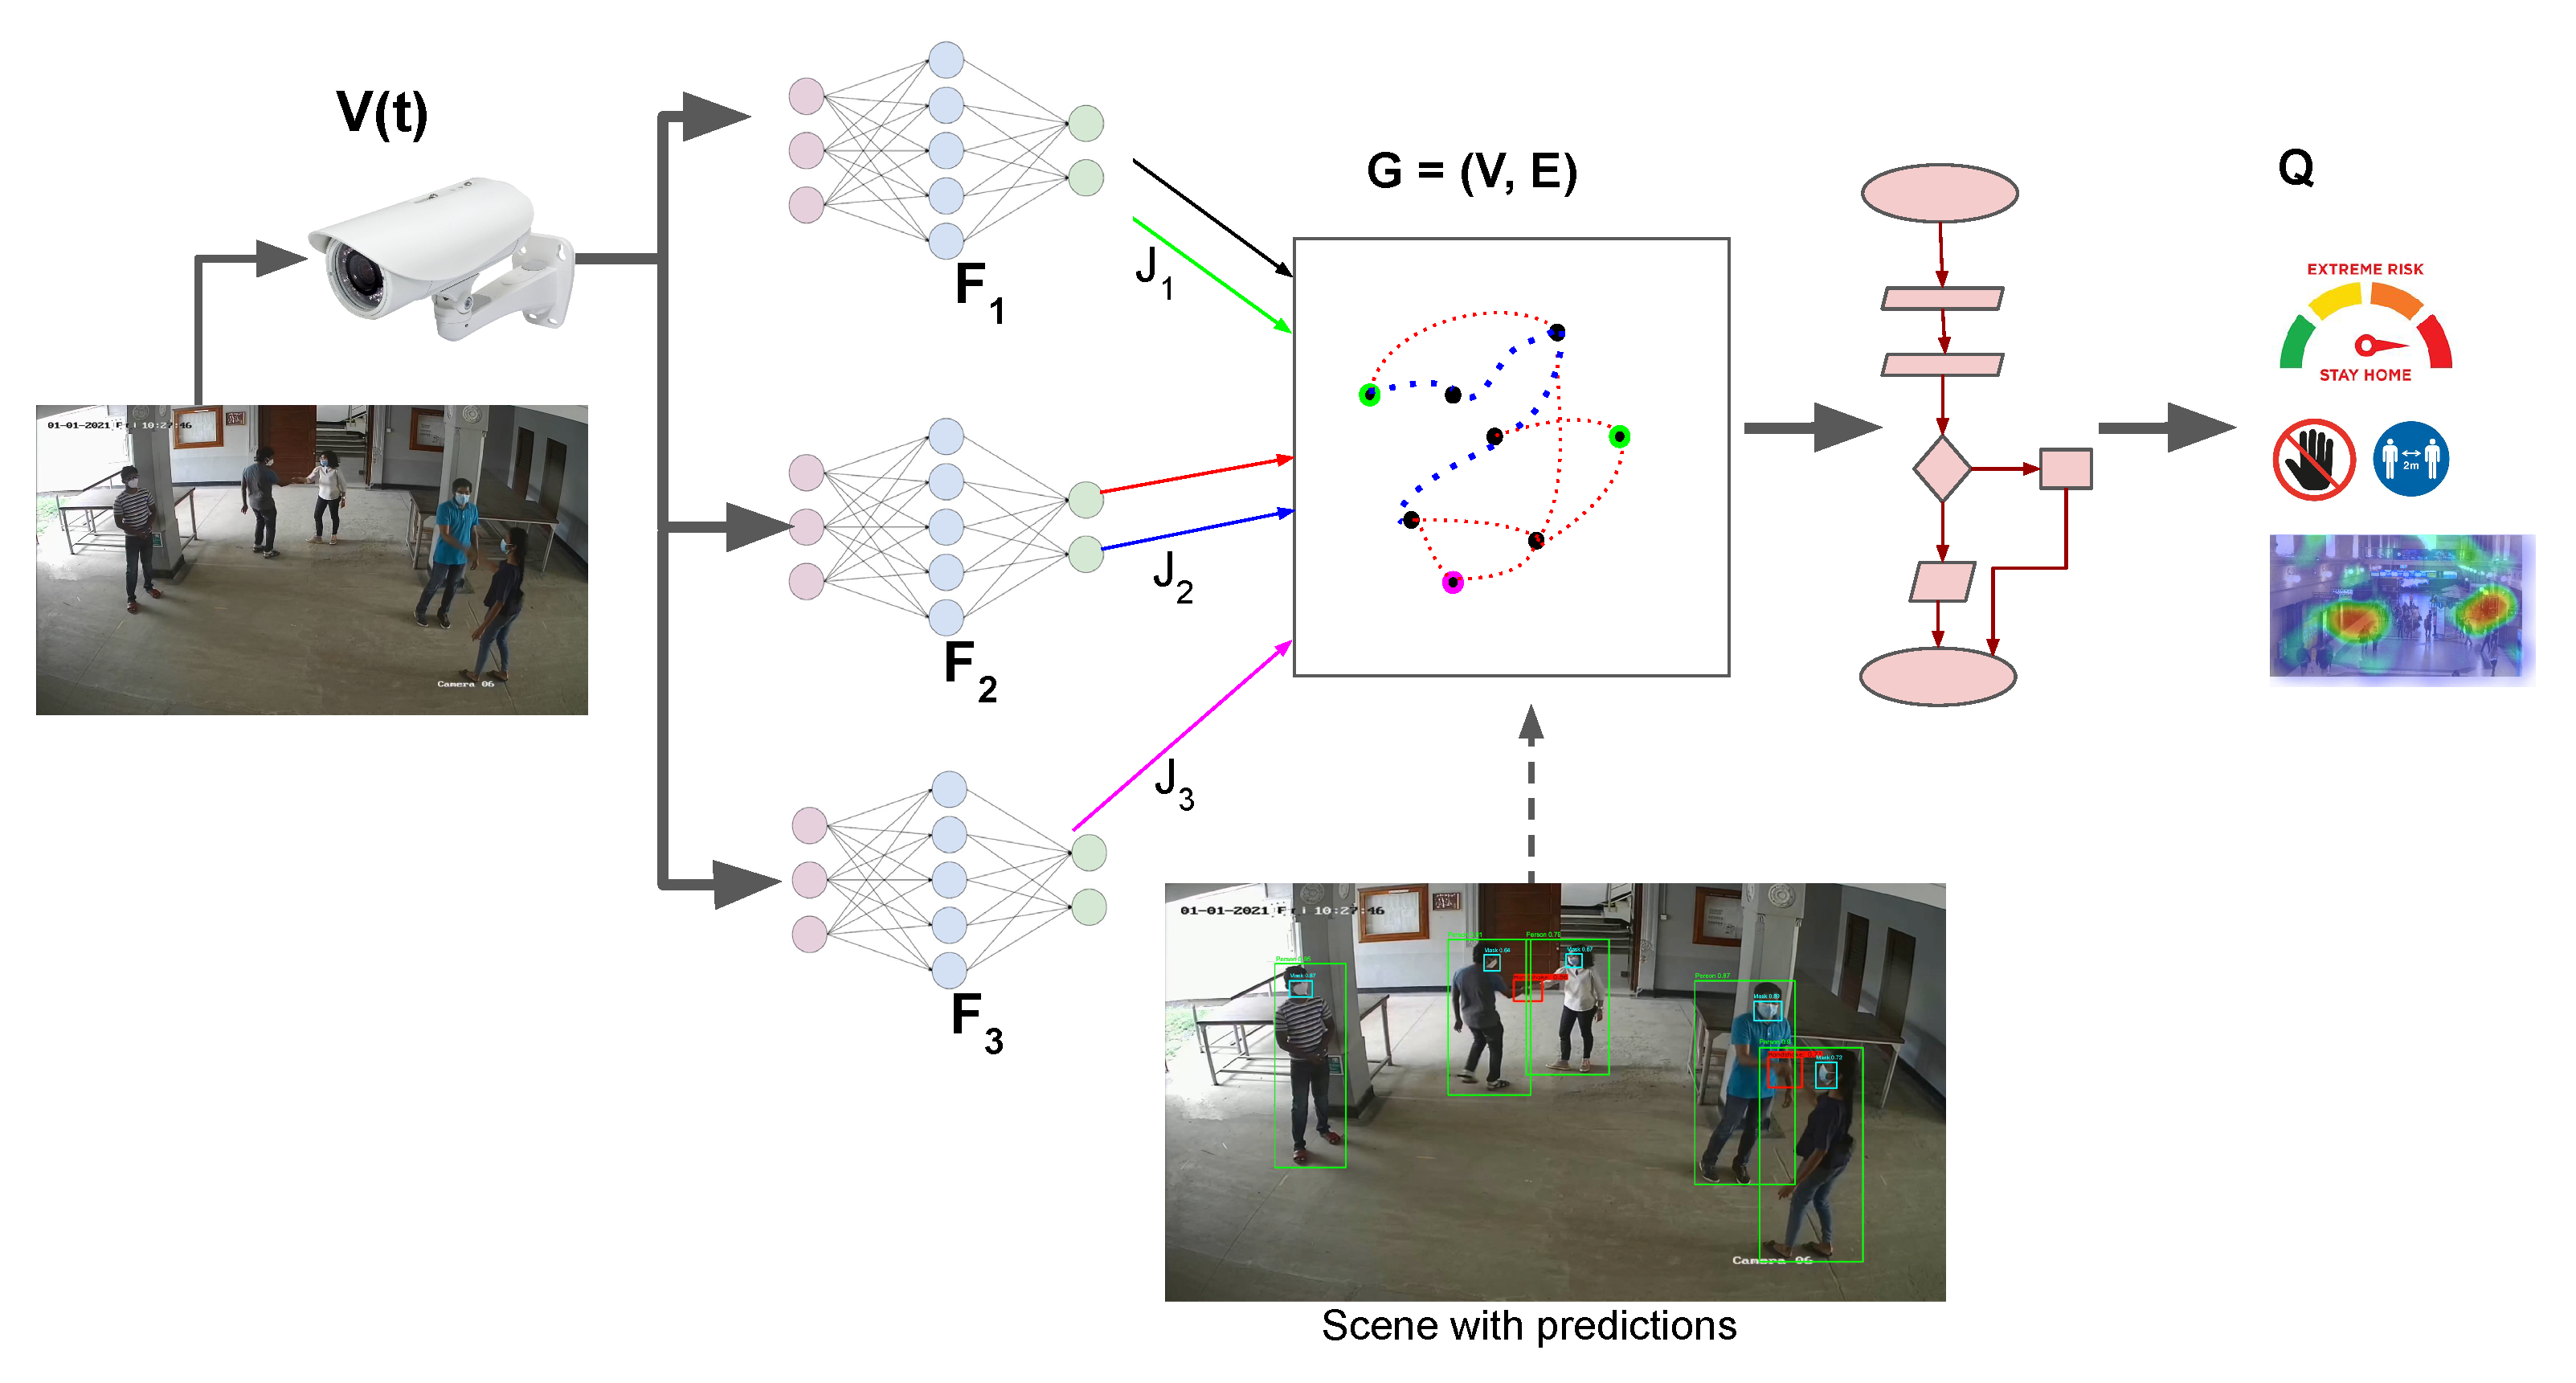
- A deep learning-based system to monitor social distancing violations and COVID-19 threat parameters. The system can utilize multiple computer vision modules to extract different information from the video sequence such as the number of people, their location, their physical interactions, and whether they wear masks.
- A temporal graph representation to structurally store the information extracted by the computer vision modules. In this representation, people are represented by nodes with time-varying properties for their location and behavior. The edges between people represent the interactions and social groups.
- A methodology to interpret the graph and quantify the threat level in every scene based on primary and secondary threat parameters such as individual behavior, proximity, and group dynamics extracted from the graph representation.
2. Proposed Solution
- People detection () and tracking ().
- Distance estimation () and group identification ().
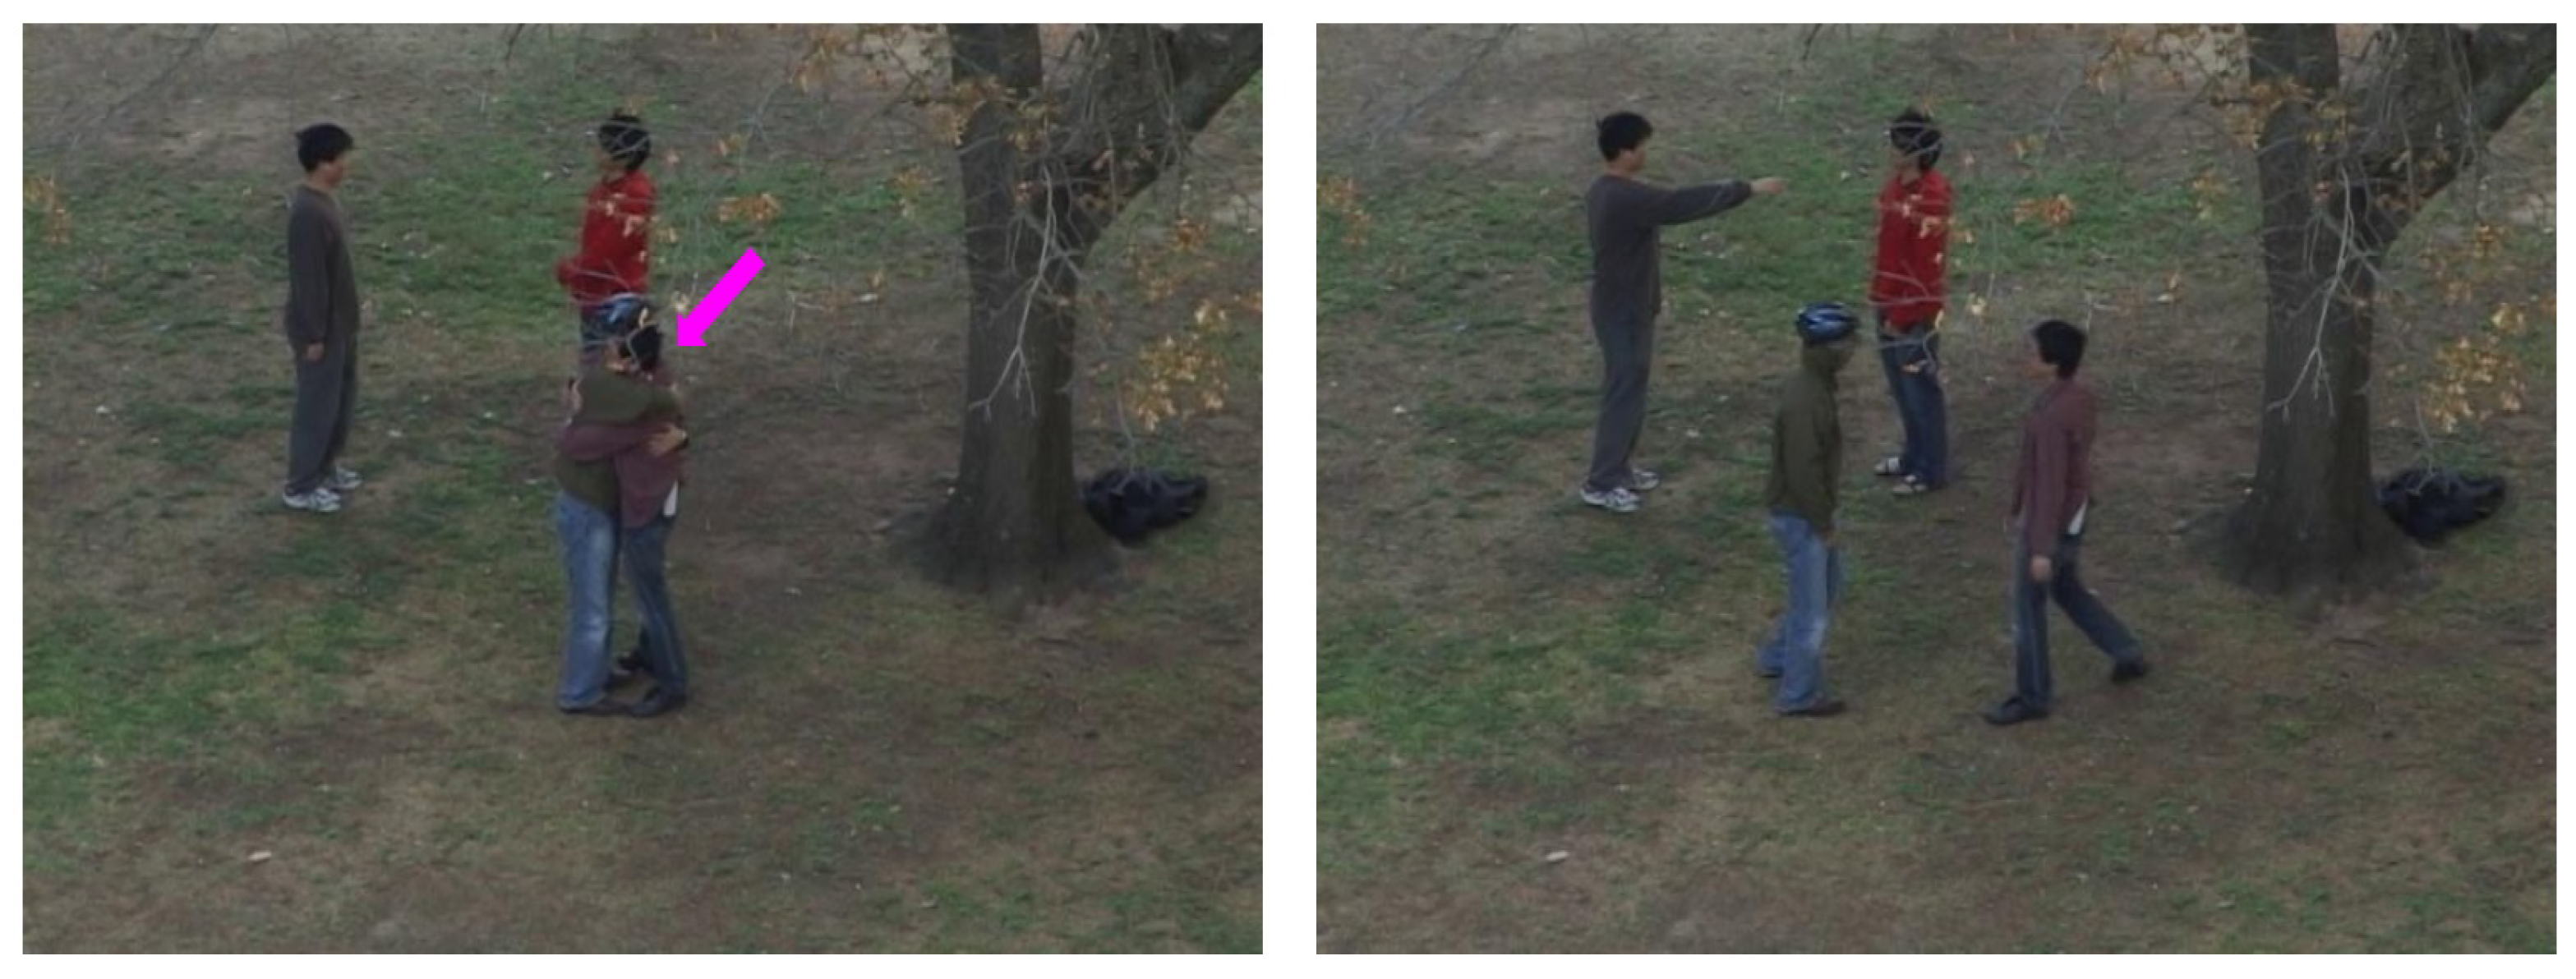
- Identifying and localizing physical interaction (handshakes) ().
- Mask detection ().
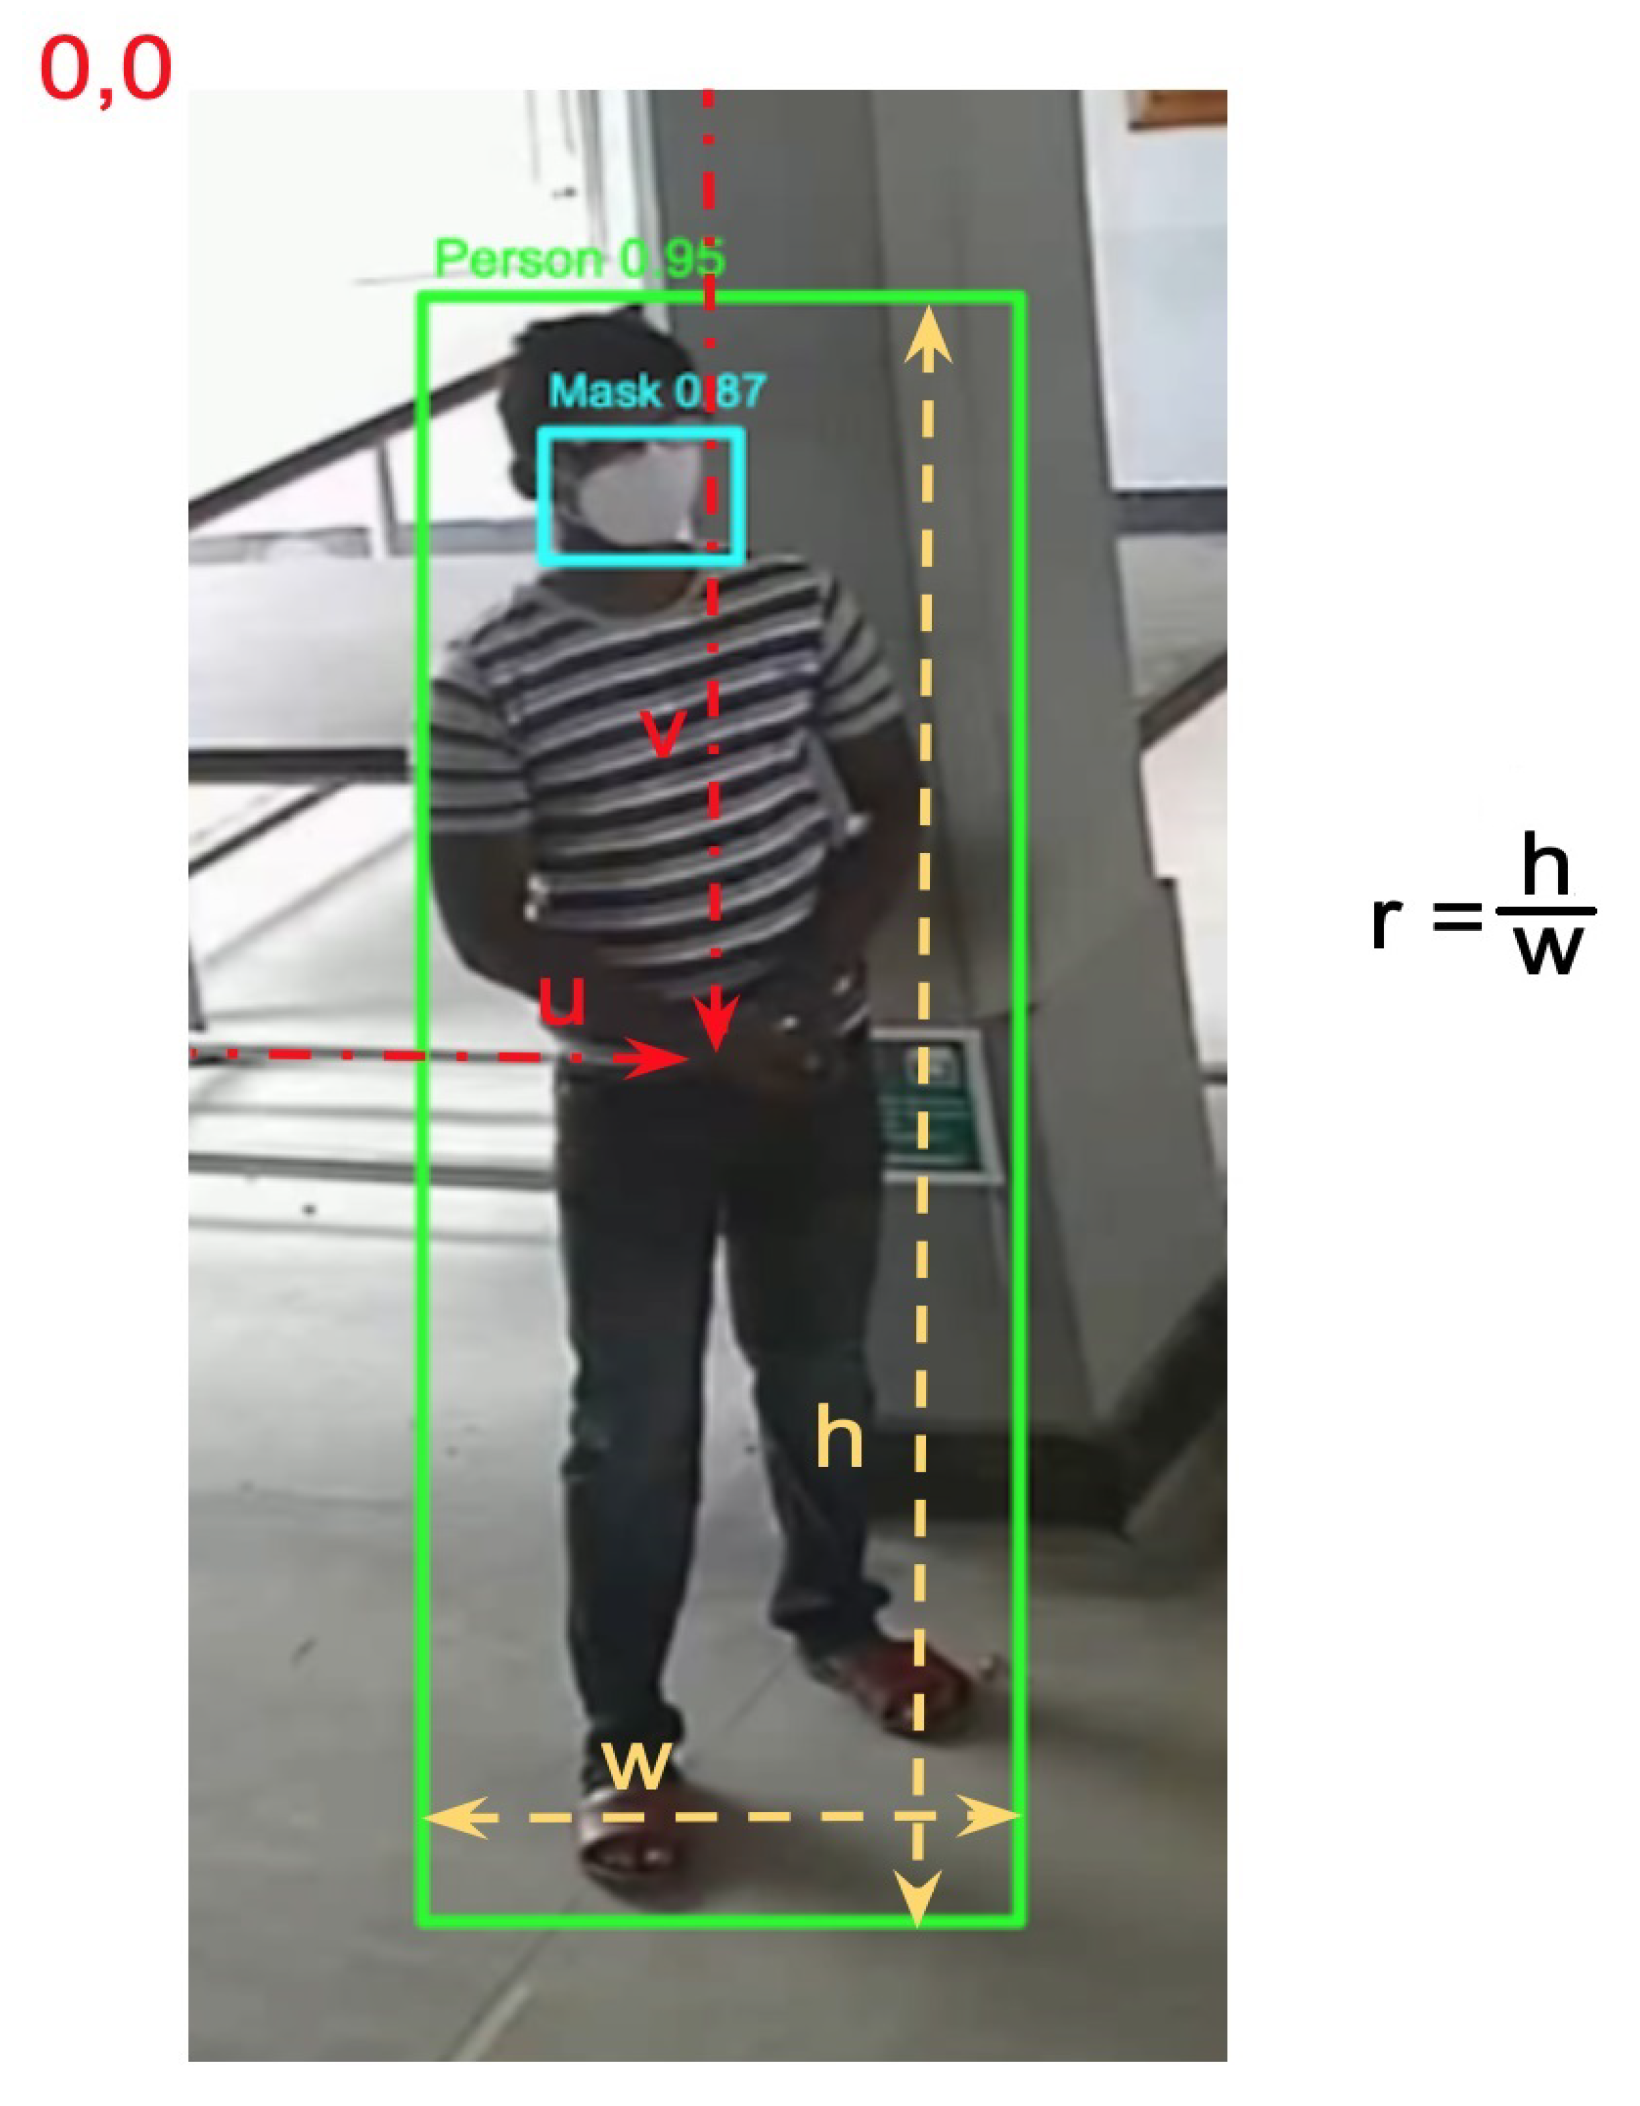
2.1. People Detection and Tracking
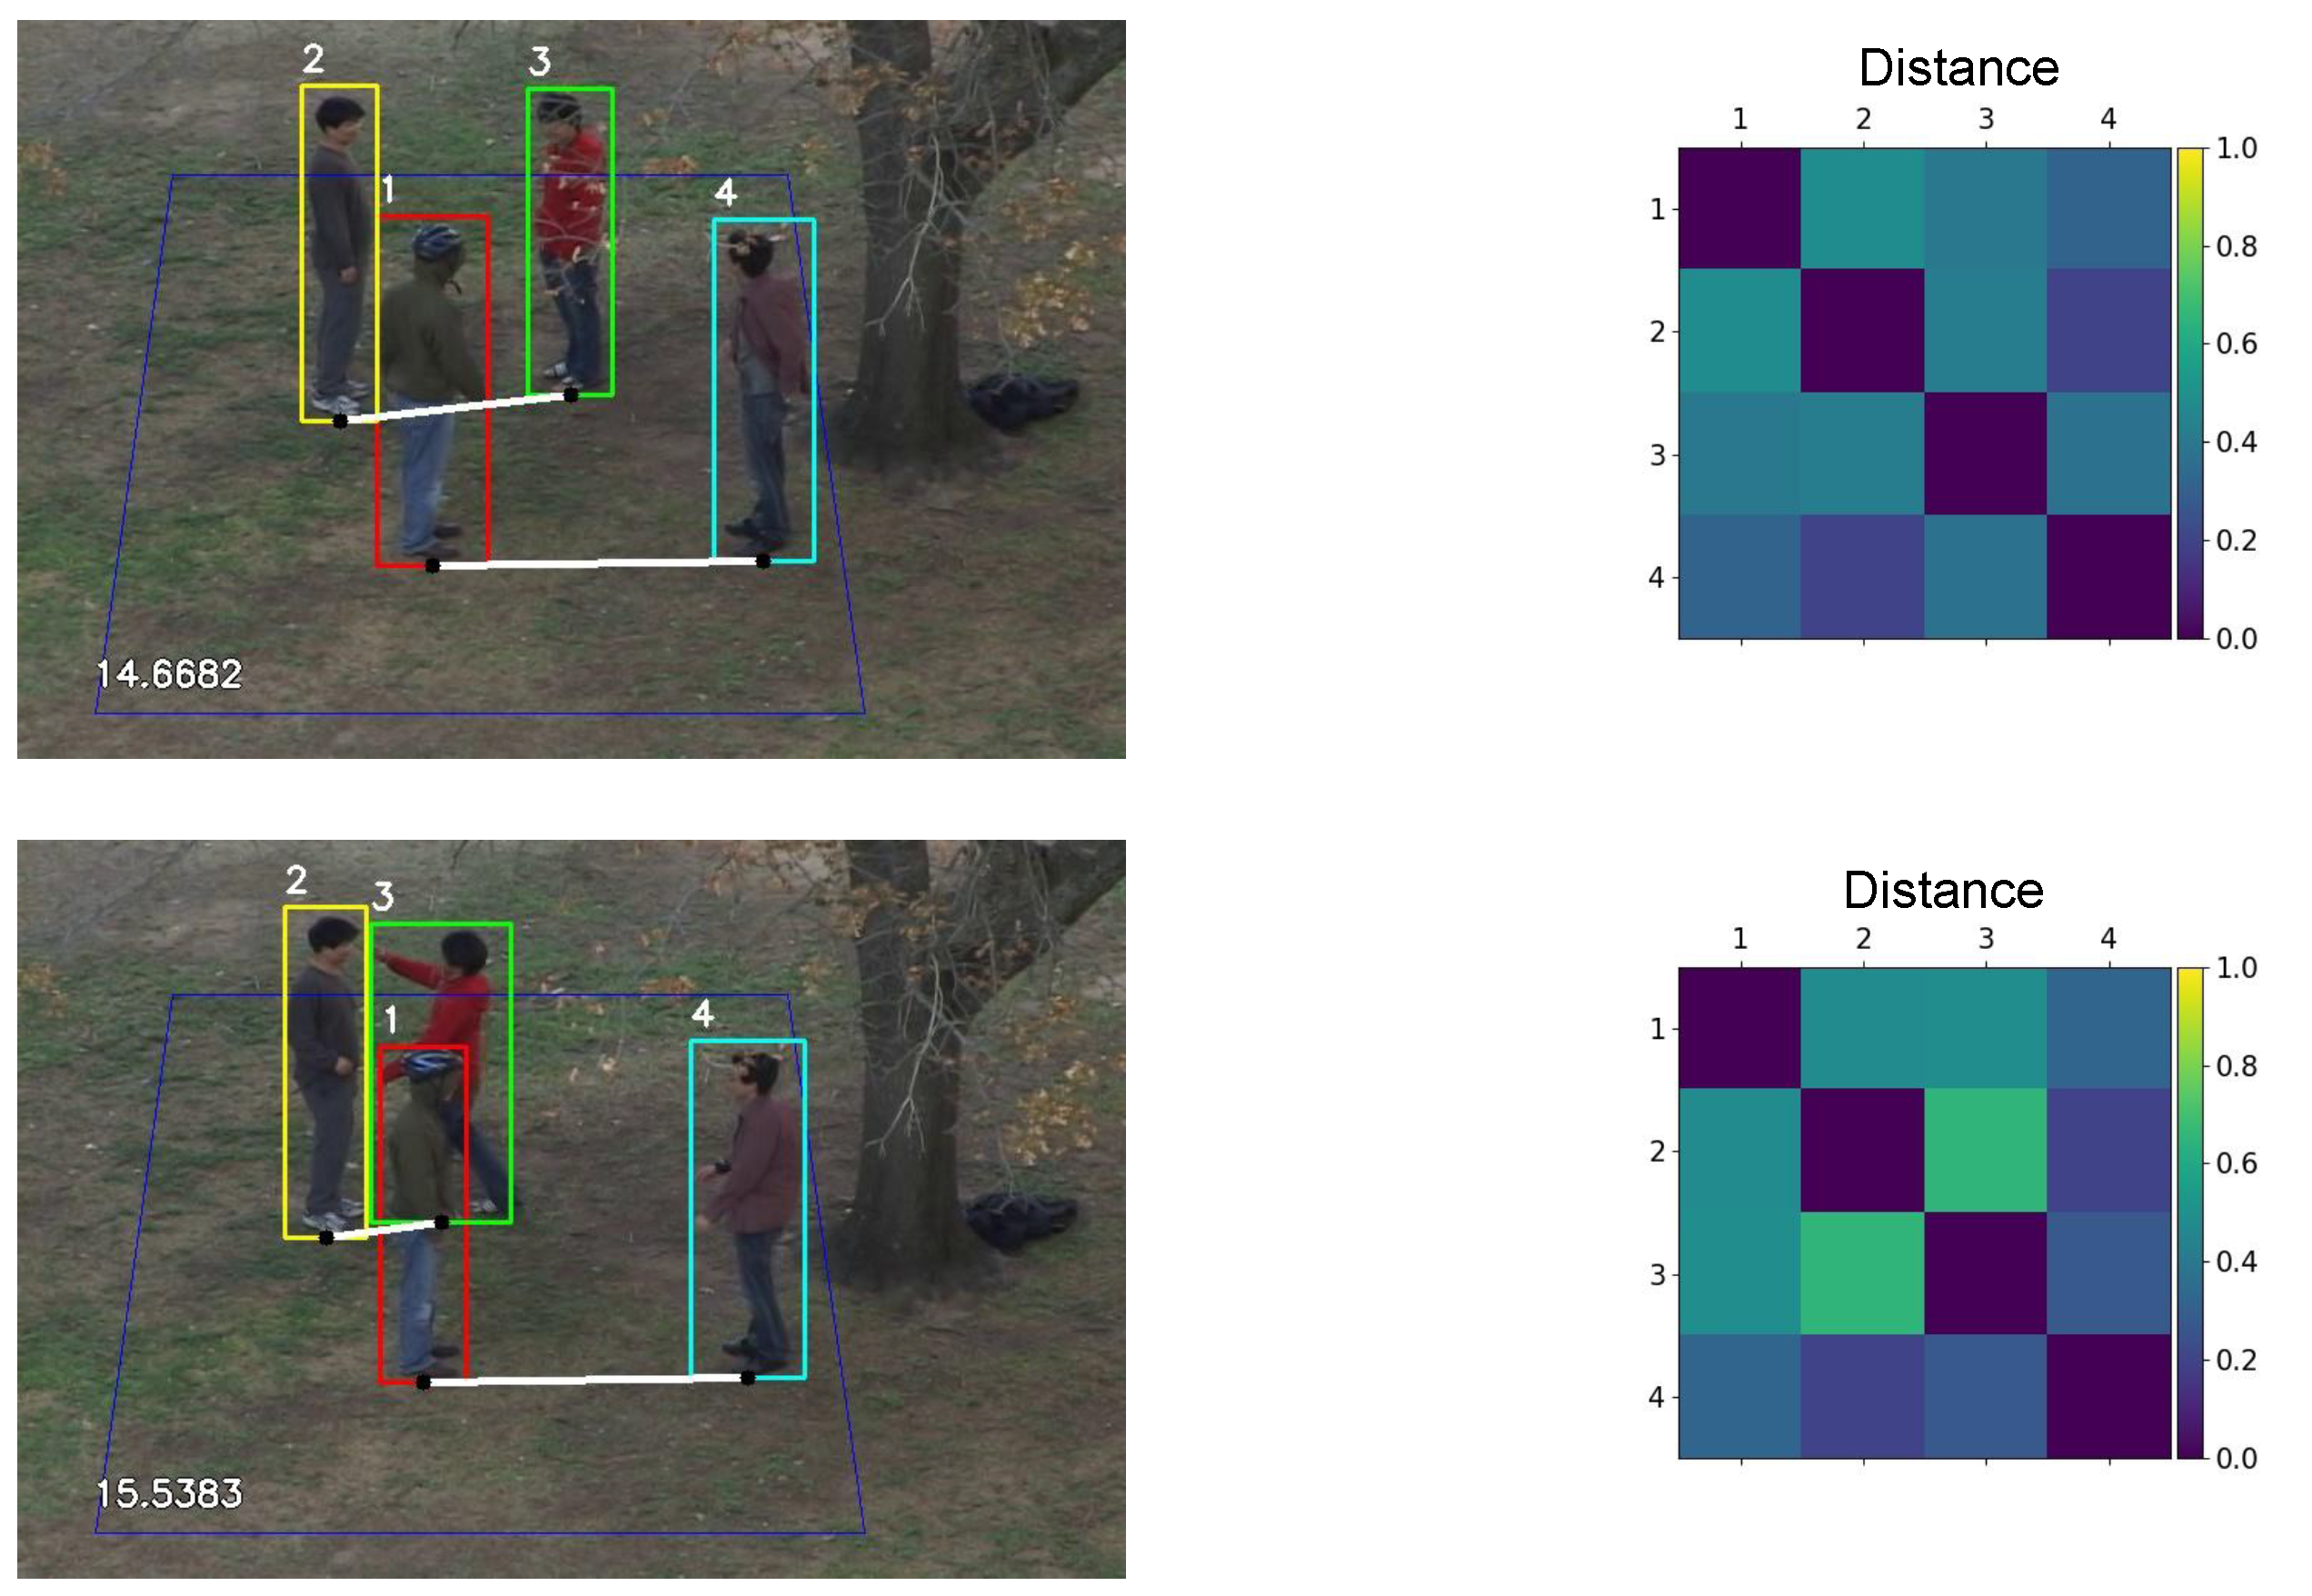
2.2. Distance Estimation
- All the people are on the same plane.
- The camera is not a fisheye-like camera.
- The camera is placed at an overhead level.
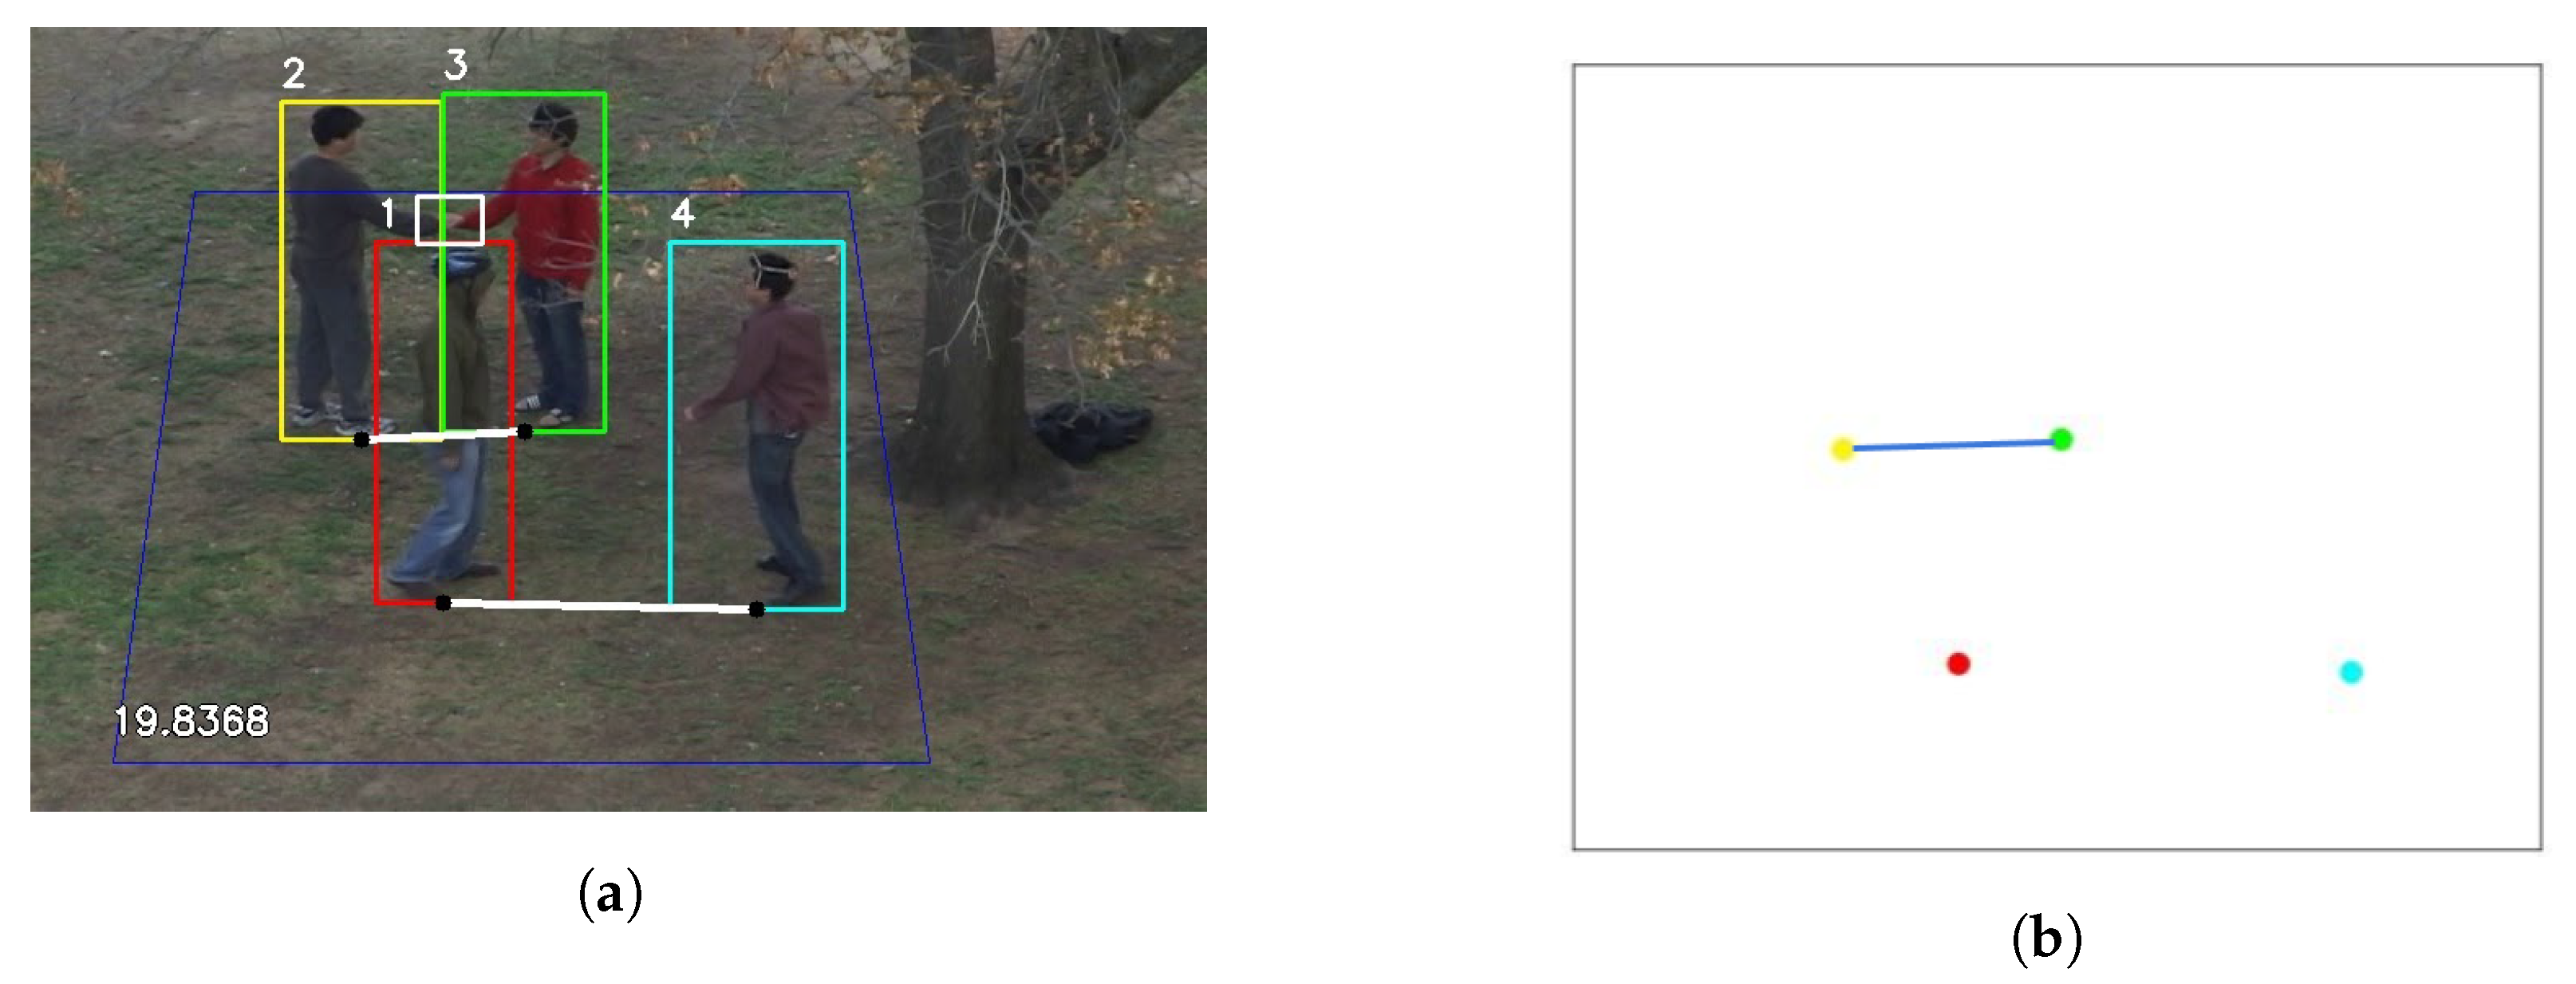
2.3. Group Identification
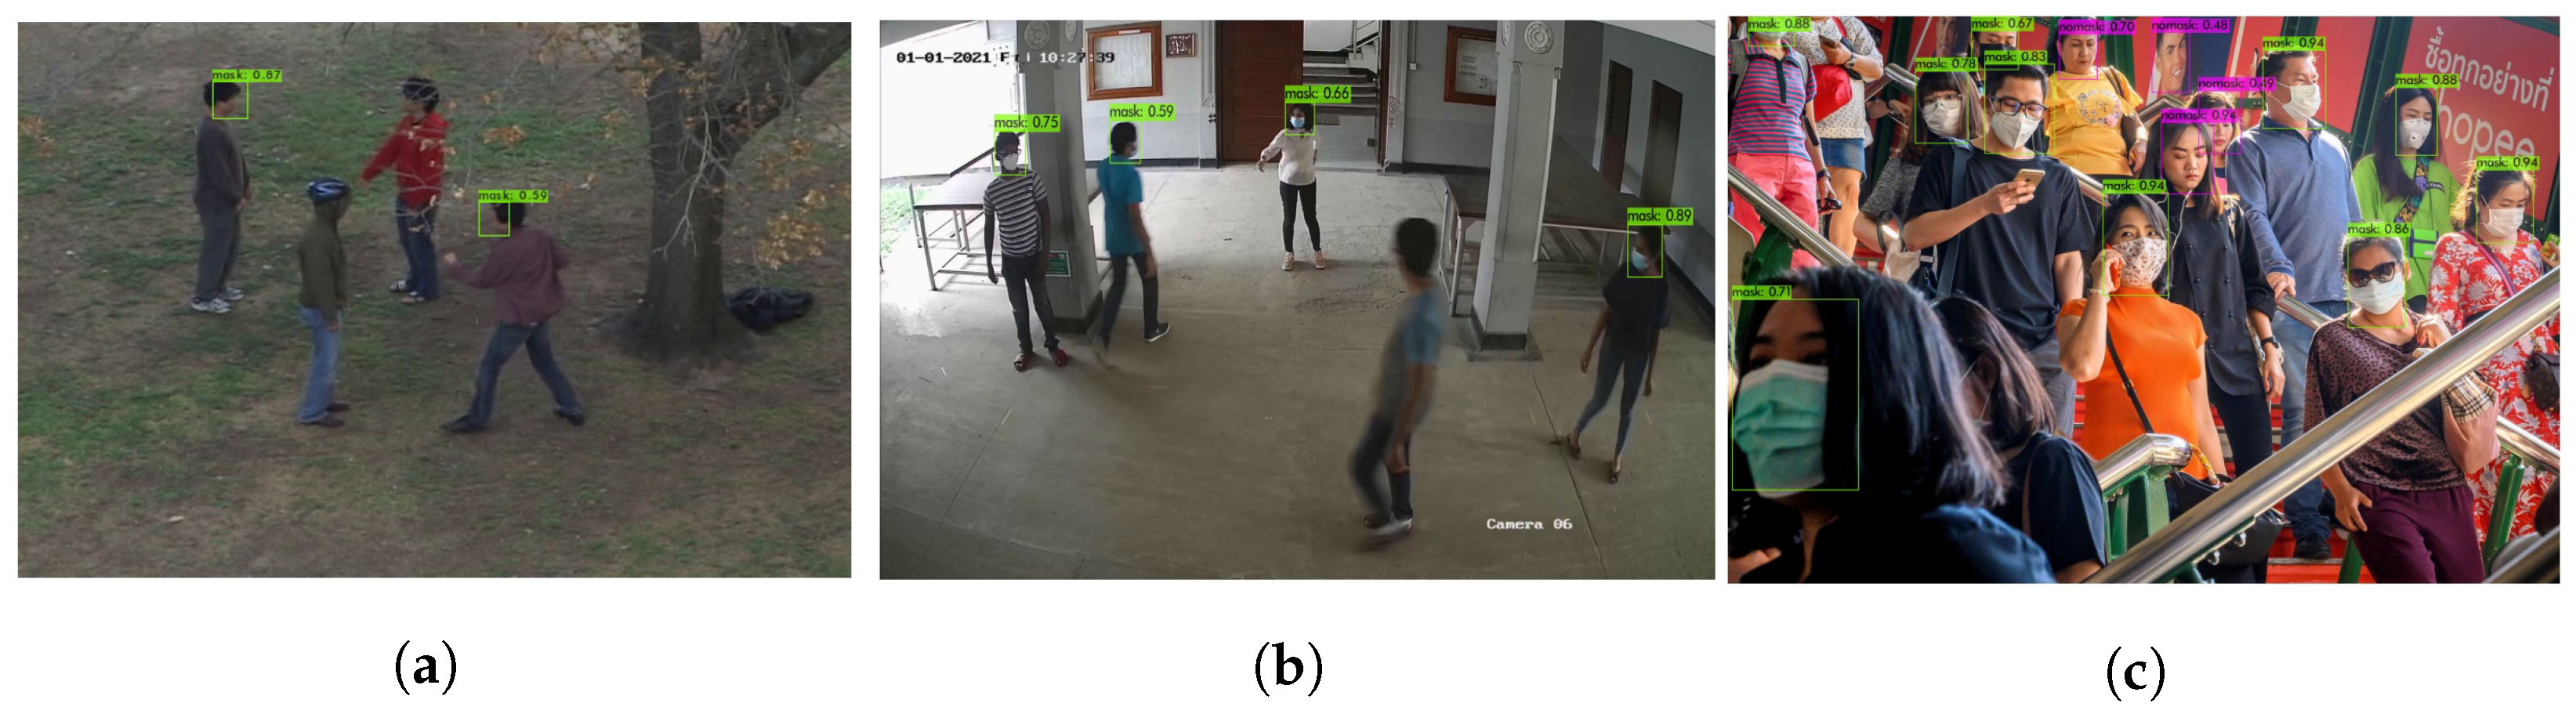
2.4. Mask Detection
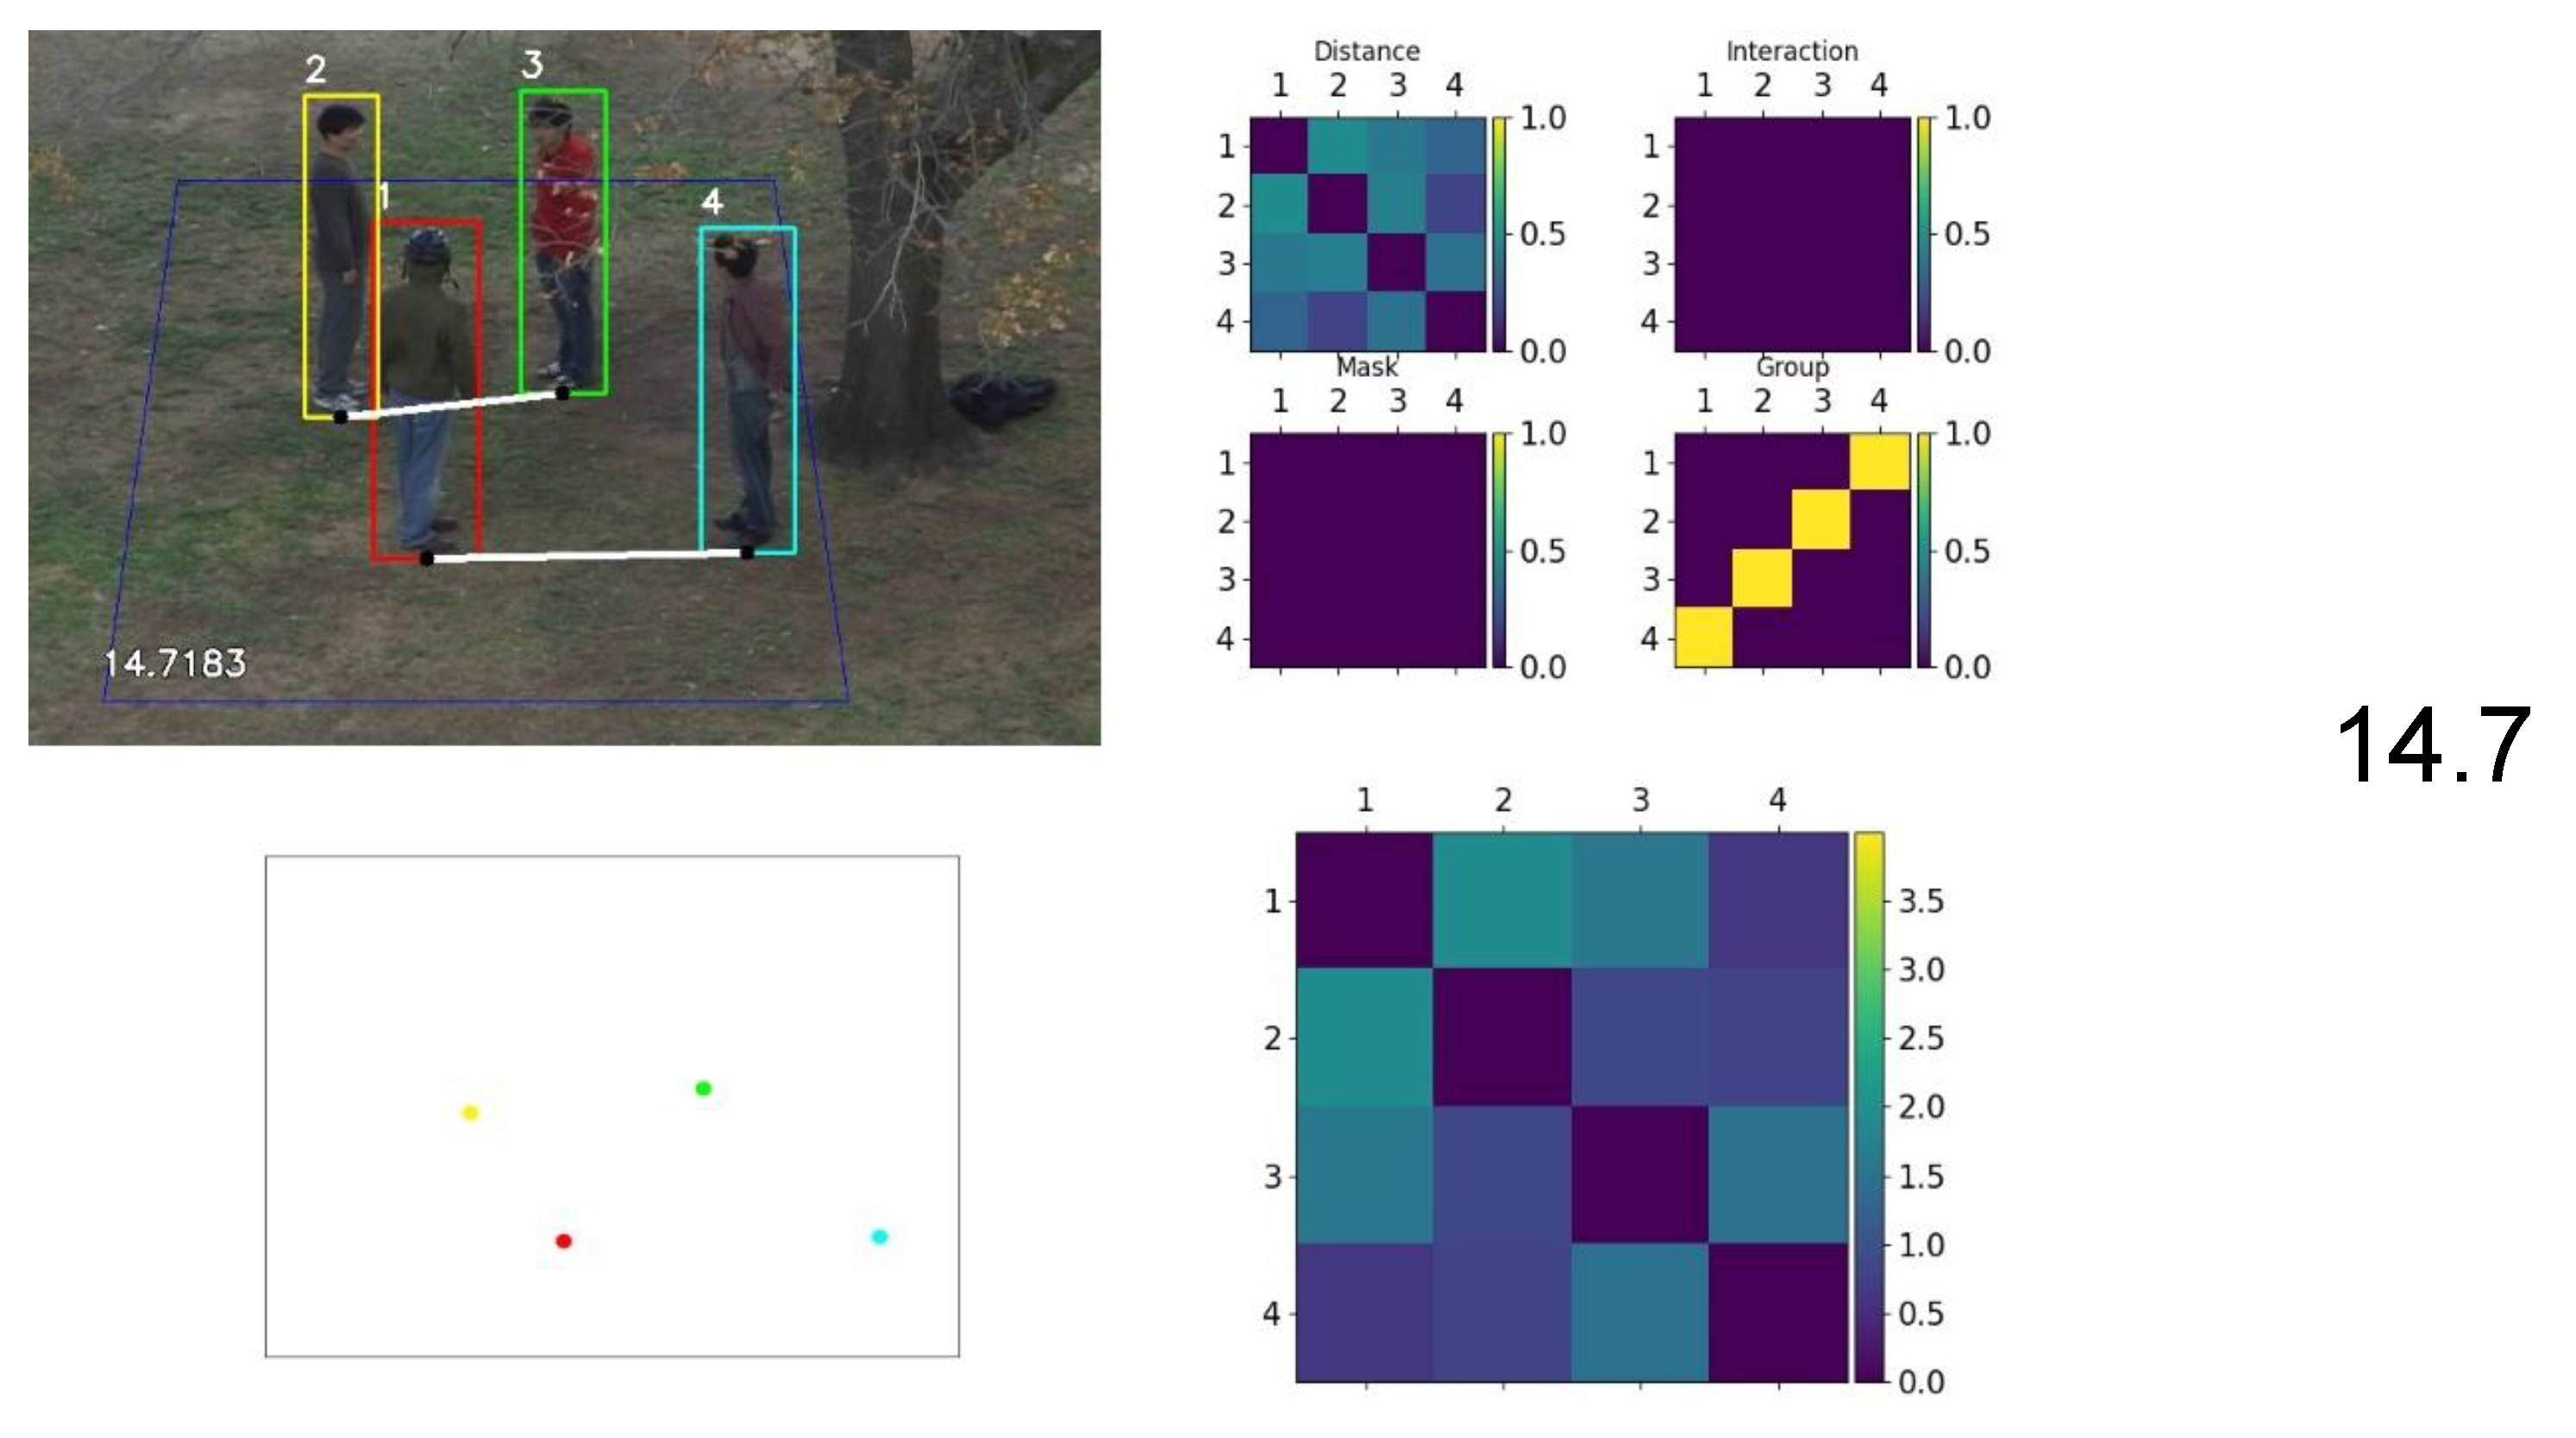
2.5. Graph Representation
2.6. Threat Quantification
3. Evaluation
3.1. Datasets
3.2. Evaluation Metrics
3.3. Model Evaluation
3.3.1. People Detection
3.3.2. Group Identification
3.3.3. Mask Detection
3.3.4. Threat Level Assessment (End-to-End System)
4. Results and Discussion
4.1. People Detection and Tracking
4.2. Distance Estimation
4.3. Group Identification
4.4. Mask Detection
4.5. Threat Level Assessment (End-to-End System)
4.6. Full System Evaluation
5. Conclusions
Author Contributions
Funding
Institutional Review Board Statement
Informed Consent Statement
Data Availability Statement
Acknowledgments
Conflicts of Interest
Abbreviations
| Notation | Definition |
| Input video feed | |
| , | People detection and tracking |
| Distance estimation | |
| , | Group identification and tracking |
| Identifying and localizing physical interaction (handshakes) | |
| , | Mask detection and tracking |
| Output of model | |
| State information | |
| , | Bounding box encompassing person k at time t and bounding box encompassing person k at time t which is being tracked with their unique index |
| , | Bounding box encompassing handshake interaction k at time t and bounding box encompassing handshake interaction k at time t which is being tracked with their unique index. |
| , | Bounding box encompassing the face of person k at time t and bounding box encompassing face of person k at time t which is being tracked with their unique index |
| The 2D coordinates of the center of the bounding box | |
| The height and aspect ratio of the bounding box | |
| The coordinates of the reference points in the video frame and two-dimensional floor plane, respectively | |
| Transformation matrix for the perspective transform from CCTV perspective to floor plane | |
| Standing location of person i at time t in the CCTV perspective | |
| Standing location of person i at time t in the floor plane | |
| Distance between a pair of people i and j at time t | |
| Person i in the frame | |
| Graph at time t | |
| Vertices of graph G at time t given by , each vertex corresponding to person with the vertex parameters embedded | |
| Edges of graph G at time t given by , where is the edge between person(vertex) i and j | |
| Threat level of frame at time t | |
| Primary parameters—set of parameters that have a direct attribute to COVID-19 transmission | |
| Secondary parameters—set of parameters that are relevant to COVID-19 transmission when two individuals are in close proximity | |
| Tuneable parameter dictating influence of parameter on overall threat level. |
References
- Zhao, D.; Yao, F.; Wang, L.; Zheng, L.; Gao, Y.; Ye, J.; Guo, F.; Zhao, H.; Gao, R. A comparative study on the clinical features of coronavirus 2019 (COVID-19) pneumonia with other pneumonias. Clin. Infect. Dis. 2020, 71, 756–761. [Google Scholar] [CrossRef] [PubMed] [Green Version]
- Long, B.; Brady, W.J.; Koyfman, A.; Gottlieb, M. Cardiovascular complications in COVID-19. Am. J. Emerg. Med. 2020, 38, 1504–1507. [Google Scholar] [CrossRef] [PubMed]
- Ellul, M.A.; Benjamin, L.; Singh, B.; Lant, S.; Michael, B.D.; Easton, A.; Kneen, R.; Defres, S.; Sejvar, J.; Solomon, T. Neurological associations of COVID-19. Lancet Neurol. 2020, 19, 767–783. [Google Scholar] [CrossRef]
- Lopez Bernal, J.; Andrews, N.; Gower, C.; Gallagher, E.; Simmons, R.; Thelwall, S.; Stowe, J.; Tessier, E.; Groves, N.; Dabrera, G.; et al. Effectiveness of Covid-19 Vaccines against the B.1.617.2 (Delta) Variant. N. Engl. J. Med. 2021, 385, 585–594. [Google Scholar] [CrossRef] [PubMed]
- McCallum, M.; Bassi, J.; De Marco, A.; Chen, A.; Walls, A.C.; Di Iulio, J.; Tortorici, M.A.; Navarro, M.J.; Silacci-Fregni, C.; Saliba, C.; et al. SARS-CoV-2 immune evasion by variant B. 1.427/B. 1.429. Science 2021, 373, 648–654. [Google Scholar] [CrossRef]
- Olliaro, P.; Torreele, E.; Vaillant, M. COVID-19 vaccine efficacy and effectiveness—The elephant (not) in the room. Lancet Microbe 2021, 2, 279–2809. [Google Scholar] [CrossRef]
- Pormohammad, A.; Zarei, M.; Ghorbani, S.; Mohammadi, M.; Razizadeh, M.H.; Turner, D.L.; Turner, R.J. Efficacy and Safety of COVID-19 Vaccines: A Systematic Review and Meta-Analysis of Randomized Clinical Trials. Vaccines 2021, 9, 467. [Google Scholar] [CrossRef]
- Abdullahi, L.; Onyango, J.J.; Mukiira, C.; Wamicwe, J.; Githiomi, R.; Kariuki, D.; Mugambi, C.; Wanjohi, P.; Githuka, G.; Nzioka, C.; et al. Community interventions in Low—And Middle-Income Countries to inform COVID-19 control implementation decisions in Kenya: A rapid systematic review. PLoS ONE 2020, 15, e0242403. [Google Scholar] [CrossRef]
- Mukerjee, S.; Chow, C.M.; Li, M. Mitigation strategies and compliance in the COVID-19 fight; how much compliance is enough? PLoS ONE 2021, 16, e0239352. [Google Scholar] [CrossRef]
- Kashem, S.B.; Baker, D.M.; González, S.R.; Lee, C.A. Exploring the nexus between social vulnerability, built environment, and the prevalence of COVID-19: A case study of Chicago. Sustain. Cities Soc. 2021, 75, 103261. [Google Scholar] [CrossRef]
- Ugail, H.; Aggarwal, R.; Iglesias, A.; Howard, N.; Campuzano, A.; Suárez, P.; Maqsood, M.; Aadil, F.; Mehmood, I.; Gleghorn, S.; et al. Social distancing enhanced automated optimal design of physical spaces in the wake of the COVID-19 pandemic. Sustain. Cities Soc. 2021, 68, 102791. [Google Scholar] [CrossRef] [PubMed]
- Ren, C.; Xi, C.; Wang, J.; Feng, Z.; Nasiri, F.; Cao, S.J.; Haghighat, F. Mitigating COVID-19 infection disease transmission in indoor environment using physical barriers. Sustain. Cities Soc. 2021, 74, 103175. [Google Scholar] [CrossRef] [PubMed]
- Srivastava, S.; Zhao, X.; Manay, A.; Chen, Q. Effective ventilation and air disinfection system for reducing Coronavirus Disease 2019 (COVID-19) infection risk in office buildings. Sustain. Cities Soc. 2021, 75, 103408. [Google Scholar] [CrossRef] [PubMed]
- Grekousis, G.; Liu, Y. Digital contact tracing, community uptake, and proximity awareness technology to fight COVID-19: A systematic review. Sustain. Cities Soc. 2021, 71, 102995. [Google Scholar] [CrossRef]
- Bian, S.; Zhou, B.; Bello, H.; Lukowicz, P. A wearable magnetic field based proximity sensing system for monitoring COVID-19 social distancing. In Proceedings of the 2020 International Symposium on Wearable Computers, Virtual Event, 12–17 September 2020; pp. 22–26. [Google Scholar]
- Fazio, M.; Buzachis, A.; Galletta, A.; Celesti, A.; Villari, M. A proximity-based indoor navigation system tackling the COVID-19 social distancing measures. In Proceedings of the IEEE Symposium on Computers and Communications, Rennes, France, 7–10 July 2020. [Google Scholar] [CrossRef]
- Shafiee, M.J.; Chywl, B.; Li, F.; Wong, A. Fast YOLO: A fast you only look once system for real-time embedded object detection in video. arXiv 2017, arXiv:1709.05943. [Google Scholar] [CrossRef]
- Wojke, N.; Bewley, A.; Paulus, D. Simple online and realtime tracking with a deep association metric. In Proceedings of the 2017 IEEE International Conference on Image Processing (ICIP), Beijing, China, 17–20 September 2017; pp. 3645–3649. [Google Scholar] [CrossRef] [Green Version]
- Chen, R.C. Automatic License Plate Recognition via sliding-window darknet-YOLO deep learning. Image Vis. Comput. 2019, 87, 47–56. [Google Scholar]
- Ye, X.Y.; Hong, D.S.; Chen, H.H.; Hsiao, P.Y.; Fu, L.C. A two-stage real-time YOLOv2-based road marking detector with lightweight spatial transformation-invariant classification. Image Vis. Comput. 2020, 102, 103978. [Google Scholar] [CrossRef]
- Chiang, S.H.; Wang, T.; Chen, Y.F. Efficient pedestrian detection in top-view fisheye images using compositions of perspective view patches. Image Vis. Comput. 2021, 105, 104069. [Google Scholar] [CrossRef]
- Wu, D.; Lv, S.; Jiang, M.; Song, H. Using channel pruning-based YOLO v4 deep learning algorithm for the real-time and accurate detection of apple flowers in natural environments. Comput. Electron. Agric. 2020, 178, 105742. [Google Scholar] [CrossRef]
- Ansari, M.A.; Singh, D.K. Monitoring social distancing through human detection for preventing/reducing COVID spread. Int. J. Inf. Technol. 2021, 13, 1255–1264. [Google Scholar] [CrossRef]
- Ahmed, I.; Ahmad, M.; Jeon, G. Social distance monitoring framework using deep learning architecture to control infection transmission of COVID-19 pandemic. Sustain. Cities Soc. 2021, 69, 102777. [Google Scholar] [CrossRef] [PubMed]
- Ahmed, I.; Ahmad, M.; Rodrigues, J.J.; Jeon, G.; Din, S. A deep learning-based social distance monitoring framework for COVID-19. Sustain. Cities Soc. 2021, 65, 102571. [Google Scholar] [CrossRef] [PubMed]
- Qin, J.; Xu, N. Reaserch and implementation of social distancing monitoring technology based on SSD. Procedia Comput. Sci. 2021, 183, 768–775. [Google Scholar] [CrossRef]
- Rahim, A.; Maqbool, A.; Rana, T. Monitoring social distancing under various low light conditions with deep learning and a single motionless time of flight camera. PLoS ONE 2021, 16, e0247440. [Google Scholar] [CrossRef]
- Su, J.; He, X.; Qing, L.; Niu, T.; Cheng, Y.; Peng, Y. A novel social distancing analysis in urban public space: A new online spatio-temporal trajectory approach. Sustain. Cities Soc. 2021, 68, 102765. [Google Scholar] [CrossRef]
- Rezaei, M.; Azarmi, M. Deepsocial: Social distancing monitoring and infection risk assessment in covid-19 pandemic. Appl. Sci. 2020, 10, 7514. [Google Scholar] [CrossRef]
- Yang, D.; Yurtsever, E.; Renganathan, V.; Redmill, K.A.; Özgüner, Ü. A vision-based social distancing and critical density detection system for COVID-19. Sensors 2021, 21, 4608. [Google Scholar] [CrossRef]
- Punn, N.S.; Sonbhadra, S.K.; Agarwal, S. Monitoring COVID-19 social distancing with person detection and tracking via fine-tuned YOLO v3 and Deepsort techniques. arXiv 2020, arXiv:2005.01385. [Google Scholar]
- Eikenberry, S.E.; Mancuso, M.; Iboi, E.; Phan, T.; Eikenberry, K.; Kuang, Y.; Kostelich, E.; Gumel, A.B. To mask or not to mask: Modeling the potential for face mask use by the general public to curtail the COVID-19 pandemic. Infect. Dis. Model. 2020, 5, 293–308. [Google Scholar] [CrossRef]
- Kampf, G. Potential role of inanimate surfaces for the spread of coronaviruses and their inactivation with disinfectant agents. Infect. Prev. Pract. 2020, 2, 100044. [Google Scholar] [CrossRef]
- Warnes, S.L.; Little, Z.R.; Keevil, C.W. Human coronavirus 229E remains infectious on common touch surface materials. MBio 2015, 6, e01697-15. [Google Scholar] [CrossRef] [PubMed] [Green Version]
- Roy, B.; Nandy, S.; Ghosh, D.; Dutta, D.; Biswas, P.; Das, T. Moxa: A deep learning based unmanned approach for real-time monitoring of people wearing medical masks. Trans. Indian Natl. Acad. Eng. 2020, 5, 509–518. [Google Scholar] [CrossRef]
- Mohan, P.; Paul, A.J.; Chirania, A. A tiny CNN architecture for medical face mask detection for resource-constrained endpoints. In Innovations in Electrical and Electronic Engineering; Springer: Berlin/Heidelberg, Germany, 2021; pp. 657–670. [Google Scholar]
- Loey, M.; Manogaran, G.; Taha, M.H.N.; Khalifa, N.E.M. Fighting against COVID-19: A novel deep learning model based on YOLO-v2 with ResNet-50 for medical face mask detection. Sustain. Cities Soc. 2021, 65, 102600. [Google Scholar] [CrossRef]
- Wu, P.; Li, H.; Zeng, N.; Li, F. FMD-Yolo: An efficient face mask detection method for COVID-19 prevention and control in public. Image Vis. Comput. 2022, 117, 104341. [Google Scholar] [CrossRef]
- Hassan, A.; Sritharan, S.; Jayatilaka, G.; Godaliyadda, R.I.; Ekanayake, P.B.; Herath, V.; Ekanayake, J.B. Hands Off: A Handshake Interaction Detection and Localization Model for COVID-19 Threat Control. arXiv 2021, arXiv:2110.09571. [Google Scholar]
- Shinde, S.; Kothari, A.; Gupta, V. YOLO based human action recognition and localization. Procedia Comput. Sci. 2018, 133, 831–838. [Google Scholar] [CrossRef]
- Sefidgar, Y.S.; Vahdat, A.; Se, S.; Mori, G. Discriminative key-component models for interaction detection and recognition. Comput. Vis. Image Underst. 2015, 135, 16–30. [Google Scholar] [CrossRef]
- Van Gemeren, C.; Poppe, R.; Veltkamp, R.C. Hands-on: Deformable pose and motion models for spatiotemporal localization of fine-grained dyadic interactions. EURASIP J. Image Video Process. 2018, 2018, 16. [Google Scholar] [CrossRef] [Green Version]
- Jones, N.R.; Qureshi, Z.U.; Temple, R.J.; Larwood, J.P.; Greenhalgh, T.; Bourouiba, L. Two metres or one: What is the evidence for physical distancing in COVID-19? BMJ 2020, 370, m3223. [Google Scholar] [CrossRef]
- Kwon, S.; Joshi, A.D.; Lo, C.H.; Drew, D.A.; Nguyen, L.H.; Guo, C.G.; Ma, W.; Mehta, R.S.; Shebl, F.M.; Warner, E.T.; et al. Association of social distancing and face mask use with risk of COVID-19. Nat. Commun. 2021, 12, 3737. [Google Scholar] [CrossRef]
- Durkin, J.; Jackson, D.; Usher, K. Touch in times of COVID-19: Touch hunger hurts. J. Clin. Nurs. 2021, 30, e4–e5. [Google Scholar] [CrossRef] [PubMed]
- Qian, M.; Jiang, J. COVID-19 and social distancing. J. Public Health 2020, 30, 259–261. [Google Scholar] [CrossRef] [PubMed]
- Verani, A.; Clodfelter, C.; Menon, A.N.; Chevinsky, J.; Victory, K.; Hakim, A. Social distancing policies in 22 African countries during the COVID-19 pandemic: A desk review. Pan Afr. Med J. 2020, 37, 46. [Google Scholar] [CrossRef] [PubMed]
- Bochkovskiy, A.; Wang, C.Y.; Liao, H.Y.M. YOLOv4: Optimal Speed and Accuracy of Object Detection. arXiv 2020, arXiv:2004.10934. [Google Scholar]
- Canny, J. A computational approach to edge detection. IEEE Trans. Pattern Anal. Mach. Intell. 1986, PAMI-8, 679–698. [Google Scholar] [CrossRef]
- Lin, T.Y.; Maire, M.; Belongie, S.; Hays, J.; Perona, P.; Ramanan, D.; Dollár, P.; Zitnick, C.L. Microsoft coco: Common objects in context. In Proceedings of the European Conference on Computer Vision; Springer: Berlin/Heidelberg, Germany, 2014; pp. 740–755. [Google Scholar]
- Dendorfer, P.; Rezatofighi, H.; Milan, A.; Shi, J.; Cremers, D.; Reid, I.; Roth, S.; Schindler, K.; Leal-Taixé, L. Mot20: A benchmark for multi object tracking in crowded scenes. arXiv 2020, arXiv:2003.09003. [Google Scholar]
- Jiang, Y.; Gao, F.; Xu, G. Computer vision-based multiple-lane detection on straight road and in a curve. In Proceedings of the 2010 International Conference on Image Analysis and Signal Processing, Xiamen, China, 9–11 April 2010; pp. 114–117. [Google Scholar]
- Von Luxburg, U. A tutorial on spectral clustering. Stat. Comput. 2007, 17, 395–416. [Google Scholar] [CrossRef]
- Milan, A.; Leal-Taixé, L.; Reid, I.; Roth, S.; Schindler, K. MOT16: A benchmark for multi-object tracking. arXiv 2016, arXiv:1603.00831. [Google Scholar]
- Leal-Taixé, L.; Milan, A.; Reid, I.; Roth, S.; Schindler, K. Motchallenge 2015: Towards a benchmark for multi-target tracking. arXiv 2015, arXiv:1504.01942. [Google Scholar]
- Ryoo, M.S.; Aggarwal, J.K. UT-Interaction Dataset, ICPR contest on Semantic Description of Human Activities (SDHA). 2010. Available online: http://cvrc.ece.utexas.edu/SDHA2010/Human_Interaction.html (accessed on 14 August 2022).
- Ryoo, M.S.; Aggarwal, J.K. Spatio-Temporal Relationship Match: Video Structure Comparison for Recognition of Complex Human Activities. In Proceedings of the IEEE International Conference on Computer Vision (ICCV), Kyoto, Japan, 29 September–2 October 2009. [Google Scholar]
- Everingham, M.; Van Gool, L.; Williams, C.K.; Winn, J.; Zisserman, A. The pascal visual object classes (voc) challenge. Int. J. Comput. Vis. 2010, 88, 303–338. [Google Scholar] [CrossRef] [Green Version]
- Kuznetsova, A.; Rom, H.; Alldrin, N.; Uijlings, J.; Krasin, I.; Pont-Tuset, J.; Kamali, S.; Popov, S.; Malloci, M.; Kolesnikov, A.; et al. The open images dataset v4: Unified image classification, object detection, and visual relationship detection at scale. arXiv 2018, arXiv:1811.00982. [Google Scholar] [CrossRef] [Green Version]
- Robertson, S. A new interpretation of average precision. In Proceedings of the 31st Annual International ACM SIGIR Conference on Research and Development in Information Retrieval, Singapore, 20–24 July 2008; pp. 689–690. [Google Scholar]
- Padilla, R.; Netto, S.L.; da Silva, E.A.B. A Survey on Performance Metrics for Object-Detection Algorithms. In Proceedings of the 2020 International Conference on Systems, Signals and Image Processing (IWSSIP), Niteroi, Brazil, 1–3 July 2020; pp. 237–242. [Google Scholar]


| Social Distancing Measure | Specifics | Handled in Our System |
|---|---|---|
| Physical distancing [43] | Singapore (1 m), South Korea (1.4 m) | 🗸 |
| Mask wearing [44] | Practiced in most of the countries | 🗸 |
| Close contacts [45] | Handshakes, hugging, etc. | 🗸 |
| Hygiene practices [44,46] | Washing hands, sanitizing, etc. | |
| Restricted gathering [44,47] | Indoor gatherings | 🗸 |
| Set | Notation | Description |
|---|---|---|
| Distance between people | ||
| Handshake interactions between people | ||
| People belonging to the same group | ||
| People wearing masks |
| Dataset | AP/mAP/% |
|---|---|
| UT-interaction (Unmasked) | 29.30 |
| UOP (Masked) | 41.47 |
| Moxa3K | 81.04 |
| Test | Accuracy | Precision | Recall |
|---|---|---|---|
| UTI dataset | 75% | 75% | 75% |
| UOP dataset | 76% | 85% | 79% |
| Overall | 76% | 81% | 77% |
Publisher’s Note: MDPI stays neutral with regard to jurisdictional claims in published maps and institutional affiliations. |
© 2022 by the authors. Licensee MDPI, Basel, Switzerland. This article is an open access article distributed under the terms and conditions of the Creative Commons Attribution (CC BY) license (https://creativecommons.org/licenses/by/4.0/).
Share and Cite
Jayatilaka, G.; Hassan, J.; Sritharan, S.; Senanayaka, J.B.; Weligampola, H.; Godaliyadda, R.; Ekanayake, P.; Herath, V.; Ekanayake, J.; Dharmaratne, S. Holistic Interpretation of Public Scenes Using Computer Vision and Temporal Graphs to Identify Social Distancing Violations. Appl. Sci. 2022, 12, 8428. https://doi.org/10.3390/app12178428
Jayatilaka G, Hassan J, Sritharan S, Senanayaka JB, Weligampola H, Godaliyadda R, Ekanayake P, Herath V, Ekanayake J, Dharmaratne S. Holistic Interpretation of Public Scenes Using Computer Vision and Temporal Graphs to Identify Social Distancing Violations. Applied Sciences. 2022; 12(17):8428. https://doi.org/10.3390/app12178428
Chicago/Turabian StyleJayatilaka, Gihan, Jameel Hassan, Suren Sritharan, Janith Bandara Senanayaka, Harshana Weligampola, Roshan Godaliyadda, Parakrama Ekanayake, Vijitha Herath, Janaka Ekanayake, and Samath Dharmaratne. 2022. "Holistic Interpretation of Public Scenes Using Computer Vision and Temporal Graphs to Identify Social Distancing Violations" Applied Sciences 12, no. 17: 8428. https://doi.org/10.3390/app12178428
APA StyleJayatilaka, G., Hassan, J., Sritharan, S., Senanayaka, J. B., Weligampola, H., Godaliyadda, R., Ekanayake, P., Herath, V., Ekanayake, J., & Dharmaratne, S. (2022). Holistic Interpretation of Public Scenes Using Computer Vision and Temporal Graphs to Identify Social Distancing Violations. Applied Sciences, 12(17), 8428. https://doi.org/10.3390/app12178428