Article

Anaerobic Digestion in the Presence of Antimicrobials—Characteristics of Its Parameters and the Structure of Methanogens

Department of Water Protection Engineering and Environmental Microbiology, Faculty of Geoengineering, University of Warmia and Mazury in Olsztyn, Prawocheńskiego 1, 10-720 Olsztyn, Poland
*
Author to whom correspondence should be addressed.
Appl. Sci. 2022, 12(17), 8422; https://doi.org/10.3390/app12178422
Submission received: 3 August 2022 / Revised: 19 August 2022 / Accepted: 20 August 2022 / Published: 24 August 2022

Abstract

:
Antibiotics are widely used in human and veterinary medicine, and they are accumulated in various types of waste, including sewage sludge (SS) and cattle slurry (CS), processed by anaerobic digestion (AD). Anaerobic treatment is a method enabling the stabilization of these substrates before transferring to the environment. The presence of contaminants, such as antimicrobials, in organic substrates processed by AD is not regulated by law. The accumulation of antimicrobials in SS and CS is a crucial issue because it may reduce the effectiveness of their stabilization. This study aimed to evaluate the long-term impact of growing concentrations of a mixture of antibiotics on the AD of SS and CS. Methane (CH4) yield, which is the main indicator of the efficiency of AD, was determined. Antibiotic exposure significantly decreased CH4 production only in SS (by 5–8% relative to control; p < 0.05). The copy numbers of the mcrA gene, a functional marker of methanogenesis, were not reliable indicators of CH4 yields in either substrate. During long-term AD, the average concentrations of the mcrA gene were determined at 108 in 1 g of SS digestate and from 108 to 109 in 1 g of CS digestate samples. At the end of long-term AD, methanogens belonging to the family Methanosarcinaceae were more prevalent than methanogens of the family Methanosaetaceae both in SS and CS samples (107 and 108–109 gene copies in 1 g of digestate, respectively).

1. Introduction

Recycling waste is becoming a relevant challenge, combined with an important aspect of the environment. The reuse of organic waste has been supported by the approval of Directive 2018/851/EC of the European Parliament, which regulates waste utilization management by supporting the principles of the circular economy and promoting the minimization of waste production [1,2]. Anaerobic digestion (AD) is a popular method of stabilizing organic matter such as sewage sludge (SS) and cattle slurry (CS), enabling receive mainly biomethane and fertilizers [3,4] which leads to the production of methane (CH4). Methanogens, mostly microorganisms belonging to the families of Methanosaetaceae and Methanosarcinaceae, directly participate in CH4 synthesis [5,6]. Methanosarcinaceae rely on H2, CO2, or acetate to produce CH4, and they easily adapt to changing environmental conditions [7]. In turn, methanogens of the family Methanosaetaceae are resistant to elevated concentrations of acetate [8]. However, the presence of antibiotics and their metabolites can compromise the efficiency of AD [9,10]. Drugs and their transformation products can inhibit AD by altering the structure of microbial communities and decreasing CH4 yields. The mcrA gene encoding methyl-coenzyme M reductase is specific to methanogens, and it can be used as a functional marker to evaluate the efficiency of AD. The efficiency of the analyzed process can also be indirectly determined based on methanogen counts, mostly microorganisms belonging to the families of Methanosarcinaceae and Methanosaetaceae [11,12].
The overuse of antibiotics in human and veterinary medicine, as well as in livestock and crop farming, increases the concentrations of antibiotics and their metabolites in municipal sewage and CS that are discharged to the environment [13]. The stability of these substances in biomass and the environment poses a significant problem. Municipal sewage containing antibiotics is processed in wastewater treatment plants (WWTPs). Pharmaceuticals are accumulated in SS, which becomes a reservoir of antibiotics [14,15]. In turn, excessive antibiotic use in veterinary medicine promotes the spread of antimicrobials in animal wastes such as CS. The medicated premixes are the main source of contamination with antibiotic residues. Antimicrobials are used both in the treatment and prevention of infectious diseases [16]. Substrates, such as SS and CS, which contain antibiotics and their metabolites, are processed by AD and often reused in agronomy [16,17]. Although there are European legal limits for contamination of stabilized organic matter before its disposal in the environment (Directive 86/278/EEC), these do not include antibiotics. The presence of antimicrobial substances in SS and CS before stabilization is also not legally controlled. Importantly, due to the growth of the human population and the intensification of animal production, higher production of SS and CS is predicted [2]. Since the worldwide production of antibiotics is still rising [18], the accumulation of antimicrobials in these substrates may reduce the effectiveness of their stabilization.
Research has demonstrated that raw wastewater often contains amoxicillin, ciprofloxacin, and metronidazole [19], whereas amoxicillin, metronidazole, and enrofloxacin have been detected in CS [20]. These antibiotics are widely used in human and veterinary medicine, but they are not always effectively absorbed in the intestines. As a result, 30–90% of the parent compound may be excreted from the body in the unmodified form [21] and transferred to the environment with SS and CS. The presence of antibiotics in these substrates may affect the efficiency of their anaerobic treatment. Worrying is that the scope and consequences of antibiotic pollution have not yet been fully elucidated, especially concerning substrates particularly liable to the accumulation of antimicrobial substances. Considering the above, we resolved to fill the gap in scientific knowledge concerning the evaluation of the synergistic action of commonly used antibiotics in the anaerobic treatment of two commonly stabilized organic substrates.
This study aimed to evaluate the long-term impact of exposure to growing concentrations of a mixture of antibiotics on the AD of SS and CS. The influence of antibiotics present in SS and CS on CH4 yields was analyzed. The copy numbers of genes specific to methanogens (mcrA) were determined to evaluate their effect on the efficiency of AD. Moreover, the prevalence of families of the order Methanosarcinales, Methanosaetaceae, and Methanosarcinaceae was detected using group-specific methanogenic primers. The study result expands our knowledge about the AD of various substrates and the extent to which antimicrobials contribute to decreasing the effectiveness of this process. Thereby the study provides new information supporting the optimization of anaerobic treatment to obtain the highest possible efficiency at low financial and environmental costs.

2. Materials and Methods

2.1. Substrates and Inoculum

Sewage sludge from the WWTP in Olsztyn (Poland) and CS from a farm in Bałdy (Poland) were the substrates for AD. On the farm, 90% and 10% pose dairy cattle and horses, respectively. In the WWTP, 80% of the incoming sewage is domestic and household sewage and 20% is industrial sewage. The average daily flow in the sewage treatment plant is 60,000 cubic meters per day. Sewage sludge from the WWTP was used as the inoculum in the AD of both SS and CS. Fermentation in the WWTP is carried out by populations of saprophytic and methane bacteria under stable, optimal conditions in the chambers, which include: the temperature within 33–35 °C, pH between 6.8–7.5, load with organic substances 10–25 days, hydration, and intensive agitation of the sediment. The characteristics of substrates were variable during the long-term experiment. The initial characteristics of SS, CS, and the inoculum are presented in Table 1.

2.2. Anaerobic Digestion Process

The AD of SS and CS was conducted in 2 L bioreactors operating under semi-continuous, dynamic conditions. The initial substrate to inoculum ratio was 0.05 (VS basis). The substrates (CS or SS) fed to the process bioreactors (PB) were supplemented with a combination of antimicrobials. Control substrates without antibiotics were fed to the control bioreactors (CB). The experiments were conducted in two replications. Antibiotics were selected based on the results of our previous studies [19,20] investigating the effects of individual doses of different antimicrobials on AD. The cited studies demonstrated that in SS supplemented with only one antibiotic, amoxicillin (AMO), ciprofloxacin (CIP), and metronidazole (MET) exerted the greatest effect on CH4 yields and the structure of microbial communities, whereas, in bioreactors filled with CS, the most potent antimicrobials were AMO, enrofloxacin (ENR) and MET. Therefore, in the present study, PB containing SS were supplemented with a mixture of AMO, CIP, and MET, and those containing CS with a mixture of AMO, ENR, and MET in gradually increasing doses (Table 2). The study was divided into experimental series with different antibiotic concentrations: six series in bioreactors containing SS and seven series in bioreactors containing CS. Antibiotic doses were increased after the digester’s hydraulic volume had doubled. Each experimental series lasted 45 and 59 days on average, and the entire experiment lasted 268 and 417 days for SS and CS, respectively.
The bioreactors were operated at an organic loading rate of 2.8 g vs. L∙d−1. Hydraulic retention time (HRT) was 22 and 28 days for SS and CS, respectively. The digesters were equipped with a mechanical stirrer and a feeding and discharge system, and they were connected to an automatic methane potential test system (AMPTS II) (Bioprocess Control, Lund, Sweden) which measured the amount of the produced CH4. Gas was normalized for standard pressure and temperature (1.01325 bar and 273.2 K). Methane quality was analyzed in a gas chromatograph equipped with a thermal conductivity detector (GC-TCD, Agilent Technologies 7890 A, Irving, TX, USA). The bioreactors were placed in a water bath to simulate mesophilic conditions (37 °C).
The pH of digestate samples, the FOS/TAC ratio (where FOS denotes the content of volatile fatty acids (VFAs), and TAC is the estimated buffer capacity of the sample), and the content of total solids (TS), volatile solids (VS), total nitrogen (TN) and total phosphorus (TP) were determined to monitor the AD process. The content of VFAs and other process parameters were analyzed with the use of a previously described method [22].

2.3. Sampling

In all experimental series, digestate samples were sampled at approximately weekly intervals from both PB and CB containing SS and CS. A total of 68 SS samples and 96 CS samples were collected. The ID numbers assigned to the samples in each experimental series are presented in Table 3.

2.4. Genomic DNA Isolation from Digestate Samples

Digestate samples of 2 g each were transferred to 2 mL Eppendorf centrifuge tubes (Eppendorf, Germany) and were centrifuged for 10 min at 8000 rpm. In the next step, the supernatant was removed from centrifuged digestate samples. Next, DNA was isolated from the pellet in duplicate using the Fast DNA Spin Kit for Soil ® (MP Biomedicals, Irvine, CA, USA) according to the manufacturer’s instructions. The concentration and quality of the extracted genetic material were determined in the Multiskan SkyHigh microplate spectrophotometer (Thermo Scientific™, Waltham, MA, USA). gDNA from digestate samples was stored in a freezer (−20 °C) for qPCR analysis.

2.5. Analysis of Gene Characteristics for Methanogens

The counts and activity of methanogenic microorganisms were determined by Real-Time PCR (qPCR). This method was used to determine the prevalence of two methanogen families of the order Methanosarcinales: Methanosaetaceae and Methanosarcinaceae, both responsible for CH4 production. The group-specific methanogenic primers have been used [23]. A meaningful share of other genera in the domain Archaea, including Methanobacteriales, Methanococcales, and Methanomicrobiales, were eliminated in a preliminary analysis (data not shown). The activity of methanogenic microorganisms was evaluated by estimating the concentration of the gene encoding methyl-coenzyme M reductase (mcrA), which catalyzes methanogenesis, the last step of AD. Standard curves were plotted before gene quantification based on serial dilutions of samples with known copy numbers of the examined genes. Amplicons were cloned from positive controls in vector pCR2.1-TOPO (Invitrogen, Waltham, MA, USA). The abundance of genes characteristic for methanogenic Archaea (mcrA gene, Methanosaetaceae- and Methanosarcinaceae-specific genes) during the AD of SS and CS was determined with the LightCycler® instrument (Roche Diagnostics, Mannheim, Germany) with LightCycler ® software (version 1.5.0). The concentrations were expressed by the copy number in 1 g of digestate (gD−1). All qPCR reactions were performed according to the methodology described in our previous study [20]. Reaction conditions and primer sequences [23,24] are presented in Table S1 in the Supplementary Materials.

2.6. Data Analysis

Data were processed statistically in Statistica 13.1 (Statsoft, Krakow, Poland). Differences in CH4 production, VFA content, and target gene copy numbers were determined by two-way ANOVA. The results were regarded as statistically significant at p < 0.05. The correlations between gene concentration and CH4 production in PB and CB containing SS and CS were visualized in principal component analysis (PCA). The distribution of genes in the analyzed substrates was visualized in charts and heatmaps developed with the use of GraphPad Prism software (GraphPad Software Inc., San Diego, CA, USA).

3. Results

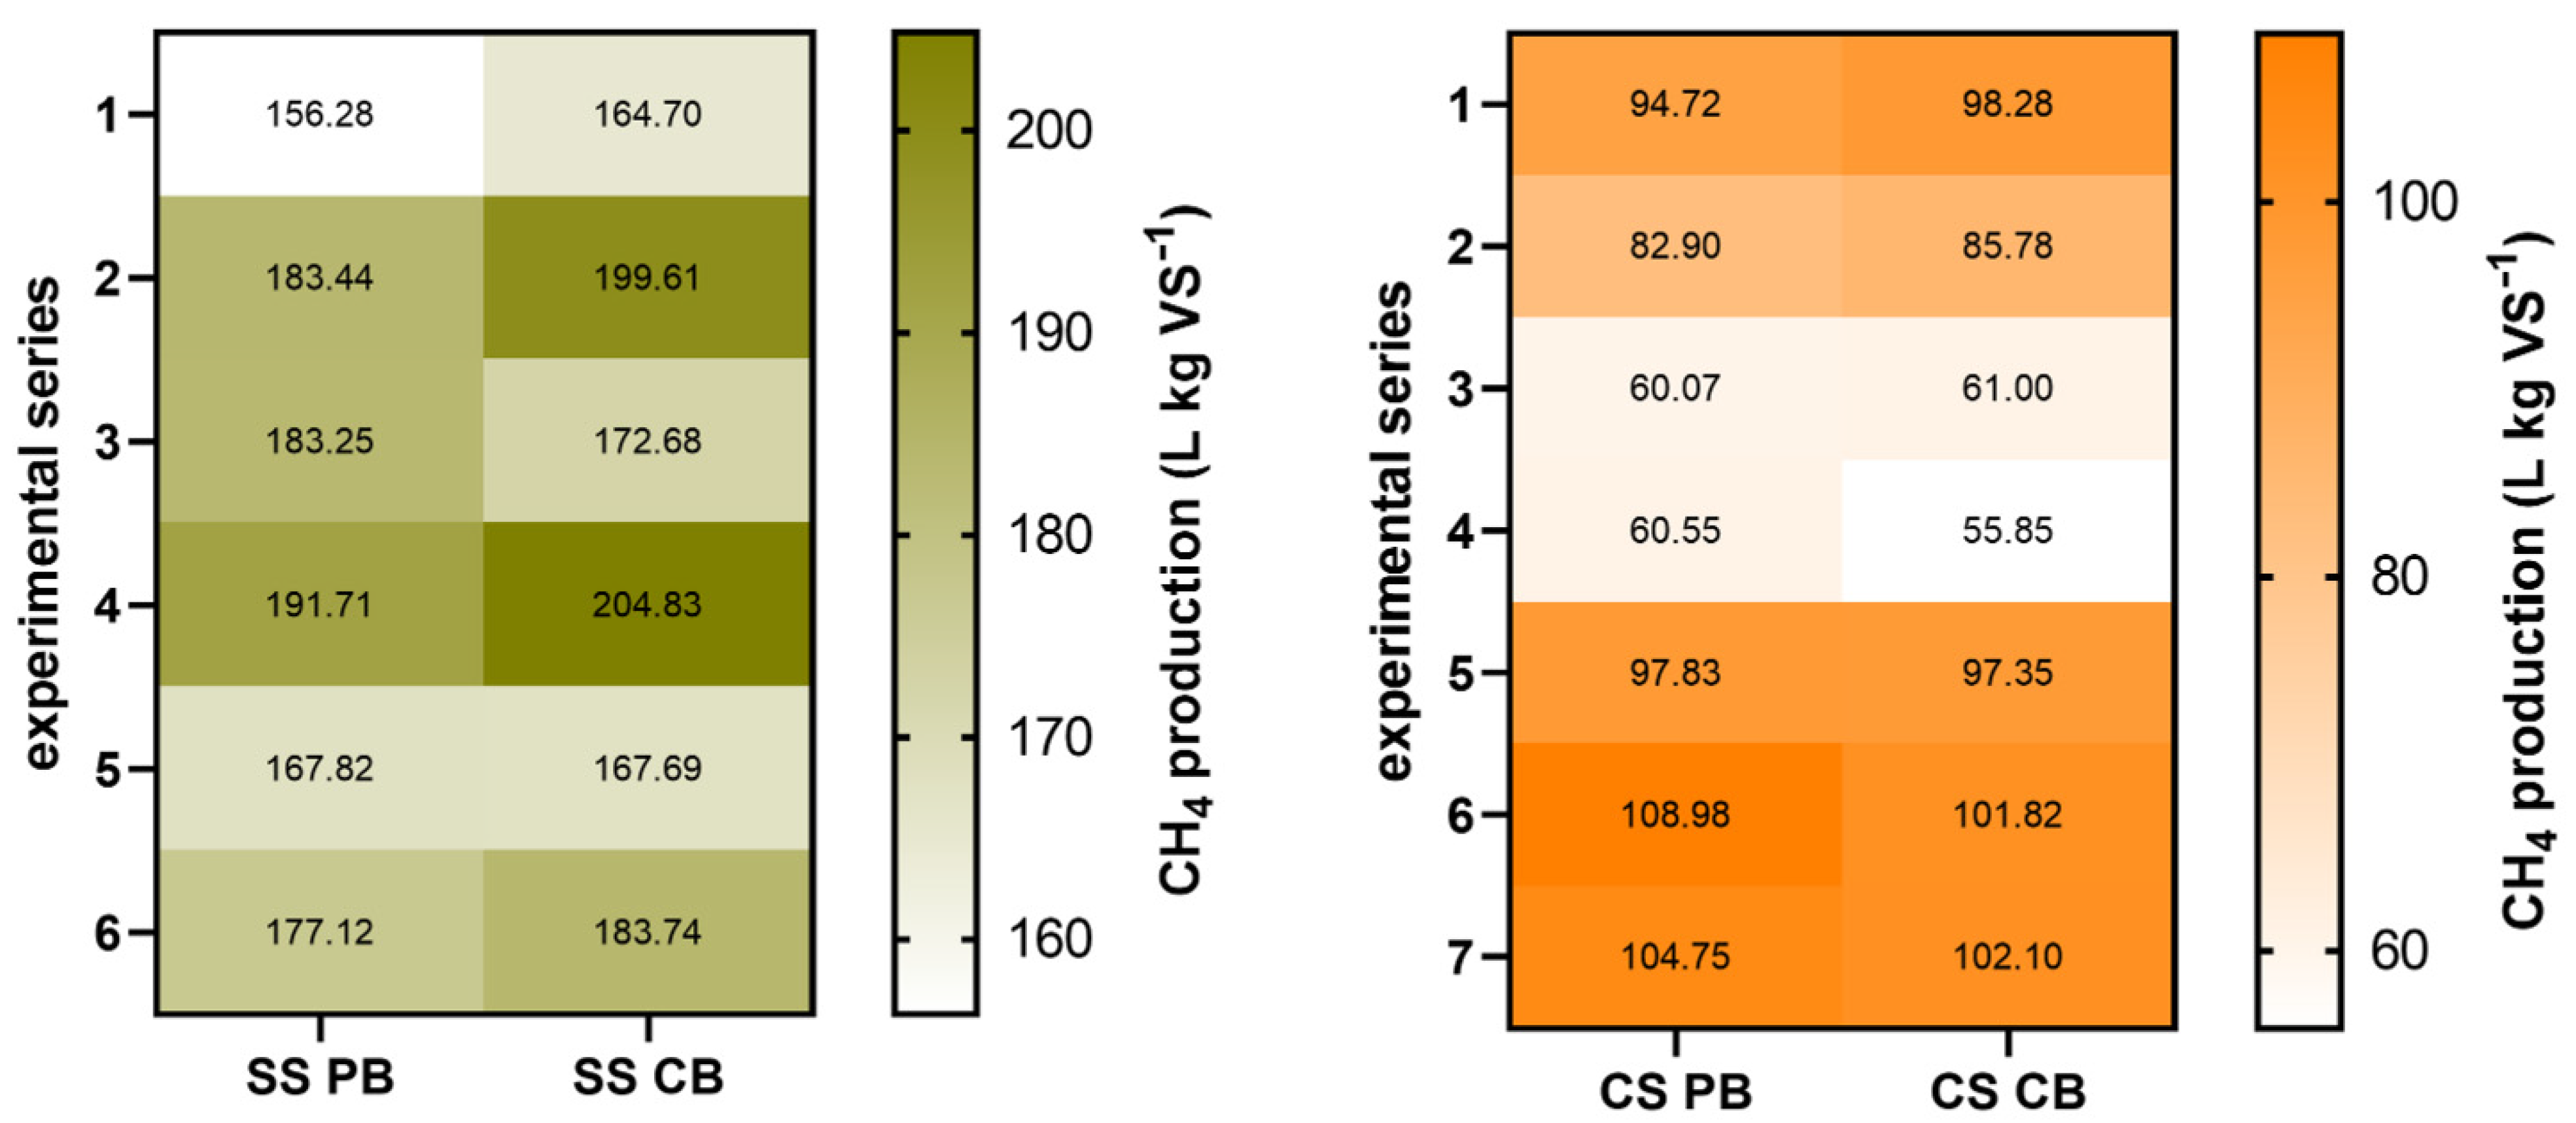
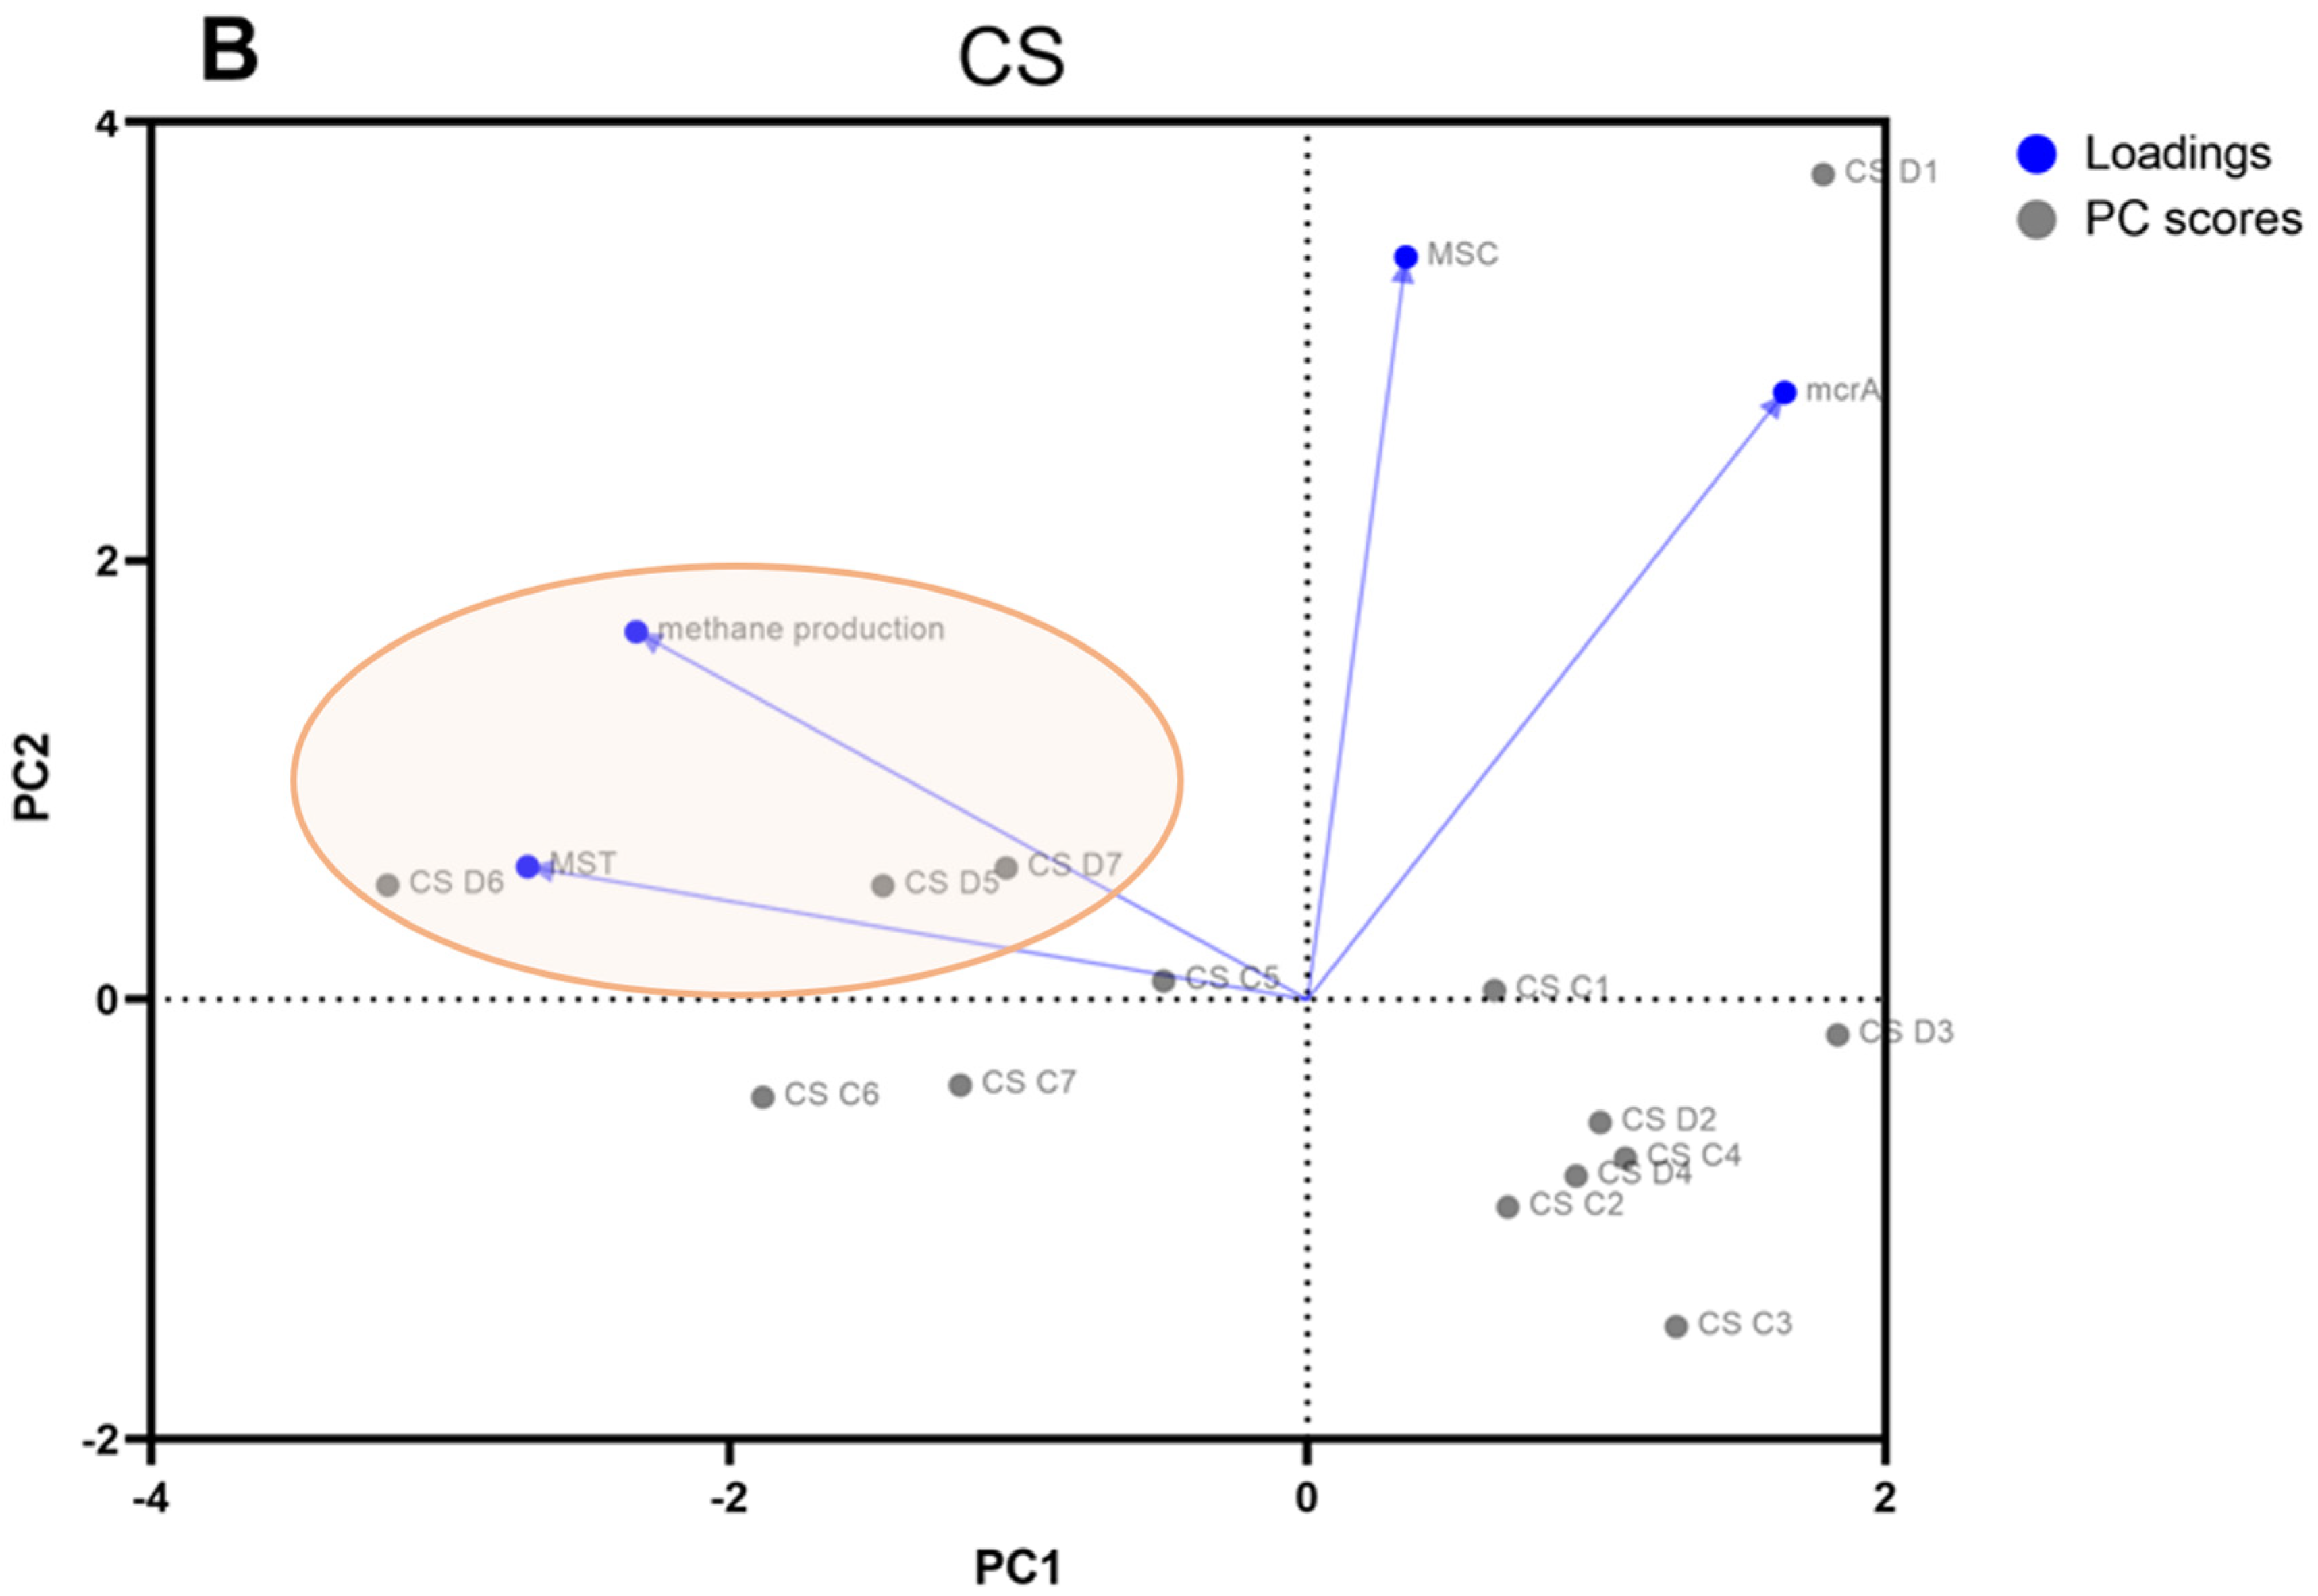
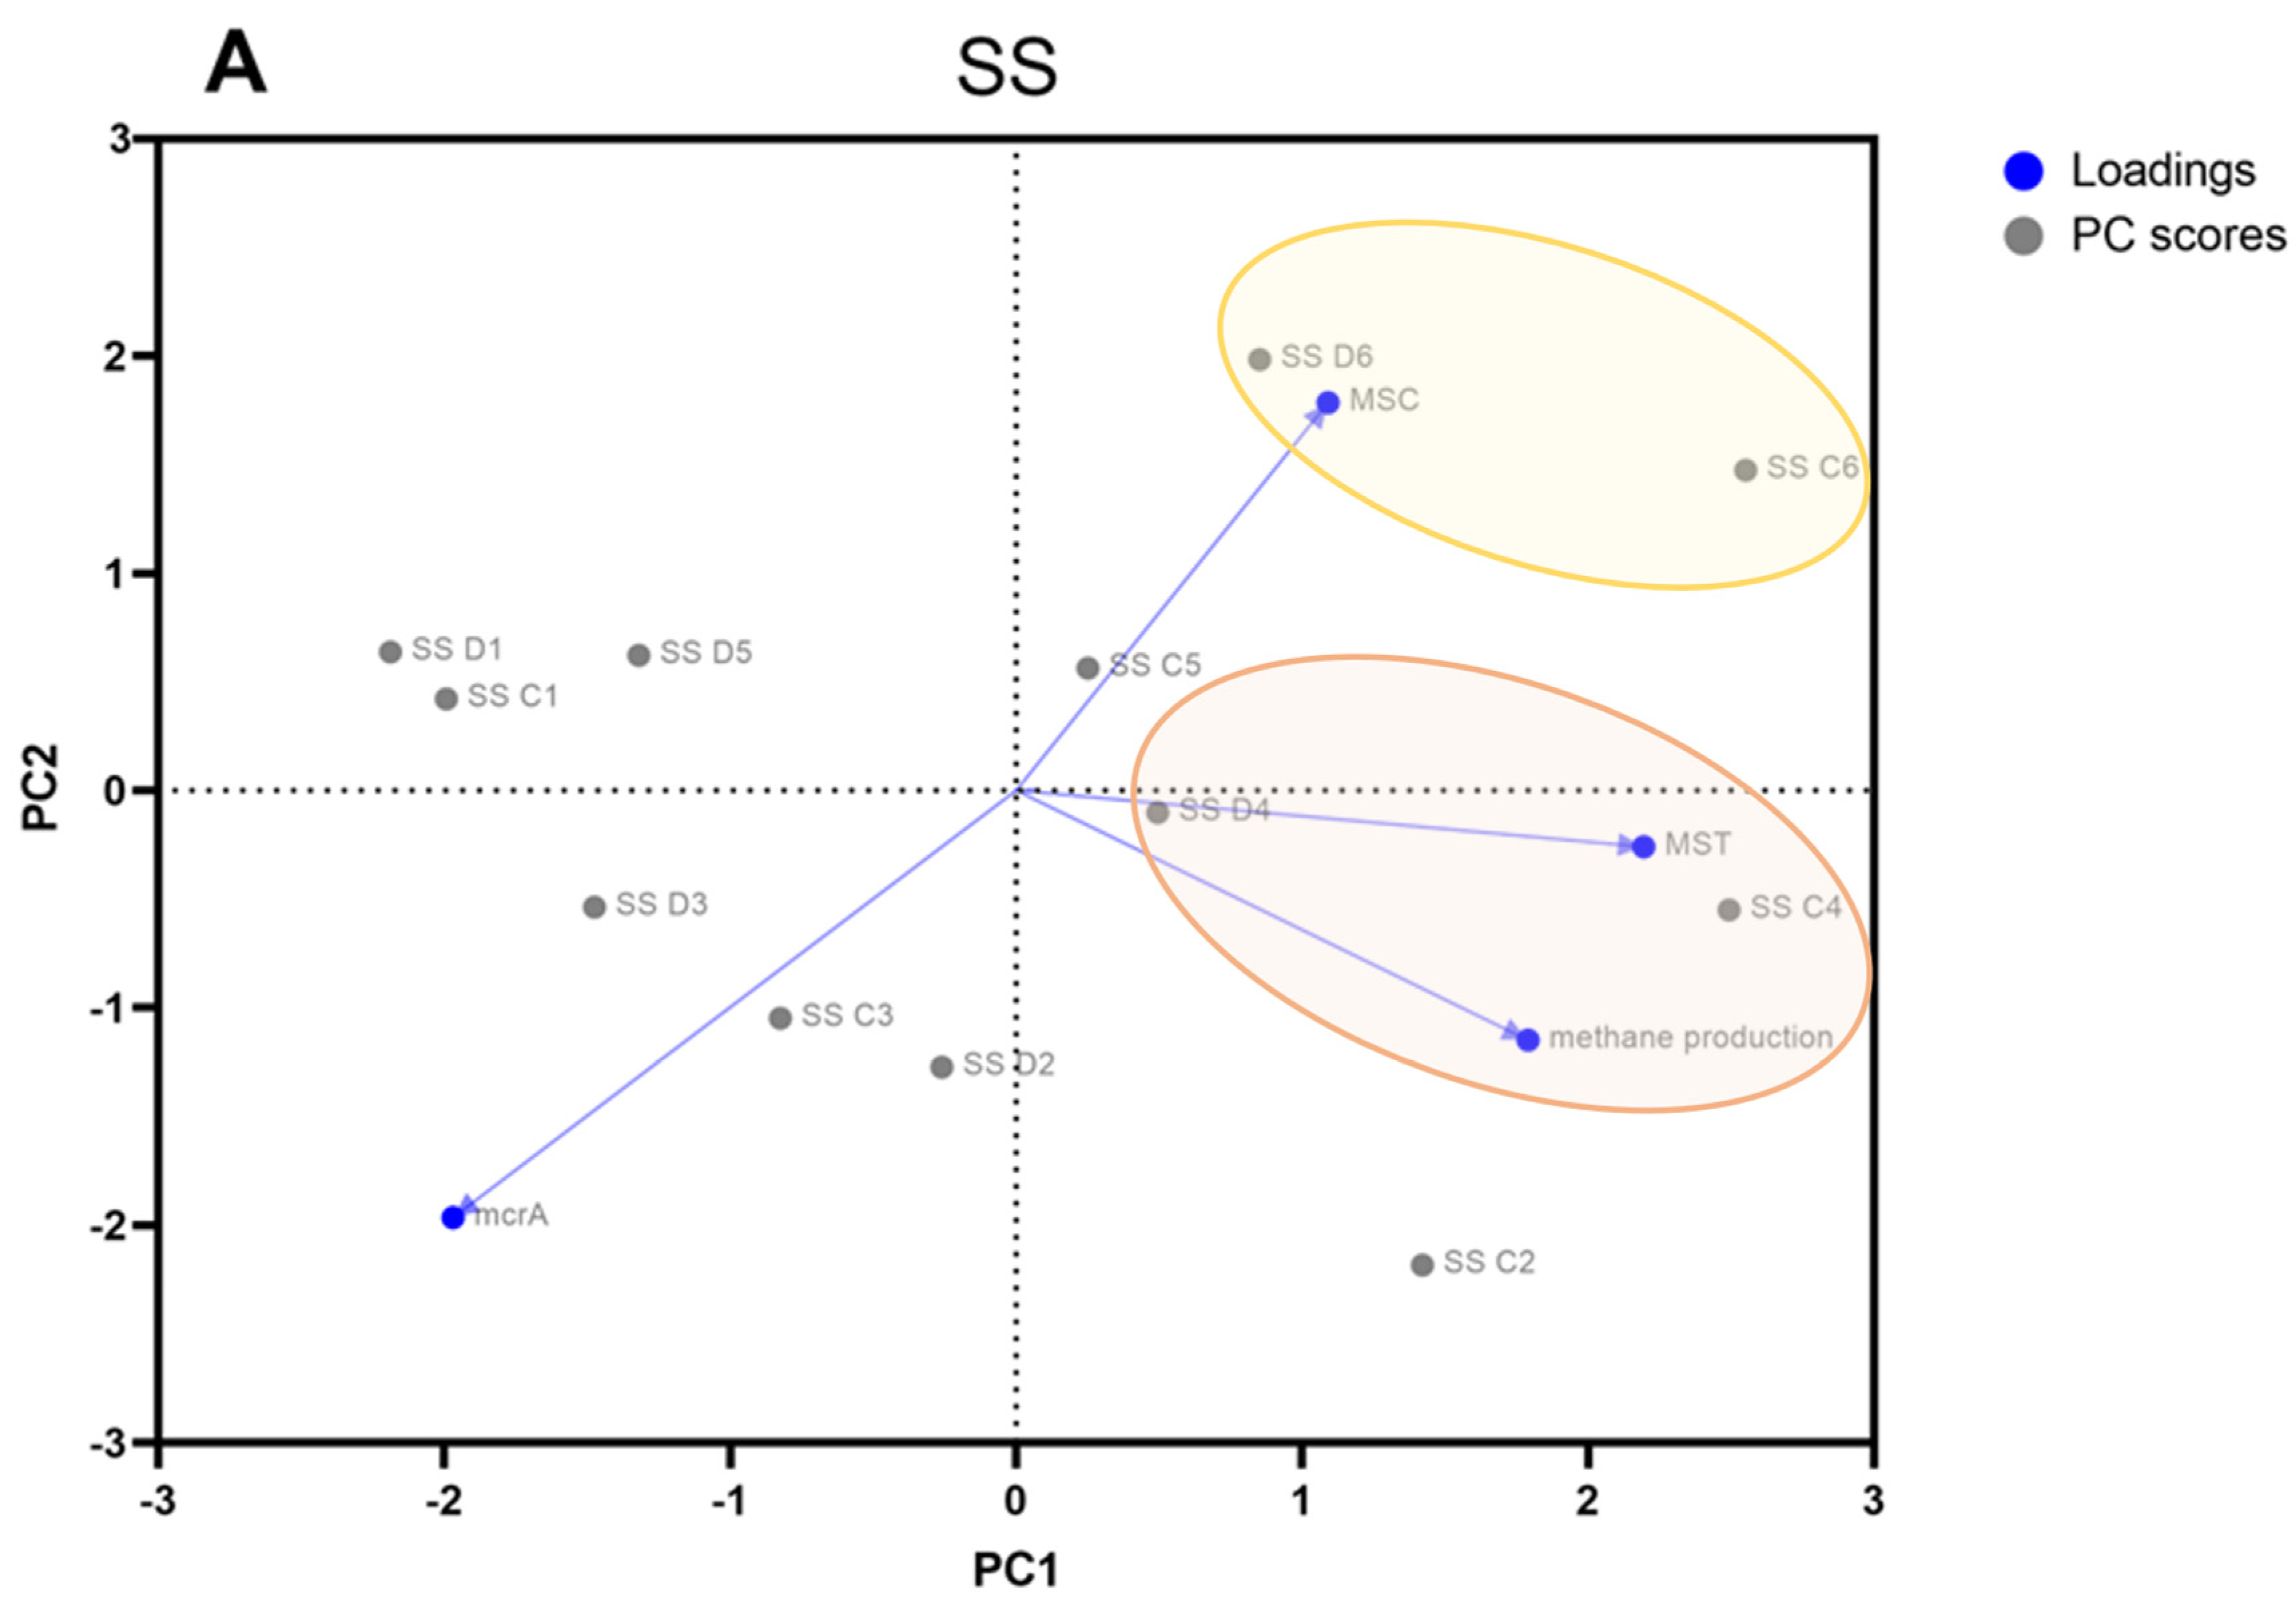
3.1. The Long-Term Impact of Antibiotics on CH4 Production and mcrA Gene Abundance

In PB containing SS, exposure to increasing concentrations of AMO, CIP, and MET significantly decreased the efficiency of CH4 production (by 5–8%) relative to control (p < 0.05) during long-term AD (Table S2). However, CH4 production trends were similar in both experimental and control samples of SS (Figure S1). The amount of CH4 produced from SS during AD was 176 and 182 L kg VS−1 on average in PB and CB, respectively. Average CH4 yields were significantly higher in PB than in CB (by 6%; 10 L kg VS−1) only in the third experimental series. The greatest differences in the efficiency of biogas production between PB and CB were noted in SS supplemented with AMO, CIP, and MET doses of 2, 0.5, and 0.5 µg mL−1 (series 2) and 8, 4, and 4 µg mL−1 (series 4), respectively (Figure 1).
No significant differences in CH4 production during AD were found between PB and CB containing CS (p > 0.05) (Figure 1 and Figure S1, Table S2). In all seven experimental series, the average CH4 yields were more than twice lower in PB and CB containing CS (87 and 86 L kg VS−1, respectively) than in PB and CB containing SS. These results indicate that the tested antibiotics did not significantly affect the AD of CS and that CS fermentation was significantly less effective than SS fermentation in terms of CH4 yields.
The organic matter in CS is more difficult to digest than the organic matter in SS [25]. Importantly, in this study, the substrate such as CS was characterized by a particular variability of individual parameters depending on the sampling time during a long-term experiment. The values of vs. and TS were variable, depending on the intensity of precipitation and the season of the year, which resulted in high standard deviations of these values (Table 1). Moreover, both SS and CS represent different environments characterized above all by diverse communities of microbes. Large amounts of bacterial and archaeal populations are involved in the complex microbiological process, such as AD. There are numerous studies indicating the benefits of anaerobic co-digestion of various types of organic waste, among others SS and manure [25,26,27]. The literature shows that co-digestion can enable the rise of organic matter levels, improve the activity of individual microorganisms in the anaerobic system and the stability of anaerobic biomass, and finally increase the efficiency of methane production.
In a previous study analyzing the influence of high individual antibiotic doses on the AD of SS and CS [5], biogas yields in both tested substrates were significantly lower under exposure to the tested drugs. The accumulation of VFAs in PB also testified to the inhibitory effects exerted by antibiotics on various stages of AD. In the present study, no significant differences in VFA concentrations (p > 0.05) were observed between SS and CS samples collected from PB and CB (Table S3). These results indicate that the mixtures of AMO, CIP, and MET as well as AMO, ENRO, and MET did not exert synergistic effects within the tested range of drug concentrations. According to other authors [28], the AD process is inhibited, and its efficiency declines rapidly only when a threshold concentration of antibiotics has been reached. Moreover, the fact that the differences between the average CH4 yields in PB and CB containing SS decreased during long-term AD could be attributed to the gradual acclimation of methanogenic microorganisms to antimicrobials [29].
The efficiency of AD was monitored not only by measuring CH4 and VFA production but was also evaluated at the molecular level. The mcrA gene encoding methyl-coenzyme M reductase is specific to methanogens. Changes in the concentration of the mcrA gene could point to fluctuations in methanogen activity which is crucial for the AD process. Therefore, the mcrA gene is regarded as a specific molecular marker of AD, and its abundance testifies to the presence and activity of methanogens in samples from various environments [30]. In the current study, mcrA concentrations in SS and CS samples collected from PB and CB differed across the experimental series. During long-term AD, the average concentrations of the mcrA gene were determined at 4.5 × 10⁸ and 1.3 × 10⁸ gene copies in 1 gD−1 of SS samples collected from PB and CB, respectively, and at 7.6 × 10⁸ and 1.0 × 10⁹ gene copies in 1 gD−1 of CS samples collected from PB and CB, respectively (Figure 2).
Similar trends in mcrA abundance were observed in SS samples collected from PB and CB in successive experimental series (Figure 2). The concentration of mcrA increased in the first experimental series, but it declined gradually in the following series (2–6). Significant differences in mcrA levels were observed between CS samples collected from PB and CB in the first three experimental series. In these series, mcrA concentrations decreased over time and were significantly higher in PB than in CB. It should be noted that CH4 yields were comparable in all experimental series in both PB and CB. In CS samples collected from PB and CB, mcrA abundance followed a similar increasing trend from the beginning of the fourth experimental series until the end of the experiment. In both substrates, significant differences in mcrA concentrations were observed between PB and CB (Table S2). In SS samples, the concentration of the mcrA gene and CH4 yields were higher in control samples. In turn, the efficiency of AD was comparable in CS samples regardless of drug supplementation, and average mcrA abundance was significantly higher in CS samples from PB. The scatter plot generated in the principal component analysis (PCA) indicates that CH4 production in bioreactors containing SS and CS was not correlated with the prevalence of mcrA during long-term AD (Figure 3).
This long-term experiment confirmed that changes in CH4 yields could not be reliably measured based on the abundance of the mcrA gene, which is characteristic of methanogens. Despite the fact that this gene has been proposed as a bioindicator for monitoring methanogen activity [31], some authors have reported significant differences between mcrA abundance and the concentrations of mcrA transcripts in fermented substrates [32,33]. Therefore, the abundance of mcrA transcripts should be taken into consideration to improve the reliability of analyses examining AD efficiency at the molecular level.

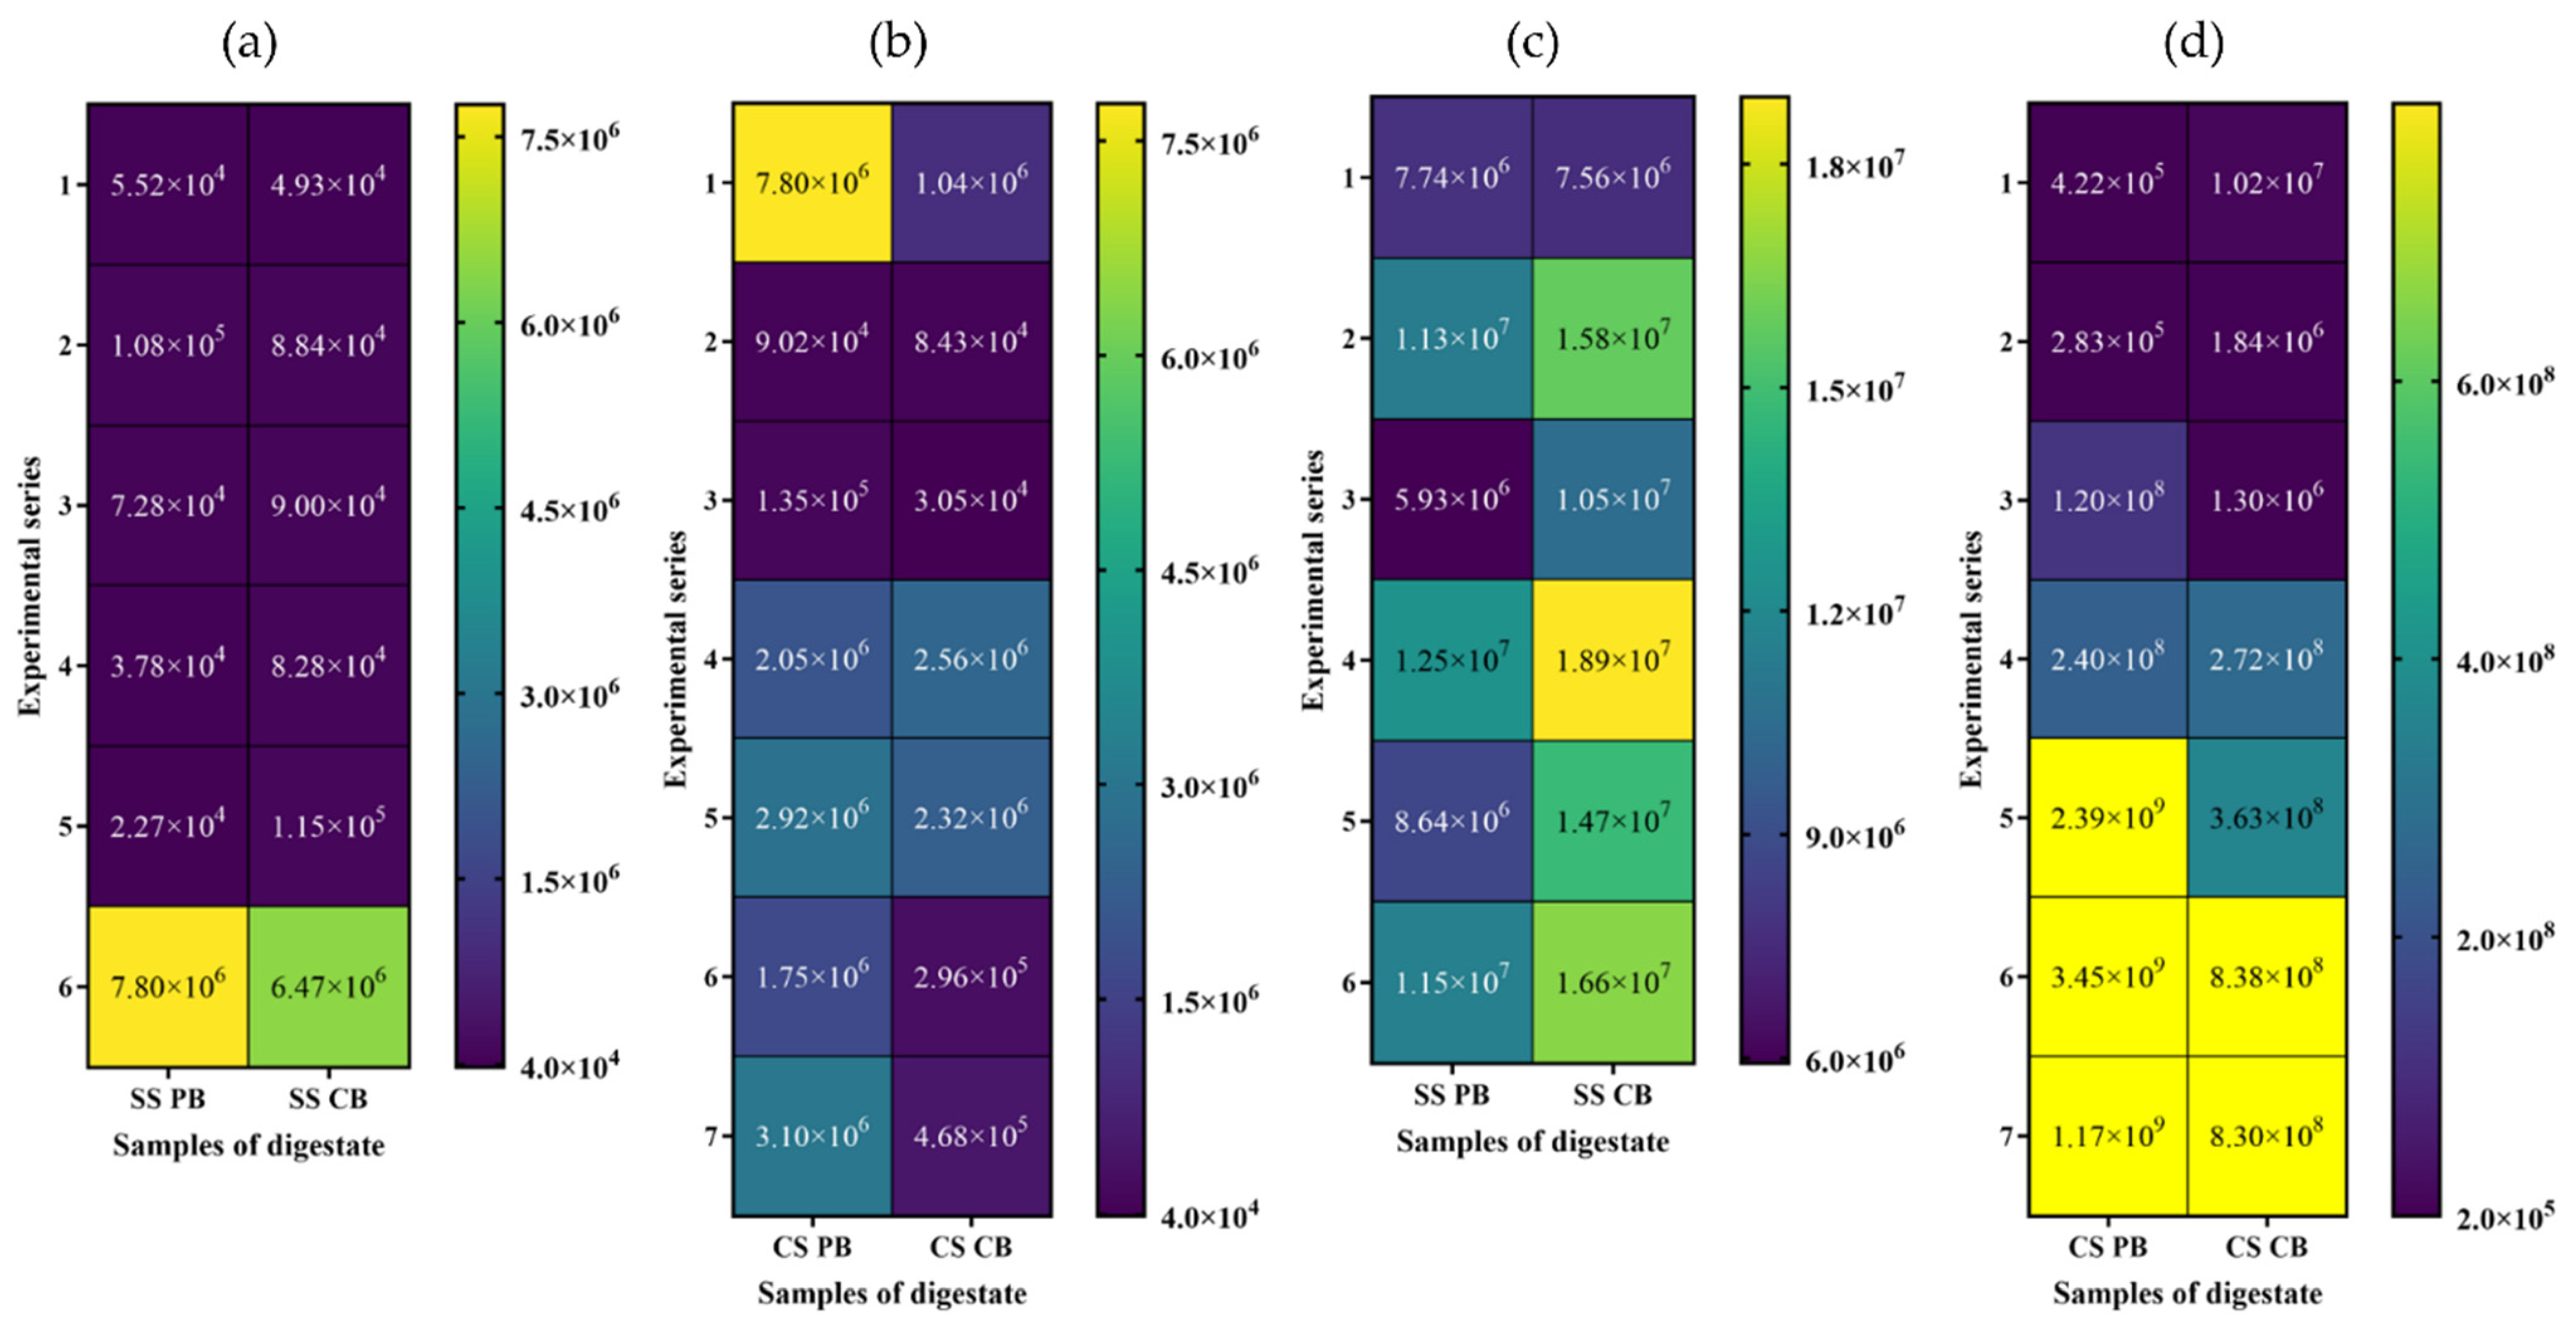
3.2. Real-Time PCR Quantification of Genes Specific to Methanogens

Methanogenic microorganisms are responsible for the last stage of AD-methanogenesis. Methanogenic members of Archaea can be divided based on their methanogenesis pathways; acetoclastic, hydrogenotrophic, and methylotrophic. Among the methanogens, only the order Methanosarcinales is capable of methane production through all three pathways. Moreover, Methanosarcinales are also the only acetoclastic methanogens that have been identified to date [34,35,36]. Bacteria belonging to both Methanosarcinaceae and Methanosaetaceae families can perform acetoclastic methanogenesis. In this pathway, acetate is activated to acetyl-CoA, either by the combined action of transacetylase and acetate kinase or by the activity of acetyl-CoA synthetase, in the case of Methanosarcinaceae and Methanosaetaceae, respectively [37]. The abundance of methanogens can be indicative of AD efficiency [4]. The prevalence of the above methanogens are affected by the composition of the fermented substrate and the presence of inhibitors such as antibiotics [5]. The presence of specific methanogenic inhibitors can promote the activity of some methanogenic Archaea that can perform different pathways to produce methane. In this study, the structure of archaeal communities was dominated by families belonging to the order Methanosarcinales, so it can be assumed that acetoclastic, hydrogenotrophic, or methylotrophic pathways could be dominant in CH4 production.
In SS samples from PB and CB, the copy numbers of gene characteristics for Methanosarcinaceae remained stable at 104 gD−1 in most experimental series (Figure 4a). In the last sixth experimental series, Methanosarcinaceae-specific genes increased to 106 in SS samples from both PB and CB. No significant changes (p > 0.05) in the copy numbers of gene characteristics for Methanosarcinaceae were found during the AD of SS (Table S2). The copy numbers of that gene point to a stable increase in Methanosarcinaceae counts and activity during SS fermentation regardless of antibiotic supplementation [23].
Cattle slurry samples were characterized by significantly higher (p < 0.05) variations in the copy numbers of the gene characteristic for Methanosarcinaceae relative to SS samples (Figure 4b; Table S2). Interestingly, in samples collected in the third, sixth, and seventh experimental series, copy numbers of Methanosarcinaceae-specific genes were one order of magnitude higher in samples exposed to antibiotics (105, 106, and 106 gD−1, respectively) than in control samples (104, 105, and 105 gD−1, respectively). The presence of higher doses of antibiotics disrupted the structure of methanogens, promoting the growth of microorganisms exhibiting the greatest adaptation. According to the literature, microorganisms belonging to the family Methanosarcinaceae have a high level of metabolic capability [6,38]. In comparison to Methanosaetaceae, Methanosarcinaceae are characterized by faster growth and more effective CH4 production, also under unfavorable conditions inside bioreactors [11].
In SS samples collected from both PB and CB during six experimental series, the copy numbers of gene characteristics for Methanosaetaceae remained fairly stable at around 106–107 gD−1. The average copy number of Methanosaetaceae-specific genes decreased significantly (p > 0.05) by one order of magnitude only in the third and fifth experimental series relative to control samples (107 gD−1) (Figure 4c; Table S2). This observation could imply that increasing antibiotic doses added to the SS bioreactor in successive experimental series led to sudden disruptions in the AD process. However, the copy numbers of gene characteristics for Methanosaetaceae were similar in SS samples collected from PB and CB (107 gD−1) in the last experimental series, which suggests that microbial consortia adapted to growing drug concentrations [39].
Significant changes in gene copy numbers were observed in CS samples collected from PB in successive experimental series (p > 0.05) (Table S2). In the first series, the number of gene copies characteristic of Methanosaetaceae was lower in experimental samples (105 gD−1) than in control samples (107 gD−1) (Figure 4d). In the second series, the number of that gene copies was also one order of magnitude lower in experimental samples than in control samples, where it reached 106 gD−1. In the fourth series, the number of Methanosaetaceae-specific genes in CS samples exposed to 5 µg mL−1 of AMO and 1.5 µg mL−1 of ENR and MET was similar to that noted in control samples (108 gD−1), and it was one order of magnitude higher (109 gD−1) in the remaining series (3, 5–7). The last experimental series of CS treatment was characterized by the predominance of genes characteristic of Methanosarcinaceae and Methanosaetaceae in samples exposed to drugs related to the control. It proves the adaptation of methanogens belonging to the order Methanosarcinales to the presence of inhibitors. However, the copy number of Methanosaetaceae-specific genes was three orders of magnitude higher than that of Methanosarcinaceae-specific genes.
The scatter plot generated in the PCA shows a correlation between the last experimental series and the presence of Methanosaetaceae in SS samples and Methanosarcinaceae in CS samples (Figure 3). At the end of the experiment, both SS and CS samples were characterized by a predominance of Methanosaetaceae, which were probably the most involved in methane production (orange clusters). However, the prevalence of Methanosarcinaceae in the last experimental series of SS treatments increased intensely (yellow cluster). The predominance of a given methanogenic family in the substrate is determined by the origin of organic matter [40], the ability to metabolize various substrates by methanogenesis (Lackner et al., 2016), and environmental factors such as the presence of inhibitors [41], which may ultimately affect the efficiency of treatment. According to the literature, some authors [42] observed the predominance of methanogens belonging to Methanosarcinaceae, while other authors [43] noted that Methanosaetaceae was the dominant methanogenic family in fermented organic matter.
Microbial balance is also essential for efficient CH4 production [44]. The increase in CH4 yields with a rise in antibiotic concentrations can be attributed to the stable growth of Methanosarcinaceae and Methanosaetaceae populations. Traversi et al. (2011) [45] reported a positive correlation between Methanosaetaceae counts and biogas production during the AD of the organic fraction of solid municipal waste and SS, which confirms that this methanogen family plays a key role in CH4 production. To sum up, we noted the variability in the dominance of individual families of methanogens in SS and CS and showed that the methanogen community and CH4 production might be closely related to the type of substrate or the presence and concentrations of inhibitors such as drugs.

4. Conclusions

This experiment demonstrated that the extent to which long-term exposure to antibiotics influences the effectiveness of AD is dependent on the type of processed substrate. The conditions inside the bioreactor and the type of substrate also determine the structure of microbial communities, including methanogens. The dominance of individual methanogens in bioreactors influences the variety of principal methanogenesis pathways, which affects the efficiency of treatment. Due to the still increasing consumption of antibiotics and their accumulation in organic matter, it is advisable to monitor the substrates processed by AD for antibiotic concentration. The study also revealed that assessments of methanogen activity based on the abundance of the mcrA gene at the molecular level should also involve analyses of mcrA transcriptomes.

Supplementary Materials

The following supporting information can be downloaded at: https://www.mdpi.com/article/10.3390/app12178422/s1, Table S1: Oligonucleotide primers and PCR reaction profile; Table S2: Differences in methane production (a), the concentration of the mcrA gene (b), Methanosarcinaceae- (c) and Methanosaetaceae-specific genes (d) between samples of sewage sludge and cattle slurry from process and control bioreactors (two-way ANOVA; p < 0.05); Table S3: Mean content of volatile fatty acids (VFAs) (gL−1) in process bioreactors (PB) containing antimicrobials and in the control bioreactor (CB). The table presents the results of two-way ANOVA (differences in VFA concentration between samples of sewage sludge and cattle slurry from PB and CB); Figure S1: Methane production (L kg VS−1) in process (PB) and control bioreactors (CB) containing sewage sludge (SS) and cattle slurry (CS). Refs [23,24] are cited in the Supplementary Materials.

Author Contributions

Conceptualization, M.C. and I.W.; methodology, M.C. and I.W.; software, M.C.; validation, M.C. and I.W.; formal analysis, M.C. and I.W.; investigation, M.C. and I.W.; resources, M.H.; data curation, M.C.; writing—original draft preparation, M.C. and I.W.; writing—review and editing, M.H. and E.K.; visualization, M.C. and I.W.; supervision, M.H.; project administration, M.H.; funding acquisition, M.H. All authors have read and agreed to the published version of the manuscript.

Funding

This research was funded by NATIONAL SCIENCE CENTRE (Poland), grant number 2016/23/B/NZ9/03669.

Institutional Review Board Statement

Not applicable.

Informed Consent Statement

Not applicable.

Data Availability Statement

Not applicable.

Conflicts of Interest

The authors declare no conflict of interest.

References

  1. Collivignarelli, M.C.; Abba, A.; Frattarola, A.; Miino, M.C.; Padovani, S.; Katsoyiannis, I.; Torretta, V. Legislation for the Reuse of Biosolids on Agricultural Land in Europe: Overview. Sustainability 2019, 11, 6015. [Google Scholar] [CrossRef] [Green Version]
  2. Stiborova, H.; Kracmarova, M.; Vesela, T.; Biesiekierska, M.; Cerny, J.; Balik, J.; Demnerova, K. Impact of Long-Term Manure and Sewage Sludge Application to Soil as Organic Fertilizer on the Incidence of Pathogenic Microorganisms and Antibiotic Resistance Genes. Agronomy 2021, 11, 1423. [Google Scholar] [CrossRef]
  3. Degueurce, A.; Trémier, A.; Peu, P. Dynamic effect of leachate recirculation on batch mode solid state anaerobic digestion: Influence of recirculated volume, leachate to substrate ratio and recirculation periodicity. Bioresour. Technol. 2016, 2016, 553–561. [Google Scholar] [CrossRef] [PubMed]
  4. Xiao, L.; Wang, Y.; Lichtfouse, E.; Li, Z.; Kumar, P.S.; Liu, J.; Feng, D.; Yang, Q.; Liu, F. Effect of Antibiotics on the Microbial Efficiency of Anaerobic Digestion of Wastewater: A Review. Front. Microbiol. 2021, 11, 611613. [Google Scholar] [CrossRef] [PubMed]
  5. Koniuszewska, I.; Czatzkowska, M.; Harnisz, M.; Korzeniewska, E. The impact of antimicrobial substances on the methanogenic community during methane fermentation of sewage sludge and cattle slurry. Appl. Sci. 2021, 11, 369. [Google Scholar] [CrossRef]
  6. Stone, J.J.; Clay, S.A.; Zhu, Z.; Wong, K.L.; Porath, L.R.; Spellman, G.M. Effect of antimicrobial compounds tylosin and chlortetracycline during batch anaerobic swine manure digestion. Water Res. 2009, 43, 4740–4750. [Google Scholar] [CrossRef]
  7. Xu, R.; Yang, Z.H.; Zheng, Y.; Wang, Q.P.; Bai, Y.; Liu, J.B.; Zhang, Y.R.; Xiong, W.P.; Lu, Y.; Fan, C.Z. Metagenomic analysis reveals the effects of long-term antibiotic pressure on sludge anaerobic digestion and antimicrobial resistance risk. Bioresour. Technol. 2019, 282, 179–188. [Google Scholar] [CrossRef]
  8. Lueders, T.; Chin, K.J.; Conrad, R.; Friedrich, M. Molecular analyses of methyl-coenzyme M reductase α-subunit (mcrA) genes in rice field soil and enrichment cultures reveal the methanogenic phenotype of a novel archaeal lineage. Environ. Microbiol. 2001, 3, 194–204. [Google Scholar] [CrossRef]
  9. Hashemi, H.; Amin, M.; Afshin, E.; Asghar, E. Effects of oxytetracycline, tylosin, and amoxicillin antibiotics on specific methanogenic activity of anaerobic biomass. Int. J. Environ. Health Eng. 2012, 1, 37. [Google Scholar] [CrossRef]
  10. aus der Beek, T.; Weber, F.A.; Bergmann, A.; Hickmann, S.; Ebert, I.; Hein, A.; Küster, A. Pharmaceuticals in the environment-Global occurrences and perspectives. Environ. Toxicol. Chem. 2016, 35, 823–835. [Google Scholar] [CrossRef]
  11. Yu, Y.; Kim, J.; Hwang, S. Use of real-time PCR for group-specific quantification of aceticlastic methanogens in anaerobic processes: Population dynamics and community structures. Biotechnol. Bioeng. 2006, 93, 424–433. [Google Scholar] [CrossRef] [PubMed]
  12. Aydin, S.; Ince, B.; Ince, O. Application of real-time PCR to determination of combined effect of antibiotics on Bacteria, Methanogenic Archaea, Archaea in anaerobic sequencing batch reactors. Water Res. 2015, 76, 88–98. [Google Scholar] [CrossRef] [PubMed]
  13. Osińska, A.; Korzeniewska, E.; Harnisz, M.; Niestȩpski, S. Quantitative occurrence of antibiotic resistance genes among bacterial populations from wastewater treatment plants using activated sludge. Appl. Sci. 2019, 9, 387. [Google Scholar] [CrossRef] [Green Version]
  14. An, J.; Chen, H.; Wei, S.; Gu, J. Antibiotic contamination in animal manure, soil, and sewage sludge in Shenyang, northeast China. Environ. Earth Sci. 2015, 74, 5077–5086. [Google Scholar] [CrossRef]
  15. Kies, F.K.; Boutchebak, S.; Bendaida, N. Soil Contamination by Pharmaceutical Pollutants: Adsorption of an Antibiotic (Amoxicillin) on an Agricultural Land. Proceedings 2020, 30, 60. [Google Scholar] [CrossRef]
  16. Berendsen, B.J.A.; Wegh, R.S.; Memelink, J.; Zuidema, T.; Stolker, L.A.M. The analysis of animal faeces as a tool to monitor antibiotic usage. Talanta 2015, 132, 258–268. [Google Scholar] [CrossRef] [PubMed]
  17. Huerta, B.; Marti, E.; Gros, M.; López, P.; Pompêo, M.; Armengol, J.; Barceló, D.; Balcázar, J.L.; Rodríguez-Mozaz, S.; Marcé, R. Exploring the links between antibiotic occurrence, antibiotic resistance, and bacterial communities in water supply reservoirs. Sci. Total Environ. 2013, 456, 161–170. [Google Scholar] [CrossRef]
  18. Klein, E.Y.; Van Boeckel, T.P.; Martinez, E.M.; Pant, S.; Gandra, S.; Levin, S.A.; Goossens, H.; Laxminarayan, R. Global increase and geographic convergence in antibiotic consumption between 2000 and 2015. Proc. Natl. Acad. Sci. USA 2018, 115, E3463–E3470. [Google Scholar] [CrossRef] [Green Version]
  19. Czatzkowska, M.; Harnisz, M.; Korzeniewska, E.; Rusanowska, P.; Bajkacz, S.; Felis, E.; Jastrzębski, J.P.; Paukszto, Ł.; Koniuszewska, I. The impact of antimicrobials on the efficiency of methane fermentation of sewage sludge, changes in microbial biodiversity and the spread of antibiotic resistance. J. Hazard. Mater. 2021, 416, 125773. [Google Scholar] [CrossRef]
  20. Koniuszewska, I.; Harnisz, M.; Korzeniewska, E.; Czatzkowska, M.; Jastrzębski, J.P.; Paukszto, Ł.; Bajkacz, S.; Felis, E.; Rusanowska, P. The Effect of Antibiotics on Mesophilic Anaerobic Digestion Process of Cattle Manure. Energies 2021, 14, 1125. [Google Scholar] [CrossRef]
  21. Spielmeyer, A. Occurrence and fate of antibiotics in manure during manure treatments: A short review. Sustain. Chem. Pharm. 2018, 9, 76–86. [Google Scholar] [CrossRef]
  22. Kisielewska, M.; Dębowski, M.; Zieliński, M. Improvement of biohydrogen production using a reduced pressure fermentation. Bioprocess Biosyst. Eng. 2015, 38, 1925–1933. [Google Scholar] [CrossRef] [PubMed]
  23. Yu, Y.; Lee, C.; Kim, J.; Hwang, S. Group-Specific Primer and Probe Sets to Detect Methanogenic Communities Using Quantitative Real-Time Polymerase Chain Reaction. Biotechnol. Bioeng. 2005, 89, 670–679. [Google Scholar] [CrossRef] [PubMed]
  24. Denman, S.E.; Tomkins, N.W.; McSweeney, C.S. Quantitation and diversity analysis of ruminal methanogenic populations in response to the antimethanogenic compound bromochloromethane. FEMS Microbiol. Ecol. 2007, 62, 313–322. [Google Scholar] [CrossRef] [Green Version]
  25. Dai, X.; Chen, Y.; Zhang, D. High-solid Anaerobic Co-digestion of Sewage Sludge and Cattle Manure: The Effects of Volatile Solid Ratio and pH. Sci. Rep. 2016, 6, 35194. [Google Scholar] [CrossRef] [Green Version]
  26. Edelmann, W.; Engeli, H.; Gradenecker, M. Co-digestion of organic solid waste and sludge from sewage treatment. Water Sci. Technol. 2000, 41, 213–221. [Google Scholar] [CrossRef]
  27. Nikiema, M.; Narcis, B.; Ynoussa, M.; Marius, K.S.; Emilian, M.; Cheik, A.T.O.; Dayeri, D.; Alfred, S.T.; Valentin, N.; Aboubakar, S.O. Optimization of Biogas Production from Sewage Sludge: Impact of Combination with Bovine Dung and Leachate from Municipal Organic Waste. Sustainability 2022, 14, 4380. [Google Scholar] [CrossRef]
  28. Spielmeyer, A.; Breier, B.; Groißmeier, K.; Hamscher, G. Elimination patterns of worldwide used sulfonamides and tetracyclines during anaerobic fermentation. Bioresour. Technol. 2015, 193, 307–314. [Google Scholar] [CrossRef]
  29. Lagator, M.; Uecker, H.; Neve, P. Adaptation at different points along antibiotic concentration gradients. Biol. Lett. 2021, 17, 20200913. [Google Scholar] [CrossRef]
  30. Lwin, K.O.; Matsui, H. Comparative analysis of the methanogen diversity in horse and pony by using mcra gene and archaeal 16S rRNA Gene clone libraries. Archaea 2014, 2014, 483574. [Google Scholar] [CrossRef] [Green Version]
  31. Alvarado, A.; Montañez-hernández, L.E.; Palacio-molina, S.L.; Oropeza-navarro, R.; Miriam, P. Microbial trophic interactions and mcrA gene expression in monitoring of anaerobic digesters. Front. Microbiol. 2014, 5, 597. [Google Scholar] [CrossRef] [PubMed]
  32. Ma, K.; Conrad, R.; Lu, Y. Responses of methanogen mcrA genes and their transcripts to an alternate dry/wet cycle of paddy field soil. Appl. Environ. Microbiol. 2012, 78, 445–454. [Google Scholar] [CrossRef] [PubMed] [Green Version]
  33. Morris, R.; Schauer-Gimenez, A.; Bhattad, U.; Kearney, C.; Struble, C.A.; Zitomer, D.; Maki, J.S. Methyl coenzyme M reductase (mcrA) gene abundance correlates with activity measurements of methanogenic H2/CO2-enriched anaerobic biomass. Microb. Biotechnol. 2014, 7, 77–84. [Google Scholar] [CrossRef] [PubMed]
  34. De Vrieze, J.; Hennebel, T.; Van den Brande, J.; Bilad, R.M.; Bruton, T.A.; Vankelecom, I.F.J.; Verstraete, W.; Boon, N. Anaerobic digestion of molasses by means of a vibrating and non-vibrating submerged anaerobic membrane bioreactor. Biomass Bioenergy 2014, 68, 95–105. [Google Scholar] [CrossRef]
  35. Czatzkowska, M.; Harnisz, M.; Korzeniewska, E.; Wolak, I.; Rusanowska, P.; Paukszto, Ł.; Jastrzębski, J.P.; Bajkacz, S. Long-Term, Simultaneous Impact of Antimicrobials on the Efficiency of Anaerobic Digestion of Sewage Sludge and Changes in the Microbial Community. Energies 2022, 15, 1826. [Google Scholar] [CrossRef]
  36. Lackner, N.; Hintersonnleitner, A.; Wagner, A.O.; Illmer, P. Hydrogenotrophic Methanogenesis and Autotrophic Growth of Methanosarcina thermophila. Archaea 2018, 1826, 4712608. [Google Scholar] [CrossRef] [Green Version]
  37. Kurth, J.M.; Op den Camp, H.J.M.; Welte, C.U. Several ways one goal—Methanogenesis from unconventional substrates. Appl. Microbiol. Biotechnol. 2020, 104, 6839–6854. [Google Scholar] [CrossRef]
  38. Ho, D.P.; Jensen, P.D.; Batstone, D.J. Methanosarcinaceae and Acetate-Oxidizing Pathways Dominate in High-Rate Thermophilic Anaerobic Digestion of Waste-Activated Sludge. Appl. Environ. Microbiol. 2013, 79, 6491–6500. [Google Scholar] [CrossRef] [Green Version]
  39. Lins, P.; Reitschuler, C.; Illmer, P. Methanosarcina spp., the key to relieve the start-up of a thermophilic anaerobic digestion suffering from high acetic acid loads. Bioresour. Technol. 2014, 152, 347–354. [Google Scholar] [CrossRef]
  40. Ike, M.; Inoue, D.; Miyano, T.; Liu, T.T.; Sei, K.; Soda, S.; Kadoshin, S. Microbial population dynamics during startup of a full-scale anaerobic digester treating industrial food waste in Kyoto eco-energy project. Bioresour. Technol. 2010, 101, 3952–3957. [Google Scholar] [CrossRef]
  41. Lee, C.; Kim, J.; Hwang, K.; O’Flaherty, V.; Hwang, S. Quantitative analysis of methanogenic community dynamics in three anaerobic batch digesters treating different wastewaters. Water Res. 2009, 43, 157–165. [Google Scholar] [CrossRef] [PubMed]
  42. Tao, B.; Donnelly, J.; Oliveira, I.; Anthony, R.; Wilson, V.; Esteves, S.R. Enhancement of microbial density and methane production in advanced anaerobic digestion of secondary sewage sludge by continuous removal of ammonia. Bioresour. Technol. 2017, 232, 380–388. [Google Scholar] [CrossRef] [PubMed]
  43. Nordgård, A.S.R.; Bergland, W.H.; Vadstein, O.; Mironov, V.; Bakke, R.; Østgaard, K.; Bakke, I. Anaerobic digestion of pig manure supernatant at high ammonia concentrations characterized by high abundances of Methanosaeta and non-euryarchaeotal archaea. Sci. Rep. 2017, 7, 15077. [Google Scholar] [CrossRef] [PubMed]
  44. Weiß, S.; Tauber, M.; Somitsch, W.; Meincke, R.; Müller, H.; Berg, G.; Guebitz, G.M. Enhancement of biogas production by addition of hemicellulolytic bacteria immobilised on activated zeolite. Water Res. 2010, 44, 1970–1980. [Google Scholar] [CrossRef]
  45. Traversi, D.; Villa, S.; Acri, M.; Pietrangeli, B.; Degan, R.; Gilli, G. The role of different methanogen groups evaluated by real-time qPCR as high-efficiency bioindicators of wet anaerobic co-digestion of organic waste. AMB Express 2011, 1, 28. [Google Scholar] [CrossRef] [PubMed] [Green Version]
Figure 1. Heatmap presenting average methane production (L kg VS−1) in each experimental series in process (PB) and control bioreactors (CB) containing sewage sludge (SS) and cattle slurry (CS).
Applsci 12 08422 g001
Figure 2. Prevalence of the mcrA gene in sewage sludge (SS) and cattle slurry (CS) samples from process (PB) and control bioreactors (CB). The mean values noted in each experimental series were used.
Applsci 12 08422 g002
Figure 3. Ordination analysis of sewage sludge ((A) SS) and cattle slurry ((B) CS) samples from process and control bioreactors. Principal component analysis (PCA) of the abundance of mcrA gene, genes characteristics for Methanosarcinaceae (MSC), Methanosaetaceae (MST), and methane production. D—dose ID, C—control.
Applsci 12 08422 g003aApplsci 12 08422 g003b
Figure 4. Average abundance of specific genes in digestate samples exposed to a mixture of antibiotics (PB) and in control samples (CB): (a) gene characteristic for Methanosarcinaceae in SS samples, (b) gene characteristic for Methanosarcinaceae in CS samples, (c) gene characteristic for Methanosaetaceae in SS samples, and (d) gene characteristic for Methanosaetaceae in CS digestate samples.
Applsci 12 08422 g004
Table 1. Characteristics of the substrates and the inoculum used in the AD process.
TS a gD−1 b (mg)VS c gD−1 (mg)pHTP d gTS−1 e (mg)TN f gTS−1 (mg)
SS g52.0 ± 11.3739.92 ± 9.596.35 ± 0.32.02 ± 0.484.32 ± 1.61
CS h107.46 ± 29.0184.23 ± 22.177.75 ± 0.420.95 ± 0.264.10 ± 1.64
Inoculum38.8 ± 5.225.2 ± 3.88.1 ± 0.50.9 ± 0.45.5 ± 1.9
a TS—total solids; b gD−1—the value of parameter per one gram of digestate samples; c VS—volatile solids; d TP—total phosphorus; e gTS−1—the value of parameter per one gram of TS; f TN—total nitrogen, g SS—sewage sludge, h CS—cattle slurry.
Table 2. Concentrations of antimicrobials (Dose ID) added to SS and CS in successive experimental series.
Antibiotic Concentrations (µg mL−1)
SubstrateSeriesDose IDAMOCIPMETENR
SS1D110.250.25X
2D220.50.5
3D3411
4D4844
5D51688
6D6361616
CS1D11X0.250.25
2D220.50.5
3D32.50.750.75
4D451.51.5
5D51033
6D61644
7D73288
Table 3. Identification numbers (Samples No. 1–No. 9) assigned to SS and CS samples collected from process (PB) and control (CB) bioreactors during the AD process in each experimental series (Series 1–7).
SSCS
SeriesSamplesPB aCB bPBCB
Sample ID
11SS D1.1SS C1.1CS D1.1CS C1.1
2SS D1.2SS C1.2CS D1.2CS C1.2
3SS D1.3SS C1.3CS D1.3CS C1.3
4SS D1.4SS C1.4CS D1.4CS C1.4
5xCS D1.5CS C1.5
6CS D1.6CS C1.6
21SS D2.1SS C2.1CS D2.1CS C2.1
2SS D2.2SS C2.2CS D2.2CS C2.2
3SS D2.3SS C2.3CS D2.3CS C2.3
4SS D2.4SS C2.4CS D2.4CS C2.4
5SS D2.5SS C2.5CS D2.5CS C2.5
6xCS D2.6CS C2.6
31SS D3.1SS C3.1CS D3.1CS C3.1
2SS D3.2SS C3.2CS D3.2CS C3.2
3SS D3.3SS C3.3CS D3.3CS C3.3
4SS D3.4SS C3.4CS D3.4CS C3.4
5xCS D3.5CS C3.5
6CS D3.6CS C3.6
41SS D4.1SS C4.1CS D4.1CS C4.1
2SS D4.2SS C4.2CS D4.2CS C4.2
3SS D4.3SS C4.3CS D4.3CS C4.3
4SS D4.4SS C4.4CS D4.4CS C4.4
5SS D4.5SS C4.5CS D4.5CS C4.5
6xCS D4.6CS C4.6
51SS D5.1SS C5.1CS D5.1CS C5.1
2SS D5.2SS C5.2CS D5.2CS C5.2
3SS D5.3SS C5.3CS D5.3CS C5.3
4SS D5.4SS C5.4CS D5.4CS C5.4
5SS D5.5SS C5.5CS D5.5CS C5.5
6xCS D5.6CS. C5.6
61SS D6.1SS C6.1CS D6.1CS C6.1
2SS D6.2SS C6.2CS D6.2CS C6.2
3SS D6.3SS C6.3CS D6.3CS C6.3
4SS D6.4SS C6.4CS D6.4CS C6.4
5SS D6.5SS C6.5CS D6.5CS C6.5
6xCS D6.6CS C6.6
71xCS D7.1CS C7.1
2CS D7.2CS C7.2
3CS D7.3CS C7.3
4CS D7.4CS C7.4
5CS D7.5CS C7.5
6CS D7.6CS C7.6
a PB—process bioreactor, b CB—control bioreactor.
Publisher’s Note: MDPI stays neutral with regard to jurisdictional claims in published maps and institutional affiliations.

