


A Finite Element Model for Investigating Unsteady-State Temperature Distribution and Thermomechanical Behavior of Underground Energy Piles

Abstract
:1. Introduction
2. Materials and Methods
2.1. Temperature Field Governing Equation
2.2. Thermomechanical Governing Equation
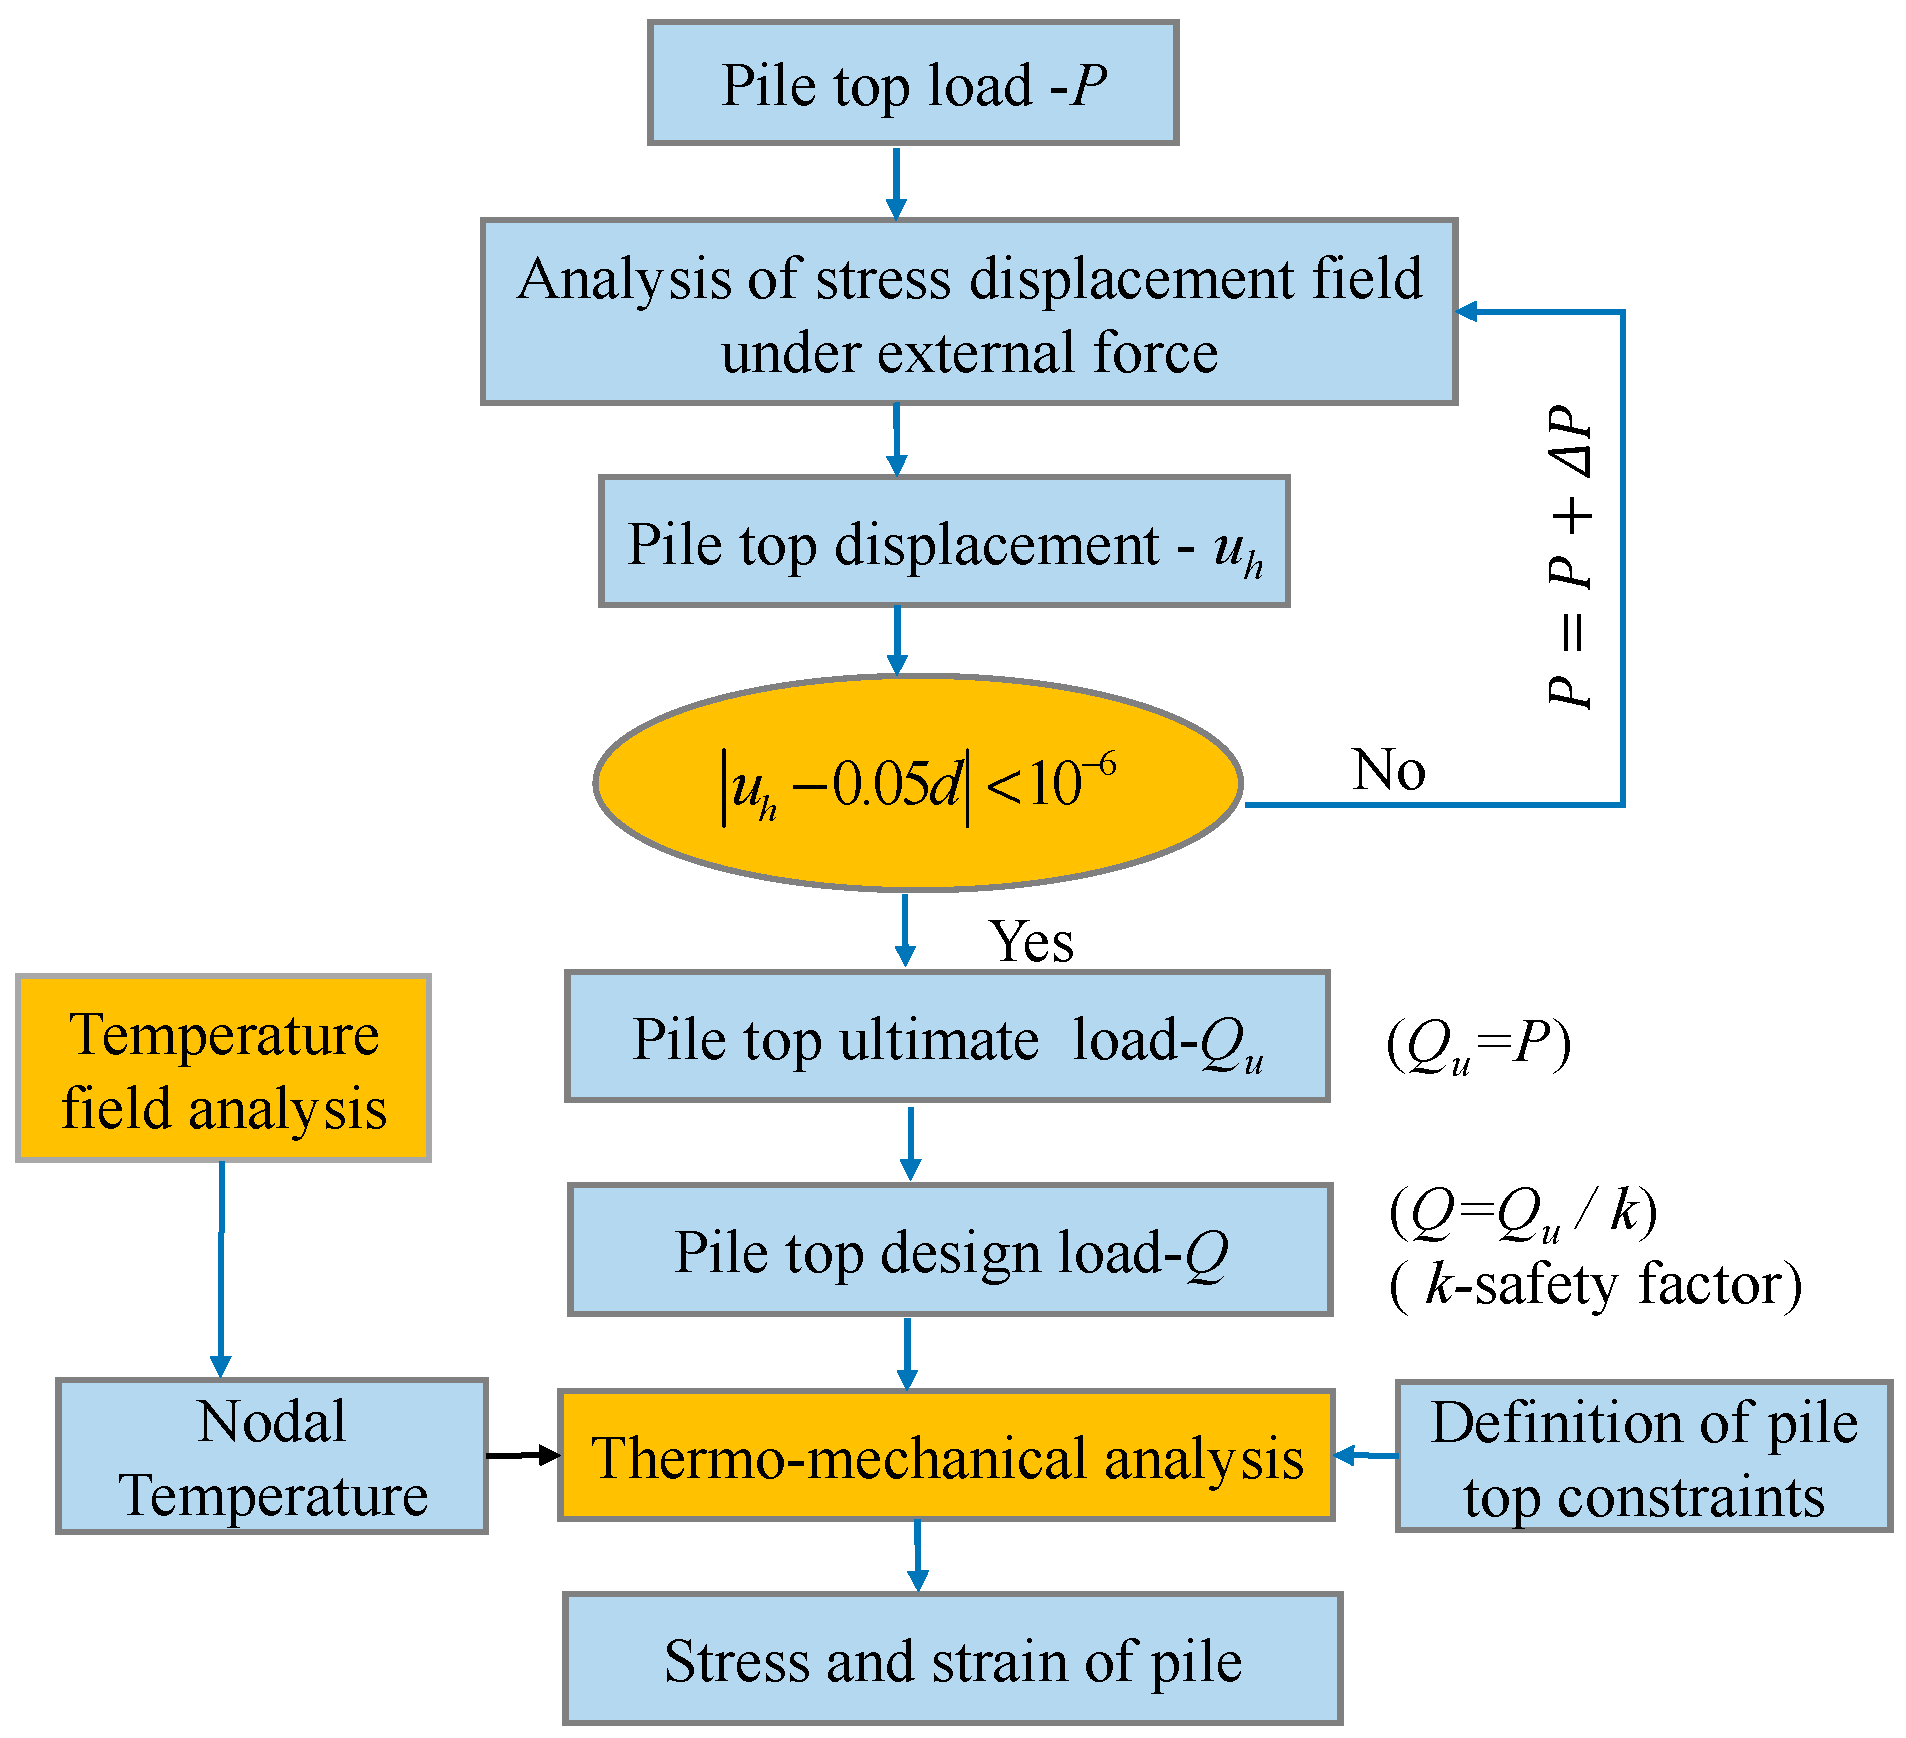
2.3. Modeling Process
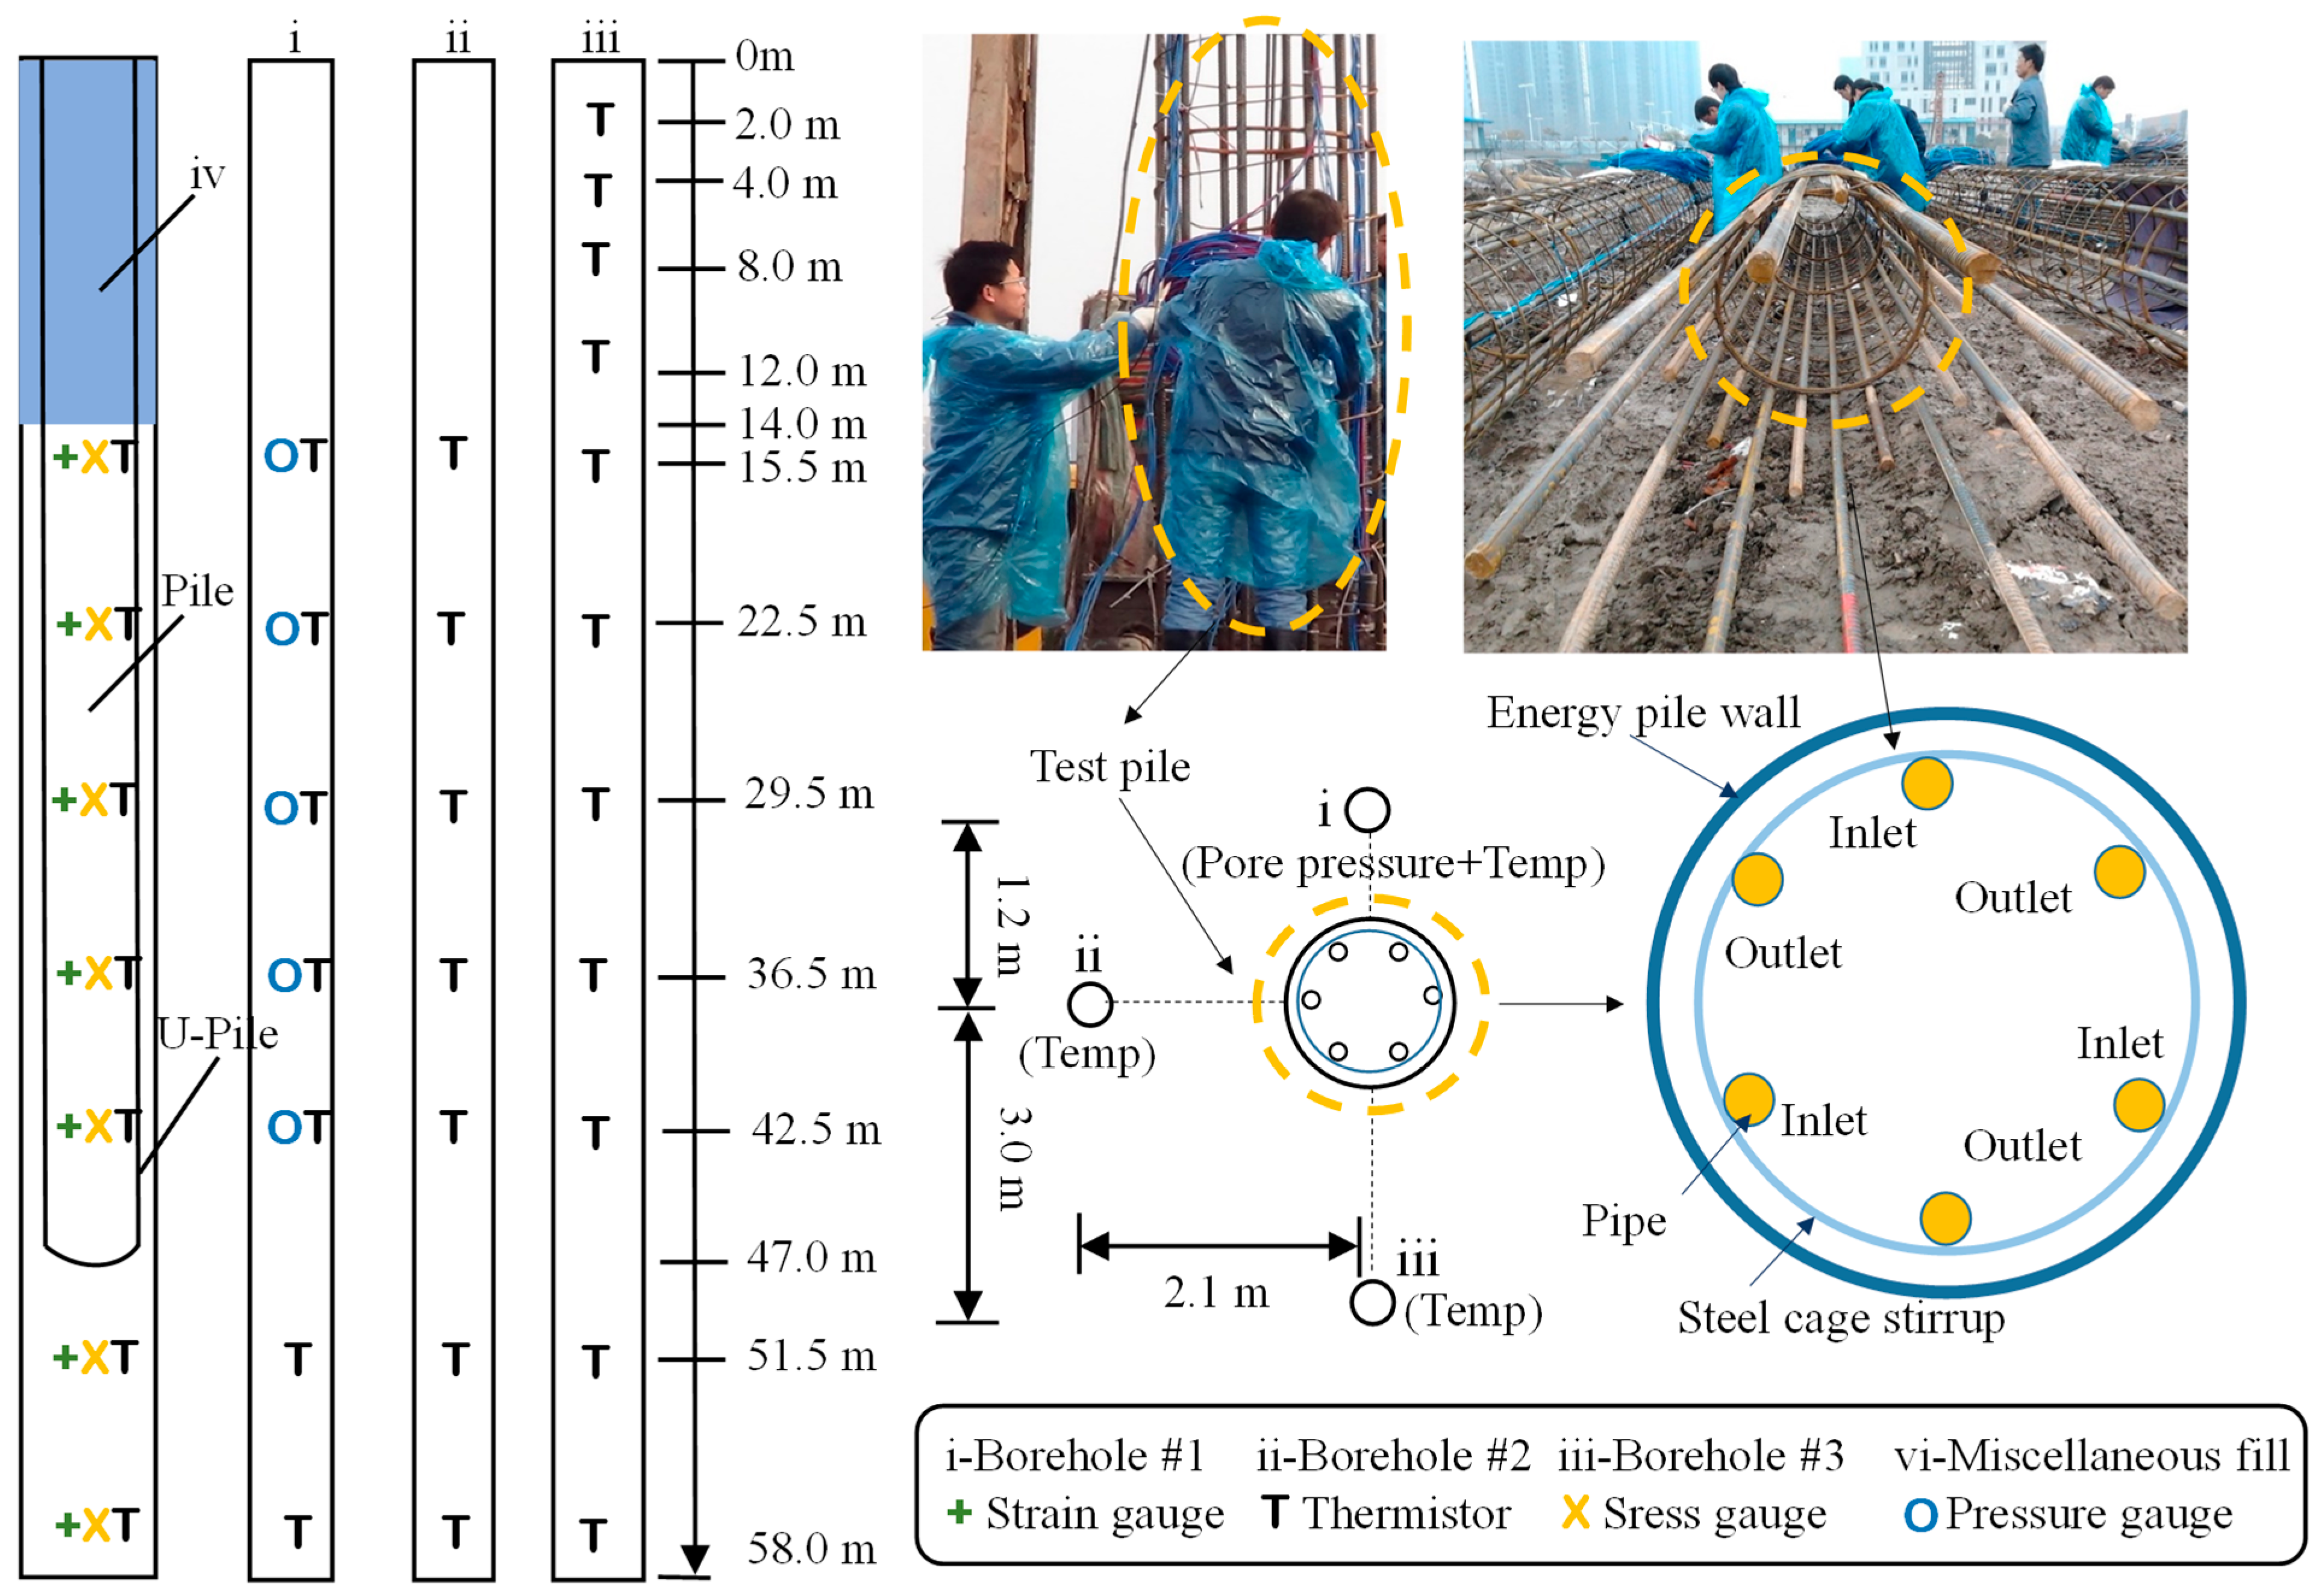
2.4. Model Verification
3. Results
3.1. The Evolution of Energy Pile Temperature Field under Typical Working Conditions
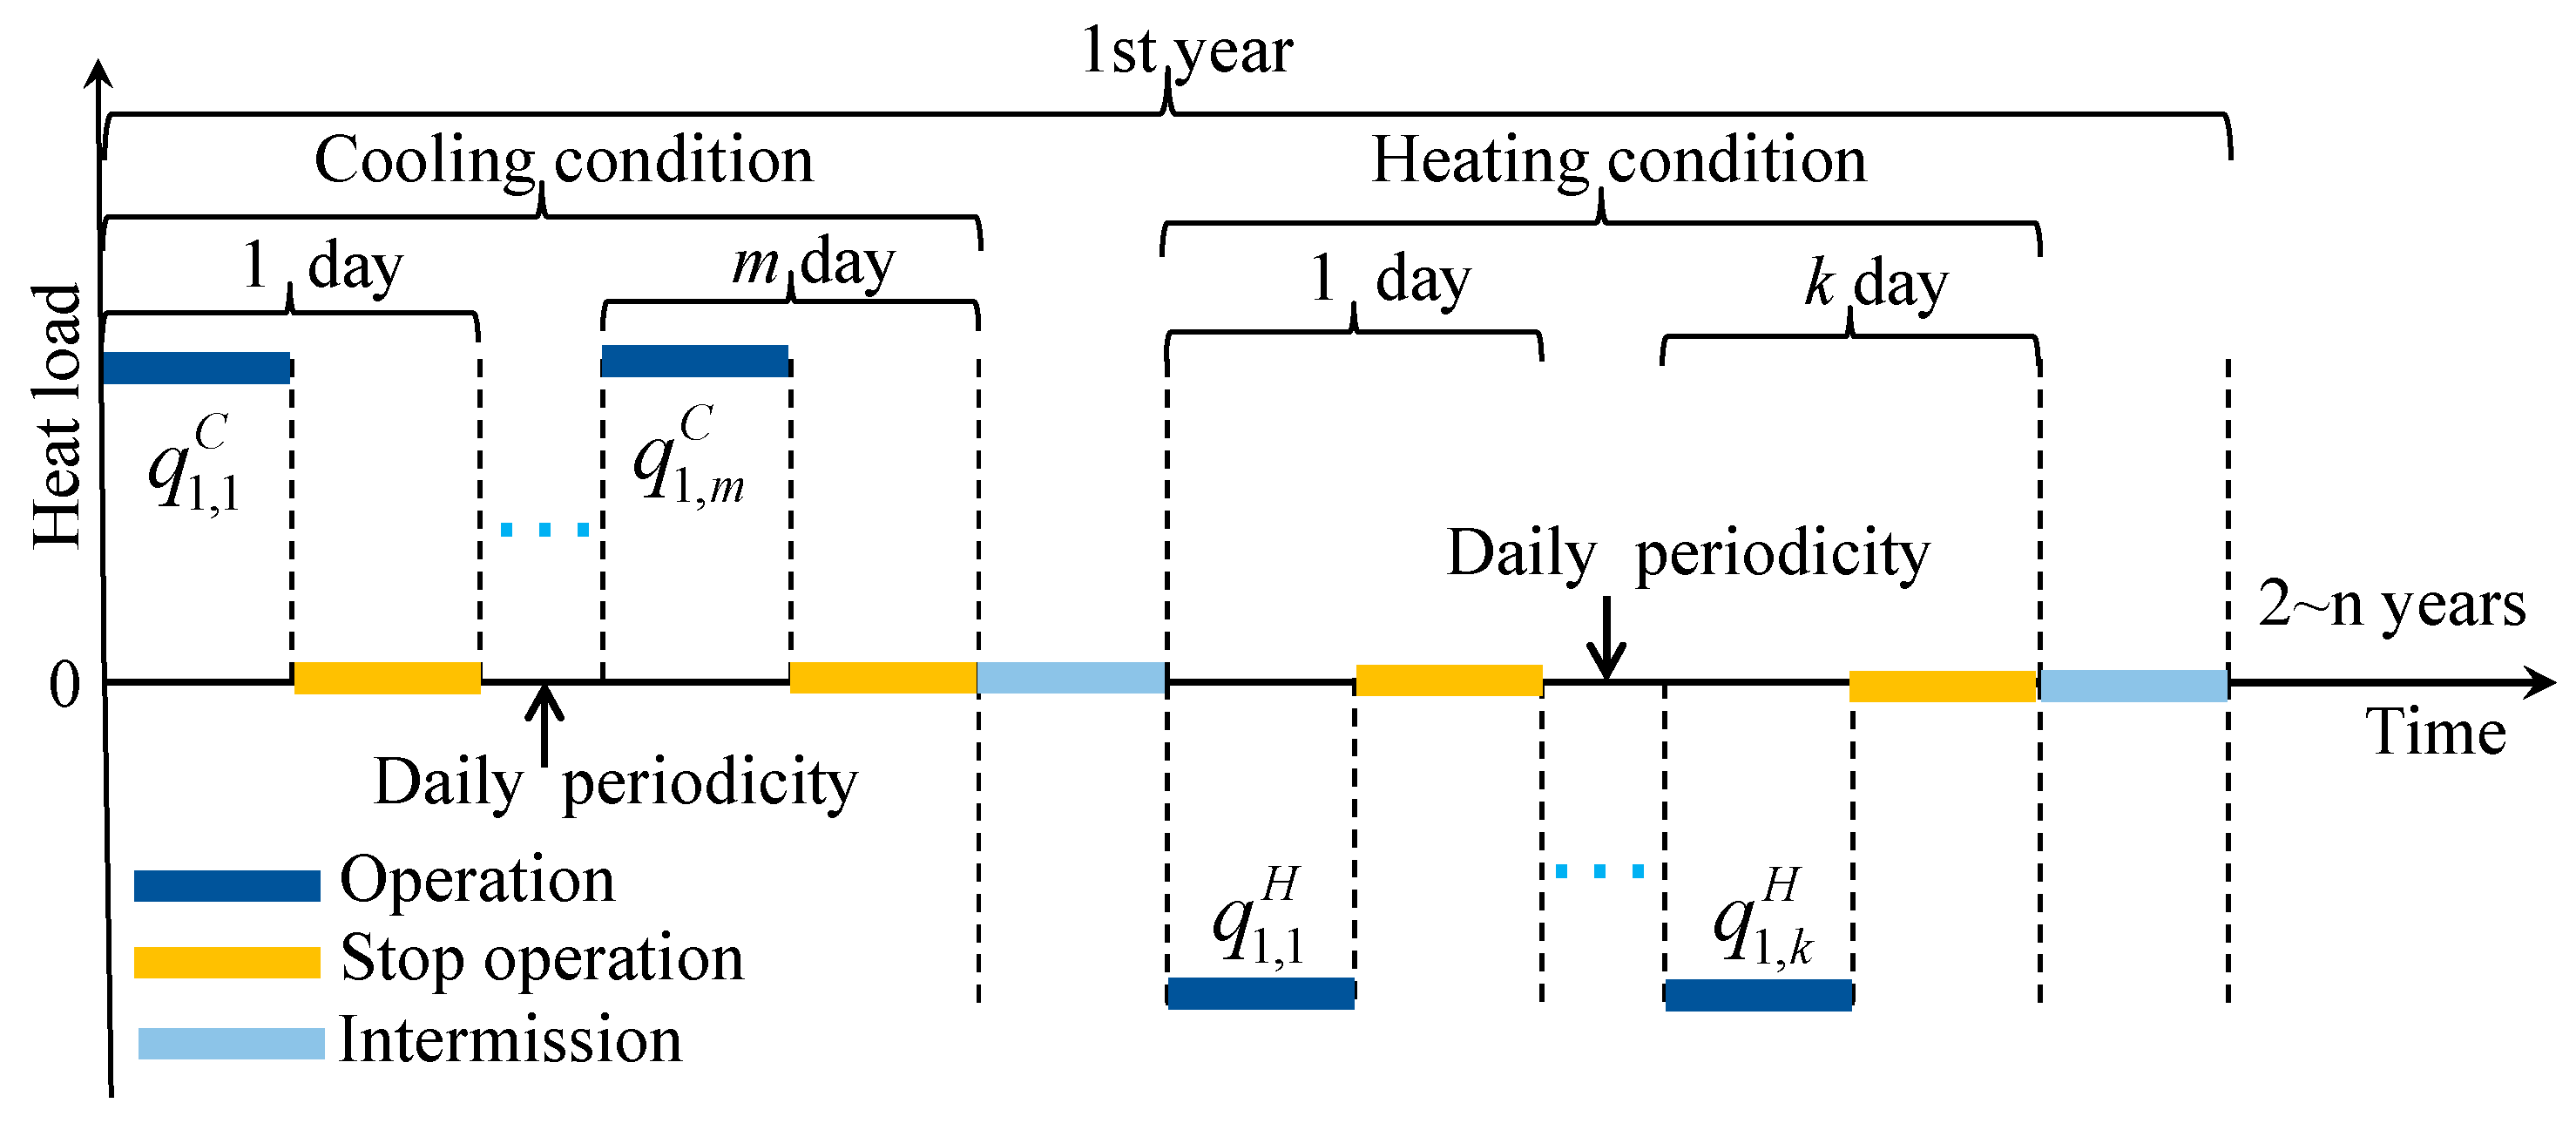
3.1.1. The Temperature Field Evolution under Typical Intermittent Condition
3.1.2. The Temperature Field Evolution under Typical Heating Load and Cooling Load Imbalance Condition
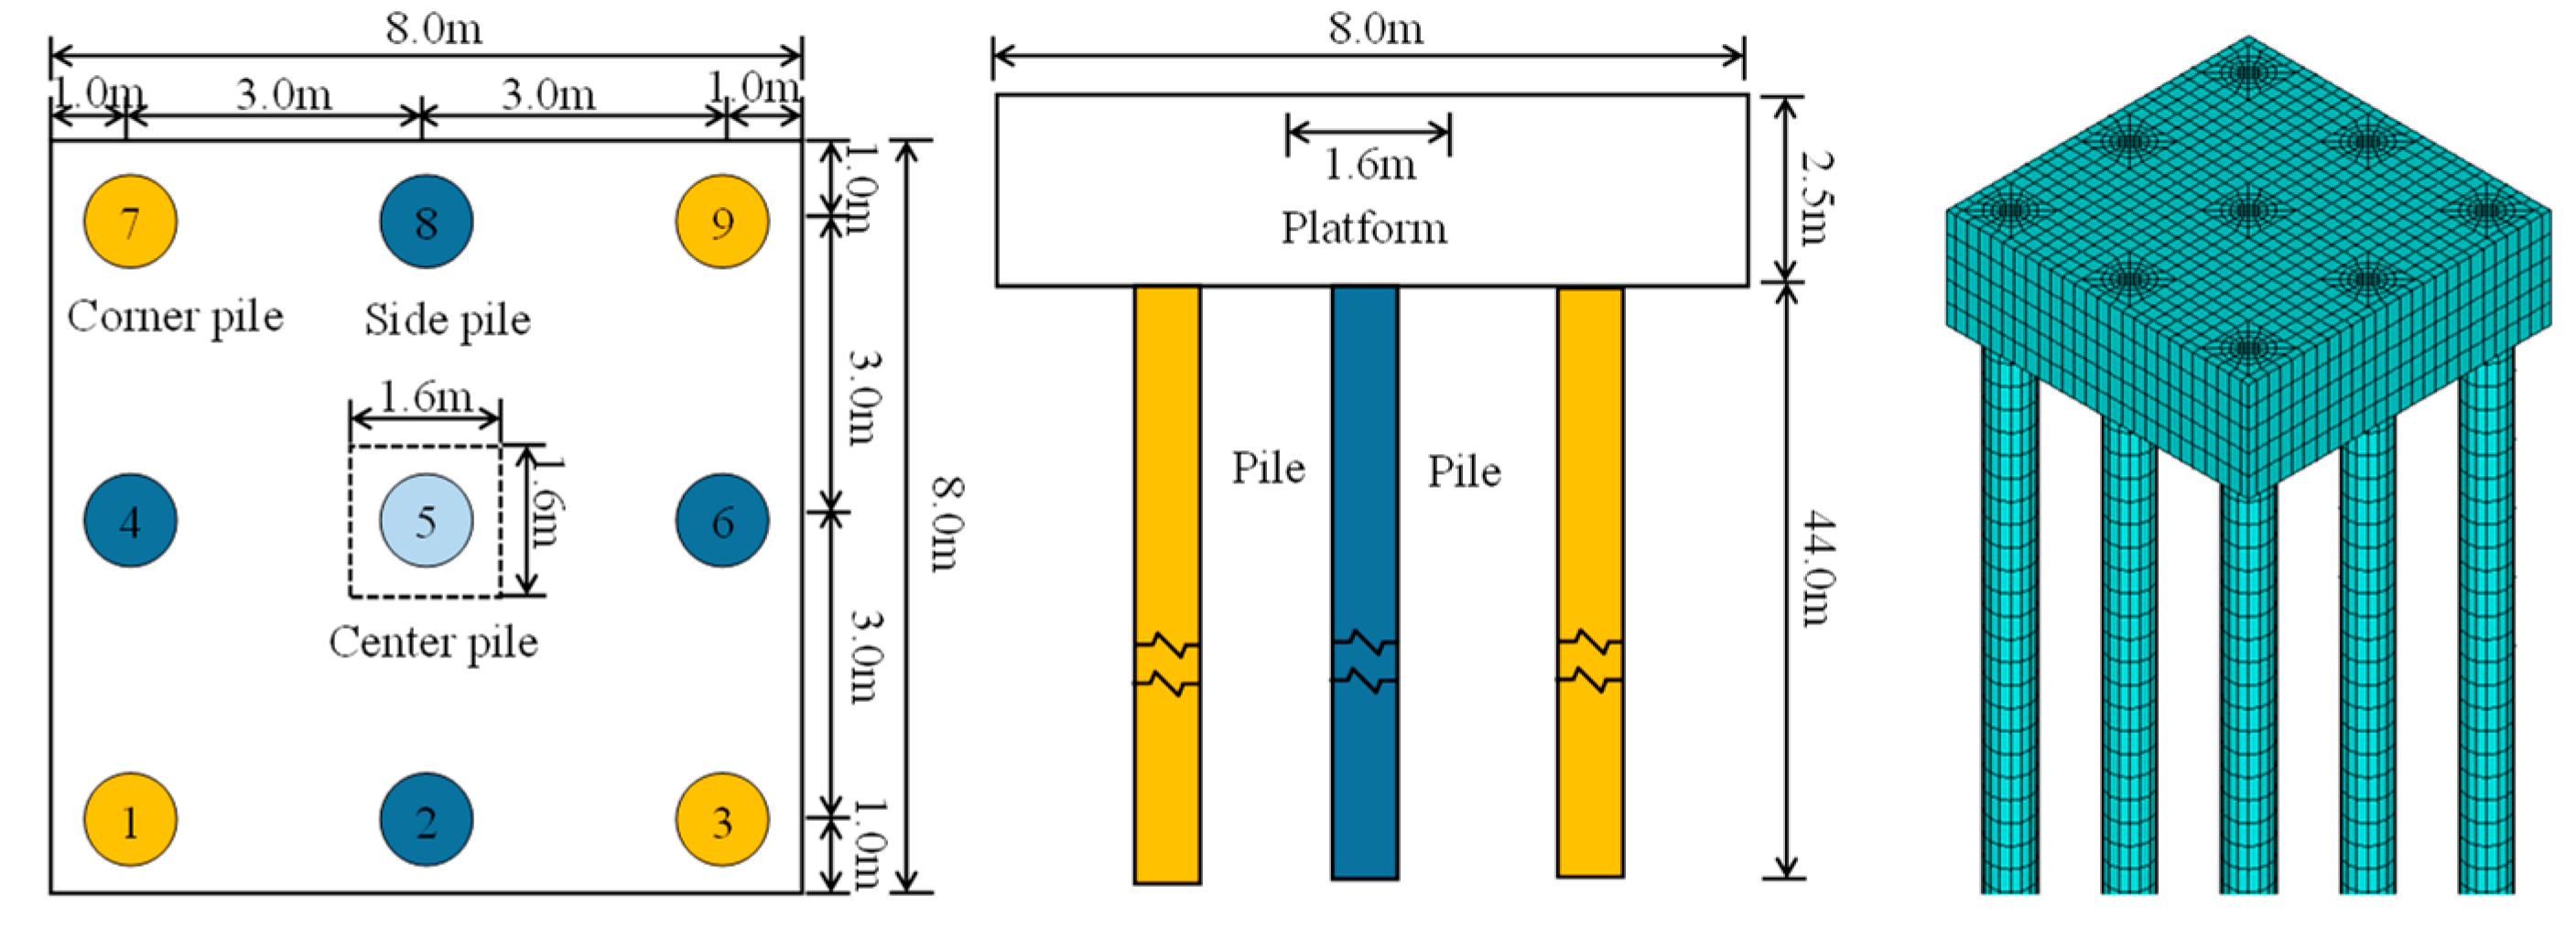
3.2. Thermomechanical Behavior of Energy Pile Group under Vertical Load
3.3. Influence of Layout on Thermomechanical Behavior of Energy Pile Group
4. Conclusions
- (1)
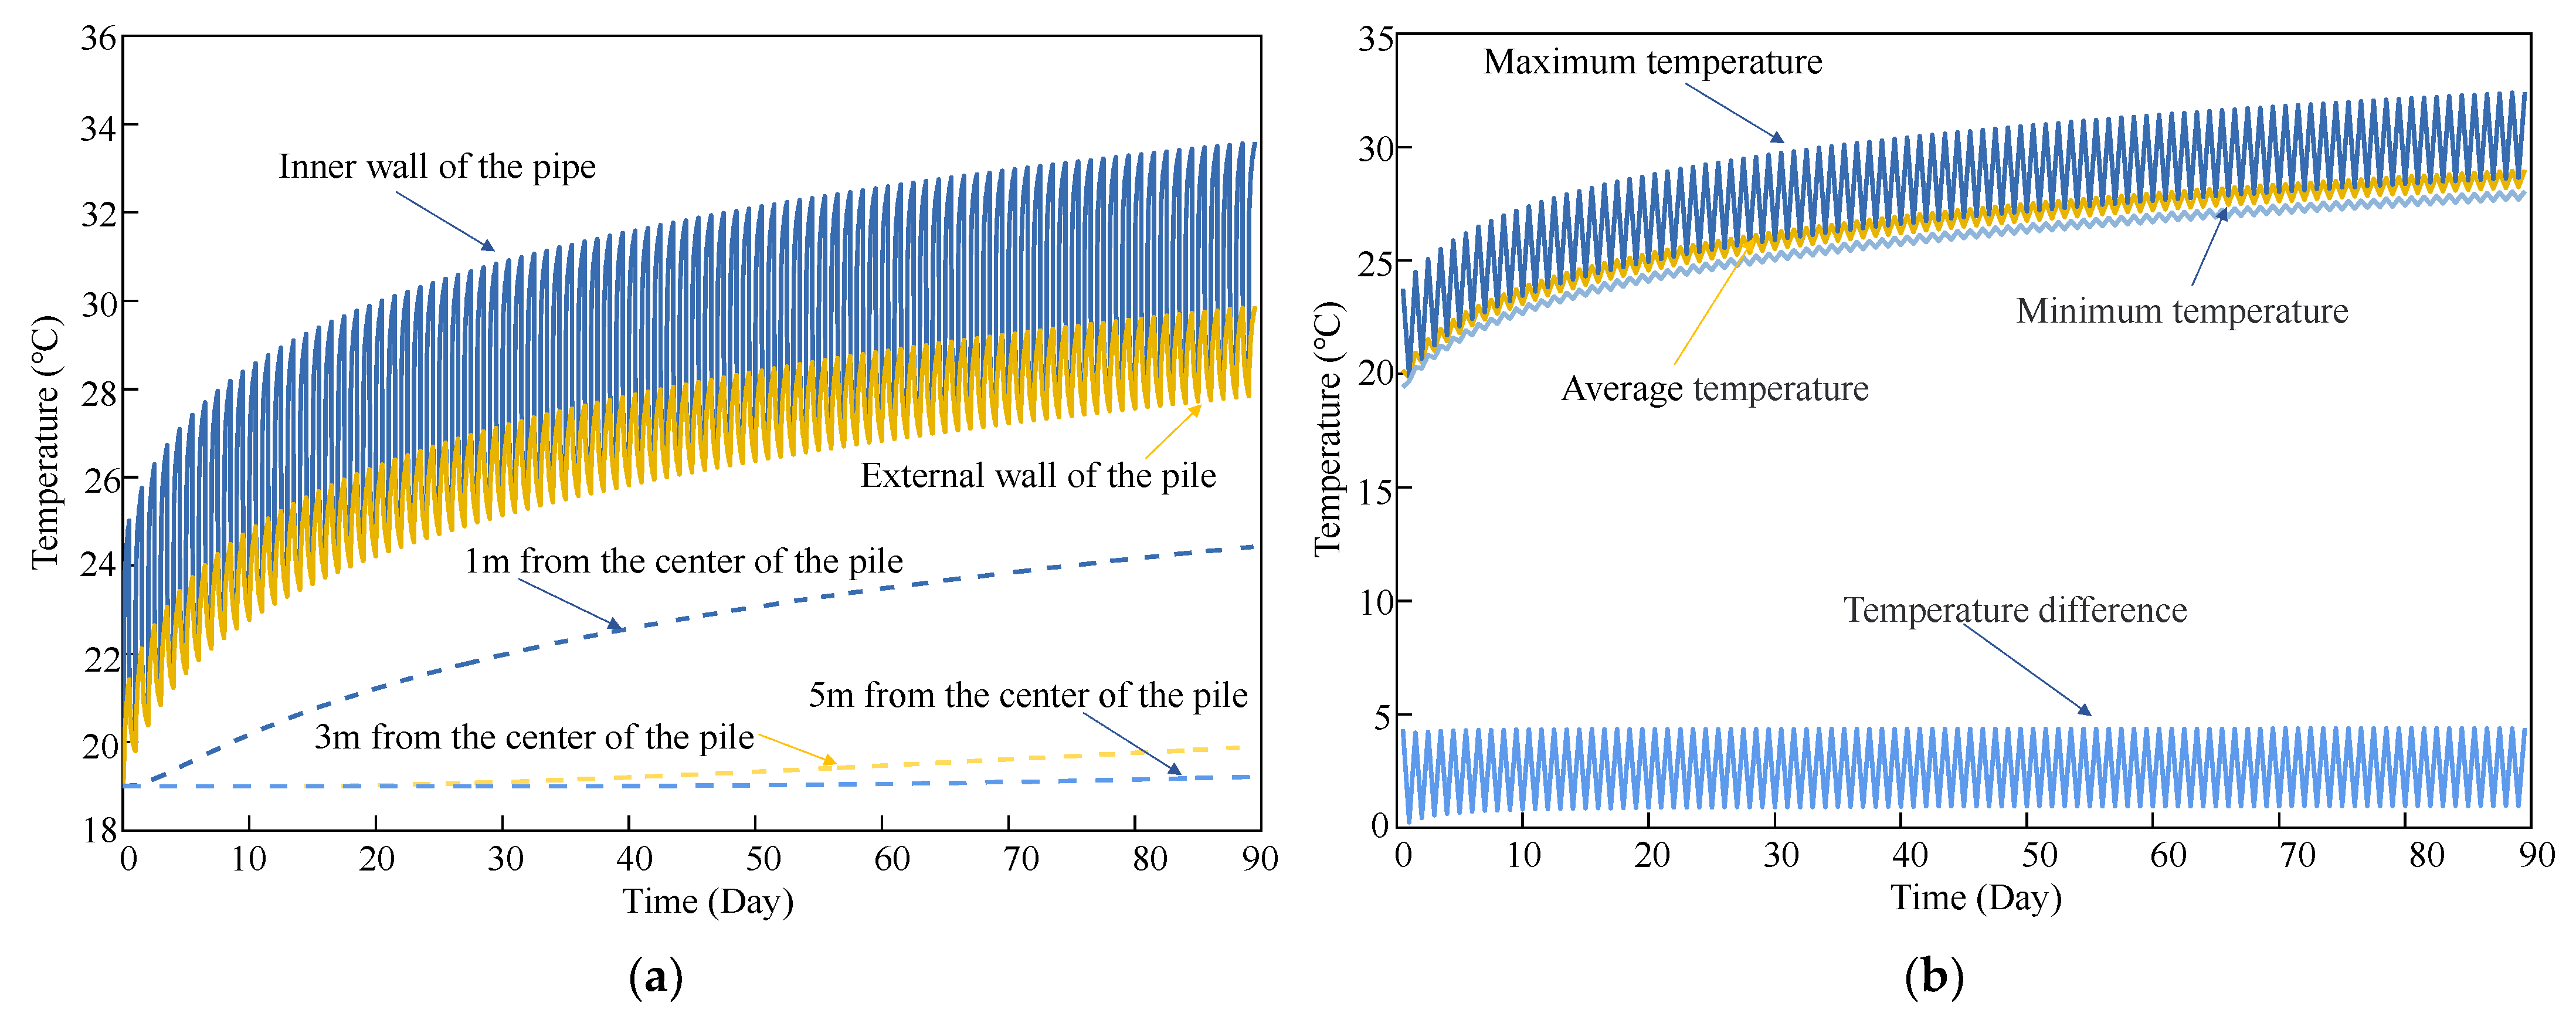
- Under typical intermittent operation conditions, the temperature of the energy pile and surrounding ground near the heat exchange pipe varies periodically. The closer the distance to the heat exchange pipe, the greater the temperature gradient and the more sensitive to the change in heating load. When the distance from the center of the pile exceeds 1 m, the characteristics of intermittent operation can no longer be reflected;
- (2)
- For areas with unbalanced cold and heating load, long-term operation of energy piles leads to thermal accumulation, and the maximum temperature of energy piles occurs in the first daily cycle. The cooling and heating load should be leveled by an auxiliary cold source (cooling tower) or auxiliary heat source (solar collector), thus controlling the fluctuation of ground temperature within a reasonable temperature range;
- (3)
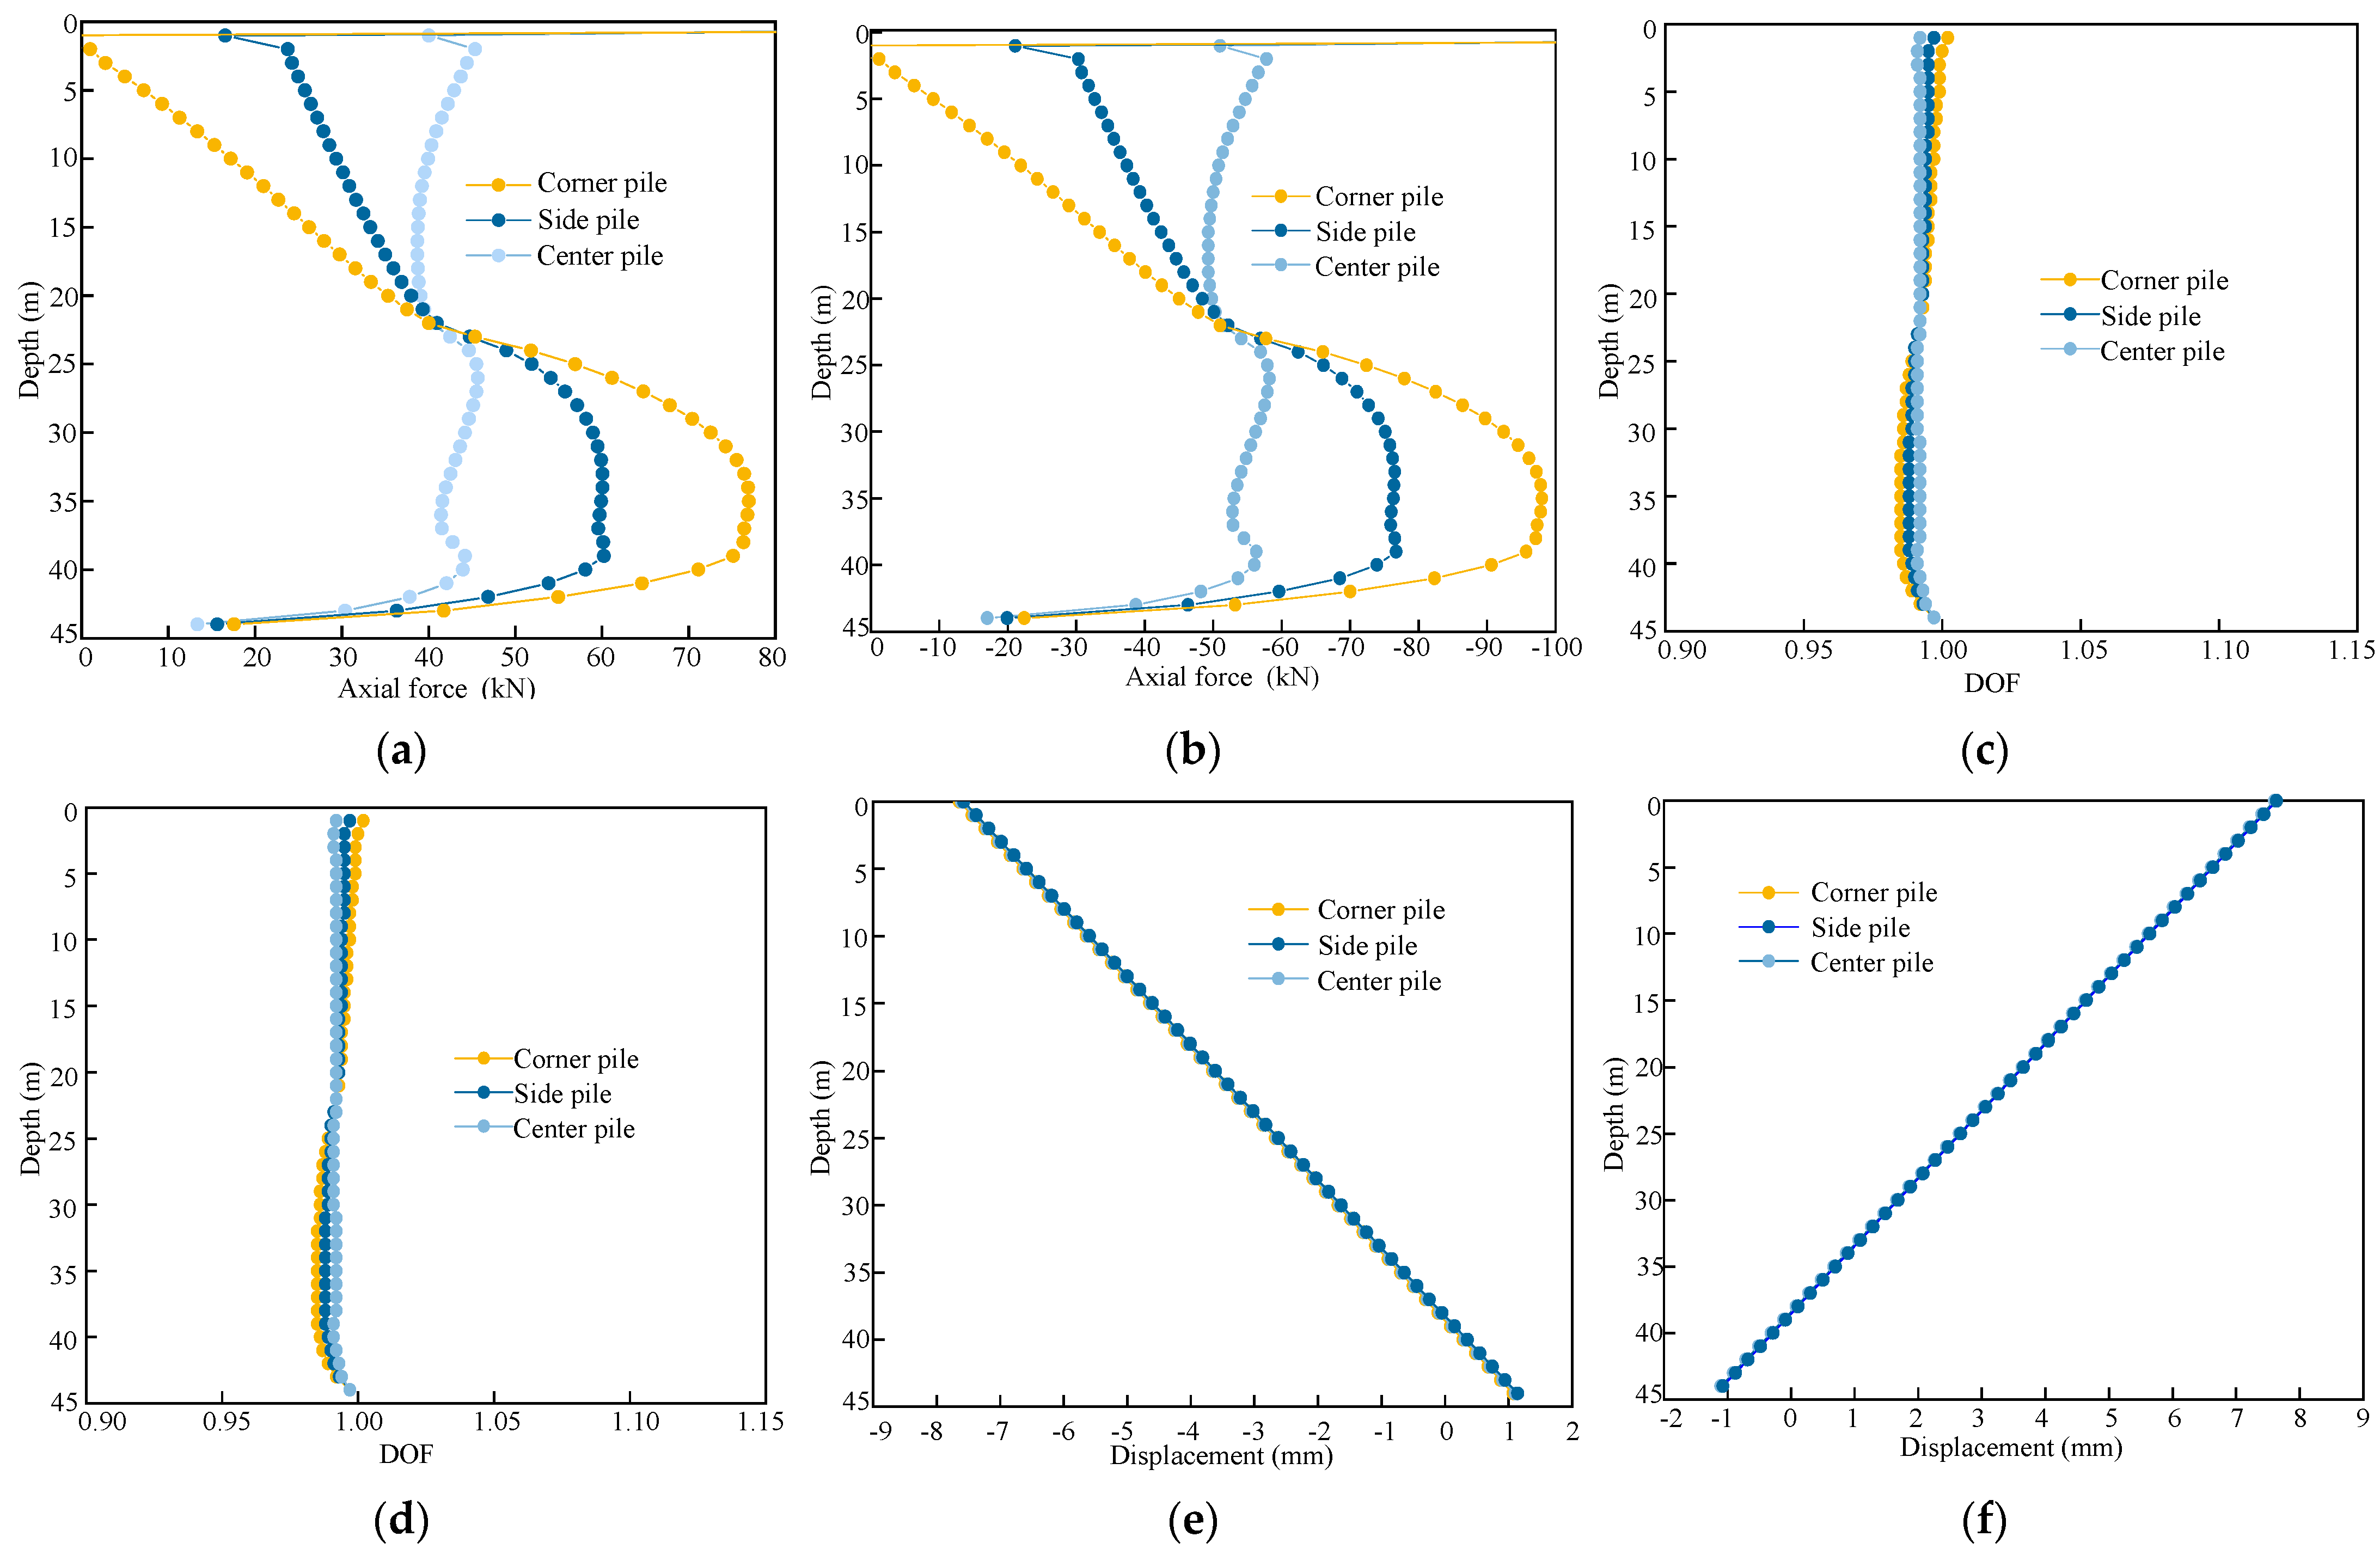
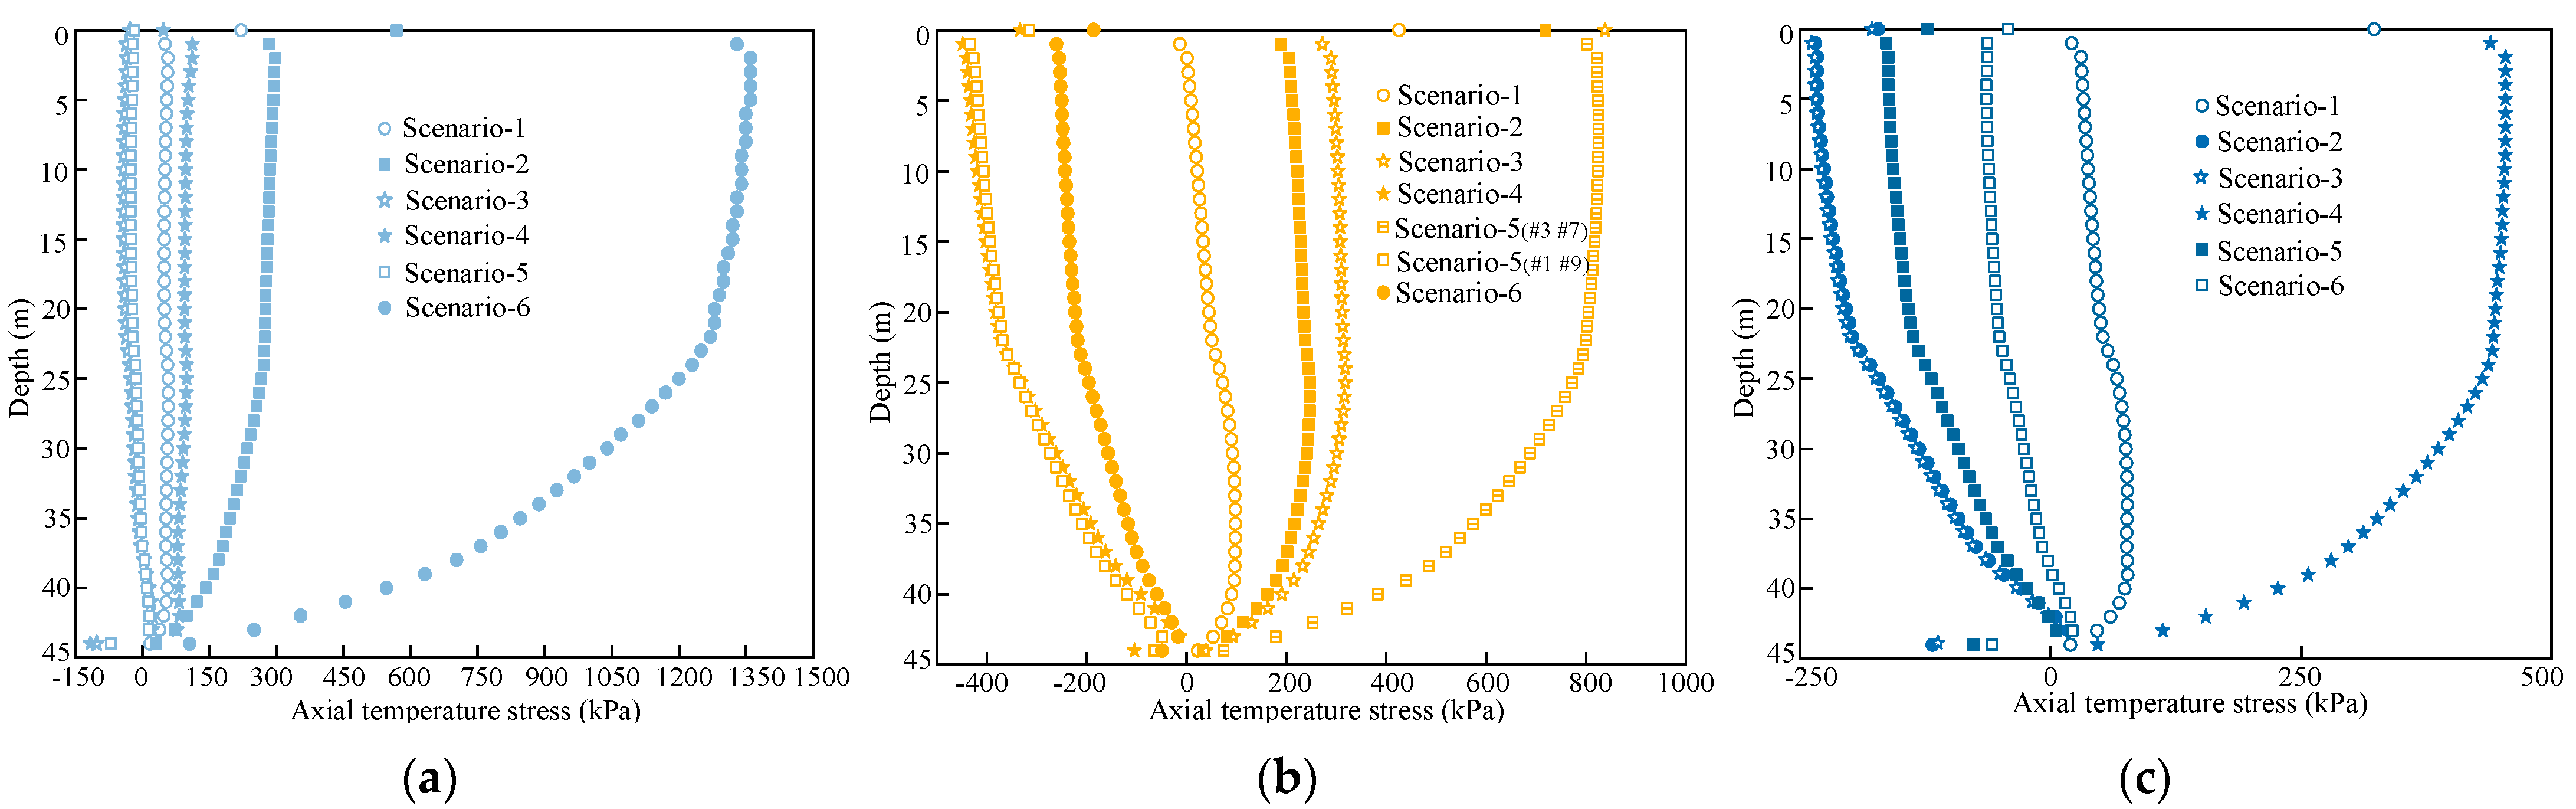
- When the pile group is all energy piles, the DOF at the pile top is the highest, and the pile top load at different positions decreases in the order of corner pile > side pile > center pile. In summer/winter working conditions, the increase/decrease in pile temperature induces axial compression/tensile stress. The axial temperature stress induced at the top of the center pile and the bottom of the corner pile is the largest. In addition, the DOF of each pile varies in the range of 0.985~1, and the constraints between piles are very small;
- (4)
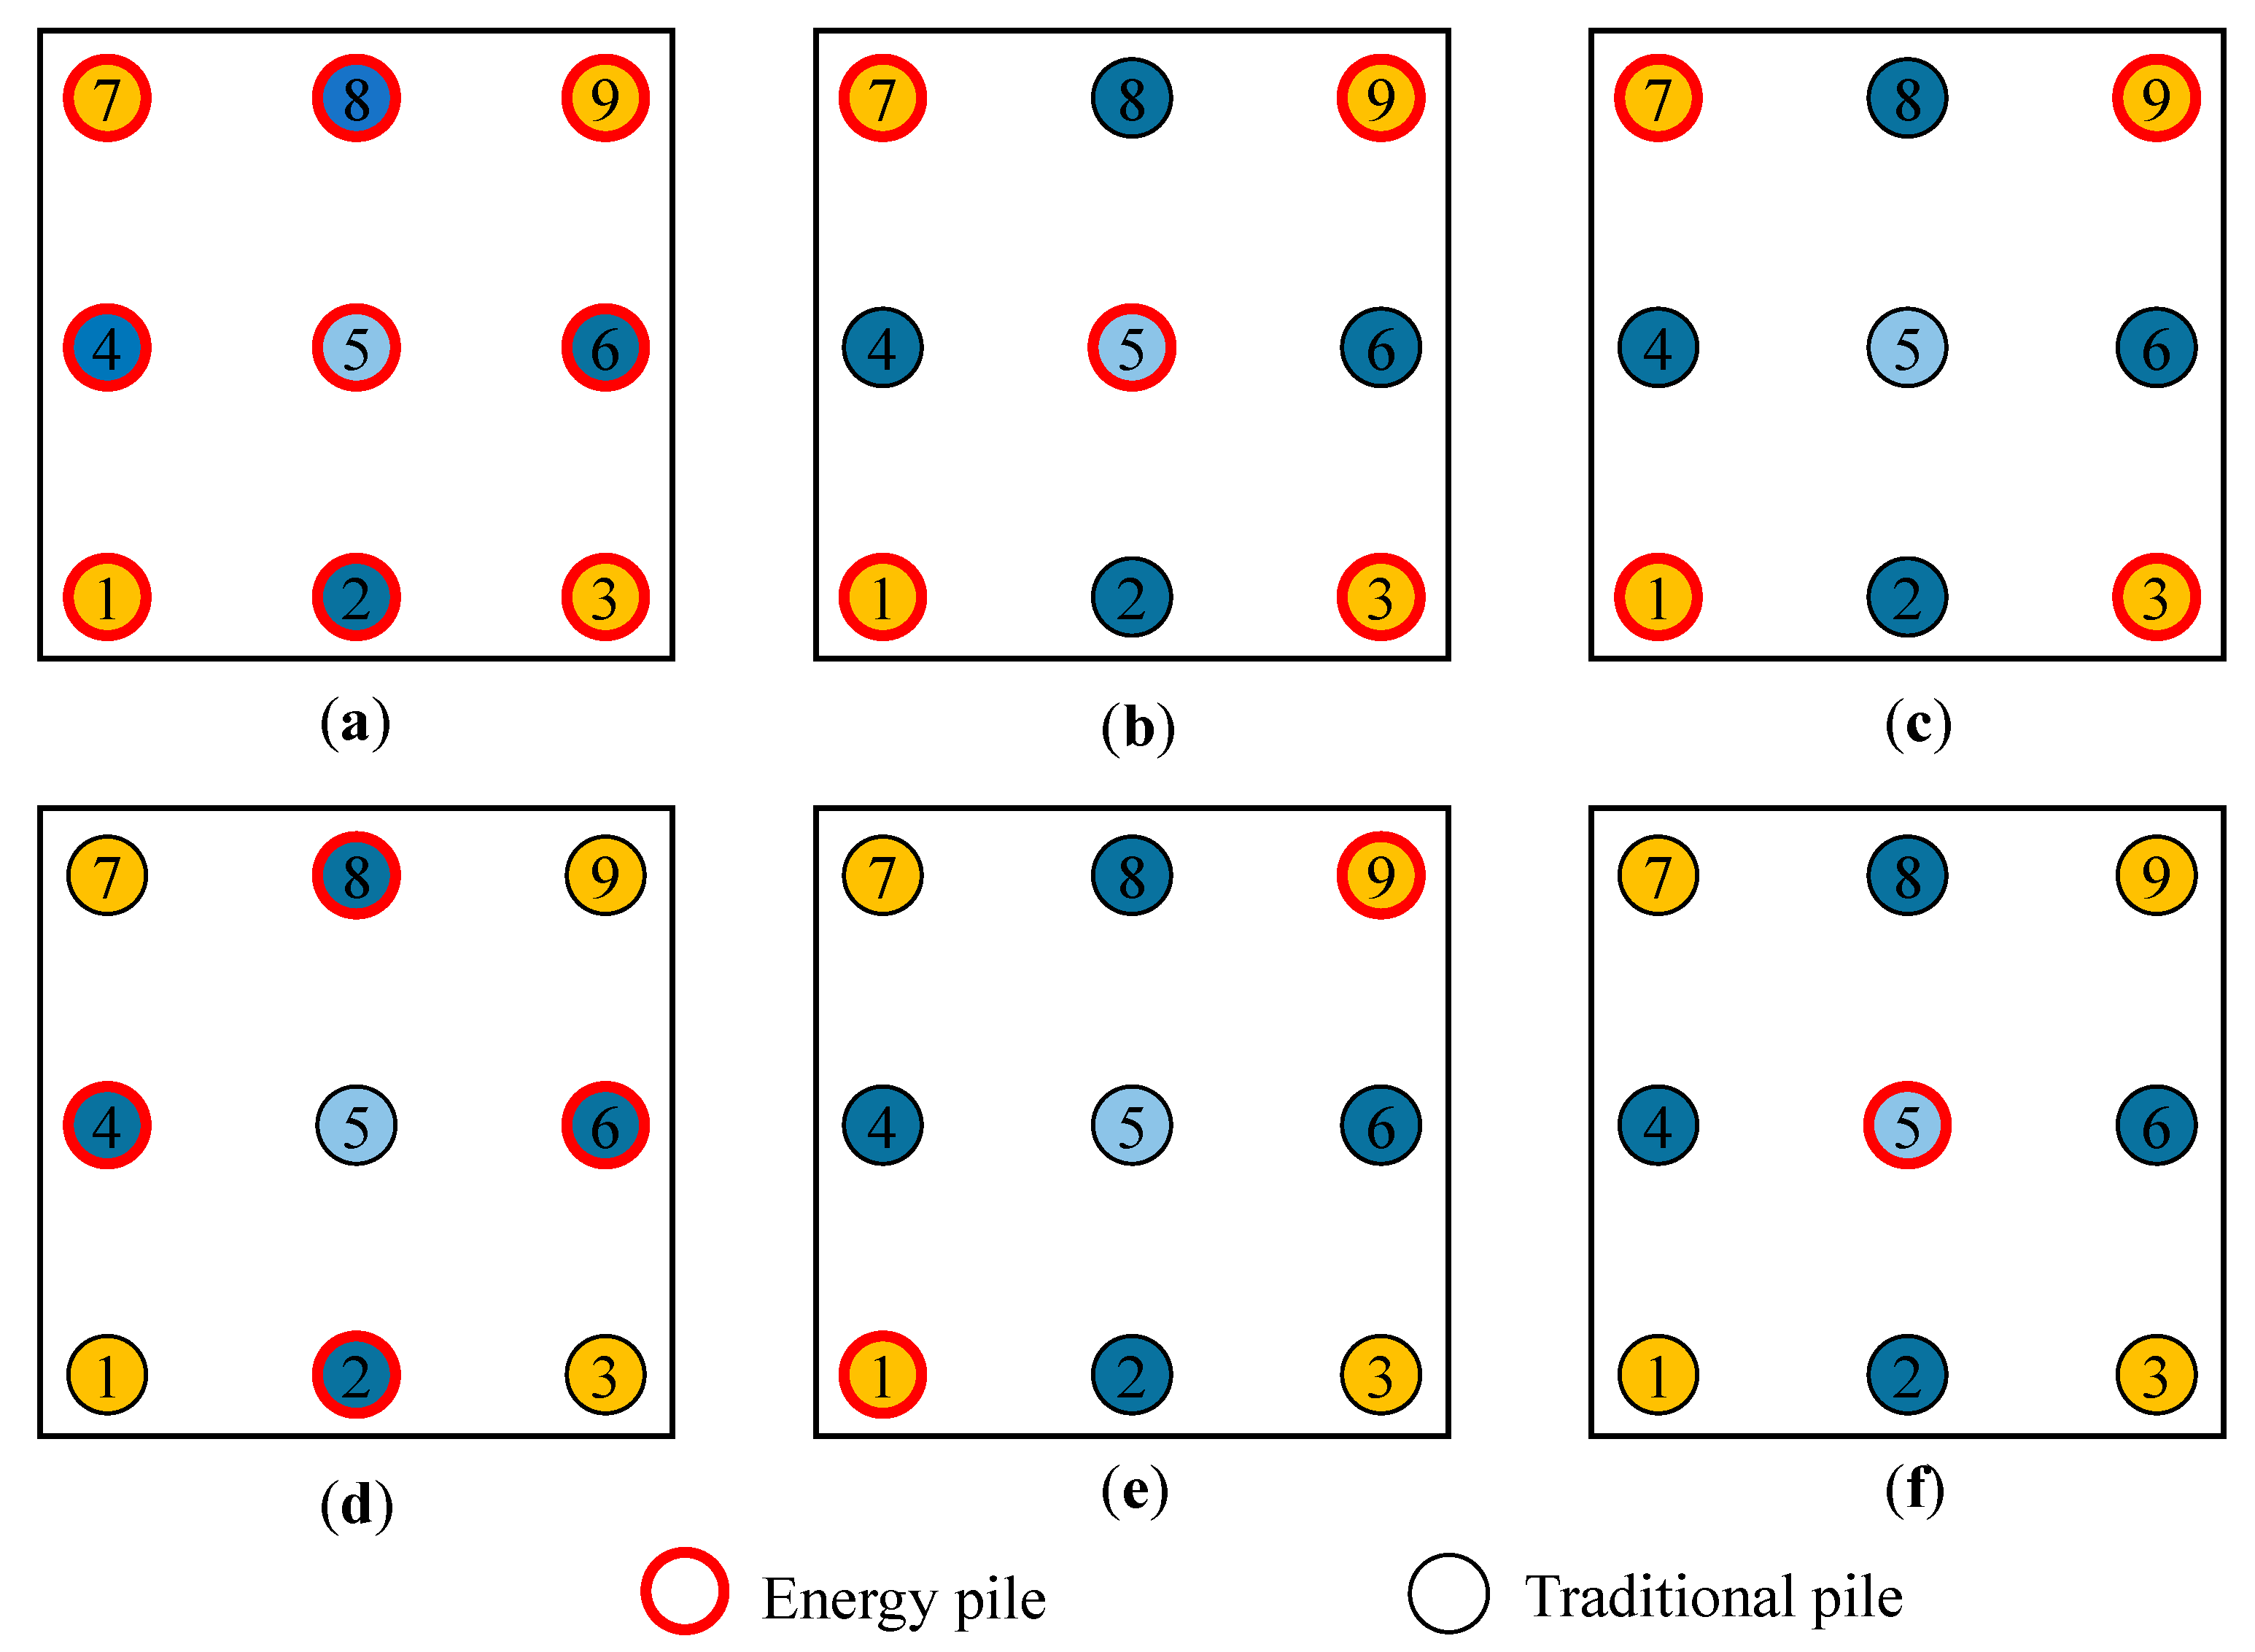
- When the pile group is partially used as the energy pile, the non-energy pile acts as the “anchor pile”, and it generates the added tensile stress. Decreased number of energy piles generates lower DOF of center piles and induces higher temperature stress. The stress induced by the corner pile does not destroy the pile or reduce its durability. Moreover, due to the constraint of the platform, the bending moment of piles at different positions is different, and the temperature stress increases with the increase in pile spacing.
Author Contributions
Funding
Institutional Review Board Statement
Informed Consent Statement
Data Availability Statement
Conflicts of Interest
References
- Charfeddine, L.; Kahia, M. Do information and communication technology and renewable energy use matter for carbon dioxide emissions reduction? Evidence from the Middle East and North Africa region. J. Clean. Prod. 2021, 327, 129410. [Google Scholar] [CrossRef]
- Wood, C.J.; Liu, H.; Riffat, S.B. An investigation of the heat pump performance and ground temperature of a piled foundation heat exchanger system for a residential building. Energy 2010, 35, 4932–4940. [Google Scholar] [CrossRef]
- Brandl, H. Energy foundations and other thermo-active ground structures. Géotechnique 2006, 56, 81–122. [Google Scholar] [CrossRef]
- Olgun, C.G.; Ozudogru, T.Y.; Abdelaziz, S.L.; Senol, A. Long-term performance of heat exchanger piles. Acta Geotech. 2015, 10, 553–569. [Google Scholar] [CrossRef]
- Dupray, F.; Laloui, L.; Kazangba, A. Numerical analysis of seasonal heat storage in an energy pile foundation. Comput. Geotech. 2014, 55, 67–77. [Google Scholar] [CrossRef]
- Bozis, D.; Papakostas, K.; Kyriakis, N. On the evaluation of design parameters effects on the heat transfer efficiency of energy piles. Energy Build. 2011, 43, 1020–1029. [Google Scholar] [CrossRef]
- Gao, J.; Zhang, X.; Liu, J.; Li, K.; Yang, J. Numerical and experimental assessment of thermal performance of vertical energy piles: An application. Appl. Energy 2008, 85, 901–910. [Google Scholar] [CrossRef]
- Sutman, M.; Brettmann, T.; Olgun, C.G. Full-scale in-situ tests on energy piles: Head and base-restraining effects on the structural behaviour of three energy piles. Geomech. Energy Environ. 2019, 18, 56–68. [Google Scholar] [CrossRef]
- Liu, H.; Wang, C.; Kong, G.; Bouazza, A. Ultimate bearing capacity of energy piles in dry and saturated sand. Acta Geotech. 2019, 14, 869–879. [Google Scholar] [CrossRef]
- Yazdani, S.; Helwany, S.; Olgun, G. Investigation of Thermal Loading Effects on Shaft Resistance of Energy Pile Using Laboratory-Scale Model. J. Geotech. Geoenviron. Eng. 2019, 145, 04019043. [Google Scholar] [CrossRef]
- Huang, G.; Liao, Z.; Li, S. A novel independent heat extraction-release double helix energy pile: Numerical and experimental investigations of heat extraction effect. Energy Convers. Manag. 2022, 254, 115249. [Google Scholar] [CrossRef]
- Loria, A.F.R.; Gunawan, A.; Shi, C.; Laloui, L.; Ng, C.W.W. Numerical modelling of energy piles in saturated sand subjected to thermo-mechanical loads. Geomech. Energy Environ. 2015, 1, 1–15. [Google Scholar] [CrossRef]
- Bandos, T.; Campos, L.; López-González, L.; Sala-Lizarraga, J. Finite cylinder-source model for energy pile heat exchangers: Effects of thermal storage and vertical temperature variations. Energy 2014, 78, 639–648. [Google Scholar] [CrossRef]
- Park, S.; Lee, D.; Choi, H.J.; Jung, K.; Choi, H. Relative constructability and thermal performance of cast-in-place concrete energy pile: Coil-type GHEX (ground heat exchanger). Energy 2015, 81, 56–66. [Google Scholar] [CrossRef]
- Park, S.; Sung, C.; Jung, K.; Sohn, B.; Chauchois, A.; Choi, H. Constructability and heat exchange efficiency of large diameter cast-in-place energy piles with various configurations of heat exchange pipe. Appl. Therm. Eng. 2015, 90, 1061–1071. [Google Scholar] [CrossRef]
- Yang, W.; Lu, P.; Chen, Y. Laboratory investigations of the thermal performance of an energy pile with spiral coil ground heat exchanger. Energy Build. 2016, 128, 491–502. [Google Scholar] [CrossRef]
- Zhang, D.; Gao, P.; Zhou, Y.; Wang, Y.; Zhou, G. An experimental and numerical investigation on temperature profile of underground soil in the process of heat storage. Renew. Energy 2020, 148, 1–21. [Google Scholar] [CrossRef]
- Yavari, N.; Tang, A.M.; Pereira, J.M.; Hassen, G. Experimental study on the mechanical behaviour of a heat exchanger pile using physical modelling. Acta Geotech. 2014, 9, 385–398. [Google Scholar] [CrossRef]
- Knellwolf, C.; Peron, H.; Laloui, L. Geotechnical Analysis of Heat Exchanger Piles. J. Geotech. Geoenviron. Eng. 2011, 137, 890–902. [Google Scholar] [CrossRef]
- Ozudogru, T.Y.; Ghasemi-Fare, O.; Olgun, C.G.; Basu, P. Numerical Modeling of Vertical Geothermal Heat Exchangers Using Finite Difference and Finite Element Techniques. Geotech. Geol. Eng. 2015, 33, 291–306. [Google Scholar] [CrossRef]
- Park, H.; Lee, S.R.; Yoon, S.; Shin, H.; Lee, D.S. Case study of heat transfer behavior of helical ground heat exchanger. Energy Build. 2012, 53, 137–144. [Google Scholar] [CrossRef]
- Gashti, E.H.N.; Malaska, M.; Kujala, K. Evaluation of thermo-mechanical behaviour of composite energy piles during heating/cooling operations. Eng. Struct. 2014, 75, 363–373. [Google Scholar] [CrossRef]
- Olgun, G.; Ozudogru, T.; Arson, C. Thermo-mechanical radial expansion of heat exchanger piles and possible effects on contact pressures at pile-soil interface. Geotech. Lett. 2014, 4, 170–178. [Google Scholar] [CrossRef]
- Ghasemi-Fare, O.; Basu, P. A practical heat transfer model for geothermal piles. Energy Build. 2013, 66, 470–479. [Google Scholar] [CrossRef]
- Cui, P.; Li, X.; Man, Y.; Fang, Z. Heat transfer analysis of pile geothermal heat exchangers with spiral coils. Appl. Energy 2011, 88, 4113–4119. [Google Scholar] [CrossRef]
- Castelli, F.; Maugeri, M. Simplified Nonlinear Analysis for Settlement Prediction of Pile Groups. J. Geotech. Geoenviron. Eng. 2002, 128, 76–84. [Google Scholar] [CrossRef]
- Han, X.; Zhang, N. In-situ tests on load transfer mechanism of group piled foundation in Beijing. Chin. J. Geotech. Eng. 2005, 27, 74–80. [Google Scholar]
- Li, M.; Zhou, C.; Rao, Z. Hourly 50-year simulations of ground-coupled heat pumps using high-resolution analytical models. Energy Convers. Manag. 2019, 193, 15–24. [Google Scholar] [CrossRef]
- Ma, W.; Kim, M.K.; Hao, J. Numerical Simulation Modeling of a GSHP and WSHP System for an Office Building in the Hot Summer and Cold Winter Region of China: A Case Study in Suzhou. Sustainability 2019, 11, 3282. [Google Scholar] [CrossRef]
- Perego, R.; Guandalini, R.; Fumagalli, L.; Aghib, F.S.; de Biase, L.; Bonomi, T. Sustainability evaluation of a medium scale GSHP system in a layered alluvial setting using 3D modeling suite. Geothermics 2016, 59, 14–26. [Google Scholar] [CrossRef]
- Li, H.; Nagano, K.; Lai, Y.; Shibata, K.; Fujii, H. Evaluating the performance of a large borehole ground source heat pump for greenhouses in northern Japan. Energy 2013, 63, 387–399. [Google Scholar] [CrossRef]
- Tarnawski, V.R.; Leong, W.H.; Momose, T.; Hamada, Y. Analysis of ground source heat pumps with horizontal ground heat exchangers for northern Japan. Renew. Energy 2009, 34, 127–134. [Google Scholar] [CrossRef]
- Man, Y.; Yang, H.; Wang, J.; Fang, Z. In situ operation performance test of ground coupled heat pump system for cooling and heating provision in temperate zone. Appl. Energy 2012, 97, 913–920. [Google Scholar] [CrossRef]
- Abuel-Naga, H.; Raouf, M.I.N.; Raouf, A.M.I.; Nasser, A.G. Energy piles: Current state of knowledge and design challenges. Environ. Geotech. 2015, 2, 195–210. [Google Scholar]


Publisher’s Note: MDPI stays neutral with regard to jurisdictional claims in published maps and institutional affiliations. |
© 2022 by the authors. Licensee MDPI, Basel, Switzerland. This article is an open access article distributed under the terms and conditions of the Creative Commons Attribution (CC BY) license (https://creativecommons.org/licenses/by/4.0/).
Share and Cite
Zhao, P.; Li, X.; Hu, L.; Wu, Y.; Zhang, C. A Finite Element Model for Investigating Unsteady-State Temperature Distribution and Thermomechanical Behavior of Underground Energy Piles. Appl. Sci. 2022, 12, 8401. https://doi.org/10.3390/app12178401
Zhao P, Li X, Hu L, Wu Y, Zhang C. A Finite Element Model for Investigating Unsteady-State Temperature Distribution and Thermomechanical Behavior of Underground Energy Piles. Applied Sciences. 2022; 12(17):8401. https://doi.org/10.3390/app12178401
Chicago/Turabian StyleZhao, Peng, Xiaozhao Li, Lihua Hu, Yun Wu, and Chenyang Zhang. 2022. "A Finite Element Model for Investigating Unsteady-State Temperature Distribution and Thermomechanical Behavior of Underground Energy Piles" Applied Sciences 12, no. 17: 8401. https://doi.org/10.3390/app12178401
APA StyleZhao, P., Li, X., Hu, L., Wu, Y., & Zhang, C. (2022). A Finite Element Model for Investigating Unsteady-State Temperature Distribution and Thermomechanical Behavior of Underground Energy Piles. Applied Sciences, 12(17), 8401. https://doi.org/10.3390/app12178401