Abstract
In this work, a group of mechanisms are exposed to provide quality of experience in flying ad hoc networks using a swarm of drones in a natural disaster service. End-to-end video traffic was analyzed. The metrics used to experimentally measure QoE/QoS are: delay, jitter and packet loss. The experience quality was evaluated before the disaster (C00), at the moment (B00) and after the disaster (I00). The methodology used to perform the design was experimental, and the NS simulator was used to evaluate the behavior of the swarm of drones connected through a flying ad hoc network. To perform data analysis, treatment and repetitions related to video traffic, the response surface methodology (MSR) was used, which is a set of mathematical techniques in order to optimize the obtained responses. The composite core design (DCC) was also used as it was the best fit to our experiment due to its flexibility. Since the quality of the experience was evaluated at three moments, the quality of services was also analyzed with three metrics. The main contributions of the research are a mathematical model of the quality of the experience based on the quality of the service; an experiment design using the end-to-end NS simulator; a methodology for the mathematical and statistical analysis of the data obtained; an algorithm that allows, from service quality metrics, to obtain the quality of the experience for end-to-end video traffic; and a proposal for future work for data analysis in a physical environment and applied to the environmental sector.
1. Introduction
According to Cisco estimates, in 2021, video traffic was subject to exponential growth rates corresponding to 82% of all consumer IP Internet traffic. This equals a million minutes of video traffic crossing global IP networks every second [1]. However, factors associated to network parameters, such as jitter, delay, packet loss [2], network capacity, unstable bandwidth, diverse terminals, user attributes and user interest in content can deteriorate the user experience. This user experience defines the end user’s perception of a service and is known as Quality of Experience. The term QoE is described by ITU-T in Recommendation P.10/100 [3] as follows: “a user’s degree of delight or annoyance in using an application or service”.
In [4], the authors proposed two methods—subjective and objective—to assess QoE. The authors in [5] proposed a classification scheme, where the objective methods are known as Instrumental Quality Models; these models are those that obtain information directly from the video package or stream [6]. Objective and subjective methods have been commonly used to assess QoE. Below, we provide an explanation of the main features of each method.
Subjective methods employ user surveys, whereby individuals evaluate a service in a real environment, answering a questionnaire that reflects the characteristics of the service, providing the supplier with a quantitative indicator of QoE for the evaluated service. Users evaluate several aspects of the service using a discrete scale (5—Excellent, 4—Good, 3—Fair, 2—Poor and 1—Bad), and the mean opinion score (MOS) is used as the metric for each aspect [7]. ITU-R and ITU-T have several recommendations for performing subjective video assessments, including methodologies for subjective assessment tests, criteria for observer selection, assessment procedures and data analysis methods.
Such recommendations are addressed in BT.500-13 [8], ITU-R BS.775-1, ITU-R BS.1286 [9] and ITU-T P.910 [10]. Objective methods are designed to overcome disadvantages inherent in the use of subjective methods; i.e., the cost and time involved in applying the surveys. The objective approach is based on mathematical (algorithms) and/or comparative techniques that generate a quantitative measure of video quality to analyze the presence of impairments, such as jerkiness, frame skips, freezes and tiling. Objective methods are classified into eight categories [6]:
- 1.
- Reference-based classification method. This is based on the need to analyze the original signal to obtain the QoE measure for the video. It features three categories:
- a.
- Full Reference (FR) Model: Models in this category measure the degradation or impairments in a video stream, comparing the video received to the original video [11].
- b.
- Reduced Reference (RR) Model: Models in this category analyze the video stream using only an explicit reference or certain key parameters of the original video to compare with the video received [12].
- c.
- No Reference (NR) Model: These models do not require a reference video stream and analyze only the received video stream, seeking indications that reflect impairments in transmission [13].
- 2.
- Image-based classification method. Models in this category analyze the visual video information through two approaches:
- a.
- The psychophysical approach, based on characterizing the mechanisms of the human visual system (HVS), such as contrast sensitivity, adaptation to color and illumination and masking effect [14].
- b.
- The engineering approach, based on analysis and extraction of distortion patterns and compression artefacts [15].
- 3.
- Input-data-based classification method. This is based on the information obtained from level 3 and 4 headers and features five methods [16].
- 4.
- Media-layer models, whose input is the media signal [17].
- 5.
- Parametric packet-layer model, whose input is the packet-header information [18].
- 6.
- Parametric planning model, whose input are the quality-design parameters [19].
- 7.
- Bit stream layer model, whose input are the packet-header and pay- load information [20].
- 8.
- Hybrid model, a combination of any of the other models [21].
In [22], the authors propose an approach based on objective methods known as instrumental QoE models. With this approach, the model obtained uses QoS parameters, subjective data or certain other model outputs to obtain a score that represents the user QoE. This approach is effective because it predicts the QoE perceived by users in live transmissions, without the requirement for user subjective tests [23].
Each of the methods presented has its advantages and disadvantages. For example, subjective methods have become a standard in testing the performance of the different types of the proposed models; however, their implementation is expensive in terms of resources and time [24]. However, objective methods require high processing power, and a few of them are not implemented in commercial software.
On the other hand, the proposals for evaluating QoE based on instrumental QoE models present advantages over approaches using subjective and objective methods [25]. Evaluating QoE combines nontechnical parameters, such as user perception, experience and expectations with the technical parameters of network QoS [26].
The remainder of the paper is organized as follows: Section 2 presents related works. Section 3 describes the formulation of the models. Section 4 describes the experiment designed to obtain the necessary data to create our models. Section 5 describes our analysis of the data obtained and our proposed models. Section 6 provides an analysis of the performance evaluation of our proposed models. Section 7 presents and analysis of the results. In Section 8, the algorithm to achieve quality is explained. In Section 9, we present future trends. Finally, our conclusions and future work are discussed in Section 10 and Section 11.
2. Related Works
Our proposed models are based on the measurement of three QoS parameters: Delay, Jitter and Packet Loss. We selected these parameters because they exert the largest influence on video quality [27]. QoE is measured using an objective method: Video Quality Metric (VQM). We selected VQM because it is a standardized model, which extracts data from the original and received videos. It was adopted by ANSI (ANSI TI.801.03-2003) and was included in ITU-TJ.144 and ITU-R BT.1883 [28] and is widely used by the scientific community for validation and comparison of new proposed models. Further details about VQM are available in [29]. The next section explains the mathematical form of our proposal to further explain the experimental design used to obtain the proposed models.
3. Mathematical Formulation of Our Proposed Models
Our goal is to propose three models to evaluate QoE. Three types of video were reviewed: one slow, one fast and one moderately slow; and a model was proposed for each type of video according to the spatio-temporal characteristics. We require the values of the factors (QoS parameters) that enable the procurement of a response (QoE associated to video). The selection of the type of mathematical model influences the experimental design and the number of treatments to be performed in order to obtain the model.
The most effective experimental design type is the Methodology of Surfaces of Response (MSR). MSR is defined as a set of mathematical and statistical techniques used for solving problems where a response of interest (video QoE) is influenced by several quantitative factors (QoS parameters) [30]. Using laboratory tests, the ranges of the parameters that affect the quality of the video were defined, and based on those ranges, we obtained a second-order hierarchical model for each type of video [6]. A system is stable when it only depends on the QoS parameters that are measured on the network—that is, it does not depend on subjective parameters that can vary the results. The behavior of this type of model is more stable, thus, allowing an exploration of the surface it represents. In addition, it allows no significant terms to remain in the model to achieve hierarchy.
The models are represented by Equation (1), where Xi and the coefficients represent the factors (QoS parameters: Delay, Jitter and Packet loss), βi represents the regression coefficients, and Y represents the response of interest (QoE) and ε is the random error. The entire detailed mathematical process is presented in [7]:
To estimate the coefficients (βi) in Equation (1), we use the least squares method. Suppose n > k runs are available and let Xij denote the jth value of factor Xi. The run data is shown in Table 1. This estimation procedure requires the random error component to have E(ε) = 0 and V(ε) = σ2 and {ε} to be uncorrelated [31].

Table 1.
Data for the model shown in Equation (1).
Model Equation (1) is written in terms of the data presented in Table 1 as follows:
The least-squares method selects the β coefficients in Equation (2) so that the sum of squares of the errors (εi) is minimized.
Thus, the least-squares function is defined as Equation (3).
Simplifying this, we obtain a system of k + 1 simultaneous equations, and the solution of such a system is the set of least-squares estimators, βj. It is more convenient to solve this system by using a matrix form. Thus, the model illustrated in Equation (2) is expressed in matrix form as:
where
The least squares estimator vector, β, is obtained by minimizing Equation (7), now expressed in matrix form:
S can be expressed as follows in Equation (8):
From Equation (8), the least-squares estimators must satisfy
This implies that
To solve Equation (10) in terms of both its sides are multiplied by the inverse X′X. Thus, the least squares estimator of β is
The adjusted model is, therefore, expressed as
In scalar form, the adjusted model is expressed as
Starting from the values obtained in Equation (13), we can express the model in Equation (1) as
Hence, in the model proposed in Equation (14), let X1 = Delay, X2 = Jitter and X3 = Packet Loss. For more convenient readability and interpretation, let D = Delay = X1, J = Jitter = X2 and PL = Packet Loss = X3. This yields Equation (15) and, after the β value replacement, Equation (16):
The model in Equation (16) is a second order model, featuring interactions of the three QoS parameters, which can be used to obtain the QoE associated with a certain video by identifying the value of its three QoS parameters [32].
Considering the type of models that will be obtained, the next section explains the experimental design to obtain them. Models are proposed depending on the video’s degree of motion (low, medium or high).
4. Experiment Design
In this section, we describe the testbed, the source videos, the selected experiment design, the execution of the data collection experiment and the values of the β constants associated with each proposed model.
The simulation (particularly in a free simulator) offers a guide to the mathematical model and methodology. This is why it is not considered relevant if the drone configuration is for microdrones or large devices. Low-cost elements are used in a swarm of drones, the most important consideration in the model was the swarm mission. The range of factors used to define the values for each execution; those values were obtained through lab tests with the aim of receiving a degraded video on the client’s side.
4.1. Simulation
The NS simulator, an open source and free application, was used in the experiment. This is a very popular network-level tool for academic work. It can be found at: https://ns3-code.com/ns3-download/ (accessed on 21 March 2022). As mentioned above, our proposed models are based on instrumental QoE models, which use three QoS parameters related to the measurement of QoE. QoE is in turn measured using an objective method, VQM [33].
We used end-to-end testing, featuring a VLC video server (source node) and VLC client (destination node [34]) and a scenario made up using drone swarms. It includes elements related to the swarm characteristics, control unit devices and managing the information and data obtained on each of the missions (See Figure 1).
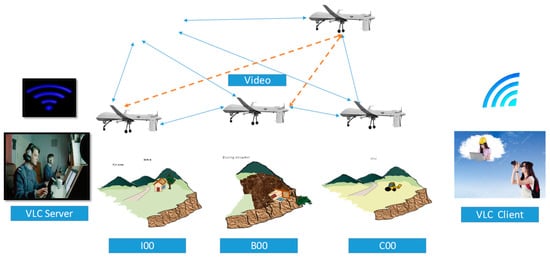
Figure 1.
Flying ad hoc networks and an environmental natural disaster.
If we consider the swarm element, the swarm drones (five drones) have the following characteristics: they are dust resistant and waterproof; they have a longer battery life for longer flights; each drone weighs 250 gr and has an HD camera system with a resolution of 1080 × 720 pixels and 180-degree sensor coverage; they can reach a maximum height of 80 m and a maximum speed of 20 m/s; and they have 60 min of absolute flight autonomy and all around-terrain coverage of 40 m. As for the control unit, each swarm has been designed to fulfil a specific flight mission (Environment), which has to be previously programed directly from the control unit.
Each control unit contains algorithms inspired by pre-existing nature swarms, (known as bio-inspired), leading to correct mission development and to improve the collective intelligence of each swarm. In terms of nature-based algorithms, we used both genetic and particle optimization-types. The type of mission examined in this paper focuses on the identification natural disasters (fires, landslides, floods etc.) in forest and jungle areas; access to hard-to-reach zones and the monitoring of identified areas.
In terms of managing the data obtained, this mission makes it possible to establish a medium level of scalability, the usual mash-up between the cloud and the distributed architecture. On the other hand, this swarm has a loading and unloading station that makes it possible to increase its general level of autonomy to over an hour [35]. We selected this configuration in order to provide end-to-end quality of service in flying ad hoc networks (VLC video server to VLC client)—in our case, source to destination [36].
To select the videos, we considered the following measures; these measures are important to provide quality of experience (QoE):
- Spatial Information (SI) is a measure of the amount of spatial detail in the image. This is generally higher for complex scenes, i.e., scenes with more objects or borders in a frame sequence yield higher SI values [37].
- Temporal Information (TI) is a measure of the amount of temporal changes in a video sequence. In general, TI is higher for high movement sequences [38].
We defined the following ranges for using each model with its respective type of video: (a) Low motion—SI: [30, 40], TI: [5, 10]; (b) Medium motion—SI: [60, 70], TI: [5, 10]; and (c) High Motion—SI: [50, 60], TI: [15, 2]. These were empirically obtained from a systematic review of the 14 databases.
Table 2 presents the VQM-to-MOS conversion table obtained for our case. The values for each rank depend on the spatial–temporal characteristics of the video.
Table 2.
Ranges for each type of video.
Figure 2 presents a screenshot of the video clips recorded, together with a motion classification (Low/Medium/High).
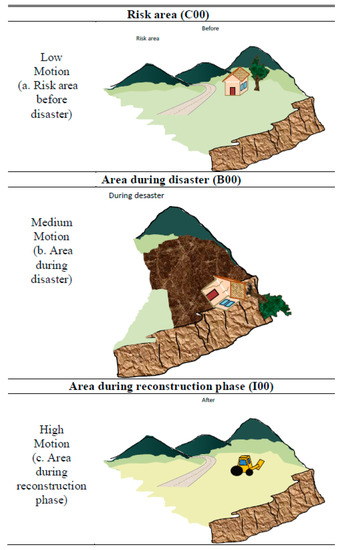
Figure 2.
Environmental natural disaster-type videos.
We define the videos in order to provide QoE as follows:
4.2. Experiment
In such experiments, we considered the following elements: (a) factors (QoS parameters), (b) response (QoE associated with the video), (c) sample size and (d) number of tests. The type of experimental design that satisfies the requirements is a response surface methodology (RSM). To determine the type and number of videos (runs) to be performed, a central composite design (CCD) with three factors with an alpha (α) equal to two was selected. The alpha value was selected so that the QoS values for each video were integers that could speed up the configuration of test.
The CCD is a factorial or fractioned factorial design with three types of points (factorial portion, axial points and central points) [39]. These elements must be related to the quality of services (QoS) parameters used in CCD, such as the delay, jitter and packet loss as these are the parameters that most affect the quality of video [40].
4.3. Experiment Execution
The procedure for executing the experiment was as follows:
- For each execution, we configured the QoS parameters according to the values obtained in the CCD. For example, the QoS parameter configuration was as follows: delay: 325 ms, jitter: 0.0045 ms and packet loss: 0.0045%.
- Once the QoS parameters were set, we transmitted the video from the VLC server (source node) to the VLC client (destination node). The video was stored in the VLC client’s cloud [41]. This was in order to perform the QoE measurement using VQM.
- The QoE of the transmitted video was measured using the MSU Video Quality Measurement Tool. Following this, we compared the quality of the received video in the destination node with that of the original video (source node) using a VQM algorithm. This process can be repeated for the “N” executions of each video, and the entire experiment was repeated at least twice [42].
The values configured to perform the simulation are presented in Table 3.
Table 3.
Simulation data for streaming video on FANET using a drone.
5. Variance Analysis
We performed a statistical analysis (Variance Analysis) and generated the response surface using [43]. A significance level of 0.05 (Alpha (α) = 0.05) was used for the statistical analysis of the data; we defined this value in order for the test to be rigorous in the statistical perspective.
Table 4 shows the model obtained for each video. The rows present the coefficients associated with each term in the model, the factors exhibiting statistical influence and the calculated R-squared value for each model. These illustrate that the factor exhibiting statistical influence on the three videos is packet loss, which is one of the most critical factors when transmitting video.
Table 4.
Summary of the results for each model. “Factor” presents each factor with its constant. “Model” presents the value of each constant for each model.
Table 4 also shows the constants associated with each term in the proposed models, including terms that exhibited a statistically low contribution to each model. Terms with a low contribution were not removed from the final model in order to retain the initially calculated R-squared value. This establishes that each model explained the variability of its data with a confidence level of close to 80% [44].
We do not propose a single model to evaluate QoE, as other types of constants need to be introduced to the model. Such constants are necessary to maintain the model’s R-squared value at a high level, and, in some cases, the calculated constants are based on the videos used to generate the data, or on the conditions of the user environment. With the models proposed in Table 4, it is not necessary to consider external variables (screen size, type of service, variables calculated with subjective tests etc.), which means that the model can be applied online only by obtaining the values of the QoS parameters (delay, jitter and packet loss) from the video stream.
The QoE value yielded by our proposed models is within the VQM scale and must, therefore, be converted to a MOS rank for convenient interpretation of the obtained results. The conversion is performed using the Video Quality Assessment Mapping (VQAMap) procedure discussed in [40], which makes it possible to map an arbitrary scale to a MOS rank.
Figure 3 summarizes the methodology used for model generation. The graph on the left shows the inputs for our proposal; the QoS factors are shown on the x-axis, and the objective method to assess video QoE (VQM) on the y-axis. Thus, we decided to use RSM (Response Surface Methodology) together with CCD (Central Composite Design) to define the experiment to produce the data. RSM yielded a second-order model (Equation (1)), and CCD defined that “N” executions will be performed on each video. Each execution features a four-value vector: Delay, Jitter, Packet Loss and QoE value measured through VQM (QoE_VQM). These vectors were used to create the models (See Table 4, Equation (14)). The proposed models output QoE in the VQM scale; therefore, the VQM-to-MOS scale block maps the VQM value obtained from our models to its MOS equivalent using VQAMap.
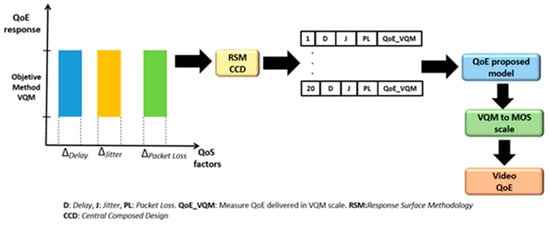
Figure 3.
The methodology for generating the proposed QoE/QoS models.
We provide a flow chart at the end the next section to explain the process followed to obtain the models described in Figure 3.
6. Methodology for QoE/QoS Models
The Video Quality Expert Group (VQEG) proposed a plan of tests to validate the performance of the different models proposed [45]. This plan allows a performance evaluation taking three factors into account: the (i) Prediction Accuracy; (ii) Prediction Monotonicity and (iii) Prediction Consistency [46]. The process followed for each aspect compares the results obtained from the proposed model to data obtained from subjective tests.
- Prediction Accuracy is expressed by the Pearson linear correlation coefficient (PLCC) and root mean square error (RMSE). PLCC can assume values between −1 and +1; values closer to either −1 or +1 indicate higher accuracy. −1 implies a completely negative correlation, zero implies an absence of correlation, and one implies a completely positive correlation [47]. The root mean square error (RMSE) is calculated based on quality estimation errors (i.e., the observed values and modelled values). It can assume values between zero and five; a value closer to zero indicates higher accuracy.
- Prediction Monotonicity is expressed by the Spearman rank order correlation coefficient (SROCC) (also known as Rho of Spearman), which assesses the monotonic relation between two variables. In a monotonic relation, the variables tend to change simultaneously, albeit not necessarily in a constant, linear or logarithmic manner. The Spearman coefficient is calculated based on the data pair X, Y, and its value lies in [−1, 1]; here, −1 signifies that X can be represented as a declining/diminishing monotonic function of Y, and one signifies that X can be represented as an increasing monotonic function of Y [48].
- Prediction Consistency is expressed by the Outlier Ratio (OR), which is defined as the percentage of the number of predictions that lie outside ± 2 standard deviations of the results of the subjective tests. If N is the total number of data and N′ is the number of atypical values, the percentage of atypical values is obtained by OR = N′/N. OR values lie between zero and one; zero implies the highest consistency [49].
In our tests, each observer assessed a total of 70 videos (six test sequences, four sequences without distortion and sixty distorted sequences). We used the absolute classification with hidden reference (ACR-HR of recommendation ITU-T P.910) method to assess the video sequences, with a quality scale of nine levels. The video assessment was conducted in order to satisfy the requirements of Recommendation ITU-R BT.500-13. The lighting conditions and television screen were calibrated using an X-rite Color Munki Display A 32-inch Samsung (UN32D6000) television set with a native 1080 p resolution. The distance between the screen and observer was three times the height of the image [50].
The model did not consider the sequences used to train the observers nor the post-processing of the subjective scoring system. The results for all the evaluated videos were recorded in a database, and the assessments obtained were processed to obtain the score associated with each video. Table 5 presents the results obtained by comparing the responses of the three proposed models with the subjective test results.
Table 5.
The results of the performance tests for the proposed models.
7. Discussion
Our analysis of the results revealed the following: the model with the lowest fidelity was the C00 model; the results of PLCC and SROCC indicated a weak positive correlation, where the OR was zero and the RMSE was 0.4546. The model with the highest fidelity was the B00 model; PLCC and SROCC indicated a strong positive correlation, and the OR was 0.066%, which is very low.
The results for each model were mapped to a MOS rank using Table 2. We show only Figure 4 (B00 model) as this is the model with the highest level of movement and the one with the highest PLCC. In this model, the delay was set to a constant value of 400 ms (according to rec. 1541 [51]), and the other two parameters were randomly set. Figure 4 illustrates that packet loss influences the model; for packet losses higher than 0.1%, the MOS began to reduce to three. For this type of video, packet loss exerts a large influence on QoE owing to the high level of movement. Therefore, only the very low packet loss values (below 0.05%) yielded MOS measurements higher than four.
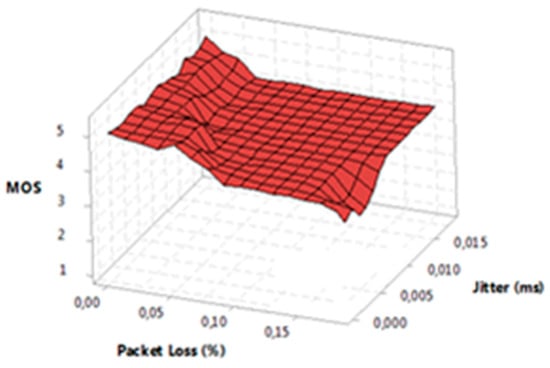
Figure 4.
MOS vs. Packet Loss and Jitter. Basketball model.
A joint analysis of Figure 4 and the results in Table 5 demonstrate that the B00 model interpreted the conducted subjective tests by 85.3%; this is coherent with the results obtained from the model through simulation, wherein the model yielded an MOS close to 3.0 for high values of packet loss. For this type of model, a MOS less than 4.0 indicated a low-quality video because packet loss significantly affected the video quality, producing pixilation and jerky movements.
Simulations with the I00 and C00 models allowed us to verify that the QoS parameters in Table 4 had the greatest influence. The results obtained reveal the possibility to use the proposed models in environments where the online calculation of QoE is desirable, allowing a service provider to adjust the network parameters in order to prevent user complaints.
Our models were designed based on the distortion of transmitted videos in an emulated environment, with simultaneous variation of the three QoS parameters. As shown in the related work section, our approach has a series of advantages over earlier models, given that, in certain proposals, the videos in the video files were distorted without transmission, or, in other cases, the authors did not explain how to introduce distortion in the videos used in their proposals [52].
8. Algorithm Used to Achieve QoE/QoS
Finally, in Figure 5, we present the flowchart of the process to allow other researchers to implement the proposals based on other network parameters. Figure 5 is explained as follows:
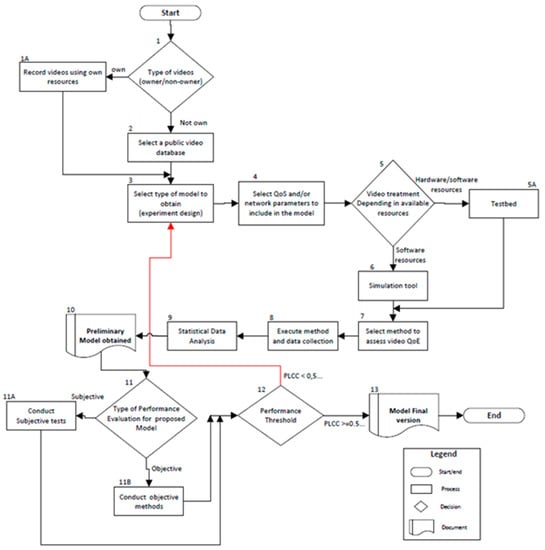
Figure 5.
Algorithm to obtain QoE/QoS models.
Step 1: Researchers decide to either record their own videos (step 1A) or select videos from a public database (Step 2).
Step 3: Select the desired type of model (experimental design). Upon selecting the type of mathematical model, researchers will be able to implement the experimental design.
Step 4: Select the number and type of QoS parameters to include in the model. Other types of network parameters may also be used.
Step 5: Execute video treatment according to the available resources. If hardware and software resources are available, researchers can implement a test (Step 5A) to introduce video impairments. If only software resources are available, simulation tools may be used (Step 6).
Step 7: Select a method to assess the video QoE. Subjective or objective methods may be selected.
Step 8: Execute the method and data collection. The experiments are executed with the number of executions defined in Step 3.
Step 9: Conduct the data analysis using statistical tools.
Step 10: A preliminary model is obtained, which can be evaluated for performance.
Step 11: Select the type of performance evaluation for the proposed model. Subjective (Step 11A) or objective methods (Step 11B) may be used.
Step 12: Performance threshold. Performance factors, such as PLCC and SROCC, are analyzed. If the selected performance metric is greater than or equal to 0.5, the researchers have obtained the final version of the model (Step 13). Otherwise, the procedure must be repeated from Step 3.
9. Future Trends: Drone Data Services
We provide our own service platform (see the list of services for the end customer in the Table 6) to analyze the data and provide the end customer with a personalized service tailored to the environmental needs, whether preventive, palliative or resolute.
Table 6.
Drone data analysis.
Data collection: The swarm with a programmed mission will collect information on the environmental problem—in this case, the landslide. This will be done in real time.
Data processing: The platform is used according to the contracted services to process the images and provide information in detail of the site where the landslide has occurred.
Data usage: The service platform allows the use of artificial intelligence and different algorithms for an adequate use of the information.
Execution: The platform allows improving the work of the data for an adequate management of environmental information, especially in situations of environmental problems.
9.1. Quality of Experience and Data Analysis in Environment Sector
The main idea is to build customer loyalty with excellent services classified in four categories according to the needs of the end customer (Basic, medium, pro and plus), so as to provide a personalized and tailor-made service according to the environmental problem (in this case, landslides and environmental problems).
With this service proposal, we can provide a better data analysis and thus provide palliative, preventive and resolute solutions when situations that have a negative environmental impact are generated. This service offer is a complement to a mixed analysis of the quality of the experience, and thus we can use our mathematical model, swarm data analysis and customer surveys for customer loyalty and quality of service.
9.2. Environment Sector
Basic Services include elements related to the swarm characteristics, control unit devices and with the management of information and obtained data on each one of the missions, as well. Regarding the swarm’s element, all the drones have the following characteristics: each drone is dust and water proof with a longer battery life for longer flights, weighs 250 g and has an HD camera system with a resolution of 1080 × 720 pixels and 180-degree sensor coverage; they can reach a maximum height of 80 m and a maximum speed of 20 m/s; and they have 60 min of absolute flight autonomy and all around-terrain coverage of 40 m.
As for the control unit, each swarm has been designed to fulfill a specific flight mission that has to be previously programed directly from the control unit. Each control unit contains algorithms inspired on pre-existing nature swarms, (known as bio-inspired), which facilitates the correct development of the mission and improves the collective intelligence of each swarm. Regarding some of the nature-based algorithms, there are genetic and particle optimization types. This specific type of service is focused on the identification of forest and jungle areas, access to hard-to-reach lands and the monitoring of identified areas. Regarding management of the obtained data, this service allows establishing a medium level of scalability with interaction between the cloud and the distributed architecture.
Intermediate Services: The intermediate one includes the same elements that constitute the basic service (swarm characteristics, control unit devices, management of in-formation and obtained data) with a few changes in the quality on each one [53].
Advanced services: As with the intermediate and the basic service, the advanced service counts with the same kind of elements (swarm characteristics, control unit devices, management of information and obtained data) with some improvements and better quality [54].
Plus and extra services: multimedia flight data management, mission planning, budget management and control, storage, administration tools multimedia services, security, identity and compliance, machine learning, block chain records, augmented and virtual reality, application integration, business productivity, streaming and desktop applications, IoT clout, intelligent data analytics, reporting, data-driven decision, backup, image editing, swarm pilot training, photogrammetry training, swarm customization, rendering-reconditioning of the swarm, hybrid drones with solar panels in the housing, charging and recharging stations, grapheme batteries, collective intelligence and in-flight machine leading.
Swarm characteristics: All drones have the following characteristics: water and dust resistance, high temperature resistance, resistant control screen, flight stabilization, weight of 200 g per unit, UHD 4K camera, longer battery life for longer flights, sensor coverage of 360 degrees, a maximum speed of 80 m/s, a flight high-limit of 120 m, a coverage of 80 m and 120-min of absolute flight autonomy.
Control unit: The advanced service counts with all of the bio-algorithms mentioned (genetic ones, particle differentiation, bees and ants). This type of service is focused on forest fire detection, the identification of its possible causes, fire risk mitigation, photographic records and night-based navigation.
Management of the obtained data: this service allows to establish a medium level of scalability, the acquisition of a mash-up between the cloud and the distributed architecture, the storage of structured, non-structured data on a distributed platform, an advanced analysis functions with computing power, obvious accessibility and analytical capacity derived from a more specific algorithm.
10. Conclusions
Three proposals for models developed through an instrumental QoE paradigm approach were presented to measure QoE using swarms of drones connected via a flying ad hoc network to perform a mission and provide quality of experience in a natural disaster service.
We found that it was not necessary to use subjective tests to obtain data in the creation of the models when using the QoE instrumental paradigm approach. The proposed models make it possible to obtain a measurement of the QoE of an online video without the need to compare it with the original video, which means that the required computing power is not high. In addition, QoE can be measured directly on the video transmitted over the ad hoc network, without the need to decode it or collect information about the transmitted video at the bit level.
With the model performance, it can be deduced that: (a) there is a close relationship between QoE and QoS, (b) the QoS parameter that most influences the QoE of a video is packet loss, (c) distortions are more visible depending on the type of video, and (d) in videos with a greater amount of movement, the distortion is more noticeable.
With this work, the following contributions were made: (a) from the quality of the experience, a mathematical model of the quality of the service was obtained, (b) using the end-to-end NS simulator, the design of the experiment was built, (c) a methodology was developed for the mathematical and statistical analysis of the information obtained, (d) an algorithm was designed to obtain the quality of the experience for end-to-end video traffic, based on service quality metrics, and (e) a proposal for future work was presented for the data analysis in a physical environment and applied to the environmental sector.
11. Future Work
Future work is to implement a test protocol to more precisely define the time–space characteristics for the use of each model to evaluate QoE. Doing this would allow an increased use range of the proposed models. Future work also includes performing a performance validation test of the proposed model and to compare this with the models presented in the “Related Works” section in order to analyze the fidelity and performance of the proposed model. At the final part of this research, we did not conduct those performance tests because our work was dedicated to validating the model fidelity using the test protocol proposed by VQEG and correlation tests with SSIM and PSNR.
To conduct those performance tests, it is necessary to implement a test plan or to have simulation tools to continue feeding the designed database with new videos that contain many distortions rather than only the distortions caused by QoS parameters modification. The database update is important because some databases are outdated or they provide scarce technical information. To present an improved version of the proposed models, we can analyze the performance of the proposed models by comparing the obtained results to PSNR and SSIM, and, based on the results of the last item and aiming to improve the fidelity of the models, we must obtain new video sequences in YUV format, so that encoding does not affect the video quality upon transmission in the testbed.
In addition to the proposed models, we designed a database as a result of the tests applied to the three proposed models. It contains over 48 videos evaluated subjectively; each video features distortions produced by its transmission in a laboratory environment with three QoS parameters being modified. This database will be online for the research community in a short time. We are also working toward adjusting the spatial–temporal range of each type of video in order to analyze each model performance. This document is focused on the quality metrics of the user experience and service, methodology and mathematical model. The details of the registration and transmission processes of the FANET network are found in an already accepted article and will be published very soon.
In [55], the alignment of subjective network parameters with network performance is proposed. Establishing a relationship between the conclusions of that work with the results of the research presented here would be enriching.
A new quality-of-experience-driven rate adaptation approach for adaptive HTTP streaming was presented in [56]. Their research was conducted in wireless network environments and demonstrated that the proposed mechanism could maximize QoS, particularly when the performance was variable. That document was focused on the quality metrics of the user experience and service, methodology and mathematical model. The details of the registration and transmission processes of the FANET network are found in an already accepted article and will be published soon.
Author Contributions
Project administration, J.H.O.M.; Investigation and writing—original draft, J.L.A.H.; Investigation and Formal analysis J.C.C.Q.; Supervision and writing—review and editing C.A.T.R.; Conceptualization and Methodology B.T.A. All authors have read and agreed to the published version of the manuscript.
Funding
This work benefited from the support of the Telematics Engineering Group of the University of Cauca. This paper shows part of results of the project “Framework for deployment and management of video content—Phase I” ID 4977. We are especially grateful to The VRI of University of Cauca for its financial support.
Institutional Review Board Statement
Not applicable.
Informed Consent Statement
Not applicable.
Data Availability Statement
The data that support the findings of this study are available from the corresponding author upon reasonable request.
Conflicts of Interest
The authors declare that they have no conflict of interest to report regarding the present study.
References
- Cisco Visual Networking Index: Forecast and Trends. Available online: https://www.cisco.com/c/en/us/solutions/collateral/service-provider/visual-networking-index-vni/white-paper-c11-741490.pdf (accessed on 13 December 2018).
- Cuellar, J.C.; Arciniegas, J.L.; Ortiz, J.H. Model to evaluate Quality of Experience to IPTV service. In Proceedings of the 14th Iberian Conference on Information Systems and Technologies (CISTI), Coimbra, Portugal, 19–22 June 2019. [Google Scholar]
- Lentisco, C.M.; Bellido, L.; Cuellar, J.C.; Pastor, E.; Arciniegas, J.L. QoE-Based Analysis of DASH Streaming Parameters Over Mobile Broadcast Networks. IEEE Access 2017, 5, 20684–20694. [Google Scholar] [CrossRef]
- Schmitt, M.; Redi, J.; Bulterman, D.; Cesar, P.S. Towards Individual QoE for Multiparty Videoconferencing. IEEE Trans. Multimed. 2018, 20, 1781–1795. [Google Scholar] [CrossRef]
- Song, W.; Tjondronegoro, D.W. Acceptability-Based QoE Models for Mobile Video. IEEE Trans. Multimed. 2014, 16, 738–750. [Google Scholar] [CrossRef]
- Raake, A. IP-Based Mobile and Fixed Network Audiovisual Media Services. IEEE Signal Process. Mag. 2011, 28, 68–79. [Google Scholar] [CrossRef]
- Cuellar, J.C.; Arciniegas, J.L.; Ortiz, J.H. Modelo para la medición de QoE en IPTV, 1st ed.; Editorial Universidad Icesi: Cali, Colombia, 2018; pp. 101–118. Available online: http://www.icesi.edu.co/editorial/medicion-de-qoe/ (accessed on 5 April 2021).
- Cuellar, J.C.; Acosta, D.; Arciniegas, J.L. QoE/QoS Mapping Models to Measure Quality of Experience to IPTV Service. In Proceedings of the IV School of Systems and Networks (SSN 2018), Valdivia, Chile, 29–31 October 2018. [Google Scholar]
- Tsolkas, D.; Liotou, E.; Passas, N.; Merakos, L. A survey on parametric QoE estimation for popular services. J. Netw. Comput. Appl. 2017, 77, 1–17. [Google Scholar] [CrossRef]
- Vocabulary for Performance, Quality of Service and Quality of Experience. Available online: https://www.itu.int/rec/T-REC-P.10-201711-I/es (accessed on 13 February 2018).
- Chen, Y.; Wu, K.; Zhang, Q. From QoS to QoE: A Tutorial on Video Quality Assessment. IEEE Commun. Surv. Tutor. 2015, 17, 1126–1165. [Google Scholar] [CrossRef]
- Maia, O.B.; Yehia, H.C.; Errico, L. A concise review of the quality of experience assessment for video streaming. Comput. Commun. 2015, 57, 1–12. [Google Scholar] [CrossRef]
- International Telecommunication Union (ITU). Methodology for subjective assessment of the quality of television pictures. In ITU-R Recommendation BT.500-13; ITU Publications: Switzerland, Geneva, 2002; pp. 1–46. [Google Scholar]
- International Telecommunication Union (ITU). Multichannel stereophonic sound system with and without accompanying picture. In ITU-R Recommendation ITU-R BS.775-1; ITU Publications: Switzerland, Geneva, 1994; pp. 1–11. [Google Scholar]
- International Telecommunication Union (ITU). Methods for the subjective assessment of audio systems with accompanying picture. In ITU-R Recommendation BS.1286; ITU Publications: Switzerland, Geneva, 1997; pp. 1–8. [Google Scholar]
- International Telecommunication Union (ITU). Subjective video quality assessment methods for multimedia applications. In ITU-T Recommendation P.910; ITU Publications: Switzerland, Geneva, 2008; pp. 1–42. [Google Scholar]
- Alreshoodi, M.; Woods, J. Survey on QoE\QoS Correlation Models for Multimedia Services. Int. J. Distrib. Parallel Syst. 2013, 4, 1–20. [Google Scholar]
- Yue, G.; Hou, C.; Gu, K.; Zhou, T.; Liu, H. No-Reference Quality Evaluator of Transparently Encrypted Images. IEEE Trans. Multimed. 2019, 21, 2184–2194. [Google Scholar] [CrossRef]
- International Telecommunication Union (ITU). Objective Perceptual Video Quality Measurement Techniques for Digital Cable Television in the presence of a full reference. In ITU-T Recommendation J.144; ITU Publications: Switzerland, Geneva, 2004; pp. 1–156. [Google Scholar]
- Liao, N.; Chen, Z. A packet-layer video quality assessment model with spatiotemporal complexity estimation. EURASIP J. Image Video Process. 2011, 2011, 5. [Google Scholar] [CrossRef][Green Version]
- Garcia, M.N. Parametric model for audiovisual quality assessment in IPTV: ITU-T Rec. P.1201.2. In Proceedings of the IEEE 15th International Workshop on Multimedia Signal Processing (MMSP), Pula, Italy, 30 September–2 October 2013; pp. 482–487. [Google Scholar]
- International Telecommunication Union (ITU). Parametric non-intrusive assessment of audiovisual media streaming quality-lower resolution application area. In ITU-T Prepublished Recommendation P.1201; ITU Publications: Switzerland, Geneva, 2012; pp. 1–35. [Google Scholar]
- Takahashi, A.; Hands, D.; Barriac, V. Standardization activities in the ITU for a QoE assessment of IPTV. IEEE Commun. Mag. 2008, 46, 78–84. [Google Scholar] [CrossRef]
- International Telecommunication Union (ITU). Parametric non-intrusive bitstream assessment of video media streaming quality–higher resolution application area. In ITU-T Recommendation P.1202.2; ITU Publications: Switzerland, Geneva, 2013; pp. 1–25. [Google Scholar]
- Rahrer, T.; Fiandra, R.; Wright, S. DSL Forum Technical Report TR-126. Triple-play Services Quality of Experience (QoE) Requirements. In Architecture & Transport Working Group; DSL Forum: Fremont, CA, USA, 2006; pp. 1–129. Available online: https://1library.net/document/q0xxg33q-technical-report-triple-services-quality-experience-requirements-december.html (accessed on 5 April 2021).
- Robitza, W. Challenges of future multimedia QoE monitoring for internet service providers. Multimed. Tools Appl. 2017, 76, 22243–22266. [Google Scholar] [CrossRef]
- Zhang, D.; Zhou, D.; Jin, X. A content-adaptive video quality assessment method for online media service. Multimed. Tools Appl. 2017, 76, 7175–7195. [Google Scholar] [CrossRef]
- Chen, B.W.; Ji, W.; Jiang, F.; Rho, S. QoE-Enabled Big Video Streaming for Large-Scale Heterogeneous Clients and Networks in Smart Cities. IEEE Access 2016, 4, 97–107. [Google Scholar] [CrossRef]
- Wang, T.; Pervez, A.; Zou, H. VQM-based QoS/QoE mapping for streaming video. In Proceedings of the 3rd IEEE International Conference on Broadband Network and Multimedia Technology (IC-BNMT), Beijing, China, 26–28 October 2010; pp. 807–812. [Google Scholar]
- Kim, H.J.; Lee, D.H.; Lee, J.M.; Lee, K.H.; Lyu, W.; Choi, S.G. The QoE Evaluation Method through the QoS-QoE Correlation Model. In Proceedings of the Fourth International Conference on Networked Computing and Advanced Information Management, Lulea, Sweden, 2–4 September 2008; pp. 719–725. [Google Scholar]
- Tommasi, F.; Luca, V.; Melle, C. Packet losses and objective video quality metrics in H.264 video streaming. J. Vis. Commun. Image Represent. 2015, 27, 7–27. [Google Scholar] [CrossRef]
- Wang, J.; Hou, Y. Packet loss rate mapped to the quality of experience. Multimed. Tools Appl. 2016, 77, 387–422. [Google Scholar] [CrossRef]
- Pinson, M.H.; Wolf, S. A new standardized method for objectively measuring video quality. IEEE Trans. Broadcast. 2004, 50, 312–322. [Google Scholar] [CrossRef]
- Montgomery, D.C. Diseño y Análisis de Experimentos, 2nd ed.; Limusa Wiley Publications: Mexico City, Mexico, 2013; pp. 1–681. [Google Scholar]
- The Linux Foundation. Available online: https://wiki.linuxfoundation.org/networking/netem (accessed on 30 July 2018).
- Lübke, R.; Büschel, P.; Schuster, D.; Schill, A. Measuring accuracy and performance of network emulators. In Proceedings of the 2014 IEEE International Black Sea Conference on Communications and Networking (BlackSeaCom), Odessa, Ukraine, 27–30 May 2014; pp. 63–65. [Google Scholar]
- Catellier, A.; Pinson, M. Characterization of the HEVC Coding Efficiency Advance Using 20 Scenes, ITU-T Rec. P.913 Compliant Subjective Methods, VQM, and PSNR. In Proceedings of the IEEE International Symposium on Multimedia (ISM), Miami, FL, USA, 14–16 December 2015; pp. 282–288. [Google Scholar]
- Stefan Winkler Resources. Available online: https://stefan.winkler.site/resources.html (accessed on 21 February 2018).
- Yamagishi, K.; Kawano, T.; Hayashi, T. Hybrid Video-Quality-Estimation Model for IPTV Services. In Proceedings of the IEEE Global Telecommunications Conference (GLOBECOM), Honolulu, HI, USA, 30 November–4 December 2009; pp. 1–5. [Google Scholar]
- Rifai, H.; Mohammed, S.; Mellouk, A. A brief synthesis of QoS-QoE methodologies. In Proceedings of the 2011 10th International Symposium on Programming and Systems (ISPS), Piscataway, NJ, USA, 25–27 April 2011; pp. 32–38. [Google Scholar]
- Wang, C.; Jiang, X.; Wang, Y. Video Quality Assessment Models for IPTV Services. Int. J. Digit. Content Technol. Its Appl. 2013, 7, 733–741. [Google Scholar]
- MSU Video Quality Measurement Tool. Available online: http://compression.ru/video/quality_measure/video_measurement_tool.html (accessed on 16 December 2019).
- Minitab. Available online: http://www.minitab.com/es-mx/ (accessed on 9 September 2018).
- Douglas, A.; William, L.; Marchal, G.; Wathen, S. Estadística Aplicada a los Negocios y a la Economía, 13th ed.; México, D.F., Ed.; McGrawHill: New York, NY, USA, 2012; pp. 1–886. [Google Scholar]
- International Telecommunication Union (ITU). Final Report from the Video Quality Experts Group on the Validation of Objective Models of Video Quality Assessment, Phase II (FR-TV2) VQEG; ITU Publications: Switzerland, Geneva, 2003; pp. 1–321. [Google Scholar]
- Moldovan, A.N.; Ghergulescu, I.; Muntean, C.H. VQAMap: A Novel Mechanism for Mapping Objective Video Quality Metrics to Subjective MOS Scale. IEEE Trans. Broadcasting 2016, 62, 610–627. [Google Scholar] [CrossRef]
- Chikkerur, S.; Sundaram, V.; Reisslein, M.; Karam, L.J. Objective Video Quality Assessment Methods: A Classification, Review, and Performance Comparison. IEEE Trans. Broadcast. 2011, 57, 165–182. [Google Scholar] [CrossRef]
- Tavera, C.A.; Castro, D.F.; Ortiz, J.H.; Khalaf, O.I.; Vargas, M.A. Synergy between Circular Economy and Industry 4.0: A Literature Review. Sustainability 2021, 13, 4331. [Google Scholar] [CrossRef]
- Tavera, C.A.; Ortiz, J.H.; Khalaf, O.I.; Saavedra, D.F.; Aldhyani, H.H. Wearable Wireless Body Area Networks for Medical Applications. Comput. Math. Methods Med. 2021, 2021, 5574376. [Google Scholar] [CrossRef] [PubMed]
- Tavera, C.A.; Ortiz, J.H.; Khalaf, O.I.; Ortega, W.M. Software Architecture for Planning Educational Scenarios by Applying an Agile Methodology. Int. J. Emerg. Technol. Learn. 2021, 8, 132–144. [Google Scholar] [CrossRef]
- Tavera, C.A.; Ortiz, J.H.; Khalaf, O.I.; Ríos, A. Web Application Commercial Design for Financial Entities Based on Business Intelligence. Comput. Mater. Contin. 2021, 67, 3177–3188. [Google Scholar]
- Narvaez, C.; Alomía, G.A.; Loaiza, D.F.; Tavera, C.A. Society 5.0: A Japanese Concept for a Superintelligent Society. Sustainability 2021, 13, 6567. [Google Scholar] [CrossRef]
- García, M.; Canovas, A.; Edo, M.; Lloret, J. A QoE Management System for Ubiquitous IPTV Devices. In Proceedings of the 3rd International Conference on Mobile Ubiquitous Computing, Systems, Services and Technologies, Sliema, Malta, 11–16 October 2009; pp. 147–152. [Google Scholar]
- Lloret, J.; García, M.; Atenas, M.; Canovas, A. A QoE management system to improve the IPTV network. Int. J. Commun. Syst. 2011, 24, 118–138. [Google Scholar] [CrossRef]
- Sideris, A.; Markakis, E.; Zotos, N.; Pallis, E.; Skianis, C. MPEG-DASH users’ QoE: The segment duration effect. In Proceedings of the Seventh International Workshop on Quality of Multimedia Experience (QoMEX), Pilos, Greece, 26–29 May 2015; pp. 1–6. [Google Scholar] [CrossRef]
- Kumar, V.P.M.; Mahapatra, S. Quality of Experience Driven Rate Adaptation for Adaptive HTTP Streaming. IEEE Trans. Broadcasting 2018, 64, 602–620. [Google Scholar] [CrossRef]
Publisher’s Note: MDPI stays neutral with regard to jurisdictional claims in published maps and institutional affiliations. |
© 2022 by the authors. Licensee MDPI, Basel, Switzerland. This article is an open access article distributed under the terms and conditions of the Creative Commons Attribution (CC BY) license (https://creativecommons.org/licenses/by/4.0/).