1. Introduction
In recent years, in improving the protection of grassland wildlife, it is essential to determine the number and distribution of grassland animals. Traditional manual methods of obtaining statistics are slow and dangerous. Therefore, in the field of artificial intelligence, especially in the continuous development of computer vision, achieving intelligent and precise realization of grassland animal detection and tracking has important research significance and practical value.
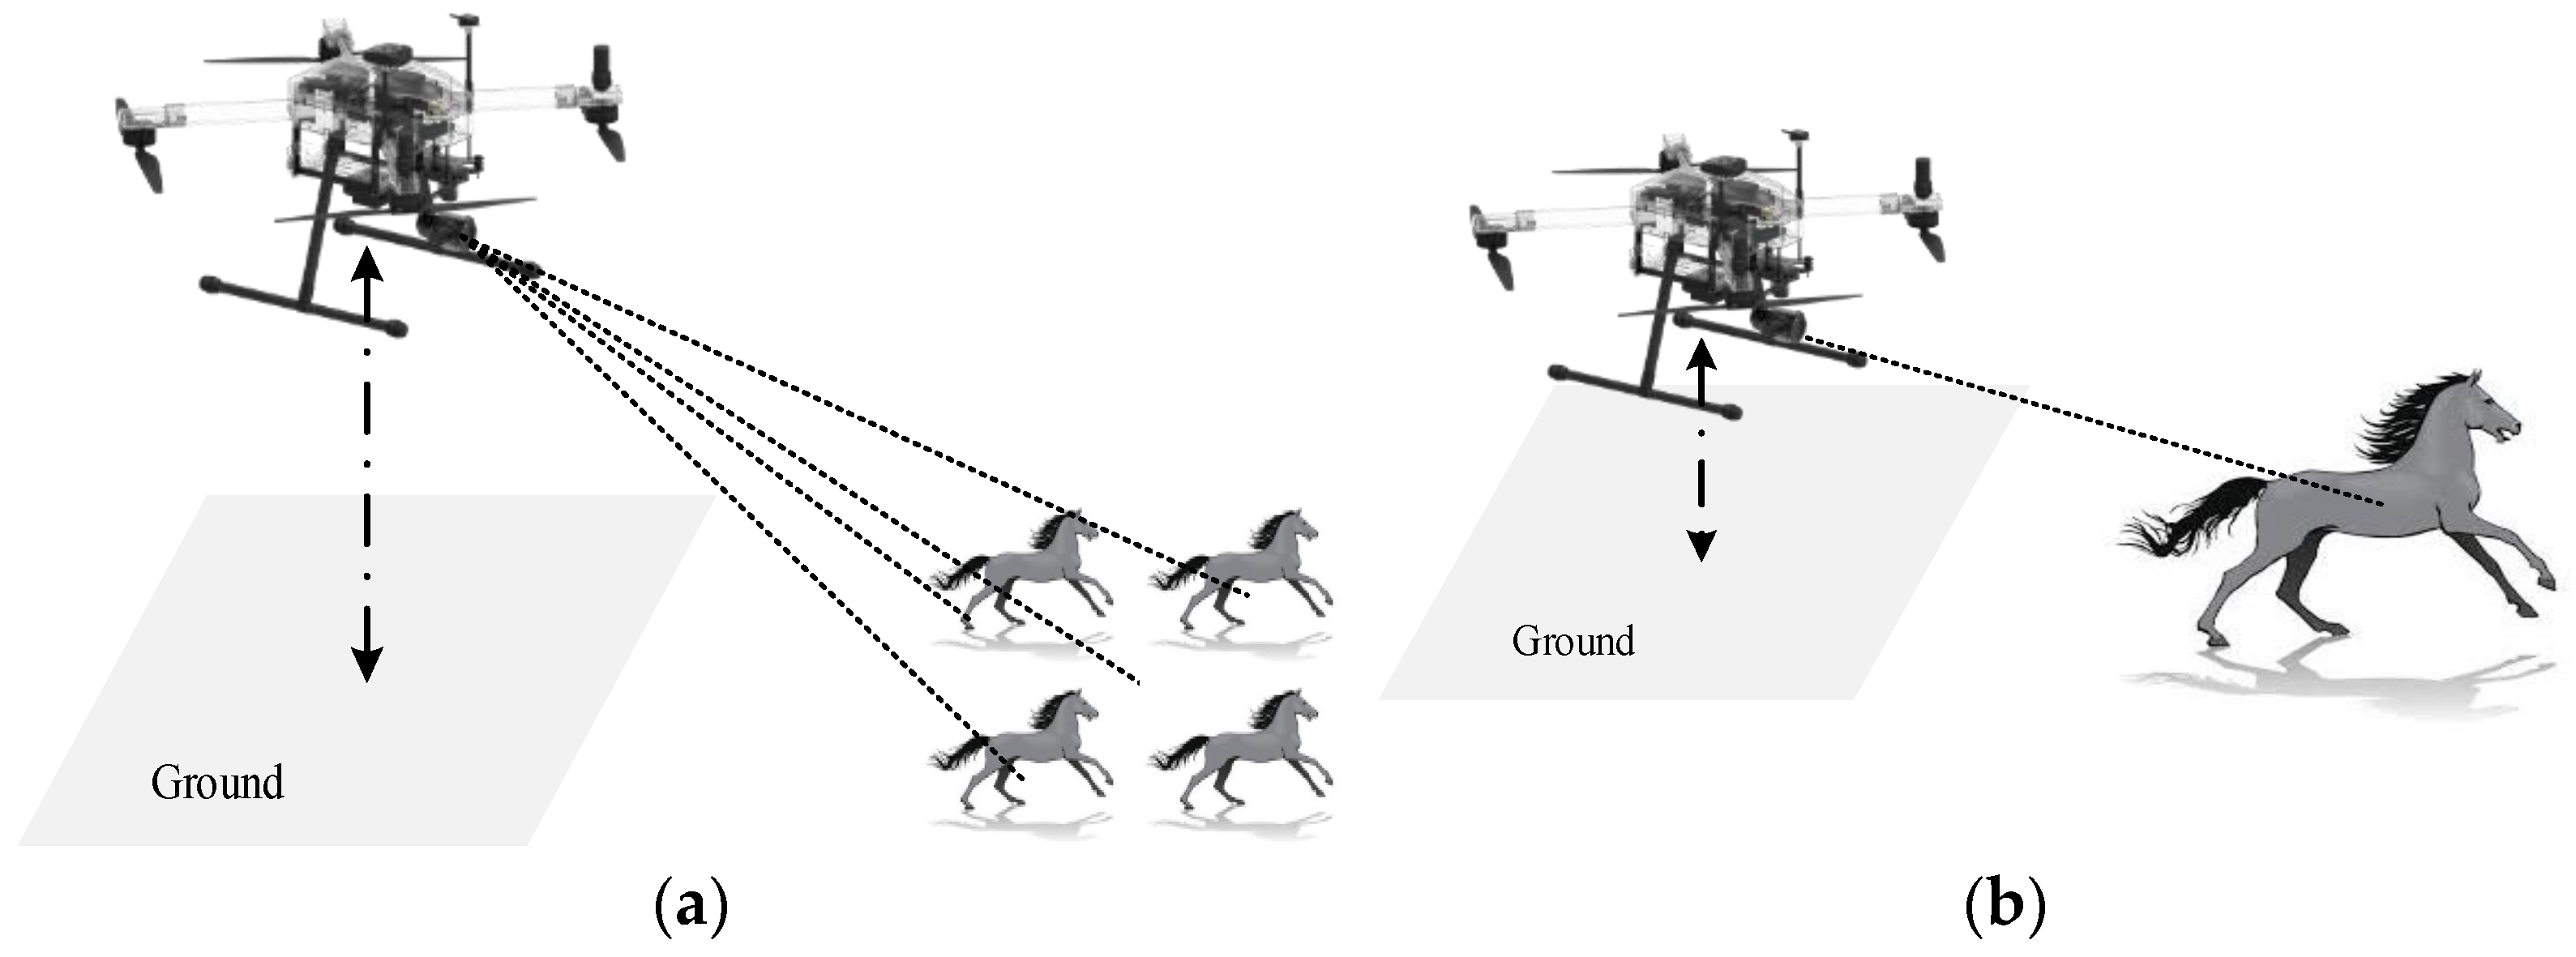
Figure 1 shows images of grassland animals taken by UAV at low altitudes. It can be seen that with increased UAV height, the proportions of targets in the picture become smaller and smaller; therefore, it is necessary to improve the ability of models to detect small objects when detecting normal objects. If a drone is flying at high altitude, this presents a huge challenge in detection. At present, there are many algorithmic models that are able to detect wild animals, such as the algorithm proposed by Mateusz Choiński et al. [
1] for monitoring the number of wild animals and the algorithm proposed by Dario G. Lema et al. [
2] for detecting whether livestock activities exist in specific terrains, but the performance of these algorithms in real-time needs to be improved.
At present, object detection in images can be roughly divided into two categories: the first includes one-stage detection methods, such as YOLO and SSD [
3,
4,
5,
6,
7]. The other includes two-stage detection methods, the most representative of which is Faster RCNN [
8]. The reasoning speed of the one-stage detection method is relatively high. The difference is that the two-stage detection method has higher positioning and target recognition accuracy, while the reasoning speed is relatively low.
In this paper, a lightweight grassland animal object detection system is designed based on Yolov5. First, Squeeze-and-Excitation Networks are introduced to improve the expressiveness of the network model. Specifically, the importance of each channel is automatically obtained by learning, and then features that are useful are promoted and features that are of little use to the task at hand are suppressed according to this level of importance. Secondly, considering the redundancy of feature map channels, the convolutional layer of branch 2 in the BottleNeckCSP structure is deleted, and 3/4 of its input channels are directly merged with the results of branch 1 processing, so that the number of 1 × 1 convolutional layer channels is reduced, which reduces the number of model parameters with guaranteed accuracy. Next, in the SPP module of the network model, a 3 × 3 maximum pooling layer is added to improve the receptive field of the model and thus the detection of small targets. Finally, the trained model was applied to NVIDIA-TX2 with an FPS of about 26.
The overall structure of this paper can be summarized as follows: The first section mainly introduces the background of object detection. In
Section 2, previous works related to the proposed method are reviewed. In
Section 3 the structure of the YOLOV5s model is introduced and improved. In
Section 4, the effect of the improved model is verified by a comparison of the training processes, and the performance of the model is verified by means of experimental testing. Finally,
Section 5 provides a discussion of our work, while
Section 6 summarizes our work and introduces future research directions.
2. Related Works
In this section, previous works related to the proposed method are reviewed. At present, object detection technology is used in many fields in combination with object detection, such as in forest fire detection [
9], identification of insulator defects on pylons [
10], and aerial vehicle detection [
11]. At the same time, there have been many studies on object detection for wildlife detection, such as O-YOLOv2, YOLOv2 [
12], YOLOv3, Tiny-YOLOv3 [
13], YOLOv4-uw [
14], Faster R-CNN, Modified Faster R-CNN, RetinaNet [
15], CenterNet, improved CenterNet [
16], and other models, the performances of which are shown in
Table 1. Although many models have high detection accuracy, the large scale of the models and the large number of parameters leads to their ability to perform real-time detection in application being insufficient. Jinbang Peng et al. [
15] used Faster R-CNN and modified Faster R-CNN models, respectively, to detect wild animals. Although the detection accuracy was high, the detection speed was very low. The detection speed of the Faster R-CNN model was 3 fps, and the detection speed of the Modified Faster R-CNN model was 2 fps.
With the advancement of technology, the application of UAVs is everywhere in daily life, and research based on UAV vision object detection is common. The current application is more based on the detection of pedestrians and vehicles by drones [
17,
18,
19]. The SlimYOLOv3 model proposed by Pengyi Zhang et al. [
20] not only has a high detection accuracy but also meets the practical needs of UAVs in real-time. Yuanyuan Hu et al. [
21] applied the object detection model to UAV countermeasures, which is a new research direction based on UAV object detection and also achieved good results in terms of real-time and accuracy. Small target detection based on UAV vision is also a research hotspot. The UAV-YOLO model proposed by Mingjie Liu et al. [
22] improves the accuracy of small target detection by adding spatial information. Haijun Zhang et al. [
23] provide a multi-scale dataset based on UAV vision, named MOHR, and this dataset is of great significance for monitoring in the industry.
The purpose of this paper is to design a lightweight real-time object detector that can be deployed to an embedded platform and better integrated with UAVs. At the same time, the detector should accommodate as much as possible the change in altitude of the UAV during actual flight.
3. Materials and Methods
3.1. YOLOv5 Network Model
The YOLO model has always been widely used. There have been five updated versions, from YOLOv1 to YOLOv5. With continuous improvement and innovation, it has been used by deep learning enthusiasts as one of the preferred frameworks for object detection [
24,
25]. The official code of YOLOv5 [
26] provides a total of five versions of the object detection network: YOLOv5s, YOLOv5m, YOLOv5l, YOLOv5x, and YOLOv5n. YOLOv5n is mainly designed for mobile and CPU environments; it is fast, but not accurate. Among the other four versions, YOLOv5s is the network with the narrowest feature map width and the shallowest depth. The following three models continue to widen and deepen these aspects, respectively. The YOLO network model is mainly composed of the backbone, neck, and prediction layers. The backbone is a convolutional neural network that aggregates different image granularities and simultaneously forms image features [
27,
28]. The neck is a series of network layers that mix and combine image features. Its main function is to transfer image features to the prediction layer. The prediction layer predicts the features of the image, generates the bounding box of the detection target, and predicts the type of the target object [
29,
30].
3.1.1. Backbone Module
The first layer of the backbone is focus. The main function of this module is to enrich the training dataset; in particular, random scaling is used to increase the number of small targets in the training process, improving the robustness of the network model, and greatly improving its ability to detect small targets.
The default input of YOLOv5s is 640 × 640 × 3, and the focus layer copies it into four, and then cuts the four pictures into four 320 × 320 × 3 slices using a slicing operation. Then, the four slices are stitched together depth wise, making the output 320 × 320 × 12, before being passed through a convolutional layer with a number of convolution kernels equal to 32 in order to generate a 320 × 320 × 32 output. Finally, the batch normalization and activation function are applied, and the results are used as input to the next convolutional layer.
BottleNeckCSP is in the third layer of the backbone, and is divided into two main parts, BottleNeck and CSPNet [
31]. BottleNeck is a classic residual network structure. The first is a 1 × 1 convolutional layer (conv+batch_norm+leaky relu), the next is a 3 × 3 convolutional layer, and finally, the initial input is added through the residual network structure. The full name of CSPNet is Cross Stage Partial Network, and it solves the problem of repeated gradients in other large convolutional network structures [
32,
33,
34].
3.1.2. Neck Module
The main function of the neck module is to generate a feature pyramid and transfer the features of the image to the prediction layer. The feature pyramid can be used to optimize the network model’s detection of target objects of different scales, and then to identify the same target objects at different sizes and scales. Before the PANet [
35] structure came out, FPN was always the preferred structure for the feature aggregation layer of the object detection framework. In the research on YOLOv4, it has been found that the most suitable feature fusion network for YOLO is PANet. Therefore, both YOLOv4 and YOLOv5 use PANet as the neck to aggregate features.
PANet is based on the Mask R-CNN and FPN frameworks, and on this basis, the dissemination of information is optimized [
36,
37]. The feature extractor of the network uses a bottom-up path FPN structure, thereby optimizing the propagation of low-level features. The feature map of the previous stage is used as the input of each stage of the third path, and a 3 × 3 convolutional layer is applied to process it at the same time. The output is added to the feature map of the same stage of the top-down path through the horizontal connection, and these feature maps provide information for the next stage. At the same time, adaptive feature pooling is used to restore the damaged information paths between all feature levels and each candidate area and aggregate each candidate area on each feature level in order to prevent arbitrary allocation [
38,
39].
3.1.3. Prediction Module
The prediction module performs the final detection, and an anchor box is applied to the output feature map, generating an output vector with category probability, confidence score, and bounding box. On the anchor, YOLOv5 uses cross-grid matching rules to distinguish the positive and negative samples of the anchor. The loss function uses GIOU_loss, and the confidence loss and category loss use the binary cross-entropy loss function.
3.2. Pre-Training
At this stage, it is very difficult to obtain large datasets when users have to take pictures themselves. At the same time, if the dataset is too small, overfitting will occur when training the model, which will lead to the model having poor generalization ability and robustness. Therefore, users typically do not train network models from scratch for a given item. The amount of data in this experiment was also limited, and the training results are likely to exhibit overfitting. To solve this problem, we adopted the transfer learning method to improve model generalization [
40]. We used the backbone of the COCO dataset to pre-train the network model and used the trained backbone to train the wildlife dataset. This method reduced the size of the training dataset, increased the training speed of the model, and effectively solved the problem of model overfitting. Since transfer learning allows the model to learn using different types of data, it is better at capturing the internal connections of the problem to be solved.
3.3. Improved YOLOv5
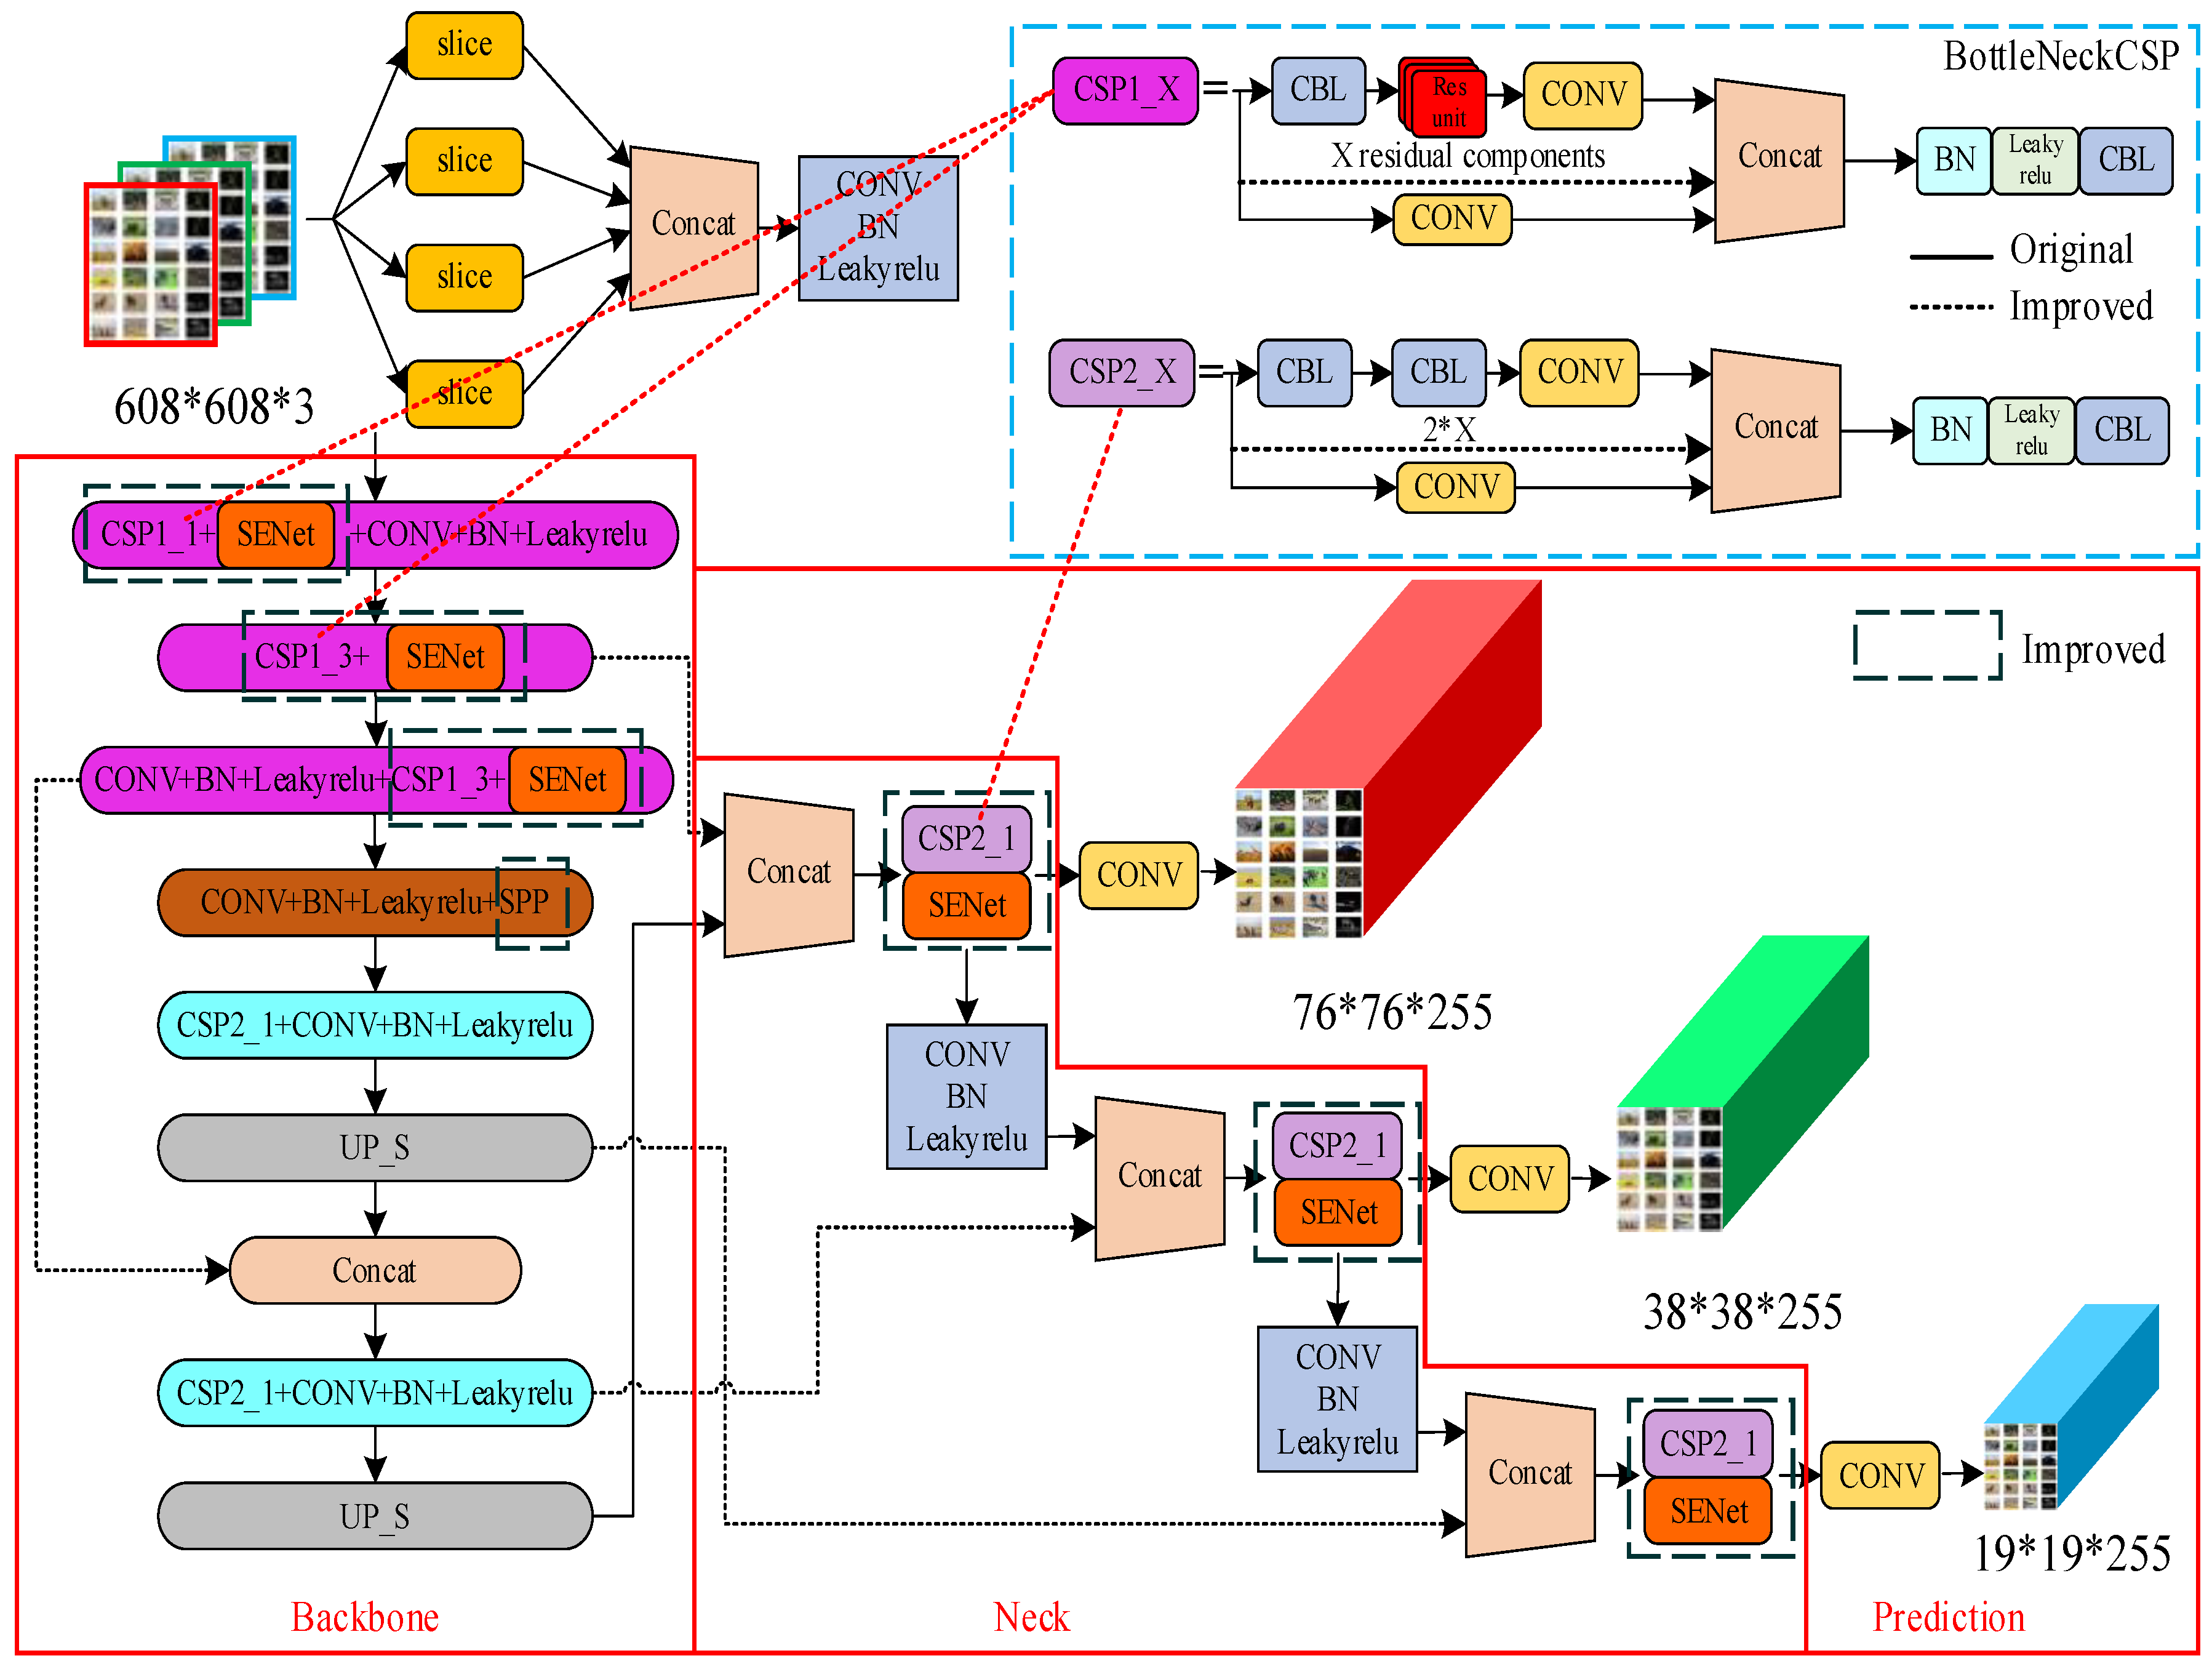
The improved YOLOv5s network model is shown in
Figure 2. To improve the performance of the model, SENet network is added after the first three BottleneckCSP and the BottleneckCSP in the three detection branches. At the same time, in order to reduce the amount of parameters, the convolution of branch 2 in BottleNeckCSP structure is deleted, and 3/4 of its input channels are directly merged with the results of branch 1 processing. Finally, in order to improve the ability of the model to detect small targets, a 3 × 3 max-pooling layer is added to the SPP module to improve the receptive field of the model.
3.3.1. Addition of the SENet Network Structure
Since the shape and appearance of grassland animals are different from the background color in the image, in order to improve the detection accuracy for grassland animal targets [
41,
42,
43,
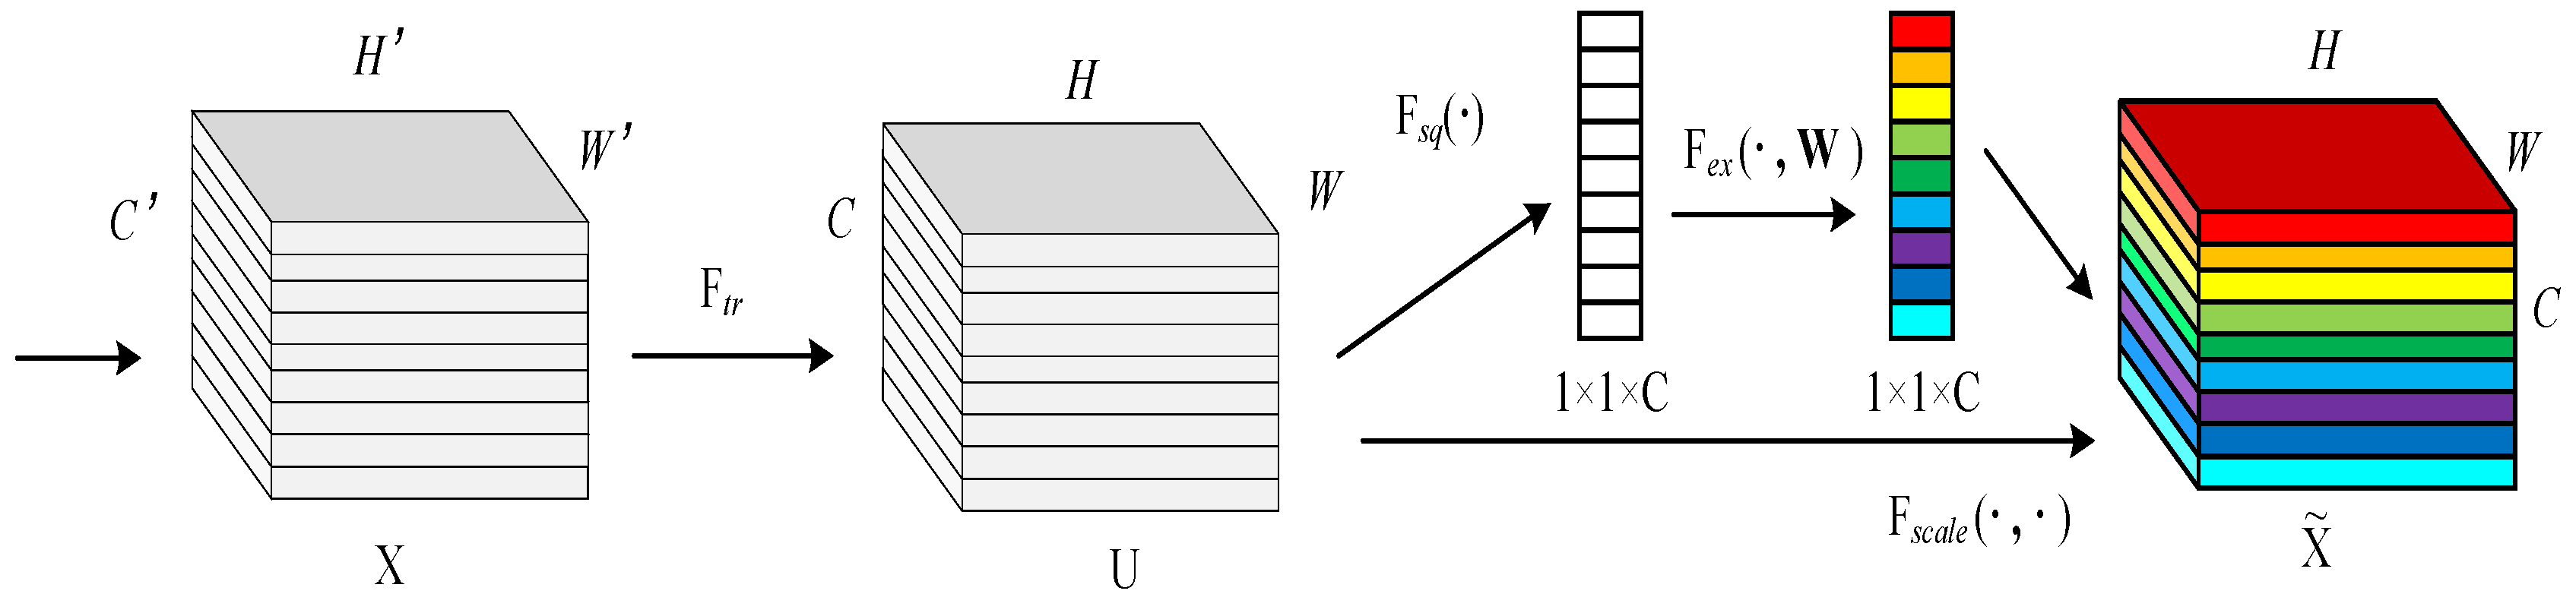
44], the SENet network is introduced [
45], the structure of which is shown in
Figure 3.
First, the
step is a conversion operation. In fact, it is a standard convolution operation in the structure, and the input and output are defined as:
. The specific form of this
is shown in Equation (1), where
represents the
c-th convolution kernel, and
represents the
s-th input.
The
obtained by
is the second three-dimensional matrix in the structure diagram, and
represents the
c-th two-dimensional matrix in
. What follows is the squeeze operation, the specific form of which is shown in Equation (2). In fact, squeeze converts the
input into
a output.
Next is the excitation operation, the specific form of which is shown in Equation (3). The result obtained by squeeze, above, is
z. First, multiply
W1 by
z. The dimension of
W1 is
, and
r is the scaling parameter. Its function is to reduce the number of channels, thereby reducing the amount of calculation required. In addition, because the dimension of
z is 1 × 1 ×
C, the dimension of
is
; then, through the ReLU layer, the dimension remains unchanged. Then multiply by
; the dimension of
is
, so the output dimension is
, and finally through the sigmoid function,
s is obtained.
It can be seen from the above that the dimension of
s is
, and
s is used to describe the weight of the feature map
in
. After obtaining s, it is possible to operate on the original
. The specific form is as shown in Formula (4), where
represents the weight. Therefore, it is equivalent to multiplying each value in the
matrix by
, which corresponds to
in
Figure 3.
The core idea of SENet is to learn the target feature weight through the loss function, and by improving the effective feature map weight. Train the network model by reducing the weight of the feature map that is invalid or has a small effect, so as to achieve better results. The SENet network structure requires a small amount of calculation, while at the same time effectively improving the expression ability of the network model and optimizing it. Therefore, the SENet network is embedded in the YOLOv5s model to improve the detection accuracy of the model, as shown in
Figure 4.
After adding the SENet module, the number of parameters of the model increased by about 3 percentage points, and the running speed was basically the same as that of the original network. Meanwhile, in order to reduce the number of parameters of the model, the weight parameter of the model channel was changed from 0.5 to 0.45 under the condition of ensuring the accuracy.
3.3.2. Improve BottleNeckCSP Module
Because it is necessary not only for the UAV object detection algorithm to accurately identify animals in different environments in the grassland, but also to reduce the model as much as possible and increase the calculation speed in order to realize real-time detection using a UAV, the BottleNeckCSP structure in the backbone network of the YOLOv5s framework is optimized. This ensures that, while improving the detection speed, the accuracy of object detection does not change significantly, thereby resulting in a lightweight UAV object detection model.
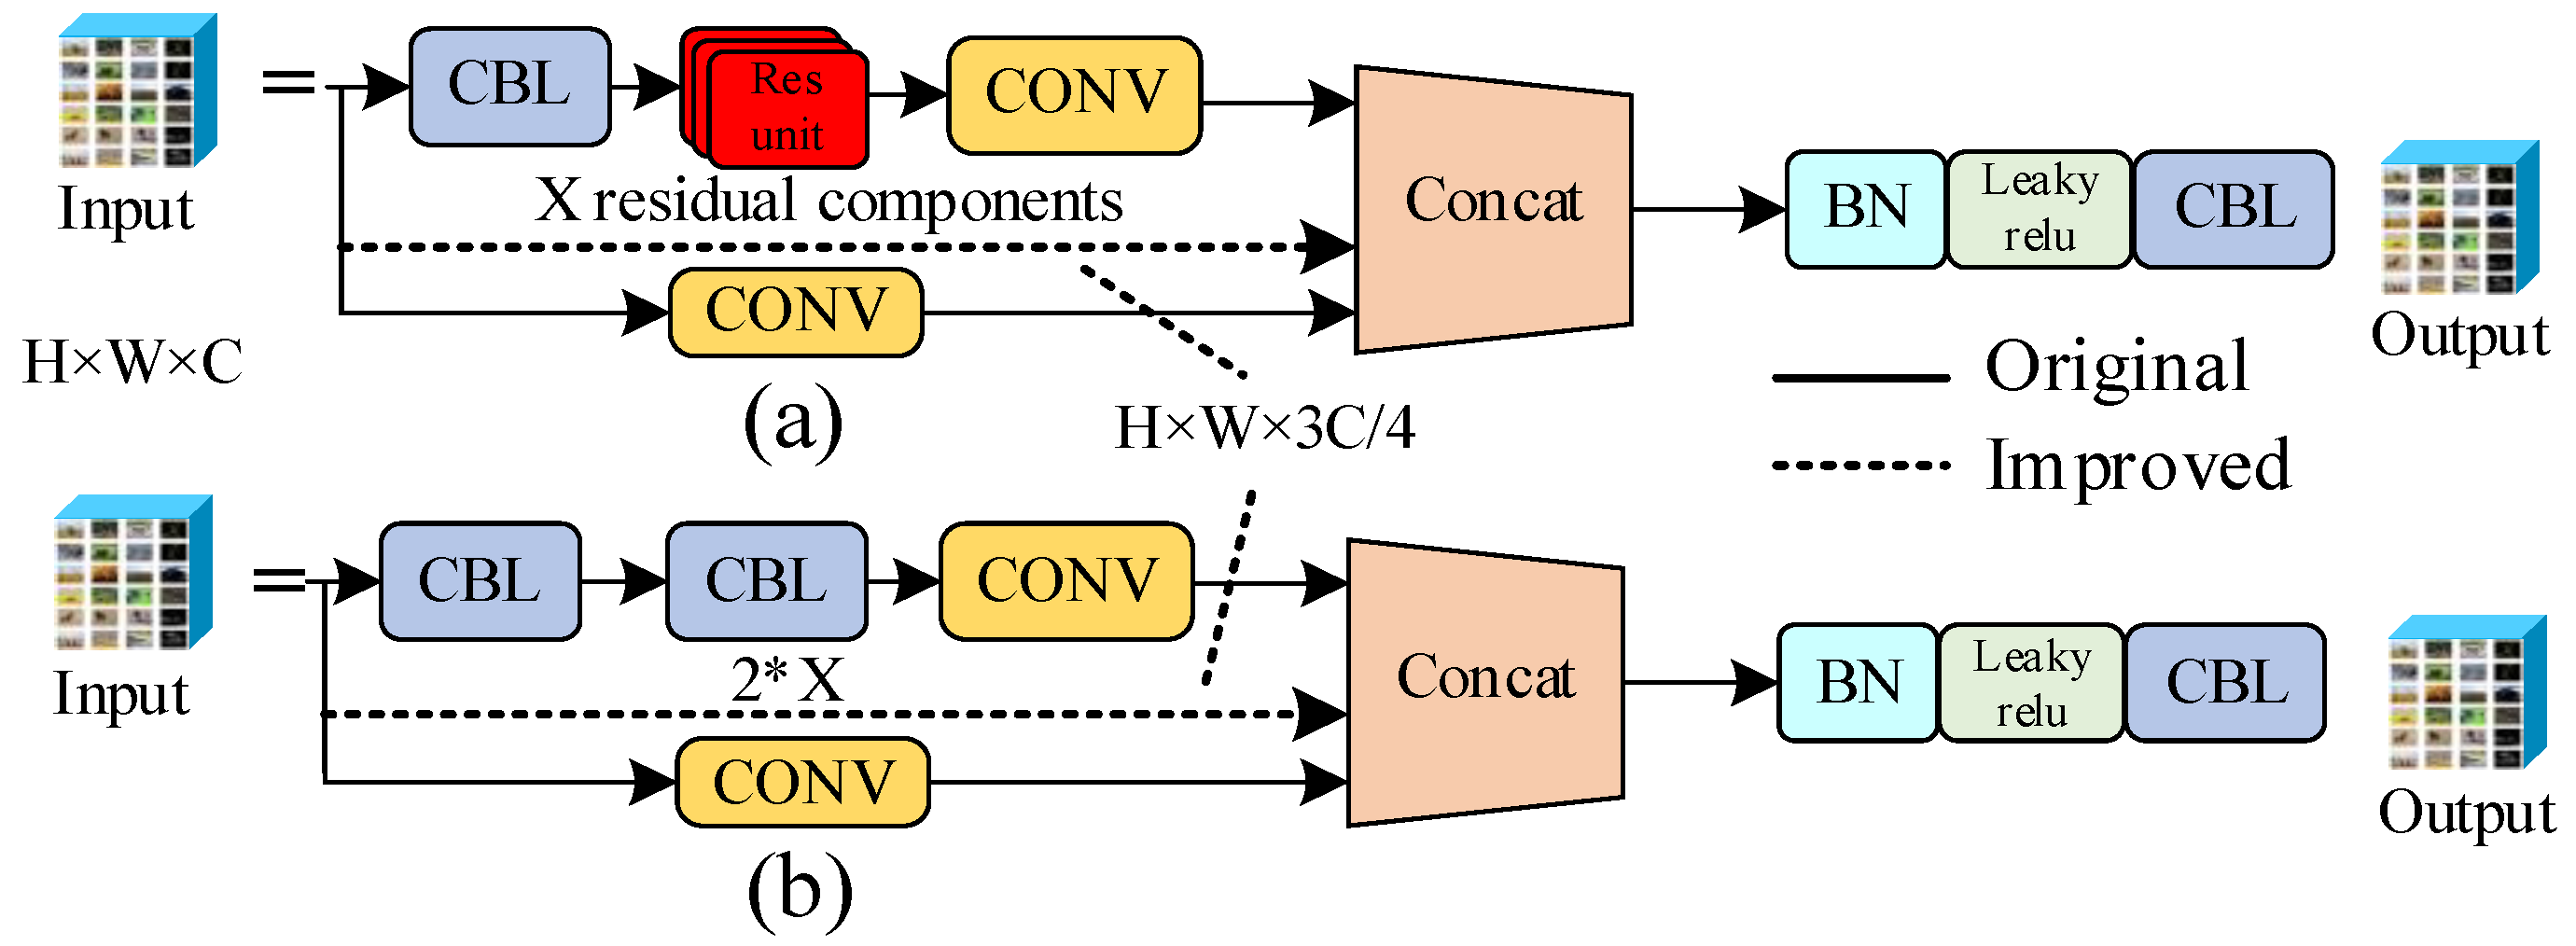
According to the architecture of the YOLOv5s network model, the backbone network contains three BottleNeckCSP modules, and there are more convolutional layers in this module. Although the convolutional layer can be used to effectively extract the features of a picture, there are also more parameters in the convolutional layer, which means that there are more parameters in the model, which leads to a decrease in calculation speed. In response to this problem, the BottleNeckCSP module is optimized in the backbone network. The convolutional layer of branch two is deleted, and the input of the BottleNeckCSP module is merged directly with the result of the branch one processing. This will lead to the increase of feature map channels after concat, so that the parameters of convolution will increase in output, and the number of parameters will remain unchanged after calculation. Considering the redundancy of the feature graph, a layer was deleted every four channels in the input channel of branch 2 to make the input channel 3/4 of the original, so as to reduce the number of parameters of the model under the condition of ensuring accuracy. The structure is shown in
Figure 5a,b.
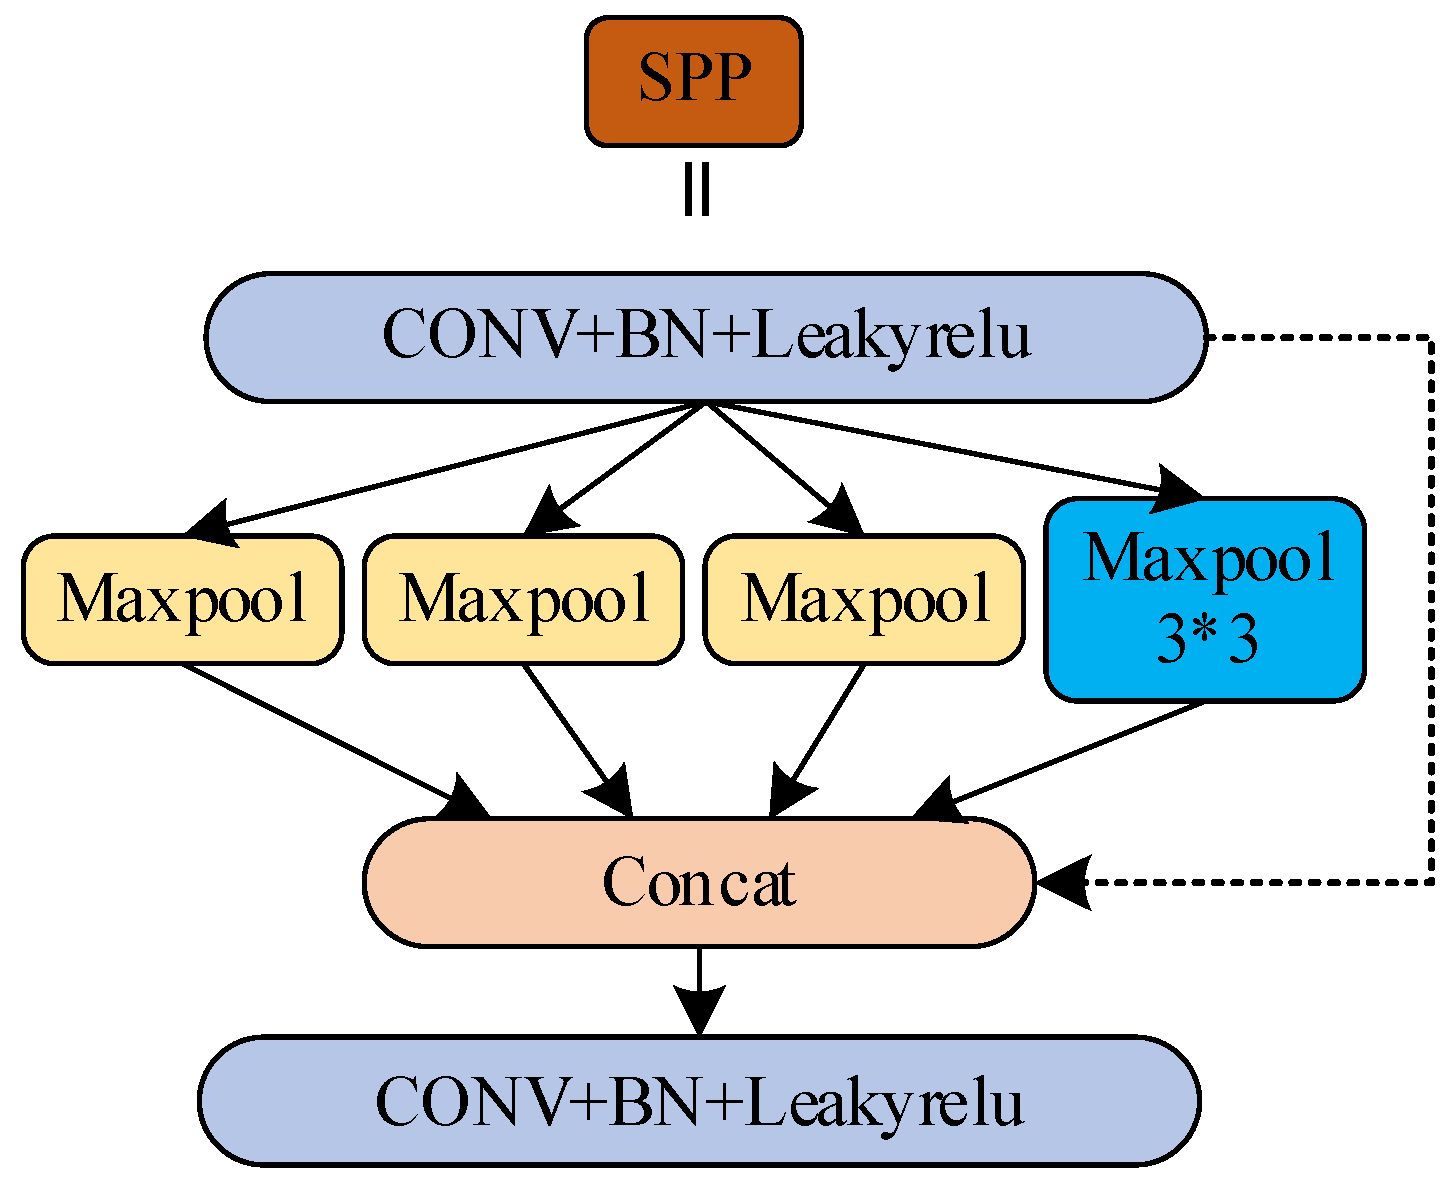
3.3.3. Optimize the SPP Module
While the drone is performing aerial photography, if the altitude is too high, it will cause the target to have small proportions in the image. The size of the input feature map of the SPP module is 512 × 19 × 19. After the convolution kernel of 256 × 512 × 1 × 1, the number of channels of the feature map changes, and the size of the output feature map is 256 × 19 × 19. Then, self-sampling this feature map with three parallel max-pooling layers, and then splicing the output feature map into the channel, outputting a feature map with a size of 1024 × 19 × 19. Finally, a feature graph with an output size of 512 × 19 × 19 is obtained after the 512 × 1024 × 1 × 1 convolution kernel. To improve the detection accuracy of small and medium targets, a 3 × 3 maximum pooling layer is added to the SPP module to improve the receptive field of the model. At the same time, in order to ensure that the number of input channels of the CSP2_1 module is consistent with the number of output channels of the SPP module, the weight matrix of the second convolution kernel in the SPP module is then increased by 1/4 of the number of channels. The improved SPP module is shown in
Figure 6.
3.3.4. Other Tricks
The YOLOv5s model has three detection feature maps, which are obtained from 8, 16 and 32 times of down-sampling respectively. The feature maps are 76 × 76, 38 × 38 and 19 × 19, respectively. The small feature map is used to detect the large target, and the large feature map is used to detect the small target. This paper tried to replace feature maps of different depths for splicing, so that the feature map paid more attention to the size of the target in the data set. However, due to the height change of UAV, the proportion of the target in the image changed greatly, so the experimental results were not ideal. Finally, the original network splicing method is adopted.
Anchor boxes of different sizes and proportions are set for feature maps of different sizes in YOLOv5s model. These anchor boxes are used to frame the target object. Through labeling, it can be found that the ratio of label width and height in the data set of this experiment is roughly distributed at 1:2 and 2:1. Therefore, it is necessary to modify the size of anchor boxes according to its own data characteristics before training. In this experiment, the size of anchor boxes 33 × 23 in 78 × 78 feature map was changed to 33 × 16, and the size of anchor boxes 116 × 90 and 373 × 326 in 19 × 19 feature map was changed to 116 × 60 and 350 × 180, respectively. The size of other anchor boxes basically conforms to the ratio of label width to height, so no modification will be made.
4. Results
4.1. Experimental Setup and Results Analysis
4.1.1. Dataset Introduction
Part of the dataset is generated by image-downloader, an open-source project that allows users to download images from Google, Bing, and Baidu websites by entering the name of the Image [
46]. The other part of the data set mainly comes from Vision China, and this website has video data specifically for aerial photography [
47]. The dataset includes six prairie animals, elephants, zebras, bison, wild horses, giraffes, and hippos, each with about 500 images [
48]. Consideration of different time periods, different angles, different distances and occlusions, etc., was achieved by rotating the pictures at different angles, adjusting the contrast, etc. The number of datasets was thus increased to 4 times the original number. The makesense.ai tool was used to label the grassland animals in the picture and divide the dataset into a training set and a test set at a ratio of 9:1. There were 3000 images in the basic dataset, and the resolution of most of the images was 1200 × 960. After data amplification, the total dataset contained 12,000 images. Meanwhile, YOLOv5 uses many effective data processing methods to increase the accuracy of the training model and reduce the training time. The main methods of data amplification are Mosaic and Cutout. In addition to these two methods, YOLOv5 also uses image perturbation, changes in brightness, saturation, and hue, the addition of noise, random scaling, random cropping, flipping, rotating, random erasure, etc., to expand the amount of data.
4.1.2. Model Training
The operating environment of this experiment was as follows: the GPU was a GeForce RTX 2080ti, the CPU was an Intel i9 9900K, the video memory size was 12 GB and the operating system was Windows 10; library files such as CUDA10.0 and OpenCV were installed, and the development language was Python, using the PyTorch framework. In this experiment, the method of stochastic gradient descent was used to train the improved YOLOv5s UAV grassland object detection model end-to-end. The parameters for training the improved model were set as follows: the batch-size parameter was set to 8, the initial learning rate was set to 0.001, the regular coefficient of heavy attenuation was set to 0.0005, the dynamic factor was set to 0.937, the coefficients of hue, saturation and brightness were set to 0.014, 0.65 and 0.45, the learning rate was set to 0.0032, and the number of training sessions was set to 300 times. After the training was completed, the optimal detection model file was saved, and the verification dataset was used to test the performance of the network model. The output of the network model was the probability of the target category being detected and its position in the image, which was selected by a rectangular frame.
4.1.3. Model Evaluation
In this experiment, Indexes such as Precision, Recall, F1, AP, mAP_0.5 and mAP_0.5:0.95 were selected to evaluate the performance of the grassland animal object detection model after training.
Precision reflects the ability of the model or classifier to correctly predict the accuracy of positive samples. The larger the value, the better the performance. Recall is the proportion of positive samples predicted to be positive samples to the total positive samples, and its performance is the same as Precision. Precision and Recall influence each other. Generally, if the accuracy rate is high, the recall rate will be low, and if the accuracy rate is low, the recall rate will be high. The
value is the weighted harmonic average of precision and recall. Taking an elephant to be detected in the picture as an example, TP means that the target in the picture was correctly recognized as an elephant, FP means that another target was detected was incorrectly recognized as an elephant, and FN means that the target in the picture was wrongly identified as belonging to another category.
AP represents the area under the Precision–Recall curve, while mAP denotes mean average precision, which is the average value of each category of AP. mAP_0.5 refers to the average value of all APs when the IOU threshold is set to 0.5. mAP_0.5:0.95 represents the average mAP for different IOU thresholds (0.5, 0.55, 0.6, 0.65, 0.7, 0.75, 0.8, 0.85, 0.9, 0.95). C represents the number of target types, N represents the number of IOU thresholds,
represents the current IOU threshold,
and
represent precision and recall.
4.1.4. Model Comparison
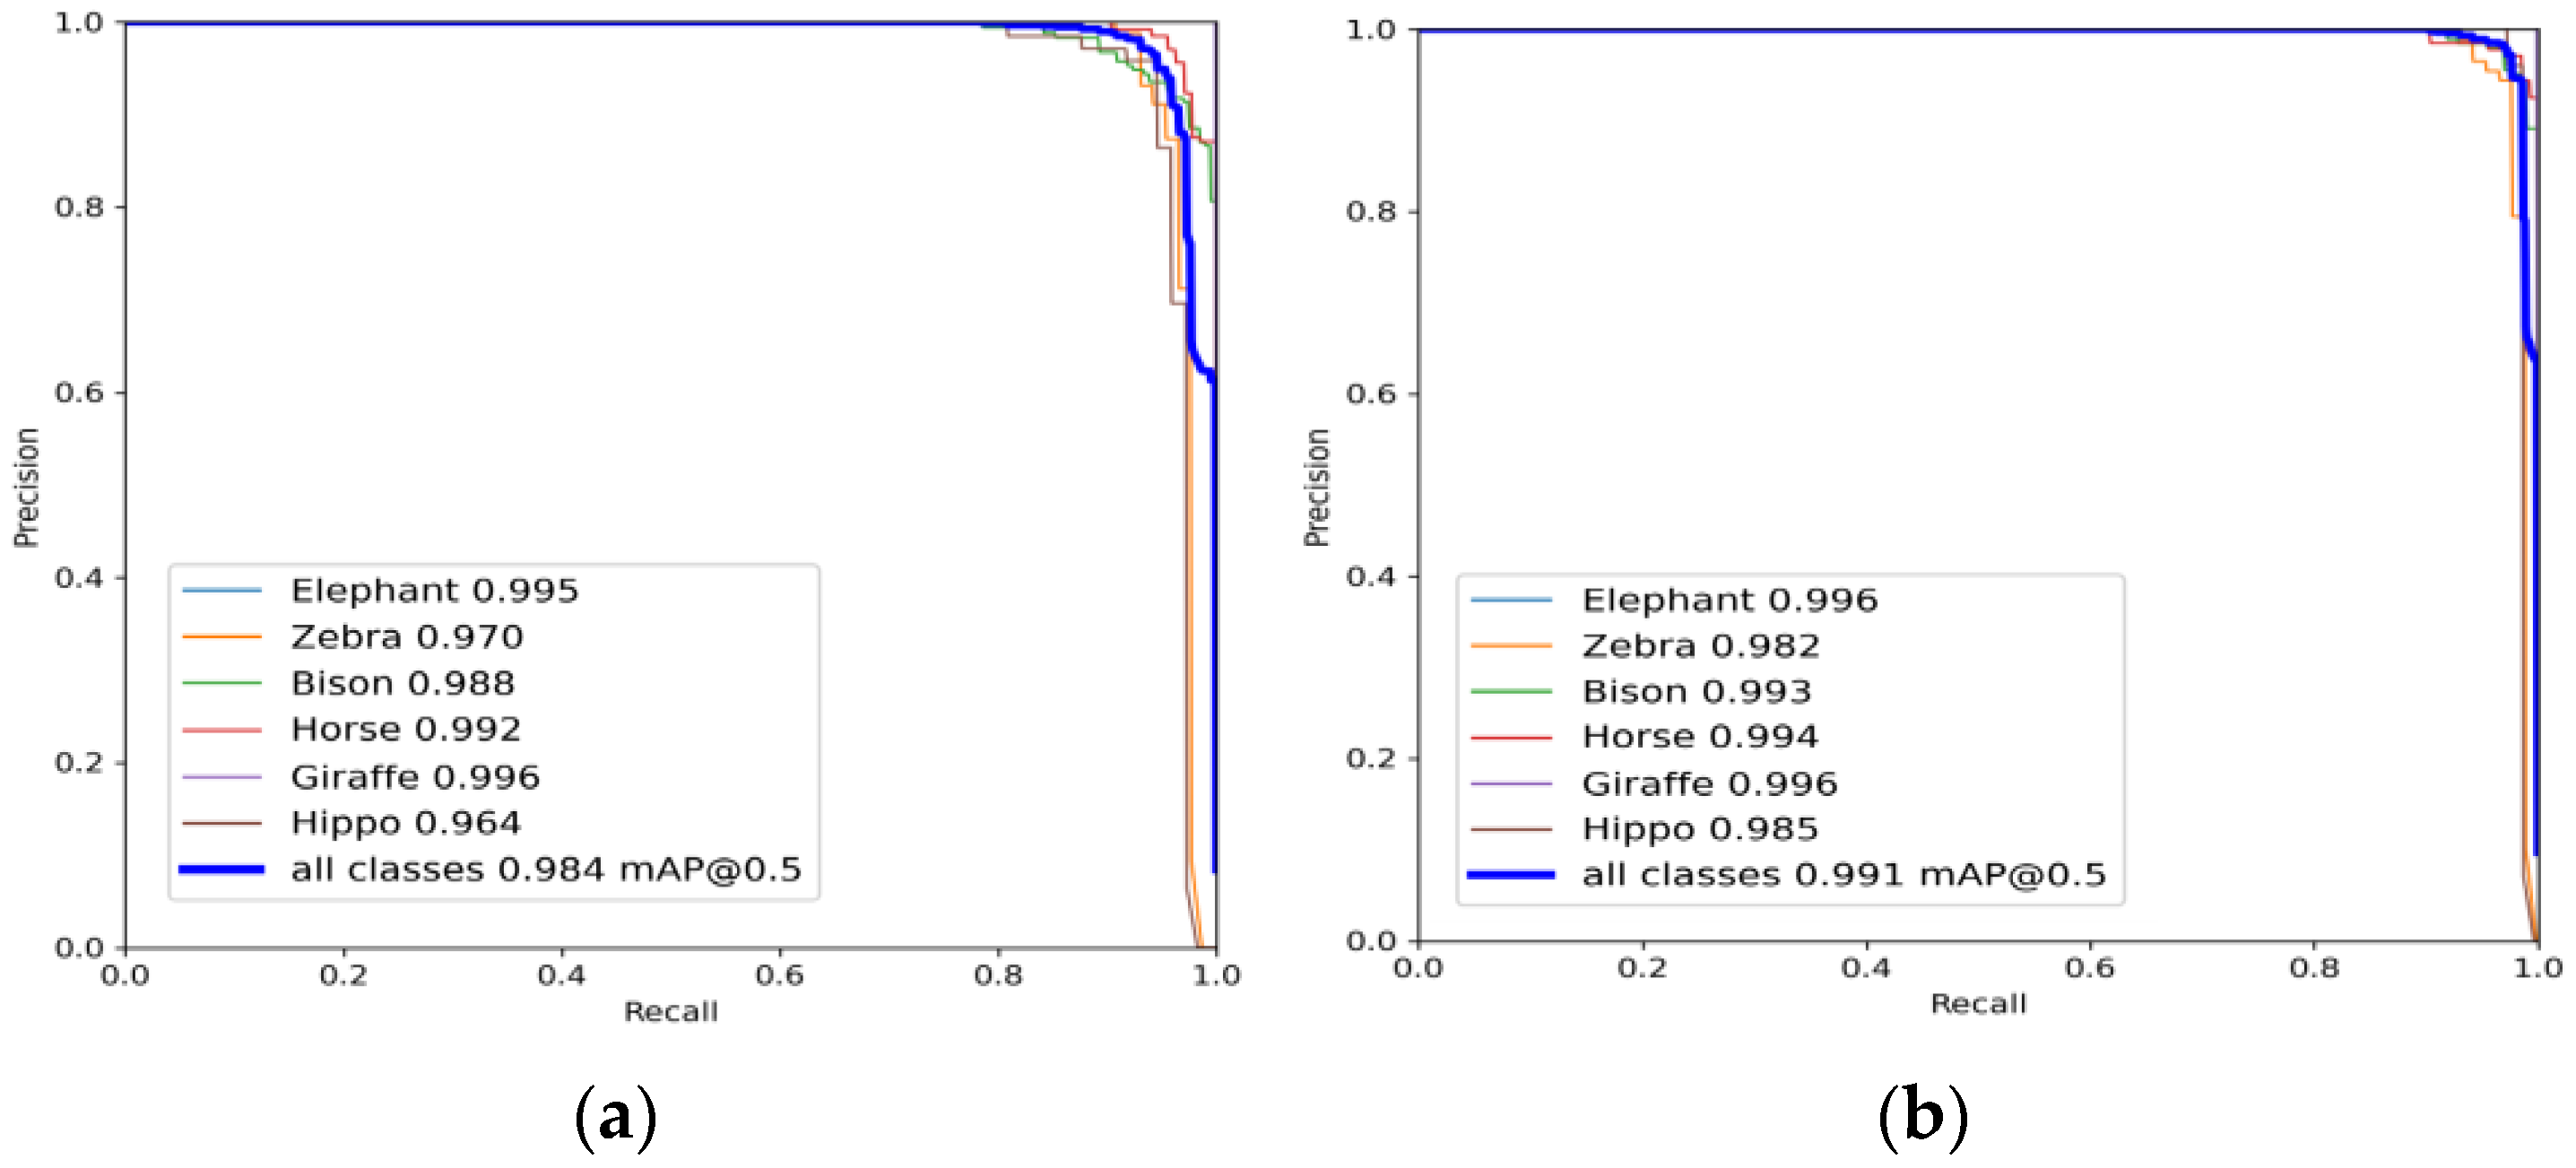
The PR curves of the YOLOv5s model and the improved YOLOv5s model after training are shown in
Figure 7.
The PR curves for each class in different models are presented in
Figure 7, and the specific information is summarized as shown in
Table 2. In the improved YOLOv5s model, only the average accuracy of giraffe detection was not improved, and the average accuracy of detection of the other five grassland animals was improved. It can be seen that the overall performance of the improved YOLOv5s model was better than that of the original model.
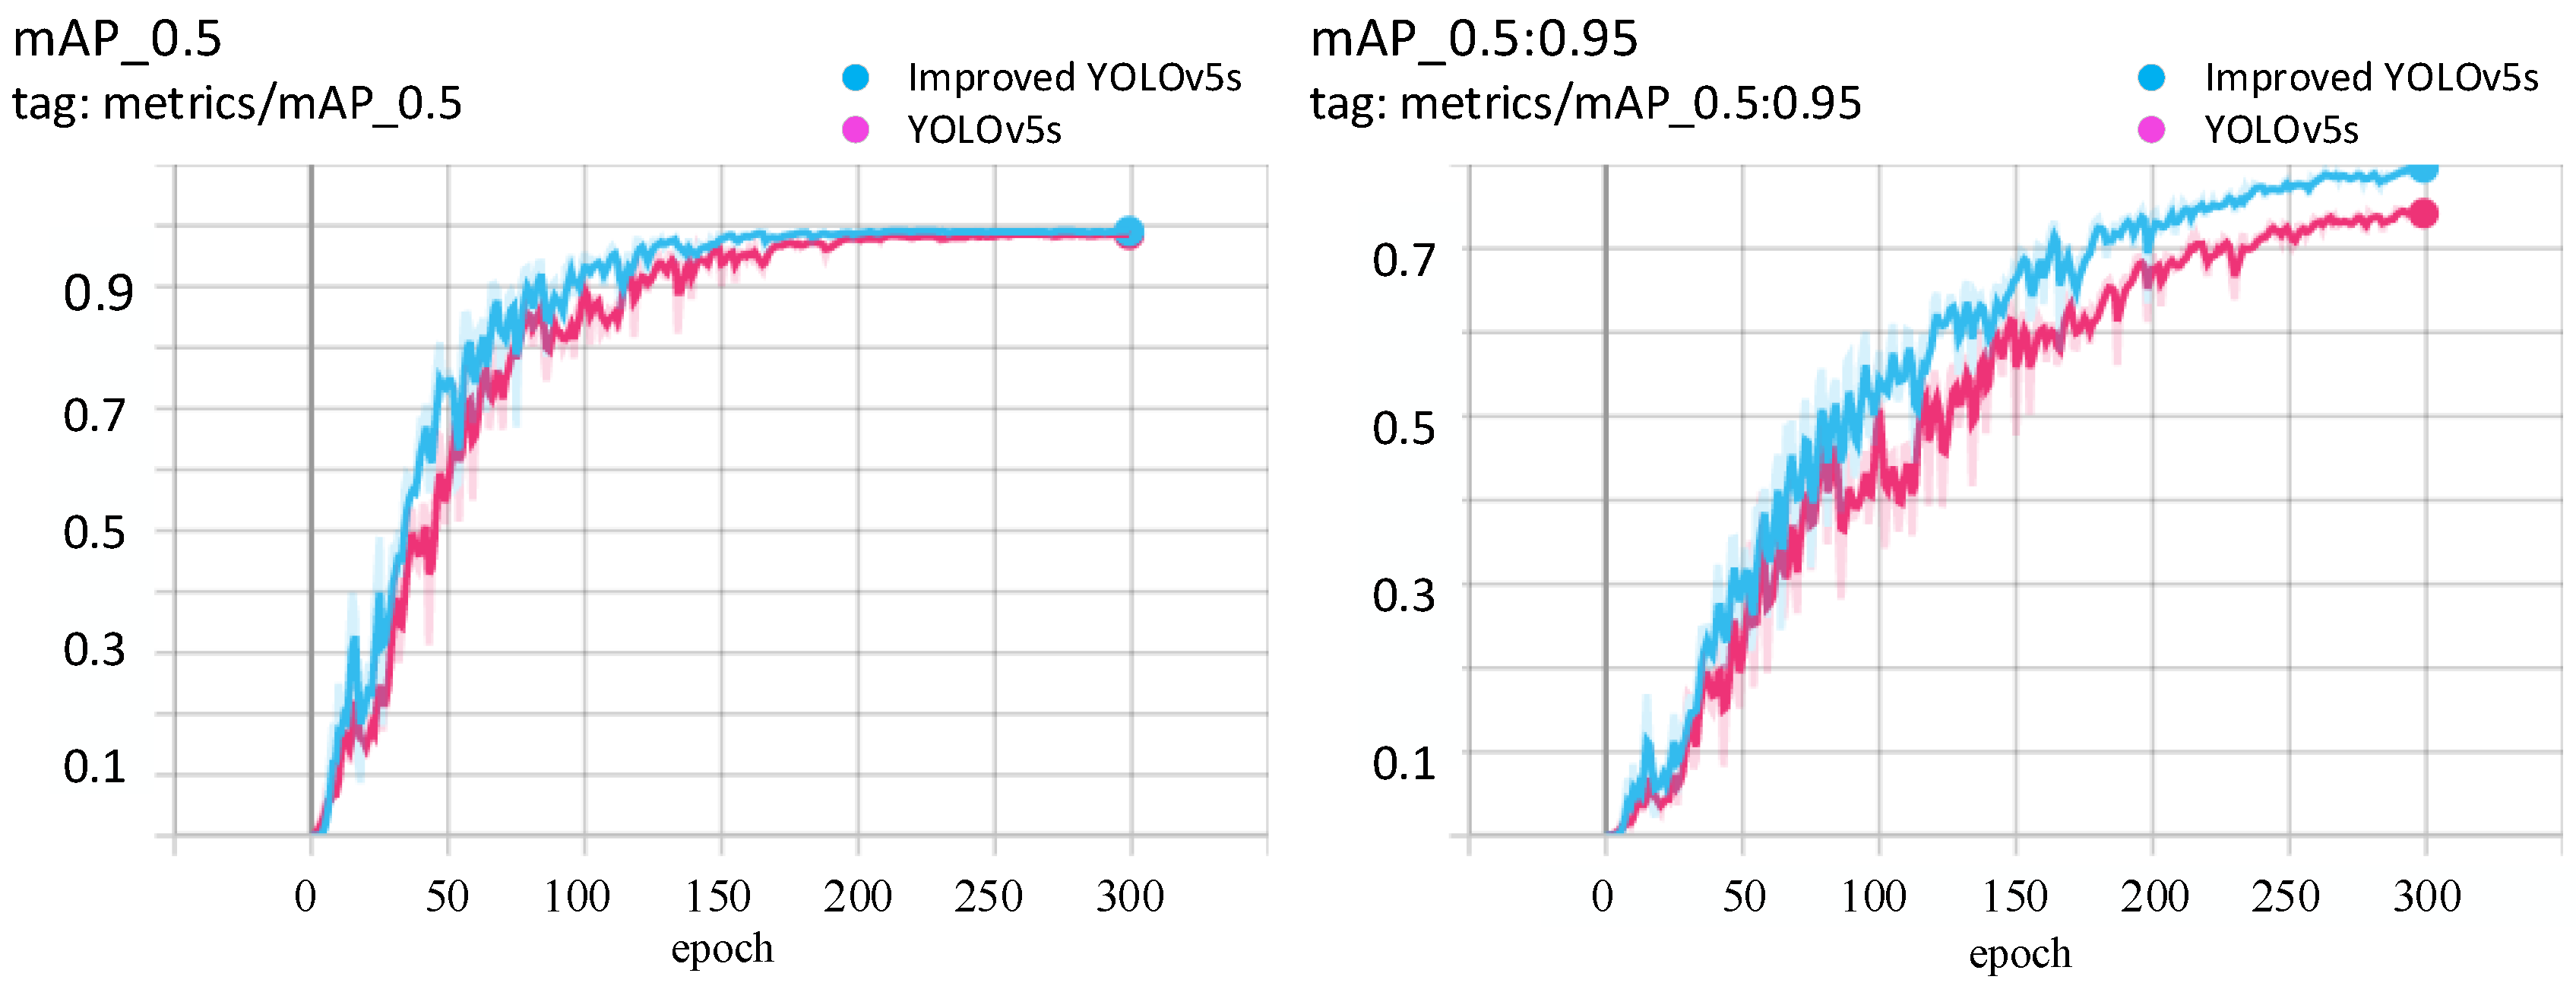
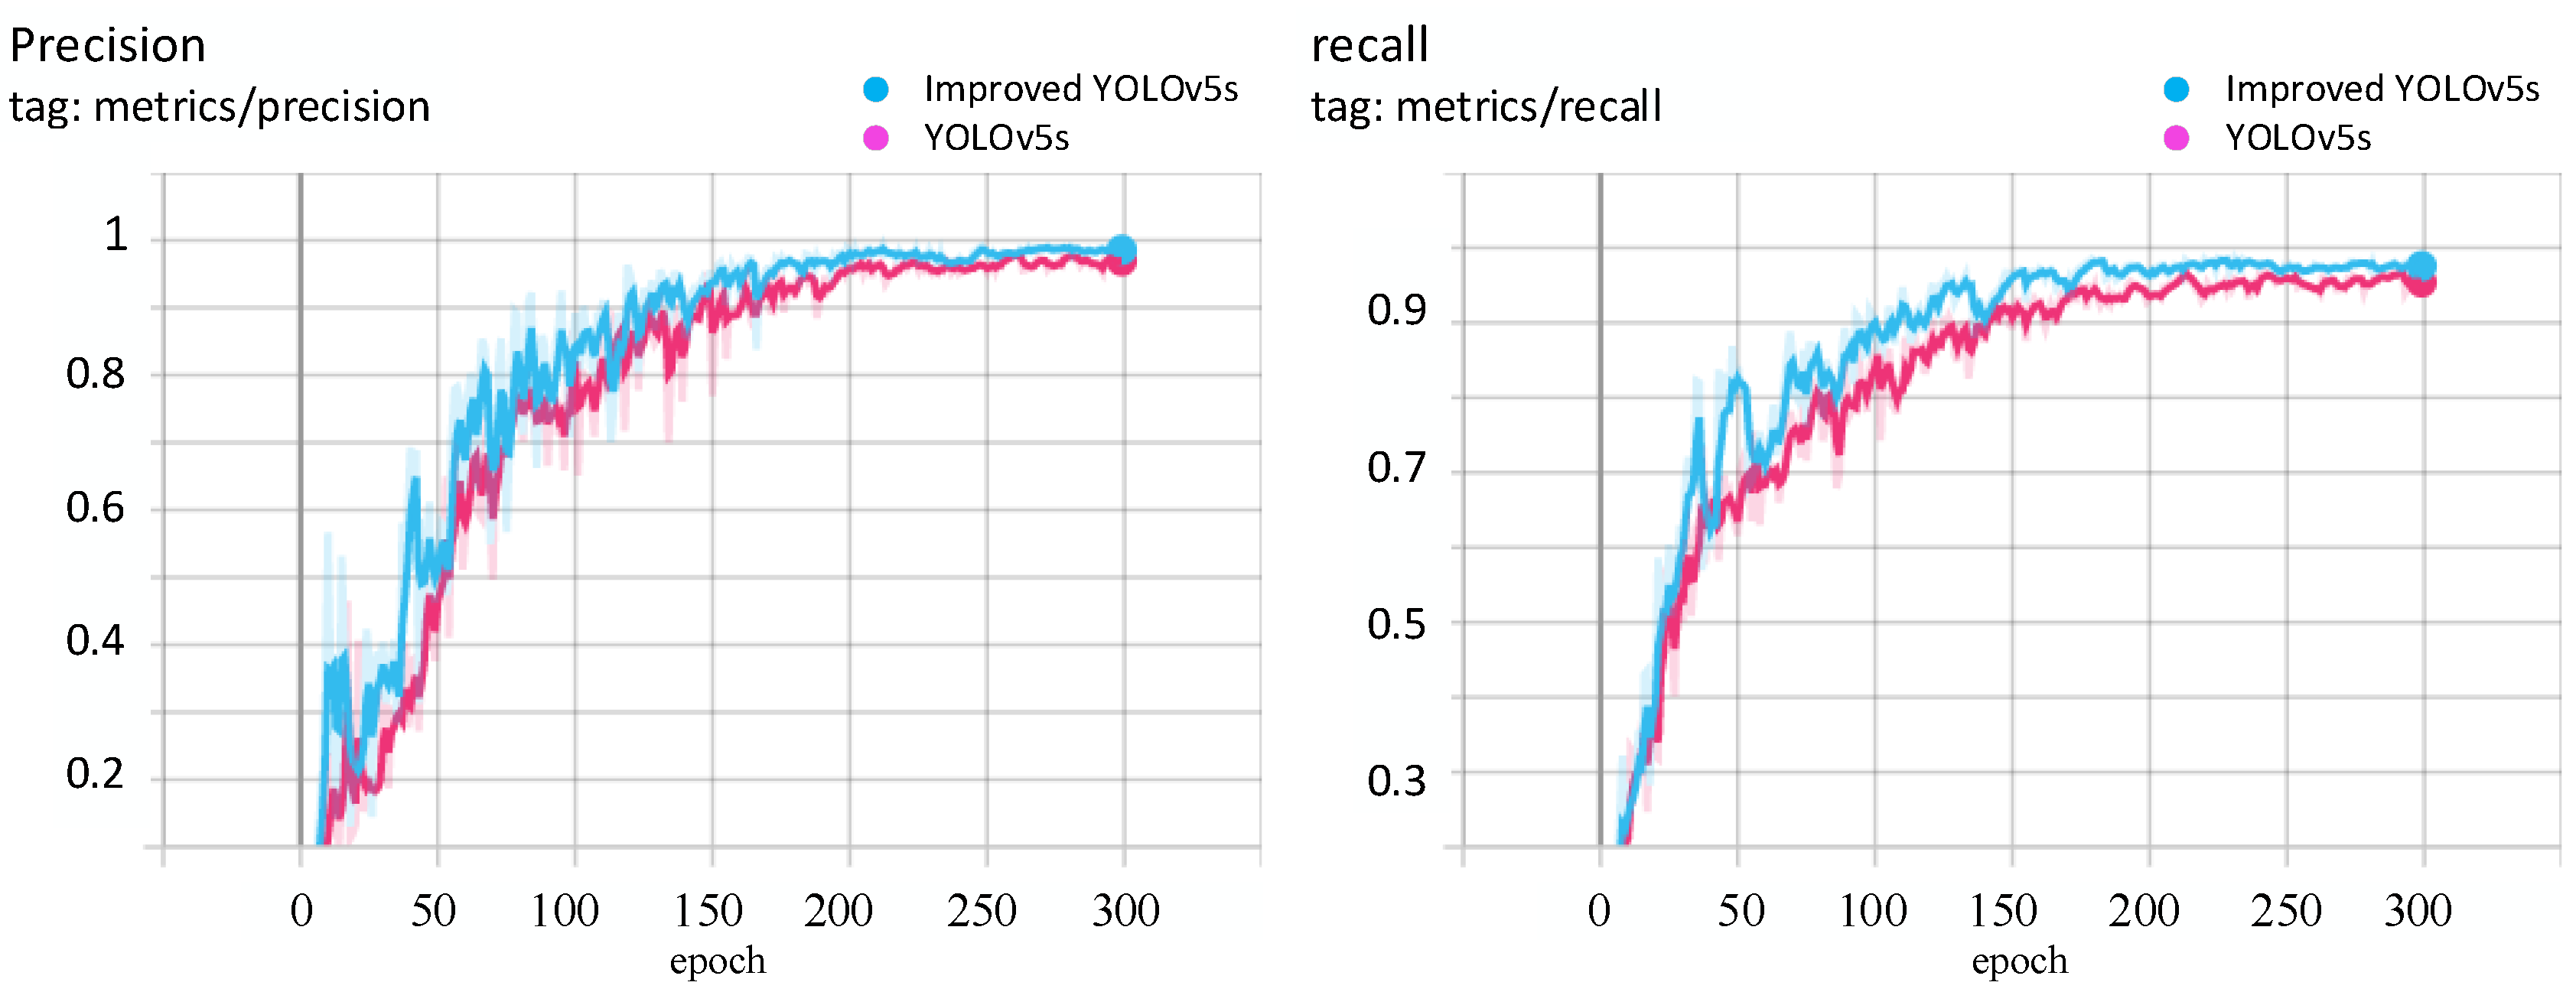
During the training process, tensorboard was used to draw the relevant curve. The data curves of Precision, Recall, mAP_0.5 and mAP_0.5:0.9 are shown in
Figure 8 and
Figure 9. The blue color corresponds to the improved YOLOv5s data curve, and the pink color represents the YOLOv5s data curve. In terms of speed and accuracy, the improved YOLOv5s model is better.
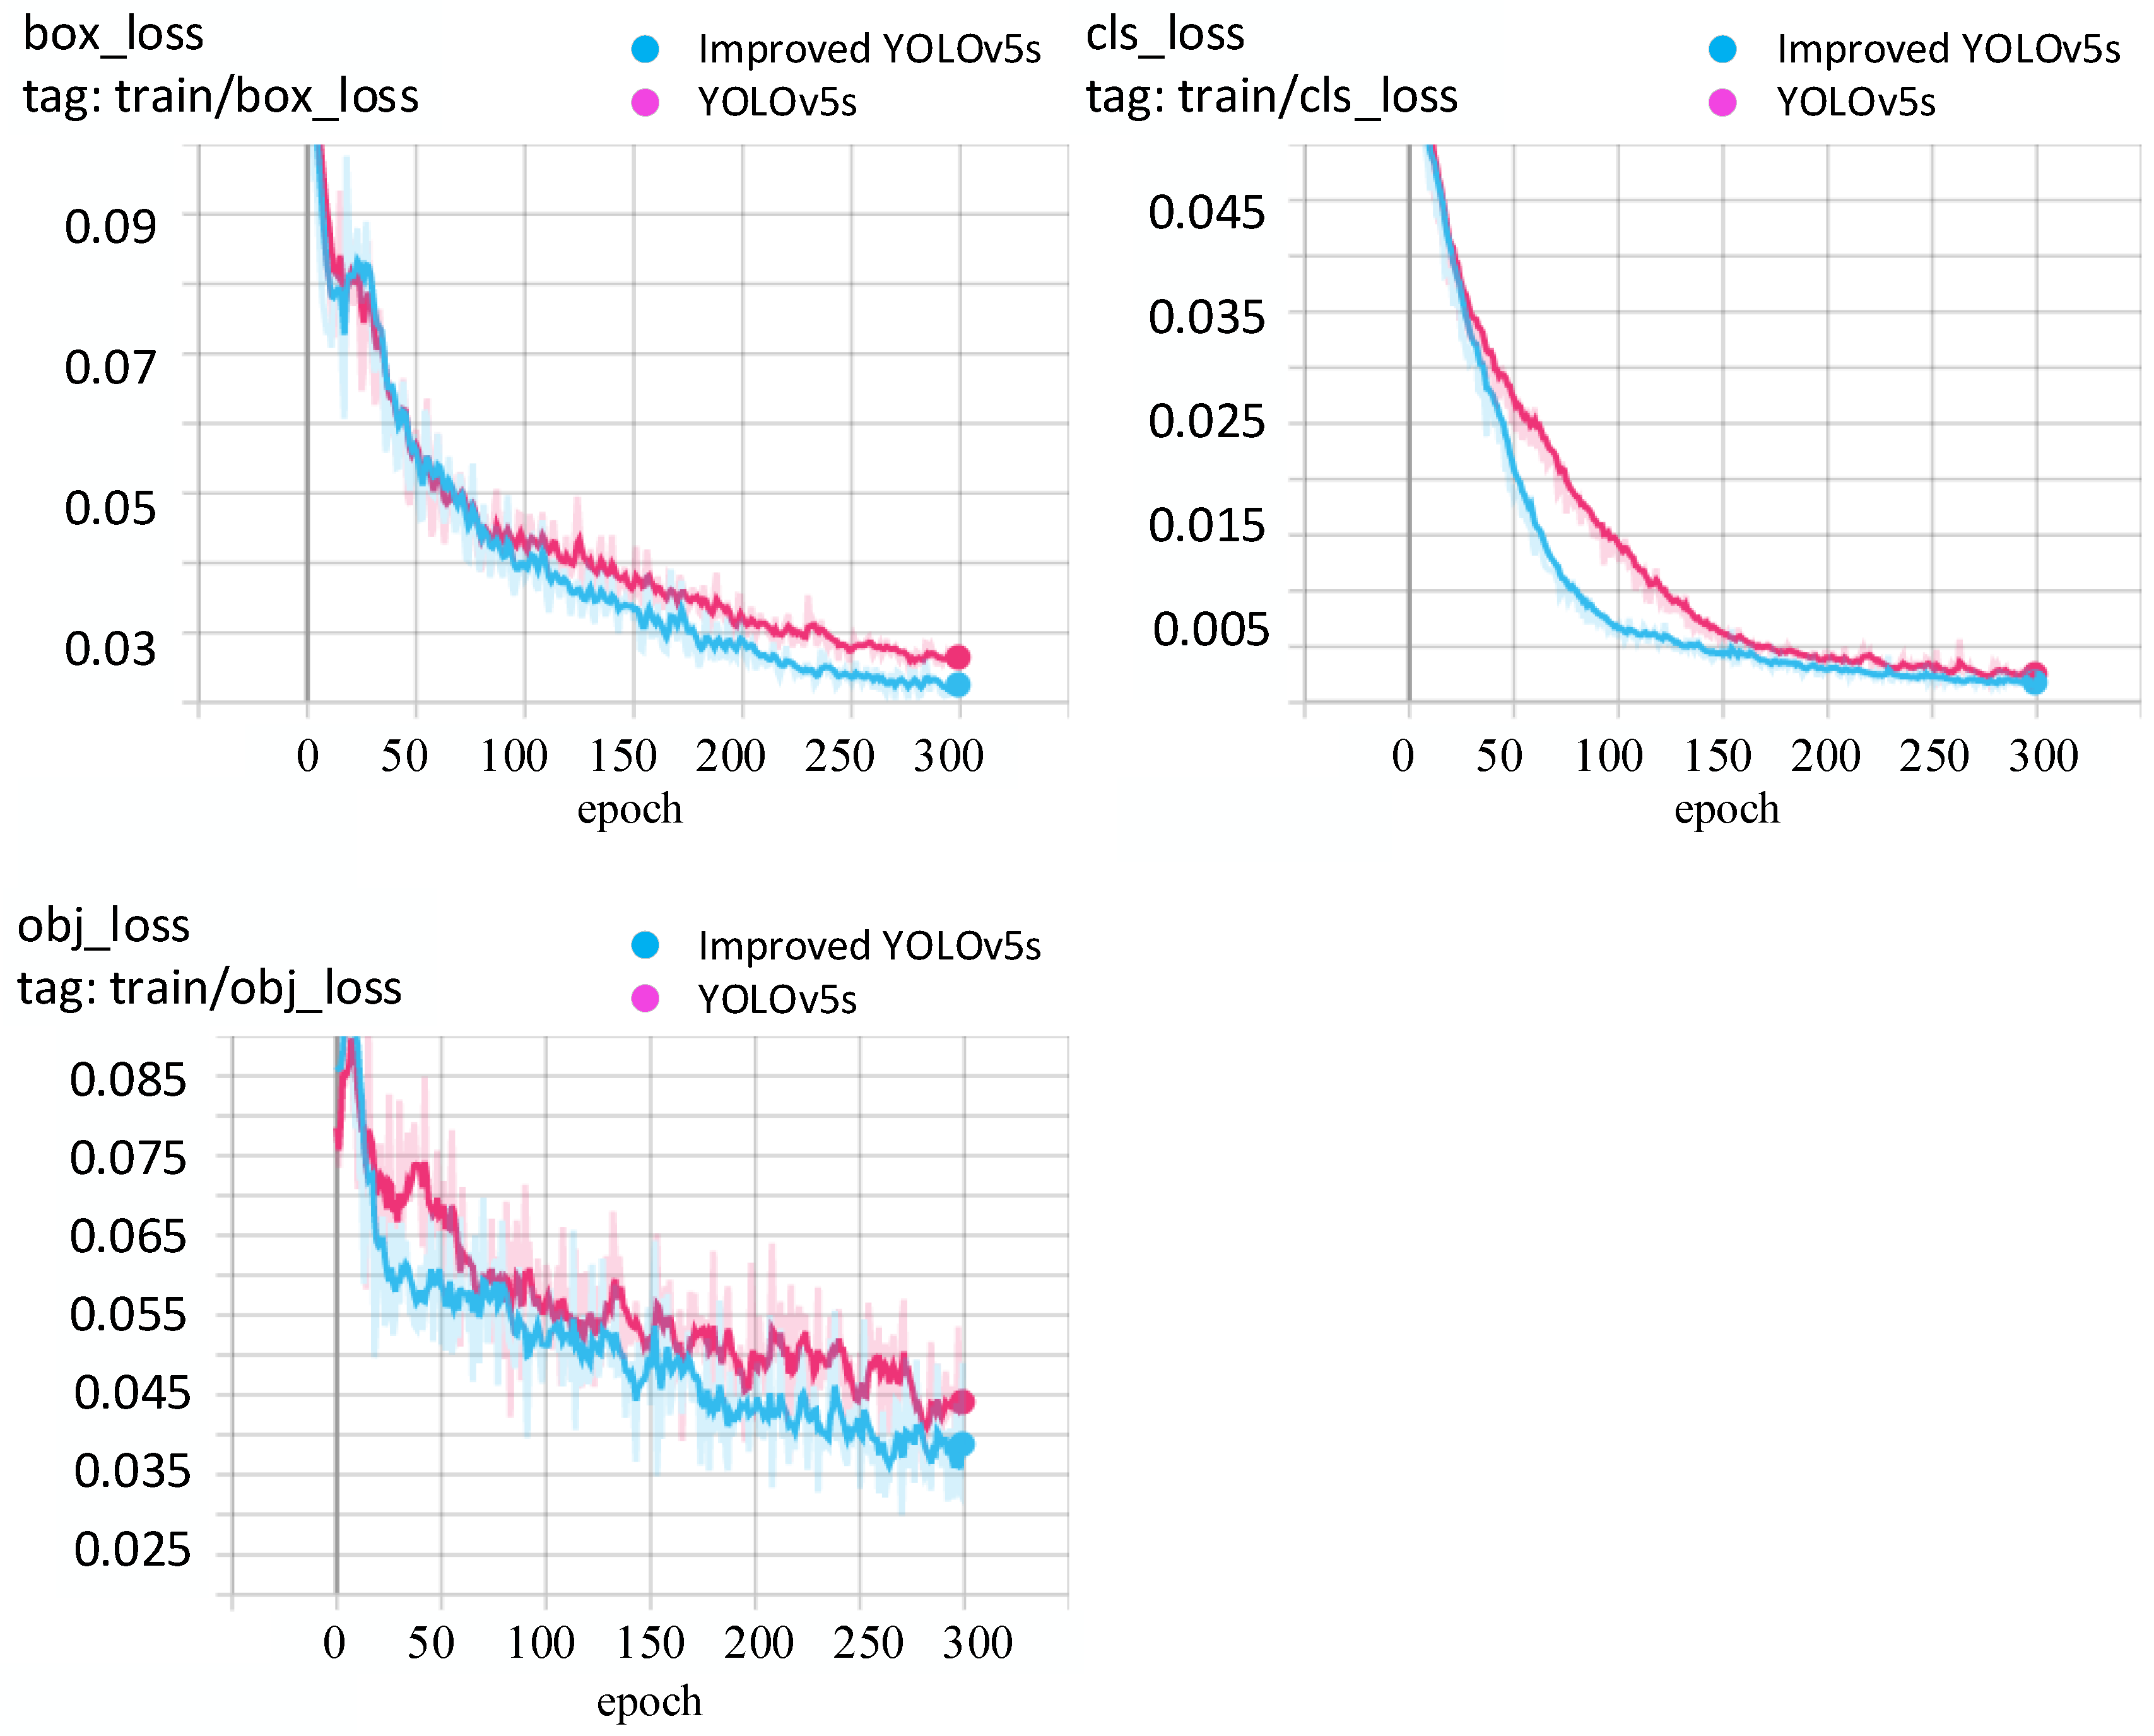
4.1.5. Loss Function Comparison
The last layer of the network model was compared with the objective function to obtain the loss function, the error update value was calculated, and the first layer was reached layer by layer through backpropagation, and the ownership value was updated together at the end of the backpropagation. The loss function can more intuitively reflect the performance of a classifier or model. The smaller the loss, the better the performance of the model or classifier. As shown in
Figure 10, the data curves of box_loss, cls_loss and obj_loss of the two models are shown in the figure. The blue color corresponds to the improved YOLOv5s data curve, and the pink color represents the YOLOv5s data curve. It can be seen that with continuous training, the performance of the two models improved gradually, and the improved YOLOv5s model converges relatively quickly.
4.2. Test Results and Analysis
The results of the detection tests are presented here. The test devices are the same as for the training machine. However, only in
Section 4.2.3, the test device is an NVIDIA-TX2 and the OS is Linux. This is to verify the computation speed and memory usage in an experimental environment similar to that of an actual UAV.
4.2.1. Test Result
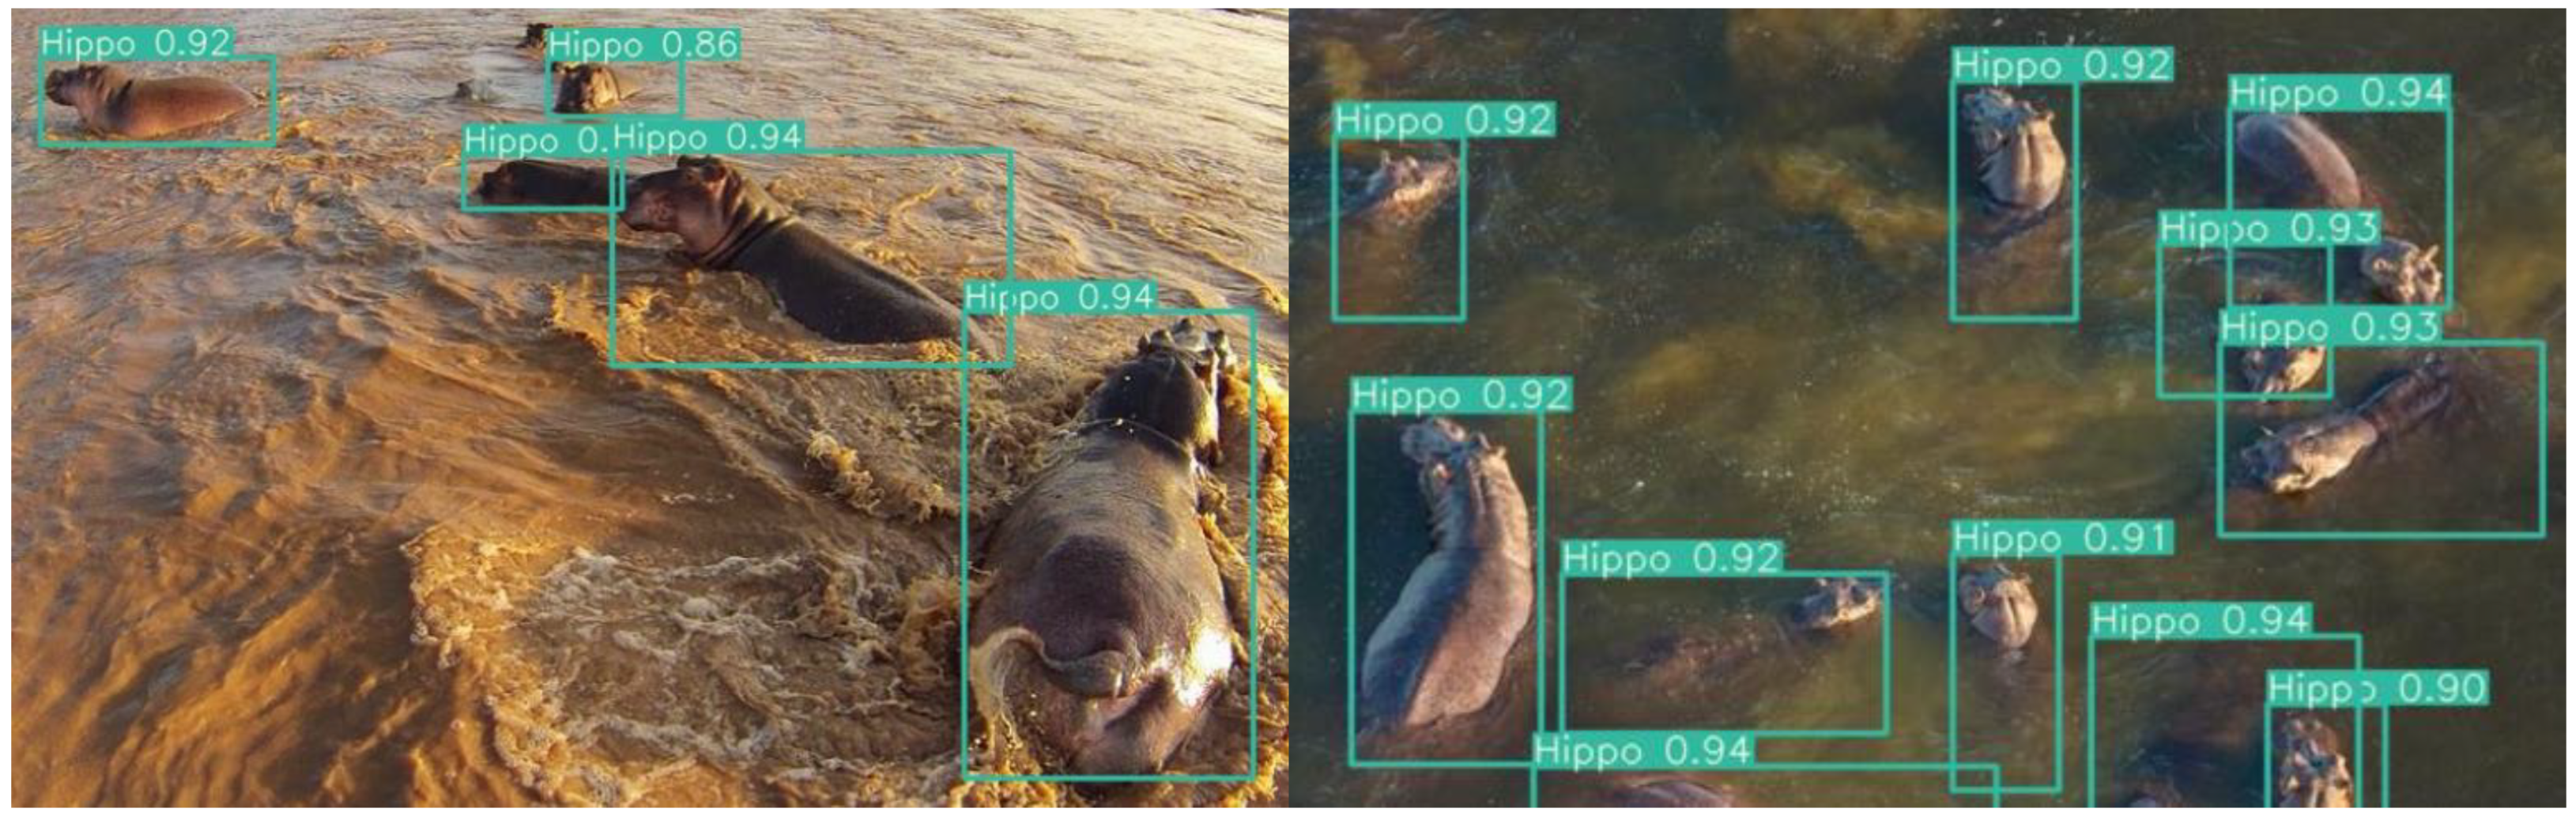
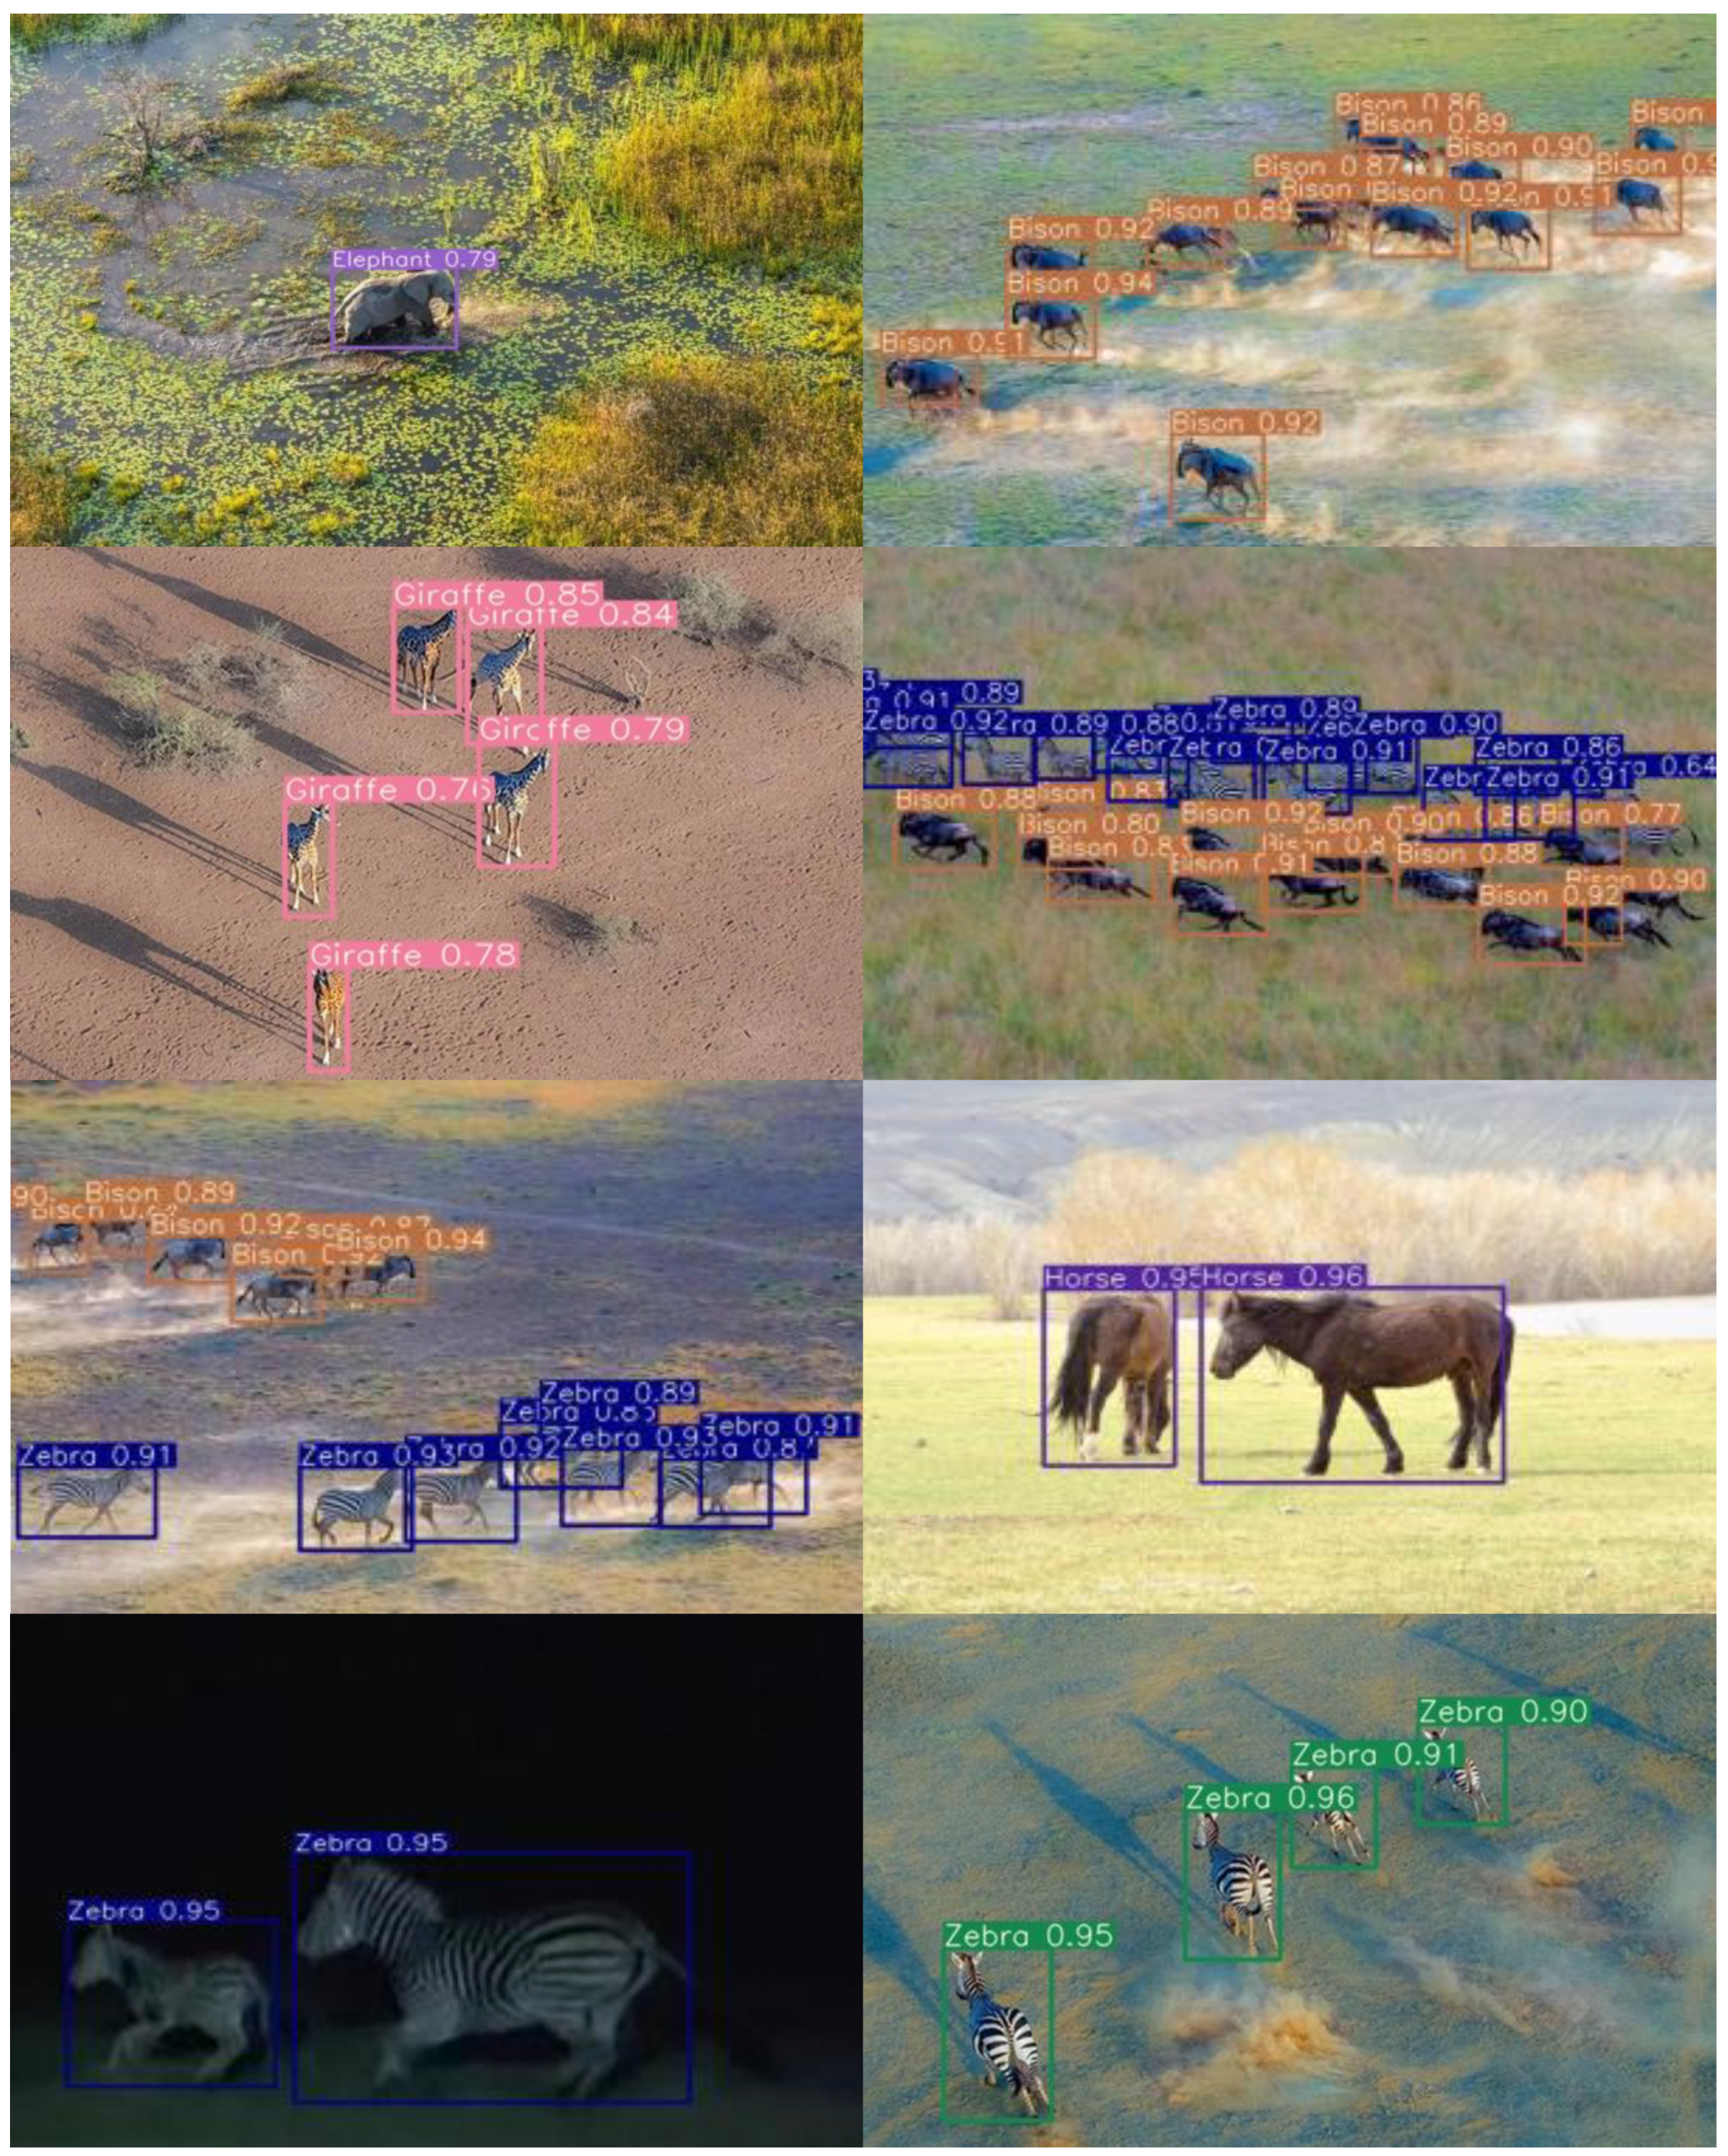
The test set was used to verify the improved YOLOv5s model, and its actual effect is shown in
Figure 11. It can be seen from the figure that the improved YOLOv5s model was able to correctly identify the six grassland animals in different time periods, from different perspectives, and with different target proportions.
4.2.2. Comparison of Results
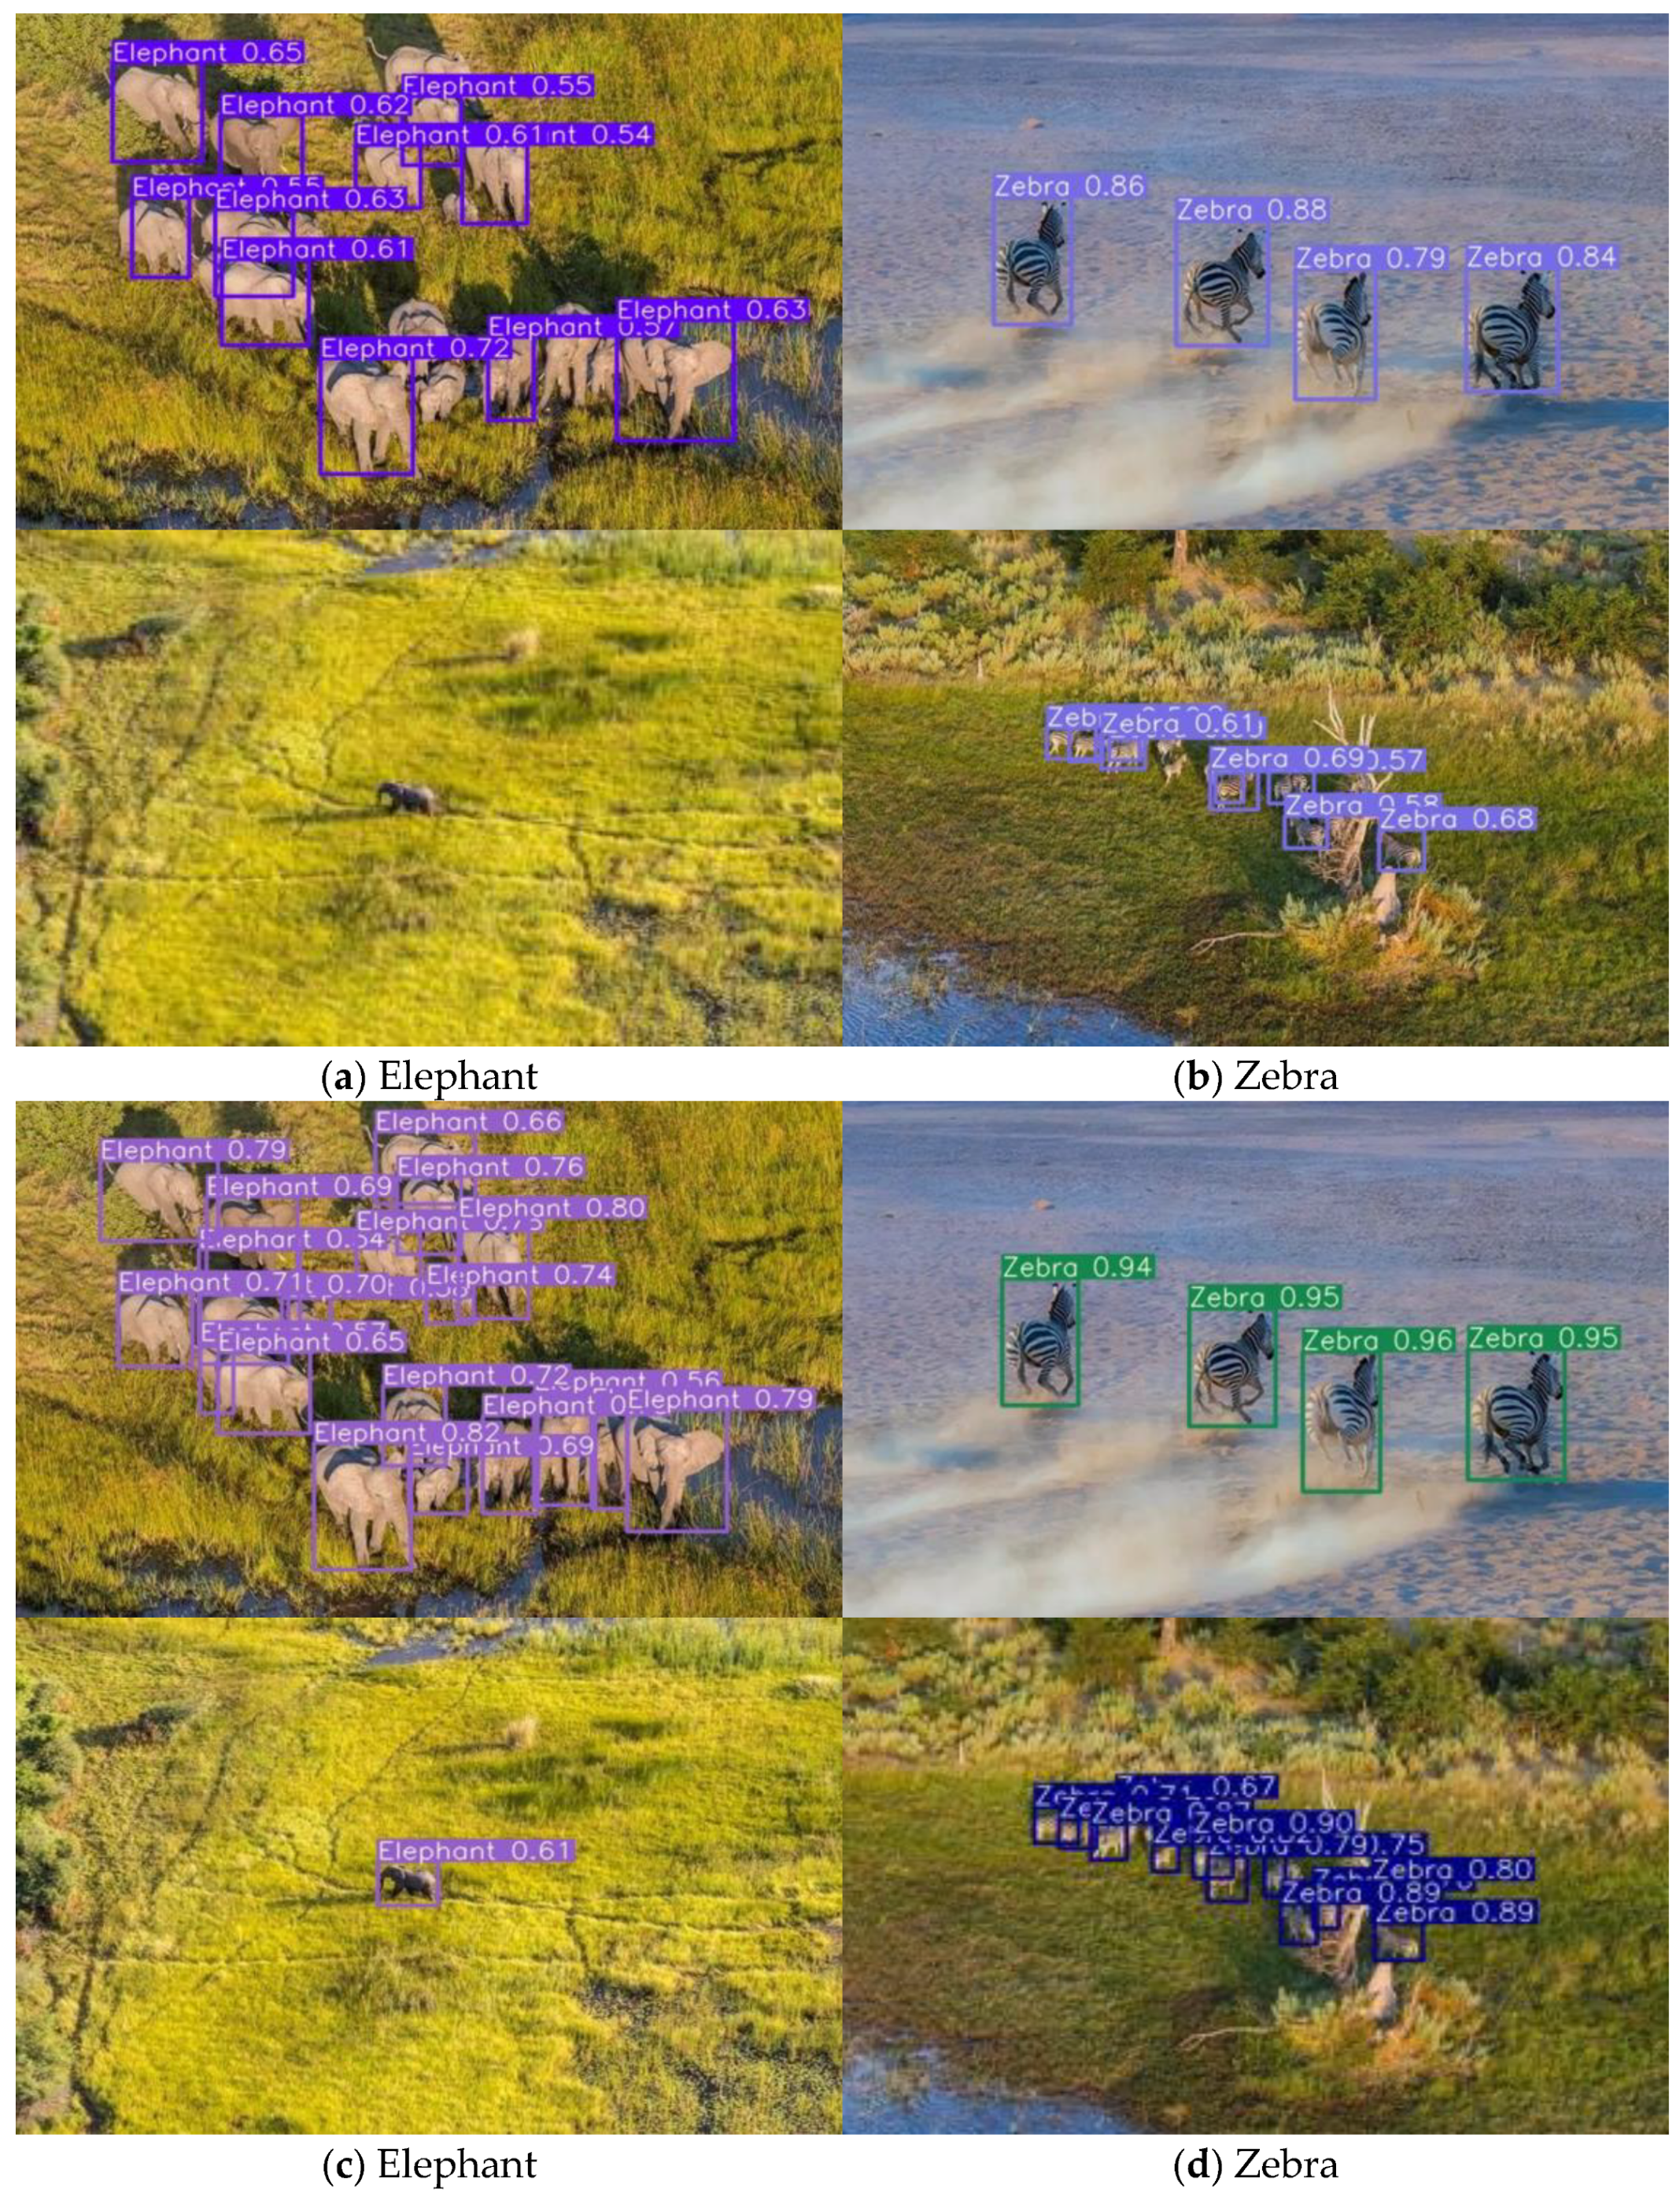
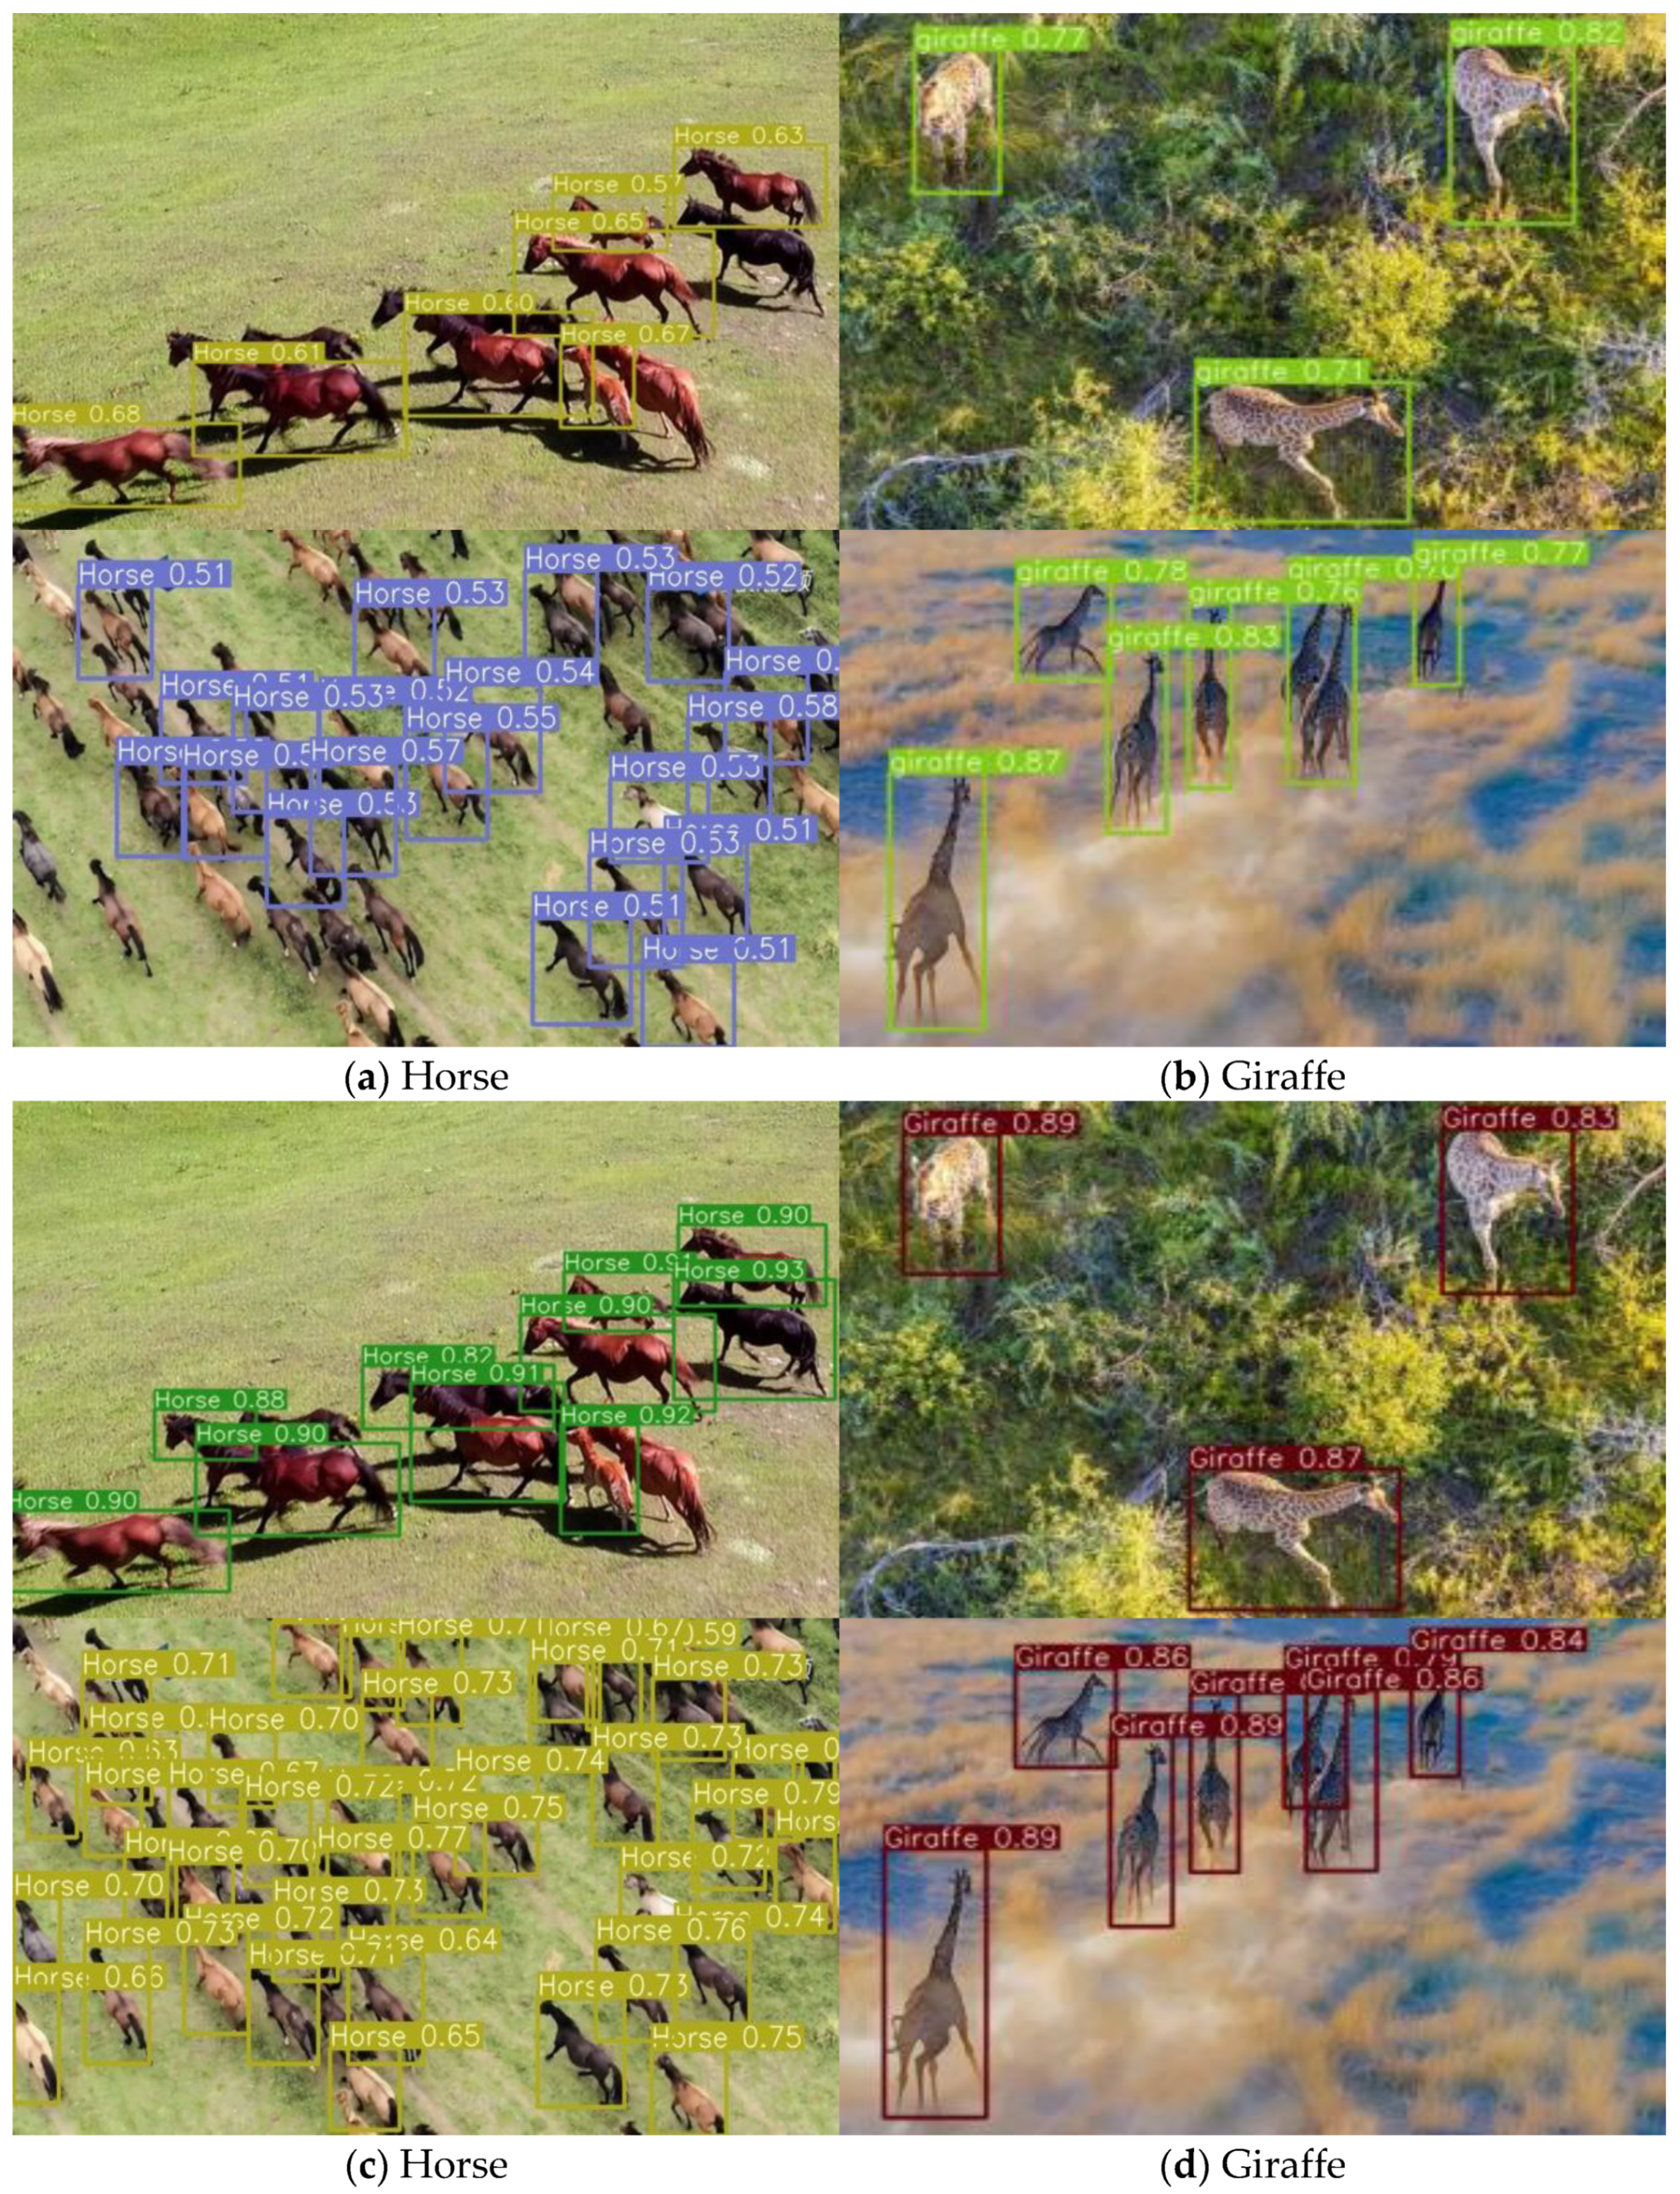
A comparison of the actual application of the improved YOLOv5s model and the original YOLOv5s model is shown in
Figure 12 and
Figure 13, with the value of IOU set to 0.5. If the value is lower than 0.5, the detection box will not be displayed. In
Figure 12a,c, the original YOLOv5s model was not able to identify elephants that were relatively small in the picture; elephants with moderate proportions in the picture could not be identified completely, only a part of them can be identified. The improved YOLOv5s model can correctly identify it. In
Figure 12b,d, the original YOLOv5s model was not able to identify zebras that were relatively small in the picture. The improved YOLOv5s model was able to correctly identify it. In
Figure 13a,c, the improved YOLOv5s model was also able to correctly identify small and medium targets. In
Figure 13b,d, both the original YOLOv5s model and the improved YOLOv5s model were able to achieve a correct recognition, but the improved YOLOv5s model had better recognition accuracy than the original YOLOv5s model.
4.2.3. Performance Comparison with Other Networks
To further verify the performance of the improved model at detecting grassland animals, the improved YOLOv5s model was compared with other models in the test set. mAP_0.5, mAP_0.5:0.9 and average detection speed were taken as the evaluation indicators of the model, and a comparison of the results is shown in
Table 3. The test device was NVIDIA-TX2.
It can be seen from
Table 3 that the mAP_0.5 and mAP_0.5:0.9 values of the improved YOLOv5s model are the highest, indicating that the performance of the improved YOLOv5s was the best among the YOLOv3, EfficientDet-D0, YOLOv4, YOLOv5s and improved YOLOv5s models. As far as the detection speed of the network model is concerned, the improved YOLOv5s model has an average detection speed of 26 fps in NVIDIA-TX2, which is a bit slower than the initial YOLOv5s model, but is better than the YOLOv3 model, EfficientDet-D0 model and the YOLOv4 model, which meets the requirements of drones for real-time detection of grassland animals. At the same time, it can be seen from
Table 3 that the size of the improved YOLOv5s model is only 12.8 MB, which is smaller than the other models. Experiments have proved that the improved YOLOv5s model not only ensures the accuracy of object detection, but also ensures that the network model is lightweight. In summary, among the four network models proposed in
Table 3, the improved YOLOv5s model has the highest mAP_0.5 value and mAP_0.5:0.9 value, and the scale of the model is also relatively small. At the same time, the detection speed is also better than that of the YOLOv3 model, EfficientDet-D0 model and the YOLOv4 model. Although the detection speed is lower than that of the initial YOLOv5s model, it can meet the needs of real-time detection using UAVs.
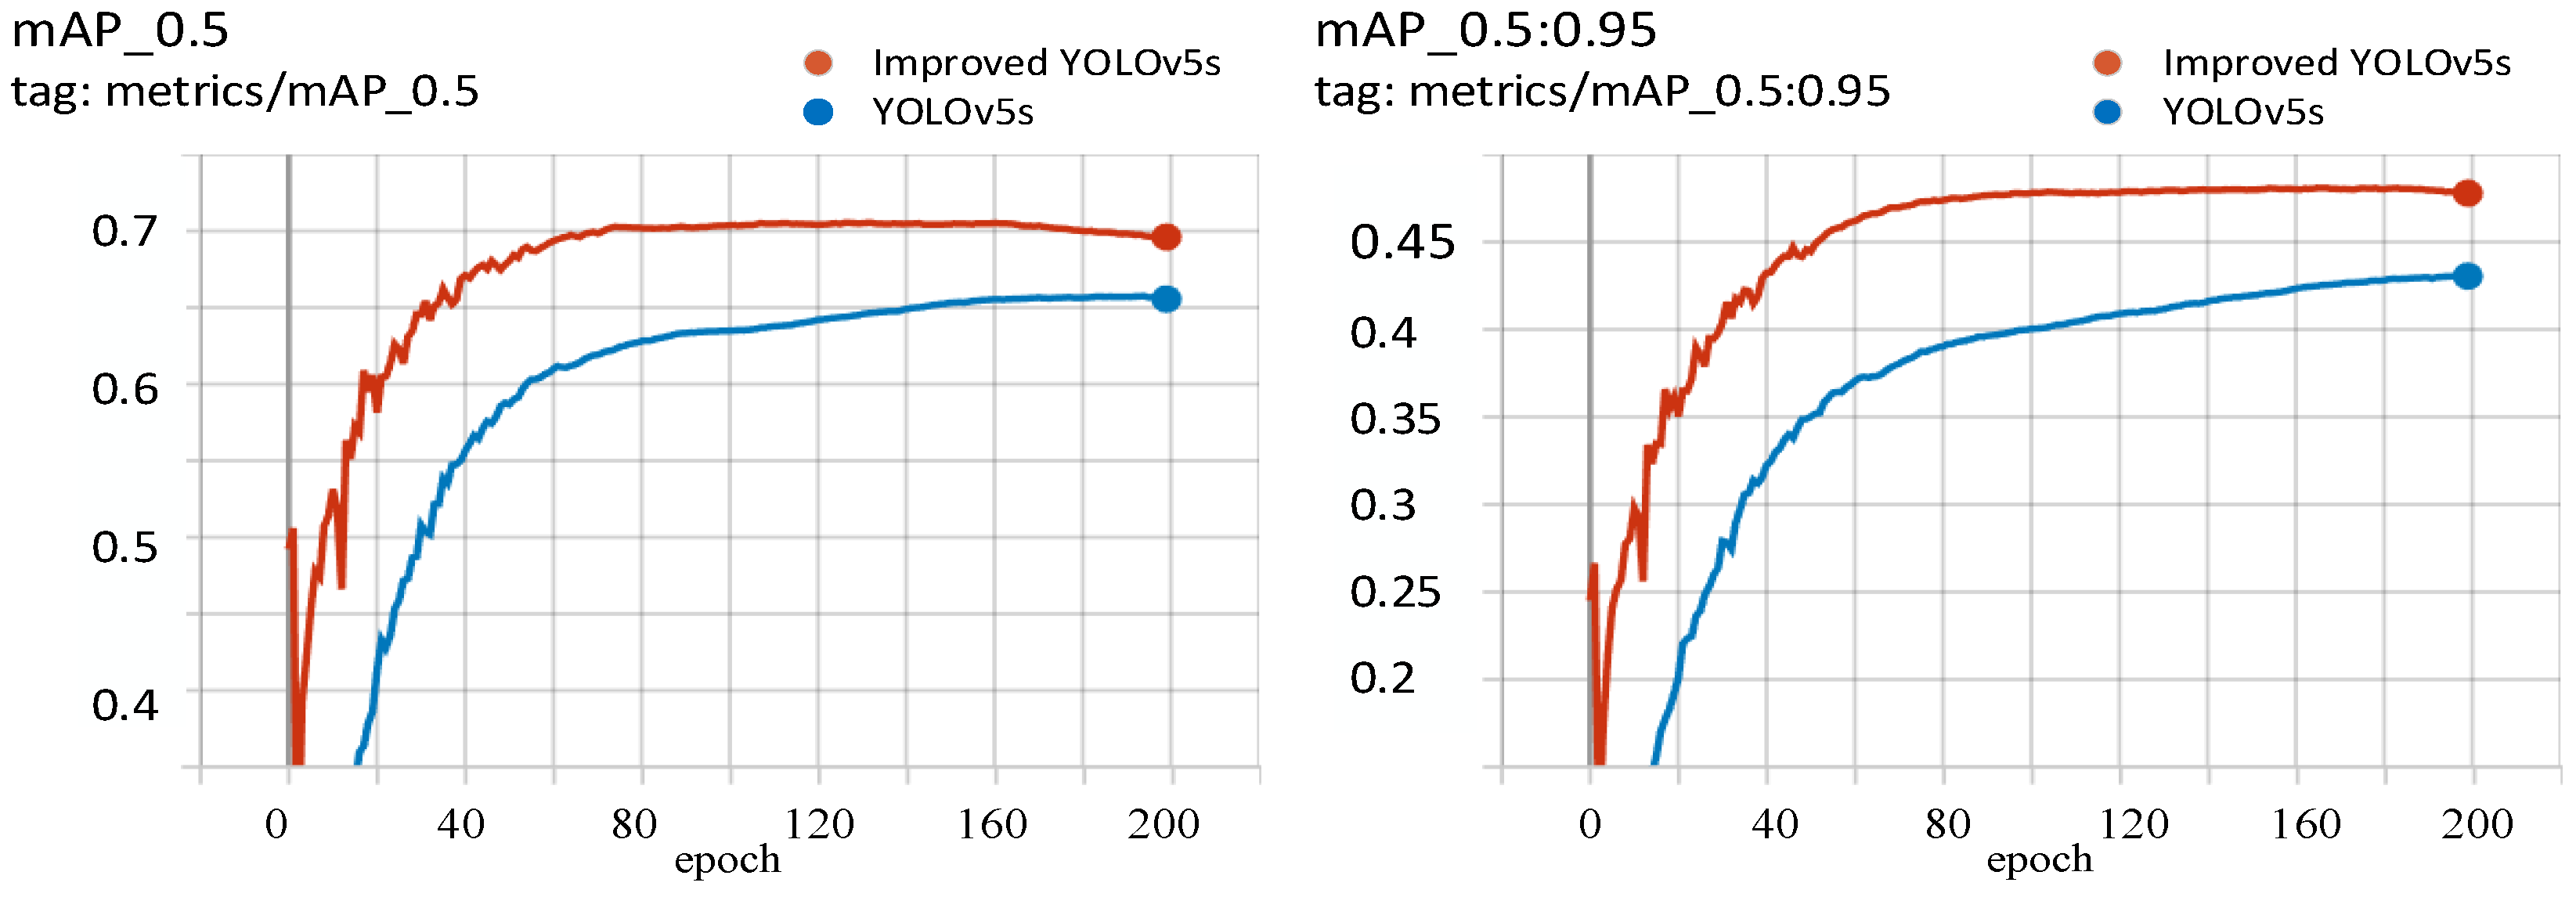
4.2.4. Pascal Voc 2012 Dataset Validation
The public dataset selected for this experiment is Pascal voc 2012, with 20 category types. Its tag format is xml, but YOLOv5 needs txt format file, so we need to convert the xml format tag to txt format first. Then the 17,125 images were divided into training and validation sets, with 13,637 images in the training set and 3488 images in the validation set. The training conditions are consistent with those described above, and their results on the validation set are shown in
Figure 14. In the mAP_0.5 and mAP_0.5:0.95 metrics, the improved YOLOv5 is 0.047 and 0.05 higher than the original model, respectively.
5. Discussion
For the problem of false positives, test sets were selected to test the performance of the model with 1612 label targets. Positive samples with an IOU threshold greater than 0.5 and negative samples with an IOU threshold less than 0.5 were selected. The number of true positives was 1548, the number of false positives was 48, and the number of false negatives was 64. False positive image types tend to have similarities between the target to be detected and the background, which may be mainly due to the following three reasons. Firstly, the content of the image. When training the model, in order to improve the generalization of the model, data enhancement is generally used to simulate complex situations such as different illumination and different angles in the image. This process may make some images too bright or too dark. After these images have been extracted by the model, if they are similar to some background features extracted by the model, the model will detect the background as an object. Secondly, it is necessary to consider the scope of the bounding box. In the process of model training, it is necessary to provide the position of the target in the picture, that is, the enclosing rectangle. However, the general target to be detected is not a rectangle, and there will be some background contents inside the label, which could also be responsible for the false positive. Thirdly, when the drone is flying at high altitudes, the characteristics of wild animals are proportionally relatively close, which could also be a reason for false detection.
A test video can be found at reference [
49]. The overall effect is ok, but there are some shortcomings. Some elephants are sometimes misidentified as giraffes. We guess that the reason for this is that during the training of the model, part of the data enhancement darkened the picture to which the giraffe belongs, which would make its features similar to those of the elephant in the video, thus leading to misidentification. The problems of the missed detection of small targets and the difficulty of detecting occluded objects in videos still need further research.
One thing to note is that the lightness of the model facilitates deployment. The speed of wildlife detection is also extremely important for drones. The recognition speed in Jinbang Peng’s [
15] paper was 2–3 fps, and was not able to meet the requirements of real-time detection by UAV. The detection speed of the model proposed in this paper is 26 fps, 12 times of its detection speed, which meets the requirements of real-time detection using UAVs. Although the YOLOV4 [
6] model has high detection accuracy, its model is too large, which is not conducive to the deployment of embedded devices. The model YOLOv4-uw proposed by Chen L et al. [
14]. has reached a detection speed of 43 fps, but its accuracy is relatively low, which can easily cause the phenomenon of missed or false detection. The application of the Tiny-YOLOv3 model by Adami D et al. [
13]. meets the requirements of lightweight deployment, but its observation of animals mainly from the ground perspective does not meet the needs of this paper applied to UAVs. In conclusion, the target detection model proposed in this paper takes into account the accuracy and real-time requirements. The accuracy of detection is ensured while real-time detection is performed. At the same time, this paper solves to a certain extent the problem that the change of target occupancy ratio makes detection difficult.
In this paper, the selection and design of the model were mainly carried out considering actual application, where the model can be easily deployed using embedded devices, in order to achieve real-time object detection. The characteristics of light weight and fast detection make the YOLOV5s model highly competitive in a variety of embedded device deployments. In conclusion, the model proposed in this paper has the following advantages. Firstly, the model can automatically detect wildlife in the video stream. Secondly, the improved YOLOV5s model is very small in scale, which makes it easy to deploy to a variety of embedded devices. This reduces hardware costs for users, which is of great value in practical applications. Thirdly, the detection speed of the improved YOLOV5s model is very fast, easily meeting the needs of real-time detection of wild animals. However, most of the dataset in this paper is in relatively good light, with a small number of dusk and night images. Therefore, working at night may not be applicable to the model proposed in this paper. At the same time, if the UAV flight is high and the proportions of the target are small, the target will be difficult to detect, which is the disadvantage of the model proposed in this paper.
6. Conclusions and Future Work
To realize real-time detection of grassland animals using aerial drones, this paper proposes a real-time detection method for grassland animals based on the YOLOv5 network model. In the improved YOLOv5s model, in order to improve the accuracy of object detection, a SENet structure is added. To achieve a lightweight model, the BottleneckCSP module in the Neck layer was replaced with the BottleneckCSPS_X module. To realize the detection of small and medium grassland animal text, the SPP module is optimized and a 3×3 maximum pooling layer is added to improve the receptive field of the model. The experimental results show that compared with YOLOv3, EfficientDet-D0, YOLOv4, and YOLOv5s, the improved YOLOv5s network model demonstrated an increase of 0.186, 0.03, 0.007, and 0.011 in the value of mAP_0.5, an increase of 0.216, 0.066, 0.034 and 0.051 in the value of mAP_0.5:0.95, and an average detection speed of 26 fps. At the same time, the scale of the improved model is also small and meets the needs of aerial drones for the real-time detection of grassland animals.
To address the limitations of the model proposed in this paper, a searchlight could be hung on the drone to facilitate the collection of pictures of wild animals at night. Add the collected pictures to the training set to solve the problem of observing the habits of wild animals at night. At the same time, in practical applications, observing the living habits of wild animals requires tracking and observing the target. The model proposed in this paper can be fused with the model of object tracking. The fused model can get the position information of the target more stably, transmit this information to the UAS, and use coordinate conversion to get the 3D information of the target. According to this information, the target can be tracked easily by using UAV control technology. In order to cope with some dead ends in tracking, the camera angle can be controlled by using a servo, which can greatly improve the stability of tracking. Because the drone is too high, the target proportion is small, so that the target is difficult to detect is also a problem to be solved. In addition, it would also a good research direction to deploy the model proposed in this paper in other embedded devices for application in the field of robotics.


