Article

Environmental Efficiency Indices in the Public Hospital Sector: A Proposal

by
Vanesa Jiménez-Lacarra
1,
Eduardo Martínez-Cámara
1,*,
Jacinto Santamaría-Peña
1,
Emilio Jiménez-Macías
2,
Agostino Bruzzone
3 and
Julio Blanco-Fernández
1
1
Department of Mechanical Engineering, University of La Rioja, 26004 Logroño, Spain
2
Department of Electrical Engineering, University of La Rioja, 26004 Logroño, Spain
3
DIME, University of Genoa, Via Opera Pia, 15, 16145 Genova, Italy
*
Author to whom correspondence should be addressed.
Appl. Sci. 2022, 12(16), 8120; https://doi.org/10.3390/app12168120
Submission received: 10 June 2022 / Revised: 6 August 2022 / Accepted: 11 August 2022 / Published: 13 August 2022

Abstract

:

Featured Application

The use of these indices, which make it possible to compare the environmental efficiency between hospitals with similar characteristics, will facilitate the adoption of measures, the development of impact mitigation plans, and the implementation of good practices in environmental topics that will guide the health sector toward sustainability scenarios.

Abstract

In the past decades, the use of indices and indicators to report on the environmental performance of organisations has increased exponentially. However, the available studies did not address the topic of obtaining indicators that show the environmental behaviour of the health sector. The main objective of this research, therefore, was aimed at the calculation of environmental efficiency indices in the hospital sector, taking a regional hospital as a case study and considering the environmental aspects identified during the development of its healthcare activity in 2019. The results obtained provided information on the potential environmental impacts triggered by every aspect of the operation of a hospital in the course of its activities that focus on patient care. The results demonstrated that the aspects related to transportation of patients, workers, and materials had the greatest impact on the global environmental indices we calculated. For the environmental efficiency indices of hospital activities, the most significant environmental aspects were materials consumption and waste generation.

1. Introduction

One of the challenges faced by health sector managers worldwide is the efficiency of hospitals [1]. The average health expenditure, as a GDP percentage in 2018, was 8.8% among the countries of the Organisation for Economic and Cooperation Development (OECD), with the US (16.9%), Germany (11.9%), France (11.5%), and Switzerland (11.3%) being the countries that invest the most in it. The ones that invest the least in it are Mexico (5.5%), Luxembourg (5.3%), and Turkey (4.2%) [2]. The mission of hospitals, as defined by the World Health Organization (WHO), is to safeguard people’s health through prevention, diagnosis, treatment, cure, and rehabilitation, in addition to the research and teaching work; however, paradoxically, these have a significant negative environmental impact [3] that affects people’s health. Hospitals’ contributions to greenhouse gas emissions, for example, are estimated at 4.4% of the global net; that is, 2 gigatons of carbon [4]. According to the classic model by Lalonde [5] that defines the determinants of health, the environment is the second most important factor in determining the health of a population.
Hospitals, which total about 800 in all of Spain [3], resemble small cities, not only due to the possible number of patients, but also due to the attendance of their visitors and workers. The total number of people can in many cases exceed the number of inhabitants of small towns. Hospitals are complex facilities with intensive resource consumption and high energy demand [6,7], which cause negative effects on the environment and contribute to air pollution and climate change [8]. A study conducted by Rodriguez Miranda [9] highlighted the importance of hospitals developing and implementing environmental management systems that focus on minimising, controlling, and mitigating all the environmental impacts in their surrounding areas.
The topic of hospital environmental efficiency has not been thoroughly studied in the scientific literature. Usually, the so-called hospital management indicators are a guide that translate into the health state of the hospital. These hospital management indicators measure the fulfilment of the institutional objectives and rarely ever consider the environmental impact of their processes. The aim of this study was to provide a useful tool to improve decision making while considering these environmental aspects.
Health systems and professionals must consider environmental sustainability as part of good health and healthcare [10,11]. This commitment is a “quid pro quo”, since a negative impact on the environment and its consequences, such as climate change, may involve the appearance of diseases or health emergencies to which health centres would have to respond.
Chapter 40 (“Information for Decision-Making”) of the United Nations Conference on Environment and Development’s Agenda 21 [12] calls for the development of sustainable development indicators. In particular, it calls, at national levels, for countries and institutions to develop sustainable development indicators and identify suitable indicators to follow the development process. These initiatives imply the development of tools that allow the production of information for decision making, planning, and management.
In the past decades, an impetuous growth has emerged worldwide in the use of indices and indicators to report on the environmental performance of organisations. Greater efforts were made each time to calculate indicators that allowed the measurement and management of environmental problems, either on a global or local scale, and above all to identify the objectives, goals, and “good practices” that made it possible to strengthen the development of environmental policies. This fact was also evidenced in the Eco-Management and Audit Scheme (EMAS) regulation, the latest revision of which [13] introduced, as the most important new feature, the incorporation of basic indicators of environmental behaviours into the environmental management system.
In the last decade, an increasing number of studies have emerged that used a life cycle analysis to examine the intensity of greenhouse gases in the hospital sector. Some studies were performed in entire hospitals, as evidenced by the work of Bambarren-Alatrista [14], while others focused on calculations for a specific hospital process, such as the carbon footprint calculation for a service in the UK [15], a reduction in the environmental impact of magnetic resonances [16], a life cycle assessment for the delivery of a baby [17], a life cycle assessment for different pathology tests regularly performed in hospitals [18], or the analysis of the possible measures to make an efficient use of consumable hospital goods by using incontinence products as a case study [19]. Several studies that evaluated the life cycle in the management of hospital wastes are also available, including studies performed by Abd El-Salam [20] and Ahmad [21]. Campion et al. analysed the environmental impact of 15 types of disposable packaging materials commonly used in hospitals [22]. The study concluded that the healthcare industry has a great potential to reduce its environmental impact. The use of an LCA to verify the environmental impact of the products used can lead to better selection of materials and the correct definition of end-of-life scenarios.
Eckelman and Sherman used a life cycle analysis to quantitatively estimate the greenhouse gas emissions caused by the US healthcare system [23]. In their findings, they highlighted the importance of improving the environmental performance of the healthcare system to achieve waste reductions and limit the burden that pollution ultimately has on the healthcare system itself.
Carino et al. sought to identify and synthesise existing research on the sustainability of hospital food services, as well as to define the environmental and economic impacts of this supply chain [22].
Other studies also conducted further research into some aspects of the COVID-19 pandemic from the point of view of a life cycle analysis. For example, van Straten [24] conducted a comparative study of the environmental impact of reprocessed FFP2 face masks and brand-new ones. Balys [25] conducted a comparative life cycle analysis of the environmental and economic impacts of the oxygen supply in Polish hospitals during the pandemic outbreak. Zhao [26] analysed the life cycle of three treatment scenarios for medical wastes produced during the COVID-19 pandemic in China.
However, the available studies did not address the topic of obtaining indicators that show the environmental behaviour of the health sector. Environmental management in this sector is limited especially to sanitary waste management [21,27,28,29,30], energy consumption analysis, and carbon footprint calculations, and lacks a more comprehensive analysis containing all the sector processes in the provision of health services for the patient, such as patient transport, transport of employees, consumption of medicinal gases, waste disposal, and materials and plastics consumption.
In Spain, out of the 969 organisations with EMAS registration in 2021, only 24 (2.4%) corresponded to the hospital sector [31]. This situation has led to a lack of detailed information for decision making and planning in the environmental area. Therefore, there is a need for an operational tool that will help to control environmental sustainability in these organisations. This tool is specified in the calculation of environmental performance indices that will allow monitoring of the situations in the environment and natural resources management, as well as the impact and consequences of the healthcare processes on natural resources.
While research in the field of life cycle analysis has been abundant in recent decades [32,33], its application in the healthcare field has not been reviewed yet [34]. Thus, this research work aimed to contribute to the improvement of the degree of involvement of health organisations in their environmental impacts. Calculating environmental performance indices in the hospital sector aims at providing hospital managers with essential information for decision making regarding environmental protection policies. Likewise, any progress in this sector will provide a valid tool to compare results with other hospitals, identify areas for improvement, and implement actions for sustainability.
The main objective of this research, therefore, was aimed at calculating environmental efficiency indices in the hospital sector. The term efficiency, in this study, was addressed from two perspectives: on the one hand, a consideration of determining to what extent the proposed environmental objectives were achieved within a healthcare organisation, and on the other hand, the possibility of conducting a comparative study of the results with those of other organisations that performed similar activities. In this sense, standardisation is a fundamental aspect, as it allows researchers to reliably compare the results with those of other organisations. Under these conditions, it was necessary to use an indicator of hospital activity production that allowed a normalisation of the results and benchmarking between different health organisations.

2. Methodology

2.1. Research Context
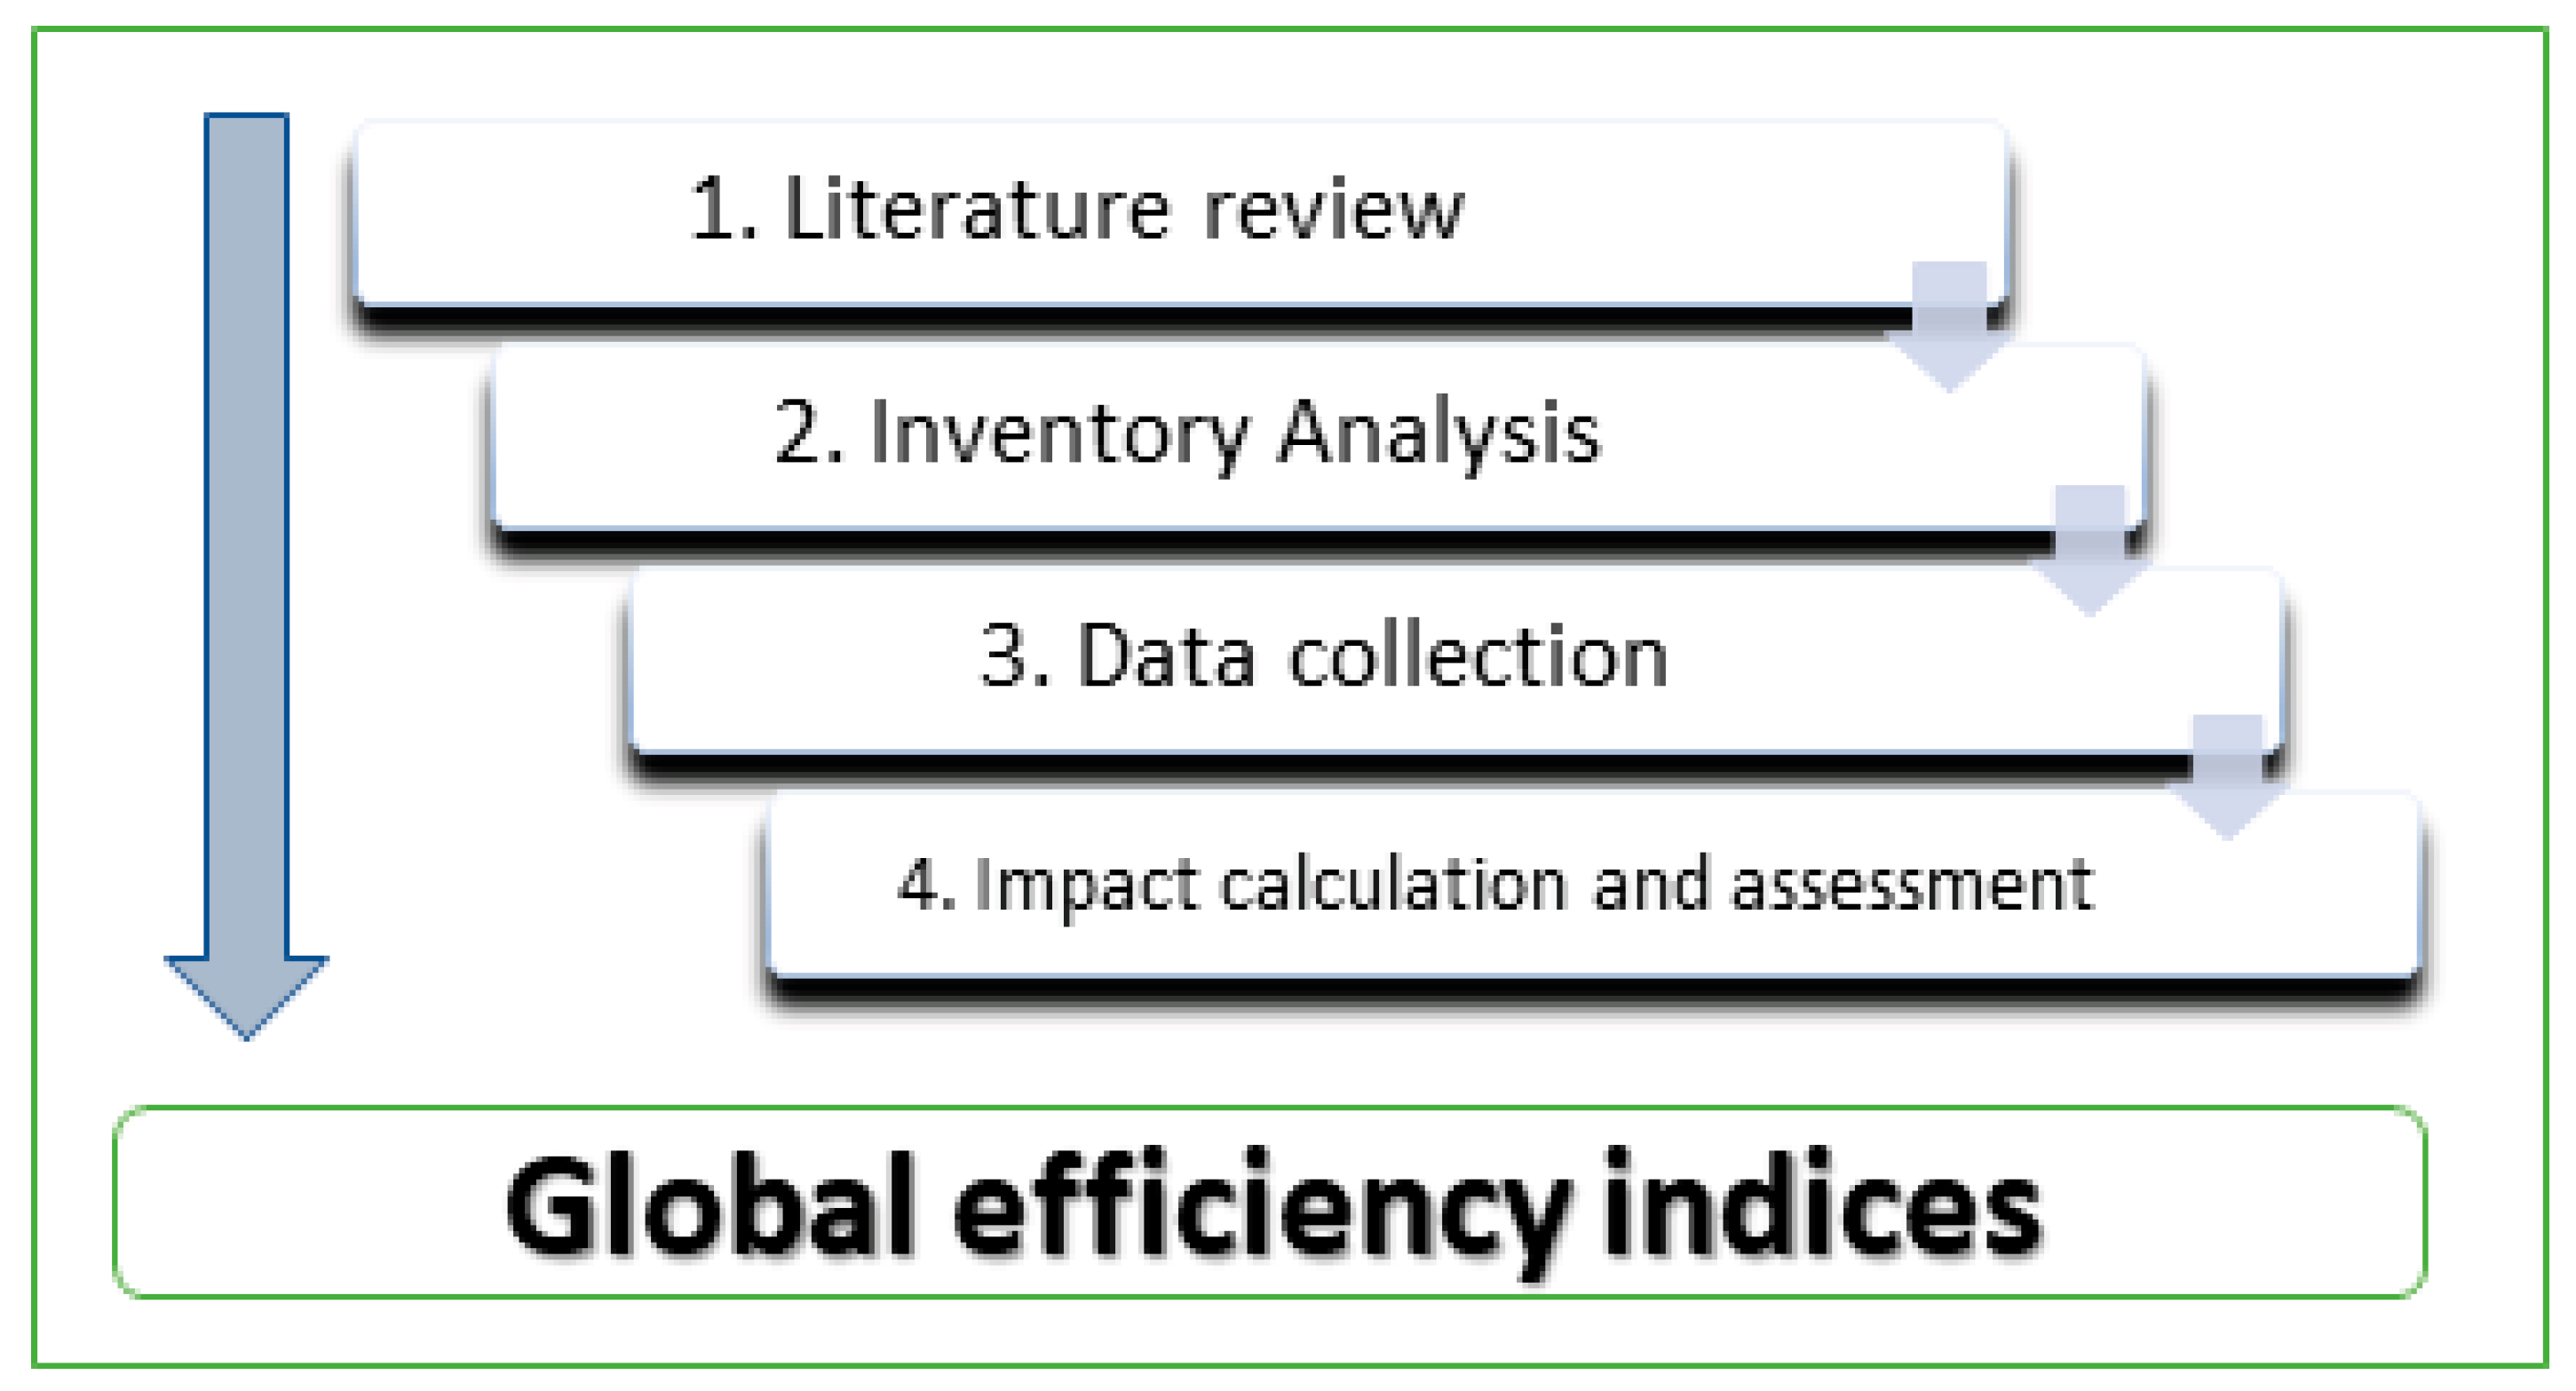
This research focused its case study on a hospital in the public health system located in northern Spain that handles specialised healthcare needs for a population of 80,000 inhabitants distributed in almost 30 municipalities. Furthermore, the hospital develops activities related to the implementation of programs for health promotion and protection, teaching, research, study, and dissemination of knowledge, as well as continuous sanitary services staff training.
To develop healthcare activities, the hospital has a group of 550 employees that offers a portfolio of healthcare services with an infrastructure of 80 beds, four operating rooms, three delivery rooms, external consult areas, emergency, rehabilitation, radiology, day hospital, intermediate care, and a haemodialysis unit.
The hospital, which has a total area of 20,194 m2, out of which 6800 m2 are built at different heights, performed 19,580 patient care actions in 2019.
The hospital has demonstrated its commitment to sustainable development through aligning its environmental and energy efficiency policies with the organisation’s strategy, which has led to the implementation and certification (since 2004) of an environmental management system based on ISO 14001 and EMAS standards.
The research conducted was a retrospective study with information obtained in this hospital corresponding to the year 2019, since this was the last year of activity with an average healthcare environment. These activities encompassed emergency care, specialised consultations, surgical interventions, haemodialysis, and hospitalisation. In addition, all the support processes that guaranteed healthcare activities, such as laboratory, radiology, pharmacy, administrative management, purchasing, and general services (cleaning, maintenance, and gardening), were also considered.

2.2. Methodology

To address the research on the calculation of environmental efficiency indices, this study was performed in 4 stages (see Figure 1).

2.2.1. Literature Review

The study began with a literature review to determine the state of the art in the calculation of environmental indicators and indices in the hospital sector. In addition, this review helped to identify the main analyses conducted regarding the environmental impacts of the hospital sector. Together with scientific articles, the reports published by the WHO and other national and international official organisations were reviewed.
The search for scientific articles was conducted in the Web of Science (WOS) and Scopus databases using the keywords “LCA” and “public hospital”, “efficiency” and “public hospital”, “environmental impact” and “public hospital”, and “environmental indices” and “public hospital”.

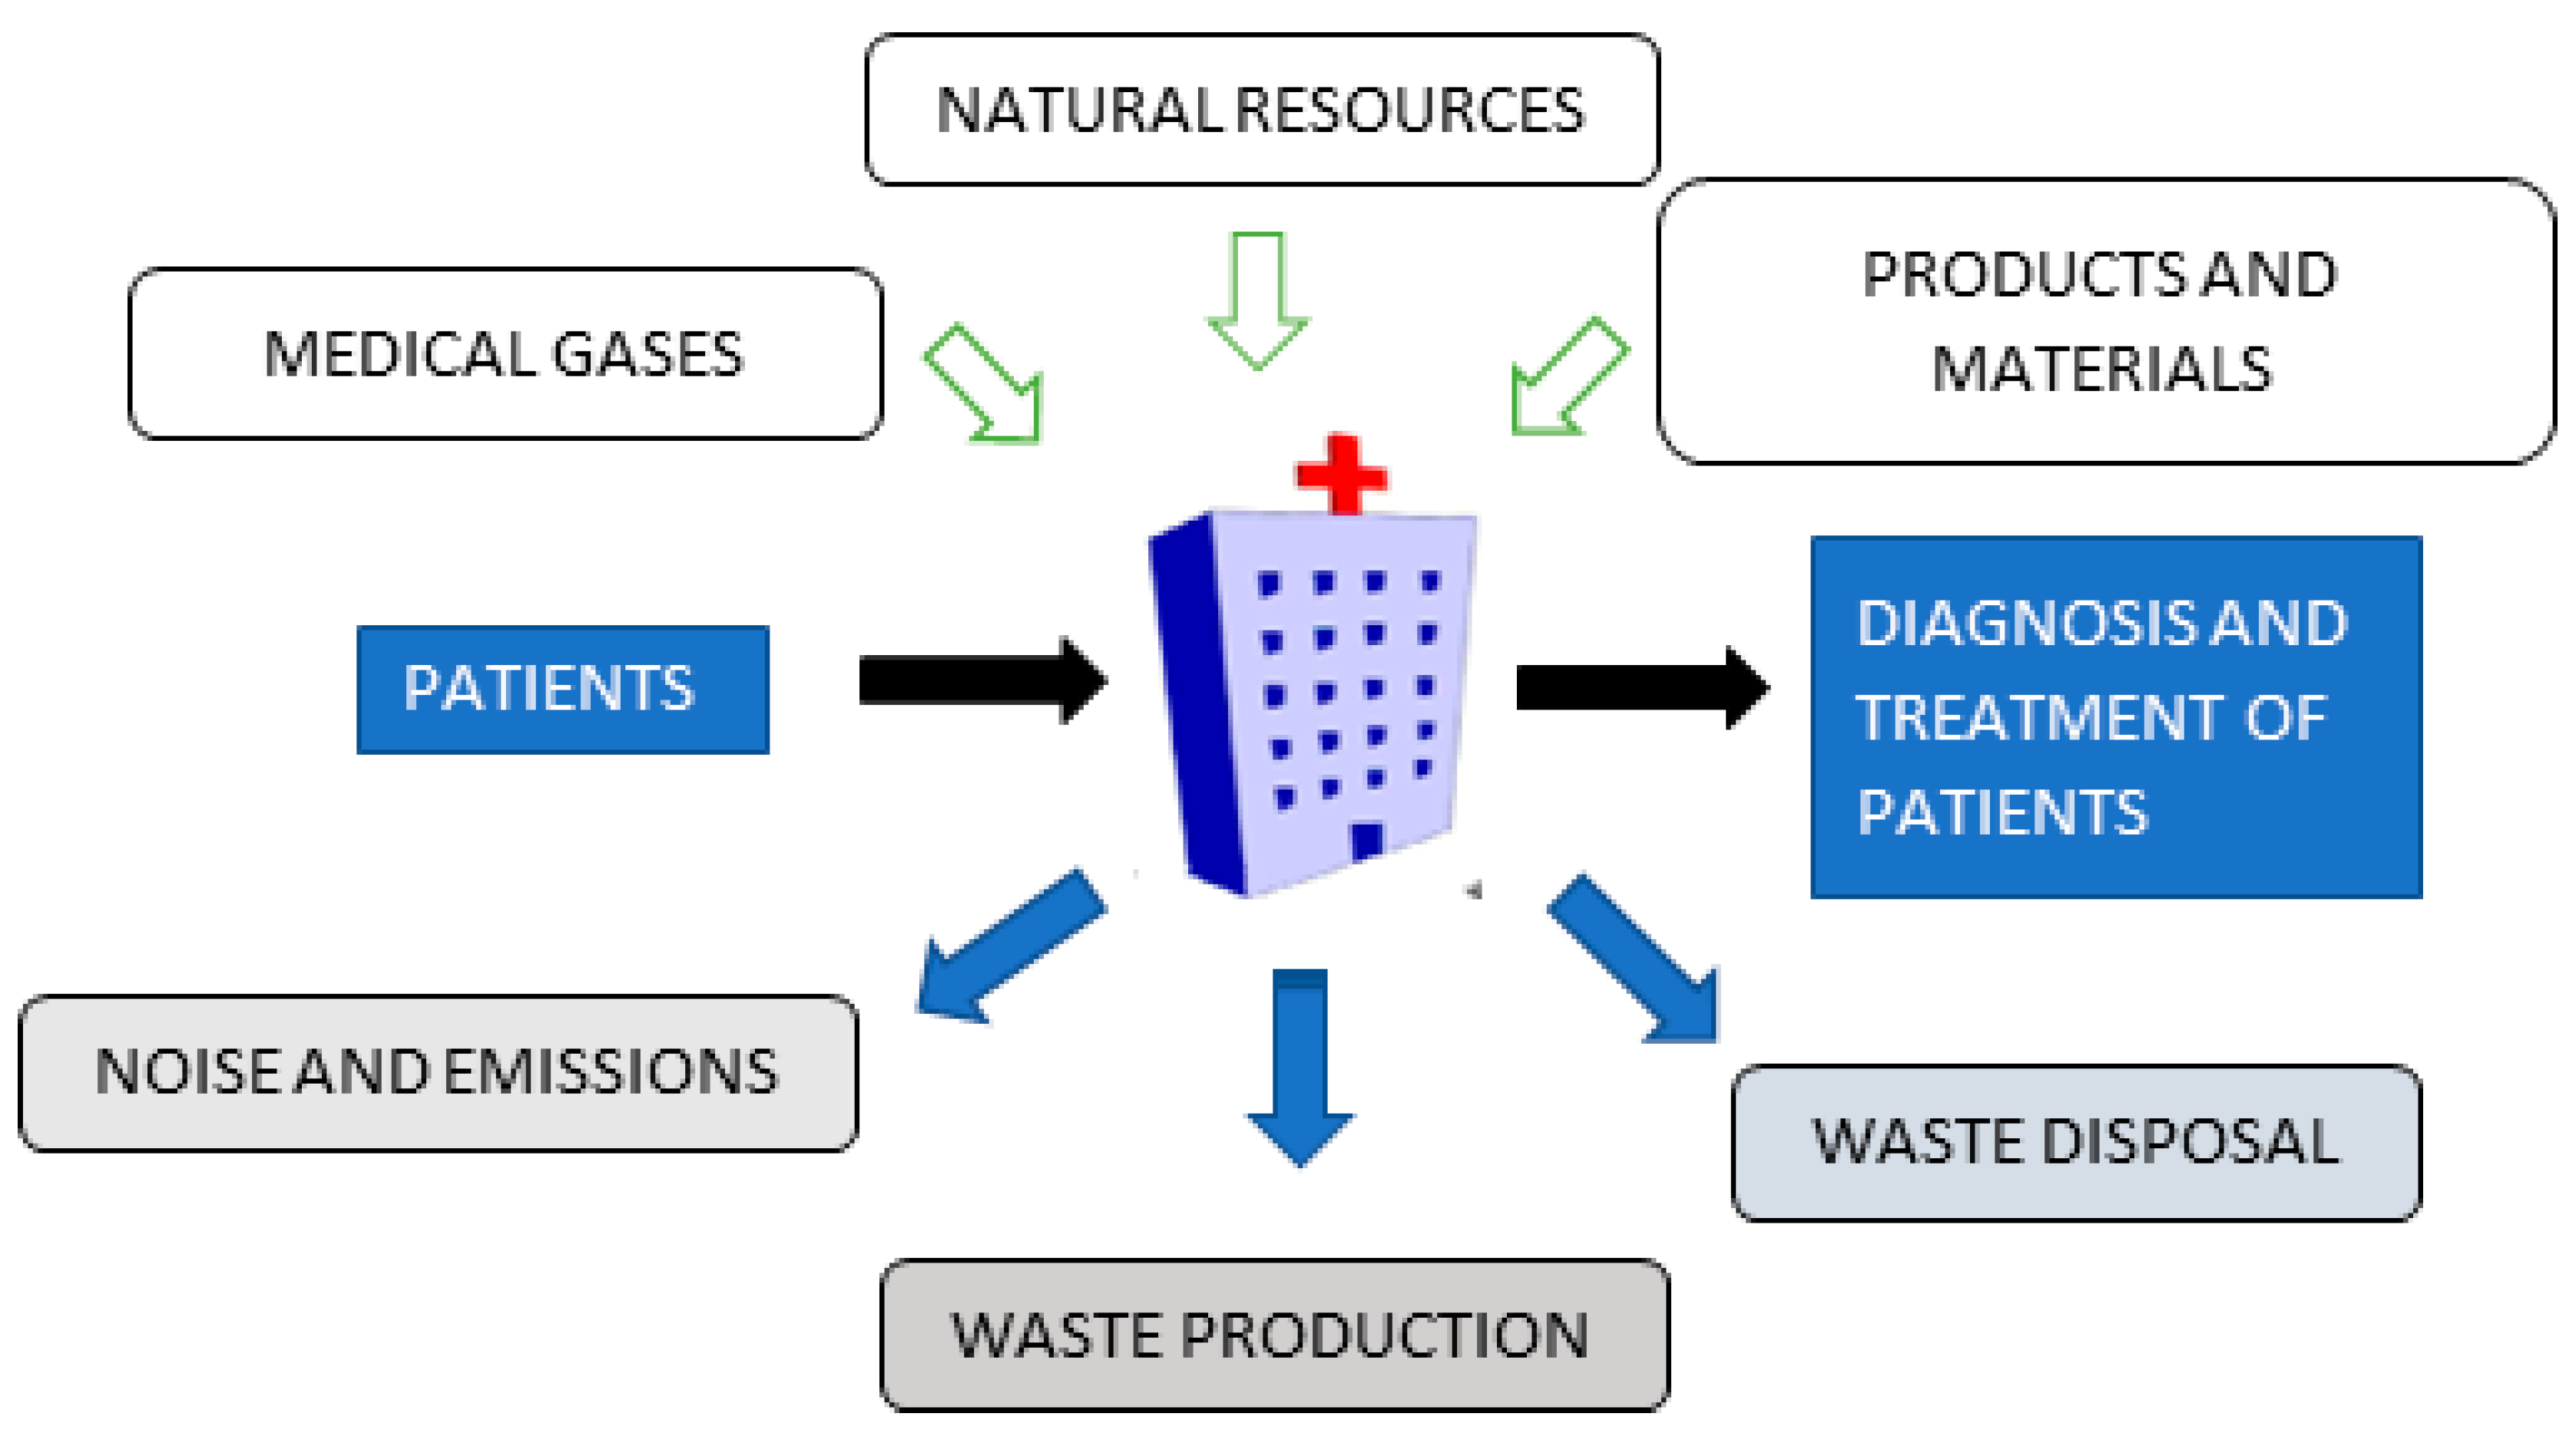
2.2.2. Inventory Analysis

The second stage of the study was devoted to the identification and analysis of different environmental aspects. In this sense, and in order to determine the environmental repercussions of direct and indirect activities in normal, abnormal, and risk conditions, the hospital-related environmental aspects were identified and evaluated from the life cycle perspective (see Figure 2 and Figure 3).

2.2.3. Data Collection

Thirdly, once the environmental aspects of the inventory to be included in the study had been selected, the data were collected and adjusted to normalised units. The model was studied with measurement data corresponding to the year 2019 for each of the inventory elements (see Table 1).
Hospitals consume energy 24 h, 365 days a year, resulting in around 8760 h of annual consumption. Most of this energy is devoted to air conditioning, ventilation, lighting, and hot water production. The same analysis can be extended to water consumption. According to WHO data, a person requires 100 L of water a day. The reality is that this amount can be multiplied by four or five in the case of a hospitalised patient. The data on electricity, gas consumption, and water for consumption and irrigation were collected through the bills and meter readings of the supplying companies.
Medical gas consumptions were evaluated based on the specific medical gas and the size of the container. The following medical gases were considered: oxygen, medical air, nitrogen, carbon dioxide, and nitrous oxide. The consumption of anaesthetic gases was minimal, so it was not considered in this study.
Regarding the materials supply, the security data sheets for each material consumed were analysed, and the total weight of materials consumed during the year under study was calculated. In addition, the transport associated with them was also considered: we calculated the distances from each supplier to the hospital and the total transported weight.
To determine the movements made by employees and patients, round-trip distances between the hospital and the town of origin were calculated for each employee and patient, resulting in the total kilometres of transport corresponding to the year under study. The percentage distribution of car registrations by type of fuel in Spain in 2019 was used, showing vehicles that used diesel fuel at 68.2%, gasoline at 30.5%, and electric cars at 1.3% [35].
For the hospital under study, there were no statistics on the use of public transport or other sustainable mobility alternatives, nor were there records of specific studies on the use of public transport versus private transport in the area around this hospital. For this reason, we decided to use the alternative with the greatest environmental impact compared to other possible alternatives. Likewise, there was no policy to encourage sustainable mobility in the hospital analysed. The location of the hospital, the distances to the different communities it serves, and the available infrastructures do not facilitate active mobility such as walking or cycling. For this reason, the scenario with the greatest environmental impact was taken as a reference, and only considered private car transport of employees.
To study hospital wastes, the weights of the wastes generated during the study year were calculated and classified according to type and subsequent treatment. Table 2 shows the details of the different components collected within each waste category considered. For example, electronic waste was included in Waste Group IV. This waste came mainly from electromedical equipment that, due to technological obsolescence and the existence of new diagnostic or intervention techniques, was replaced. In some cases, if the equipment was still operational, there was the possibility of sending it to countries with fewer resources, and if not, it was destined for recycling. The benefits of recycling these devices are, among others: the use of raw materials, the saving of natural and energy resources, and adequate waste management to minimise the potential impact on the environment.
On the other hand, the waste generated by food and drinks was included in Waste Group I as urban waste. In 2019, organic waste accounted for 77,084.95 kg, of which 20,707.75 kg corresponded to food and drink waste (26.86%). Hospital food waste comes not only from patients’ leftovers, but also from flaws in internal organisation. There are often errors in dietary requests that, together with a lack of coordination between services, result in a large number of meals being thrown away. To reduce this waste volume, it is necessary to improve the internal processes of hospitals and encourage initiatives such as patient choice of meals, together with proper waste segregation.
The waste generated by expired medicines was accounted for in Waste Group IV—Special healthcare wastes. In 2019, the waste produced in this hospital from medicines amounted to 1790.8 kg. According to Spanish legislation, this waste is considered hazardous and is managed by an authorised waste management institution.

2.2.4. Impact Calculation and Assessment

Finally, in the fourth phase of the study, the calculation of the environmental impacts was made. The software chosen to perform the study was SimaPro v.9.1®. This is a professional tool that allows the calculation of the environmental, social, and economic impacts associated with a product throughout its entire life cycle.
Firstly, the global impact of hospital activities was calculated using the ReCiPe method. This is one of the most used methods in the LCA research area, and includes both the midpoint and the endpoint method. The “midpoint” and the “endpoint” are especially different links in the causal chain with an impact on the results of the analysis of life cycle inventory. Midpoints are quantifiable and can be used to track the original emissions, but cannot entirely indicate the total damage to the chain. The damages are caused by impacts, which are endpoints of the chain. Endpoints represent the inevitable damages. Therefore, to obtain a global representation in this study of the inevitable damage caused by hospital activities, the endpoint ReCiPe method was selected, and included three endpoint impact categories: damages to human health, the ecosystem, and depletion of resources. For this first calculation, the data were summed up to a single total impact value.
Secondly, by selecting the calculation methodology CML-IA baseline V3.05/EU25, environmental impacts were assessed, classified, and evaluated in 11 impact categories. The impact categories analysed were abiotic depletion (AD), fossil depletion (ADF), global warming potential for a 100-year time horizon (GWP), ozone layer depletion (ODP), human toxicity potential (HTP), fresh water aquatic ecotoxicity (FWAE), marine aquatic ecotoxicity (MAETP), terrestrial ecotoxicity (TE), photochemical oxidant creation potential (POCP), acidification potential (AP), and eutrophication potential (EP). The CML-IA IA baseline V3.05/EU25 methodology is one of the most widely used in the scientific literature on life cycle assessments. It also allows researchers to analyse the environmental impacts in the specific categories to be studied. On the other hand, the CML-IA methodology is a midpoint methodology that does not incorporate the grouping and weighting phases, and therefore avoids the incorporation of subjectivity in the results.

2.2.5. Calculation of the Environmental Efficiency Index (EEI)

Hospitals resemble companies, which in this case produce a healthcare service. The processes are different for each patient, so there are countless products. For this reason, measuring hospital production is complicated and difficult. Traditionally, hospital production was measured by the number of beds or stays in a hospital. Nowadays, technological evolution in the healthcare environment, which seeks to reduce complications and adverse events in patients, reduces stays by promoting major outpatient surgery and high resolution.
In 1998 in Spain, there was a change at the National Health Institute (INSALUD, Spanish acronym) regarding the so-called management contracts, a new tool with which hospitals are financed based on the complexity of the processes addressed in the hospitalisation area, as well as on the different hospital products in the other production areas. The hospital complexity unit (HCU) appears in management contracts as a measure of healthcare activity. It is established using the average weight of each patient multiplied by the number of patients received annually. The mean weight is a classification system of patients of the same class who consume a similar amount of resources. The diagnosis-related group (DRG) is an American system with worldwide acceptance that establishes a relative weight for each class of patients based on their cost. Thus, for example, the weight corresponding to DRG 165 (Uncomplicated appendicitis) is 1.3502, and that of DRG 103 (Heart transplant) is 37.91.
The process is no longer about measuring productivity according to the number of stays, but is based on complexity. To obtain the HCUs, DRG weights are applied to hospital discharges, generating an average weight for each hospital and reflecting their complexity index. The production of the centre expressed in HCUs [9] is obtained by multiplying the discharges by this index. Note that HCU = number of discharges per average weight.
The HCU, in addition to facilitating activity information, allows the financing of the hospital activity to be known if a HCU fee is established, as it considers the two main aspects of hospital production: the complexity of the processes attended (average DRG weight per discharges) and the activity volume (number of discharges) [10].
Therefore, a hospital’s HCU value, in addition to revealing information on the hospitalisation activity, is the expression of the patients’ resource consumption as they pass through the healthcare process. The HCU indicator is a dimensionless unit of measurement of hospitalisation activity that considers the relative complexity of the pathology of hospitalised patients.
In this study, to obtain the environmental efficiency index, both for the endpoint global impact (calculated with ReCiPe) and for, in each impact category studied (CML-IA) (Equation (1)), the environmental impact calculated based on the hospital complexity unit (HCU).
EEI = I HCU
where:
I = calculated environmental impact;
HCU = annual hospital complexity unit (annual activity).

3. Results and Discussion

The calculation of environmental efficiency indices in the hospital sector was made through this research, which took a regional hospital as a case study and considered the environmental aspects identified during the development of its healthcare activity in 2019. The results obtained for the indices will be presented in two ways: first as a single ultimate impact value, and later in detail for each of the 11 impact categories studied.
On the one hand, the results obtained in the calculation of the global environmental efficiency indices were considered. They included all the environmental aspects identified in the inventory: natural resource consumption, consumption by patients, waste production, waste disposal, and transport and consumption of materials. Alshqaqeeq et al. conducted a systematic review of the existing literature on the environmental impact of sanitation services and detected a major limitation with regards to the data used [36]. Most of the articles did not include data from the three areas that Alshqaqeeq et al. considered essential: transport, direct energy consumption, and consumption of materials. Out of the 57 articles analysed by Alshqaqeeq et al., only 6 included these three aspects. Therefore, this article included all the aspects related to the transportation of patients and goods, as well as the consumption of energy and materials, which allowed for a complete assessment of the environmental impact of the healthcare services offered by the hospital. On the other hand, to build environmental efficiency indices of the activities performed by the hospital as a care provider, and to prevent transport-related activities from distorting the results obtained, we considered it necessary to calculate the environmental efficiency indices while excluding inventory data related to transportation, which included transporting patients, employees, and materials to the hospital analysed.

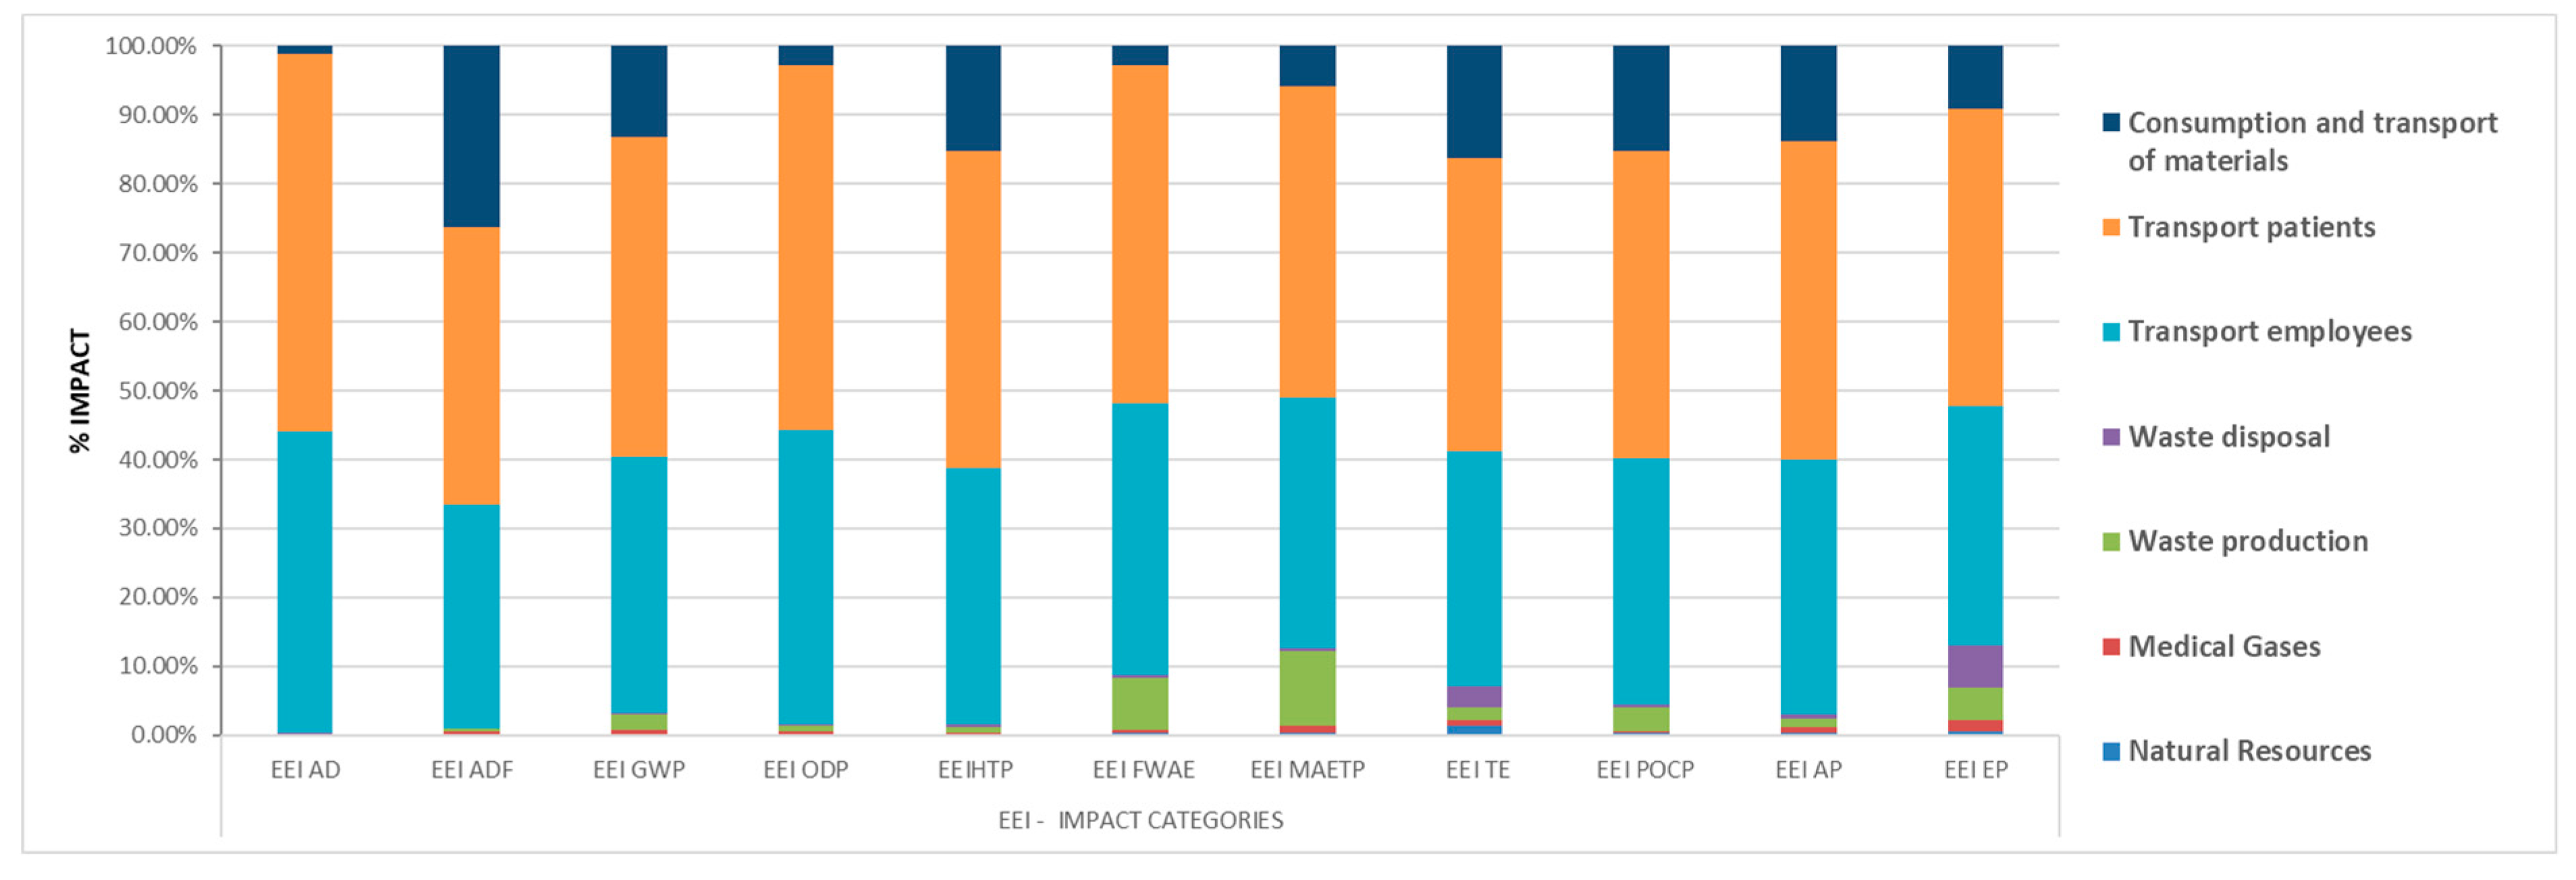
3.1. Global Efficiency Indices

3.1.1. Single-Value Global Environmental Efficiency Index

Table 3 shows the value obtained for the single-value Global Environmental Impact Index (GEEI) for each environmental aspect analysed.
Measuring this index led to obtaining a single value that was representative of the environmental impacts derived from the hospital activities during 2019.
GEEI = 6.06 × 10⁴
This single value was turned into reference points that will make it easier to compare with other scenarios or hospitals with regard to environmental damages [37].

3.1.2. Environmental Efficiency Index per Category

The results shown in the Table 4 present the global environmental efficiency indices calculated using the CML-IA methodology for each impact category based on 2019 data. In addition, the results obtained for each environmental aspect analysed in this study are included.
For the index associated with the global warming potential for the year 2019, EEIGWP100a, a value of 6.22 × 10² was obtained. All the environmental aspects analysed had an impact on this index; in particular, those related to transport, in addition to materials consumption and waste generation. Malik [38] also noted the importance of transport in an analysis of the environmental impact of the hospital sector. On the other hand, Nicolet et al. analysed the environmental impact of primary care in Switzerland, and also noted that 82.6% of CO2 emissions were due to secondary activities necessary to provide primary care, including the transportation of employees and patients [39]. This showed how important it was to consider not only the environmental impact of the hospital itself, but also all the ancillary activities that were necessary to provide these services. From all the results obtained for the global environmental indices, transportation and materials consumption were the most significant aspects. Only in the cases of the EEIFWAE and EEIMAETP indices was it observed that the generated waste had a greater impact than materials consumption. Zhao et al. analysed different medical waste treatments and noted the relevance of heavy metal emissions in the FWAE category [40]. In particular, they highlighted the emissions of nickel and copper into the water, which can be generated both in their incineration process and during their relocation to a landfill.
The most relevant finding of this work was that the environmental impact of transportation made the most significant contribution to the 11 indices per impact categories studied (Figure 4). In some cases, as with the EEIAD, the sum of transport of employees and patients was responsible for over 90% of the global environmental index. The contribution of transport to the calculated global indices was very large due to the great intensity of trips that occur in a hospital on a regular day.
If the transports considered were to be made in a more sustainable way, the results would be significantly affected. For example, assuming an alternative scenario in which the use of private vehicles represented 45.7% of journeys and 54.3% used public transport [41], the indices shown in Table 5 would be obtained. Similarly, if an alternative scenario was considered in which employees used active means of mobility such as bicycles, when applying 2.1% of the annual kilometres travelled in 2019, reductions in the impact of transport of around 2% would be achieved in all categories (see Table 5).
The studied hospital is located in a regional area away from patients and workers who need to use a means of transportation to travel to the hospital. The study led to recommending a location analysis prior to the design and implementation phases for hospitals [42]. Planned hospitals should analyse their future locations while considering, among other factors, the distance to the residences of their potential patients and employees. Locating hospitals close to public transport infrastructures will reduce their environmental impacts, thus achieving improvements in their environmental efficiency, and ultimately reducing emissions and environmental pollution.
Another strategy that will allow the reduction of patient trips in their vehicles is to favour, where possible, the use of telemedicine or those alternatives that do not require face-to-face meetings between health professionals and patients. Promoting primary and home care can positively contribute to reducing unnecessary patient travel.
The adoption of hybrid technologies or electric vehicles will reduce emissions from vehicle fleets, including ambulances. Developing campaigns that encourage staff and patients to use public transport or carpool can also help reduce pollutant emissions in relation to hospitals.
In short, decisions on the location of a hospital have a huge impact on future transportation requirements.
Following the results obtained, the consumption of materials contributed to all the indices. For the indices EEIADF, EEIHTP, EEITE, and EEIPOCP, it contributed around 15 to 26% of the total impact.
For the environmental aspect corresponding to generated wastes, the only significant indices obtained were for the cases of EEIMAETP and EEIFWAE, which contributed to the total with 10.8% and 7.5%, respectively.
Finally, for the rest of the indices obtained, the consumption of natural resources and medical gases did not cause significant impacts in this case.

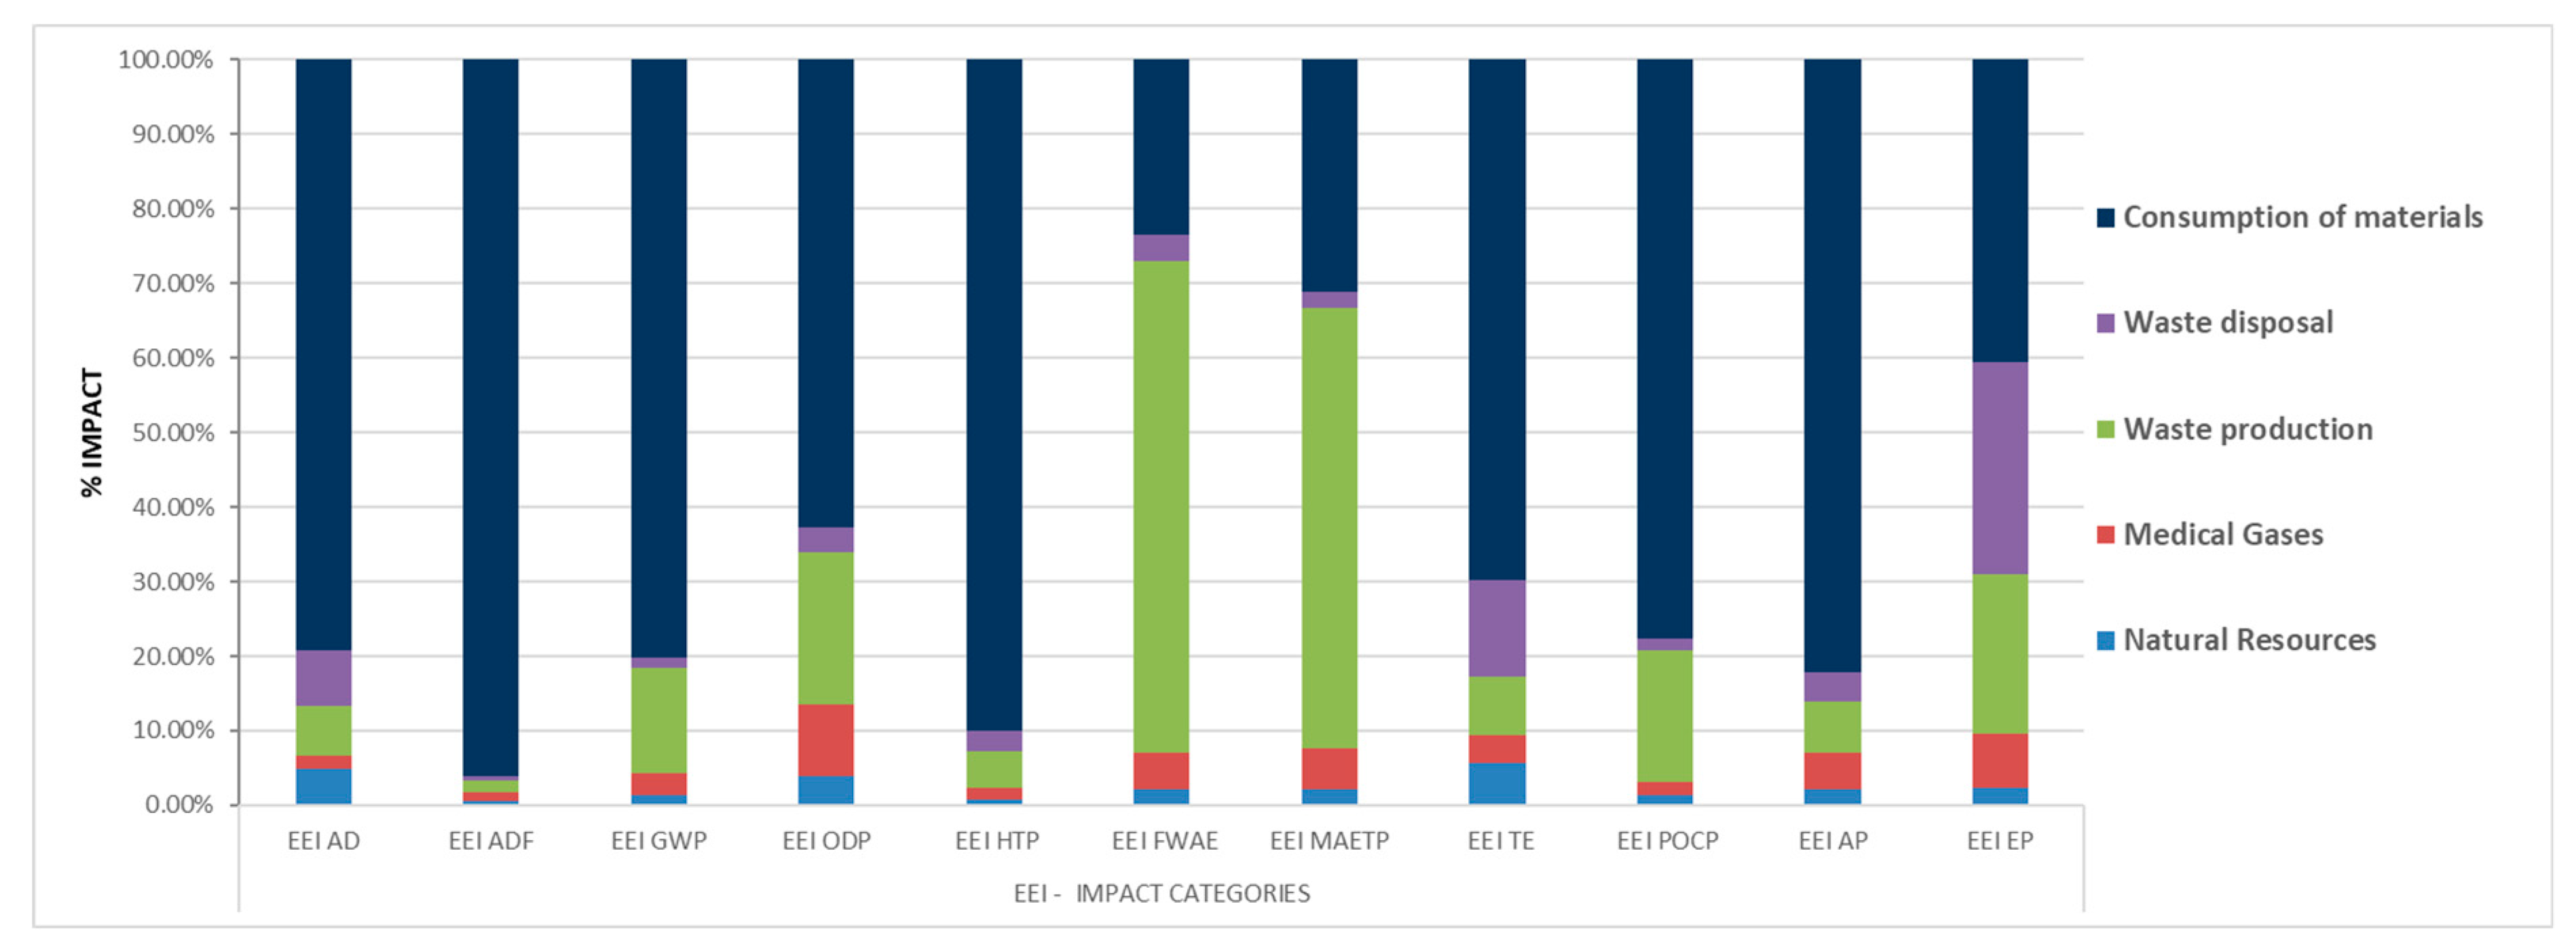
3.2. Study of Environmental Efficiency Indices of “Hospital Activity”

In a second analysis, aspects related to transportation (employees, patients, and materials) were eliminated from the study, and the environmental efficiency indices of hospital activity were calculated. The calculation of these indices made it possible to analyse the environmental behaviour associated with the hospital process solely in its healthcare work.

3.2.1. Single-Value Environmental Efficiency Index: “Hospital Activity”

Table 6 shows the value obtained for the single-value Global Environmental Efficiency Index (GEEI) for each environmental aspect analysed, except for transport.
Waste generation was the aspect with the most impact on the calculated index. Calculating this index allowed us to obtain a single representative value for the impacts derived from the hospital’s activities during 2019.
GEEI = 3.60 × 10³
This single value was turned into reference points that will make it easier to compare with other scenarios or institutions with regard to the damages to the environment by hospital activities.

3.2.2. Environmental Efficiency Index: “Hospital Activity” per Impact Categories

Table 7 shows the detailed results obtained using the CML-IA methodology for environmental efficiency indices of hospital activity classified by impact category.
In this case, the environmental efficiency indices of hospital activity were calculated for the index corresponding to global warming potential (EEIGWP100a), and a value of 1.02 × 10² was obtained. All the environmental aspects analysed had a significant impact on this index, with a strong highlight on the aspects of materials consumption and waste generation [42]. Keller et al. also identified the waste generated by hospitals and the consumption of materials commonly used in hospitals as environmentally significant [43].
As shown in Figure 5, a significant change in the environmental indices was obtained by removing the environmental aspect related to transportation of employees, patients, and materials from the study.
The results in this case indicated that the hospital materials consumption generated the environmental indices that had the greatest impact in 9 of the 11 categories studied, and were responsible for more than 90% of the impact on the EEIADF and EEIHTP indices. Some of the materials consumed in the hospital were toxic substances, especially products used in cleaning and disinfection, or reagents used in the laboratory. In addition, a high battery consumption was seen during 2019, mostly alkaline-type batteries, and to a lesser extent, button-type. Numerous electromedical appliances use this type of battery, and it is difficult to replace them with another type of power supply, as each equipment has its peculiarities. Plastic bags are also part of the materials that are most consumed within the hospital, with their main use being waste collection.
Waste production significantly impacted the indices EEIFWAE and EEIMAETP. In order to prevent and reduce illnesses, utilization of single-use materials is frequent in hospitals, which causes a significant amount of waste generation. These wastes are transferred to landfills or sterilisation or incineration plants, depending on the type of waste.
Disposals produced in the hospital come from hygienic/sanitary use and have been shown to have a moderate effect on the environmental index of hospital activity. They only showed a significant result in the EEIEP indices (21.54%) and the EEITE indices (13.07%).
For the aspects related to the consumption of natural resources and medical gases, the results showed them to have a minimal contribution to hospital-activity environmental impact indices that, oddly enough, was much lower than to the rest of the environmental aspects analysed.
Finally, the interpretation of the results obtained in this case made it possible to identify the critical points in the system, as well as to recommend options to reduce environmental loads. The environmental impacts of hospital activities were mainly caused by materials consumption and waste generation, and to a lesser extent by discharges produced.
To reduce the environmentally harmful indices caused by materials consumption in the health sector, it is necessary, among other things, to promote purchasing policies that evaluate the environmental impact of the materials acquired, as well as to introduce a sustainability approach in the selection of these products. This also implies reaching the commitment to reuse and recycle, and always minimise the transport of materials and products while promoting the use of available resources in local areas. In addition, it is necessary for manufacturers of sanitary materials to adopt sustainable manufacturing procedures.
It is worth highlighting the benefits that measures based on common sense and the application of optimisation initiatives can bring, among which we suggest: making proper use of materials and minimising their consumption, implementing measures to save paper and plastic bags, promoting the use of rechargeable batteries, substituting environmentally friendly cleaning products and disinfectants for others that are not, and educating health personnel on the correct disposal of waste and establishing plans to minimise waste. Martini et al. analysed hospital waste management and evaluated the efficiency of different measures taken to reduce the environmental impact of such wastes [44]. They emphasised the difficulty of achieving a significant reduction in the amount of waste generated by healthcare, but noted the possibility of improving the current classification and management of these resources. Specifically, the policies implemented in the study reduced the error rates for hazardous waste management from 29.42% to 2.79% thanks to a 313% increase in the education of hospital staff.
Healthcare studies must include not only the use of products or equipment, but also the entire life cycle of the resources purchased in order to know the real impact they will have. In a hospital, the terms “use and dispose” and the concept of “single use” are common practices, and although they aim to improve the health of patients and citizens, they are still unsustainable.
Implementing a life cycle approach to electromedical equipment can facilitate a reduction in generated e-waste and a better use of these devices. Applying purchasing policies to electromedical systems while considering consumption and waste generation promotes direct actions to improve the process and, above all, to manage the waste generated during the use cycle of the equipment.
Using circular economy criteria can facilitate decision making from planning to end-of-life, both for disposable products and for the entire scope of healthcare technology. This can result in cost savings while also respecting the environment. The implementation of these types of measures, together with that of environmental management systems, will allow health organisations to improve their environmental efficiency indices and guarantee the sustainability of the health system and the planet. Schoen and Chopra also recommended, as one of the actions necessary to achieve sustainable healthcare services, the systematic quantification of the environmental impacts of healthcare activities to set targets for improvement from a baseline [45]. In addition, they highlighted the need to consider a complete LCA of healthcare services to obtain the essential information in the design of sustainable strategies and achieve improvements in this field.

4. Conclusions

The objective of this research was to propose environmental efficiency indices in the hospital sector. The use of these indices, which will make it possible to compare the environmental efficiency between hospitals with similar characteristics, will facilitate the adoption of measures, the development of impact mitigation plans, and the implementation of good practices in environmental topics that will guide the health sector toward sustainability scenarios.
The methodology used in this research was conducted from the perspective of a life cycle analysis. It was based on analysing inventory, collecting the data, and calculating the environmental impacts to finally determine the global and hospital environmental efficiency indices.
The results obtained provided information on the potential environmental impacts triggered by every aspect of the operation of a hospital in the course of its activities that focused on patient care. The results demonstrated that the aspects related to the transportation of patients, workers, and materials, had the greatest impact on the global environmental indices that were calculated. For the environmental indices of hospital activities, the most significant environmental aspects were materials consumption and waste generation.
The location of hospitals, their policies for the acquisition and consumption of materials, and their waste management systems are the main elements that define the environmental behaviour of these organisations.
Among the future and possible lines of research that can be formulated from the results obtained in this study, we suggest conducting an analysis of the impact of the COVID-19 pandemic on the environmental efficiency indices in hospitals. Another possibility resulting from this study is that of complementing an environmental life cycle analysis with a social life cycle analysis in the hospital sector.
The calculation of environmental indices in the health sector in this study can prove helpful for those responsible for decision making with an aim toward sustainability. This study provides an excellent opportunity to make healthcare services more efficient from environmental, economic, and social points of view without compromising safety or effectiveness in healthcare practice.

Author Contributions

Conceptualisation, V.J.-L. and J.B.-F.; methodology, V.J.-L. and E.M.-C.; software, E.M.-C. and V.J.-L.; validation, J.S.-P., E.J.-M. and A.B.; formal analysis, E.J.-M. and A.B.; investigation, V.J.-L.; resources, J.S.-P. and A.B.; data curation, V.J.-L.; writing—original draft preparation, V.J.-L., E.M.-C. and J.B.-F.; writing—review and editing, J.B.-F., E.J.-M. and A.B.; visualisation, J.S.-P.; supervision, J.B.-F.; project administration, J.S.-P. All authors have read and agreed to the published version of the manuscript.

Funding

This research received no external funding.

Institutional Review Board Statement

Not applicable.

Informed Consent Statement

Not applicable.

Data Availability Statement

Not applicable.

Conflicts of Interest

The authors declare no conflict of interest.

Abbreviations

LCALife cycle analysis
GDPGross domestic product
OECDOrganisation for Economic and Cooperation Development
WHOWorld Health Organization
EMASEco-Management and Audit Scheme
INSALUDNational Health Institute (Spanish)
HCUHospital complexity unit
DRGDiagnosis-related group
ADAbiotic depletion
ADFFossil depletion
GWPGlobal warming potential for a 100-year time horizon
ODPOzone layer depletion
HTPHuman toxicity potential
FWAEFresh water aquatic ecotoxicity
MAETPMarine aquatic ecotoxicity
TETPTerrestrial ecotoxicity
POCPPhotochemical oxidant creation potential
AP Acidification potential
EPEutrophication potential
EEIEnvironmental Efficiency Index
GEEIGlobal Environmental Efficiency Index

References

  1. Davis, P.; Milne, B.; Parker, K.; Hider, P.; Lay-Yee, R.; Cumming, J.; Graham, P. Efficiency, effectiveness, equity (E3). Evaluating hospital performance in three dimensions. Health Policy 2013, 112, 19–27. [Google Scholar] [CrossRef]
  2. OECD. Health Spending; Organisation for Economic Cooperation and Development (OECD): Paris, France, 2019. [Google Scholar] [CrossRef]
  3. Villar, C.A.; Guadaño, M.d.B. Catalogo Nacional de Hospitales 2020; Ministry of Health: Madrid, Spain, 2020.
  4. Karliner, J.; Slotterback, S.; Boyd, R.; Ashby, B.; Steele, K. Huella Climática del Sector de la Salud; Salud sin Daño: Buenos Aires, Argentina, 2019. [Google Scholar]
  5. Lalonde, M. A New Perspective on the Health of Canadians. 1974. Available online: www.phac-aspc.gc.ca/ph-sp/phdd/pdf/perspective.pdf (accessed on 18 January 2022).
  6. Amunjela, A.S.; De Kock, I.H.; Brent, A. Developing objective normalised metrics for comparing the energy use of hospitals. In Proceedings of the 26th International Association for Management of Technology Conference—IAMOT 2017, Vienna, Austria, 14–18 May 2017. [Google Scholar]
  7. Jain, N.; Burman, E.; Stamp, S.; Shrubsole, C.; Bunn, R.; Oberman, T.; Barrett, E.; Aletta, F.; Kang, J.; Raynham, P.; et al. Building performance evaluation of a new hospital building in the uk: Balancing indoor environmental quality and energy performance. Atmosphere 2021, 12, 115. [Google Scholar] [CrossRef]
  8. Bambarén-Alatrista, C. Environmental impact of a public hospital in the city of Lima, Peru. Rev. Peru. Med. Exp. Salud Publica 2014, 31, 712–715. [Google Scholar] [CrossRef]
  9. Rodríguez-Miranda, J.P.; García-Ubaque, C.A.; García-Vaca, M.C. Environmental management in public hospitals: Environmental management in Colombia. Rev. Fac. Med. 2016, 64, 621–624. [Google Scholar] [CrossRef]
  10. Pencheon, D. Developing a sustainable health care system: The United Kingdom experience. Med. J. Aust. 2018, 208, 284–285. [Google Scholar] [CrossRef]
  11. Jausovec, M.; Korpnik, N.; Gabrovec, B.; Klemencic, V.S. Siting of Healthcare Care Facilities Based on the Purpose of Their Operation, Demographic Changes, Environmental Characteristics, and the Impact on Public Health. Appl. Sci. 2022, 12, 379. [Google Scholar] [CrossRef]
  12. Organisation, U.N. Conferencia de las Naciones Unidas Sobre el Medio Ambiente y el Desarrollo; United Nations: New York, NY, USA, 1992. [Google Scholar]
  13. European Commission. Regulation (EC) No 1221/2009 of the European Parliament and of the Council of 25 November 2009 on the Voluntary Participation by Organisations in a Community Eco-Management and Audit Scheme (EMAS), Repealing Regulation (EC) No 761/2001 and Commission Decisions 2001/681/EC and 2006/193/EC; European Commission: Brussels, Belgium, 2009. [Google Scholar]
  14. Bambarén-Alatrista, C.; Alatrista-Gutiérrez, M.d.S. Huella de Carbono en Cinco Establecimientos de Salud del Tercer Nivel de Atención de Perú, 2013. Rev. Peru. Med. Exp. Salud Publica 2016, 33, 274–277. [Google Scholar] [CrossRef]
  15. Connor, A.; Lillywhite, R.; Cooke, M. The carbon footprint of a renal service in the United Kingdom. QJM Int. J. Med. 2010, 103, 965–975. [Google Scholar]
  16. Esmaeili, A.; McGuire, C.; Overcash, M.; Ali, K.; Soltani, S.; Twomey, J. Environmental impact reduction as a new dimension for quality measurement of healthcare services: The case of magnetic resonance imaging. Int. J. Health Care Qual. Assur. 2018, 31, 910–922. [Google Scholar] [CrossRef]
  17. Campion, N.; Thiel, C.L.; DeBlois, J.; Woods, N.C.; Landis, A.E.; Bilec, M.M. Life cycle assessment perspectives on delivering an infant in the US. Sci. Total Environ. 2012, 425, 191–198. [Google Scholar] [CrossRef]
  18. McAlister, S.; Grant, T.; McGain, F. An LCA of hospital pathology testing. Int. J. Life Cycle Assess. 2021, 26, 1753–1763. [Google Scholar] [CrossRef]
  19. Willskytt, S.; Tillman, A.M. Resource efficiency of consumables—Life cycle assessment of incontinence products. Resour. Conserv. Recycl. 2019, 144, 13–23. [Google Scholar] [CrossRef]
  20. Abd El-Salam, M.M. Hospital waste management in El-Beheira governorate, Egypt. J. Environ. Manag. 2010, 91, 618–629. [Google Scholar] [CrossRef]
  21. Ahmad, R.; Liu, G.; Santagata, R.; Casazza, M.; Xue, J.; Khan, K.; Nawab, J.; Ulgiati, S.; Lega, M. LCA of hospital solid waste treatment alternatives in a developing country: The case of district Swat, Pakistan. Sustainability 2019, 11, 3501. [Google Scholar] [CrossRef]
  22. Carino, S.; Porter, J.; Malekpour, S.; Collins, J. Environmental Sustainability of Hospital Foodservices across the Food Supply Chain: A Systematic Review. J. Acad. Nutr. Diet. 2020, 120, 825–873. [Google Scholar] [CrossRef] [PubMed]
  23. Eckelman, M.J.; Sherman, J. Environmental impacts of the U.S. health care system and effects on public health. PLoS ONE 2016, 11, e0157014. [Google Scholar] [CrossRef]
  24. Van Straten, B.; Ligtelijn, S.; Droog, L.; Putman, E.; Dankelman, J.; Weiland, N.H.S.; Horeman, T. A life cycle assessment of reprocessing face masks during the Covid-19 pandemic. Sci. Rep. 2021, 11, 17680. [Google Scholar] [CrossRef]
  25. Bałys, M.; Brodawka, E.; Korzeniewska, A.; Szczurowski, J.; Zarębska, K. LCA and economic study on the local oxygen supply in Central Europe during the COVID-19 pandemic. Sci. Total Environ. 2021, 786, 147401. [Google Scholar] [CrossRef]
  26. Zhao, H.; Liu, H.; Wei, G.; Wang, H.; Zhu, Y.; Zhang, R.; Yang, Y. Comparative life cycle assessment of emergency disposal scenarios for medical waste during the COVID-19 pandemic in China. Waste Manag. 2021, 126, 388–399. [Google Scholar] [CrossRef]
  27. Sisinno, C.; Moreira, J.C. Ecoefficiency: A tool to reduce solid waste production and waste of materials in health care units. Cad. Saude Publica 2005, 21, 1893–1900. [Google Scholar] [CrossRef]
  28. Silva, A.; Bernardes, R.S.; Moraes, L.; Reis, J. Criteria for definition of environmental contamination indicators related to solid waste from health care facilities: A proposal for evaluation. Cad. Saude Publica 2002, 18, 1401–1409. [Google Scholar] [CrossRef] [PubMed]
  29. Andeobu, L.; Wibowo, S.; Grandhi, S. Medical Waste from COVID-19 Pandemic—A Systematic Review of Management and Environmental Impacts in Australia. Int. J. Environ. Res. Public Health 2022, 19, 1381. [Google Scholar] [CrossRef]
  30. Talibi, S.S.; Scott, T.; Hussain, R.A. The Environmental Footprint of Neurosurgery Operations: An Assessment of Waste Streams and the Carbon Footprint. Int. J. Environ. Res. Public Health 2022, 19, 5995. [Google Scholar] [CrossRef]
  31. European Commission. EMAS Statistics & Graphs. Available online: http://ec.europa.eu/environment/emas/emas_registrations/statistics_graphs_en.htm (accessed on 13 April 2022).
  32. Sanyé-Mengual, E.; Sala, S. Life Cycle Assessment support to environmental ambitions of EU policies and the Sustainable Development Goals. Integr. Environ. Assess. Manag. 2022. [Google Scholar] [CrossRef] [PubMed]
  33. Gulcimen, S.; Aydogan, E.K.; Uzal, N. Life cycle sustainability assessment of a light rail transit system: Integration of environmental, economic, and social impacts. Integr. Environ. Assess. Manag. 2021, 17, 1070–1082. [Google Scholar] [CrossRef]
  34. Seifert, C.; Koep, L.; Wolf, P.; Guenther, E. Life cycle assessment as decision support tool for environmental management in hospitals: A literature review. Health Care Manag. Rev. 2021, 46, 12–24. [Google Scholar] [CrossRef]
  35. Observatory, N.R.S. Anuario Estadístico 2019; Directorate General for Traffic: Madrid, Spain, 2020.
  36. Alshqaqeeq, F.; Amin Esmaeili, M.; Overcash, M.; Twomey, J. Quantifying hospital services by carbon footprint: A systematic literature review of patient care alternatives. Resour. Conserv. Recycl. 2020, 154, 104560. [Google Scholar] [CrossRef]
  37. Huijbregts, M.A.J.; Steinmann, Z.J.N.; Elshout, P.M.F.; Stam, G.; Verones, F.; Vieira, M.; Zijp, M.; Hollander, A.; van Zelm, R. ReCiPe2016: A harmonised life cycle impact assessment method at midpoint and endpoint level. Int. J. Life Cycle Assess. 2017, 22, 138–147. [Google Scholar] [CrossRef]
  38. Malik, A.; Padget, M.; Carter, S.; Wakiyama, T.; Maitland-Scott, I.; Vyas, A.; Boylan, S.; Mulcahy, G.; Li, M.; Lenzen, M.; et al. Environmental impacts of Australia’s largest health system. Resour. Conserv. Recycl. 2021, 169, 105556. [Google Scholar] [CrossRef]
  39. Nicolet, J.; Mueller, Y.; Paruta, P.; Boucher, J.; Senn, N. What is the carbon footprint of primary care practices? A retrospective life-cycle analysis in Switzerland. Environ. Health Glob. Access Sci. Source 2022, 21, 3. [Google Scholar] [CrossRef]
  40. Zhao, W.; van der Voet, E.; Huppes, G.; Zhang, Y. Comparative life cycle assessments of incineration and non-incineration treatments for medical waste. Int. J. Life Cycle Assess. 2009, 14, 114–121. [Google Scholar] [CrossRef]
  41. IDAE. Estudio Sobre Hábitos y Actitudes de Los No Usuarios Habituales Hacia el Transporte Público Urbano Colectivo; IDAE: Madrid, Spain, 2017.
  42. Weisz, U.; Pichler, P.P.; Jaccard, I.S.; Haas, W.; Matej, S.; Bachner, F.; Nowak, P.; Weisz, H. Carbon emission trends and sustainability options in Austrian health care. Resour. Conserv. Recycl. 2020, 160, 104862. [Google Scholar] [CrossRef]
  43. Keller, R.L.; Muir, K.; Roth, F.; Jattke, M.; Stucki, M. From bandages to buildings: Identifying the environmental hotspots of hospitals. J. Clean. Prod. 2021, 319, 128479. [Google Scholar] [CrossRef]
  44. Martini, M.; Chiavaro Da Fonseca, R.; Voigt Severiano, L.; Garbin, H.I.; Flôres Da Rosa, T.; Klück, M. Hospital waste: Can we reduce the environmental impact of a large university hospital? Clin. Biomed. Res. 2017, 37, 288–294. [Google Scholar] [CrossRef]
  45. Schoen, J.; Chopra, V. The Harm We Do: The Environmental Impact of Medicine. J. Hosp. Med. 2018, 13, 353–355. [Google Scholar] [CrossRef] [PubMed]
Figure 1. Work methodology.
Applsci 12 08120 g001
Figure 2. Environmental aspects associated with the activities and services provided by the hospital.
Applsci 12 08120 g002
Figure 3. Inputs and outputs included in the environmental index.
Applsci 12 08120 g003
Figure 4. Distribution of the environmental impact of each environmental aspect in the global environmental efficiency indices.
Applsci 12 08120 g004
Figure 5. Distribution of the environmental impact of each environmental aspect in the environmental efficiency indices of the hospital activity.
Applsci 12 08120 g005
Table 1. Life cycle inventory associated with the activities and services provided by the hospital in 2019.
ItemUnitQuantity
Natural ResourcesWaterm329,917
ElectricityMWh2865.29
Natural gasMWh2767.35
Medical GasesOxygenm328,432
Medical airm331,005
Nitrogenm3686
Waste ProductionWastekg179,991.49
Waste DisposalWaterm329,038
TransportEmployeeskm6,648,422.4
Patientskm8,274,345.4
Materialskm7101.6
Products and MaterialsDisinfectantskg2146.6
Reagentskg1323.2
Batterieskg106.56
Paperkg15,033
Tonerkg244.8
Plastic bagskg5483
Gloveskg11,275.5
Maskskg456
Head and shoe coverskg524
Gownskg8
Protection goggleskg456
Table 2. Details of the elements included in the different waste groups produced by the hospital in 2019.
Waste ProductionItem
Group I—Urban assimilable wastesOrganic waste
Glass
Cardboard
Paper
Debris/wood/metal
Group II—Non-specific healthcare wastes
Group III—Biohazardous healthcare wastesHospital waste
Cytostatics
Group IV—Special healthcare wastesExpired drugs
Halogenated solvents
Plates
Contaminated packaging
Electronic equipment
Batteries
Formaldehyde wastes
Table 3. Single-value Global Environmental Efficiency Index associated with the studied hospital’s activities and services provided in 2019.
GEEI
Natural Resources1.39 × 102
Medicinal Gases2.91 × 102
Wastes2.99 × 103
Discharges1.69 × 102
Means of Transport Used2.21 × 104
Transport of Patients3.48 × 104
Consumption of Materials1.57 × 101
Table 4. Global environmental efficiency indices classified by impact category.
IndicesTotalNatural ResourcesMedical GasesWaste ProductionWaste DisposalTransport EmployeesTransport PatientsConsumption Transport Mat.
EEIAD6.12 × 10−34.42 × 10−61.71 × 10−66.06 × 10−66.73 × 10−62.69 × 10−33.34 × 10−37.52 × 10⁻⁵
EEIADF9.80 × 1031.48 × 1013.30 × 1014.15 × 1011.39 × 1013.17 × 1033.95 × 1032.58 × 103
EEIGWP100a6.22 × 1021.35 × 103.11 × 101.43 × 1011.51 × 102.31 × 1022.88 × 1028.25 × 101
EEIODP8.16 × 10−51.30 × 10−73.14 × 10−76.70 × 10−71.07 × 10−73.48 × 10−54.33 × 10−52.18 × 10⁻⁶
EEIHTP5.46 × 1027.08 × 10−11.37 × 104.57 × 102.48 × 102.02 × 1022.51 × 1028.32 × 101
EEIFWAE3.31 × 1028.15 × 10−11.86 × 102.51 × 1011.33 × 101.30 × 1021.62 × 1029.14 × 10
EEIMAETP5.46 × 1052.08 × 1035.48 × 1035.92 × 1042.14 × 1031.98 × 1052.47 × 1053.18 × 104
EEITE1.05 × 101.39 × 10−28.77 × 10−31.90 × 10−23.18 × 10−23.57 × 10−14.45 × 10−11.71 × 10⁻¹
EEIPOCP1.64 × 10−14.06 × 10−45.92 × 10−45.66 × 10−35.02 × 10−45.88 × 10−27.32 × 10−22.52 × 10⁻²
EEIAP1.99 × 106.93 × 10−31.62 × 10−22.26 × 10−21.30 × 10−27.37 × 10−19.18 × 10−12.72 × 10⁻¹
EEIEP6.51 × 10−13.26 × 10−31.04 × 10−23.09 × 10−24.05 × 10−22.26 × 10−12.81 × 10−15.93 × 10⁻²
Table 5. Effect of alternative transport scenarios on environmental efficiency indices.
IndicesTransport of Patients (100% Private Vehicles)Transport of Patients (45.7% Private Vehicles and 54.3% Public Transport)Impact ReductionTransport of Employees (100% Private Vehicles)Transport of Employees (45.7% Private Vehicles and 54.3% Public Transport)Impact ReductionTransport of Employees (97.9% Private Vehicles and 2.1% Bicycles)Impact Reduction
EEIAD3.34 × 10−31.97 × 10−341.02%2.69 × 10−31.58 × 10−341.26%2.63 × 10−32.23%
EEIADF3.95 × 1032.54 × 10335.70%3.17 × 1032.04 × 10335.65%3.11 × 1031.89%
EEIGWP100a2.88 × 1021.83 × 10236.46%2.31 × 1021.47 × 10236.36%2.27 × 1021.73%
EEIODP4.33 × 10−52.88 × 10−533.49%3.48 × 10−52.31 × 10−533.62%3.41 × 10−52.01%
EEIHTP2.51 × 1021.28 × 10249.00%2.02 × 1021.03 × 10249.01%1.98 × 1021.98%
EEIFWAE1.62 × 1028.24 × 10149.14%1.30 × 1026.62 × 10149.08%1.28 × 1021.54%
EEIMAETP2.47 × 1051.28 × 10548.18%1.98 × 1051.03 × 10547.98%1.95 × 1051.52%
EEITE4.45 × 10−12.50 × 10−143.82%3.57 × 10−12.01 × 10−143.70%3.51 × 10−11.68%
EEIPOCP7.32 × 10−24.36 × 10−240.44%5.88 × 10−23.50 × 10−240.48%5.77 × 10−21.87%
EEIAP9.18 × 10−17.45 × 10−118.85%7.37 × 10−15.98 × 10−118.86%7.23 × 10−11.90%
EEIEP2.81 × 10−12.08 × 10−125.98%2.26 × 10−11.67 × 10−126.11%2.21 × 10−12.21%
Table 6. Single-Value Environmental Efficiency Index (Hospital Activity) associated with the hospital activities and services provided in 2019.
GEEI
Natural Resources1.39 × 102
Medicinal Gases 2.91 × 10²
Wastes2.99 × 103
Discharges1.69 × 102
Consumption of Materials1.49 × 101
Table 7. Hospital activity environmental efficiency indices of the activities and services provided by the hospital in 2019 classified by impact category.
IndicesTotalNatural ResourcesMedical GasesWaste ProductionWaste DisposalConsumption of Materials
EEIAD9.11 × 10−54.42 × 10−61.71 × 10−66.06 × 10−66.73 × 10−67.23 × 10⁻⁵
EEIADF2.67 × 1031.48 × 1013.30 × 1014.15 × 1011.39 × 1012.57 × 103
EEIGWP100a1.02 × 1021.35 × 103.11 × 101.43 × 1011.51 × 108.17 × 101
EEIODP3.28 × 10−61.30 × 10−73.14 × 10−76.70 × 10−71.07 × 10−72.06 × 10⁻⁶
EEIHTP9.20 × 1017.08 × 10−11.37 × 104.57 × 102.48 × 108.29 × 101
EEIFWAE3.81 × 1018.15 × 10−11.86 × 102.51 × 1011.33 × 108.96 × 10
EEIMAETP1.00 × 1052.08 × 1035.48 × 1035.92 × 1042.14 × 1033.13 × 104
EEITE2.43 × 10−11.39 × 10−28.77 × 10−31.90 × 10−23.18 × 10−21.70 × 10⁻¹
EEIPOCP3.21 × 10−24.06 × 10−45.92 × 10−45.66 × 10−35.02 × 10−42.49 × 10⁻²
EEIAP3.28 × 10−16.93 × 10−31.62 × 10−22.26 × 10−21.30 × 10−22.69 × 10⁻¹
EEIEP1.43 × 10−13.26 × 10−31.04 × 10−23.09 × 10−24.05 × 10−25.83 × 10⁻²
Publisher’s Note: MDPI stays neutral with regard to jurisdictional claims in published maps and institutional affiliations.

