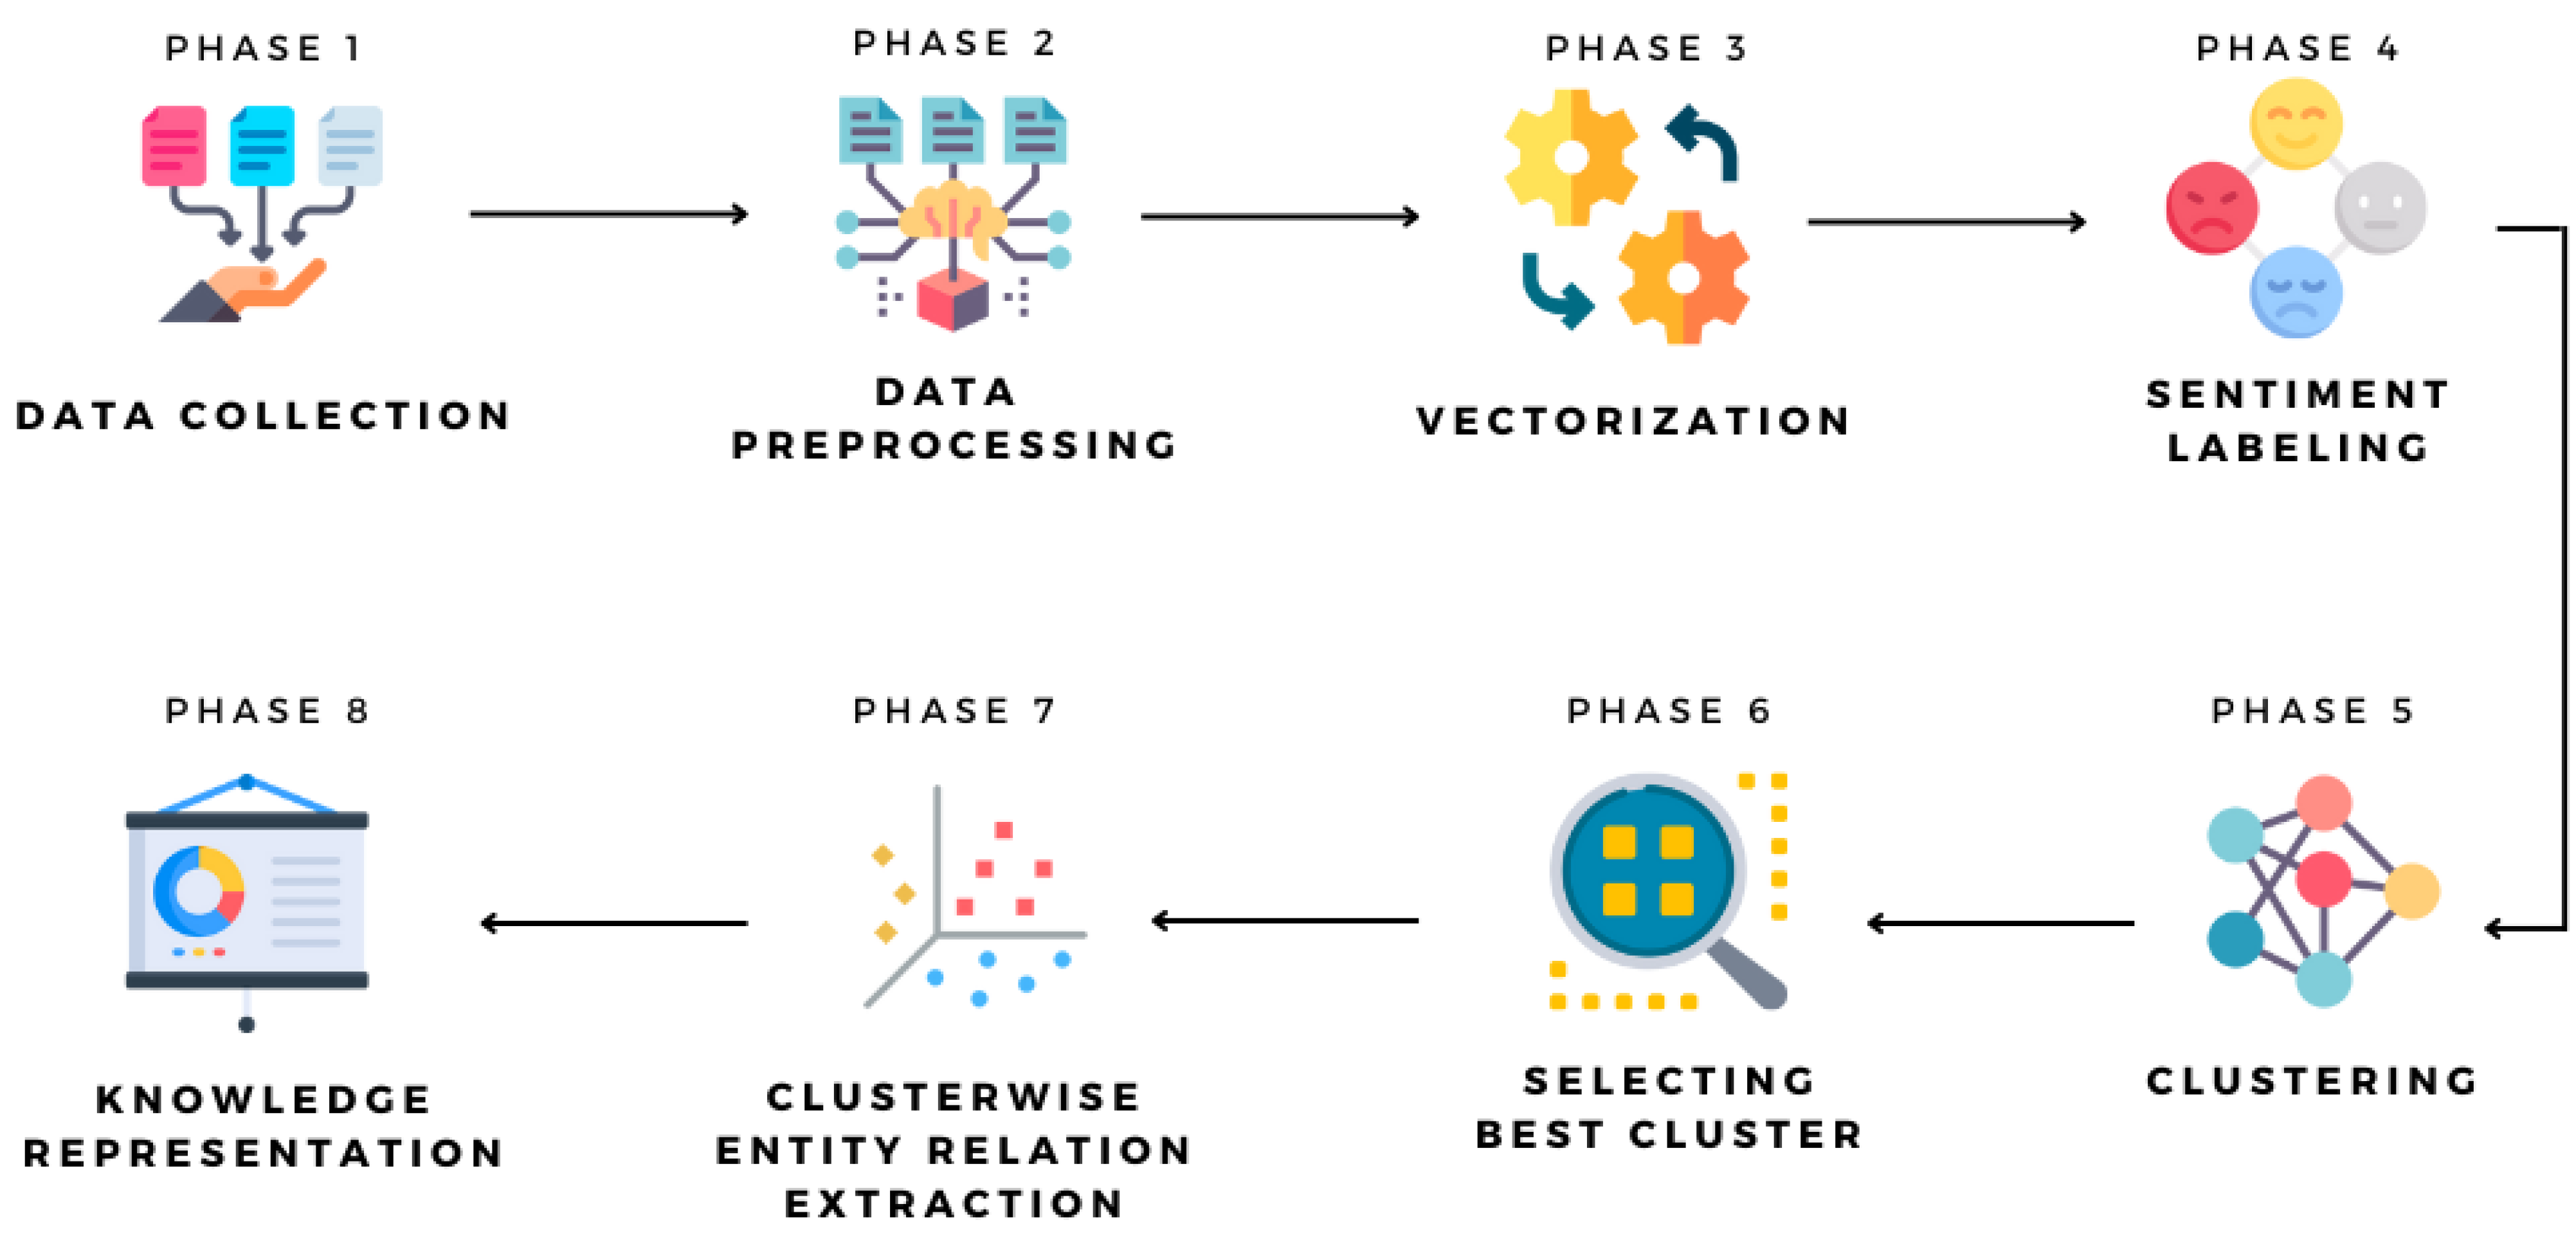
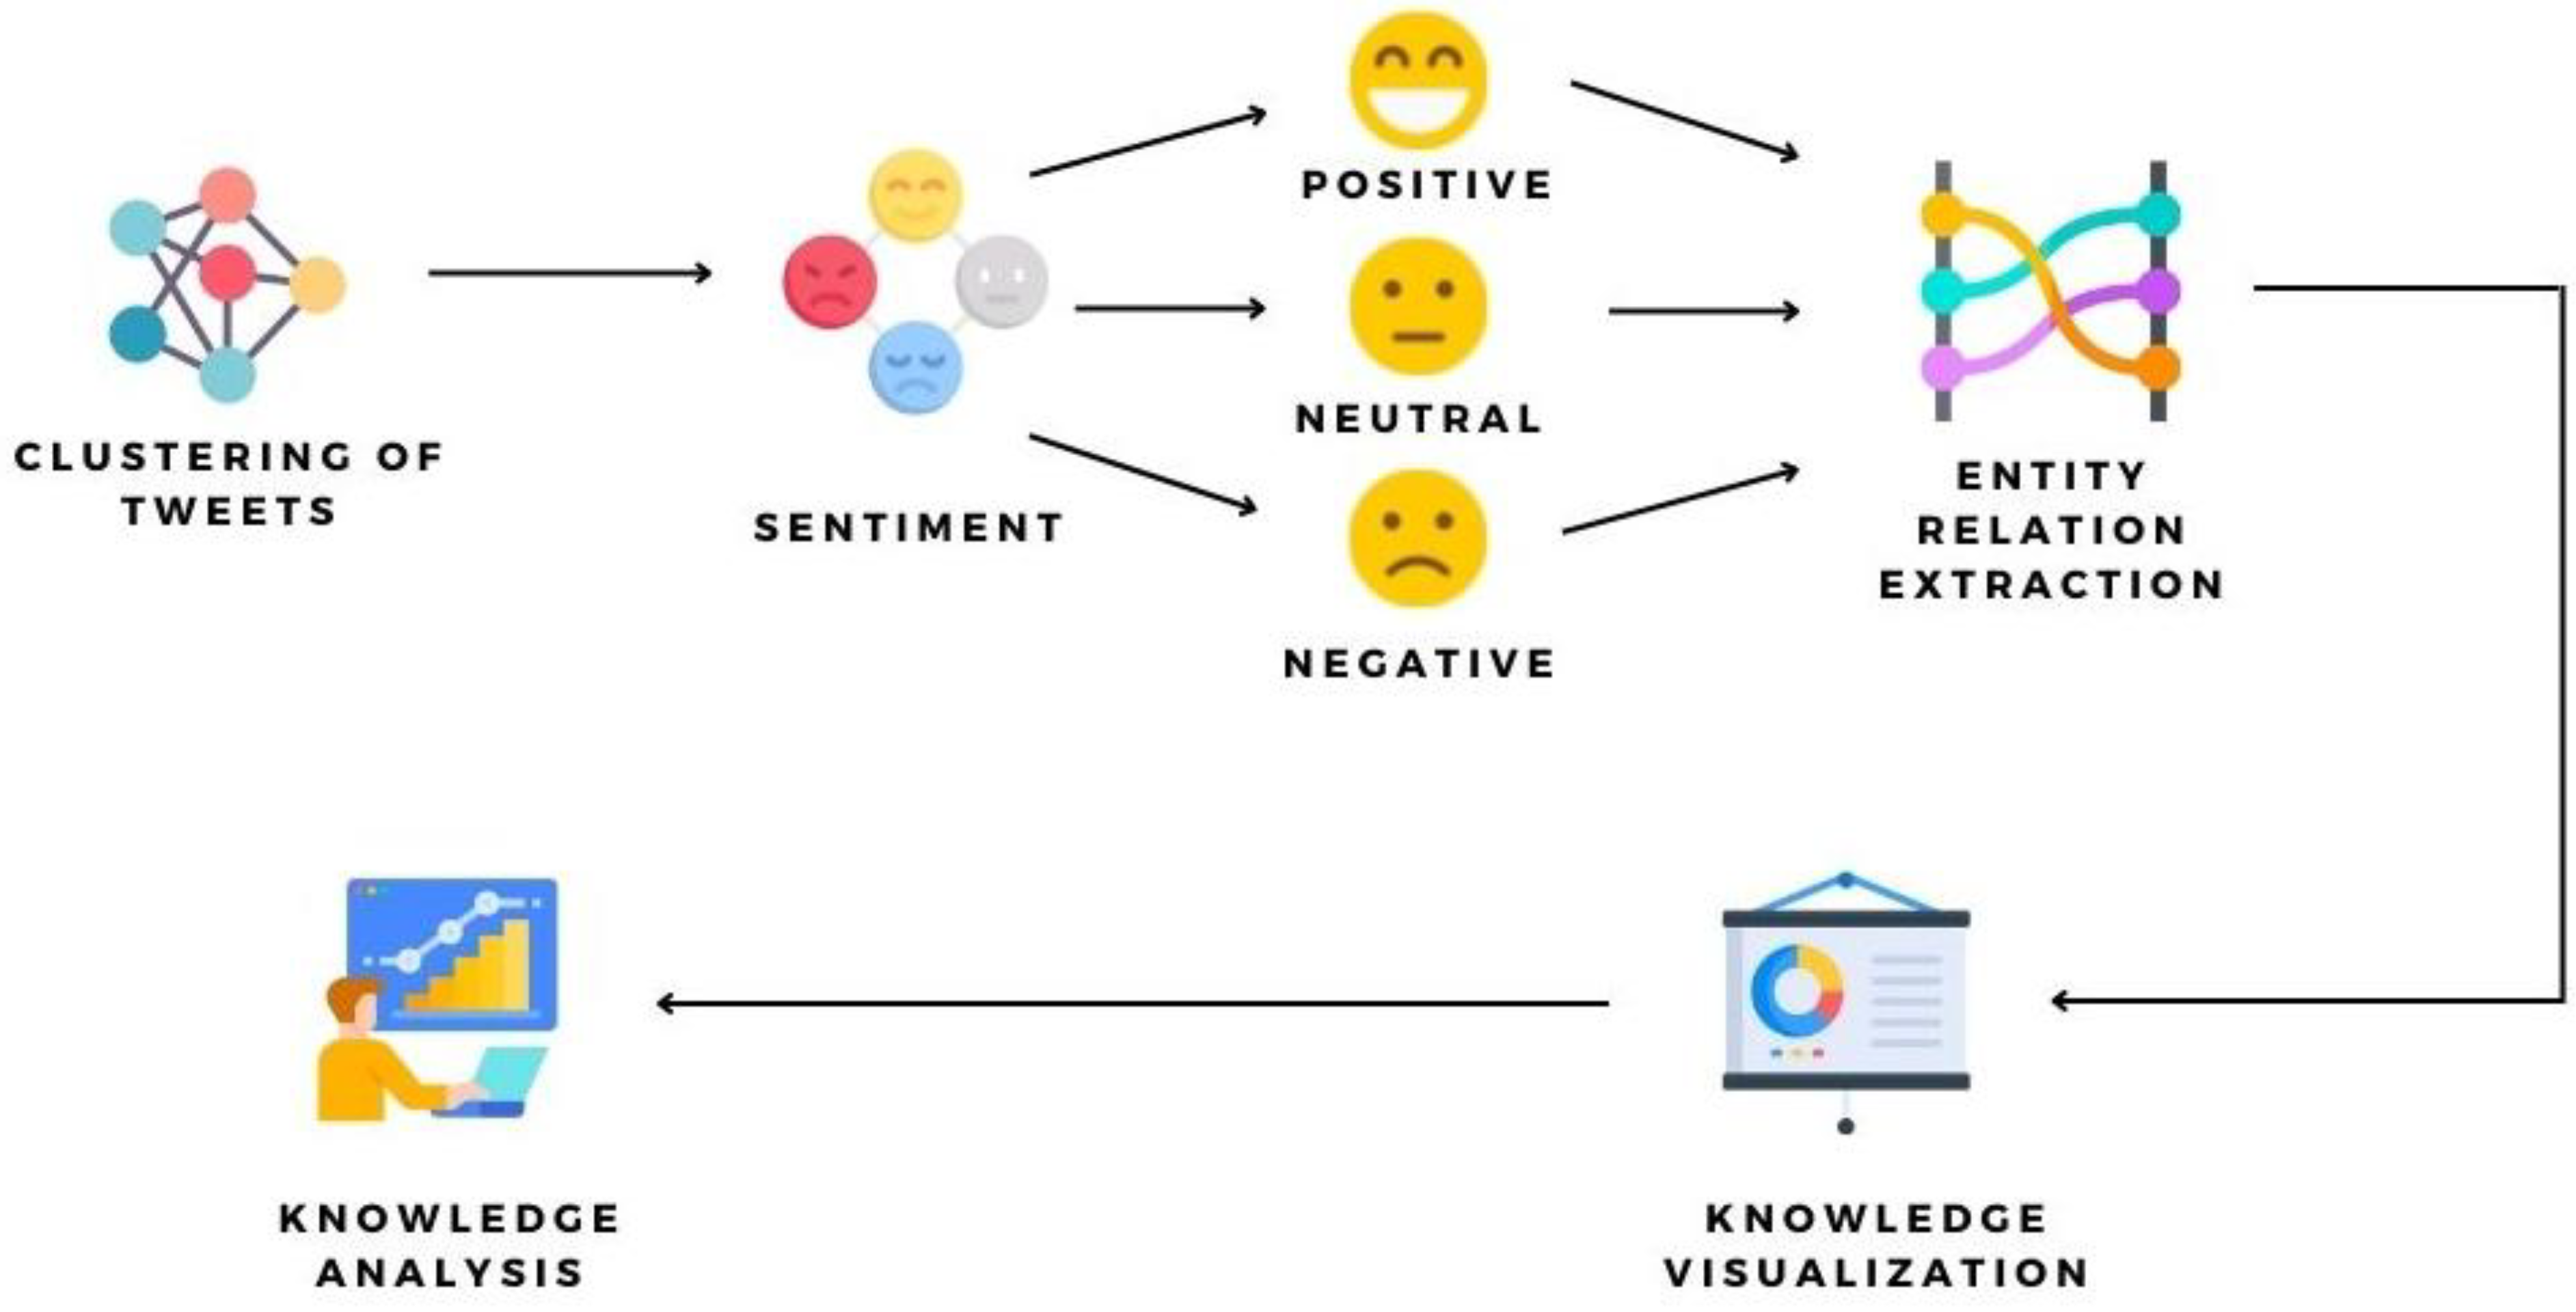
In this section of the research, a discussion of a detailed stepwise approach is presented as shown in
Figure 1. The process starts with collecting the data from Twitter followed by a few crucial components such as cleaning and preprocessing of the data. Then the collected the tweets are changed to numeric vector representations, where an optimized K-means clustering algorithm is used to group similar entities. Cluster-wise knowledge graphs are finally created to visually represent significant relationships in relevance to tourism and economical sentiments.
3.2. Dataset Preprocessing
Data preprocessing is a mining activity that transforms the raw data into an understandable format [
19,
28]. To overcome the issue of redundant unstructured information through tweets preprocessing is important and it has been done with a tweet-preprocessor library, which is held responsible for identification of emoticons, URLs, and reserved words. Due to the unstructured information obtained from the tweets, the information must be preprocessed into quantifiable evaluation [
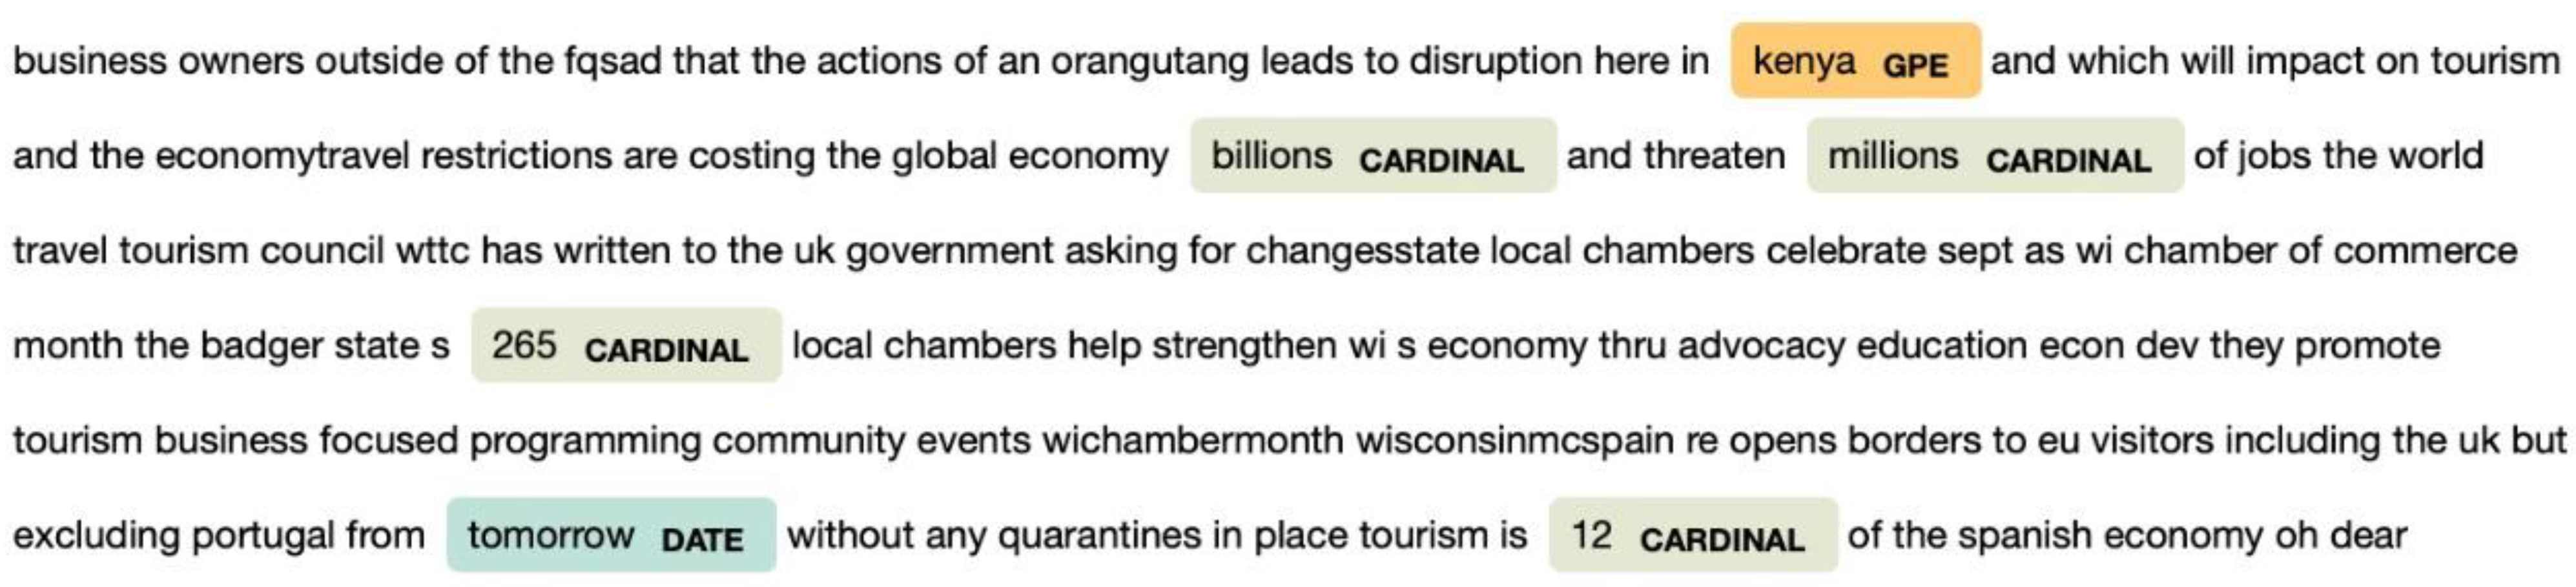
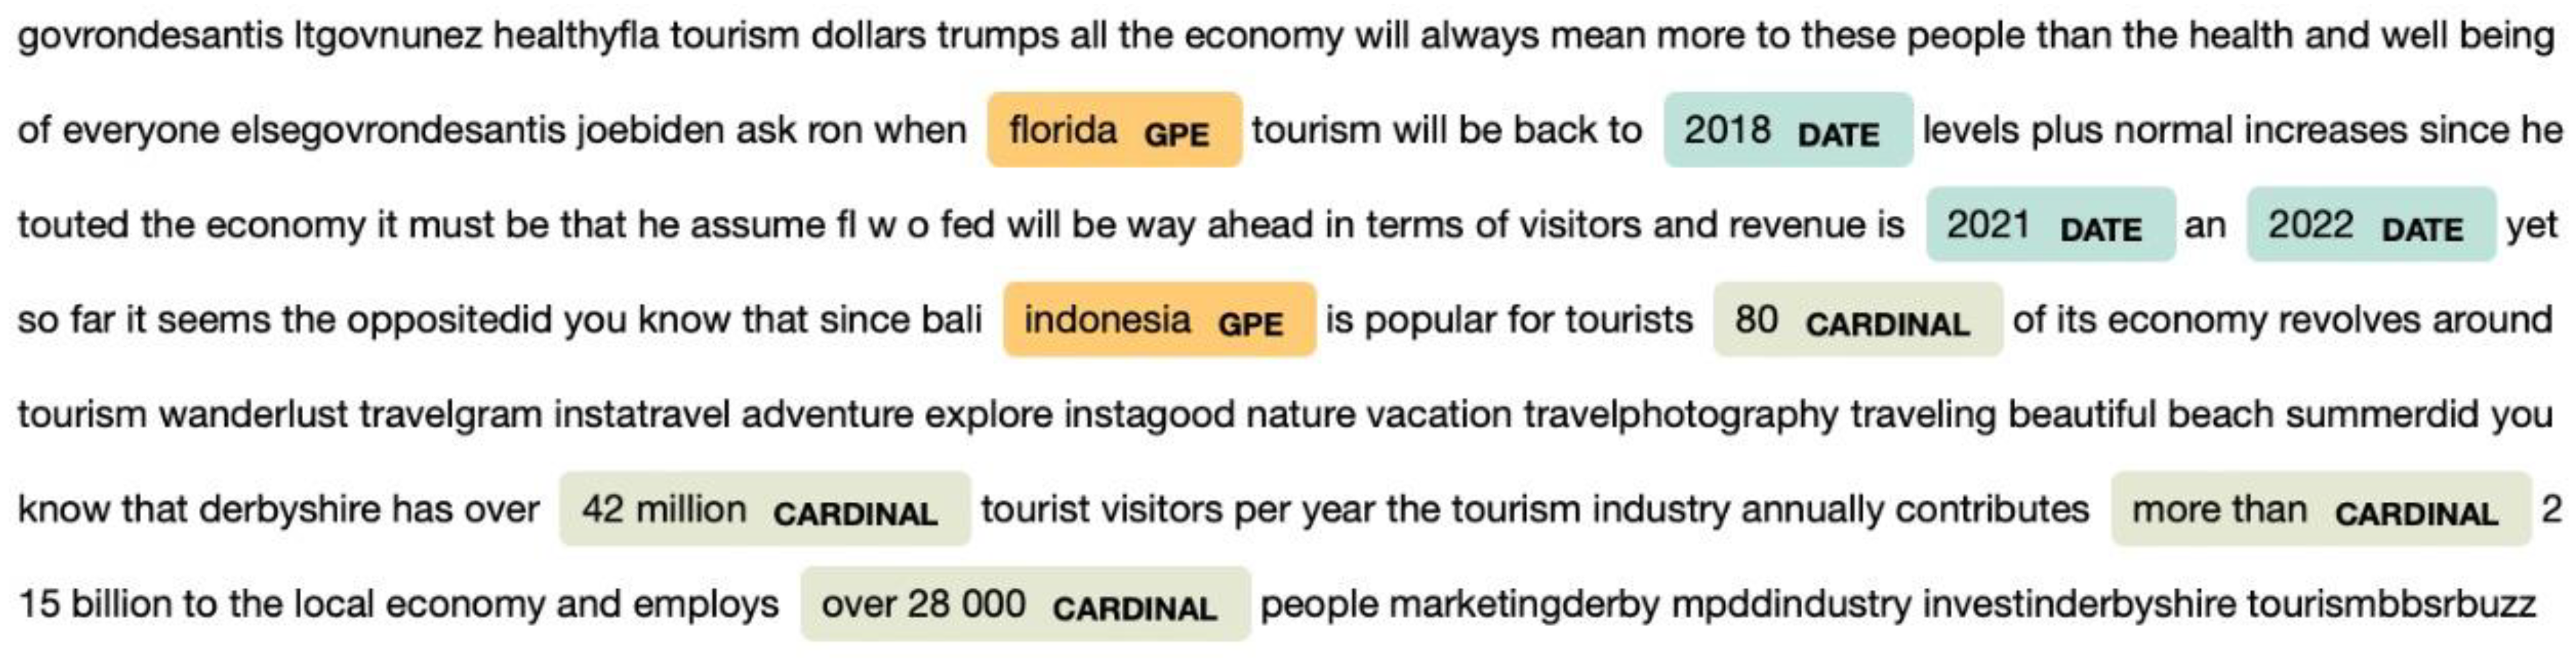
29]. For each tweet, the orientation of emotions are positive sentiment, negative sentiment, and neutral sentiment.
Table 2 describes the query with keywords along with their sentimental score.
Stop Words are terms like “for” or “by” that have no real meaning. Eliminating such terms is usually believed to be an essential step, which can enhance the quality of the framework.
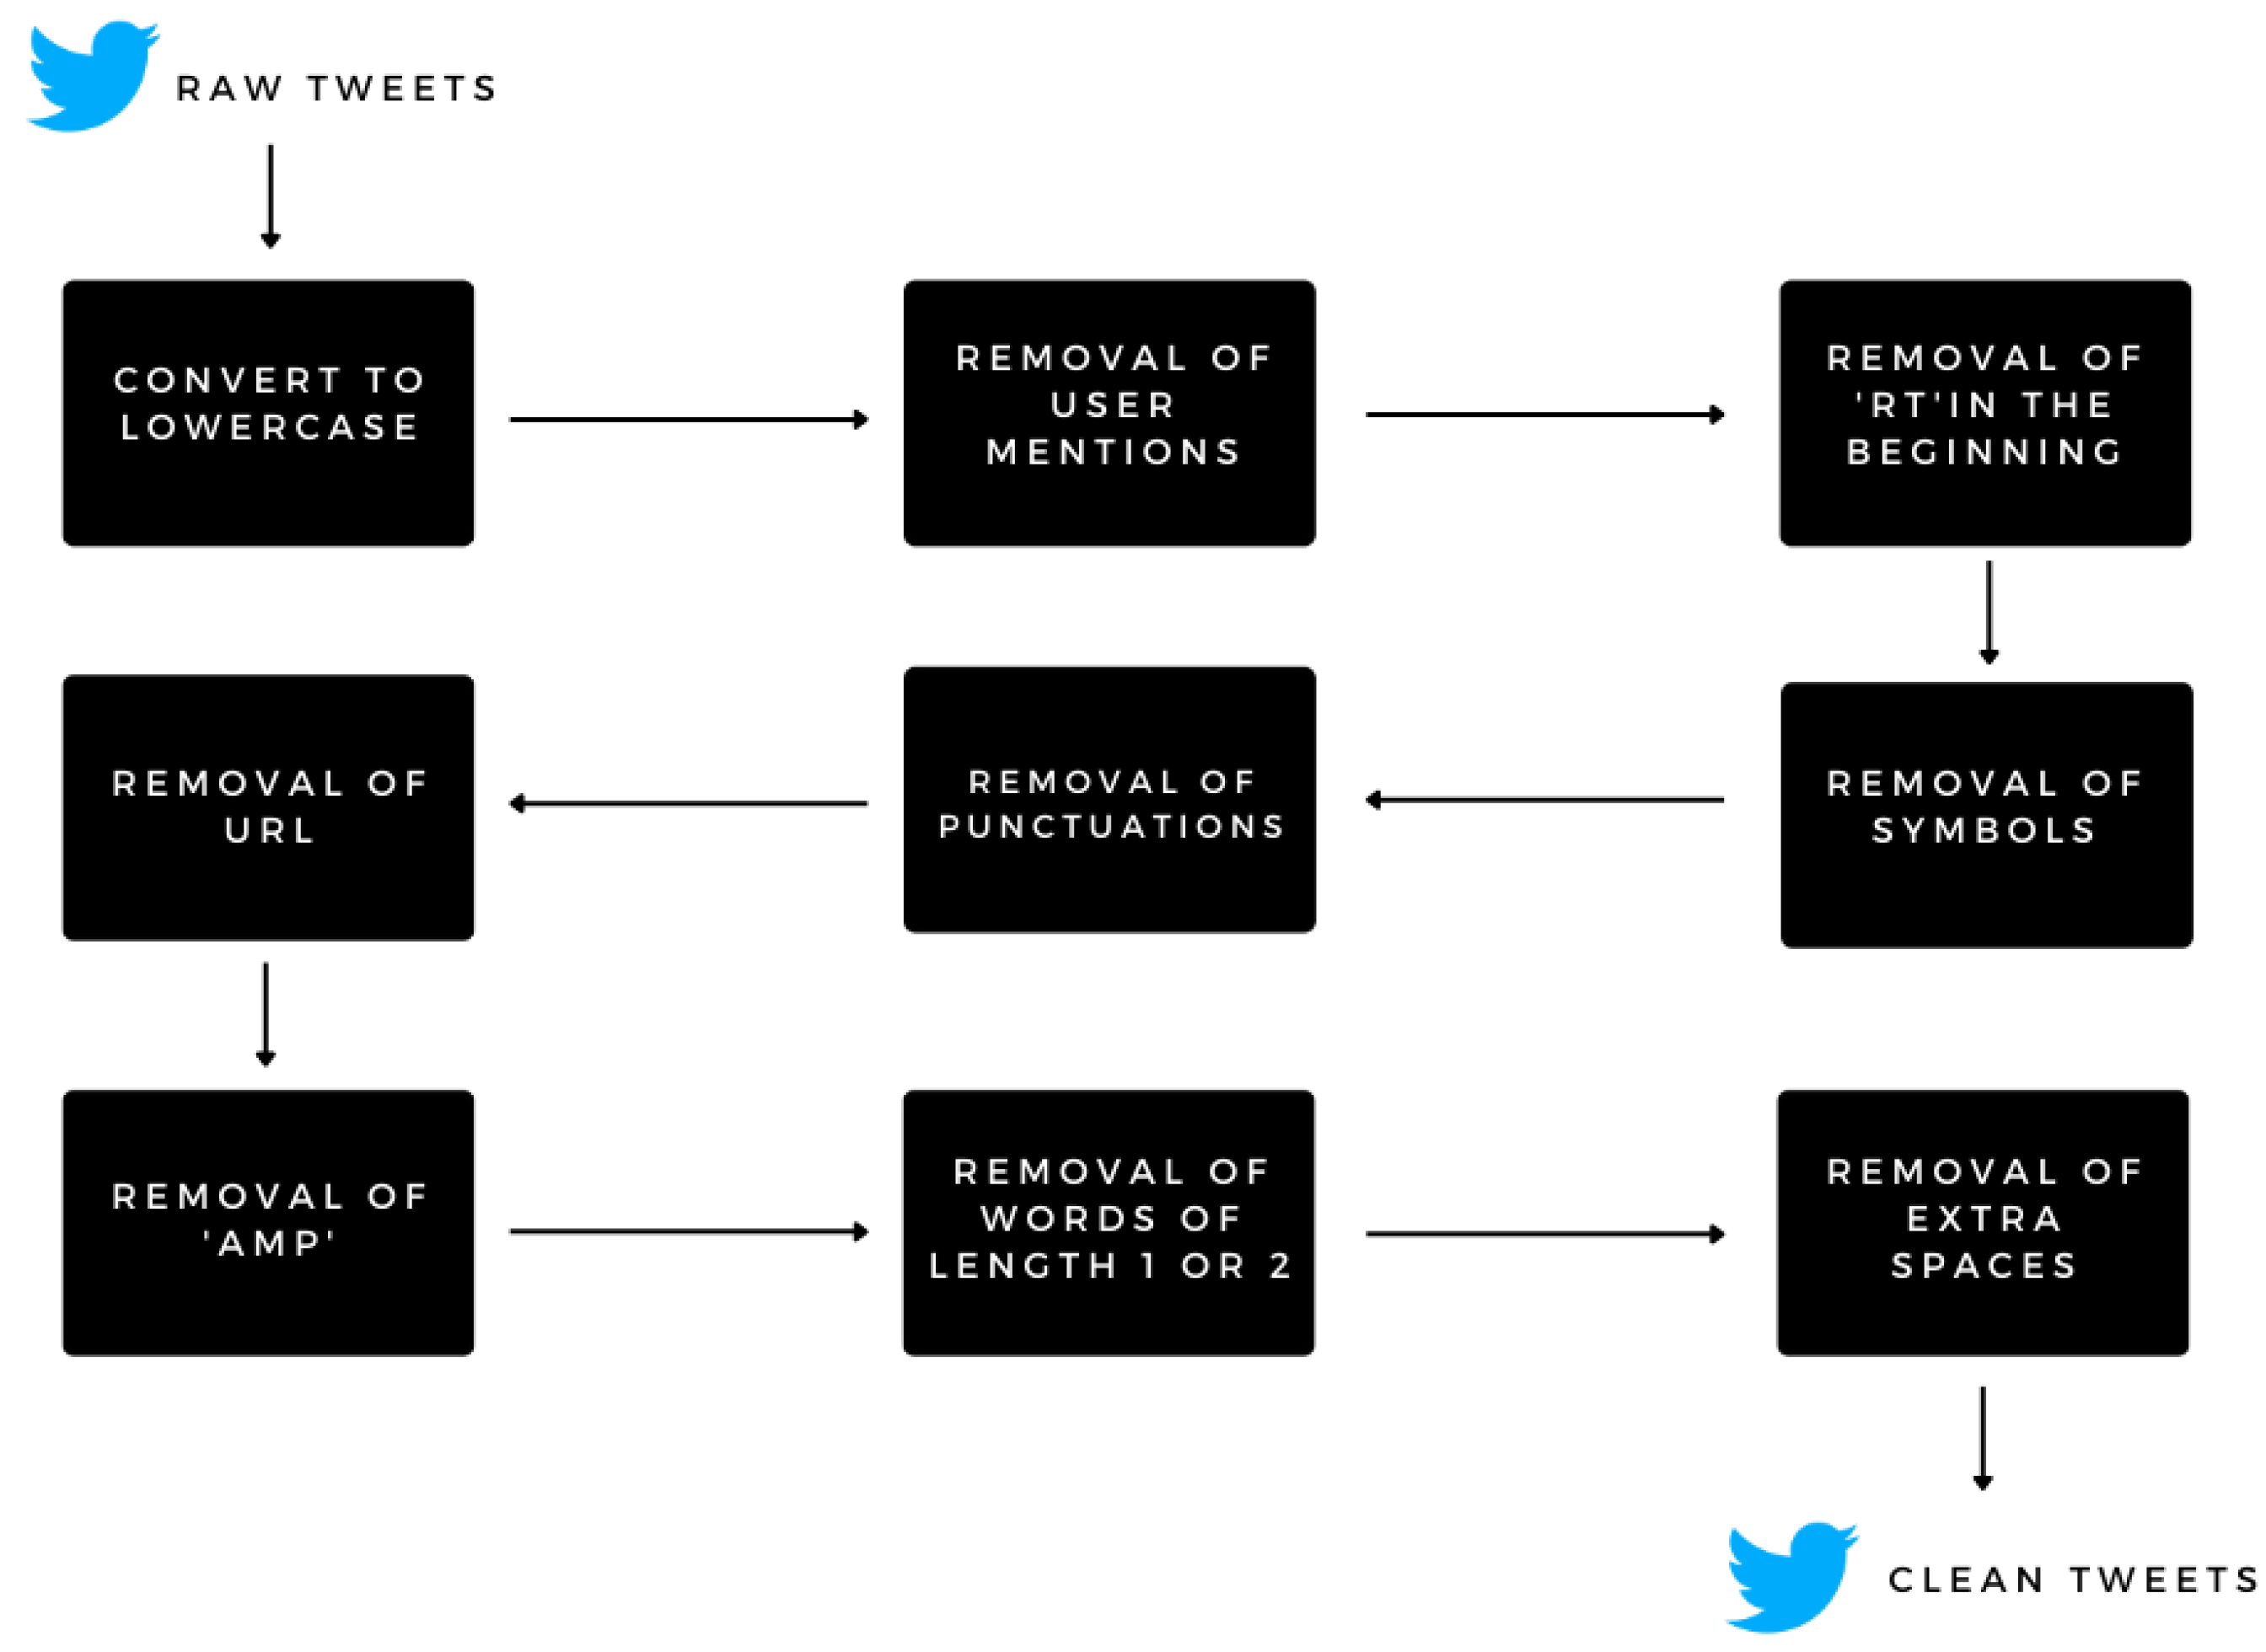
Figure 2 shows all the necessary steps taken to preprocess the tweets.
3.3. Tweet Vectorization
Machine learning methods work with a numeric feature space and need input in the form of a two-dimensional array with rows representing occurrences and columns representing features. To perform machine learning on text, first the documents must be converted into vector representations so that computation operational for machine learning may be applied [
30]. This procedure is known as feature extraction or, more simply, vectorization, and it is a necessary initial step in language-aware analysis.
Punkt sentence tokenizer splits a given paragraph into a collection of sentences by building a model for abbreviated terms, compound words, and terms that initiate lines using an unsupervised method. Before utilizing the tokenizer, it should be trained on a substantial amount of input in the chosen language. A pre-conditioned Punkt tokenizer for English is included in the NLTK (Natural Language Toolkit) data collection [
31,
32,
33].
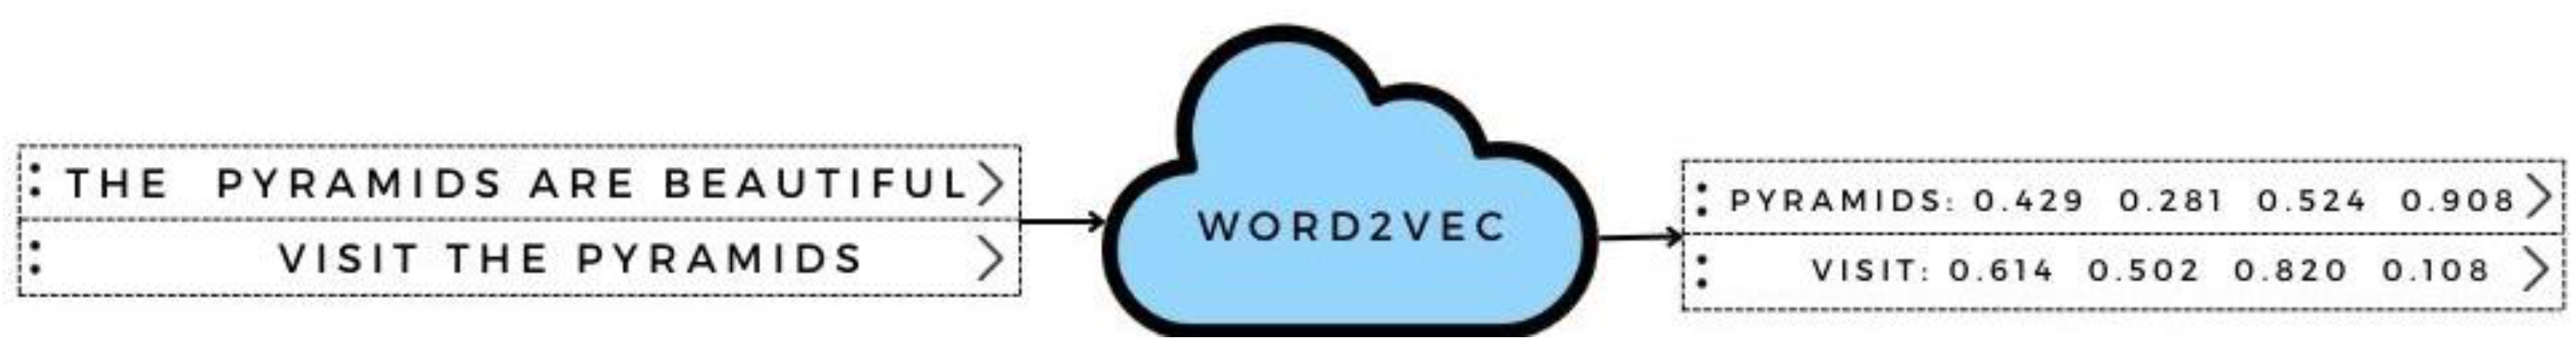
Word2vec [
34], shown in
Figure 3, is used in order to convert the tweets into the vector format. Statistical computations on such word vectors allow us to discover connections between the terms. Word2Vec is a hybrid method that combines two methods: CBOW [
35] (Continuous Bag of Words) [
36] and the Skip-gram model [
37]; both are neural networks that map one or more words to a target variable that is also a word. Weights that serve as term vector forms are learned in both approaches. CBOW predicts the chances of a term based on the context in which it is used, which can be a sole neighboring word or a series of words. The Skip-gram model operates in the opposite direction, attempting to predict the background for a given term [
38].
In order to employ textual content in machine learning methods, it must first be transformed it into a vector. The bag-of-words strategy is one of the techniques. Bag of words approach neglects syntax and word structure. First, a keyword bank is constructed from the whole sample of dataset that was gathered. As a result, each text or item is considered as a series of input vectors depending on the corpus’s terminology [
35].
3.4. Sentiment Labelling
Every year, the number of digital exchanges increases significantly, and content analysis gives a mechanism to comprehend the views, ideas, and reactions that lay beneath the online language. It is especially valuable in the era of social media, that may give you a sense of how people feel about certain topics. Data collected from sentiment studies on social networking sites has a wide range of applications, ranging from minor applications like improving brand building activities to bigger public concerns like guiding government ideology and forecasting economic growth [
5,
39]. As people are expressing their ideas and emotions more freely nowadays, sentiment analysis is quickly coming up as an indispensable tool for monitoring and understanding opinions in all forms of data, including social media.
Sentiment labeling can be considered as a subdivision of natural language processing that involves determining the underlying emotion in a textual content [
40,
41]. This involves measuring the sentiment polarity of an entity. Sentiment polarity refers to the inclination of the text, whether the emotion is more of negative or positive. Polarity score is a float value of the range [−1.0, 1.0].
After converting the textual data into vector representations, the polarity of each text is measured based on lexical approach. NLTK is a python library that provides the user with simple access to large sources of lexical knowledge. Textblob is an NLP module present in NLTK that helps users to facilitates the investigation and manipulation of large amounts of textual data. Textblob returns sentiment polarity of a sentence based on positive and negative words used [
42].
The polarity and subjectivity of a statement are returned by TextBlob: −1 denotes a negative emotion, whereas 1 indicates a pleasant emotion. This polarity is reversed when using negative terms. TextBlob is used as a labeling system to perform fine-grained analysis. For instance, emoticons, exclamation points, emojis, and like (button) are all examples. Between [0, 1] is where subjectivity is found. Quantifying the quantity of subjective information in a piece of writing is called subjectiveness. The more subjective the material, the more likely it is to be filled with personal opinions instead of facts. Intensity is an additional TextBlob property. TextBlob uses ‘intensity’ to determine how subjective a piece of content is. The severity of a term affects whether it alters the following word or phrase. Adverbs are often employed in English as modifiers (e.g., “excess amount”) [
43,
44].
3.5. Clustering
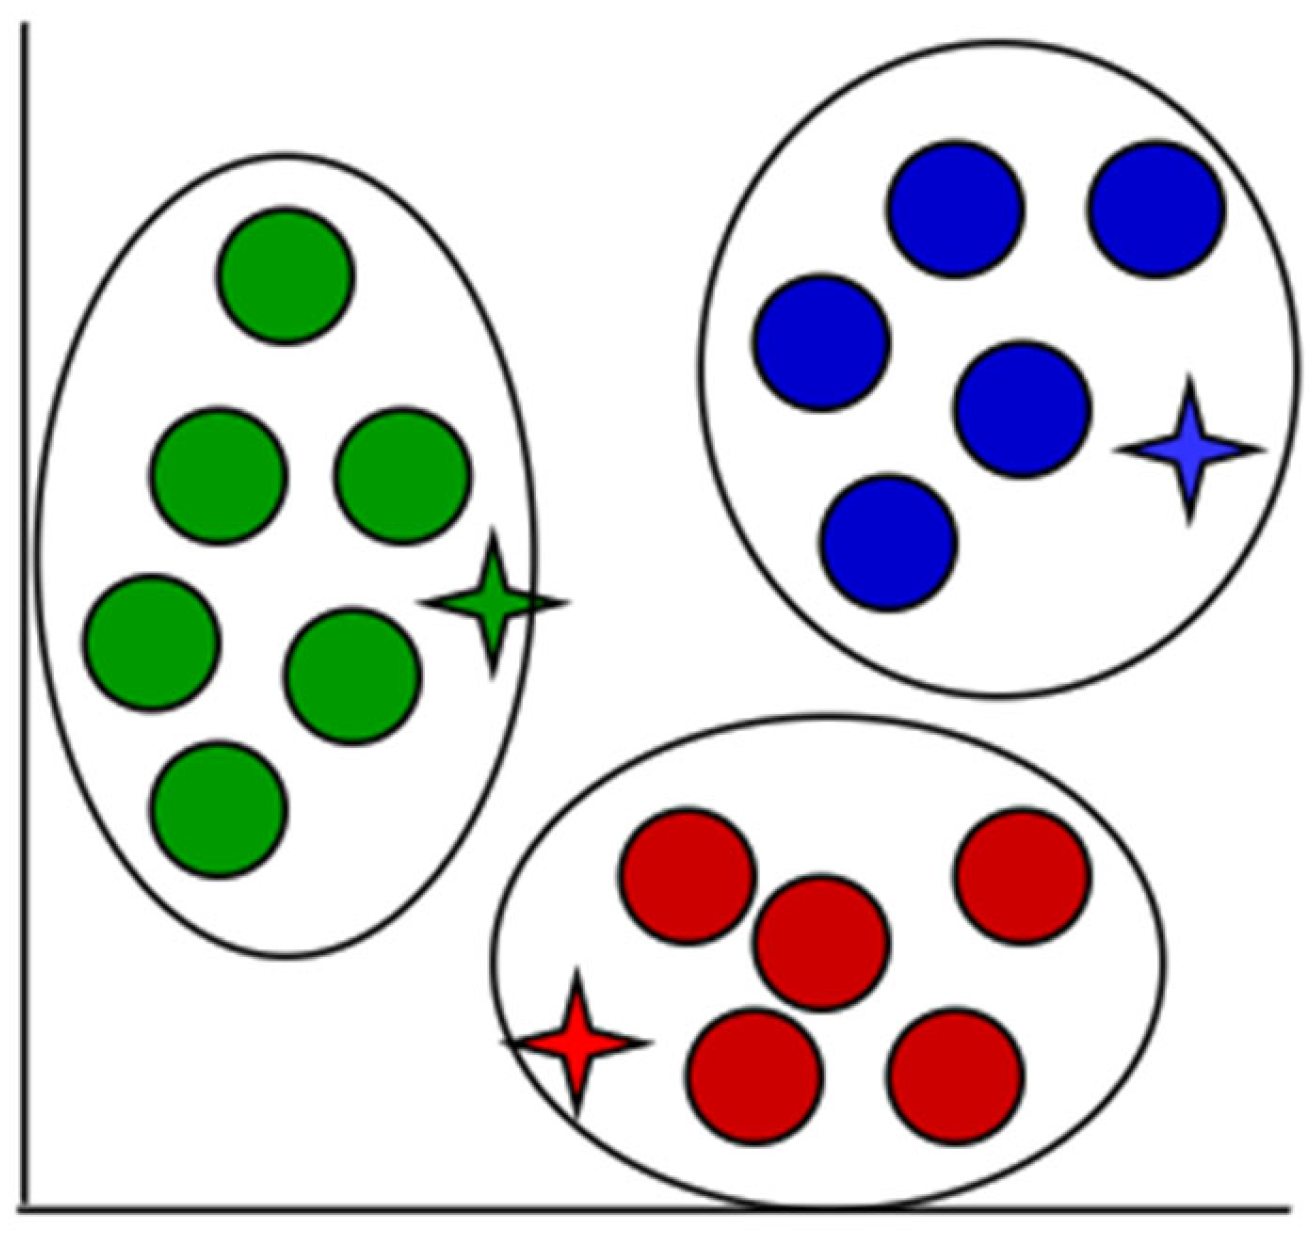
Clustering plays a huge role in data analysis and can be regarded as one of the most challenging aspects under unsupervised learning. The main aim of clustering to make groups of similar unlabeled data points called clusters. For the clustering process, the
K-means clustering approach is used.
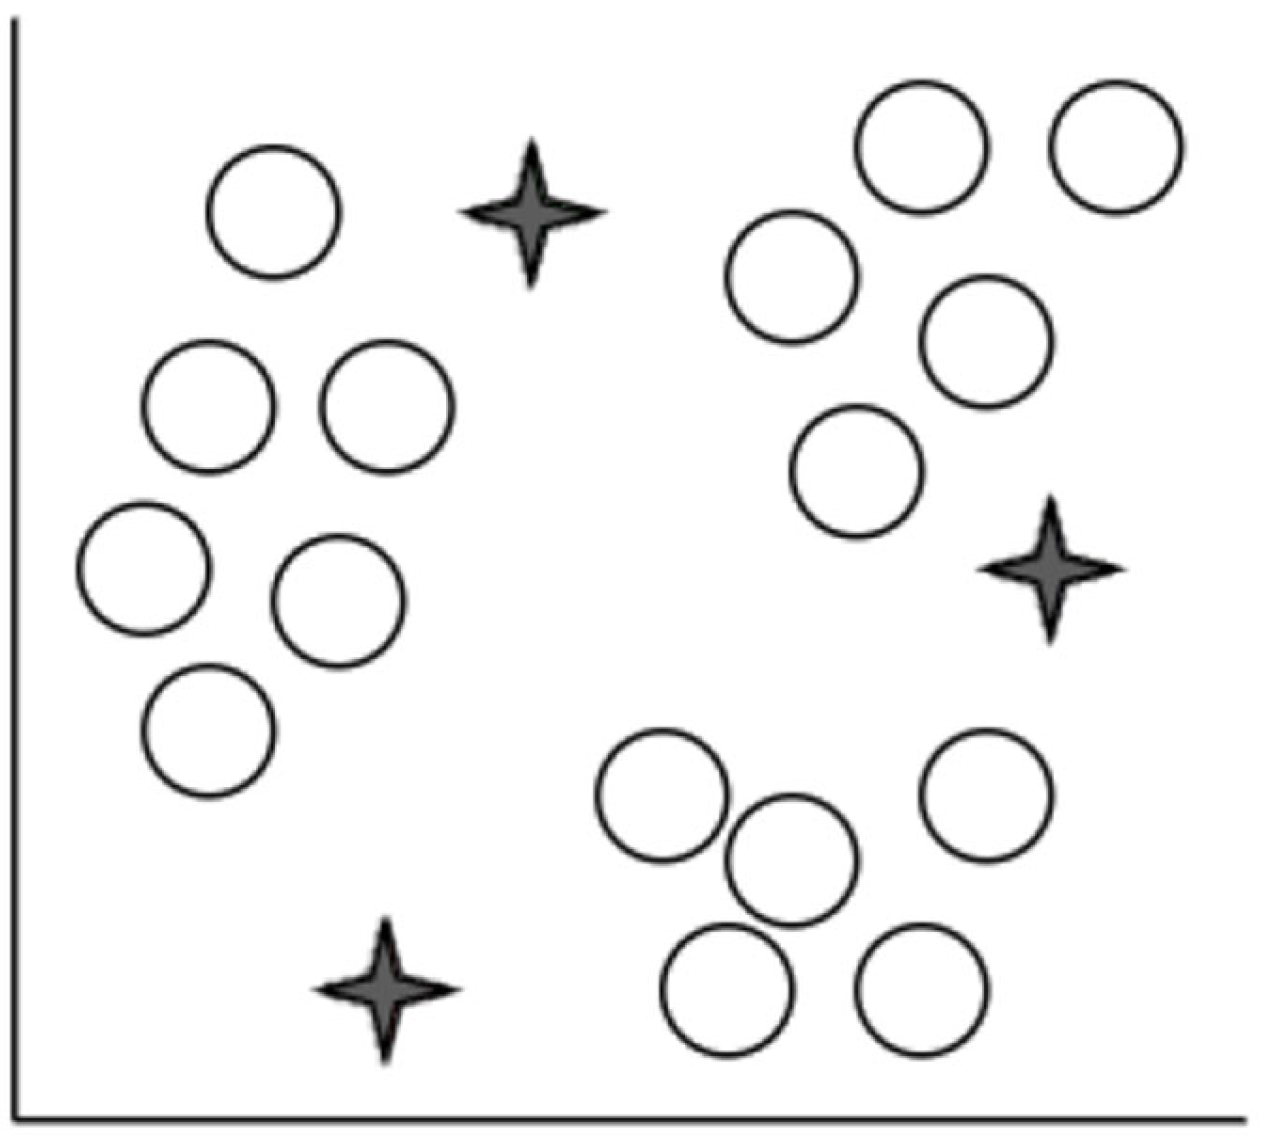
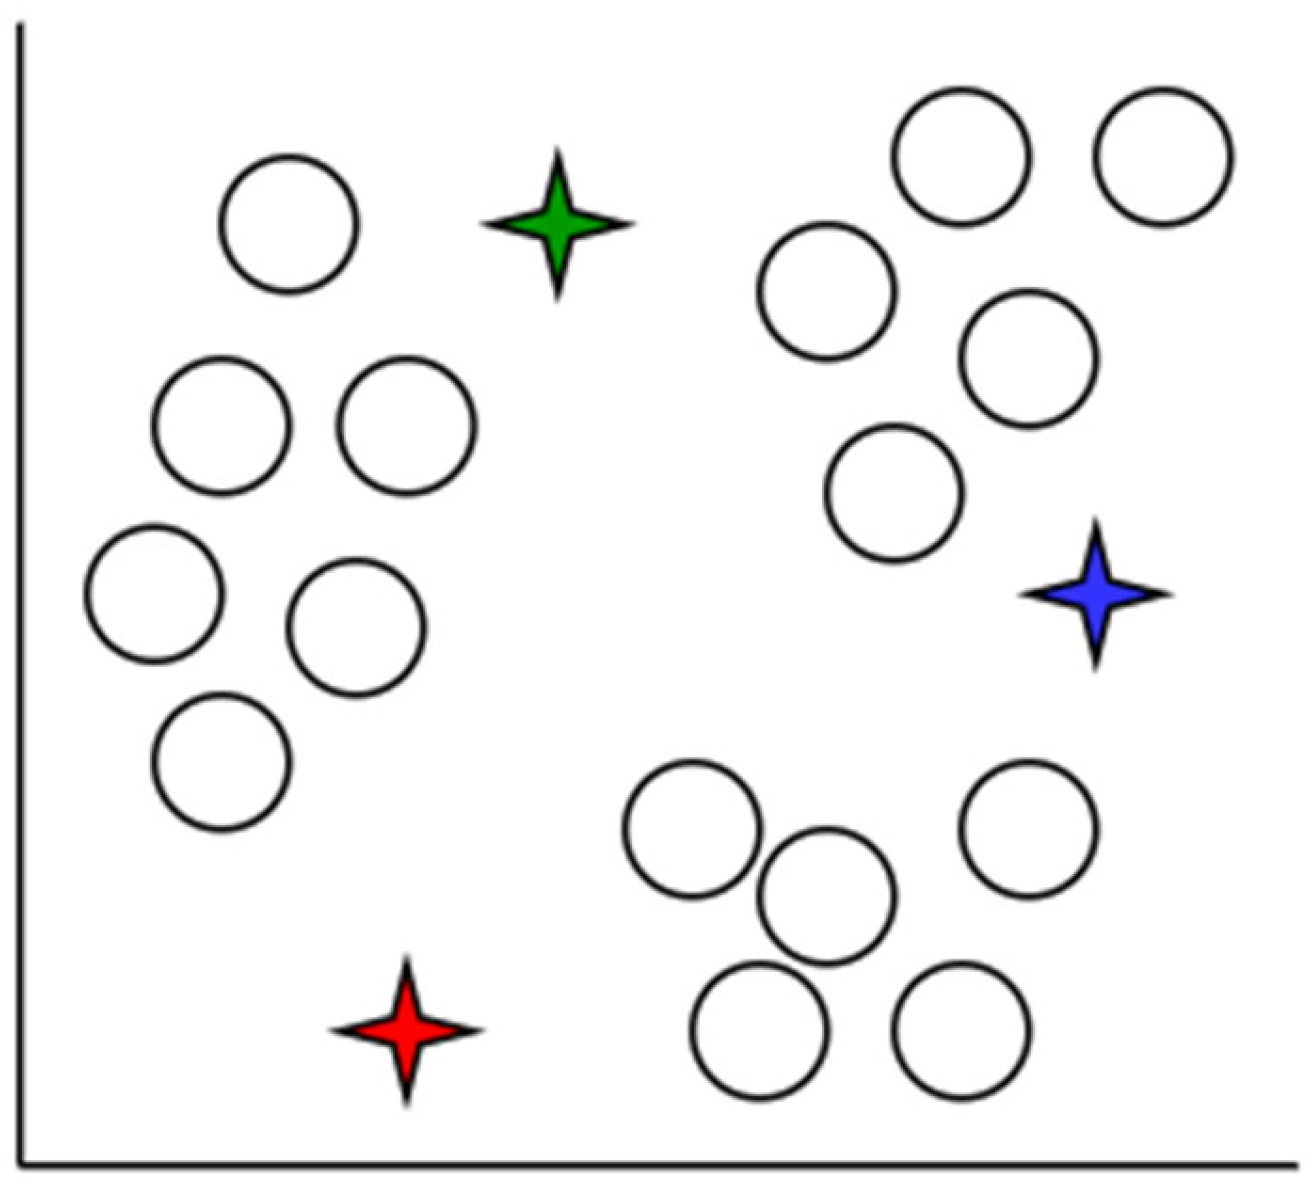
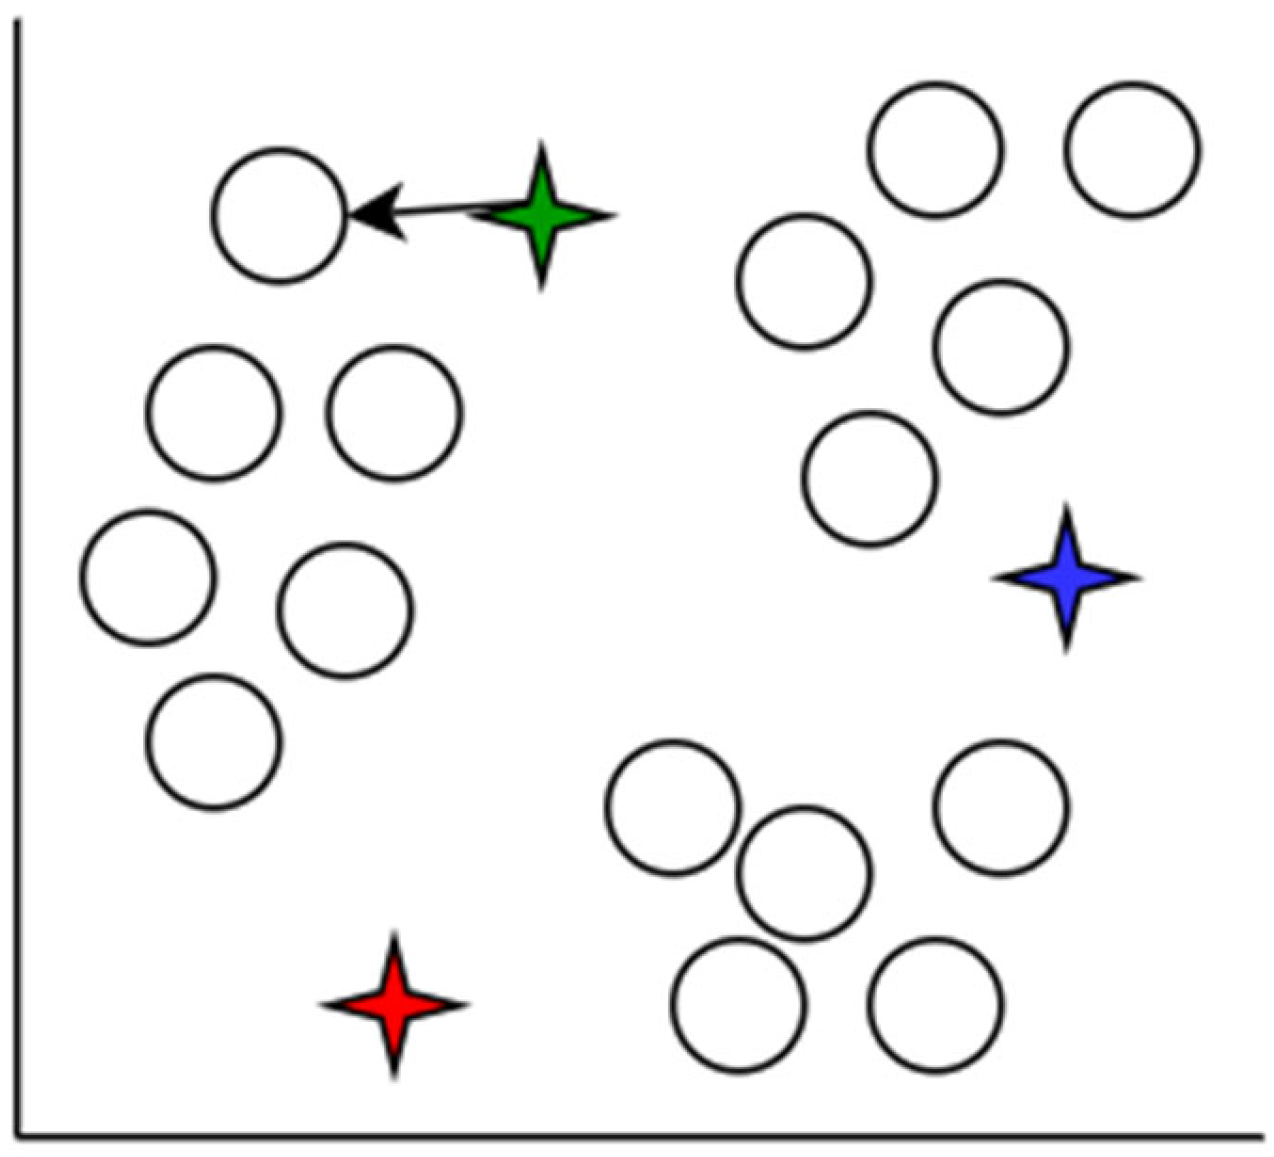
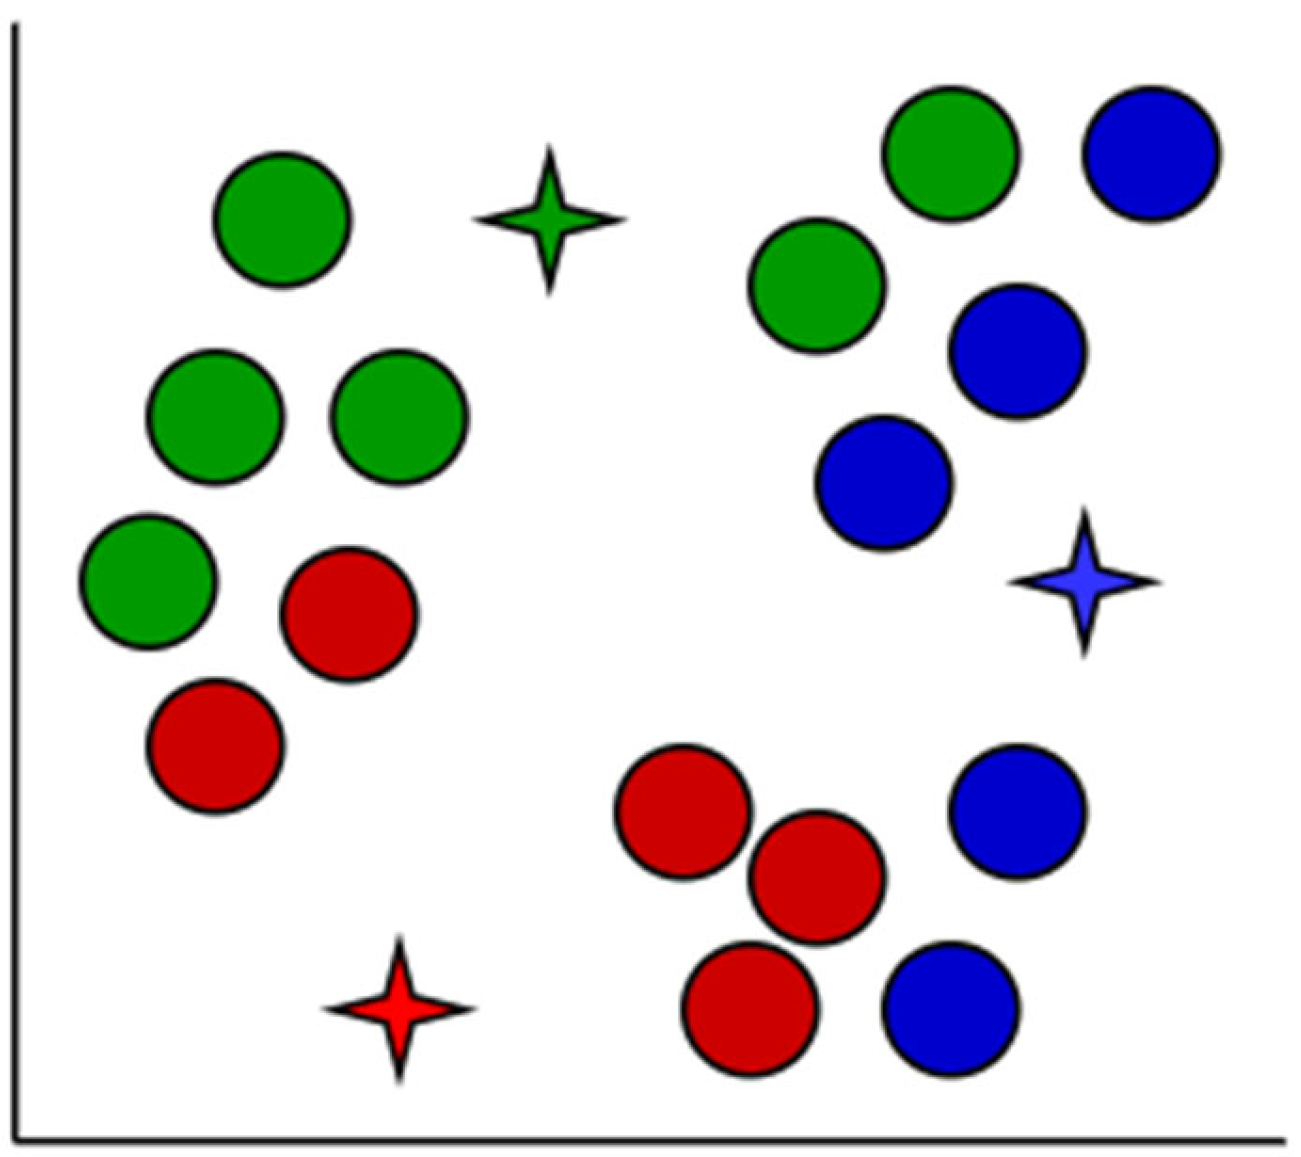
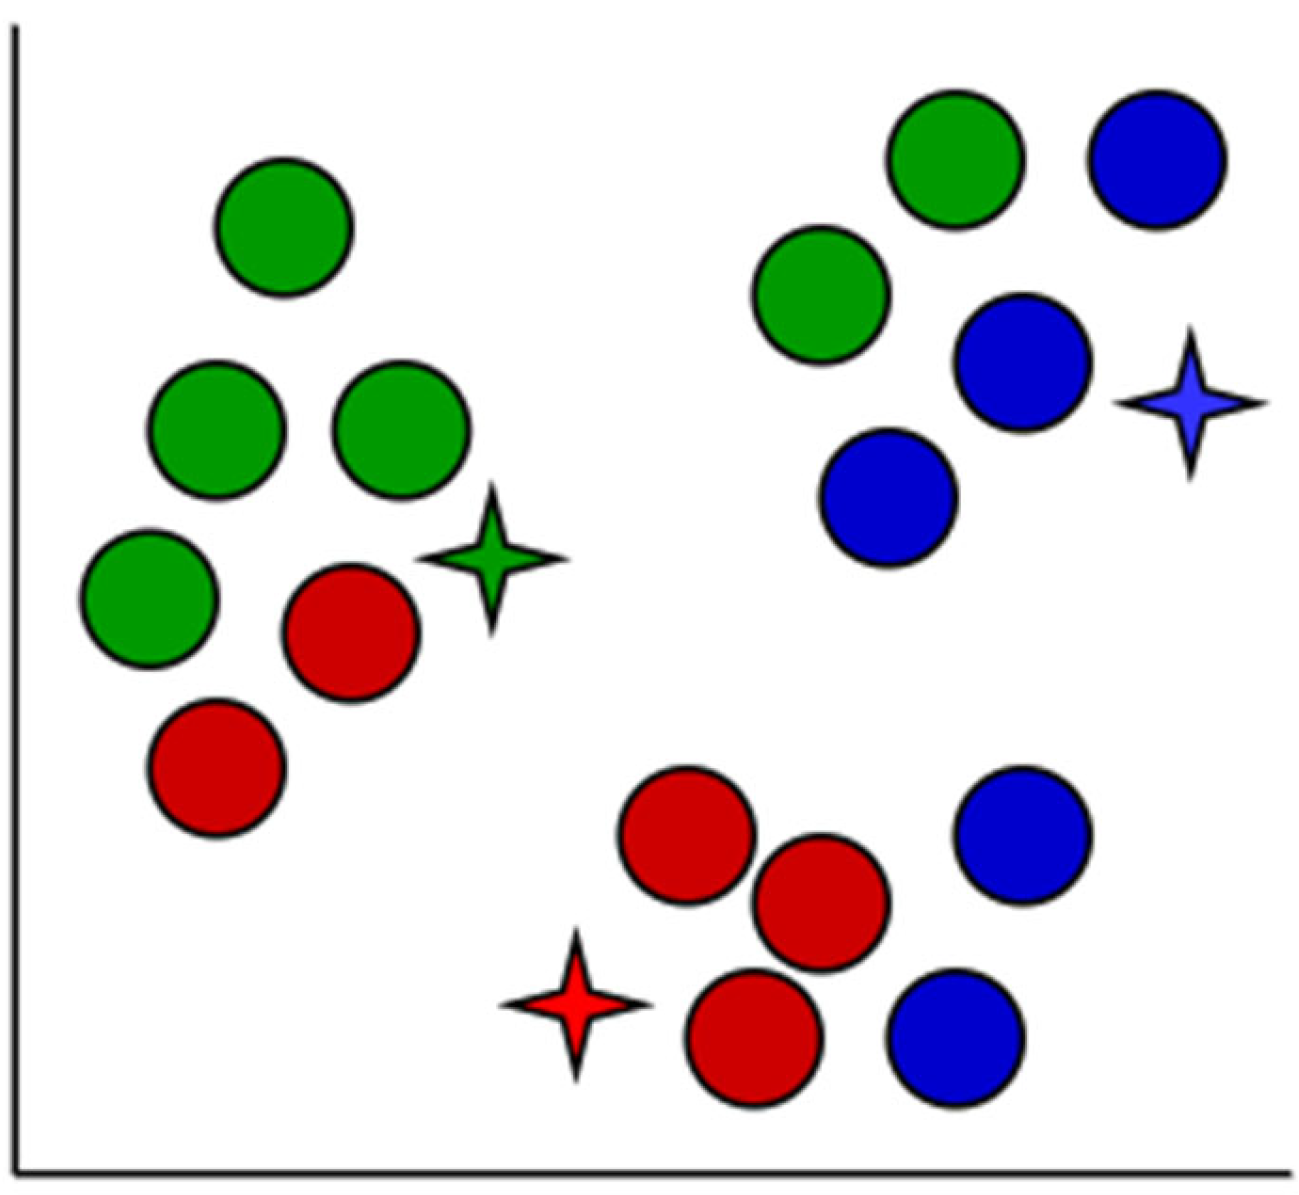
K-means clustering is a well-known and strong unsupervised classification approach that may be used to a wide range of problems where each data point is added to a cluster. It is used in the solution of a wide range of complicated unsupervised machine learning issues [
45]. The
Figure 4,
Figure 5,
Figure 6,
Figure 7,
Figure 8 and
Figure 9 demonstrate how
K-means clustering works.
An iterative method of allocating each piece of data item to the categories, and over time, data points begin to clump together based on similar characteristics. The goal is to reduce the total of gaps among the data items and the group center to the smallest possible value in order to determine which group every data item should fall to.
K-means clustering function can be stated as
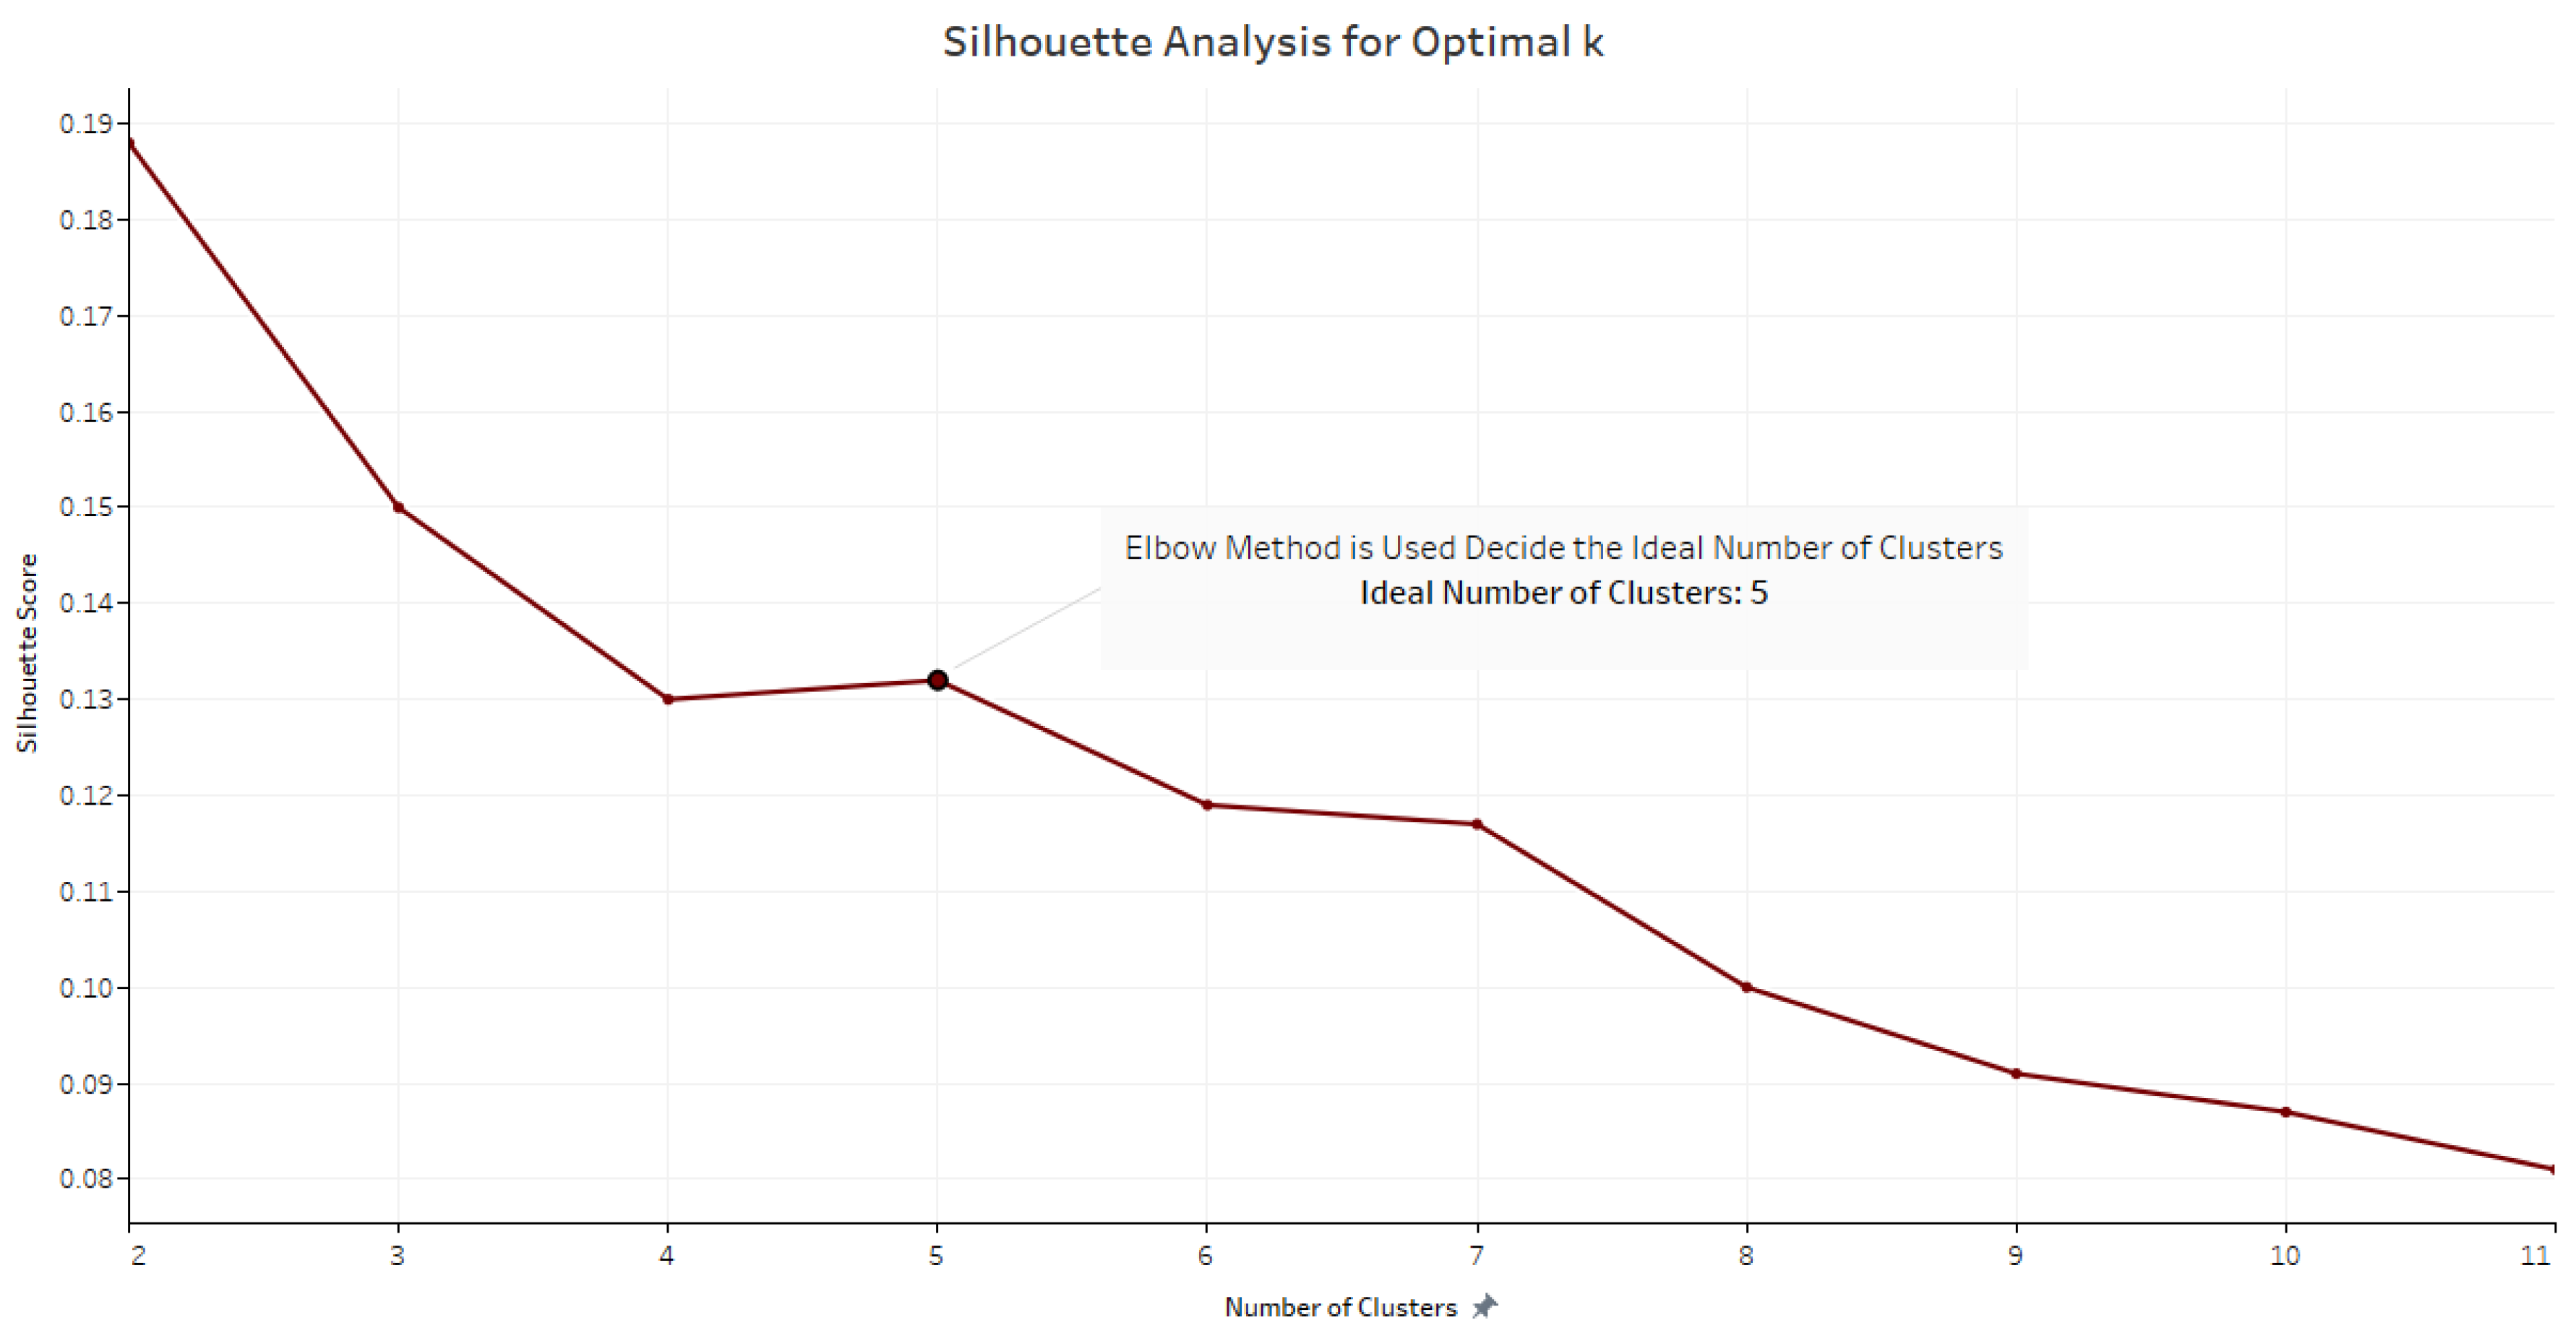
Silhouette score [
46] is used to evaluate the quality of clusters created using the clustering algorithms. In this study, the
K-means clustering method is used where it uses optimized centroids to calculate silhouette scores. The silhouette score for a set of sample data points is used to measure how dense and well-separated the clusters are. The intra-cluster distance between the sample and other data points in the same cluster is also taken into account by the silhouette score. The score is within the range [−1, 1], where negative values imply that data belonging to clusters are possibly incorrect. A silhouette score of 0 suggests that the clusters are overlapping and a score 1 means that the cluster is dense and neatly separated. After the calculation of the silhouette score, the scores can be plotted which aids the selection of the most optimal value of
K, the number of clusters in the
K-means clustering method. In this study, there are 11 iterations of the clustering process where the optional cluster size for the given dataset is 5 (
K = 5) [
47].
3.7. Cluster Wise Entity Relation Extraction
With regard to the applications of natural language processing, there is a particular emphasis on data analysis for digital media or online data mining, with relationship extraction being one of the most essential aspects of data analysis. The process of identifying the relationships between two different elements in a text is known as relationship extraction. A sentence is broken down into two entities and then the relation analysis is performed between the subject and object that have been recognized in the text [
25].
In order to create a knowledge representation graph, the entity pairs need to be extracted from the sentences. Functions using SpaCy matcher are built to extract the entities.
Step 1:
The main objective is to pull out an entity pair, when the sentence is being analyzed. This chunk contains several declarations of empty variables. The variables ‘prv_tok_dep’ and ‘prv_tok_text’ will store the dependency label of the preceding word in a phrase as well as the prior word itself, respectively, in the context of a sentence. The text that relates to the entities of the text will be contained within the prefix and modifier.
Step 2:
Check for punctuation marks in the text. If a punctuation is present disregard that token and move to the next. Check if that word is a compound word. Compound words are a set of words that come in together with different meanings. When a subject or an object is discovered while analyzing the text, the compound word will be added as a prefix to it.
Step 3:
Extracting the subject as the first entity.
Step 4:
Extracting the subject as the second entity.
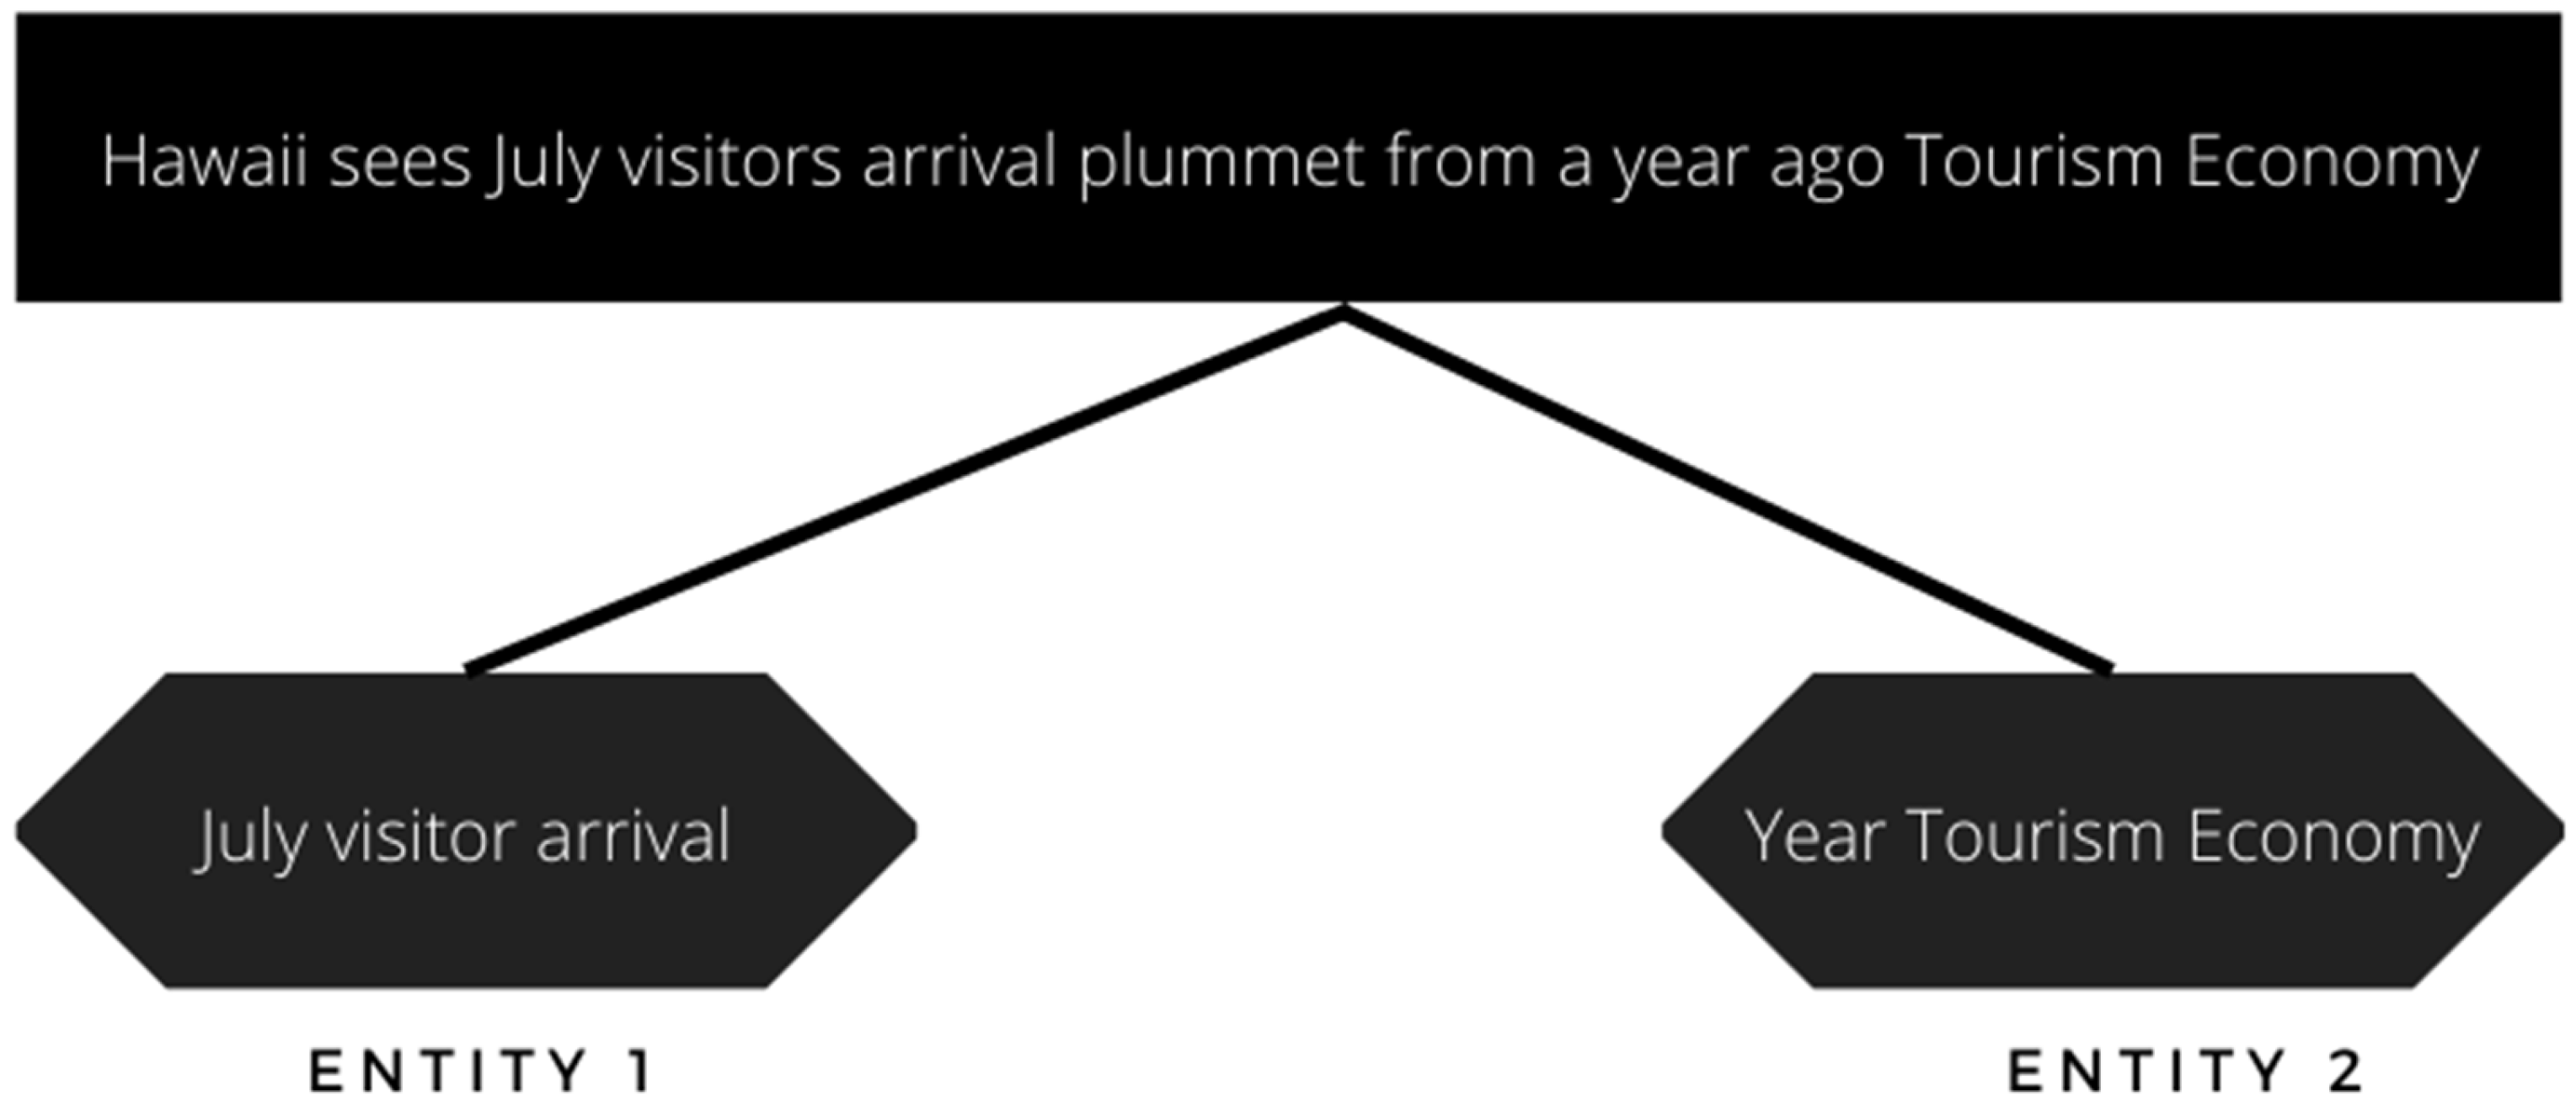
After all the steps are completed, an entity pair extraction is created, seen in
Figure 11. SpaCy is a Python library for sophisticated NLP techniques that is available as a free, open-source download. SpaCy is specifically built for usage in production environments, and it assists developers in creating systems that analyze and understand massive volumes of text. It may be used to develop information extraction and natural language comprehension systems, as well as to pre-process text in preparation for deep learning applications.
The first part of the work is completed with entity extraction. The nodes must be linked in order to construct a knowledge graph (entities). These edges represent relationships between nodes that are next to one another. The architecture of the statement, including items like the subject, object, modifiers, and components in the statement, must be understood in order to extract the needed details. The matcher lets the user locate terms or expressions by applying rules that describe the token properties of the words and phrases. In addition to lexical characteristics, rules may relate to token annotations (such as text or part-of-speech tags) and other types of markings.
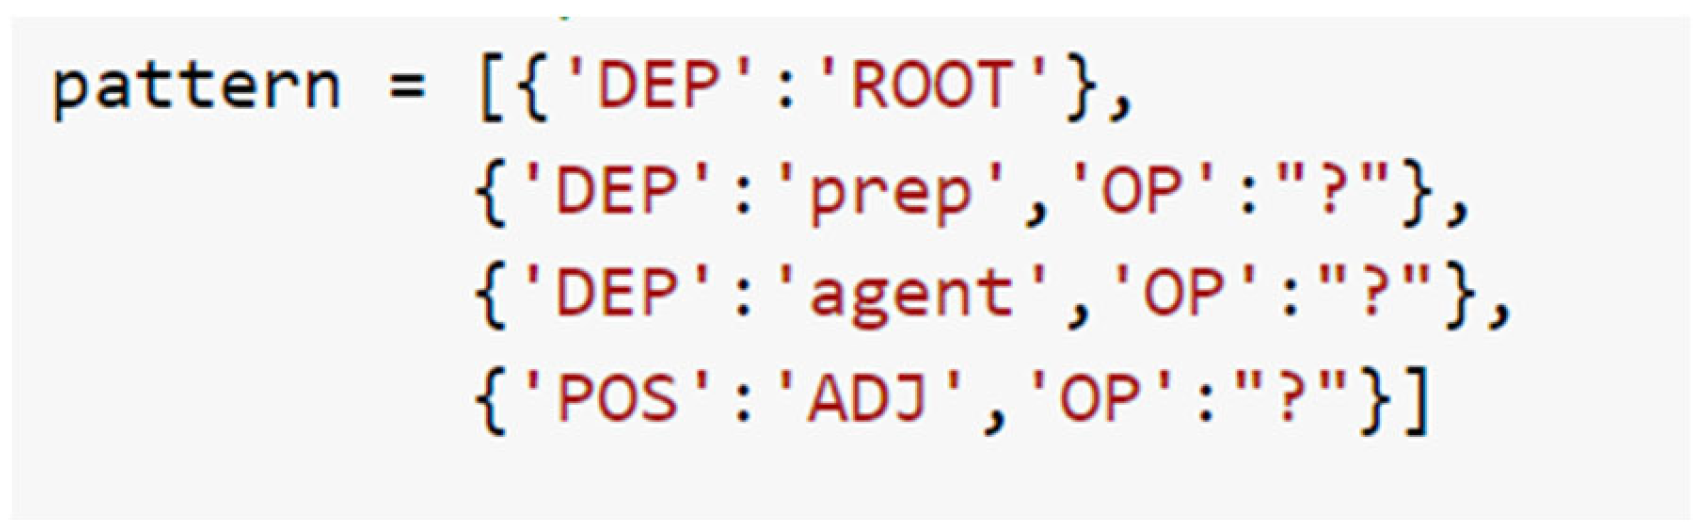
Now a pattern is added to the matcher object based on what needs to be extracted. This pattern is made using a specific format mentioned in Spacy. Adding a pattern to the Matcher, seen in
Figure 12, involves adding a collection of dictionary definitions. In each dictionary, one token and its properties are described.
The syntactic organization of a statement may be represented by obtaining its dependency parse. Headwords and their dependents are linked by this rule. The root of a statement refers to the core of the statement, which is independent of the rest of the statement. The main part of the phrase is generally the verb, and the root serves as a hub for all other terms.
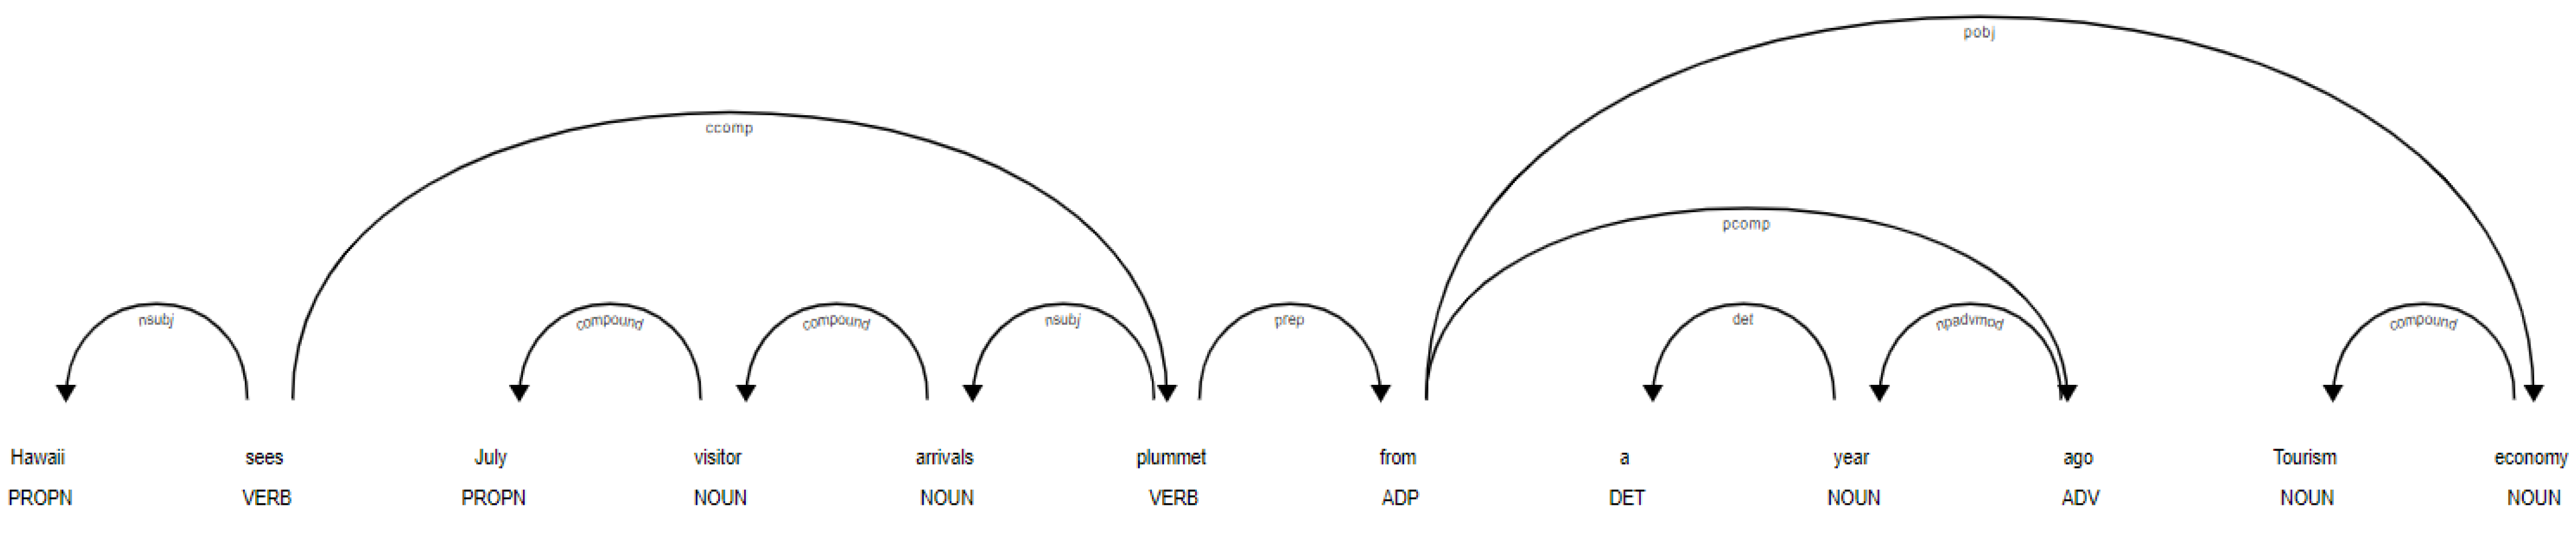
Sentences are parsed to determine the underlying root word using the function shown in
Figure 13 and
Table 3. After it has been identified, it is checked to see whether a preposition or an agent word comes after it. If so, the suffix will be appended to the root term.
“Hawaii sees July visitor arrivals plummet from a year ago Tourism economy”.
From the entities and relations extracted shown in
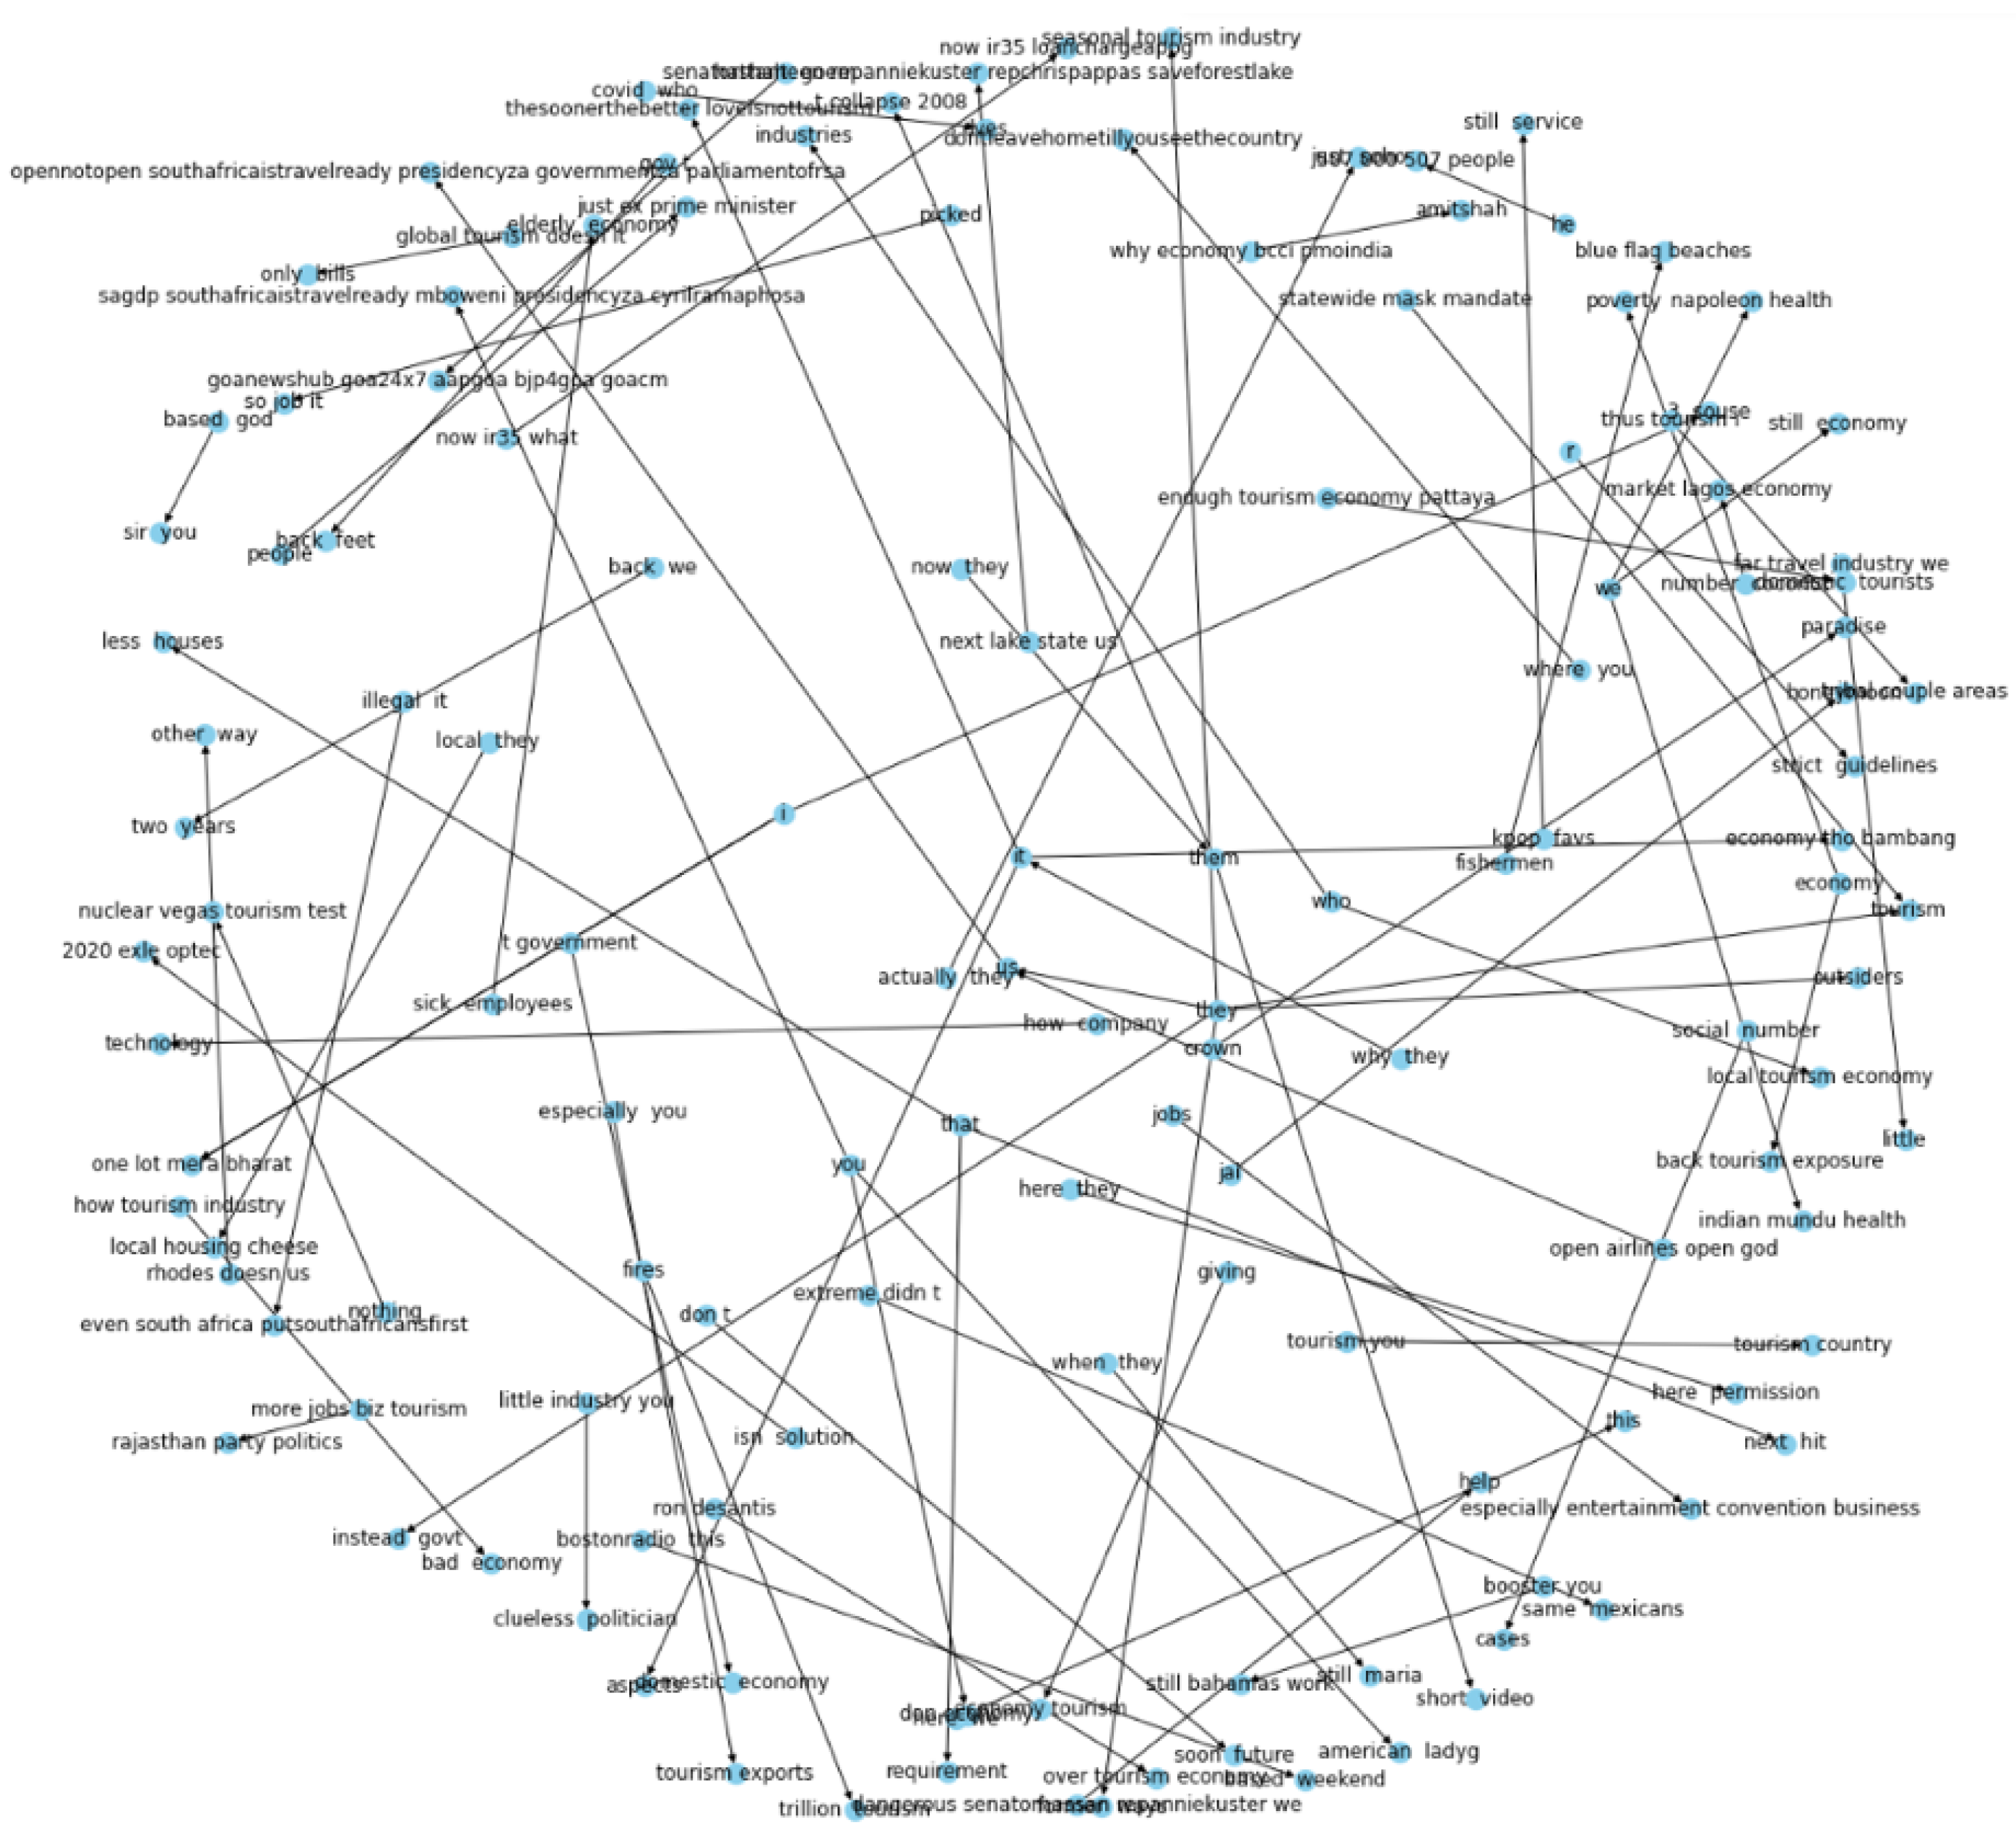
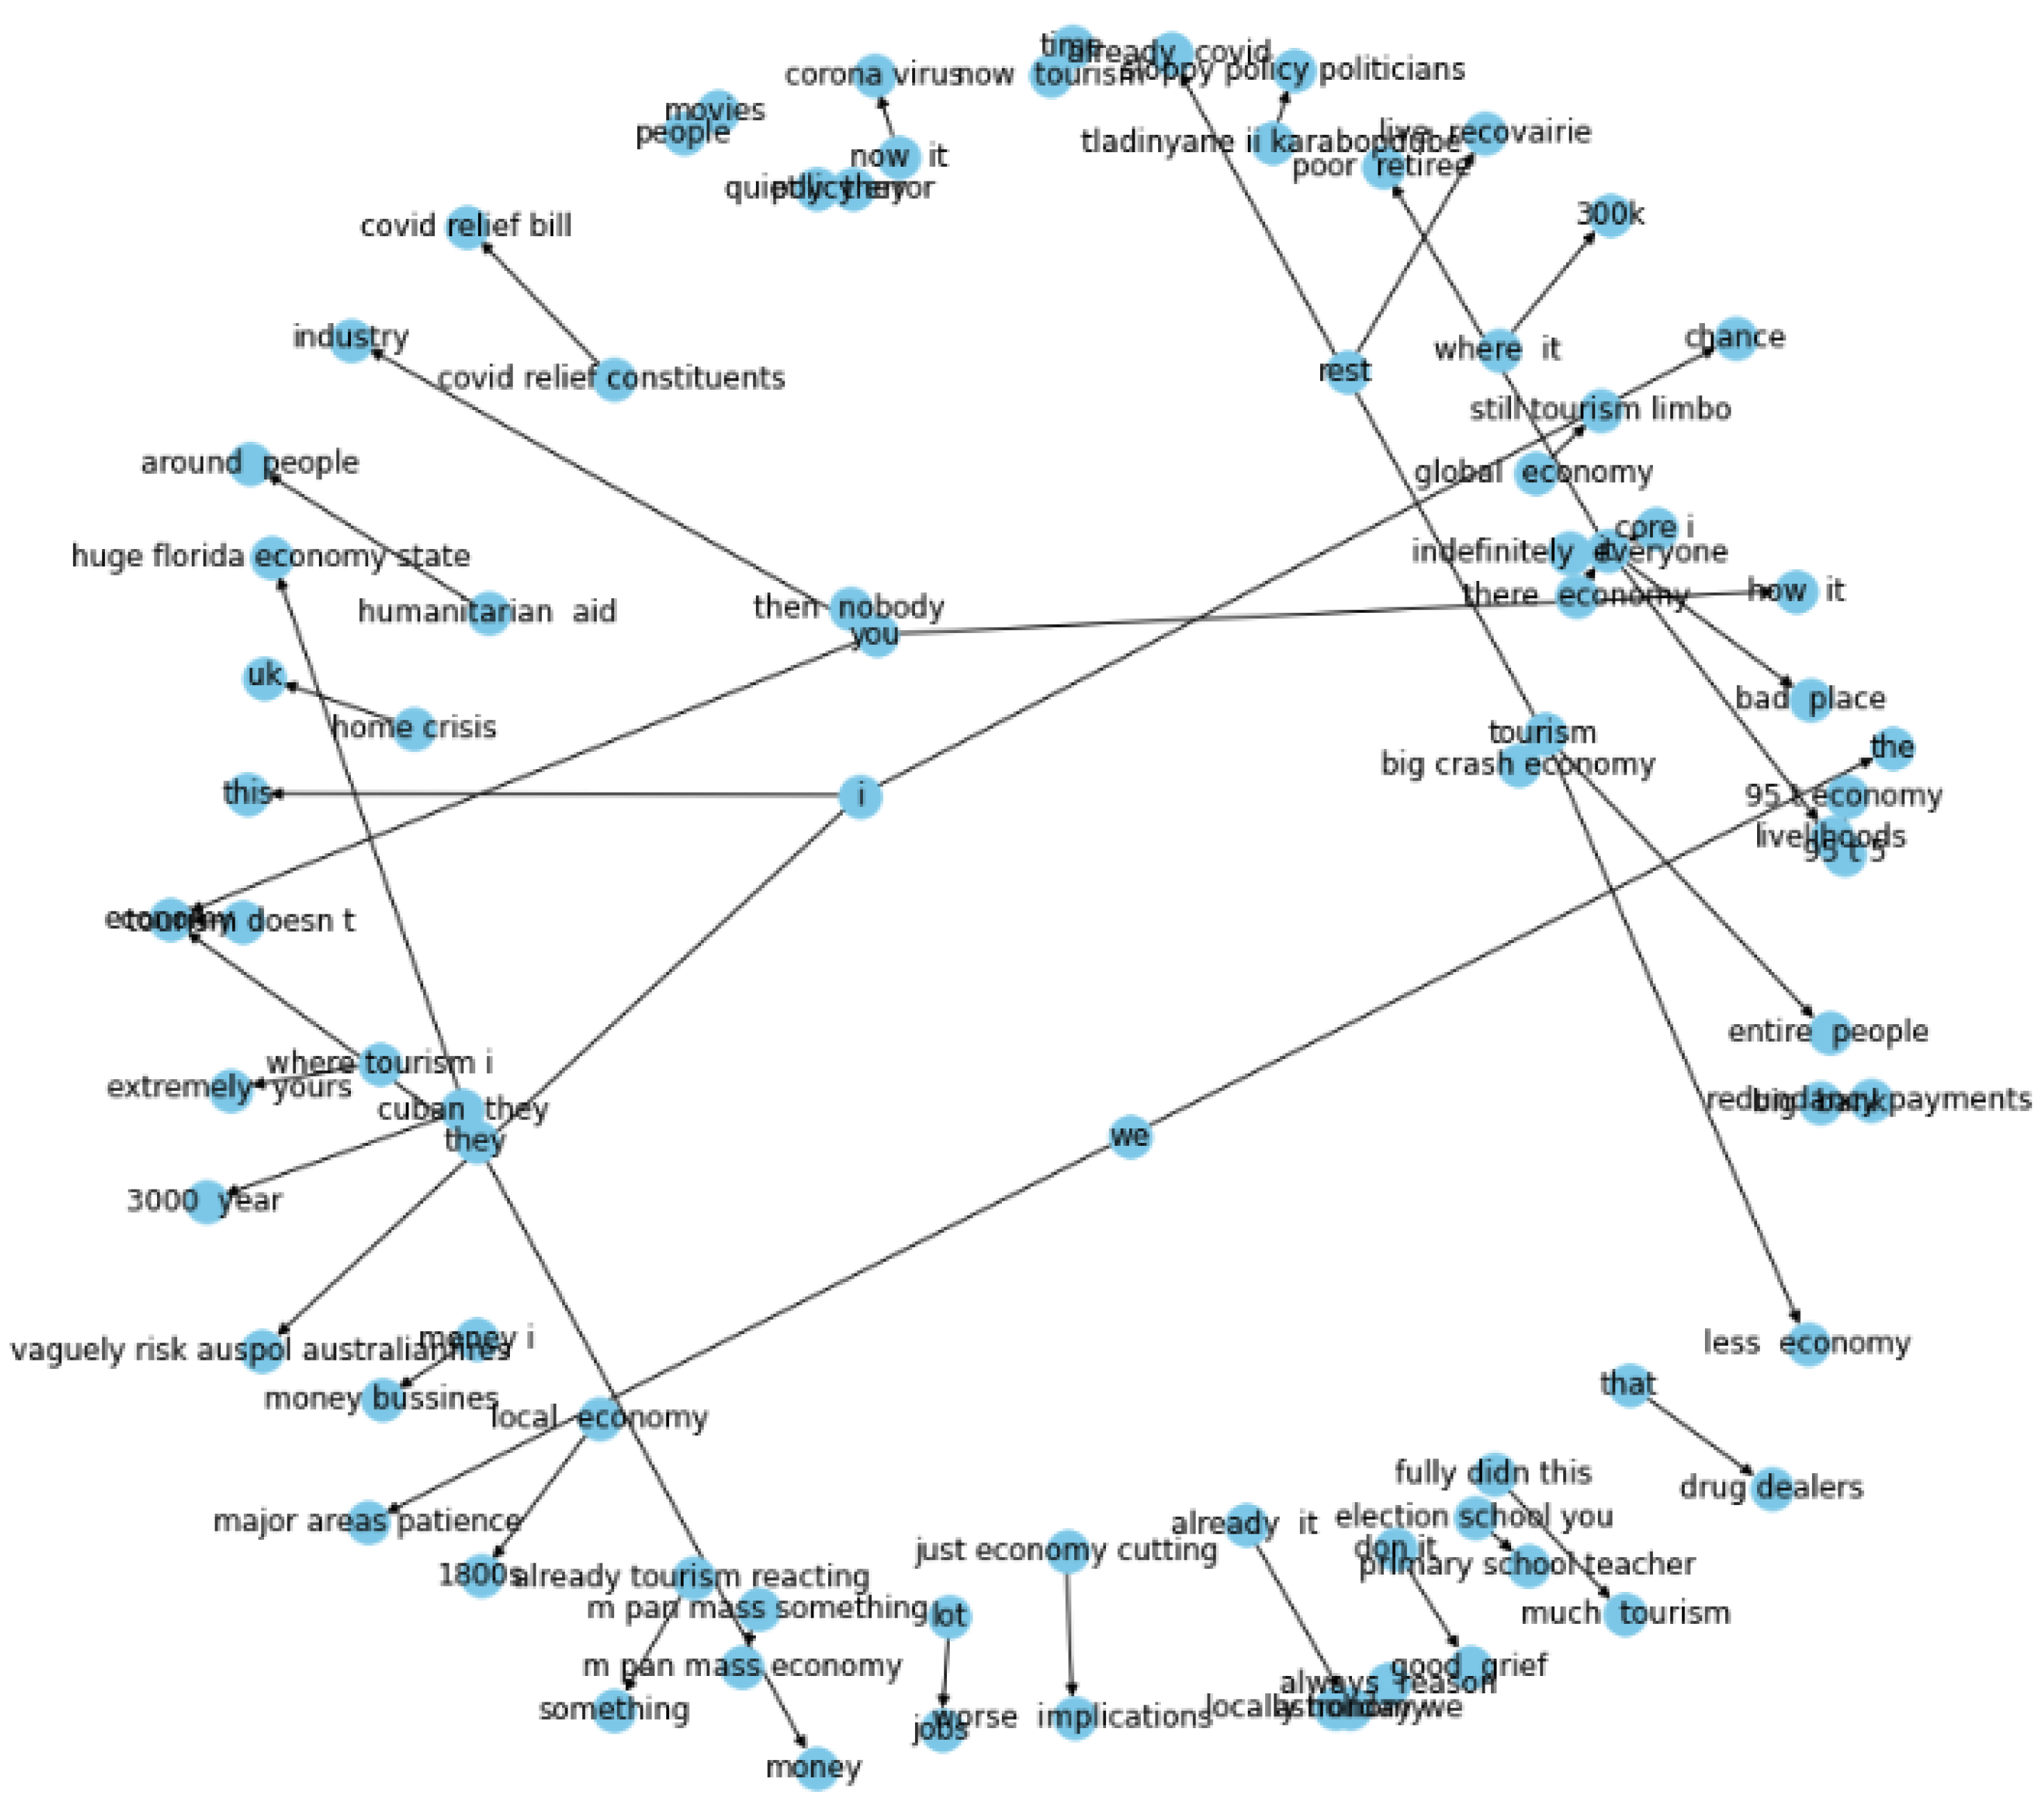
Table 4, a network of directed graphs is built using the Networkx library in Python. Directed graph implies that relation is only from one entity to the other. The nodes are regarded as the entities and the link between them is considered to be the relation between the entities.
3.8. Knowledge Representation
When it comes to building knowledge graphs, one can often find data from a wide variety of platforms, each with different data structures. To make sense of a wide range of data, formats, names, and semantics should all be taken into consideration collectively. As the knowledge graph’s building blocks, schemas establish nodes’ identity, and the setting establishes their location in relation to each other; terms that have multiple meanings benefit from the inclusion of these features. For example, Google’s search engine system can distinguish among the color orange and the fruit orange [
48].
The text data is aggregated on a graph-based data structure in the case of semantic processing. Entities are represented as nodes in the knowledge graph, and certain pairs of entities are connected to each other in some way. Edges are used to show these connections. The integration of data around knowledge graphs may aid in the development of new knowledge by revealing relationships between data points that may not have been apparent previously [
49].
Knowledge graphs have evolved as an appealing concept for structuring the world’s largest user acknowledges, as well as a method for integrating data retrieved from a variety of platforms, among other things. Knowledge graphs have begun to carry a significant role for describing the material retrieved via the use of NLP and artificial intelligence techniques, among other methods. Domain information represented in knowledge graphs is being fed into neural network models in order to make more accurate predictions [
50].
The suggested solution relies on the identification of entity pairs and their relationships, and the use of spaCy’s rule-based matching makes this possible.
Using knowledge graphs in conjunction with machine learning approaches, this research demonstrates that it is possible to identify sentiment in brief portions of text. Knowledge graphs are capable of capturing the structural information included in a tweet as well as a fraction of its underlying meaning. The most significant focus of this research is linked to knowledge graphs, which have the benefit of not being impacted by the quantity of the content or the usage of accents and being able to be graphically examined. There are nodes and connections in the knowledge graph, and each node’s context serves as a vector representation of each item and relation. Consistent models of both local and global relations are maintained during the synchronization process, while precise feature learning information is also included in the resultant knowledge graph from the constructor.


 ,
, 


