Article

Measurement and Analysis of Radar Signals Modulated by the Respiration Movement of Birds

1
State Key Laboratory of Information Engineering in Surveying, Mapping and Remote Sensing, Wuhan University, Wuhan 430072, China
2
Wuhan Geomatics Institute, Wuhan 430022, China
3
School of Information Engineering, Hubei University of Economics, Wuhan 430205, China
4
National Center Marine Equipment Quality Inspection, Qingdao 266201, China
*
Author to whom correspondence should be addressed.
Appl. Sci. 2022, 12(16), 8101; https://doi.org/10.3390/app12168101
Submission received: 25 May 2022 / Revised: 4 August 2022 / Accepted: 8 August 2022 / Published: 12 August 2022
(This article belongs to the Section Electrical, Electronics and Communications Engineering)

Abstract

:

Featured Application

This paper provides a measurement method for measuring weak signals, which can be applied in many applications, such as detecting biological signals and monitoring radar signals of respiration movement in humans and animals.

Abstract

Once, bird respiration was thought to be responsible for the 10 dB-level fluctuations in the radar signals of birds. Although, recently, many researchers provide evidence against this, there are almost no quantification measurements of the contribution of respiration to bird signals in microwave anechoic chambers. Here, we first measured the radar signals modulated by the respiration of birds in a microwave anechoic chamber. Theoretically, the simulated signal fluctuation caused by the respiration of a 1 kg standard avian target (SAT) duck is approximately 1.2 dB based on the water sphere model. Then, experimentally, in a microwave anechoic chamber, we measured the signal fluctuations produced by the respiration movement of ducks using a dynamic system composed of a network analyzer and a high-speed camera. We tracked continuous radar data of a living duck and a dead duck within the S-band, X-band, and Ku-band, and then presented them using low-resolution range profiles (LRRP) and high-resolution range profiles (HRRP). The results indicate that respiration movement causes periodic signal fluctuation with a respiration rate of approximately 0.7 Hz, but the amplitudes within S-band, X-band, and Ku-band are approximately 1 dB level, much less than the 10 dB level. Respiration is not responsible for the 10 dB-level periodic signal fluctuation in radar echoes from birds.

1. Introduction

Once, there was an argument about the source of the modulating variations in radar echoes from birds. Radar ornithologists believed that respiration movement could modulate the radar echoes from birds and produce a 10 dB-level signal fluctuation [1]. The primary empirical evidence confirmed that the periodic signal fluctuation could be as high as approximately 10~20 dB [2,3,4], sometimes even over 40 dB in some radar bands [5]. In addition, researchers have verified that the flapping patterns over the respiration movement of birds are believed to be the primary cause [6,7,8,9,10] because the signal fluctuations were correlated with the flapping movement of the bird’s wings [11,12]. Moreover, the radar signatures posed by the flapping wings can be extracted from the radar signals of birds and introduced to recognize and track the radar echoes of birds [13,14,15,16,17]. Nevertheless, those researchers provided no direct measurement of the fluctuating radar signals produced by the respiration movement of birds in labs but measured the radar signals of flying birds in the outfield and made connections between the variations and flapping gaits.
We first investigated radar signals modulated by respiration movement using direct and quantitative measurements of such signal fluctuations in a microwave anechoic chamber. As described in Section 2, we theoretically modelled the signal fluctuations modulated by respiration after introducing the water sphere model. We also performed experiments to measure the weak signal fluctuation using dynamic measurements composed of a network analyzer and a high-speed camera. The results are provided and analyzed in Section 3 and 4 using both time series analysis and frequency analysis. Finally, the conclusions are provided in Section 5.

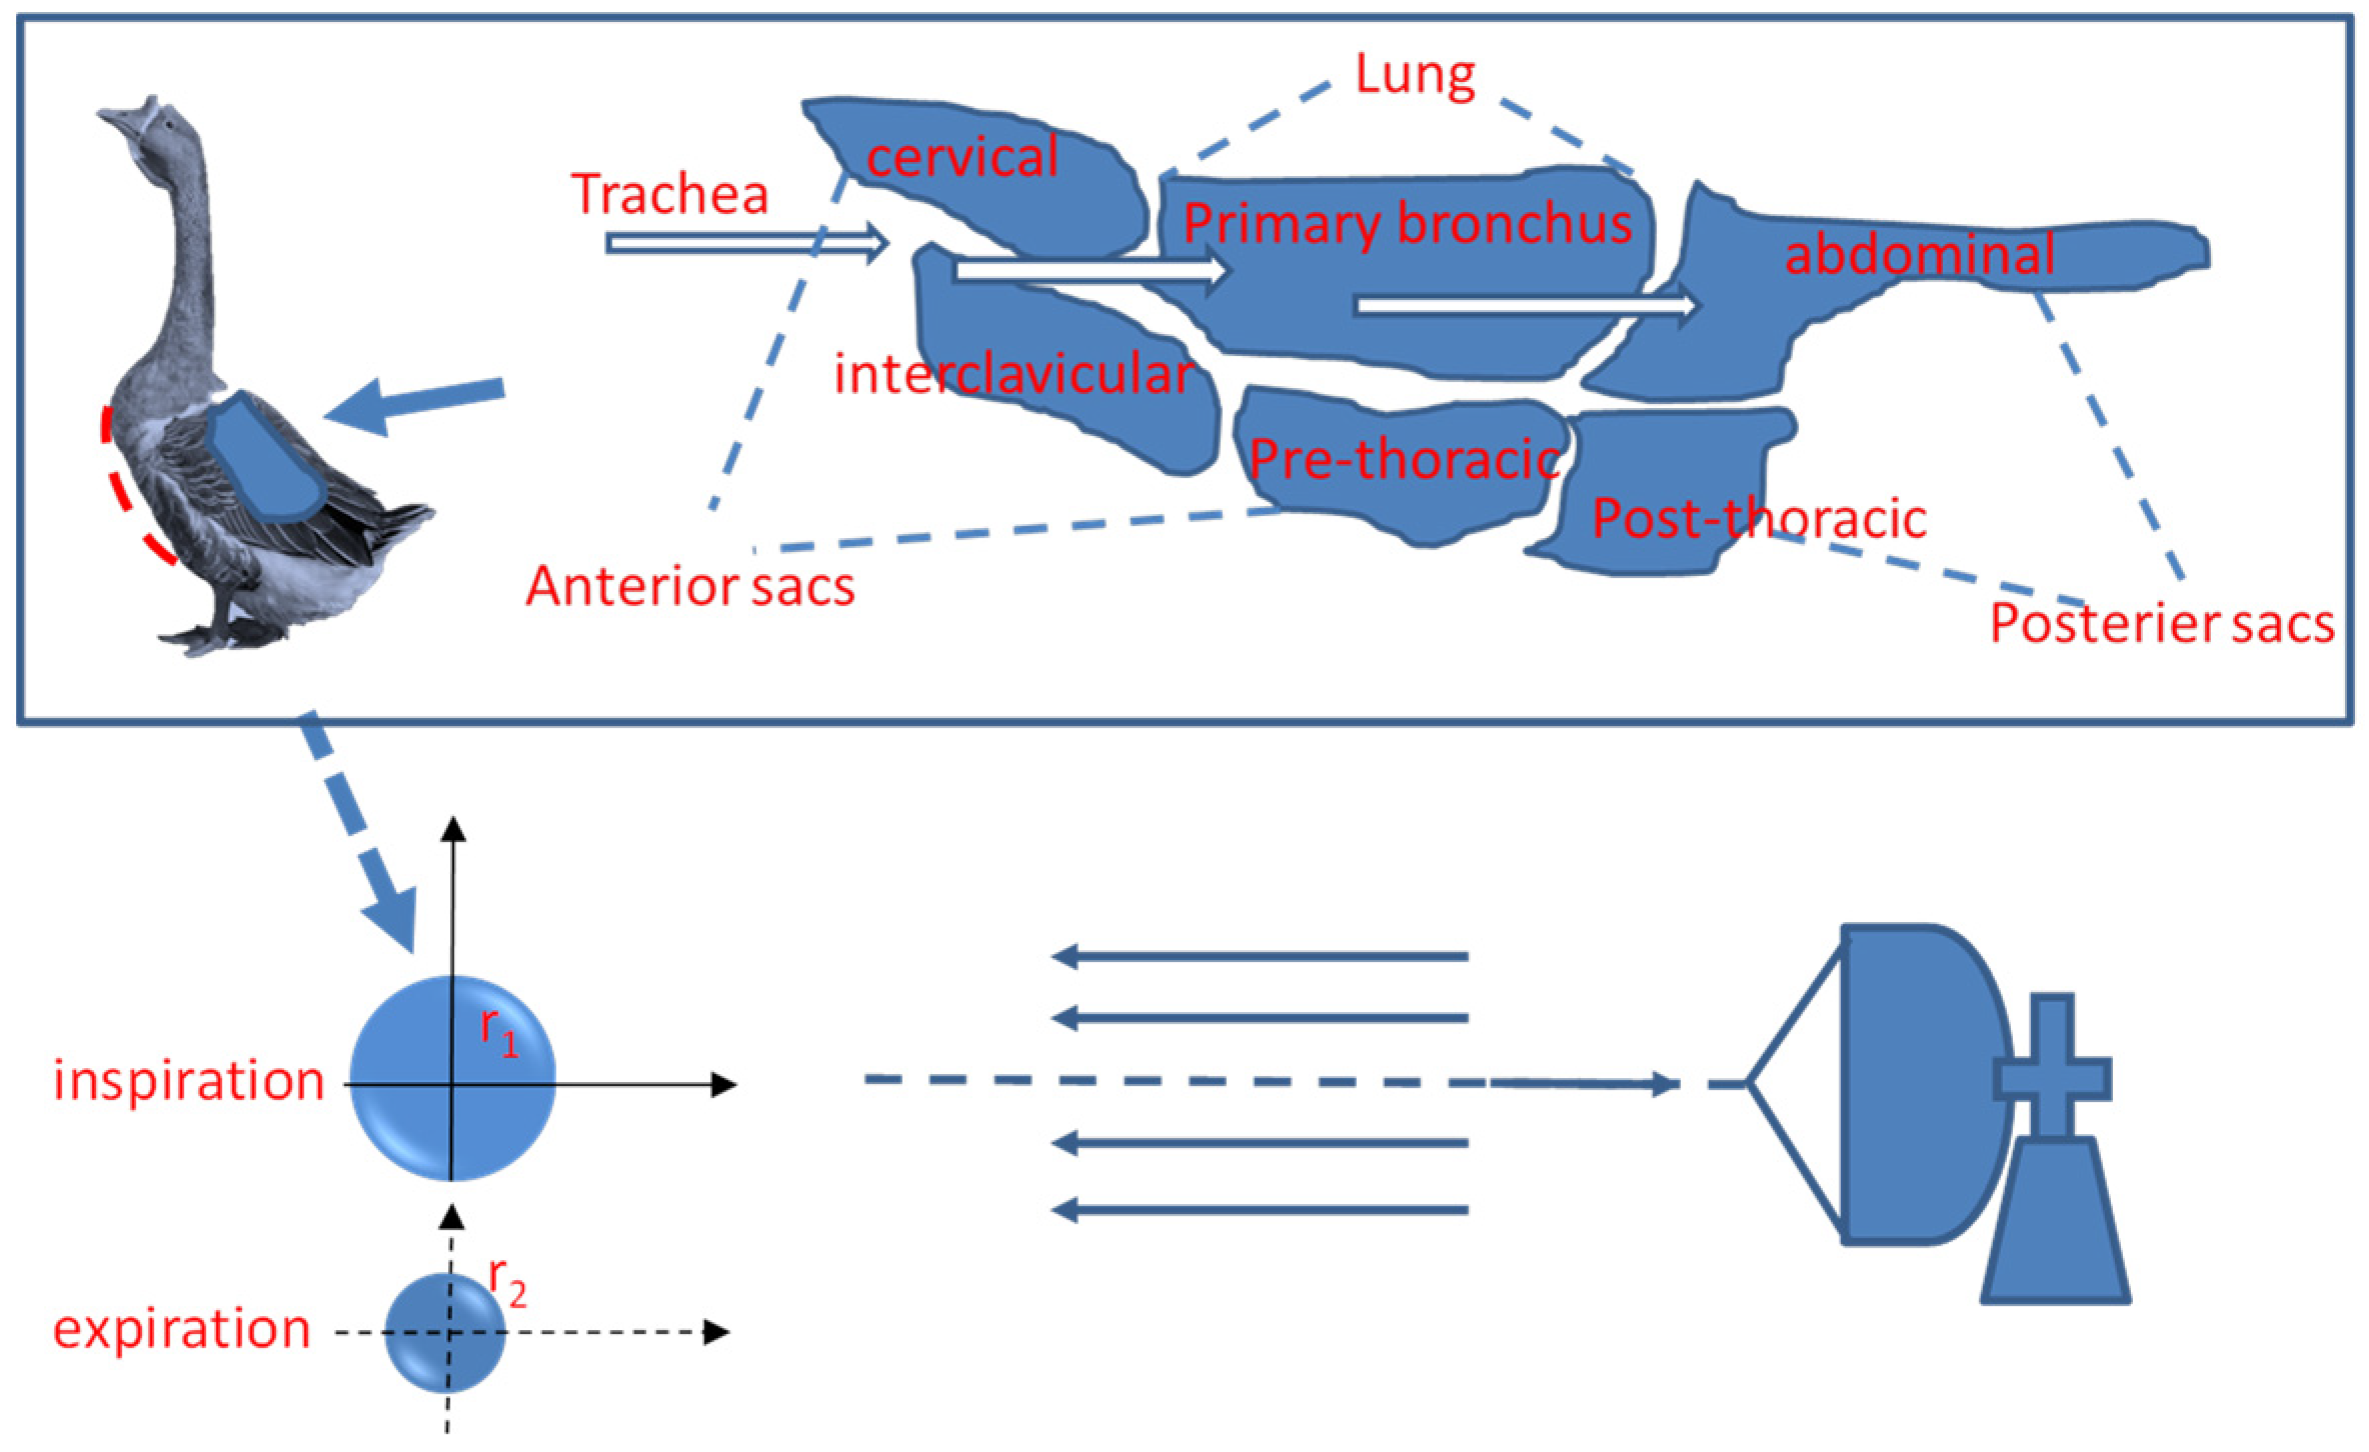
2. Method and Materials

2.1. Theoretical Calculation

Theoretically, the respiration of a bird could change the physical area and scattering cross-section, and then contribute to the radar signal fluctuation of the bird. Figure 1 demonstrates the structure of an avian respiratory system. References [18,19] describe the detailed respiration process. In brief, respiration changes the volume by changing the thoracic volume and then changing the cross-section of the bird.
We utilize the common water sphere model in radar ornithology to analyze signal fluctuations caused by respiration. It was claimed that an approximate model can be obtained by regarding the bird as a water sphere of equivalent mass to the water content because the radar cross-section (RCS) of a bird is predominantly caused by 65% of its water mass [20]. The radius of the “water” bird, r , is given by
r = 3 4 0.65 m π ρ 3
where m is the mass and ρ is the mean density of the sphere. The RCS, σ , of a water bird is given by
σ = π r 2
Considering the periodic respiration movement, the equation should be revised into σ t , which is given by
σ t = π r 2 t
where r t is the radius function of respiration motion, with the up and down boundary values of r 1 and r 2 . The RCS fluctuation σ , is determined by differences in the water sphere radius.
σ = π r 1 2 π r 2 2  
The modulation rate is given by the respiration rate of ω σ , which is inversely proportional to the respiratory period of T :
ω σ = 1 T
Thus, the radar signals of the duck are modulated by respiration with the periodic respiratory pattern. The original water sphere model mentioned no radar bands, but most of the radar bands used for detecting birds are typical marine radar bands, such as the S-band or X-band. Since radar data of a general bird within these radar bands fall into the resonance region (or the optical region) [15], we used scattering rules (i.e., Mie series solution) in the resonance region (or the optical region) to analyze the radar signals of birds.
This theoretical simulation indicates that the RCS fluctuation produced by respiration was approximately 1 dB level, much smaller than the 10 dB level. A duck is treated as a two-standard avian target (SAT) object with a 1 kg mass, as defined by the United States Federal Aviation Administration (FAA) [21]. Assuming that the water sphere is 0.65 kg, with a water density of 1 g/cm3, then the calculated radius of the water duck is approximately 4.65 cm. If the changing radius span is 1 cm, the maximum RCS fluctuation is approximately 1.2 dB, based on the calculation of Equation (4). However, the current measurement of a two-SATs bird has an RCS fluctuation at a 10 dB-level, much larger than the theoretical 1 dB-level fluctuation. If the respiratory movement modulates the 10 dB-level fluctuations, the respiratory radius should have a 10-fold change in its range.

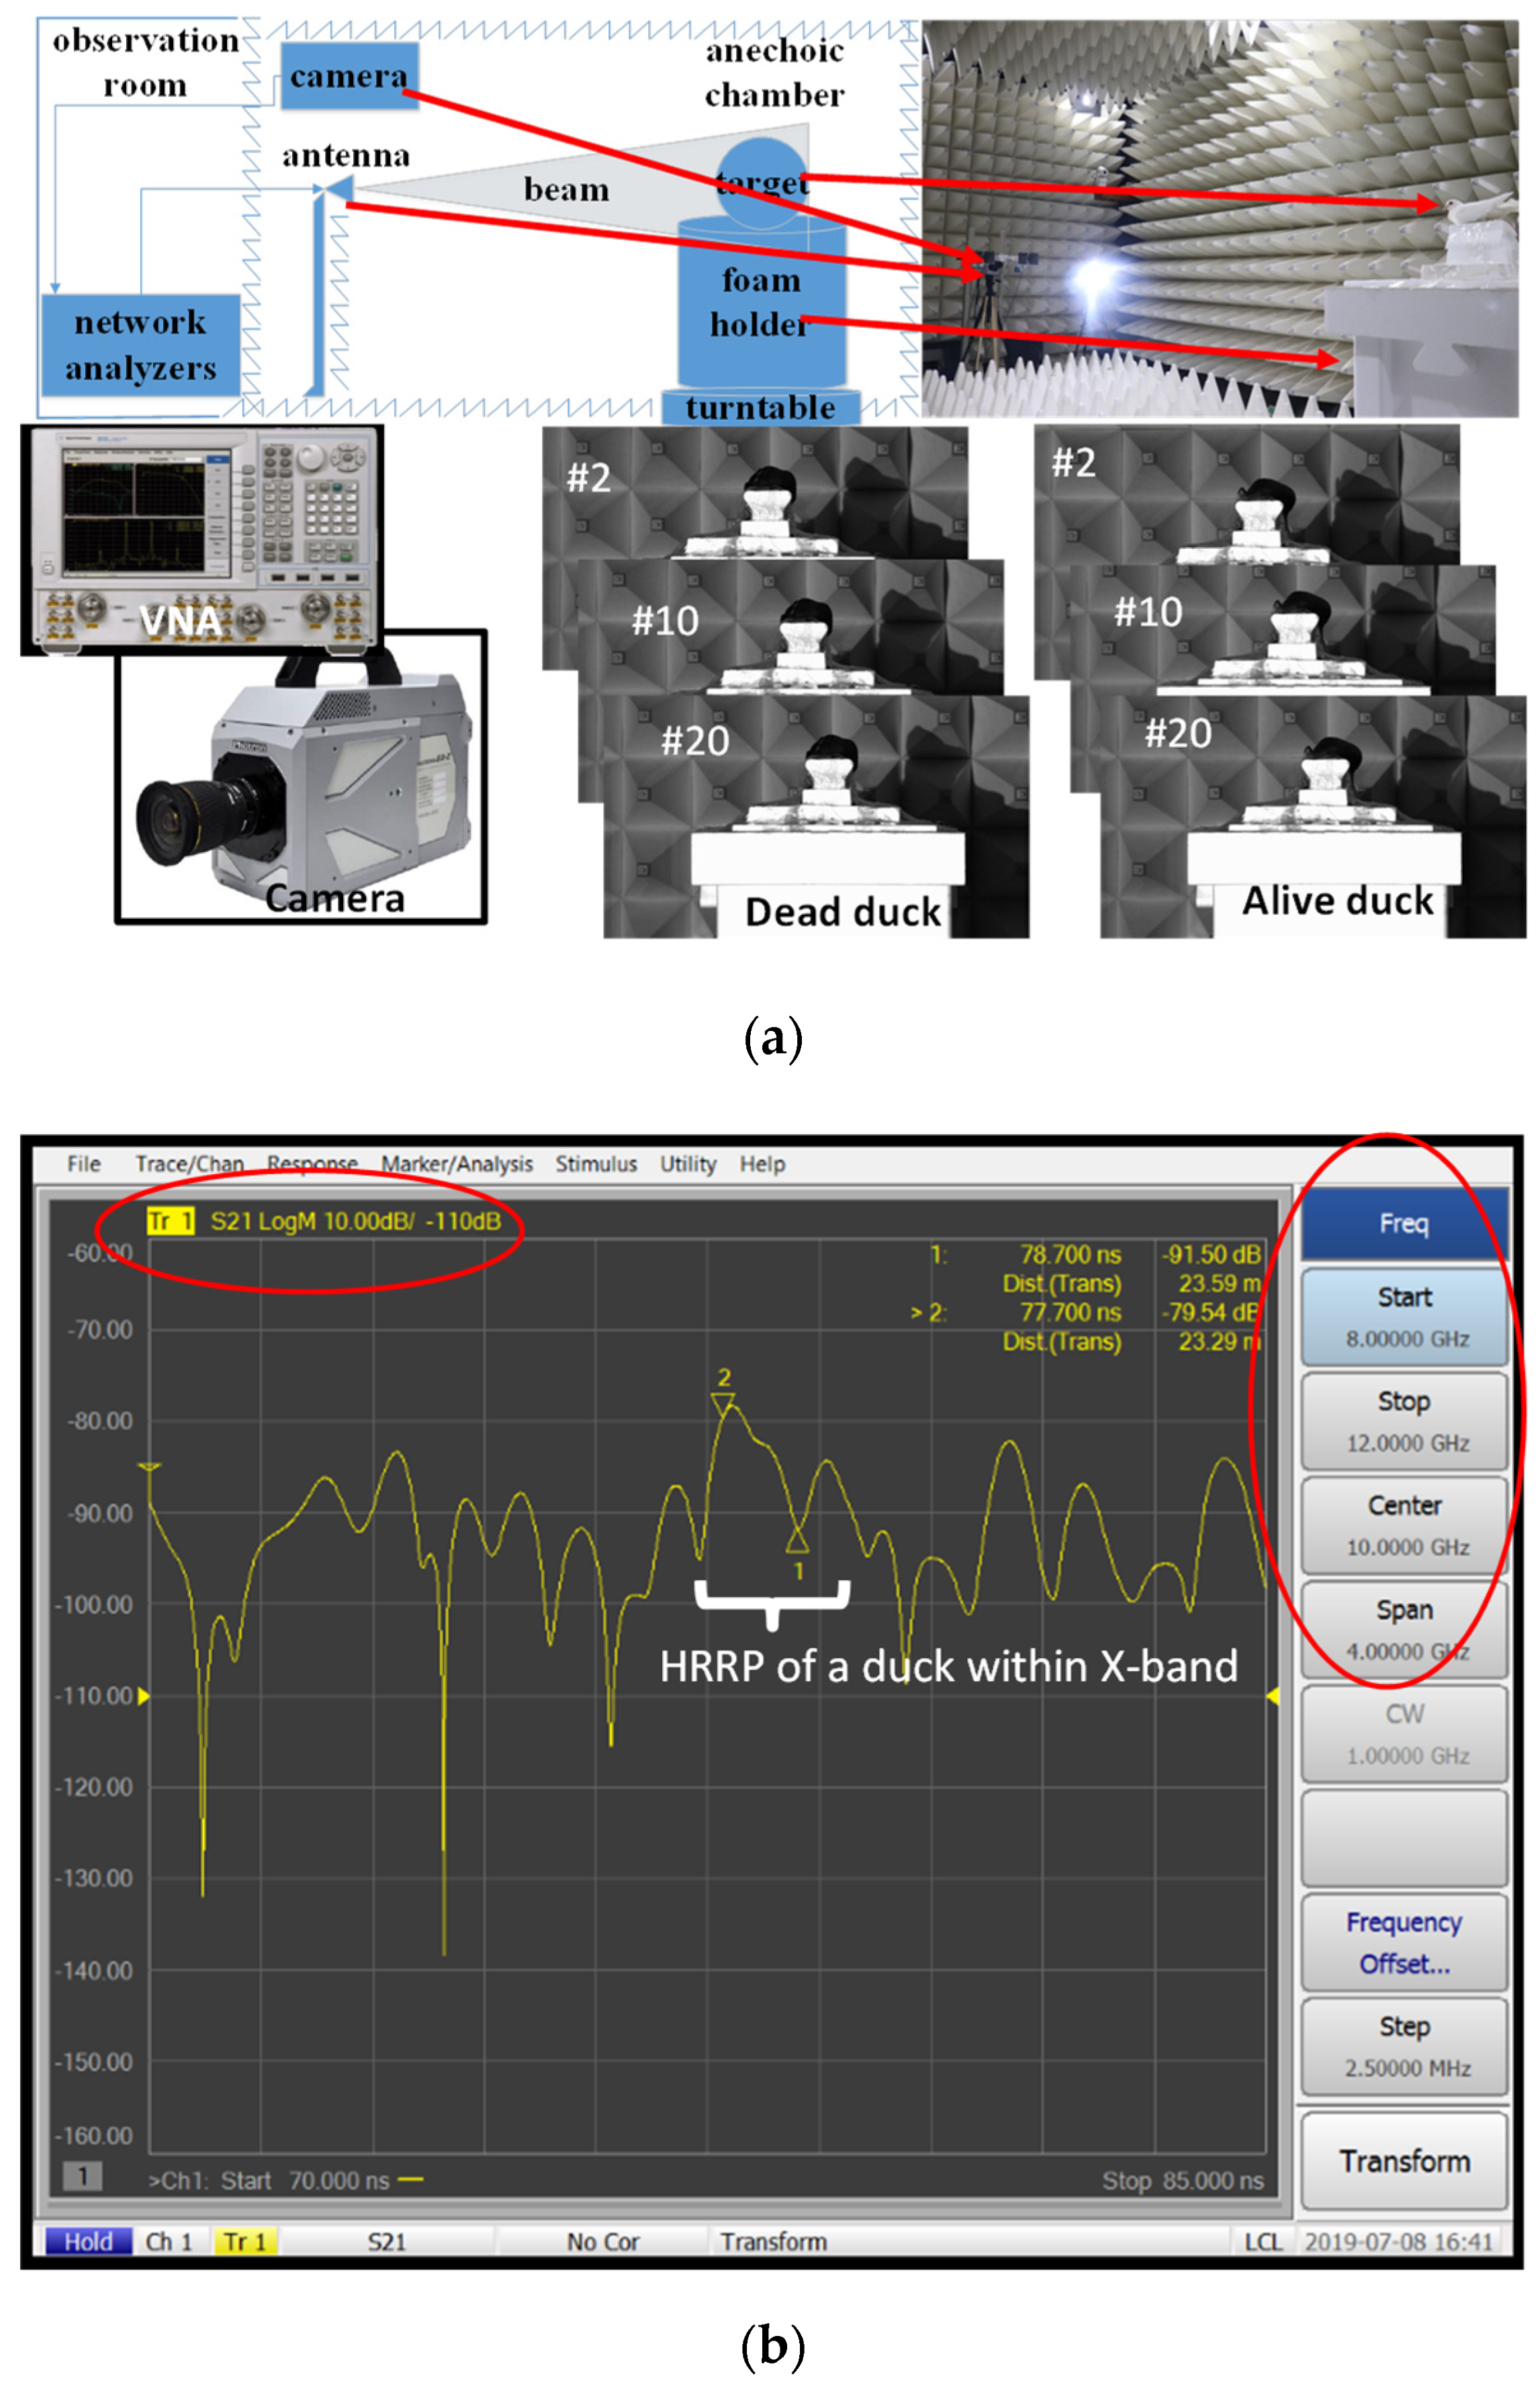
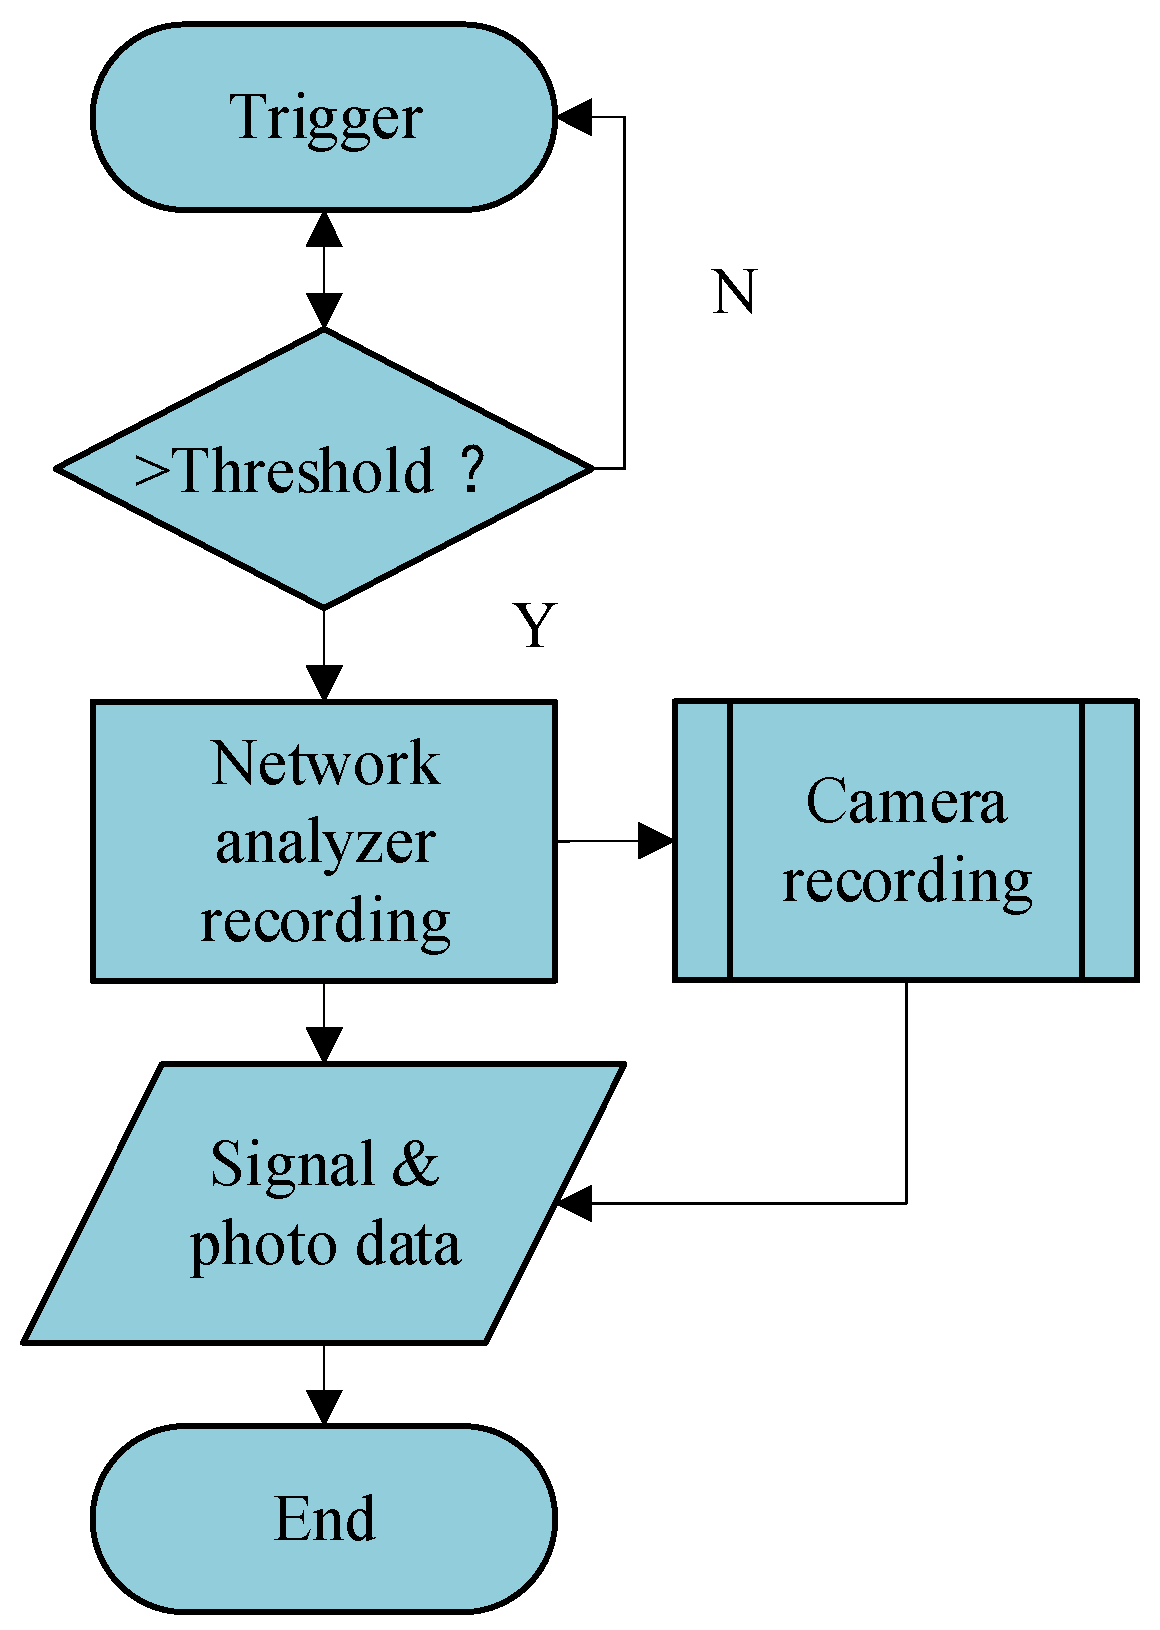
2.2. Measurement Systems
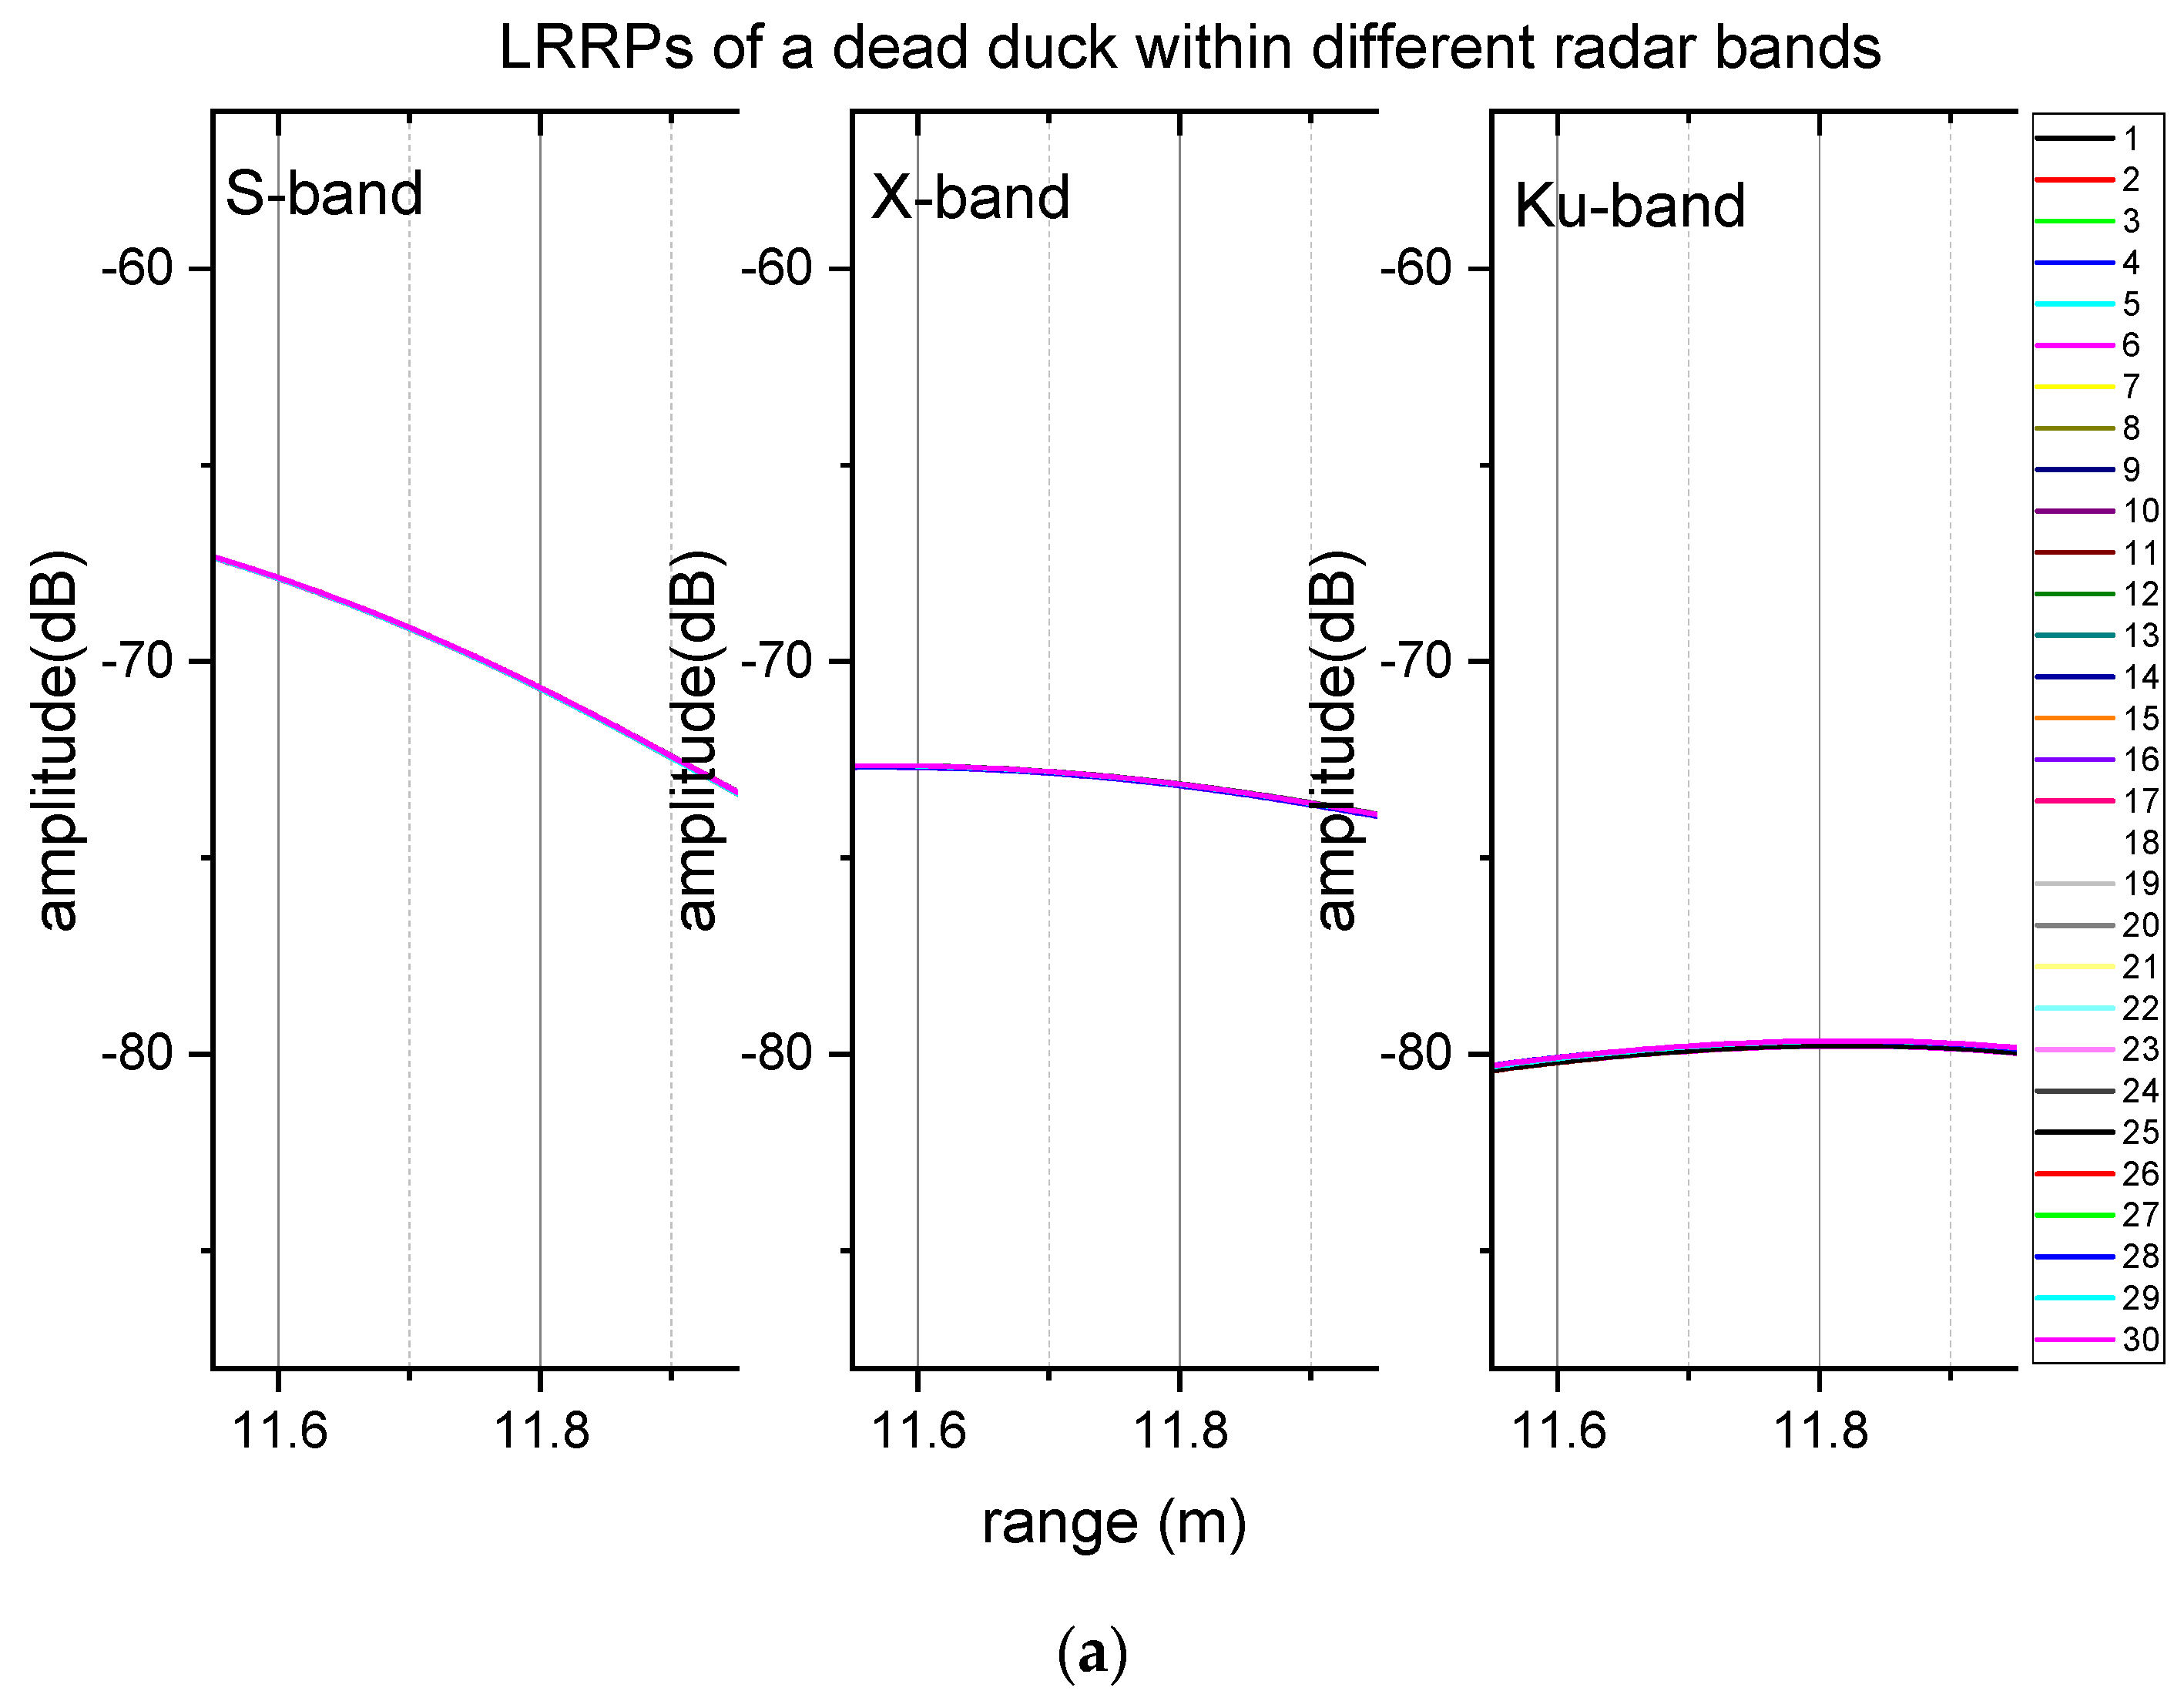
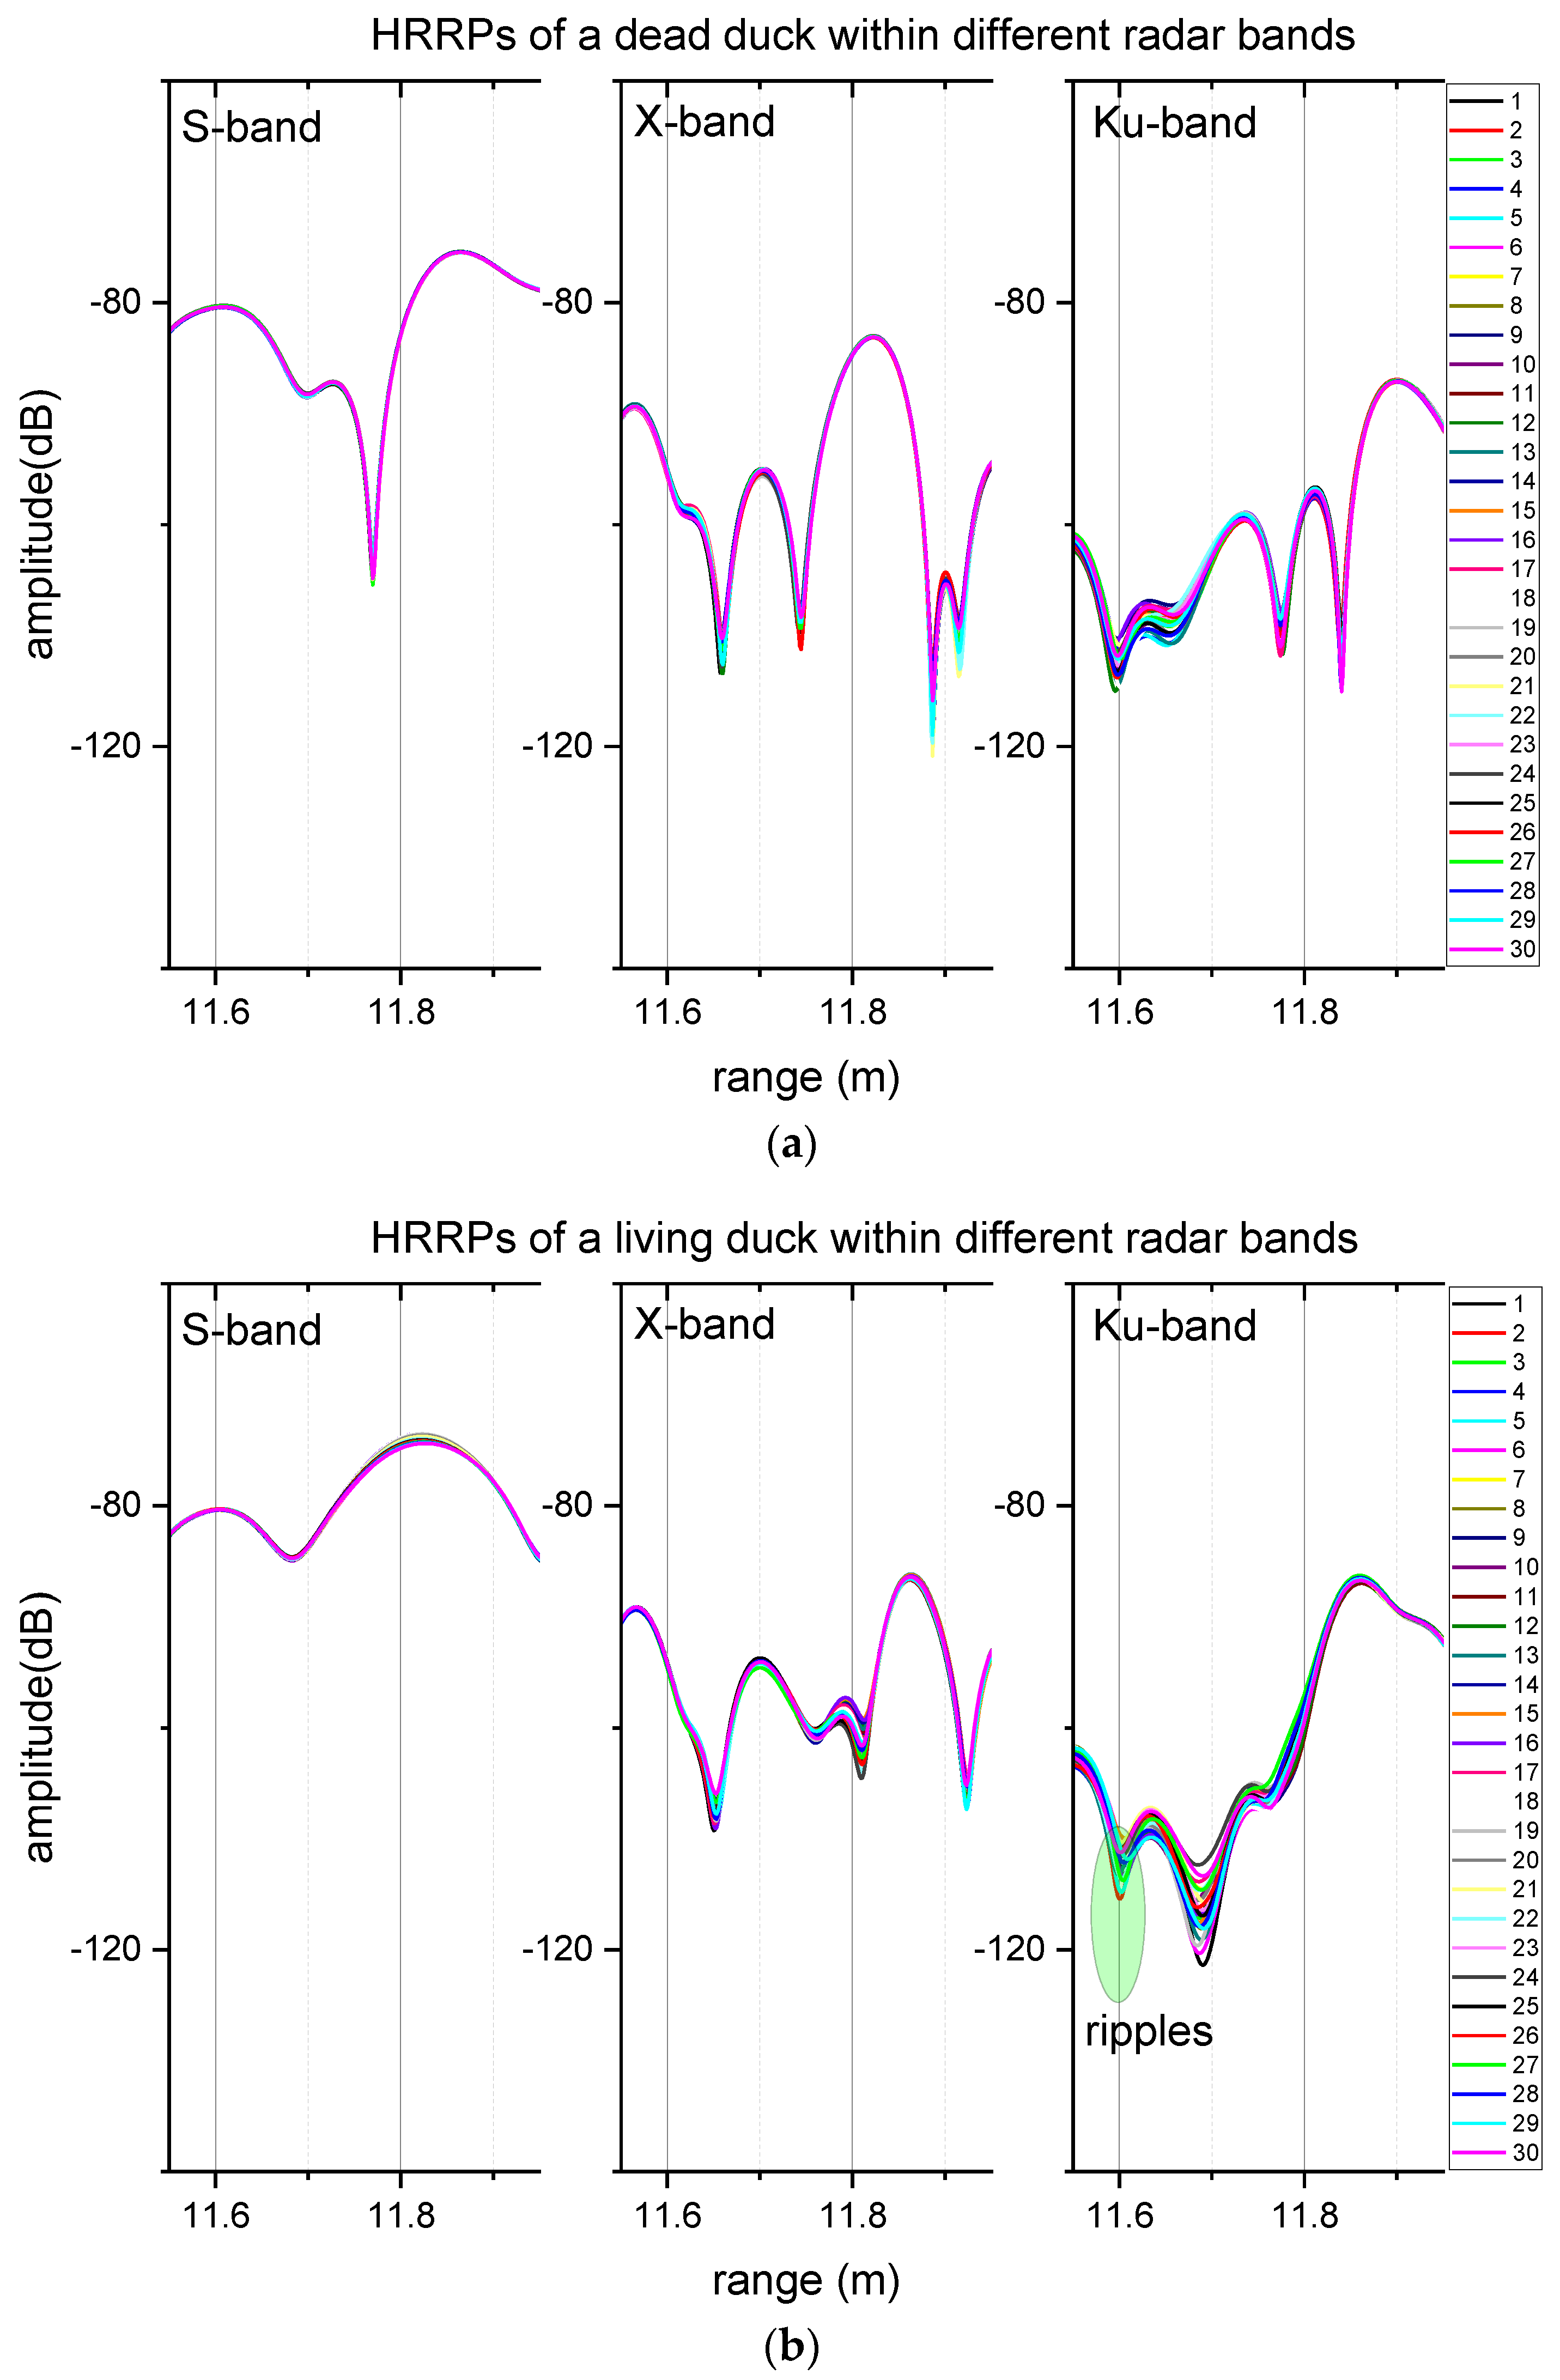
We designed a dynamic measurement system composed of a vector network analyzer (VNA) and a high-speed camera to capture the weak signal fluctuation. The spatial arrangement is shown in Figure 2a. The anechoic chamber belongs to the National Center Marine Equipment Quality Inspection. The camera is a Photron FASTCAM SA-Z, manufactured by Photron from Tokyo, Japan. The network analyzer Agilent PNA-N5224A (Santa Clara, CA, USA) uses vertical polarization to transmit signals and receive echoes [8]. Network analyzers have become convenient for onsite RCS measurements [22]. Network analyzers measure the S-parameter matrix of a system. The transmitting antenna is connected to source port 1 of the network analyzer; the receiving antenna is connected to source port 2. The parameter S21 (unit: dB) describes the ratio of the transmitted power to the received power, which can be seen as the radar signals of the target, as the example in Figure 2b shows. The most practical approach for calibrating the RCS value of a measured target uses a standard object with a known RCS. It is known as the ratio method [12,22,23]. The process is described by
σ m = P m P r σ r
where σ m is the RCS value of the measured target, σ r is the known RCS value of the standard object, P r is the received power of the standard object, and P m is the received power of the measured target. Considering that we measure the variation in the radar signals, the difference in the measured data can be described in dB units of dBsm. The unit of dBsm is defined as decibels received for a square meter target.
We wrote a program to conduct the measurement automatically. There are synchronization signals to synchronize the measurement of PNA-N5524A and Photron FASTCAM SA-Z. The flow diagram of one measurement is described in Figure 3. PNA-N5524A provides an external source control feature, which can be used to control external sources automatically. We used the Trigger-Aux function of PNA-N5524A to send the synchronistical signals. It could input a trigger signal and then send out two synchronistical response signals (i.e., TTL signals) to external devices using the Handler IO of “Aux Trig out 1” and “Aux Trig out 2” on the panel PNA-N5524A. Then, we could track the dynamics of the detailed deformation of the bird’s chest posed by respiration movement and other deformations, such as wing beats and head movements. Moreover, we waited until the duck was flapping its wings, and a program automatically triggered the recording process to capture the data. We used the Macros provided by the PNA-N5524A to conduct the measurement. Macros are executable programs that a user writes, loads into the analyzer, and runs from the analyzer. We recorded 30 frames (see legends in Figure 4) of radar echoes and photos in approximately 3 s.
The target birds were ducks: a living duck and a dead duck. These two domestic ducks were bought from a local farm. Their masses were similar (0.955 kg). They also shared a similar appearance. From their beaks to their feet, the body heights were 38 cm. The wingspans were 75 cm, while the width of the wings was 14 cm. The respiration rate was approximately 30~50 breaths/minute [18,24]. Our sampling frequency was 10 Hz, larger than the required sampling frequency of 1.66 Hz based on the Nyquist Theorem. There were 30 continuous sampling frames in 3 s. Moreover, we sometimes used tape to fix wings, necks, and heads to avoid flapping motions, but we just placed the ducks on the foam holder without tapes in other cases because we found that the duck was more still than we thought. It remained still, as shown in the photos in Figure 2. Since many real bird detection radars work with a narrow bandwidth as well as a low range resolution profile (LRRP), we needed to measure the LRRP of birds in a lab. In addition to LRRP data, we also used the high range resolution profile (HRRP) to separate radar signals of respiration (or wings) from other parts of the bird. Given that the radar bandwidth is B , the range resolution, R e , is calculated by [25]
R e = c 2 B
where B is the transmitted bandwidth, and c is the propagation speed of the radar electromagnetic wave. The range resolutions within three radar bands are listed in Table 1.
We select three radar bands (S-, X-, or Ku-band) after referring to the actual bird radar applications. Currently, radar systems used to detect birds mainly work in these bands, such as the S-band (or L-band, or C-band) weather surveillance radar, X-band marine navigation radar system, and Ku-band fire-control radar. Based on the ratio of a bird’s size to the wavelength [25], radar echoes within the S-band from flying birds fall into the resonance region and within the X-band and Ku bands, which are in the optic region. Rules in the scattering regions explain different signal fluctuations in the three radar bands.

3. Results

The measured LRRP data of the duck indicated that respiration caused 1 dB-level signal fluctuations. Figure 4 compares the data of a living duck and a dead duck with LRRPs in Table 1. The duck’s chest faces the radar wave (i.e., head view). The duck’s echoes were at 11.8 m in the range data (Figure 4). There were no apparent signal fluctuations within any test radar bands of the dead duck, but the signal fluctuations were approximately 1 dB within the S-band and 3 dB within the X-band and Ku-band. Neither of them was larger than the 10 dB level for the data of the living duck.
Compared to the LRRPs of the duck, the HRRPs of the duck present clearer radar signatures posed by respiration. Figure 5 compares the HRRPs. The duck chest echoes were at 11.8 m in the range data. The signal fluctuations of the dead duck were no more significant than 1 dB within any measured radar band. However, the respirations of the chest caused different levels of signal fluctuations in radar data within the three radar bands. LRRPs cannot exclude inference from the ducks’ movements in the test, but HRRPs can capture detailed echoes from a specific part of the bird and the surrounding environment. Thus, it can mark the contributions from the measured part over other parts of the bird. For example, the radar reflection from the duck could reflect the surrounding environment and then be received by the antenna and produce the different HRRP curves. The shapes of the HRRP curves are different, even within the same band, and there were other fluctuations (e.g., fluctuations at 11.6 m and 11.7 m in Figure 5) around the chest of the bird. These fluctuations were not from the duck’s movement because the bird stayed still, and its neck was curled up to the tail, as shown in Figure 2. These “ripples” contain waves because of the multipath effect or even the vortex [26,27] due to respiration and other unknown reasons.
Statistical results of both LRRPs and HRRPs are shown in Table 2. The mean value is the mean number, and the scope is the difference between the maximum and the minimum one, which describes the fluctuation level of the signals. First, the mean values of the S-band were the largest, and those of the X-band were the second largest, and then those of the Ku-band were the smallest, no matter whether it was the living duck or the dead duck. Second, the scope level was less than 1 dB within the S-band and approximately 4 dB within the X-band and the Ku-band. Similar to LRRPs, neither was larger than the 10 dB level.
In addition to range profiles, the signal fluctuations in the time series could also measure apparent intervals due to respiration. We extracted the data of 11.8 m in Figure 5, drew the continuous frames of radar data in the cross-range profile, and calculated their corresponding spectrum in Figure 6. As we stated in Section 2, although the sampling period is approximately 3 s, our sampling frequency of 10 Hz is larger than the required sampling frequency of 1.66 Hz, following the Nyquist theorem. There are two peaks in the X-band HRRPs, with a time interval of 1400 ms. These numbers within the Ku-band, and S-band are also about 1400 ms. The calculated respiration rate of the duck was approximately 42 breaths/min (i.e., 0.7 Hz).
The respiration rate could also be tracked in the spectrum. The calculated respiration rate is approximately 0.7 Hz in Figure 6a,b. In this experiment, we recorded the data after the duck flapped its wings for a while, and we could even hear the quick and loud sound of the duck’s breathing; hence, the respiration rate of the duck was a little higher than the normal state, and the value approached the upper limit of the reference rate (i.e., 30~50 breaths/min (0.50~0.83 Hz) [18,24]). In addition, the comparison in Figure 6a,b indicates that the signal fluctuation modulated by respiration is very weak, and there were no signal fluctuations or respiratory frequencies when the radar wave shot on the back of the duck (i.e., tail-view) (Figure 6b). This extraction required that the chest of the duck face the radar wave (i.e., head view) (Figure 6a).

4. Discussion

The above results indicated that radar signals posed by respiration were weak; thereby, it was not believed to be important for the 10 dB-level amplitude modulation on echoes from flying birds. Other reasons take primary responsibility for the 10 dB-level amplitude modulation. The most likely reason could be the contributions of flapping wings, as some studies reported that the fluctuation was related to the flapping gaits of birds. Our dynamic measurement system can also be used for capturing the radar signals modulated by different flapping gaits, so that we can continue to conduct future research on this topic and quantify the relationship between radar signals and the flapping gaits of flying birds using our measurement systems, as shown in Figure 2 and Figure 3.
The signal fluctuations modulated by respiration within the S-band were ~1 dB and stronger within the X-band and Ku-band (>2 dB), as shown in Table 2. The higher the frequency, the stronger the modulation of birds’ echoes. Scattering regions can explain this phenomenon. The material contents of the target mainly affect the signal fluctuation in the resonance region. In contrast, in the optic region, scattering centers (i.e., the shape of the target) contribute to the significant scattering field of the target. Although the bird is breathing, its material contents did not change much; therefore, the signal fluctuation within the S-band is small. However, due to respiration, the scattering section of the bird is changing; hence, signal fluctuations within the X-band and Ku band are more evident and larger than those within the S-band. The same reason could also explain the case in [1], where the authors found that the modulation signals within the S-band are weaker than those within the X-band. For this reason, the S-band could be a little unsuitable for detecting radar signals of birds, especially those involved in signal recognition using modulation signatures.

5. Conclusions

Current research provides few measurements of radar signals modulated by the respiration movement of birds in a microwave anechoic chamber. First, we investigated the periodic signals of birds produced by respiration with the water sphere model. Moreover, the theoretical simulation of the signal fluctuation is approximately 1.2 dB for a 1 kg duck as a two SATs bird. Then, we experimentally captured the weak signals of a living duck and a dead duck in an anechoic chamber using a dynamic measurement system composed of a vector network analyzer and a high-speed camera. The results for both LRRPs and HRRPs within the S-band, X-band, and Ku-band indicate that the respiration movement of the bird causes periodic amplitude fluctuation with a respiration rate of 0.7 Hz. Due to the scattering region theory, the higher the frequency, the stronger the modulation of the birds’ echoes; thus, the signal fluctuations modulated by respiration within the S-band were ~1 dB and stronger within the X-band and Ku-band (>2 dB).The fluctuation is approximately 1 dB level, similar to the simulated result of 1 dB level, which is much less than the 10 dB level reported in the references (e.g., [2,3,4,5]). In addition, the 10 dB level of signal fluctuations in radar echoes of birds could mainly come from the wing-beating motion. Future work will quantify the contribution from flapping wings and explain the modulation mechanism.

Author Contributions

Conceptualization, J.G. and J.Y.; methodology, D.K. and J.Y.; software, D.K.; validation, J.G. and J.Y.; formal analysis, J.G.; investigation, J.Y., W.B. and S.W.; resources, D.L.; data curation, J.Y.; writing—original draft preparation, J.G. and D.K.; writing—review and editing, H.H.; visualization, H.H.; supervision, J.Y.; project administration, D.L.; funding acquisition, D.K. All authors have read and agreed to the published version of the manuscript.

Funding

This work was supported in part by the Shanghai Aerospace Science and Technology Innovation Fund under Grant SAST2018-007.

Institutional Review Board Statement

The authors declare that they obtained experimental approval for the Laboratory Animal Use Protocol (AUP) from the IACUC of Wuhan University Center for Animal Experiment, with the IACUC Pre-Review NO. WP20220122. All applicable international, national, and/or institutional guidelines for the care and use of animals were followed.

Informed Consent Statement

Not applicable.

Data Availability Statement

Some of the data presented in this study may be available on request from the corresponding author. The data are not publicly available due to the internal restriction of the research group.

Acknowledgments

We appreciate both the testers during the collection of the data, and we want to thank the authors whose photographs are reproduced in this study.

Conflicts of Interest

The authors declare no conflict of interest.

References

  1. Schaefer, G.W. Bird Recognition by Radar A Study in Quantitative Radar Ornithology. In The Problems of Birds As Pests; Academic Press: London, UK, 1968; pp. 53–86. [Google Scholar]
  2. Torvik, B.; Olsen, K.E.; Griffiths, H. K-Band Radar Signature Analysis of a Flying Mallard Duck. In Proceedings of the International Radar Symposium, Dresden, Germany, 19–21 June 2013; Volume 2, pp. 584–592. [Google Scholar]
  3. Nohara, T.J.; Beason, R.C.; Weber, P. Using Radar Cross-Section to Enhance Situational Awareness Tools for Airport Avian Radars. Hum.-Wildl. Interact. 2011, 5, 210–217. [Google Scholar]
  4. Dokter, A.M.; Liechti, F.; Stark, H.; Delobbe, L.; Tabary, P.; Holleman, I. Bird Migration Flight Altitudes Studied by a Network of Operational Weather Radars. J. R. Soc. Interface 2011, 8, 30–43. [Google Scholar] [CrossRef] [PubMed]
  5. Vaughn, C.R. Birds and Insects as Radar Targets: A Review. Proc. IEEE 1985, 73, 205–227. [Google Scholar] [CrossRef]
  6. Torvik, B.; Knapskog, A.; Lie-Svendsen, Ø.; Olsen, K.E.; Griffiths, H.D. Amplitude Modulation on Echoes from Large Birds. In Proceedings of the European Microwave Week 2014: “Connecting the Future”, EuMW 2014—Conference Proceedings, EuRAD 2014: 11th European Radar Conference, Rome, Italy, 8–10 October 2014; pp. 177–180. [Google Scholar]
  7. Torvik, B.; Olsen, K.E.; Griffiths, H.D. X-Band Measurements of Radar Signatures of Large Sea Birds. In Proceedings of the 2014 International Radar Conference, Lille, France, 13–17 October 2014; pp. 1–6. [Google Scholar]
  8. Mirkovic, D.; Stepanian, P.M.; Kelly, J.F.; Chilson, P.B. Electromagnetic Model Reliably Predicts Radar Scattering Characteristics of Airborne Organisms. Sci. Rep. 2016, 6, 35637. [Google Scholar] [CrossRef] [PubMed]
  9. Bruderer, B. The Study of Bird Migration by Radar. Part 1: The Technical Basis. Naturwissenschaften 1997, 84, 26–28. [Google Scholar] [CrossRef]
  10. Pennycuick, C.J. The Flight of Birds and Other Animals. Aerospace 2015, 2, 505–523. [Google Scholar] [CrossRef]
  11. Farshchian, M.; Selesnick, I.; Parekh, A. Bird Body and Wing-Beat Radar Doppler Signature Separation Using Sparse Optimization. In Proceedings of the 2016 4th International Workshop on Compressed Sensing Theory and Its Applications to Radar, Sonar and Remote Sensing, CoSeRa, Aachen, Germany, 19–22 September 2016; pp. 71–74. [Google Scholar]
  12. Urmy, S.S.; Warren, J.D. Quantitative Ornithology with a Commercial Marine Radar: Standard-Target Calibration, Target Detection and Tracking, and Measurement of Echoes from Individuals and Flocks. Methods Ecol. Evol. 2017, 8, 860–869. [Google Scholar] [CrossRef]
  13. Martinson, L.W. A Preliminary Investigation of Bird Classification by Doppler Radar; the NASA Center for Aerospace Information (CASI). 1973. Available online: https://ntrs.nasa.gov/api/citations/19740009774/downloads/19740009774.pdf (accessed on 7 August 2022).
  14. Bruderer, B.; Steuri, T.; Baumgartner, M. Short-Range High-Precision Surveillance of Nocturnal Migration and Tracking of Single Targets. Isr. J. Zool. 1995, 41, 207–220. [Google Scholar] [CrossRef]
  15. Gauthreaux, S.A.; Belser, C.G. Radar Ornithology and Biological Conservation. Auk 2003, 120, 266–277. [Google Scholar] [CrossRef]
  16. Bruderer, B.; Peter, D.; Boldt, A.; Liechti, F. Wing-Beat Characteristics of Birds Recorded with Tracking Radar and Cine Camera. Ibis 2010, 152, 272–291. [Google Scholar] [CrossRef]
  17. Bruderer, B.; Popa-Lisseanu, A.G. Radar Data on Wing-Beat Frequencies and Flight Speeds of Two Bat Species. Acta Chiropterol. 2005, 7, 73–82. [Google Scholar] [CrossRef]
  18. Smith, E.N.; Peterson, C.; Thigpen, K. Body Temperature, Heart Rate and Respiration Rate of an Unrestrained Domestic Mallard Duck, Anas Platyrhynchos Domesticus. Comp. Biochem. Physiol. A Comp. Physiol. 1976, 54, 19–20. [Google Scholar] [CrossRef]
  19. Brown, R.E.; Brain, J.D.; Wang, N. The Avian Respiratory System: A Unique Model for Studies of Respiratory Toxicosis and for Monitoring Air Quality. Environ. Health Perspect. 1997, 105, 188–200. [Google Scholar] [CrossRef] [PubMed]
  20. Moon, J.R. Effects of Birds on Radar Tracking Systems. In Proceedings of the IEE Conference Publication, Edinburgh, UK, 15–17 October 2002; Volume 490, pp. 300–304. [Google Scholar]
  21. U.S. Department of Transportation, Airport Avian Radar Systems—Advisory Circular. 2005. Available online: https://www.faa.gov/documentLibrary/media/Advisory_Circular/AC_150_5220-25.pdf (accessed on 7 August 2022).
  22. Nakamura, R.; Hadama, H. Characteristics of Ultra-Wideband Radar Echoes from a Drone. IEICE Commun. Express 2017, 6, 530–534. [Google Scholar] [CrossRef]
  23. Kent, B.M. Comparative Measurements of Precision Radar Cross Section (RCS) Calibration Targets. In Proceedings of the IEEE Antennas and Propagation Society, AP-S International Symposium (Digest), Boston, MA, USA, 8–13 July 2001; Volume 4, pp. 412–415. [Google Scholar]
  24. Bretz, W.L.; Schmidt-Nielsen, K. Bird Respiration: Flow Patterns in the Duck Lung. J. Exp. Biol. 1971, 54, 103–118. [Google Scholar] [CrossRef] [PubMed]
  25. Tait, P. Introduction to Radar Target Recognition; Institution of Electrical Engineers: New York, NY, USA, 2006; ISBN 9781849190831. [Google Scholar]
  26. Barbaresco, F.; Wasselin, J.P.; Jeantet, A.; Meier, U. Wake Vortex Profiling by Doppler X-Band Radar: Orly Trials at Initial Take-off & ILS Interception Critical Areas. In Proceedings of the 2008 IEEE Radar Conference, RADAR, Rome, Italy, 26–30 May 2008; pp. 1–6. [Google Scholar]
  27. Marshall, R.E.; Myers, T.J. Wingtip Generated Wake Vortices as Radar Targets. IEEE Aerosp. Electron. Syst. Mag. 1996, 11, 27–30. [Google Scholar] [CrossRef]
Figure 1. The avian respiratory system with a lateral view of one lung and the water sphere model of a duck.
Applsci 12 08101 g001
Figure 2. Tests in the anechoic chamber. (a) Photos of birds using the high-speed camera 1, (b) a screenshot of the data measured by the Vector Network Analyzer, PNA-N5224A. 1 The number # x is the tracking ID.
Applsci 12 08101 g002
Figure 3. The flow chart of one measurement.
Applsci 12 08101 g003
Figure 4. The comparison of LRRPs of a living duck and a dead duck 1,2. (a) LRRPs of a dead duck, (b) LRRPs of a living duck. 1 The ducks were in positions around 11.8 m of the range profiles. 2 The numbers of the legends on the right bar are the sequence number of the sampling frame.
Applsci 12 08101 g004aApplsci 12 08101 g004b
Figure 5. The comparison of HRRPs of a living duck and a dead duck 1. (a) HRRPs of a dead duck, (b) HRRPs of a living duck. 1 The ducks were in positions around 11.8 m of the range profiles.
Applsci 12 08101 g005
Figure 6. The comparison of signal fluctuations produced by respiration. (a) Radar signals in time series and spectrum of a duck (head-view, HRRP), (b) Radar signals in time series and spectrum of a duck (tail-view, HRRP).
Applsci 12 08101 g006
Table 1. Measured parameters of experiments.
ContentParameters
Bands 1S-BandX-BandKu-Band
Range profile 2HRRPLRRPHRRPLRRPHRRPLRRP
Frequency (GHz)2–49–9.18–1210–10.114–1816–16.1
Bandwidth (GHz)20.140.140.1
Resolution (cm)7.51503.751503.75150
1 The S-band, X-band, and Ku-band are the common radar bands for reconnaissance radar systems. 2 HRRP means high range resolution profile, which is a technology where a radar transmits a wide bandwidth, and the corresponding range resolution can separate the scattering centers of a target; in contrast, LRRP is the abbreviation of “Low Range Resolution Profile”, where the size of a target is shorter than the range resolution.
Table 2. Some statistics results of signal fluctuations in Figure 4 and Figure 5.
LRRPHRRP
Dead DuckLiving DuckDead DuckLiving Duck
S-bandMean (dB)−70.6949−74.9089−82.665−74.3358
Scope (dB)0.04250.37651.01220.9605
X-bandMean (dB)−73.146−73.965−84.528−99.519
Scope (dB)0.0573.0530.22464.062
Ku-bandMean (dB)−79.720−83.146−98.167−98.777
Scope (dB)0.1372.6210.2353.772
Publisher’s Note: MDPI stays neutral with regard to jurisdictional claims in published maps and institutional affiliations.

