Article

Finite Element Analysis of the Distribution Parameters of a Metal Dot Array in a SAW Gyroscope

1
School of Information Science and Engineering, Shandong Normal University, Jinan 250014, China
2
State Key Laboratory of Acoustics, Institute of Acoustics, Chinese Academy of Sciences, Beijing 100190, China
*
Authors to whom correspondence should be addressed.
Appl. Sci. 2022, 12(16), 8062; https://doi.org/10.3390/app12168062
Submission received: 3 July 2022 / Revised: 8 August 2022 / Accepted: 9 August 2022 / Published: 11 August 2022
(This article belongs to the Special Issue Wireless and Passive Surface Acoustic Wave Sensor)

Abstract

:
A surface acoustic wave (SAW) gyroscope has many unique advantages, but a low detection sensitivity limits its development. Previous studies have shown that adding a metal dot array to the acoustic wave propagation path of the SAW delay line can enhance the Coriolis force and further improve sensitivity. Therefore, in order to optimize the detection sensitivity performance of the sensor, 128°YX-LiNbO3, ST-X Quartz and X112°Y-LiTaO3 piezoelectric substrates were selected by finite element method to analyze the influence of the metal dot array size on the SAW gyroscopic effect in this paper. The most suitable metal dot size for 128°YX-LiNbO3 and X112°Y-LiTaO3 obtained by simulation are 5 / 16 λ and 1 / 16 λ , respectively; for example, when the normalized angular velocity is 1 × 10⁻³, the SAW gyroscopic effect factor g of the two piezoelectric substrates distributing the optimum size metal dots can reach 22.4 kHz and 5.2 kHz. For ST-X quartz, there is a threshold between the rotation speed of the substrate and the optimum size of the metal dot. When the rotating speed is lower than the threshold, the SAW gyroscopic effect is strongest when the metal dot size is 3 / 16 λ ; otherwise, the SAW gyroscopic effect is strongest when the size is 11 / 16 λ . These research results provide new ideas for improvement of the SAW gyroscope.

1. Introduction

In recent years, the surface acoustic wave (SAW) gyroscope has been widely studied by scholars because of its significant advantages, such as its simple structure, small size, long service life, superior inherent shock robustness, and so on, and it has the prospect of broad applications in attitude monitoring and motion control [1,2,3,4,5]. The SAW gyroscopes mainly include the traveling wave mode and standing wave mode. The standing wave mode SAW gyroscope cannot be put into use due to its output signal being difficult to detect, and it cannot achieve temperature compensation [6]. The traveling wave mode SAW gyroscope, which uses a differential scheme for temperature compensation and the output signal is easy to detect, has been studied deeply [7]. However, a weak Coriolis force leads to a low detection sensitivity, which limits its practicality. Therefore, recently, many teams have devoted themselves to solving the bottleneck problem of the low detection sensitivity of the SAW gyroscope, and they proposed various methods to improve the sensor performance in terms of selection and optimal design of the interdigital transducer and the piezoelectric substrate [8,9,10,11,12]. In addition, our team proposed a traveling wave mode SAW gyroscope structure combined with a metal dot array in the previous research work, and verified the effectiveness of this structure in improving the detection sensitivity performance of the SAW gyroscope, both theoretically and experimentally [13,14].
The principle of the SAW gyroscope is based on the SAW gyroscopic effect, which is specifically explained as follows: a Rayleigh wave (a wave pattern of SAW) propagates on the surface of the substrate, and the particles in the medium (elements of infinitesimal size) vibrate along an elliptical trajectory in the plane composed of the direction of the acoustic wave propagation and the normal direction of the substrate. When the Coriolis force induced by external rotation acts on the particles, a secondary SAW will be induced and coupled with the initial SAW; thus, the particle vibration trajectory changes, resulting in the change of the velocity and the frequency of the SAW. In this way, the magnitude of the rotation vector can be characterized by detecting the change in frequency [13]. The schematic diagram is shown in Figure 1. The Rayleigh wave propagates along the x-axis direction, and the amplitude decays exponentially along the z-axis direction. The particle in the medium (hereinafter referred to as the vibrating particle) moves along an elliptical trajectory in the plane formed by the x-axis and the z-axis.
Commonly used piezoelectric substrates in SAW devices include quartz, AIN, ZnO, LiNbO3, LiTaO3, etc. The performance parameters of the substrate, such as the electromechanical coupling coefficient ( κ 2 ), dielectric constant ( ε i j ), elastic constant ( C i j ), piezoelectric constant ( e i j ) and temperature coefficient (TCF), will directly affect the performance of the SAW gyroscope devices [15,16]. In this paper, three piezoelectric substrates that can excite Rayleigh wave are selected as research objects; among them, 128°YX-LiNbO3 has a strong electromechanical coupling coefficient, ST-X Quartz has an excellent temperature characteristic close to 0 and X112°Y-LiTaO3, with a moderate temperature coefficient and electromechanical coupling coefficient, is taken as a contrast [17,18,19,20,21,22] We established 3D models of these three piezoelectric substrates, distributing copper dot arrays of different sizes, and calculated the influence of angular velocity on the phase velocity and frequency of the SAW using the finite element method [23]. Finally, the optimum distribution parameters of the metal dot array for the piezoelectric substrate with different characteristics under different rotation speeds are determined, which provides theoretical guidance for further development of a high-performance SAW gyroscope.

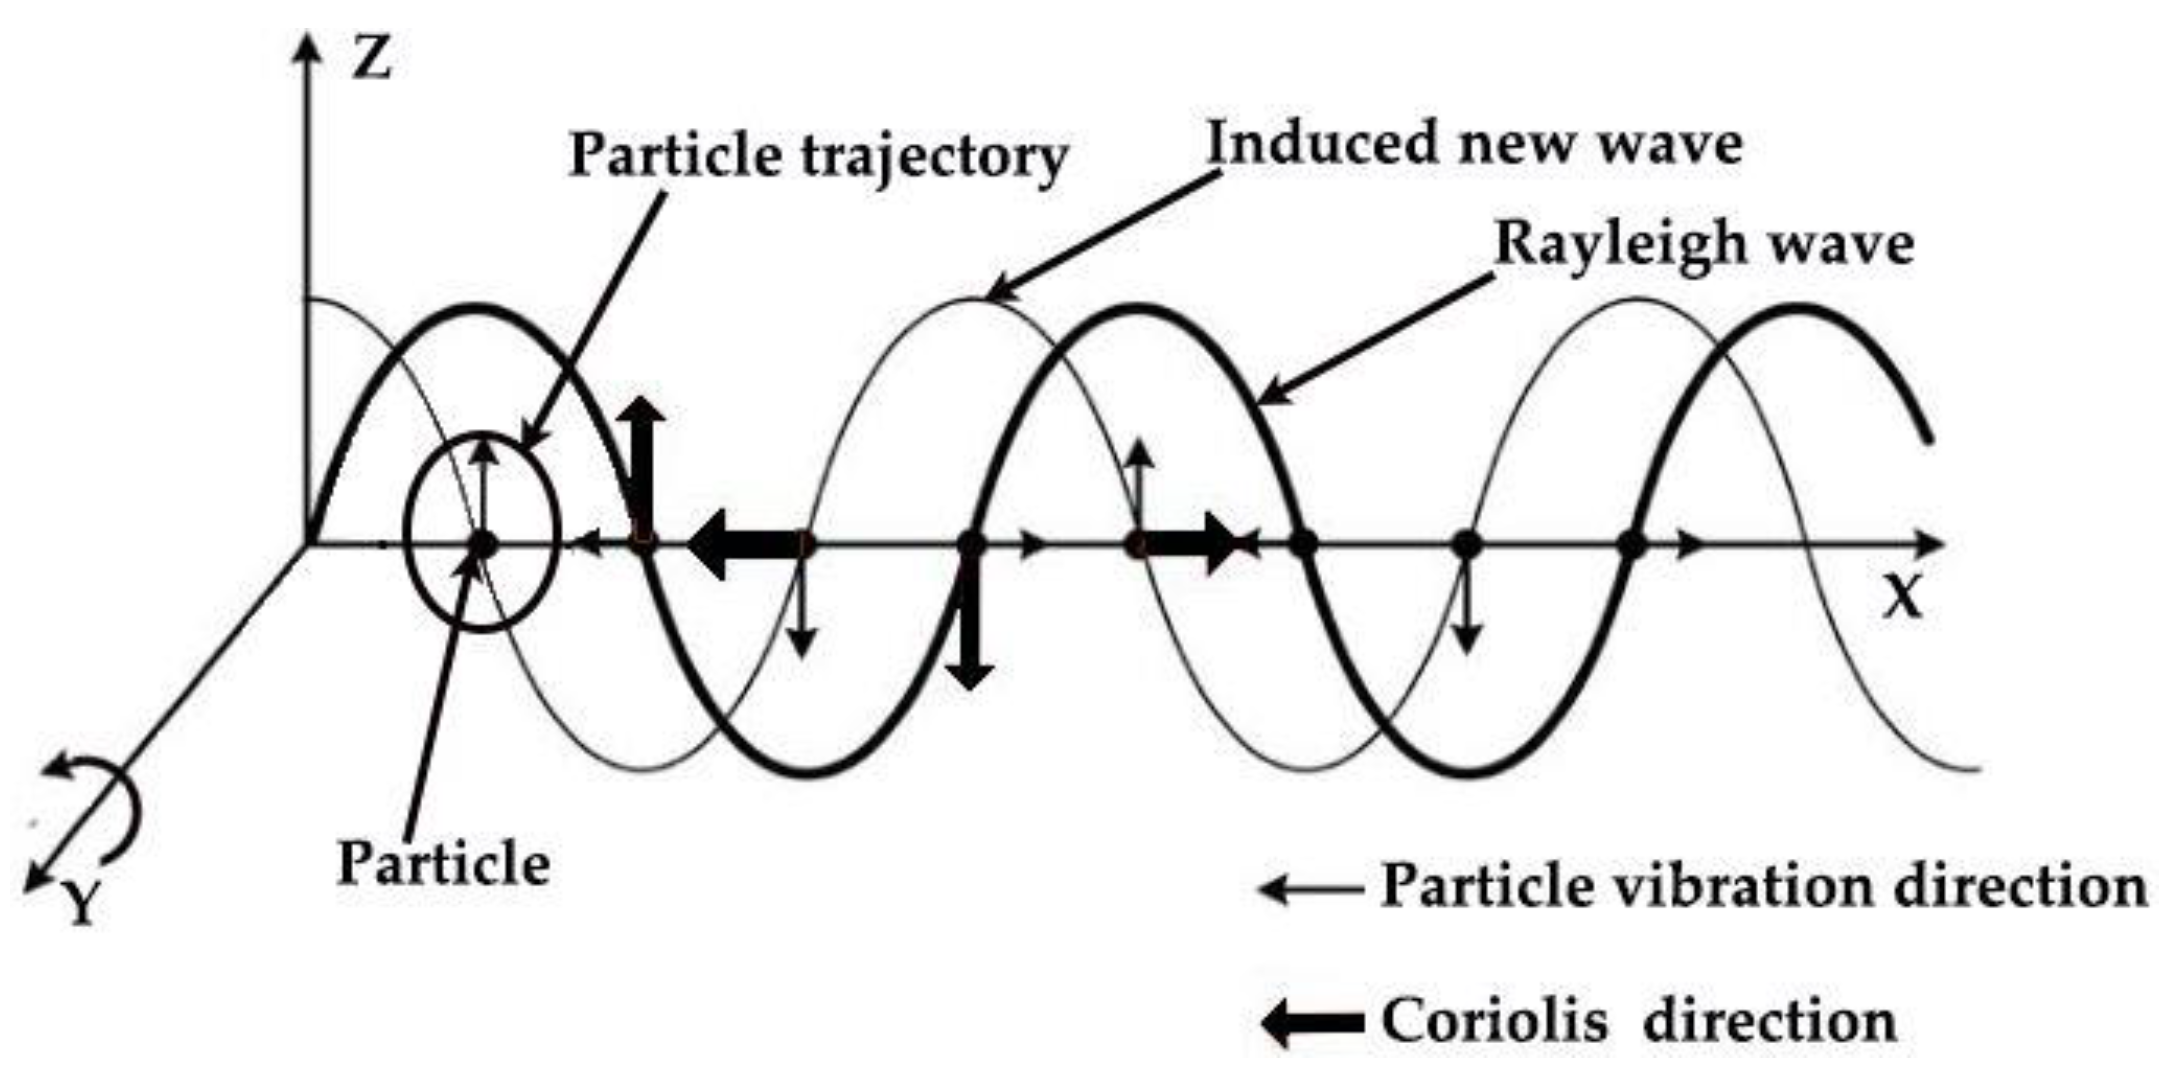
2. Theoretical Analysis

Previous research showed that distributing a metal dot array on the propagation path of the SAW is an effective method to improve the detection sensitivity performance of a SAW gyroscope [24]. The typical structure of a SAW gyroscope, as shown in Figure 2, includes interdigital transducers (IDTs), a metal dot array and a piezoelectric substrate. The structure consists of two parallel and reverse SAW delay lines to form a differential sensing mode [7]. When the SAW gyroscope rotates, the vibrating particles, in dual delay lines arranged in opposite directions, are subjected to a Coriolis force in the opposite direction [25]. Taking the frequency difference of dual delay lines as the output signal can not only realize temperature compensation, but also obtain stronger detection sensitivity performance [26].
Compared with a metal dot array, the thickness of the piezoelectric substrate is much larger; therefore, we can regard the piezoelectric substrate in SAW gyroscope devices as a semi-infinite space [27]. Taking a single metal dot element on a semi-infinite piezoelectric substrate as the research object (as shown in Figure 3), we studied the relationship between the intensity of the SAW gyroscopic effect and the distribution parameters of the metal dot array.
The value h in Figure 3 represents the thickness of the metal dot, and z < 0 represents the piezoelectric substrate in the semi-infinite space. SAW propagates along the x-axis direction with speed V 0 , and the whole model rotates around the y-axis with angular velocity Ω [28,29].
When the substrate model rotates around the y-axis at a constant angular velocity Ω , the vibrating particles are subjected to the action of the Coriolis force and centrifugal force, which can be, respectively, expressed as [30]:
F c o r = 2 m V × Ω
F c e n = m Ω × ( Ω × u )
In which, F c o r represents the Coriolis inertia force, F c e n represents the centrifugal inertia force, m represents the mass, V represents the vibration velocity, u represents the elastic displacement and Ω represents the angular velocity. Since the angular frequency of the SAW is much larger than the angular velocity, the influence of the centrifugal force on the particle is much smaller than that of the Coriolis force which can be ignored. Equation (1) shows that the strength of the Coriolis force depends on three factors: the mass m of the vibrating particle, the vibration velocity V and the angular velocity Ω . Therefore, adding a metal dot array on the path of the acoustic wave propagation can increase the mass of the particles; in particular, the metal dots with an appropriate size can make the Coriolis force superimpose in the same direction to enhance the sensitivity. On the contrary, an improper metal dot array will cause Coriolis force cancelling in the opposite direction and weaken the sensitivity.
In the SAW gyroscope devices distributed with a metal dot array, the periodic metal dot array plays a role similar to the interdigital electrode and causes the characteristic frequency to split into two, namely the symmetric frequency ( f s c + ) and the anti-symmetric frequency ( f s c ). When the substrate model rotates around the y-axis, the symmetric and anti-symmetric frequencies will change accordingly. However, it should be noted that with the change of the normalized angular velocity Ω / ω , the variation of symmetric frequency and anti-symmetric frequency is not the same, which corresponds to the change in the characteristic frequencies of the SAW propagating along the +x and −x axes of the dual delay lines with Ω / ω , respectively, in Figure 2 [11,31]. Therefore, in this study, the difference between the symmetric frequency and the anti-symmetric frequency is used to represent the output signal of the differential SAW gyroscope. When the substrate model is stationary, the output signal of the SAW gyroscope can be expressed as:
f 0 = f s c + f s c
When a rotation vector is applied to the piezoelectric substrate distributed metal dot array, f s c + and f s c will changed accordingly. At this time, the output signal of the SAW gyroscope can be defined as [32]:
f c = f s c + f s c
where, f s c + and f s c are the symmetric and antisymmetric frequencies under rotation, respectively. By subtracting Equation (3) from Equation (4), the magnitude of the SAW gyroscopic effect caused by the rotation can be obtained. Here we define a parameter g , as shown in Equation (5) below, to represent the SAW gyroscopic effect intensity. In this way, the optimum distribution parameters of the metal dot array in the sensor can be determined by comparing the value of g under the same rotation speed:
g = f c f 0 = ( f s c + f s c + ) ( f s c f s c )

3. Modeling and Simulation
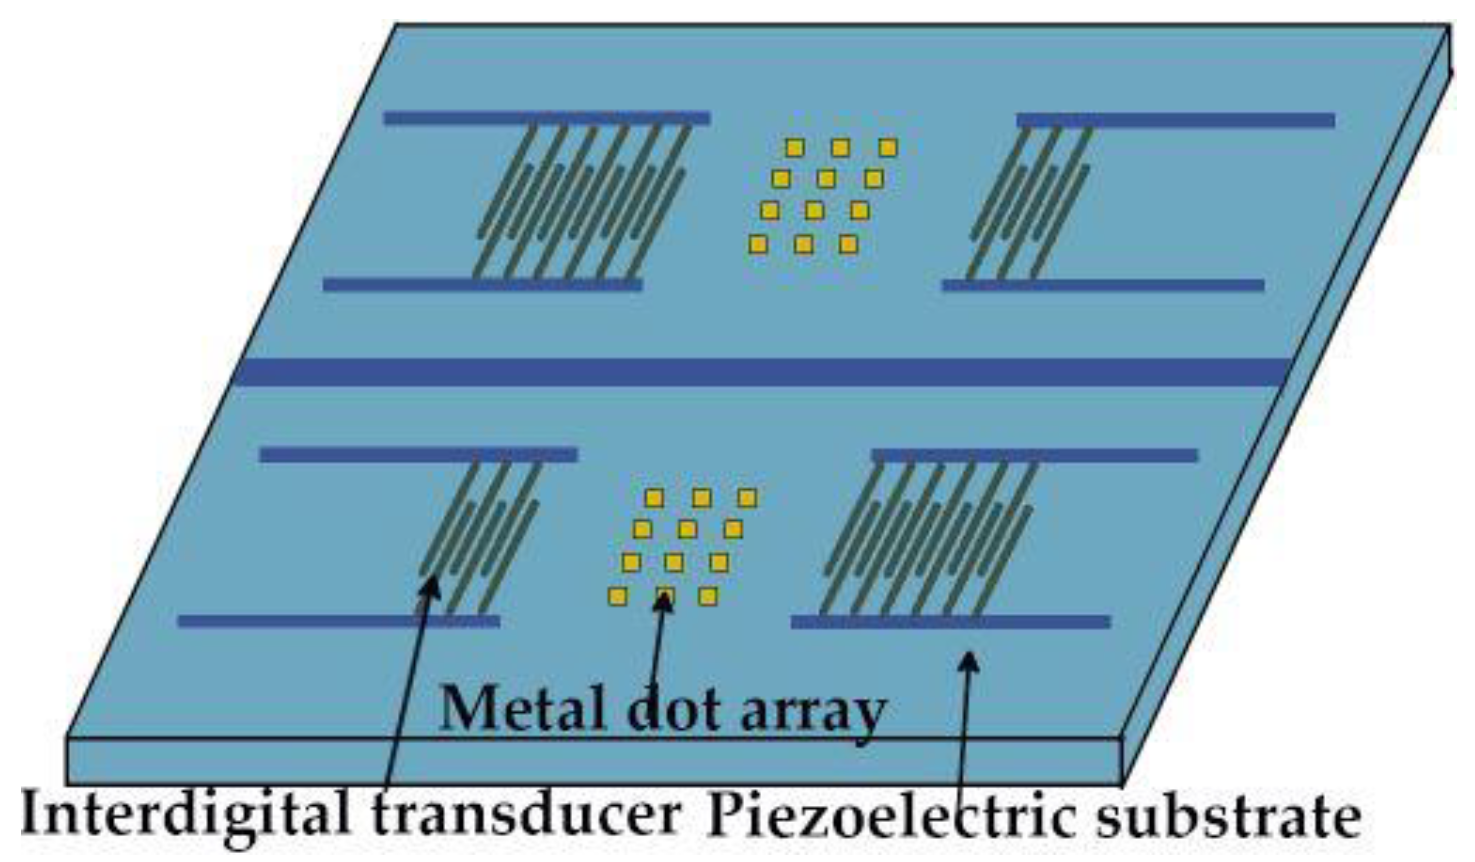
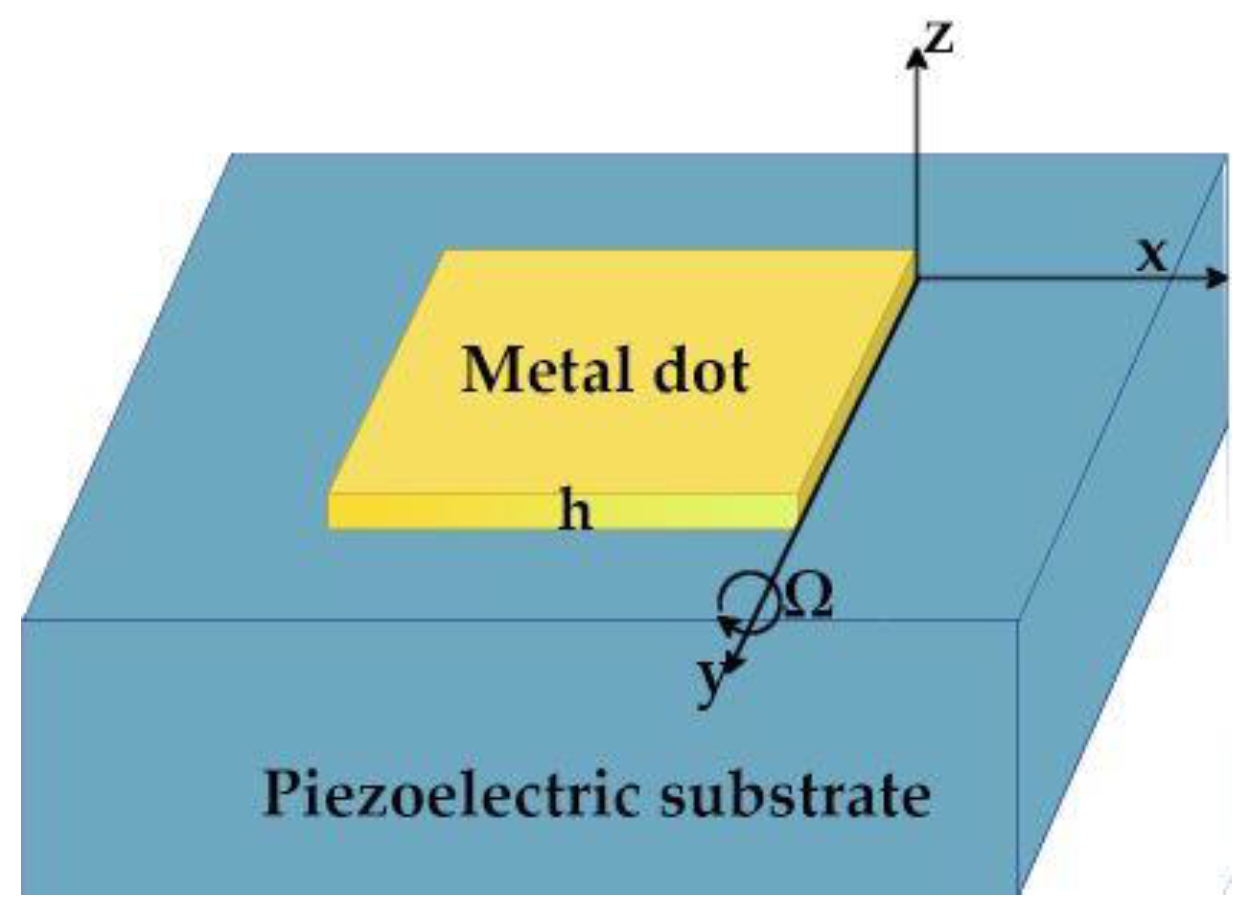
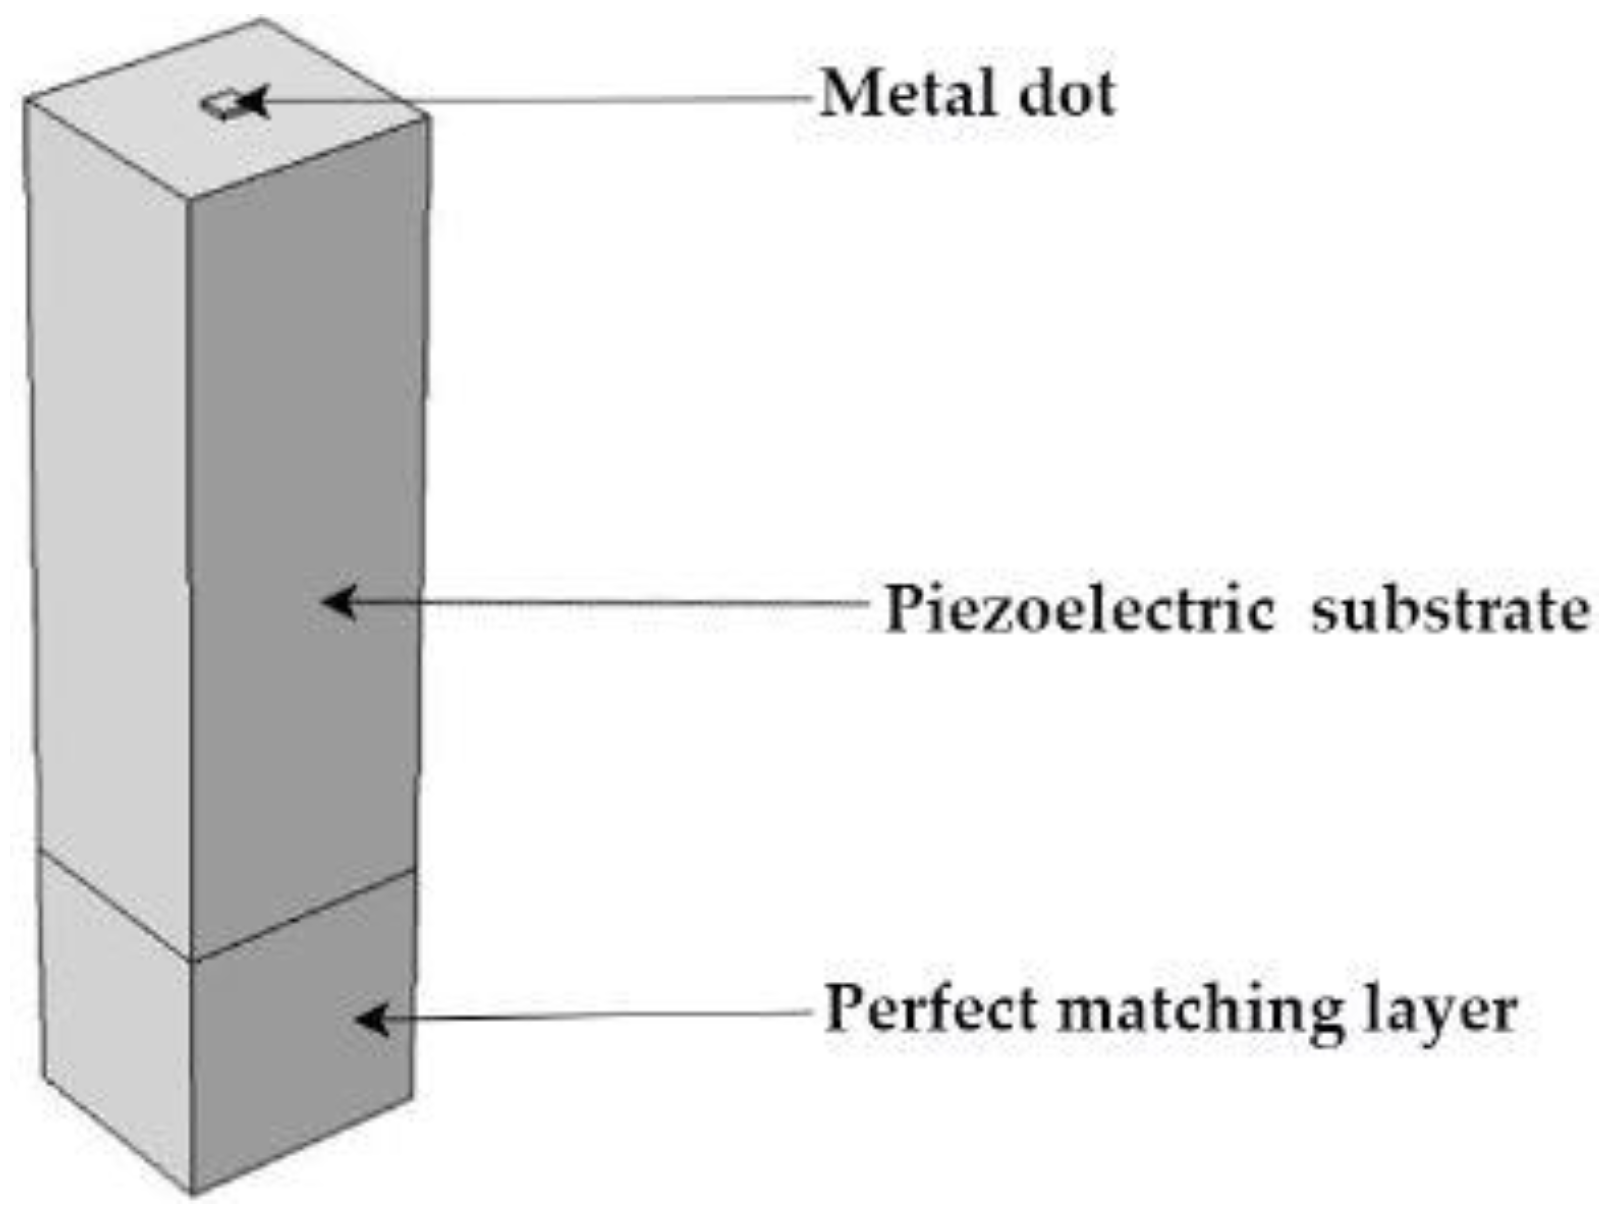
3.1. Modeling

The finite element method (FEM) is a common method for accurately simulating SAW gyroscopes [33], which is based on the acoustic wave equation considering the Coriolis force shown in Equation (6) and specific boundary conditions. The FEM is suitable for analyzing SAW characteristics in different structures because it is highly flexible [18,34].
ρ 2 u i t 2 C i j k l 2 u l x j x k + 2 ρ ε i j k Ω j u k t + ρ ( Ω i Ω j u j Ω j 2 u i ) = 0 T i 3 = C i 3 k l u k x l = 0
where ρ is the density of the medium, C i j k l is the elastic stiffness tensor, ε i j k is the Levi-Civita symbol, u i is a component of the elastic displacement vector, T i k is the stress and i, j, k, l = 1, 2, 3. The first two terms on the left-hand side of Equation (6) are related to inertia and elasticity. The third and the fourth terms are due to the Coriolis force and the centrifugal force, respectively.
The metal dot array in the SAW gyroscope is composed of many periodically arranged metal dots, and due to the periodicity of the structure, this paper models the single-period piezoelectric substrate and the metal dots distributed on it as the research object [35]. Meanwhile, the Rayleigh wave mainly concentrates within the range of 1~2 wavelengths on the surface of the piezoelectric substrate and attenuates rapidly along the depth [36]. Therefore, it is sufficient to set the model height to three wavelengths and then set a PML layer with a thickness of one wavelength to eliminate reflections [37]. Although previous research have shown that the thickness of the metal dot array increase, the SAW gyroscopic effect will be stronger, but we can only set the thickness of metal dot to 0.9 um due to the technological limitations. In addition, the metal dot is arranged in the center of the piezoelectric substrate for each period.
To improve the authenticity and the accuracy of the simulation experiment, based on the solving object (Figure 3), through the finite element simulation software, we have established a single-period 3D reference model, as shown in Figure 4 [38], and the material parameters used in the simulation are listed in Table 1. The boundary conditions of the model are as follows: (1) mechanical boundary conditions: the upper surface of the piezoelectric substrate is free, and the lower surface of the PML is fixed; (2) electrical boundary conditions: the upper surface of the piezoelectric substrate has zero charge or is grounded, and the lower surface of the PML has zero electric charge; and (3) the front and back sides, and the left and right sides of the piezoelectric substrate and PML have periodic boundary conditions [39].

3.2. Simulation Results and Discussion

The vibration modes of the SAW in the piezoelectric substrate can be derived by characteristic frequency analysis; when a metal dot array is distributed on a piezoelectric substrate, the characteristic frequency will split into two modes: symmetric mode and anti-symmetric mode [18]. According to the model established in Section 3.1, taking the 128°YX-LiNbO3 substrate distributed with a metal dot of size 1 / 16 λ as an example, we set the initial operation frequency f 0 to be 100 MHz. Since the SAW velocity of the 128°YX-LiNbO3  V f = 3986   m / s [40], we set the acoustic wavelength λ to 39.86 µm, the parameter ‘width’ is defined to achieve a parametric sweep of the metal dot size, and its value is set from 1 / 16 λ to 15 / 16 λ with a step interval of 1 / 16 λ , the grid size is selected to be ultra-refinement, and the number of characteristic frequency searches is set to 30. Finally, a rotate coordinate system is added, and the angular velocity is set to 2 π f 0 × a ( a is a constant used to control the angular velocity of the substrate). The simulation results shown in Figure 5a,b demonstrate the SAW of the symmetric mode and anti-symmetric mode, respectively [41], where the depth of the color indicates the magnitude of the displacement (i.e., amplitude of displacement), and the darker the color, the greater the displacement. In addition, the right side of the figure is the specific value of the displacement [42].
It can be clearly seen from Figure 5a,b that the Rayleigh waves propagate on the surface of the medium, and the elastic displacement is only in the x-axis and z-axis planes; there is no displacement in the y-axis. Besides, the particle displacement is mainly concentrated in the depth of one wavelength, and is almost invisible in when the depth reaches two wavelengths [43], which is completely consistent with the theory that the energy of the SAW is mainly concentrated in one to two wavelengths [44].

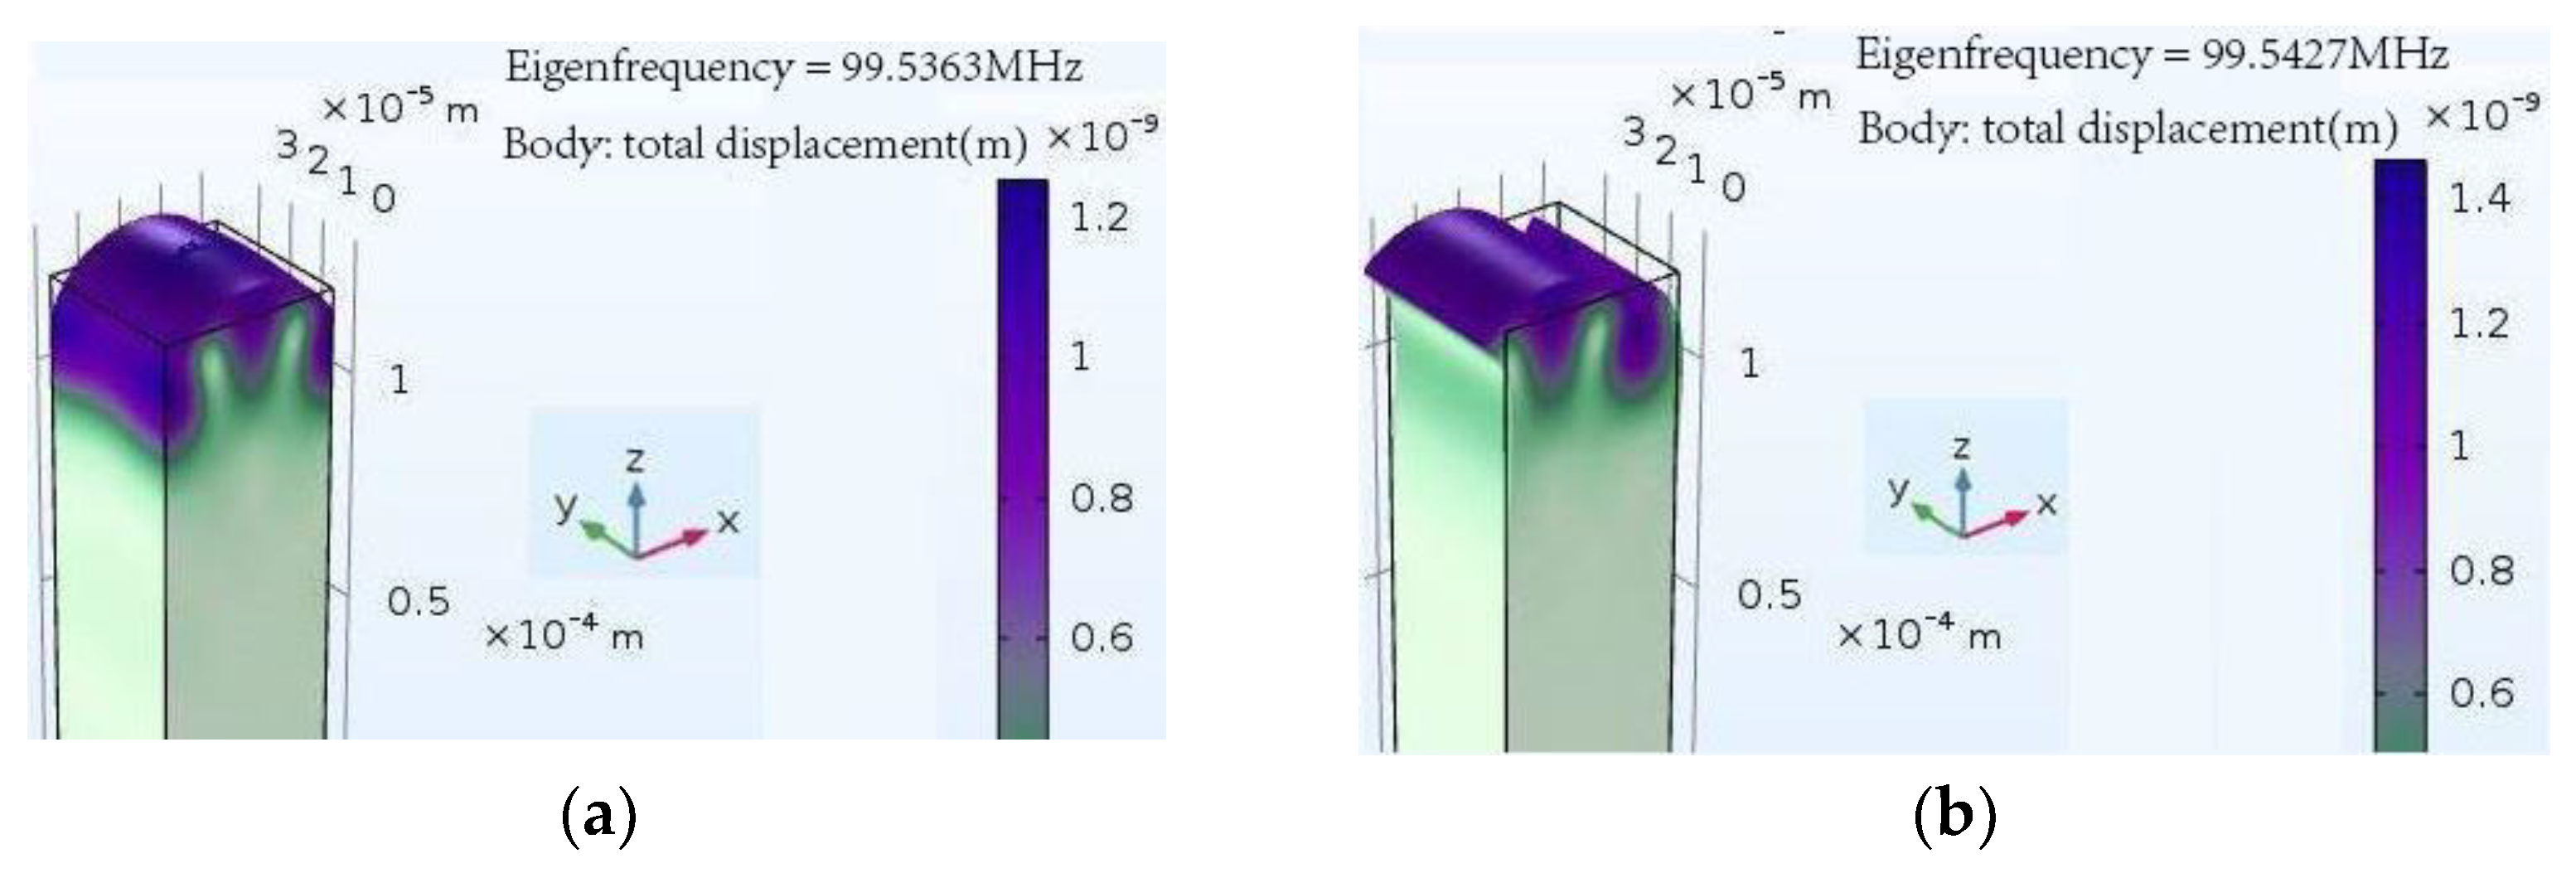
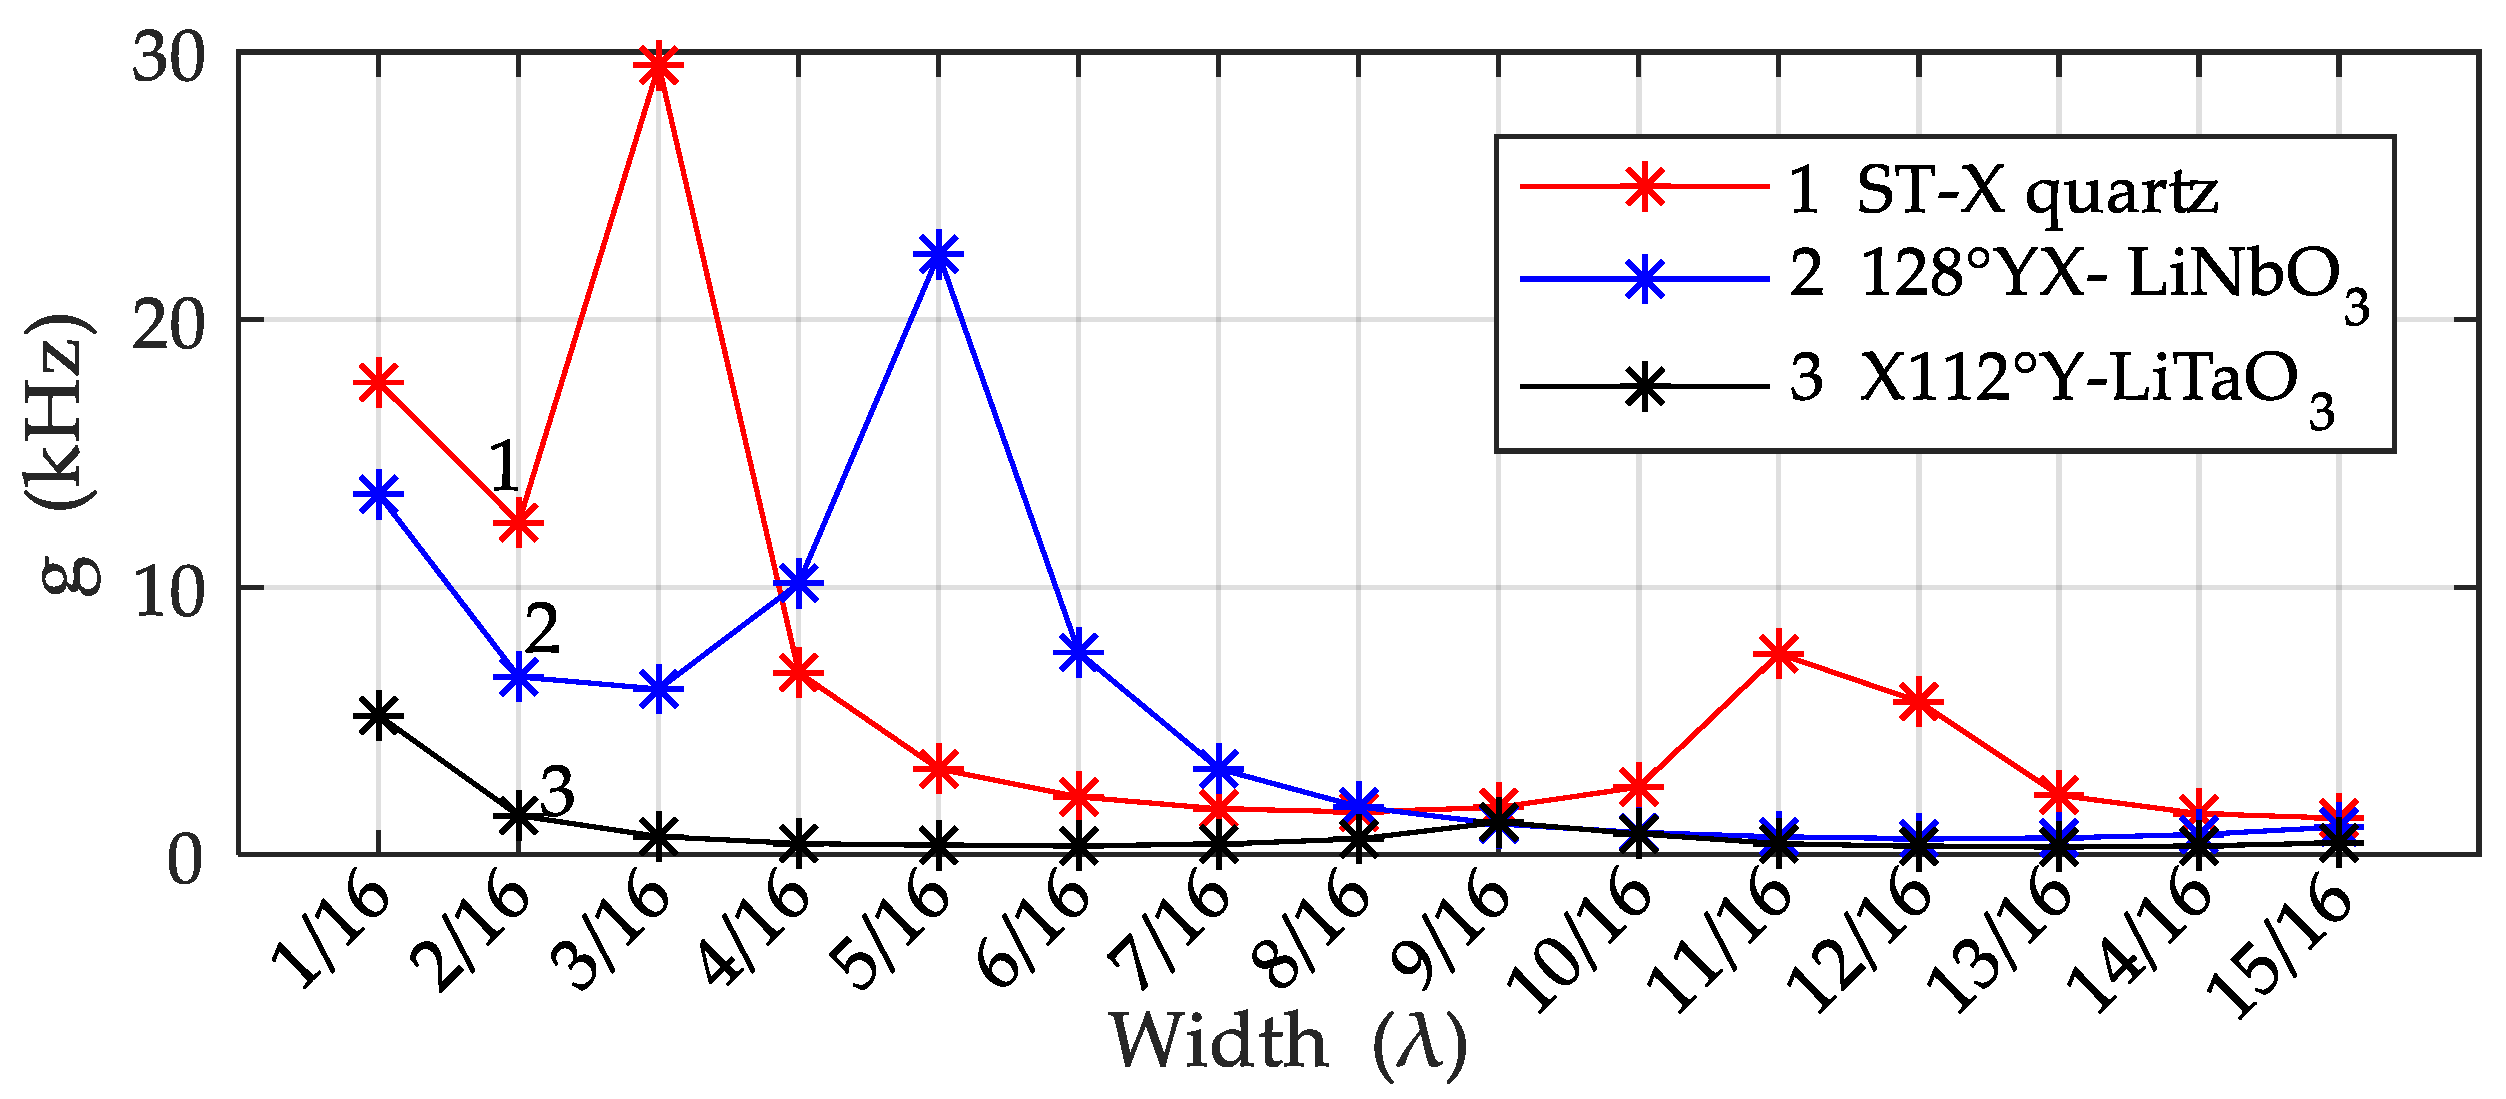
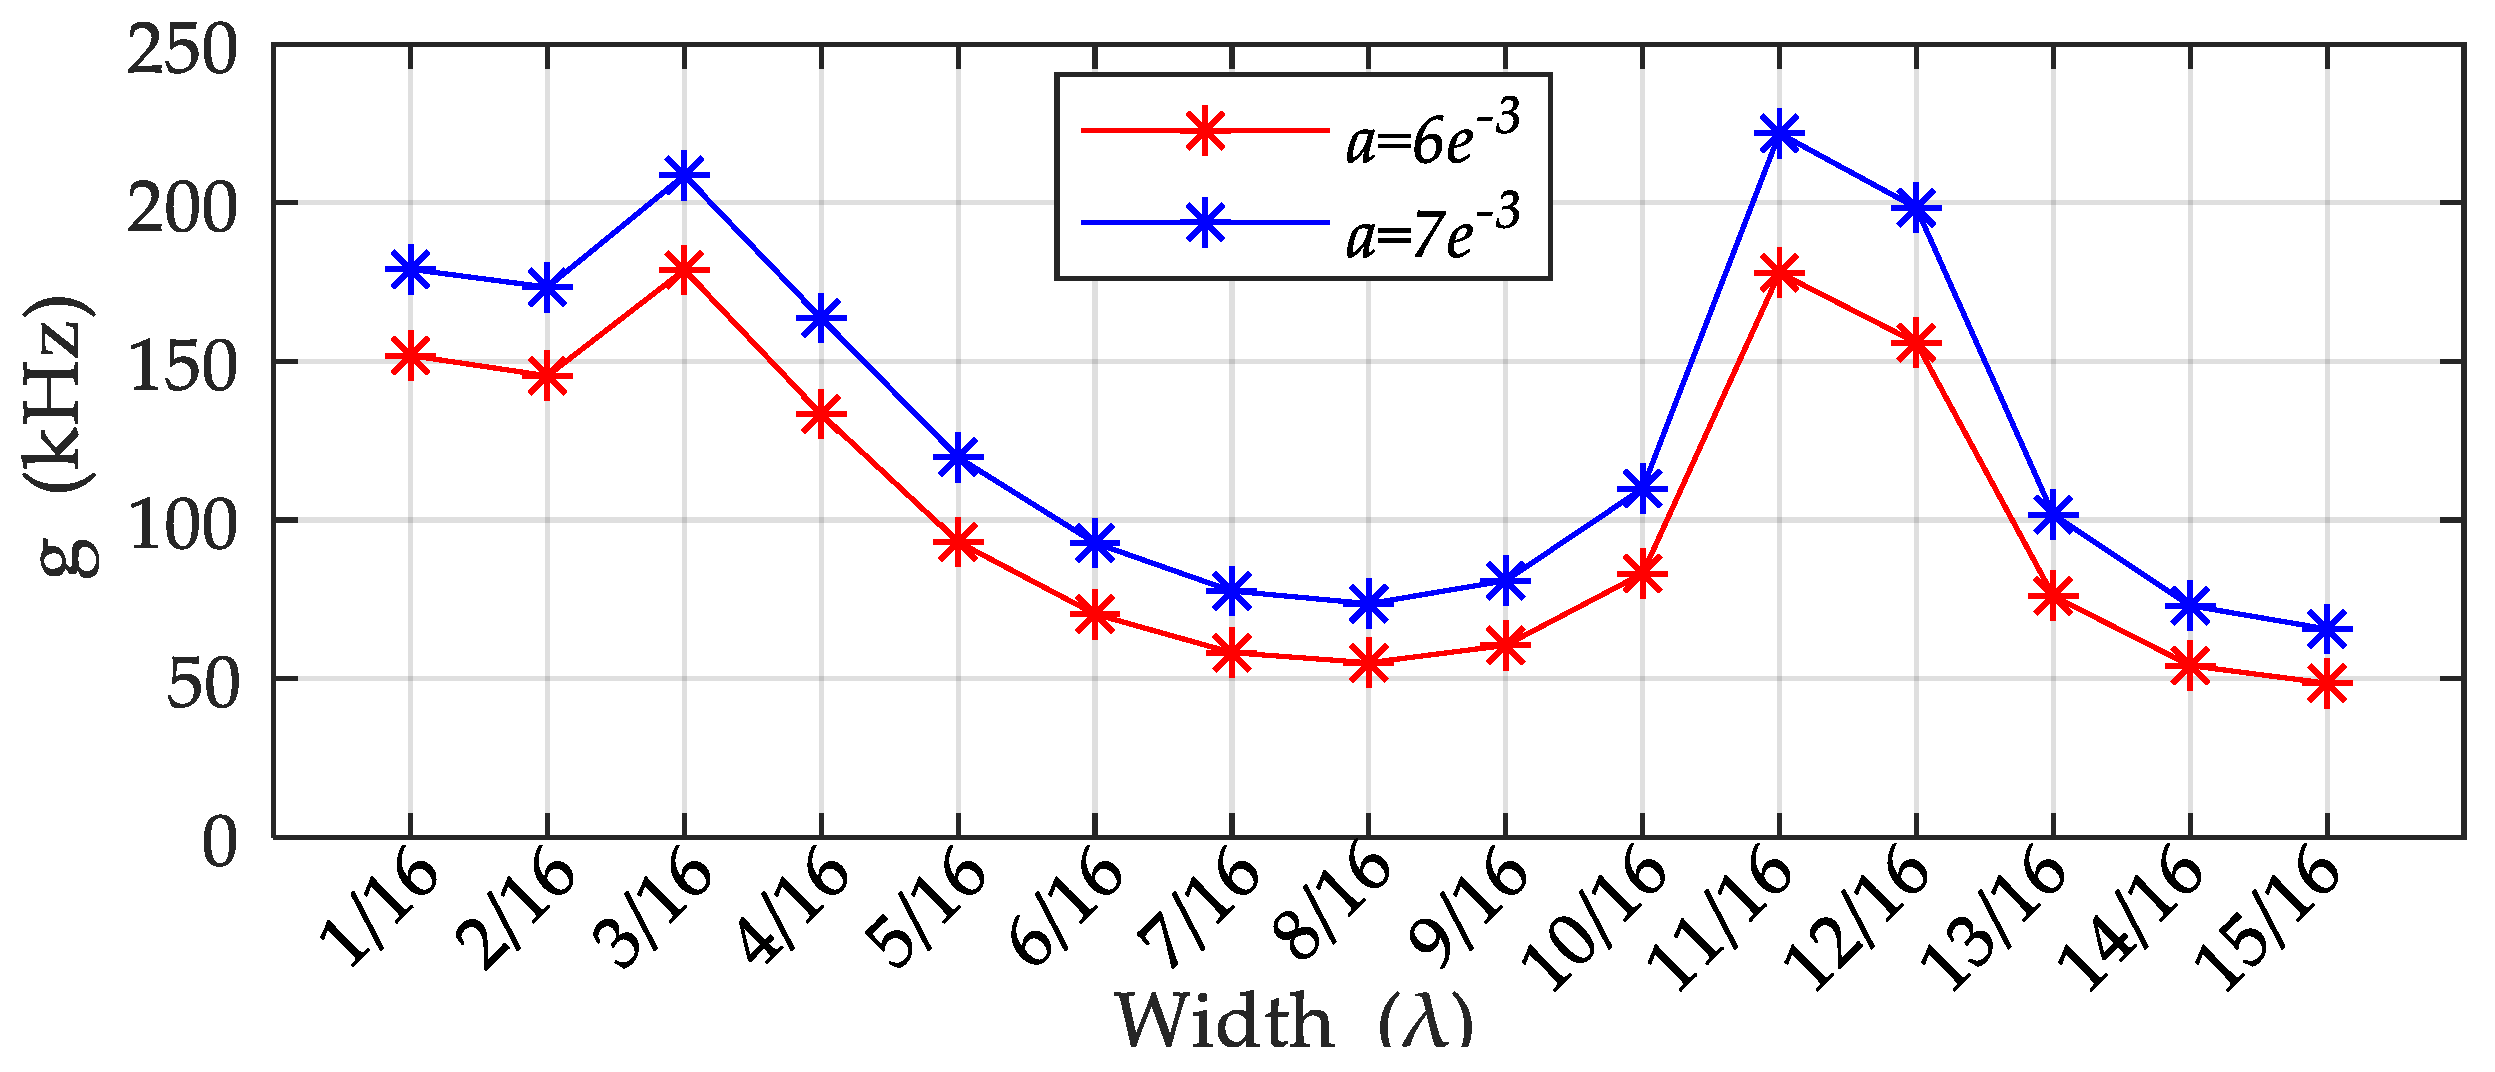
3.2.1. The Influence of the Size of the Metal Dot Array on the SAW Gyroscope Effect

When the model size of the piezoelectric substrate is fixed, the influence on the SAW gyroscopic effect is calculated by adjusting the distribution parameters of the metal dot on the upper surface of the piezoelectric substrate. Taking ω to denote the angular frequency of the SAW, which is defined as ω = 2 π f 0 , and taking a parameter a to represent the normalized angular velocity, that is, a = Ω / ω , then the angular velocity of the model can be expressed as Ω = 2 π f 0 × a [45]. In simulation, a is used as one of the parameters of the parametric sweep to control the angular velocity of the substrate.
Firstly, the factor g that represents the SAW gyroscopic effect of three piezoelectric substrates is analyzed, respectively, when a = 1 × 10 3 , and the simulation results shown in Figure 6 demonstrate the variation rule of the factor g with the size of the metal dot ‘width’. It is clear from Figure 6 that the value of the ‘width’ affects the intensity of the SAW gyroscopic effect significantly. When metal dots of different sizes are distributed on each piezoelectric substrate, the intensity of the SAW gyroscopic effect exhibited is very different from the results in the figure. It can be concluded that distributing a metal dot array of suitable size on the piezoelectric substrate can effectively improve the intensity of the SAW gyroscopic effect. The simulation results also show that, for three different piezoelectric substrates, the optimum sizes of the metal dot that can make the SAW gyroscopic effect the strongest are: 3 / 16 λ for ST-X quartz, 5 / 16 λ for 128°YX-LiNbO3 and 1 / 16 λ for X112°Y-LiTaO3. Besides, ST-X quartz with metal dots of 3 / 16 λ has the strongest SAW gyroscopic effect, followed by 128°YX-LiNbO3 with metal dots of 5 / 16 λ , and X112°Y-LiTaO3 with metal dots of 1 / 16 λ is the weakest.

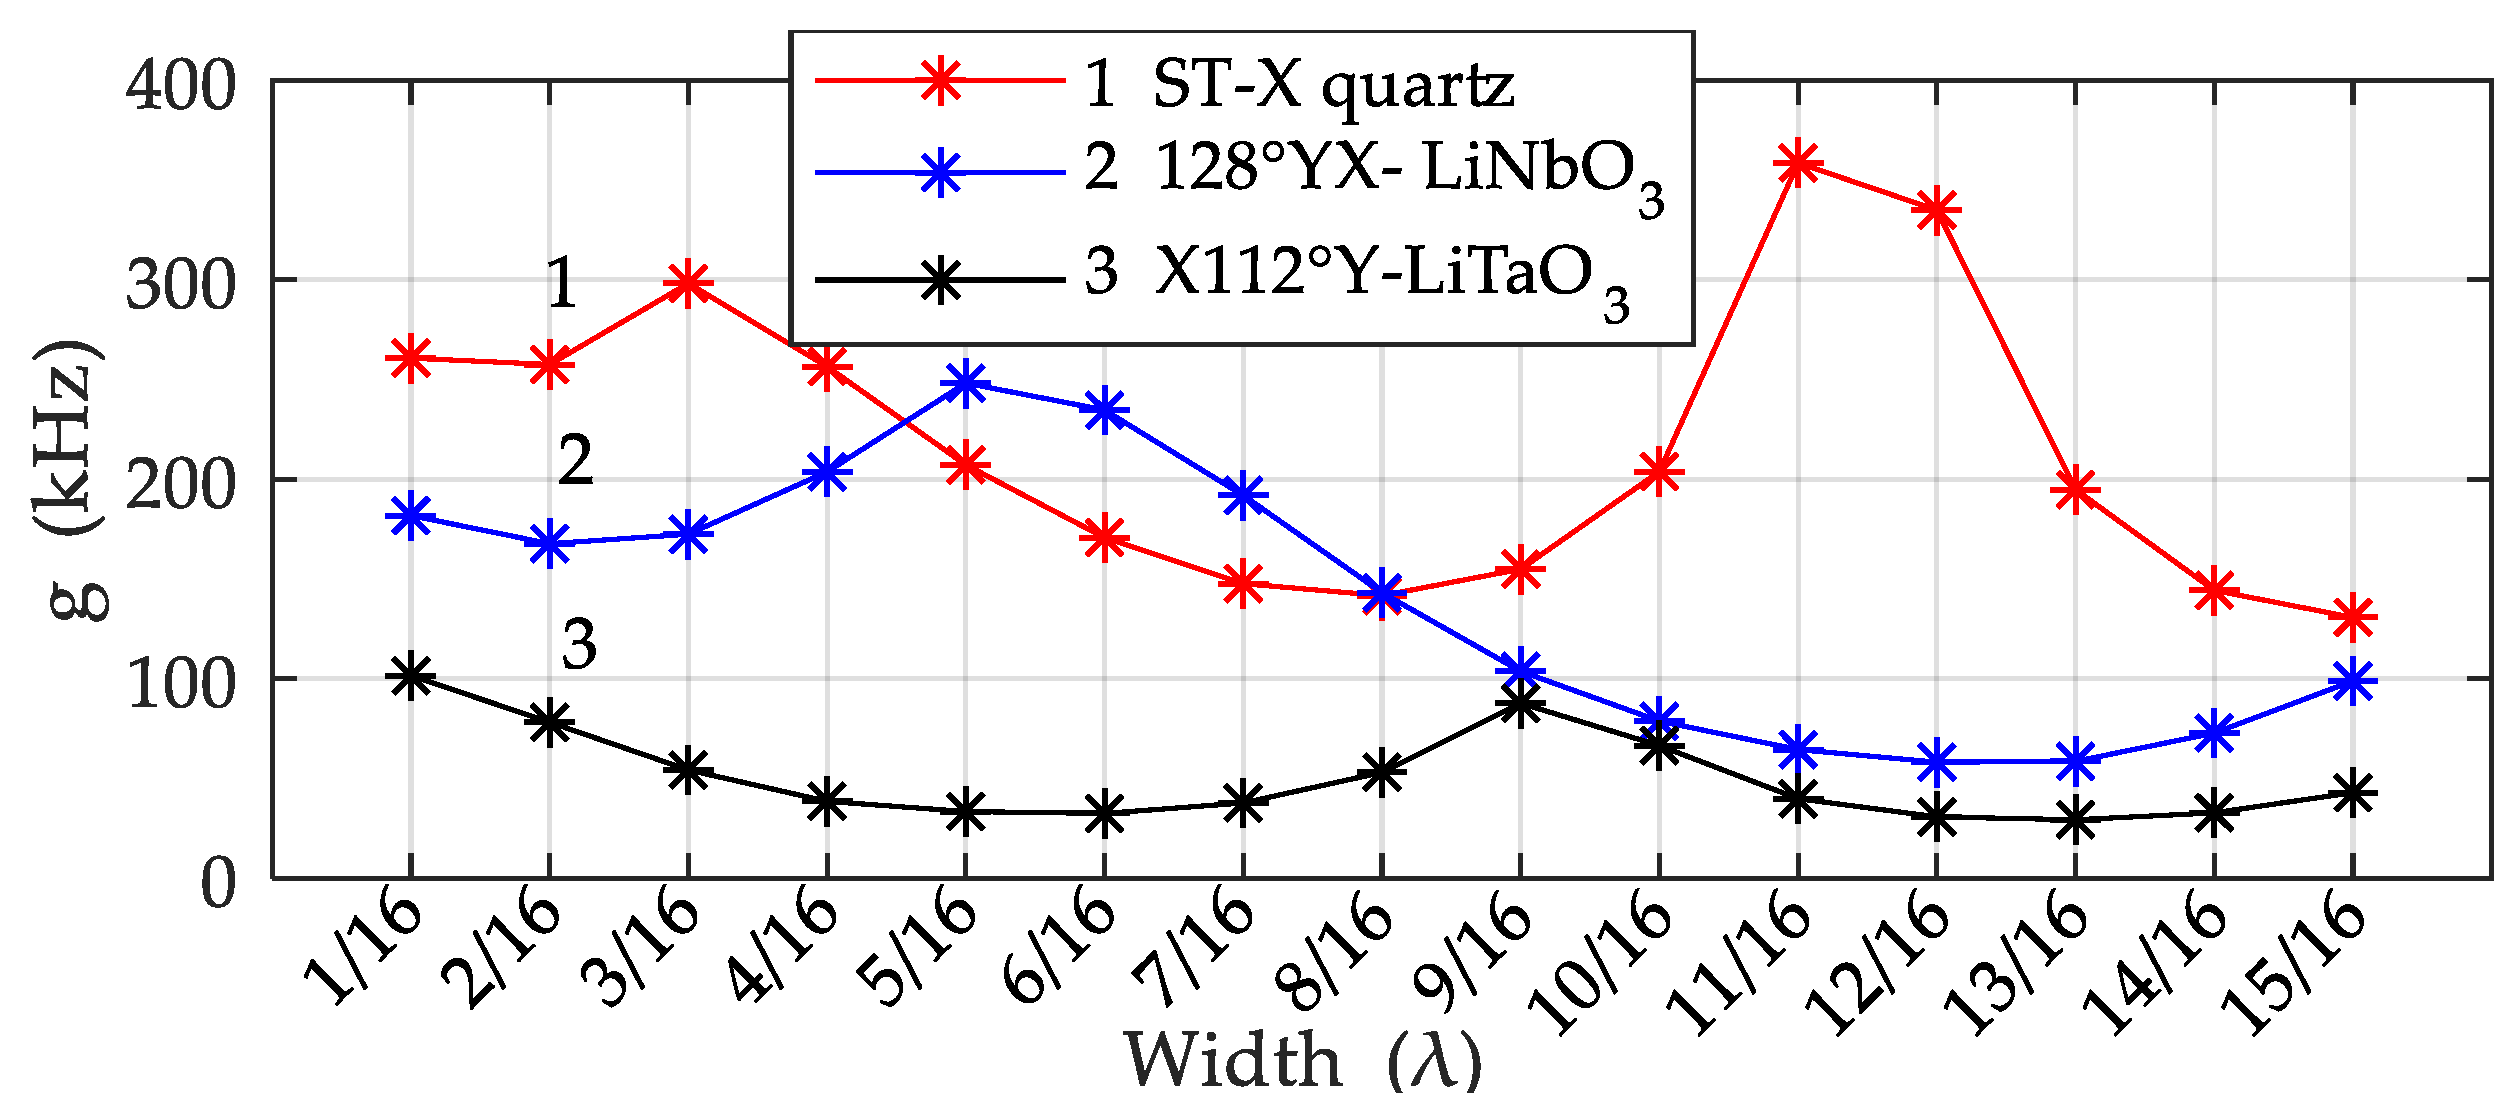
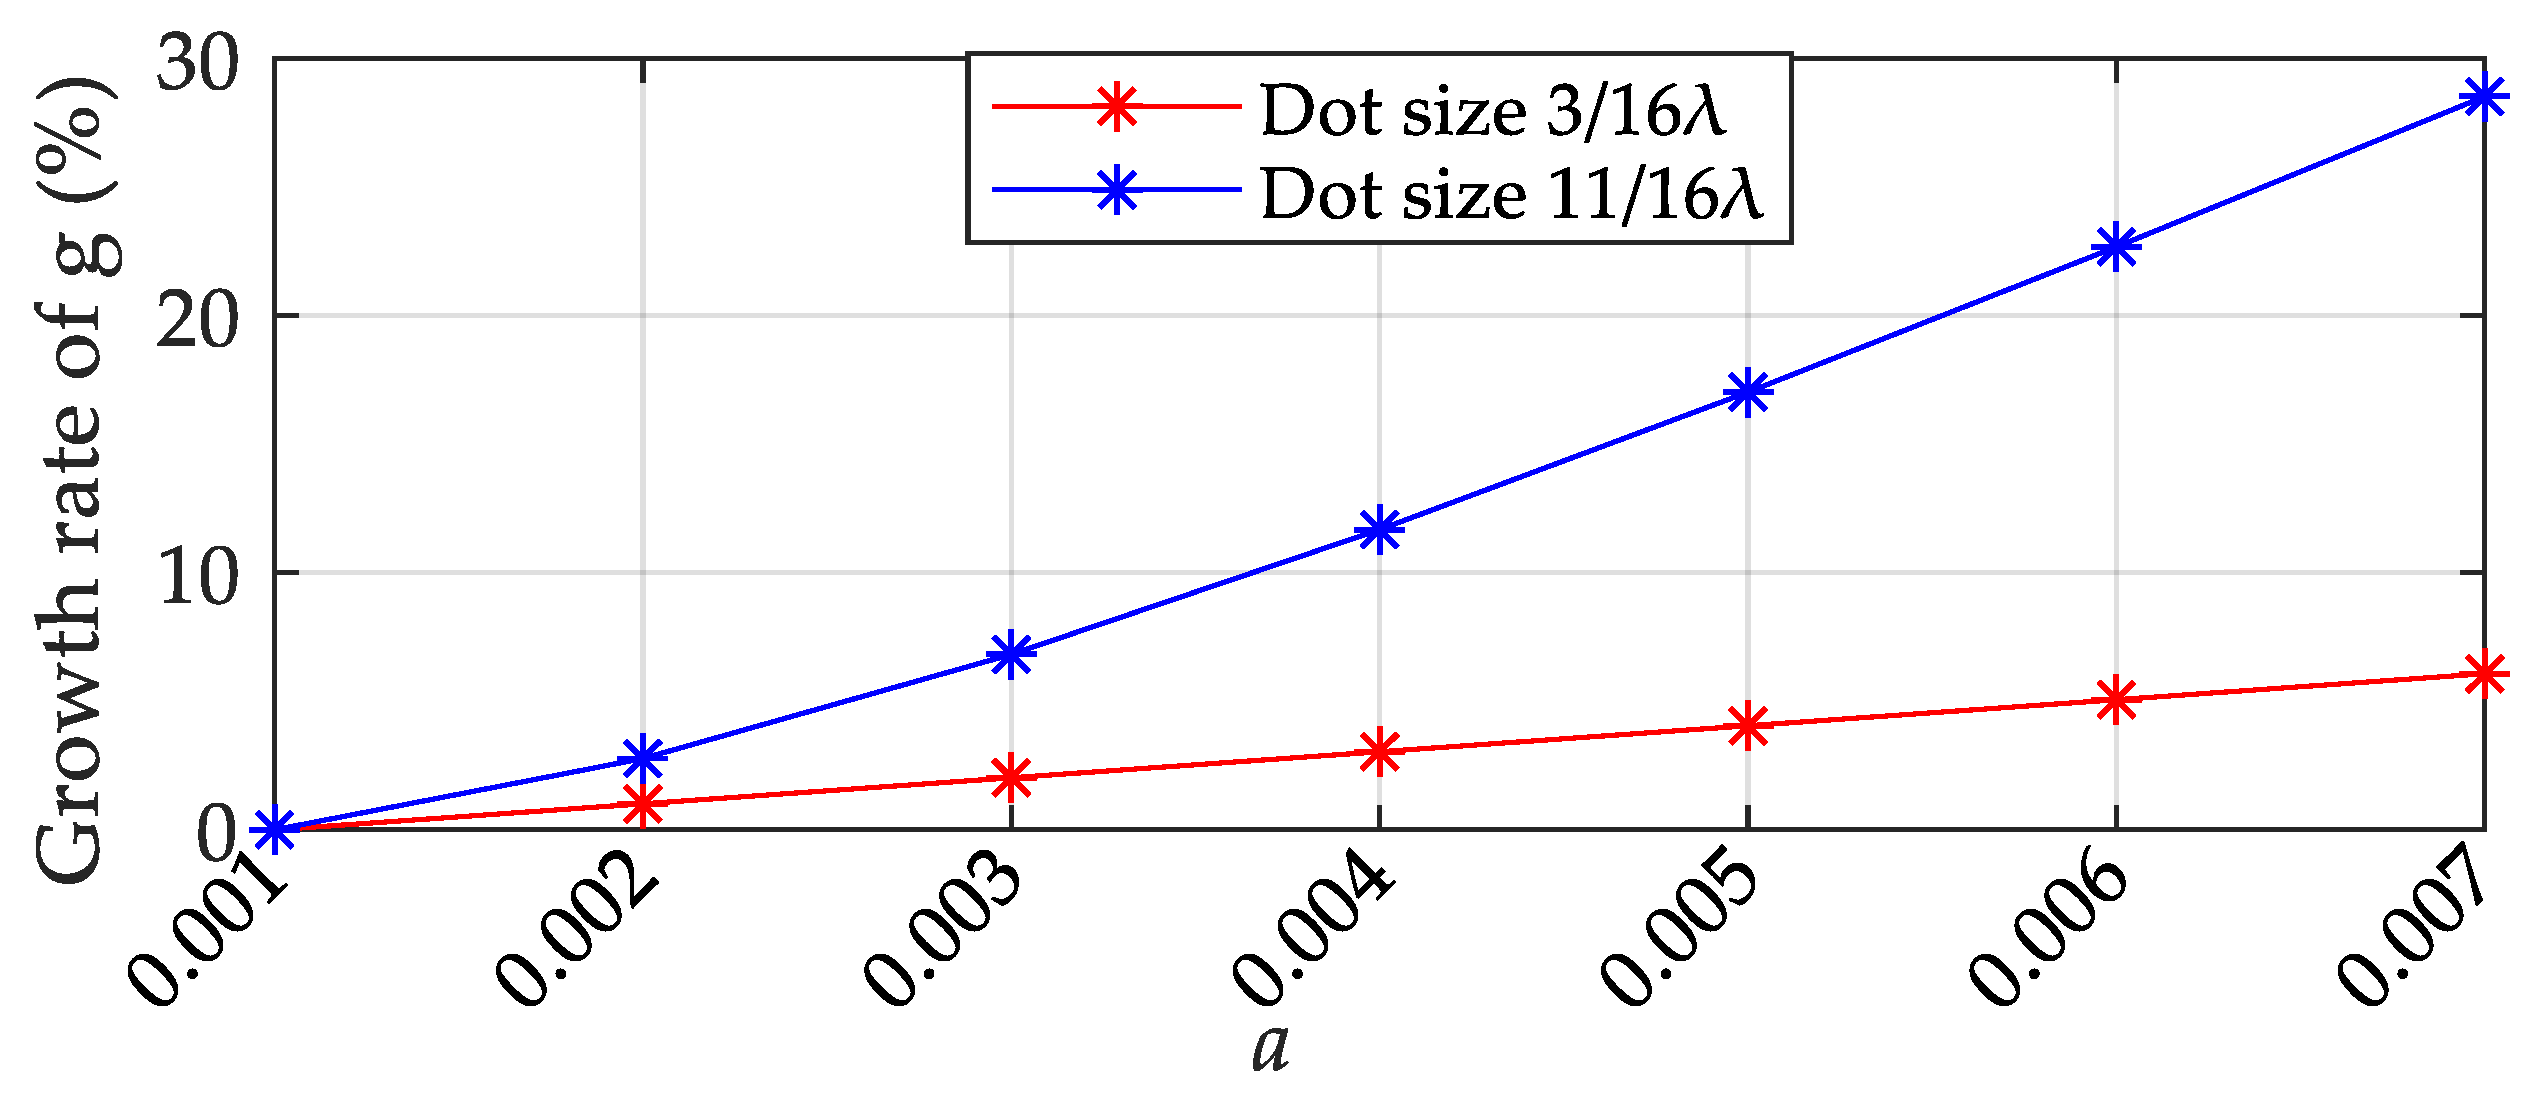
3.2.2. Influence of Rotation Speed on the Distribution Parameters of the Metal Dot Array

Next, it is analyzed whether the change of the rotation speed of the substrate will affect the optimum size of the metal dot array. Increasing the value of a from 1 × 10 3 to 1 × 10 2 to analyze the relationship between the factor g and the ‘width’ of the metal dot on the three substrates at high rotation speed. As shown in Figure 7, the optimum sizes of the metal dot on the 128°YX-LiNbO3 substrate and X112°Y-LiTaO3 substrate do not change with the increase in the rotation speed, and their strongest SAW gyroscopic effect appears when the metal dot size is 5 / 16 λ and 1 / 16 λ , respectively. In contrast, the optimum metal dot size of ST-X quartz has changed from 3 / 16 λ to 11 / 16 λ . Combined with the simulation results in Figure 6 and Figure 7, it can be seen that the optimum metal dot sizes of the 128°YX-LiNbO3 substrate and X112°Y-LiTaO3 substrate are not affected by the rotation speed, while that of ST-X quartz substrates are closely related to the rotation speed of the substrate.

3.2.3. The Relationship between the Metal Dot Array Distribution Parameters and Rotation Speed in a ST-X Quartz Substrate

In order to clarify the relationship between the distribution parameters of the metal dot array and the rotation speed when ST-X quartz is used as the substrate, the growth rates of the SAW gyroscopic effect with the rotation speed when the metal dot size is 3 / 16 λ and 11 / 16 λ , respectively, are calculated based on the SAW gyroscopic effect when a = 1 × 10 3 . The results are shown in Figure 8. With the increase in the rotation speed, the growth rate of the SAW gyroscopic effect at 3 / 16 λ and 11 / 16 λ is obviously different, and the growth rate at 11 / 16 λ is much higher than that at 3 / 16 λ . As shown in Figure 9, when the rotation speed increases to a certain extent, for example, when the value increases from 6 × 10 3 to 7 × 10 3 , the optimum size of the metal dot for the ST-X quartz substrate will change from 3 / 16 λ to 11 / 16 λ , which is also consistent with the conclusion mentioned above that the optimum metal dot size of the ST-X quartz substrate will change with the increase in the rotation speed.
Table 2 lists the strongest SAW gyroscopic effect obtained for three piezoelectric substrates with different characteristics under the condition of matching the optimum metal dot array (i.e., the data obtained from the simulation in Figure 6). Among them are 128°YX-LiNbO3 with a large electromechanical coupling coefficient and ST-X quartz with a temperature coefficient close to zero; both of which show a very strong SAW gyroscopic effect. However, the specific reasons for the superior performance of 128°YX-LiNbO3 and ST-X quartz piezoelectric substrates in angular velocity detection are not clear and require more in-depth study.

4. Conclusions

In this paper, the influence of distributing metal dot array with different sizes on piezoelectric substrates on the intensity of the SAW gyroscopic effect, and the influence of the rotation speed on the optimum size of the metal dot array are discussed. Based on the differential sensing structure, finite element simulation software was used to simulate the optimum metal dot distribution parameters of ST-X quartz, 128°YX-LiNbO3, and X112°Y-LiTaO3 piezoelectric substrates at different rotation speeds, and the relationship between the SAW gyroscopic effect and the rotation speed. The research results provide theoretical support for further development of a high-sensitivity SAW angular velocity sensor.

Author Contributions

Conceptualization, W.W., X.S. and L.M.; methodology, software, and writing, H.C.; data analysis, M.L., X.S., L.M. and H.C.; review, X.S. and L.M.; investigation and validation, H.C. and M.L.; funding acquisition, X.S. and W.W. All authors have read and agreed to the published version of the manuscript.

Funding

This research was supported by the National Natural Science Foundation of China (Grant No. 11804201).

Institutional Review Board Statement

Not applicable.

Informed Consent Statement

Not applicable.

Data Availability Statement

Not applicable.

Conflicts of Interest

The authors declare no conflict of interest.

References

  1. Campbell, C. Surface Acoustic Wave Devices and Their Signal Processing Applications, 1st ed.; Academic Press: San Diego, CA, USA, 1989. [Google Scholar]
  2. Xuan, W.; He, M.; Meng, N.; He, X.; Wang, W.; Chen, J.; Shi, T.; Hasan, T.; Xu, Z.; Xu, Y.; et al. Fast Response and High Sensitivity ZnO/glass Surface Acoustic Wave Humidity Sensors Using Graphene Oxide Sensing Layer. Sci. Rep. 2014, 4, 7206. [Google Scholar] [CrossRef] [PubMed]
  3. Achour, B.; Attia, G.; Zerrouki, C.; Fourati, N.; Raoof, K.; Yaakoubi, N. Simulation/Experiment Confrontation, an Efficient Approach for Sensitive SAW Sensors Design. Sensors 2020, 20, 4994. [Google Scholar] [CrossRef] [PubMed]
  4. Xu, H.; Fu, S.; Su, R.; Shen, J.; Zeng, F.; Song, C.; Pan, F. Enhanced Coupling Coefficient in Dual-Mode ZnO/SiC Surface Acoustic Wave Devices with Partially Etched Piezoelectric Layer. Appl. Sci. 2021, 11, 6383. [Google Scholar] [CrossRef]
  5. Ma, X.; Lei, H.; Cai, P.; Ji, X. Fast Extraction of Coupling of Modes Parameters for Surface Acoustic Wave Devices Using Finite Element Method Based Simulation. Appl. Sci. 2022, 12, 4547. [Google Scholar] [CrossRef]
  6. Woods, R.C.; Kalami, H.; Johnson, B. Evaluation of a novel surface acoustic wave gyroscope. IEEE Trans. Ultrason. Ferroelectr. Freq. Control 2022, 49, 136–141. [Google Scholar] [CrossRef]
  7. Oh, H.; Lee, K.; Yang, S.; Wang, W. Enhanced sensitivity of a surface acoustic wave gyroscope using a progressive wave. J. Micromech. Microeng. 2011, 21, 5015. [Google Scholar] [CrossRef]
  8. Lee, M.; Lee, K. Enhancing the sensitivity of three-axis detectable surface acoustic wave gyroscope by using a floating thin piezoelectric membrane. Jpn. J. Appl. Phys. 2017, 56, 06GN14. [Google Scholar] [CrossRef]
  9. Sun, X.; Liu, W.; Ge, S.; Zhou, S.; Li, X.; Li, D. Achieving both high electromechanical response and stable temperature behavior in Si/SiO2/Al/LiTaO3 sandwich structure. AIP Adv. 2019, 9, 035145. [Google Scholar] [CrossRef]
  10. Sun, X.; Ge, S.; Shao, X.; Zhou, S.; Wang, W.; Lin, D.; Liu, W. Analysis and Design of Single-Phase Unidirectional Transducers with High Directivity. Appl. Sci. 2021, 11, 7500. [Google Scholar] [CrossRef]
  11. Sun, X.; Liu, W.; Shao, X.; Zhou, S.; Wang, W.; Lin, D. Surface Acoustic Wave Gyroscopic Effect in an Interdigital Transducer. Sensors 2019, 19, 106. [Google Scholar] [CrossRef]
  12. Shen, J.; Fu, S.; Su, R.; Xu, H.; Lu, Z.; Xu, Z.; Luo, J.; Zeng, F.; Song, C.; Wang, W.; et al. High-Performance Surface Acoustic Wave Devices Using LiNbO3/SiO2/SiC Multilayered Substrates. IEEE Trans. Microw. Theory Tech. 2021, 69, 3693–3705. [Google Scholar] [CrossRef]
  13. Wang, W.; Shao, X.; Liu, X.; Liu, J.; He, S. Enhanced Sensitivity of Surface Acoustic Wave-Based Rate Sensors Incorporating Metallic Dot Arrays. Sensors 2014, 14, 3908–3920. [Google Scholar] [CrossRef]
  14. Xu, F.; Wang, W.; Shao, X.; Liu, X.; Liang, Y. Optimization of Surface Acoustic Wave-Based Rate Sensors. Sensors 2015, 15, 25761–25773. [Google Scholar] [CrossRef]
  15. Mandal, D.; Banerjee, S. Surface Acoustic Wave (SAW) Sensors: Physics, Materials, and Applications. Sensors 2022, 22, 820. [Google Scholar] [CrossRef]
  16. Sun, Y.; Jia, Y.; Zhang, Y.; Cheng, L.; Liang, Y.; Wang, W. Enhanced Sensitivity of FeGa Thin-Film Coated SAW Current Sensor. Appl. Sci. 2021, 11, 11726. [Google Scholar] [CrossRef]
  17. Borrero, G.A.; Bravo, J.P.; Mora, S.F.; Velásquez, S.; Segura-Quijano, F.E. Design and fabrication of SAW pressure, temperature and impedance sensors using novel multiphysics simulation models. Sens. Actuators A Phys. 2013, 203, 204–214. [Google Scholar] [CrossRef]
  18. Ma, R.; Liu, W.; Sun, X.; Zhou, S.; Lin, D. FEM Simulation of a High-Performance 128°Y–X LiNbO3/SiO2/Si Functional Substrate for Surface Acoustic Wave Gyroscopes. Micromachines 2022, 13, 202. [Google Scholar] [CrossRef]
  19. Kovacs, G.; Anhorn, M.; Engan, H.E.; Visintini, G.; Ruppel, C.C.W. Improved material constants for LiNbO3 and LiTaO3. In Proceedings of the IEEE Ultrasonics Symposium, Honolulu, HI, USA, 4–7 December 1990; pp. 435–438. [Google Scholar]
  20. Kushibiki, J.; Takanaga, I.; Arakawa, M.; Sannomiya, T. Accurate measurements of the acoustical physical constants of LiNbO3 and LiTaO3 single crystals. IEEE Trans. Ultrason. Ferroelectr. Freq. Control 1999, 46, 1315–1323. [Google Scholar] [CrossRef]
  21. Tomar, M.; Gupta, V.; Mansingh, A.; Sreenivas, K. Temperature stability of c-axis oriented LiNbO3/SiO2/Si thin film layered structures. J. Phys. D Appl. Phys. 2001, 34, 2267. [Google Scholar] [CrossRef]
  22. Bechmann, R.; Ballato, D.; Lukaszek, T.J. Higher-Order Temperature Coefficients of the Elastic Stiffinesses and Compliances of Alpha-Quartz. Proc. IRE 1962, 50, 1812–1822. [Google Scholar] [CrossRef]
  23. Nelsa Abraham, R.; Reshma Krishnakumar, C.; Unni, D.P. Simulation studies on the responses of ZnO-CuO/CNT nanocomposite based SAW sensor to various volatile organic chemicals. J. Sci. Adv. Mater. Devices 2019, 4, 125–131. [Google Scholar] [CrossRef]
  24. Ge, F.; Zhao, L.; Zhang, Y. Design and Optimization of a Novel SAW Gyroscope Structure Based on Amplitude Modulation with 1-D Phononic Crystals. Micromachines 2021, 12, 1485. [Google Scholar] [CrossRef]
  25. Shevchenko, S.Y.; Kukaev, A.S.; Yakubovskaya, G.V. Features of surface acoustic wave delay line simulation in inertial space. In Proceedings of the 2018 IEEE Conference of Russian Young Researchers in Electrical and Electronic Engineering (EIConRus), Moscow/St. Petersburg, Russia, 29 January–1 February 2018; pp. 544–548. [Google Scholar]
  26. Hu, F.; Cheng, L.; Fan, S.; He, X.; Xue, X.; Liang, Y.; Lu, M.; Wang, W. Enhanced Sensitivity of Wireless and Passive SAW-Based Strain Sensor with a Differential Structure. IEEE Sens. J. 2021, 21, 23911–23916. [Google Scholar] [CrossRef]
  27. Hu, S.M.; Hu, Y.F.; Cao, X.S.; Tian, S.M. Gyro Effect on Surface Acoustic Wave Propagation in A Piezoelectric Layered Structure. In Proceedings of the 2019 14th Symposium on Piezoelectrcity, Acoustic Waves and Device Applications (SPAWDA), Shijiazhuang, China, 1–4 November 2019; pp. 1–5. [Google Scholar]
  28. Zhou, Y.H.; Jiang, Q. Effects of Coriolis force and centrifugal force on acoustic waves propagating along the surface of a piezoelectric half-space. Z. Angew. Math. Phys. 2001, 52, 950–965. [Google Scholar] [CrossRef]
  29. Wang, W.; Xu, F.; He, S.; Li, S.; Lee, K. A New Micro-rate Sensor Based on Shear Horizontal Surface Acoustic Wave Gyroscopic Effect. Jpn. J. Appl. Phys. 2010, 49, 9R. [Google Scholar] [CrossRef]
  30. Han, W.; Bu, X.; Cao, Y.; Xu, M. SAW Torque Sensor Gyroscopic Effect Compensation by Least Squares Support Vector Machine Algorithm Based on Chaos Estimation of Distributed Algorithm. Sensors 2019, 19, 2768. [Google Scholar] [CrossRef]
  31. Biryukov, S.V.; Schmidt, H.; Weihnacht, M. Gyroscopic effect for SAW in common piezoelectric crystals. In Proceedings of the 2009 IEEE International Ultrasonics Symposium, Rome, Italy, 20–23 September 2009; pp. 2133–2136. [Google Scholar]
  32. Lukyanov, D.; Shevchenko, S.; Kukaev, A. Micro rate gyroscopes based on surface acoustic waves. In Proceedings of the 2014 Symposium on Piezoelectricity, Acoustic Waves, and Device Applications, Beijing, China, 30 October–2 November 2014; pp. 14–17. [Google Scholar]
  33. Shen, W.; Li, D.; Zhang, S.; Ou, J. Analysis of wave motion in one-dimensional structures through fast-Fourier-transform-based wavelet finite element method. J. Sound Vib. 2017, 400, 369–386. [Google Scholar] [CrossRef]
  34. Lukyanov, D.P.; Filatov, Y.V.; Shevchenko, S.Y.; Shevelko, M.M.; Peregudov, A.N.; Kukaev, A.S.; Safronov, D.V. State of the art and prospects for the development of SAW-based solid-state gyros. Gyroscopy Navig. 2011, 2, 214. [Google Scholar] [CrossRef]
  35. Koskela, J.; Plessky, V.; Maniadis, P.; Turner, P.; Willemsen, B. Rapid 2D FEM simulation of advanced SAW devices. In Proceedings of the 2017 IEEE MTT-S International Microwave Symposium (IMS), Honololu, HI, USA, 4–9 June 2017; pp. 1484–1486. [Google Scholar]
  36. Salim, Z.T.; Hashim, U.; Arshad, M.K.M. FEM modeling and simulation of a layered SAW device based on ZnO/128° YX LiNbO3. In Proceedings of the 2016 IEEE International Conference on Semiconductor Electronics (ICSE), Kuala Lumpur, Malaysia, 17–19 August 2016; pp. 5–8. [Google Scholar]
  37. Martinez, S.M.; Vera, J.E.; Molina, F.B.; Chaverra, J.F. Design and Characterization of a SAW Pressure Sensor on ST Quartz Using a Multiphysic Model. In Proceedings of the 2021 IEEE XXVIII International Conference on Electronics, Electrical Engineering and Computing (INTERCON), Lima, Peru, 5–7 August 2021; pp. 1–4. [Google Scholar]
  38. Maouhoub, S.; Aoura, Y.; Mir, A. FEM simulation of AlN thin layers on diamond substrates for high frequency SAW devices. Diam. Relat. Mater. 2016, 62, 7–13. [Google Scholar] [CrossRef]
  39. Luo, J.; He, C.; Mao, R. Gas Sensor Based on Surface Acoustic Waves Using Zinc Oxide Piezoelectric Thin Films. In Proceedings of the 2019 3rd International Conference on Circuits, System and Simulation (ICCSS), Nanjing, China, 13–15 June 2019; pp. 50–53. [Google Scholar]
  40. Yamada, K.; Takemura, H.; Inoue, Y.; Omi, T.; Matsumura, S. Effect of Li/Nb Ratio on the SAW Velocity of 128°Y–X LiNbO3 Wafers. Jpn. J. Appl. Phys. 1987, 26, 219. [Google Scholar] [CrossRef]
  41. Zhang, Y.; Jin, J.; Li, H.; Hu, H. A Novel Method to Extract COM Parameters for SAW Based on FEM. In Proceedings of the 2019 13th Symposium on Piezoelectrcity, Acoustic Waves and Device Applications (SPAWDA), Harbin, China, 11–14 January 2019; pp. 1–5. [Google Scholar]
  42. An, Y.; Hao, W.; Liu, J.; He, S. Effect of electrode width on the sensitivity of the surface acoustic wave detector in a GC/SAW. In Proceedings of the 2017 Symposium on Piezoelectricity, Acoustic Waves, and Device Applications (SPAWDA), Chengdu, China, 27–30 October 2017; pp. 139–141. [Google Scholar]
  43. Belkhelfa, N.; Serhane, R. Silicon SAW parameters extraction and optimization using finite elements analysis. In Proceedings of the 2019 International Conference on Advanced Electrical Engineering (ICAEE), Algiers, Algeria, 19–21 November 2019; pp. 1–5. [Google Scholar]
  44. Mishra, D.; Singh, A. Sensitivity of a surface acoustic wave based gas sensor: Design and simulation. In Proceedings of the 2015 International Conference on Soft Computing Techniques and Implementations (ICSCTI), Faridabad, India, 8–10 October 2015; pp. 1–5. [Google Scholar]
  45. Herasymenko, D.O.; Zhovnir, M.F.; Pysarenko, L.D. Angular Velocity Transducer with Ring Resonator of Surface Acoustic Waves. In Proceedings of the 2018 IEEE 38th International Conference on Electronics and Nanotechnology (ELNANO), Kyiv, Ukraine, 24–26 April 2018; pp. 734–738. [Google Scholar]
Figure 1. Schematic of the gyroscopic effect on the Rayleigh wave.
Applsci 12 08062 g001
Figure 2. SAW sensor structure.
Applsci 12 08062 g002
Figure 3. Solve object.
Applsci 12 08062 g003
Figure 4. A 3D model of the single-period structure.
Applsci 12 08062 g004
Figure 5. Displacement distribution of the SAW: (a) symmetric mode; (b) anti-symmetric model.
Applsci 12 08062 g005
Figure 6. SAW gyroscopic effects of three piezoelectric substrates when a = 1 × 10 3 .
Applsci 12 08062 g006
Figure 7. SAW gyroscopic effects of three piezoelectric substrates when a = 1 × 10 2 .
Applsci 12 08062 g007
Figure 8. Growth rate of the SAW gyroscopic effect at points 3 / 16 λ and 11 / 16 λ .
Applsci 12 08062 g008
Figure 9. The influence of a value from 6 × 10 3 to 7 × 10 3 on the SAW gyroscopic effect.
Applsci 12 08062 g009
Table 1. Material parameters used in FEM simulations [19,20,21].
Material ConstantsMaterials
128°YX-LiNbO3X112°Y-LiTaO3ST−X QuartzCu
SAW typeRSAWRSAWRSAW
Euler angle(0°, 37.86°, 0°)(90°, 90°, 112.2°)(0°, 132.75°, 0°)
κ 2 (%)5.40.710.11
TCF (ppm/°C)−72−18.20
Stiffness constants (1011 N/m2)
C 11 1.982.320.871.77
C 12 0.540.460.071.24
C 13 0.650.830.12
C 14 0.07−0.11−0.18
C 33 2.272.751.07
C 44 0.590.950.580.82
Piezoelectric constants (C/m2)
e x 1 0.171
e x 4 −0.0436
e x 5 3.692.64
e y 2 2.421.86
e z 1 0.30−0.22
e z 3 1.771.71
e z 6 0.14
Dielectric constants (10−12 F/m)
ε 11 45.6 × ε 0 40.9 × ε 0 4.5 × ε 0
ε 33 26.3 × ε 0 42.5 × ε 0 4.6 × ε 0
ε 0 8.8548.8548.854
Table 2. SAW gyroscopic effect of different piezoelectric substrates.
a Piezoelectric SubstrateWidth κ 2
(%)
TCF
(ppm/°C)
g
1 × 10 3 ST-X Quartz 3 / 16 λ 0.11029.5 kHz
128°YX-LiNbO3 5 / 16 λ 5.4−7222.4 kHz
X112°Y-LiTaO3 1 / 16 λ 0.71−18.25.2 kHz
Publisher’s Note: MDPI stays neutral with regard to jurisdictional claims in published maps and institutional affiliations.

