Article

The Recommendation of the Rural Ecological Civilization Pattern Based on Geographic Data Argumentation

1
School of Computer Science, Nanjing University of Posts and Telecommunications, Nanjing 210023, China
2
Jiangsu Key Laboratory of Big Data Security & Intelligent Processing, Nanjing University of Posts and Telecommunications, Nanjing 210023, China
3
Institute of Geographical Sciences and Natural Resources Research, Chinese Academy of Sciences, Beijing 100101, China
*
Authors to whom correspondence should be addressed.
Appl. Sci. 2022, 12(16), 8024; https://doi.org/10.3390/app12168024
Submission received: 12 July 2022 / Revised: 3 August 2022 / Accepted: 8 August 2022 / Published: 10 August 2022

Abstract

:
For any rural area, a suitable ecological civilization model is of great significance and must be recommended taking into account its natural, social, and cultural characteristics so that the model is conducive to the sustainable development of its economy, environment, and industrial structure. However, the rural attribute data required for such a recommendation are often missing, and the data sparsity leads to the low accuracy of and poor training effect issues in recommendation algorithms. To address this issue, this paper proposes a geographic data augmentation method, namely the spatial factor on generative adversarial networks (S-GANs), which combines the generative adversarial network (GAN) with the Third Law of Geography. Specifically, the GAN is used to generate data for the rural ecological civilization recommender system, while the Third Law of Geography is used to ensure that the generated data conform to the real geographical environment. To test the effectiveness of the S-GAN method, the experiment used the enhanced rural attribute data as the input of three recommendation systems: RippleNet, KGCN, and KGNN-LS. Compared with the data before argumentation, the recommendation accuracy increased by 55.49%, 25.12%, and 27.14% in RippleNet, KGCN, and KGNN-LS, respectively. The experimental results show that the S-GAN is effective in geographic data argumentation for recommendation and is expected to be widely used in other geographic data argumentation fields.

1. Introduction

The rural ecological civilization pattern plays an important guiding role in developing rural areas. By analyzing the rural areas that have developed successfully, people can summarize the characteristics of different ecological civilization development models, which can be used as references for the development of other rural areas. In other words, advanced ecological civilization development models can be recommended for developing areas that have similar natural conditions. With the development of artificial intelligence and deep learning models, it is now possible to use similar natural conditions as features in a recommendation system. Using such a system to recommend the development model of rural ecological civilization is also a feasible solution.
The current mainstream recommendation algorithms are based on collaborative filtering. The algorithms use the historical feedback data of users to mine the correlation between users and items and make recommendations [1], such as the SVD model [2]. Although these recommendation algorithms are relatively simple in terms of the calculation, data sparsity is a common problem in many scenarios. Some researchers construct recommender systems based on knowledge graphs [3,4]. As a directed heterogeneous information network, a knowledge graph contains many entities and relation information that can be used as effective auxiliary information to enrich the representation between entities [5,6]. Relevant studies have shown that, compared with that of traditional recommendation systems, the performance of knowledge-graph-based recommendation systems has improved to some extent in some application scenarios [4,7,8]. However, unlike the case of recommending movies, music, news, etc., the performance of such systems is still not satisfactory when it comes to recommending rural ecological civilization patterns. This is because many rural areas lack relevant statistical data, such as the cultivated area, the road network density, and forest coverage, which cannot be supplemented by knowledge graphs, leading to the “cold start” problem.
Therefore, generative adversarial networks (GANs) [9] are introduced to enhance the original dataset and improve the performance of the recommendation system. A GAN is based on the idea of game theory and confrontation and learns data distribution, which does not rely on any prior assumptions and generates samples in a relatively simple way [10,11,12]. However, unlike image data argumentation, geographic data argumentation needs to follow the Third Law of Geography [13], i.e., the more similar the geographical environment, the closer the geographical features, and so a GAN cannot be directly used to enhance rural geographic data to cope with the problem of a cold start. In the application scenarios studied in this paper, this similarity is mainly reflected in the villages with similar geographical locations. The geographical environment characteristics are similar, and the ecological civilization models are similar. Related works are described in detail in Section 2.
In this paper, we investigate the problem of recommending rural ecological civilization patterns. Our design objective is to solve the problems of sparsity and a cold start in geographic data. Inspired by the GAN and the Third Law of Geography, we propose a method for recommending rural ecological civilization patterns based on geographic data argumentation. Its core idea is to analyze the digital features of each geographic element of the sample under the same pattern and generate objective geographic data based on these features; and then, these data and the original data are sent to the recommender system. Specifically, we build a generative adversarial network (spatial factors on generative adversarial networks) that incorporates spatial factors, namely the S-GAN method. The network is theoretically supported by the Third Law of Geography and can generate data in batches that conform to the real geographical environment. The main work and contributions of this paper are as follows:
(1) To address the sparsity of rural geographic data, a geographical data argumentation method based on generative adversarial networks is proposed that can generate rich data presented in the form of knowledge graphs of the rural ecological civilization.
(2) To address the problem of a cold start and generate high-quality data, this method combines the Third Law of Geography with generative adversarial networks, which can more accurately analyze the characteristics of relevant geographical elements and generate data that conform to the real geographical environment according to these characteristics.
(3) To significantly improve the performance of multiple recommendation systems using our enhanced data.
(4) To combine, for the first time, the GAN with the recommendation of the rural ecological civilization pattern, which also has certain reference significance in other related geographical issues. To facilitate researchers to better use and improve this method, we will publish the source code and dataset used in this study (https://github.com/Jenson2525/S-GAN, accessed on 24 June 2022).

2. Related Work

2.1. The Recommendation of the Rural Ecological Civilization Pattern

The ecological civilization model is a new and more advanced civilization form of human society following primitive civilization, agricultural civilization, and industrial civilization. Relevant studies [14,15,16] have shown that the fundamental difference between the ecological civilization model and the industrial civilization is the difference in the value orientation of the relationship between man and nature, as well as the difference in production, lifestyle, and institutional systems determined and derived from it. The rural ecological civilization pattern determines the development direction of the countryside to a certain extent. So personalized recommendation based on the geographical characteristics of the village is a more promising research direction.
The traditional recommendation is to mainly follow some development suggestions of the government expert consultants who conduct research on the villages. This method is time consuming, labor intensive, and highly subjective. With the development of artificial intelligence technology, relevant recommendation algorithms can more accurately capture the characteristics of objects and make recommendations. Therefore, it is a more appropriate choice to use the machine learning method to recommend the rural ecological civilization pattern.
The current recommendation algorithms are mainly divided into three categories: content-based recommendation algorithms, collaborative-filtering-based recommendation algorithms, and hybrid recommendation algorithms [5,17]. Among these, the most widely used is the one based on collaborative filtering, which uses the user’s historical behavioral preferences for modeling [18]. Although such methods are effective and ubiquitous, there are still some problems, mainly the sparsity of user behavior data and the cold-start problem. To this end, some relevant researchers have introduced knowledge graphs to build recommendation algorithms. As a heterogeneous information network [19,20,21,22], a knowledge graph contains many entities and relationship information between entities. In many application scenarios, recommendation algorithms based on knowledge graphs perform better than collaborative filtering recommendation algorithms [4,7,23,24,25].
However, when recommending the rural ecological civilization pattern, the main problem encountered is the data sparsity, that is, the rural attribute data required for the recommendation (for example, the gross regional product, the cultivated land area, and forest coverage) are often missing. Therefore, the accuracy of the recommendation algorithm is not high and the training effect is not ideal.

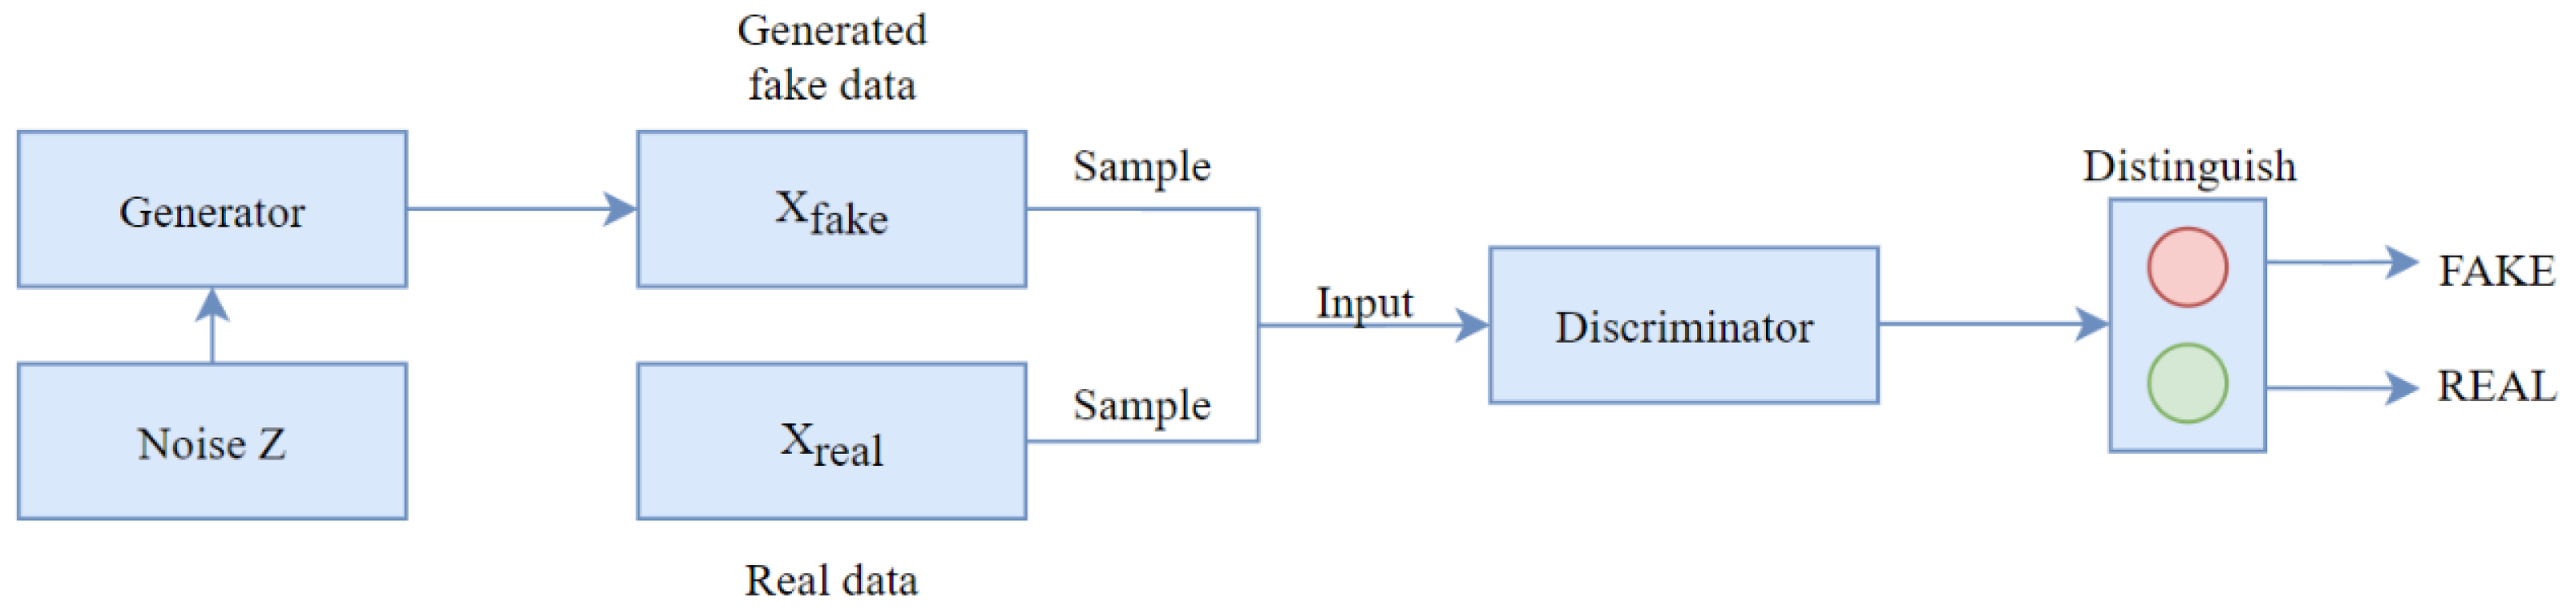
2.2. The Data Argumentation Based on the GAN

Data augmentation is effective for expanding the scale of data and has been widely used in image processing, natural language processing, and other fields. Data augmentation can enrich the dataset itself and improve the generalization performance of the model. According to the different ways of data augmentation, current data augmentation techniques can be divided into supervised and unsupervised data augmentation. Supervised data argumentation mainly includes single-sample data argumentation techniques (such as the geometric transformation of rotation, cropping, and color transformation) and multi-sample data argumentation techniques (such as SMOTE, SamplePairing, and Mixup) [26,27]. Data augmentation techniques are mainly based on deep learning, such as generative adversarial networks (GANs) [9,28].
In view of geographic data sparsity, it is necessary to choose an appropriate data argumentation method. The single-sample data argumentation technology is relatively straightforward. However, this method causes inconsistencies with the distribution of the original data. Multi-sample data argumentation techniques, such as the Mixup algorithm based on linear interpolation, although simple to implement, can only be effective when the data distribution exhibits a linear law. However, most of the geographic data present the characteristics of nonlinear distribution, and it is difficult to achieve good results using this method [22]. A generative adversarial network is a data augmentation technology based on deep learning and can solve the above two problems.
The theory of the generative adversarial network comes from the two-person zero-sum game in game theory [9], and its structure is shown in Figure 1. The network has a generator (denoted by G) and a discriminator (denoted by D), where neural networks are used. The role of the generator is to capture and learn the distribution of sample data, and the role of the discriminator is to judge data authenticity. There are no mandatory restrictions on the choice of the two models. The task of G is to generate a sample Xfake that is as close to the real distribution as possible, and its input is random noise Z. D is a binary classifier whose task is to judge the authenticity of the data for its input, a generated sample Xfake and real data Xreal. G and D are independent of each other and are alternately iteratively trained. Eventually, the data generated by G become so close to the real data that D cannot tell whether the samples it inputs are generated data or real data.
The training process of the GAN is a min–max game, which means that D will minimize the errors when discriminating between true and false data and G will maximize the probability of D’s discriminating errors. Therefore, in the actual training process, D will sample from the real data x and the data G(z) generated by G. Then, D will bring the probability as close to 1 as possible when determining x as real data and bring the probability as close to 0 as possible when determining x as fake data.
At the beginning of training, due to poor performance, G does not generate good data samples, so D is easily judged to be false. However, it will become increasingly accurate because with the existence of D, G can learn to approximate the real data samples without a lot of prior knowledge and prior distribution and finally generate samples that are realistic enough to be similar to the true data.

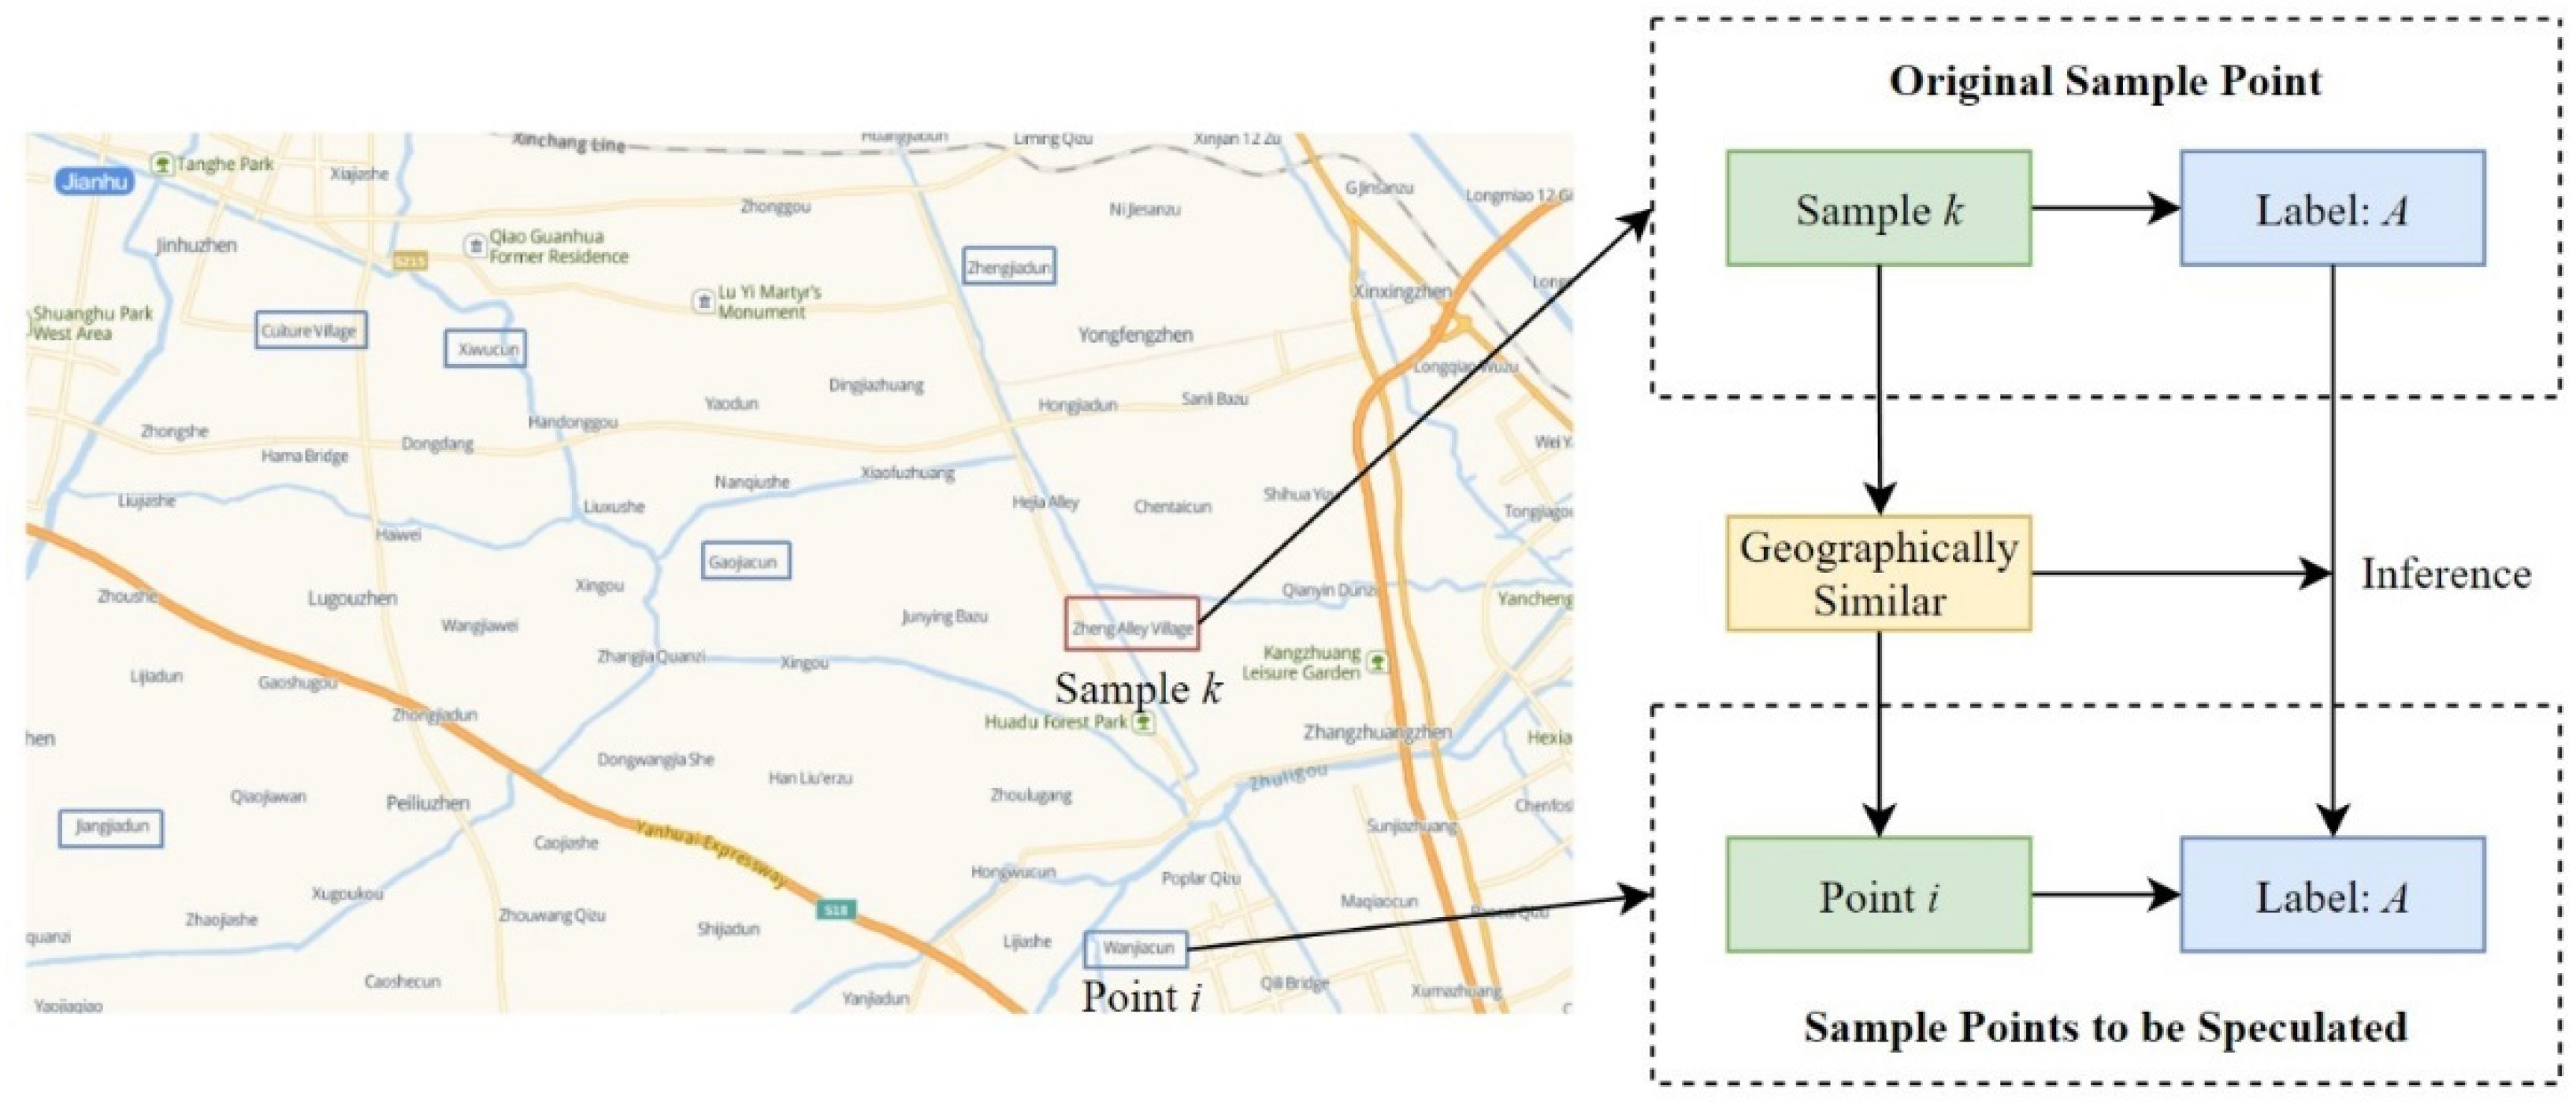
2.3. Third Law of Geography

The key to data argumentation for a rural ecological civilization pattern is how to accurately generate geographically relevant real data. Data generation in the real space cannot be completed only by statistical simulation, and the authenticity of the real spatial factors need to be considered. Therefore, the main problem of geographic data argumentation is how to consider the real spatial characteristics of the data in the process of argumentation, which is about data quality. The Third Law of Geography provides ideas for solving this problem.
The Third Law of Geography, also known as the Law of Geographical Similarity, was discovered and proposed by Zhu et al. and states that “the more similar the geographical environment, the more similar the geographical features” [13]. The similarity here refers to the comprehensive similarity of two points in space in terms of the geographical environment features (including spatial and non-spatial elements). Two factors need to be noted here:
(1) The two points are not necessarily connected in space. In the application scenario studied in this paper, two administrative villages with the same ecological civilization model are not necessarily adjacent to each other. For example, Hancunhe Village is located in Fangshan, Beijing, while Yangjiayao Village is located in Nanjiao, Datong, Shanxi. However, the two villages have the same ecological civilization model; both belong to the industrial development type.
(2) Geographical environment features refer to the features of the geographic variables we are targeting. In the application scenarios studied in this paper, our target geographical variable is the rural ecological civilization pattern. Then, the geographical environment is composed of geographical elements related to the ecological civilization model, including natural elements (latitude and longitude, climate, water area, vegetation coverage index, etc.) and human elements (districts and cities, population, administrative area, GDP, etc.).
Inspired by the Third Law of Geography, we consider that villages under the same ecological civilization model have similar geographical environments and characteristics. This study intends to use the idea of geographical similarity and introduce spatial factors to solve the problem of geospatial data generation in the GAN so that the GAN can consider the real spatial characteristics of the data and improve the authenticity of the generated data.

3. Data Augmentation Method Based on the GAN

Different from traditional image data argumentation, geographic data argumentation needs to follow certain rules so that the generated geographic data samples are realistic enough to improve the effect of the recommendation. In this section, we introduce a generative-adversarial-network-based approach to geographic data augmentation, namely the S-GAN.

3.1. The Data Structure of the S-GAN

The data structure of the S-GAN includes a sample point and a sample attribute. A sample point refers to a point located in a certain geographic location (latitude and longitude) in space. A sample attribute refers to various geographic features contained in a sample point, including climate, latitude and longitude, and population. The data of each attribute of a sample point are called sample attribute data. The structure of a data sample of the S-GAN is shown in Table 1. The first column displays the sample point, and the other columns are the values of the attribute data of each sample.
New sample points need to be generated according to their longitude and latitude. Therefore, in the dataset, the sample points must contain the latitude and longitude attributes and must correspond to the values of the latitude and longitude coordinates.

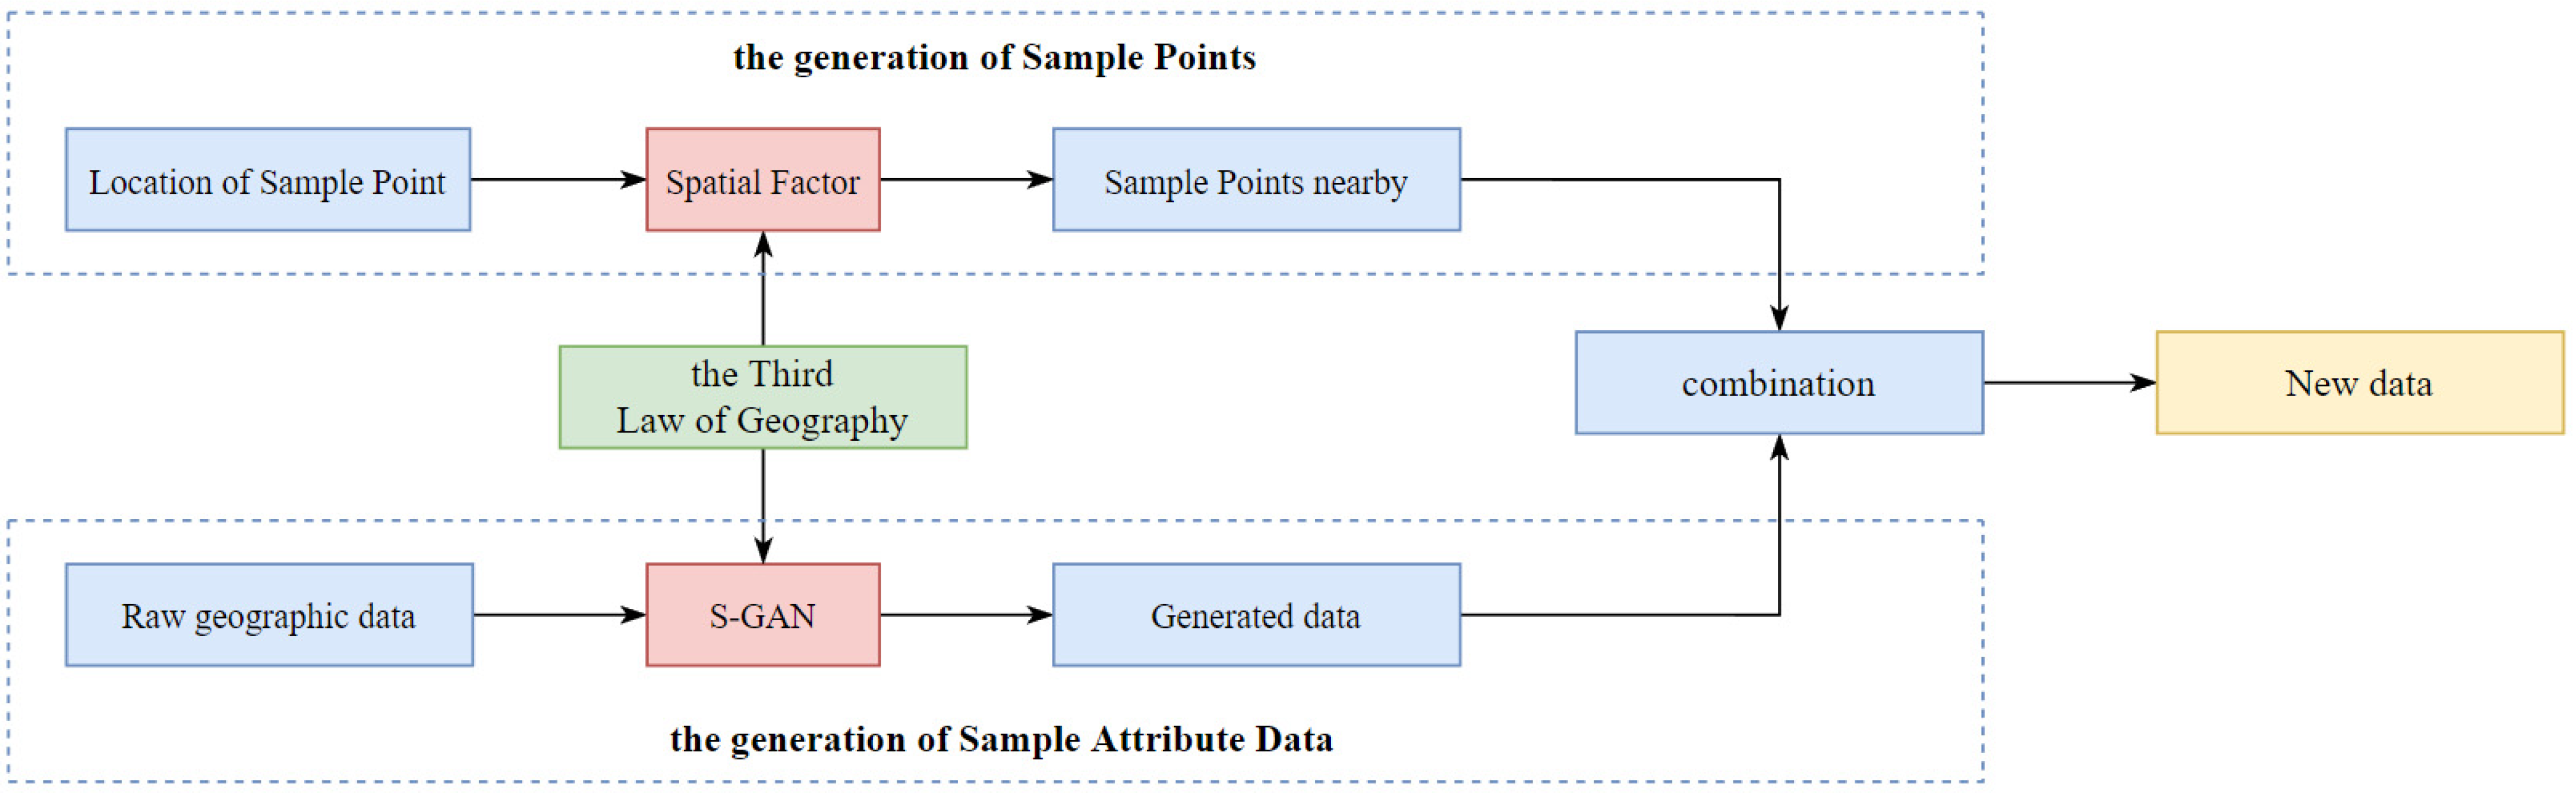
3.2. The Generation of Geographic Data

To address the problem of a cold start and generate high-quality data, our method combines the Third Law of Geography with generative adversarial networks. The generation of geographic data mainly includes two aspects: the generation of sample points and the generation of sample attribute data, the basic idea of which is displayed in Figure 2. This section introduces the process and steps of these two kinds of generation.

3.2.1. The Generation of Sample Points

In the original dataset, the geospatial position (i.e., the latitude and the longitude) of the sample points and their labels are known. We use each sample point as the center and set a certain length as the radius to delimit a range. Within this range, a certain number of adjacent sample points are retrieved as new sample points.
According to the Third Law of Geography, the more similar the geographical environment, the more similar the geographical features [13]. Since these generated new sample points that are similar in space to the original sample points, the geographical environments of these sample points can be considered to be similar. Therefore, we can assign to these new sample points the classification label of the center point. This method is essentially an inference process, using the Third Law of Geography to infer the neighboring points around the sample point. Figure 3 displays the framework of this method.

3.2.2. The Generation of Sample Attribute Data
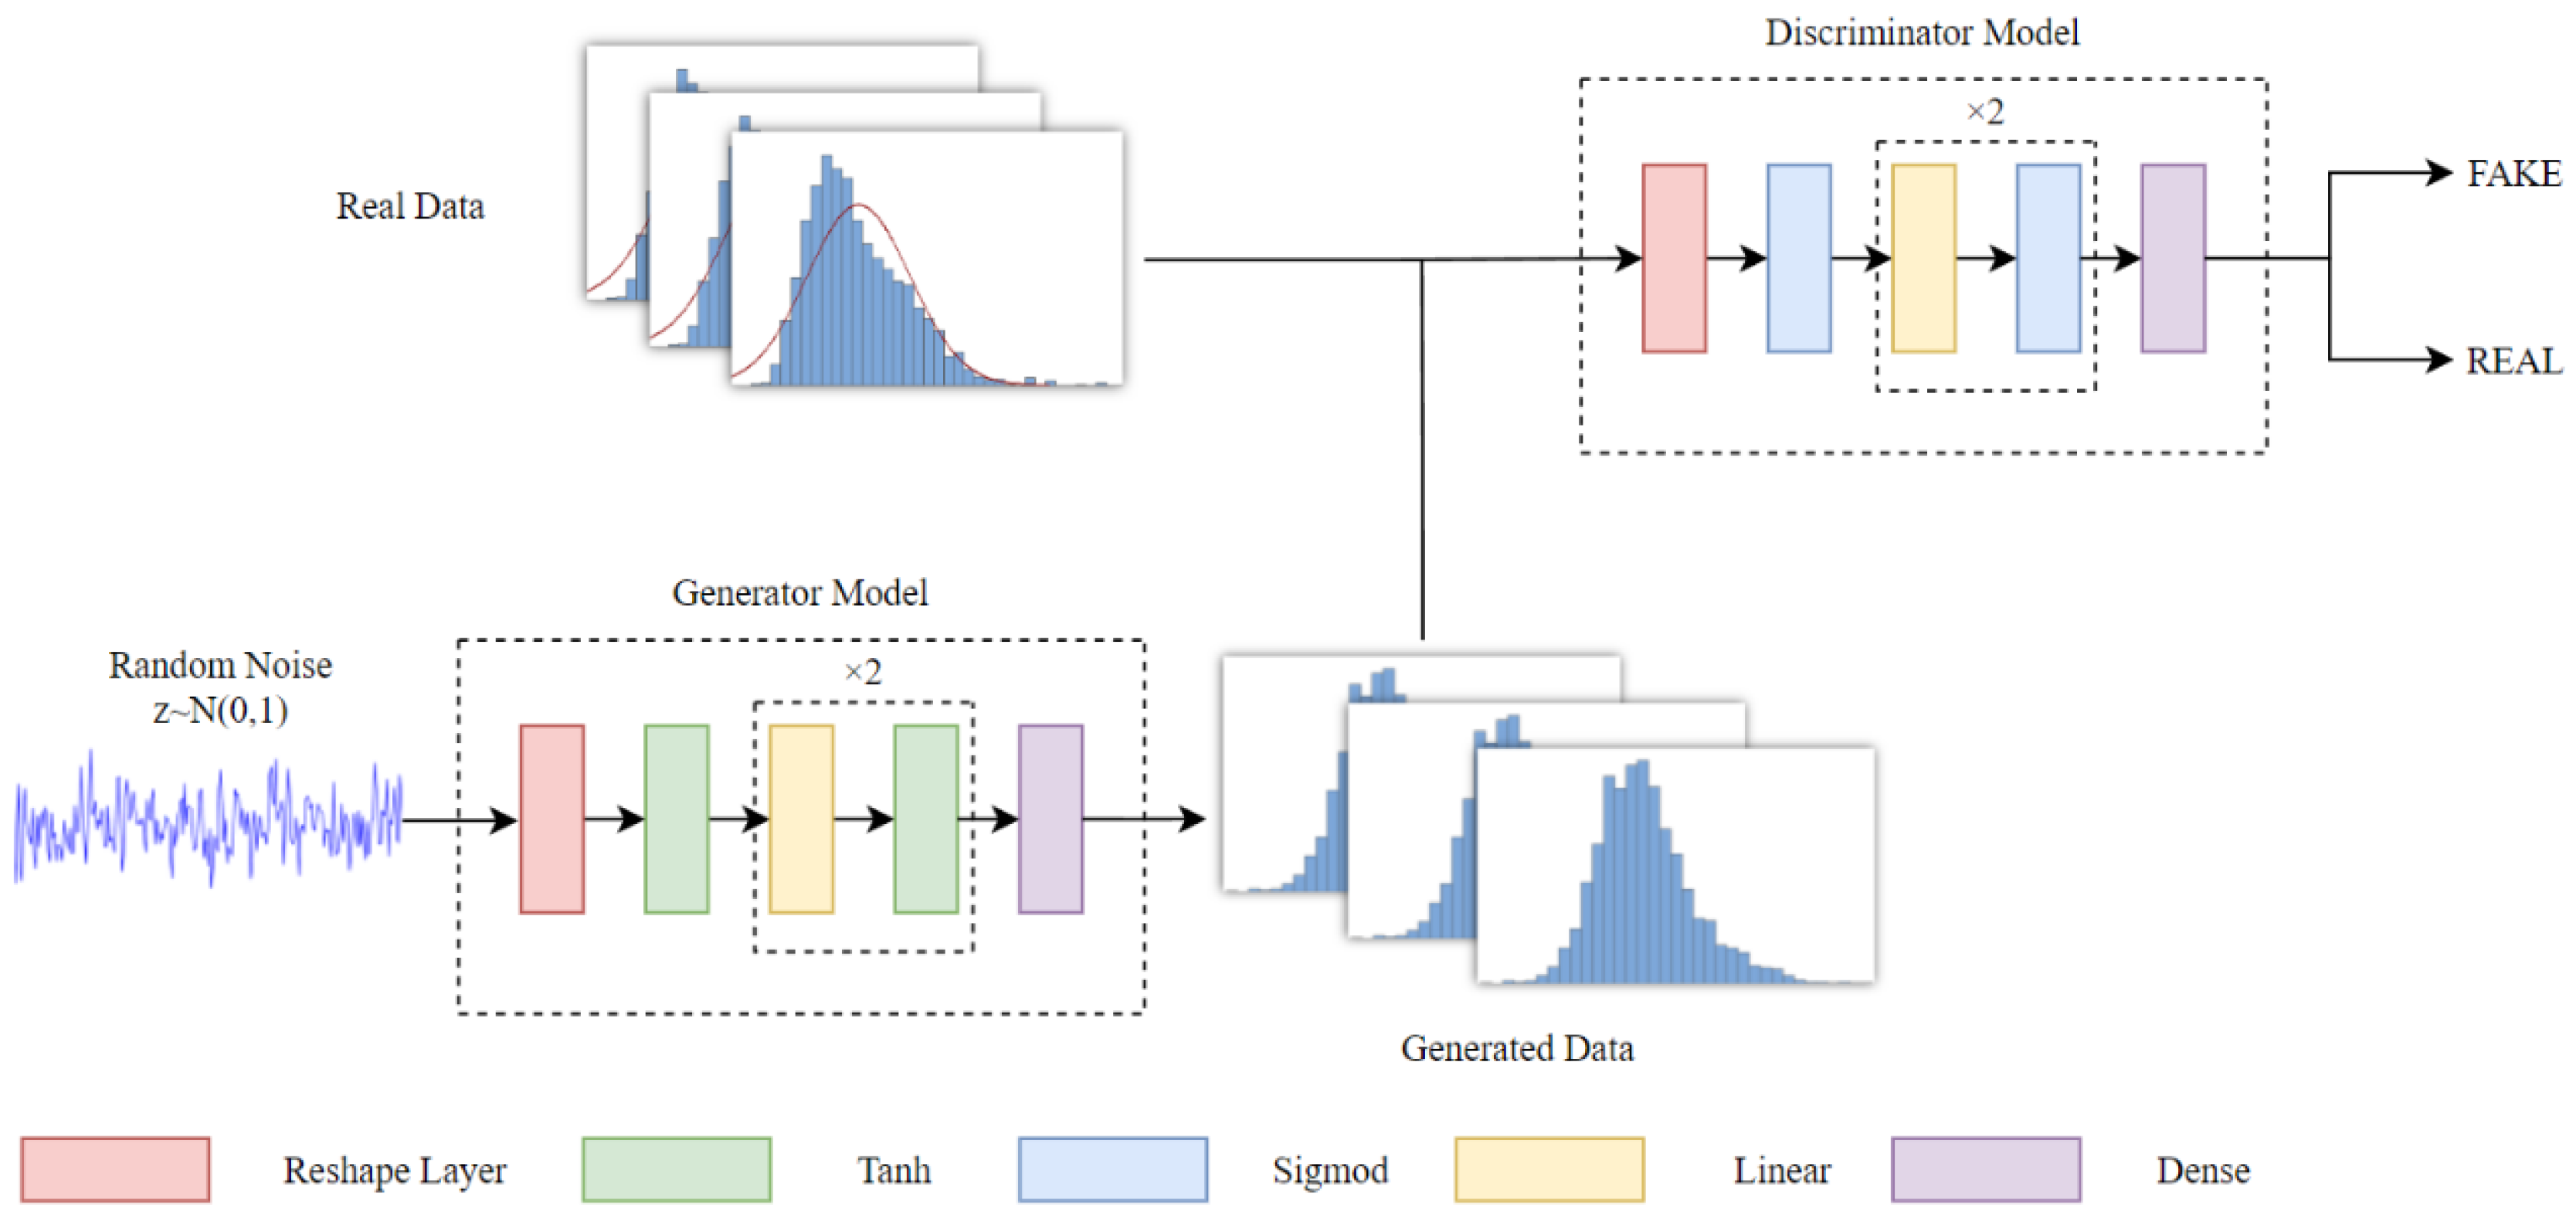
The generation of sample attribute data is based on the S-GAN method. After the dataset is preprocessed, the data of each attribute under each label are used as the real data of the S-GAN to generate new data. According to the Third Law of Geography, “the more similar the geographical environment is, the more similar the geographical features are”. Therefore, under a certain label, the data of each attribute satisfy a certain distribution and the generated data should also satisfy this distribution. By learning and imitating the distribution of real data, the new data generated by the S-GAN also satisfy this distribution, so these data and the original data can be used as sample attribute data under the label.

3.3. S-GAN Model

The S-GAN model is the core part of the entire generative-adversarial-network-based geographic data argumentation method, and its main task is to capture and learn the distribution of sample attribute data and generate sample attribute data. Similar to the traditional generative adversarial network, the S-GAN also includes a generator model and a discriminator model, and its network structure is displayed in Figure 4. The main parts of these two models are described below.

3.3.1. Generator

The generator employs a standard feedforward neural network, which has two hidden layers and three linear maps, and the activation function is tanh. The input to the generative model is random noise that somehow mimics the distribution of the original dataset.
The loss function of the generative model can be written as:
LG = H(1, D(G(z))),
where G represents the generator and D represents discriminator. D(G(z)) represents the judgment probability of D with respect to the generated data of G. H represents the cross-entropy loss function, and H(1, D(G(z))) represents the distance between the real data and 1. Therefore, if the generator wants to achieve good results, the discriminator must determine the generated data as true as possible.

3.3.2. Discriminator

The structure of the discriminator is similar to that of the generator, which also has two hidden layers and three linear maps, and the activation function adopts sigmoid [29]. It samples from the original dataset and the fake dataset and outputs a number between 0 and 1 to represent the authenticity of the data. An output result of 1 means that the discriminator determines the data to be real, that is, the data are from the real sample. An output result of 0 means that the discriminator determines the data to be false, which means the data are from the generated sample.
The loss function of the discriminator can be written as:
LD = H(1, D(x)) + H(0, D(G(z))),
where x is the real data, H(1, D(x)) represents the distance between 1 and the probability of x being real data, and H(0, D(G(z))) represents the distance between 0 and the probability of G(z) being generated data. Therefore, for the discriminator to achieve good results, H(1, D(x)) and H(0, D(G(z))) should be as small as possible.

3.3.3. Objective Function

Similar to the traditional GAN, the core idea of the S-GAN is still the idea of game theory and confrontation, that is, allow the generator and the discriminator to compete so that the two models are enhanced at the same time, and finally allow the data generated by the generative model to achieve the effect of mixing the fake with the real. Therefore, the optimized objective function is as follows:
min G   max D   V ( D , G ) = E x ~ p data ( x ) [ log   D ( x ) ] + E z ~ p z ( z ) [ log ( 1     D ( G ( z ) ) ) ] ,
where pz(z) represents the prior distribution of the input noise, which is used to learn the probability distribution Pg of the generator G on the training data x; pdata(x) represents the distribution of the real data, that is, the distribution that G needs to learn; D(x) represents the probability that the data x come from the real data distribution pdata instead of Pg; and G(z) is the generating function that represents the mapping of the input noise z to the data.

3.3.4. Training the Model

We adopted the alternate iterative training method of fixing one side and training one side. The main steps are as follows:
(1) 
Fix the generator G, train the discriminator D, and update its parameters.
During the update process, for the data x from the real distribution pdata, the probability D(x) that D judges it to be the real distribution is as close to 1 as possible, that is, log D(x) is as large as possible and its optimal solution can be written as follows:
D * ( x ) = p data ( x ) p data ( x ) + P g ( x )   ,
For the data G(z) generated by random noise z, D(G(z)) should be as close to 0 as possible, that is, D can distinguish between real data and generated data, and log ( 1     D ( G ( z ) ) ) needs to be as large as possible.
(2) 
Fix the discriminator D, train the generator G, and update its parameters.
During the update process, D(G(z)) should be as close to 1 as possible, that is, log(1 − D(G(z))) should be as small as possible. The objective function achieves a global minimum only if pg(x) = pdata(x).
Finally, the result of the game between the two models is that G can generate sufficiently real data G(z), while for D, it is difficult to determine whether the data generated by G are real data, which means D(G(z)) = 0.5.

3.4. S-GAN Algorithm

First, the S-GAN algorithm initializes the generator and the discriminator. Next, in each iterative process, the S-GAN algorithm first fixes the generator and the discriminator samples from real data samples and random noise, respectively, and trains and updates the parameters of the discriminator and then fixes the discriminator and generates the model from random. In this process, the generator will continuously adjust its parameters to obtainS a higher score of the discriminator. Algorithm 1 describes the details of the S-GAN algorithm.
For the sample attribute data sequence with a length N, our S-GAN samples capture and learn the distribution of the data in Steps 3 and 4. Their time complexity is O(N). With K updates in Step 5, its time complexity is O(K). Similarly, the time complexity in Steps 7 and 8 is O(N + K). Assuming that the number of training iterations is M, the time complexity of the entire algorithm is O(NMK).
Algorithm 1 S-GAN algorithm
input:
(1) Z: random noise, which satisfies Z~N(0,1)
(2) X: real samples
output:
(1) G(Z): fake data generated by learning the distribution of the dataset
(2) D(G(z)): a score that represents the probability that the data is fake data
1.   for number of training iterations do
2.    for 1~ K do
3.     Sample m examples {x1, x2, …, xm} from X, which satisfies X~Pg(x).
4.     Sample m noise examples {z1, z2, …, zm} from Z.
5.     Train and update the Discriminator by ascending its stochastic gradient:
         θ d 1 m i = 1 m [ logD ( x i ) + log ( 1 D ( G ( z i ) ) ) ]
6.    end for
7.     Sample m noise examples {z1, z2, …, zm} from Z.
8.       Train and update the Generator by descending its stochastic gradient:
         θ d 1 m i = 1 m log ( 1 D ( G ( z i ) ) )
9.   end for

4. Experiment

In this section, we used the rural knowledge graph dataset to augment data. To verify the effect of data argumentation, we put the enhanced dataset into different recommender systems. Therefore, the whole experiment was divided into two parts: one was geographic data argumentation, using the S-GAN to generate data and make a dataset; and the other was rural ecological civilization recommendation, in which we sent the original dataset and the enhanced dataset to the different recommendation systems and compared the performances of these two datasets by using AUC, ACC, and F1 values as evaluation metrics.

4.1. Experiment Environment

Table 2 displays the experimental environment of this paper.

4.2. Dataset

4.2.1. Dataset Overview

We used the rural knowledge graph as our dataset. This dataset collects detailed geographic data of the “Top 100 Examples” of beautiful villages selected by the Ministry of Agriculture and Rural Affairs of the People’s Republic of China in 2016 (http://www.crnews.net/zt/jkbzb/jkp_img/index.htm, accessed on 10 October 2016), including their latitudes and longitudes, climates, population, GDPs, and other geographical information, which are presented in the form of a knowledge graph. In this dataset, a total of 100 villages, 441 entities, and 22 relationships are included. Among them, each village is regarded as a sample point and each sample point has 27 sample attributes. Table 3 displays the details of the sample properties.

4.2.2. Preprocessing

Data preprocessing mainly involves data extraction and screening.
Data extraction refers to extracting the required sample points or sample attribute data from the original dataset as a separate dataset. For example, when the data of a certain attribute under a certain label need to be generated, this part of the data is extracted as a single small sample. The advantage is that when a large dataset is split into many smaller datasets, these can be used as input for subsequent data generation.
Data screening refers to the removal of labels and their data with a small sample size in the original dataset. Data screening is a must because the sparsity and imbalance problems of geographic data largely make the characteristics of the data less obvious, resulting in low-quality generated fake samples.
We obtained the number of sample points under each rural ecological civilization pattern in the rural knowledge graph dataset, as shown in Table 4. In four patterns, grassland pasture pattern, suburban intensive pattern, high-efficiency agricultural pattern, and environmental remediation pattern, the amount of data is too small to express their characteristics. Therefore, data should be augmented for the remaining five patterns: industrial development pattern, social comprehensive treatment pattern, ecological protection pattern, cultural heritage pattern, and leisure travel pattern. Table 5 shows the changes in the data scale before and after data augmentation.
After the processing above, we obtained two datasets: (1) a dataset about sample points, including three attributes of the village, namely latitude and longitude, climate, and the ecological civilization model, and (2) a dataset about sample attribute data, which contains the remaining 23 properties.

4.3. The Data Argumentation Experiment

4.3.1. Generate New Sample Points

For a village in the rural knowledge graph (this village can be regarded as a sample point), we took the longitude and latitude of the village as the center point and took 10 km as the radius to retrieve the neighboring villages within the radius. In this experiment, we used different lengths as the radius of the retrieval range and found the radius of 10 km to be the most suitable in this experiment because, within a 10 km radius, we were able to retrieve several villages with similar geographic settings.
Taking Tiantaishan Village (114.729487 latitude and 36.540976 longitude) as an example, we used Baidu Map API to retrieve 10 villages within 10 km of this village. The retrieval results are shown in Table 6. Since the ecological civilization model of Tiantaishan Village is a social comprehensive treatment type, according to the Third Law of Geography, we also assigned a social comprehensive treatment type label to these 10 villages.
After retrieving and counting, we identified 92 sample points that we needed to amplify. By repeating the above operation, we obtained all 92 neighboring villages within 10 km of the initial 10 villages, and these villages were used as sample points in our generated new dataset. After statistics, the number of new sample points reached 772.

4.3.2. Generate New Sample Attribute Data

It is necessary to identify the attributes in the sample that need to be generated before new sample attribute data are generated. After analyzing the attributes of the rural knowledge graph dataset, we found that climate attributes can be derived from the Third Law of Geography, while other attributes (population, GDP, land area, etc.) are numerical data, which can be generated by the S-GAN. Statistics indicate that 20 sample attributes need to be generated, and 15,770 data are generated in total.
After being generated, the sample attribute data were merged with the sample points generated in the previous section to obtain a new rural knowledge graph dataset. Compared with the original dataset, its scale was greatly improved. For example, the number of entities was enlarged from 441 to 1684. The scales of the original dataset and the new dataset are displayed in Table 7.
S-GAN Parameter setting: The random noise dimension entering the generator and the dimension of the generated output vector were set to 1, the size of the mini-batch input to the discriminant model was 500, the dimension of the output vector was 1, the initial learning rate was set to 2 × 10⁻⁴, and the number of training sessions was 20,000.

4.4. The Recommendation System Experiment

4.4.1. Different Recommendation Methods

To test the effectiveness of the S-GAN method and the performance of three different recommendation methods, RippleNet, KGCN, and KGNN-LS, the original and enhanced datasets were used as the input of the recommendation system.
(1) RippleNet [22] is a recommendation system that integrates a knowledge graph as additional information. This method draws on the propagation of the ripple, which takes the items that the user is interested in as the starting point and goes through multiple layers of diffusion on the knowledge graph to extract the user’s features.
(2) KGCN [4] is a recommendation system that combines a knowledge graph and a graph convolutional neural network. Through multi-layer convolution, the semantic information in the knowledge graph is automatically captured and the connection between entities is mined to achieve more accurate and diverse recommendations.
(3) KGNN-LS [30] is a knowledge graph recommendation system based on a graph neural network. The recommender system uses a label propagation algorithm (LPA) for prediction and recommendation. At the same time, a regularization term is introduced to prevent overfitting.

4.4.2. Parameters and Evaluation Metrics of the Experiment

We determined the parameter of the recommender systems by comparing multiple experiments. The specific parameter settings are as follows: neighbor_sample_size was set to 10, dim was set to 4, n_iter was set to 2, batch_size was set to 128, l2_weight was set to 1 × 10⁻⁵, and lr was set to 1 × 10⁻³.
In terms of evaluation metrics, we chose to use AUC, ACC, and the F1 score as the evaluation metrics of our experiments, and these metrics are introduced below.
(1) AUC (area under curve) is defined as the area enclosed by the coordinate axis under the ROC curve [31,32]. So, the value of this area will not be greater than 1, and because the ROC curve is generally above the line y = x, the value of AUC ranges between 0.5 and 1. The larger the value of AUC, the better the effect of the classifier.
(2) ACC (accuracy) represents the accuracy rate, that is, the ratio of the samples whose predicted values are consistent with the true values. This metric reflects the rate at which the classifier accurately identifies true positives and false negatives. The formula for calculating the ACC is as follows:
ACC = TP + TN TP + FP + FN + TN ,
where TP (true positive) means that the predicted value of the sample is consistent with the real value and both are positive, FP (false positive) means that the predicted value of the sample is positive and the real value is negative, FN (false negative) means that the predicted value of the sample is negative and the true value is positive, and TN (true negative) means that the predicted value of the sample is consistent with the true value and both are negative.
(3) F1 score is a comprehensive evaluation index that represents the harmonic mean of precision and recall. Its calculation formula is as follows:
F 1 = 2 Precision     Recall Precision     Recall ,
where the calculation formulas of precision and recall are as follows:
Precision = TP TP + FP ,
Recall = TP TP + FN ,

4.4.3. The Results and Analysis of Experiments

The experimental results of the rural knowledge graph dataset before and after argumentation in different recommender systems are displayed in Table 8.
The relevant evaluation indicators of the recommender system show that, after data argumentation, the indicators of the recommender system were significantly improved. Among them, RippleNet has the highest performance improvement. Its AUC and ACC improved by 45.84% and 55.49%, respectively, and F1 improved by 40.01%. In KGCN, AUC improved by 40.76%, ACC improved by 25.12%, and F1 improved by 19.53%. In KGNN-LS, AUC improved by 39.50%, ACC improved by 27.14%, and F1 improved by 29.24%. Such an obvious performance improvement is mainly because the scale of the dataset was greatly improved through geographic data argumentation, which makes the characteristics of labels more obvious and makes it easier for the rural ecological civilization pattern recommendation system to mine these characteristics.

5. Conclusions

This paper proposed a geographic data argumentation method that incorporates spatial factors into generative adversarial networks, aiming to address the problems of sparsity and cold start, which lead to the poor performance of the rural ecological civilization recommendation system. For geographic datasets with a small number of samples, geographic data can be augmented by studying the distribution of relevant data. At the same time, the enhanced datasets were applied to solve the problem of rural ecological civilization recommendation, which effectively solved the problem of the recommendation accuracy of the recommendation system not being high enough. Although the method proposed in this paper mainly addressed the problem of rural ecological civilization recommendation, we believe that our method has certain universality and can be widely used in other fields of geographic data argumentation. In the future research work, we plan to improve the S-GAN method by further optimizing the structure of the simple GAN. For example, the advanced GAN variants (such as DCGAN and WGAN) would be applied to geographic data augmentation.

Author Contributions

Conceptualization, M.X.; methodology, M.X. and S.W.; software, M.X., C.S. and A.Z.; validation, M.X., C.S. and A.Z.; formal analysis, M.X.; investigation, C.S.; resources, S.W. and Y.Z.; data curation, A.Z. and S.W.; writing—original draft preparation, M.X.; writing—review and editing, S.W. and Z.Z.; visualization, A.Z.; supervision, Z.Z. and Y.Z.; project administration, Z.Z.; funding acquisition, Y.Z. All authors have read and agreed to the published version of the manuscript.

Funding

This work was supported by the Strategic Priority Research Program of the Chinese Academy of Sciences (grant number XDA23100100), the Chinese Scholarship Council (grant number 202008320044), and the National Natural Science Foundation of China (grant number 42050101).

Institutional Review Board Statement

Not applicable.

Informed Consent Statement

Not applicable.

Data Availability Statement

Not applicable.

Acknowledgments

The authors acknowledge the anonymous reviewers and the editors for their constructive comments that helped to improve the paper significantly.

Conflicts of Interest

The authors declare no conflict of interest.

References

  1. Yang, D.; Wang, Z.; Jiang, J.; Xiao, Y. Knowledge embedding towards the recommendation with sparse user-item interactions. In Proceedings of the 2019 IEEE/ACM International Conference on Advances in Social Networks Analysis and Mining, Vancouver, BC, Canada, 27–30 August 2019; pp. 325–332. [Google Scholar]
  2. Kawtar, N.; El, H.B.; Nawal, S.; Ahmed, Z. Collaborative Filtering Approach: A Review of Recent Research. In Proceedings of the 3rd International Conference on Advanced Intelligent Systems for Sustainable Development (AI2SD), Tangier, Morocco, 21–26 December 2020; pp. 151–163. [Google Scholar]
  3. Ye, Z.; Zhao, H.; Zhang, K.; Zhu, Y.; Xiao, Y.; Wang, Z. Improved DeepWalk Algorithm Based on Preference Random Walk. In Proceedings of the International Conference Natural Language Processing, Sanya, China, 20–22 December 2019; pp. 265–276. [Google Scholar]
  4. Wang, H.; Zhao, M.; Xie, X.; Li, W.; Guo, M. Knowledge graph convolutional networks for recommender systems. In Proceedings of the International Conference on World Wide Web, San Francisco, CA, USA, 13–17 May 2019; pp. 3307–3313. [Google Scholar]
  5. Guo, Q.; Zhuang, F.; Qin, C.; Zhu, H.; Xie, X.; Xiong, H.; He, Q. A survey on knowledge graph-based recommender systems. IEEE Trans. Knowl. Data Eng. 2020, 34, 3549–3568. [Google Scholar] [CrossRef]
  6. Chen, X.L.; Xie, H.R.; Li, Z.X.; Cheng, G. Topic analysis and development in knowledge graph research: A bibliometric review on three decades. Neurocomputing 2021, 461, 497–515. [Google Scholar] [CrossRef]
  7. Wang, H.; Zhang, F.; Xie, X.; Guo, M. DKN: Deep knowledge-aware network for news recommendation. In Proceedings of the 2018 World Wide Web Conference, Lyon, France, 23–27 April 2018; pp. 1835–1844. [Google Scholar]
  8. Wang, X.; He, X.; Cao, Y.; Liu, M.; Chua, T.S. KGAT: Knowledge Graph Attention Network for Recommendation. In Proceedings of the 25th ACM SIGKDD International Conference on Knowledge Discovery and Data Mining, Anchorage, AK, USA, 4–8 August 2019; pp. 950–958. [Google Scholar]
  9. Goodfellow, I.; Pouget-Abadie, J.; Mirza, M.; Xu, B.; Warde-Farley, D.; Ozair, S.; Courville, A.; Bengio, Y. Generative adversarial nets. In Proceedings of the 27th International Conference on Neural Information Processing Systems, Montreal, QC, Canada, 8–13 December 2014; pp. 2672–2680. [Google Scholar]
  10. Choi, S.H.; Shin, J.M.; Liu, P.; Choi, Y.H. ARGAN: Adversarially Robust Generative Adversarial Networks for Deep Neural Networks against Adversarial Examples. IEEE Access 2022, 10, 33602–33615. [Google Scholar] [CrossRef]
  11. Souibgui, M.A.; Kessentini, Y. DE-GAN: A Conditional Generative Adversarial Network for Document Enhancement. IEEE Trans. Pattern Anal. Mach. Intell. 2022, 44, 1180–1191. [Google Scholar] [CrossRef] [PubMed]
  12. Toshpulatov, M.; Lee, W.; Lee, S. Generative adversarial networks and their application to 3D face generation: A survey. Image Vis. Comput. 2021, 108, 104–119. [Google Scholar] [CrossRef]
  13. Zhu, A.X.; Lu, G.; Liu, J.; Qin, C.Z.; Zhou, C. Spatial prediction based on Third Law of Geography. Ann. GIS 2018, 24, 225–240. [Google Scholar] [CrossRef]
  14. Shen, S. Ecological Civilization and Its Theoretical and Practical Basis. J. Peking Univ. Philos. Soc. Sci. 1994, 3, 31–37. [Google Scholar]
  15. Yu, K. Scientific Outlook on Development and Ecological Civilization. Marx. Real. 2005, 4, 4–5. [Google Scholar]
  16. Zhou, S.X. Actively Build Ecological Civilization. Environ. Sustain. Dev. 2010, 1, 1–3. [Google Scholar]
  17. Ko, H.; Lee, S.; Park, Y.; Choi, A. A Survey of Recommendation Systems: Recommendation Models, Techniques, and Application Fields. Electronics 2022, 11, 141. [Google Scholar] [CrossRef]
  18. Zhang, S.C. Research on Recommendation Algorithm Based on Collaborative Filtering. In Proceedings of the 2021 2nd International Conference on Artificial Intelligence and Information Systems, Chongqing, China, 28–30 May 2021; pp. 1–4. [Google Scholar]
  19. Natthawut, K.; Rungsiman, N.; Ryutaro, I. UWKGM: A Modular Platform for Knowledge Graph Management. In Proceedings of the 29th ACM International Conference on Information & Knowledge Management, Virtual Event, Ireland, 19–23 October 2020; pp. 3421–3424. [Google Scholar]
  20. Jalota, R.; Vollmers, D.; Moussallem, D.; Ngomo, A.C.N. LAUREN—Knowledge Graph Summarization for Question Answering. In Proceedings of the 15th IEEE International Conference on Semantic Computing(ICSC), Elector Network, Laguna Hills, CA, USA, 27–29 January 2021; pp. 221–226. [Google Scholar]
  21. Ji, S.X.; Pan, S.R.; Cambria, E.; Marttinen, P.; Yu, P.S. A Survey on Knowledge Graphs: Representation, Acquisition, and Applications. IEEE Trans. Neural Netw. Learn. Syst. 2022, 33, 494–514. [Google Scholar] [CrossRef] [PubMed]
  22. Tang, X.; Wang, T.; Yang, H.; Song, H. Akupm: Attention-enhanced knowledge-aware user preference model for recommendation. In Proceedings of the 25th ACM SIGKDD International Conference on Knowledge Discovery and Data Mining, Anchorage, AK, USA, 4–8 August 2019; pp. 1891–1899. [Google Scholar]
  23. Wang, H.; Zhang, F.; Wang, J.; Zhao, M.; Li, W.; Xie, X.; Guo, M. Ripplenet: Propagating user preferences on the knowledge graph for recommender systems. In Proceedings of the 27th ACM International Conference on Information and Knowledge Management, Torino, Italy, 22–26 October 2018; pp. 417–426. [Google Scholar]
  24. Wang, H.; Zhang, F.; Zhao, M.; Li, W.; Xie, X.; Guo, M. Multi-task feature learning for knowledge graph enhanced recommendation. In Proceedings of the International Conference on World Wide Web, San Francisco, CA, USA, 13–17 May 2019; pp. 2000–2010. [Google Scholar]
  25. Cao, Y.; Wang, X.; He, X.; Hu, Z.; Chua, T.S. Unifying knowledge graph learning and recommendation: Towards a better understanding of user preferences. In Proceedings of the International Conference on World Wide Web, San Francisco, CA, USA, 13–17 May 2019; pp. 151–161. [Google Scholar]
  26. Raghuwanshi, B.S.; Shukla, S. Classifying imbalanced data using SMOTE based class-specific kernelized ELM. Int. J. Mach. Learn. Cybern. 2021, 12, 1255–1280. [Google Scholar] [CrossRef]
  27. Zhang, H.; Cisse, M.; Dauphin, Y.N.; Lopez-Paz, D. mixup: Beyond Empirical Risk Minimization. In Proceedings of the International Conference on Learning Representations, Vancouver, BC, Canada, 30 April–3 May 2018. [Google Scholar]
  28. Cheng, J.R.; Yang, Y.; Tang, X.Y.; Xiong, N.X.; Zhang, Y.; Lei, F.F. Generative Adversarial Networks: A Literature Review. KSII Trans. Internet Inf. Syst. 2020, 14, 4625–4647. [Google Scholar]
  29. Zhang, A.; Lipton, Z.C.; Li, M.; Smola, A.J. Dive into Deep Learning; People Post Press: Beijing, China, 2019; pp. 128–133. [Google Scholar]
  30. Wang, H.; Zhang, F.; Zhang, M.; Jure Leskovec Zhao, M.; Li, W.; Wang, Z. Knowledge-aware Graph Neural Networks with Label Smoothness Regularization for Recommender Systems. In Proceedings of the 25th ACM SIGKDD Conference on Knowledge Discovery and Data Mining, Anchorage, AK, USA, 4–8 August 2019; pp. 968–977. [Google Scholar]
  31. Fawcett, T. An introduction to ROC analysis. Pattern Recogn. Lett. 2006, 27, 861–874. [Google Scholar] [CrossRef]
  32. Bradley, A.P. The use of the area under the ROC curve in the evaluation of machine learning algorithms. Pattern Recogn. 1997, 30, 1145–1159. [Google Scholar] [CrossRef] [Green Version]
Figure 1. The structure of the GAN.
Applsci 12 08024 g001
Figure 2. The basic idea of geographic data generation.
Applsci 12 08024 g002
Figure 3. Framework of sample point generation.
Applsci 12 08024 g003
Figure 4. The structure of the S-GAN.
Applsci 12 08024 g004
Table 1. The structure of a data sample.
Sample PointValue: attribute 1Value: attribute 2……Value: attribute N
Table 2. The environment of the experiment.
TitleVersion
OSWindows 11 64 bit
RAM16 GB
CPUIntel(R) Core(TM) i7-8750H @ 2.20 GHz
GPUNIVIDA GeForce GTX1060 6 GB
Anaconda34.10.3 64 bit
TensorFlow1.4.0
Table 3. The attributes information of the sample point.
ClassificationAttributesDescription
Basic VillageThe name of the village
LongitudeLatitudeLatitude and longitude
GeographicalPositionGeographical location
DistrictDistrict/County
ProvinceProvince
Humanities and EconomicsRoadThe total length of roads
AreaRegional area
RoadDensityRoad network density
GDPRegion GDP
GDPPerGDP per capita
FirstGDP of the primary industry
SecondGDP of the secondary industry
ThirdGDP of the tertiary industry
Nature and EcologyClimateClimate
FarmCultivated area
GrassGrass area
FrostForest area
WaterWater area
WaterDensityIndexWater network density index
BioabundanceIndexBioabundance index
VegetationCoverIndexVegetation cover index
ForestCoverIndexForest cover index
DroughtIndexDrought index
Table 4. Number of sample points under a rural ecological civilization pattern.
Ecological Civilization PatternThe Number of Sample Points
Grassland Pasture Pattern2
Industrial Development Pattern22
Suburban Intensive Pattern4
High-efficiency Agricultural Pattern1
Environmental Remediation Pattern1
Social Comprehensive Treatment Pattern9
Ecological Protection Pattern6
Cultural Heritage Pattern14
Leisure Travel Pattern42
Table 5. Changes in data scale before and after data argumentation.
PatternBeforeAfter
Industrial Development Pattern22210
Social Comprehensive Treatment Pattern990
Ecological Protection Pattern661
Cultural Heritage Pattern14117
Leisure Travel Pattern42387
Table 6. Search results (Tiantaishan Village).
The Name of the VillageVillage Nearby
Tiantaishan VillageDaxihan Village
Panzhai Village
Zhangda Village
Nanzhongbao Village
Gaozhuang Village
Dasishang Village
Shizhuang Village
Dongbeizhuang Village
Xinanzhuang Village
Xiyaobao Village
Table 7. Data scale comparison of the rural knowledge graph before and after augmentation.
Rural Knowledge Graph
(Before)
Rural Knowledge Graph
(After)
Users101873
Items101873
Number of entities4411684
Number of relations2223
Table 8. Results of two datasets in different recommender systems (in bold are the data with the best performance under this indicator).
Recommendation SystemEvaluation MetricsRural Knowledge Graph
(Before)
Rural Knowledge Graph
(After)
RippleNetAUC0.59330.8653
ACC0.58060.9028
F10.60270.8439
KGCNAUC0.62370.8779
ACC0.60940.7625
F10.63790.7895
KGNN-LSAUC0.65210.9097
ACC0.62500.7946
F10.63330.8185
Publisher’s Note: MDPI stays neutral with regard to jurisdictional claims in published maps and institutional affiliations.

