
Integration and Flight Test of a 7 kW Turboelectric Vertical Take-Off and Landing Unmanned Aircraft


Abstract
:Featured Application
Abstract
1. Introduction
2. Background
3. Methodology
3.1. Avionics and Controls Selection
3.2. Aircraft Weight Breakdown
3.3. Fuel Burn
4. Results
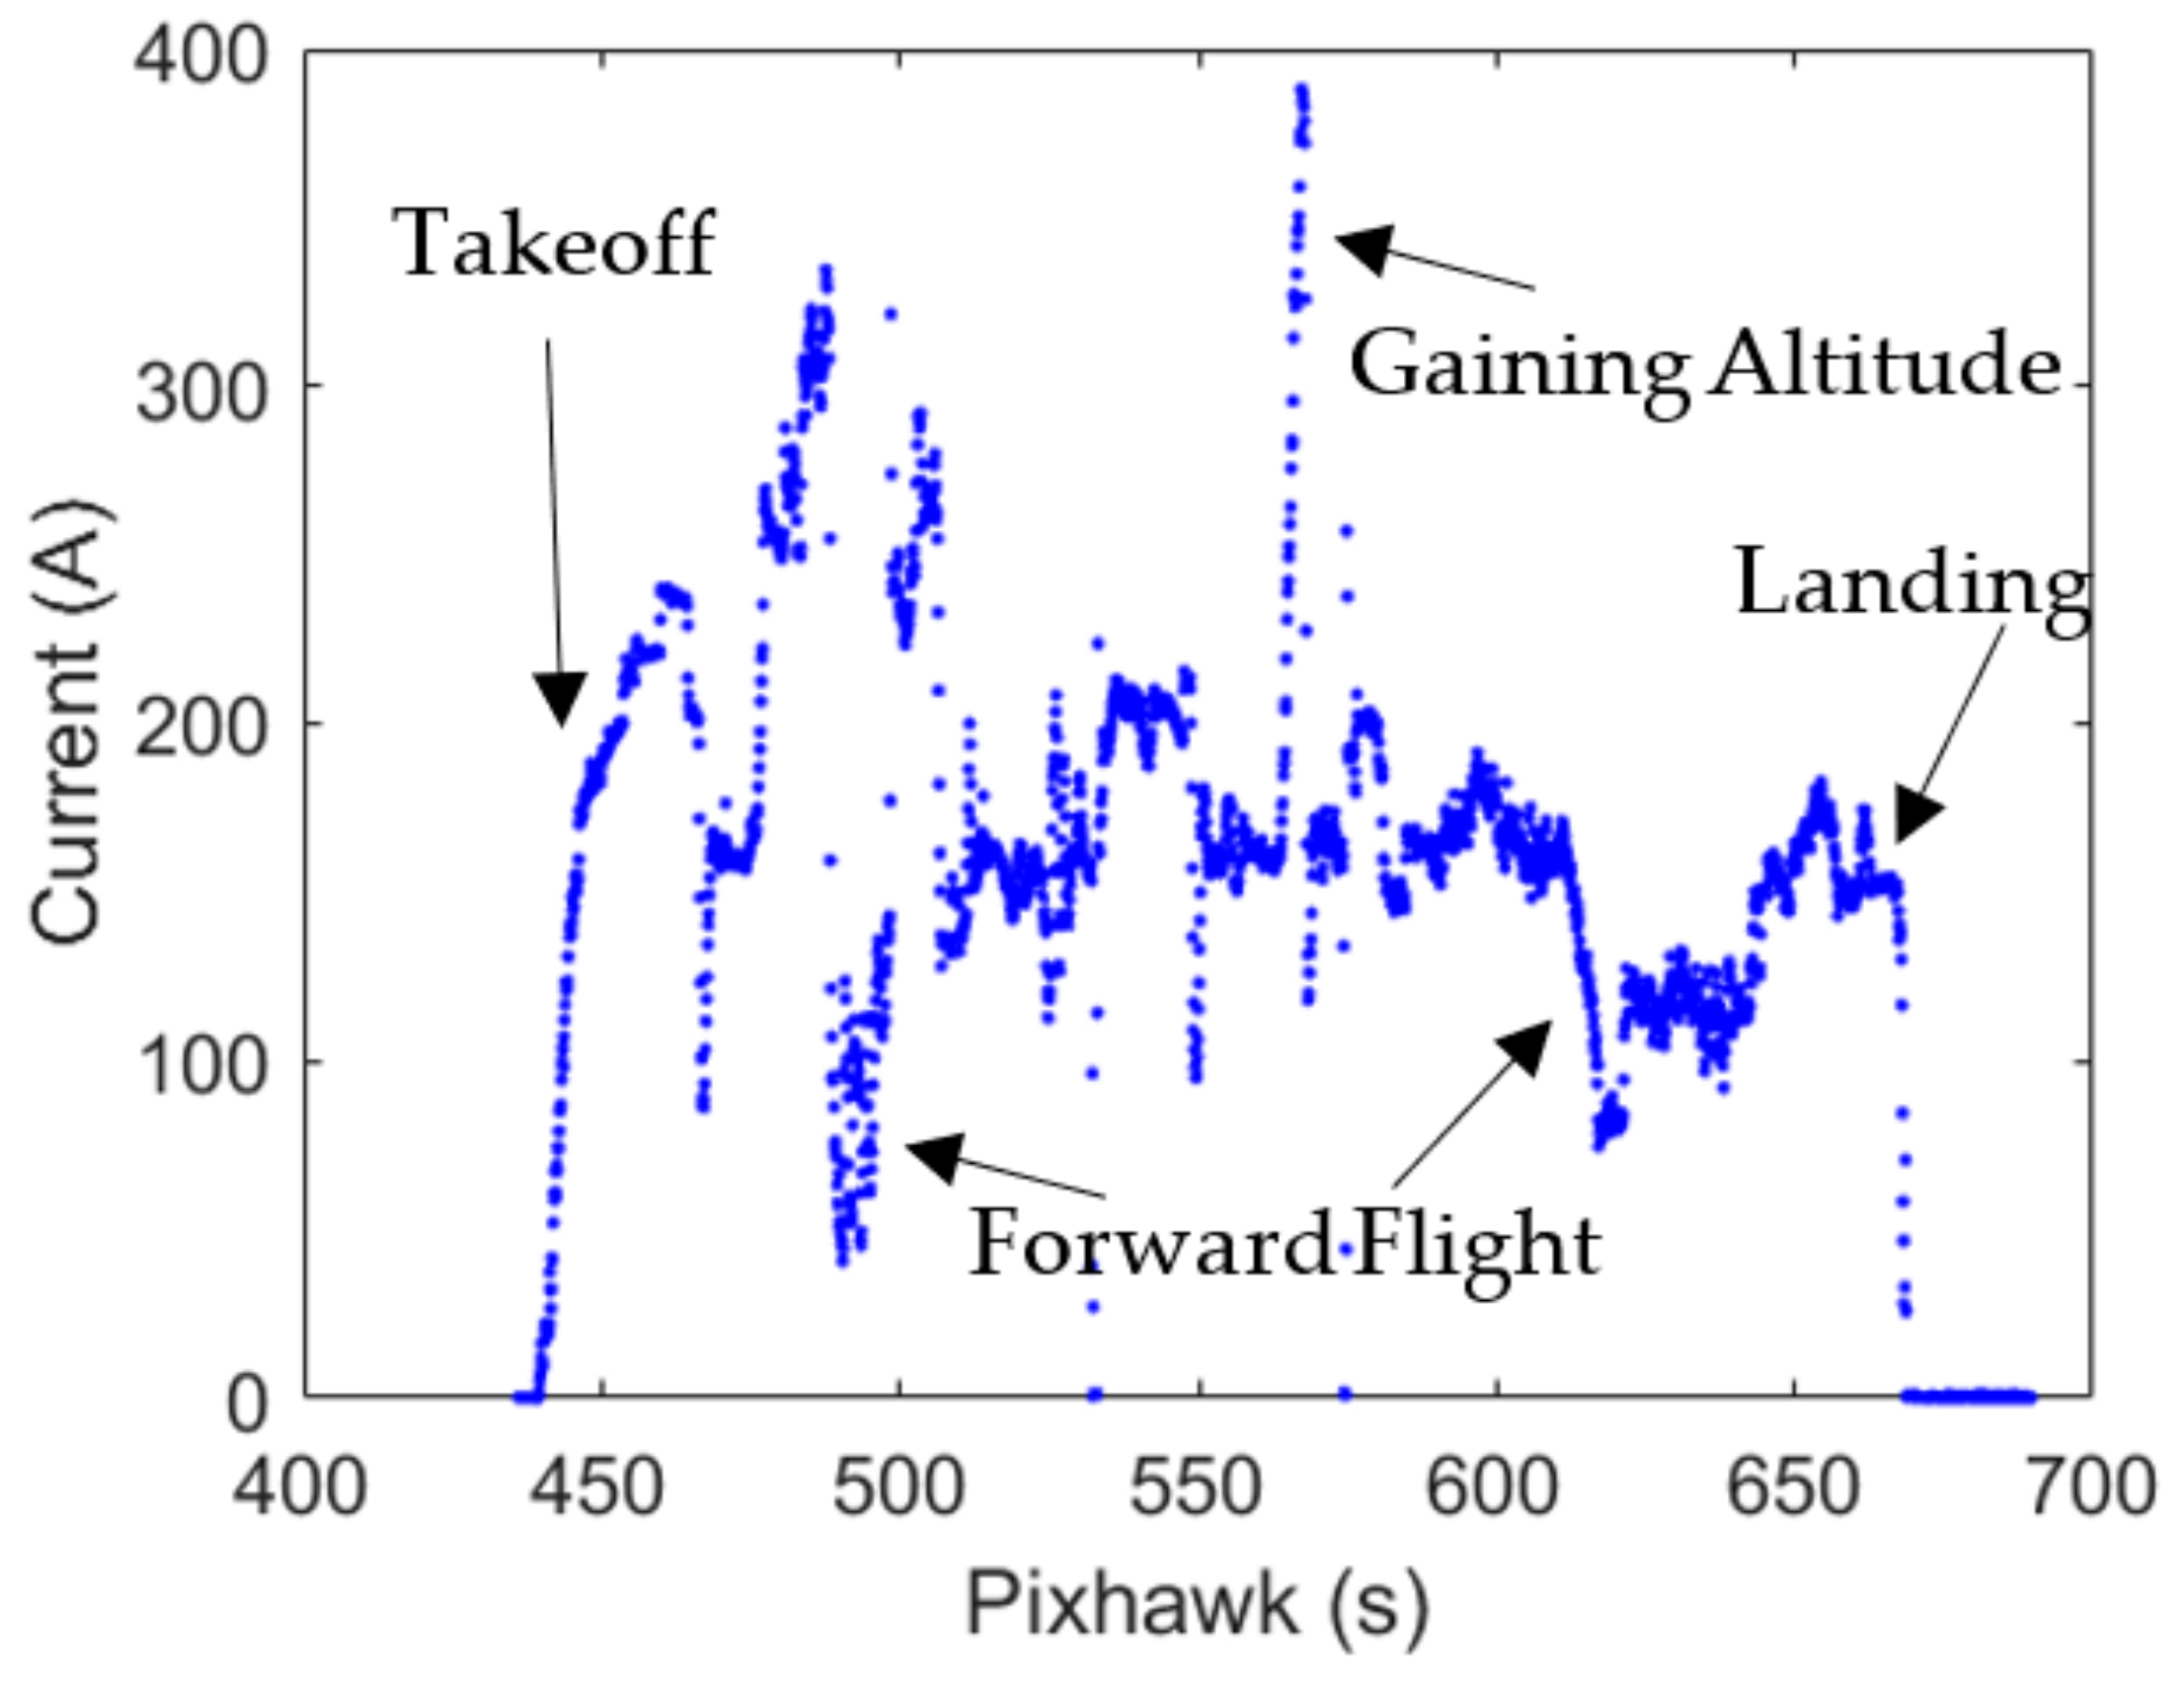
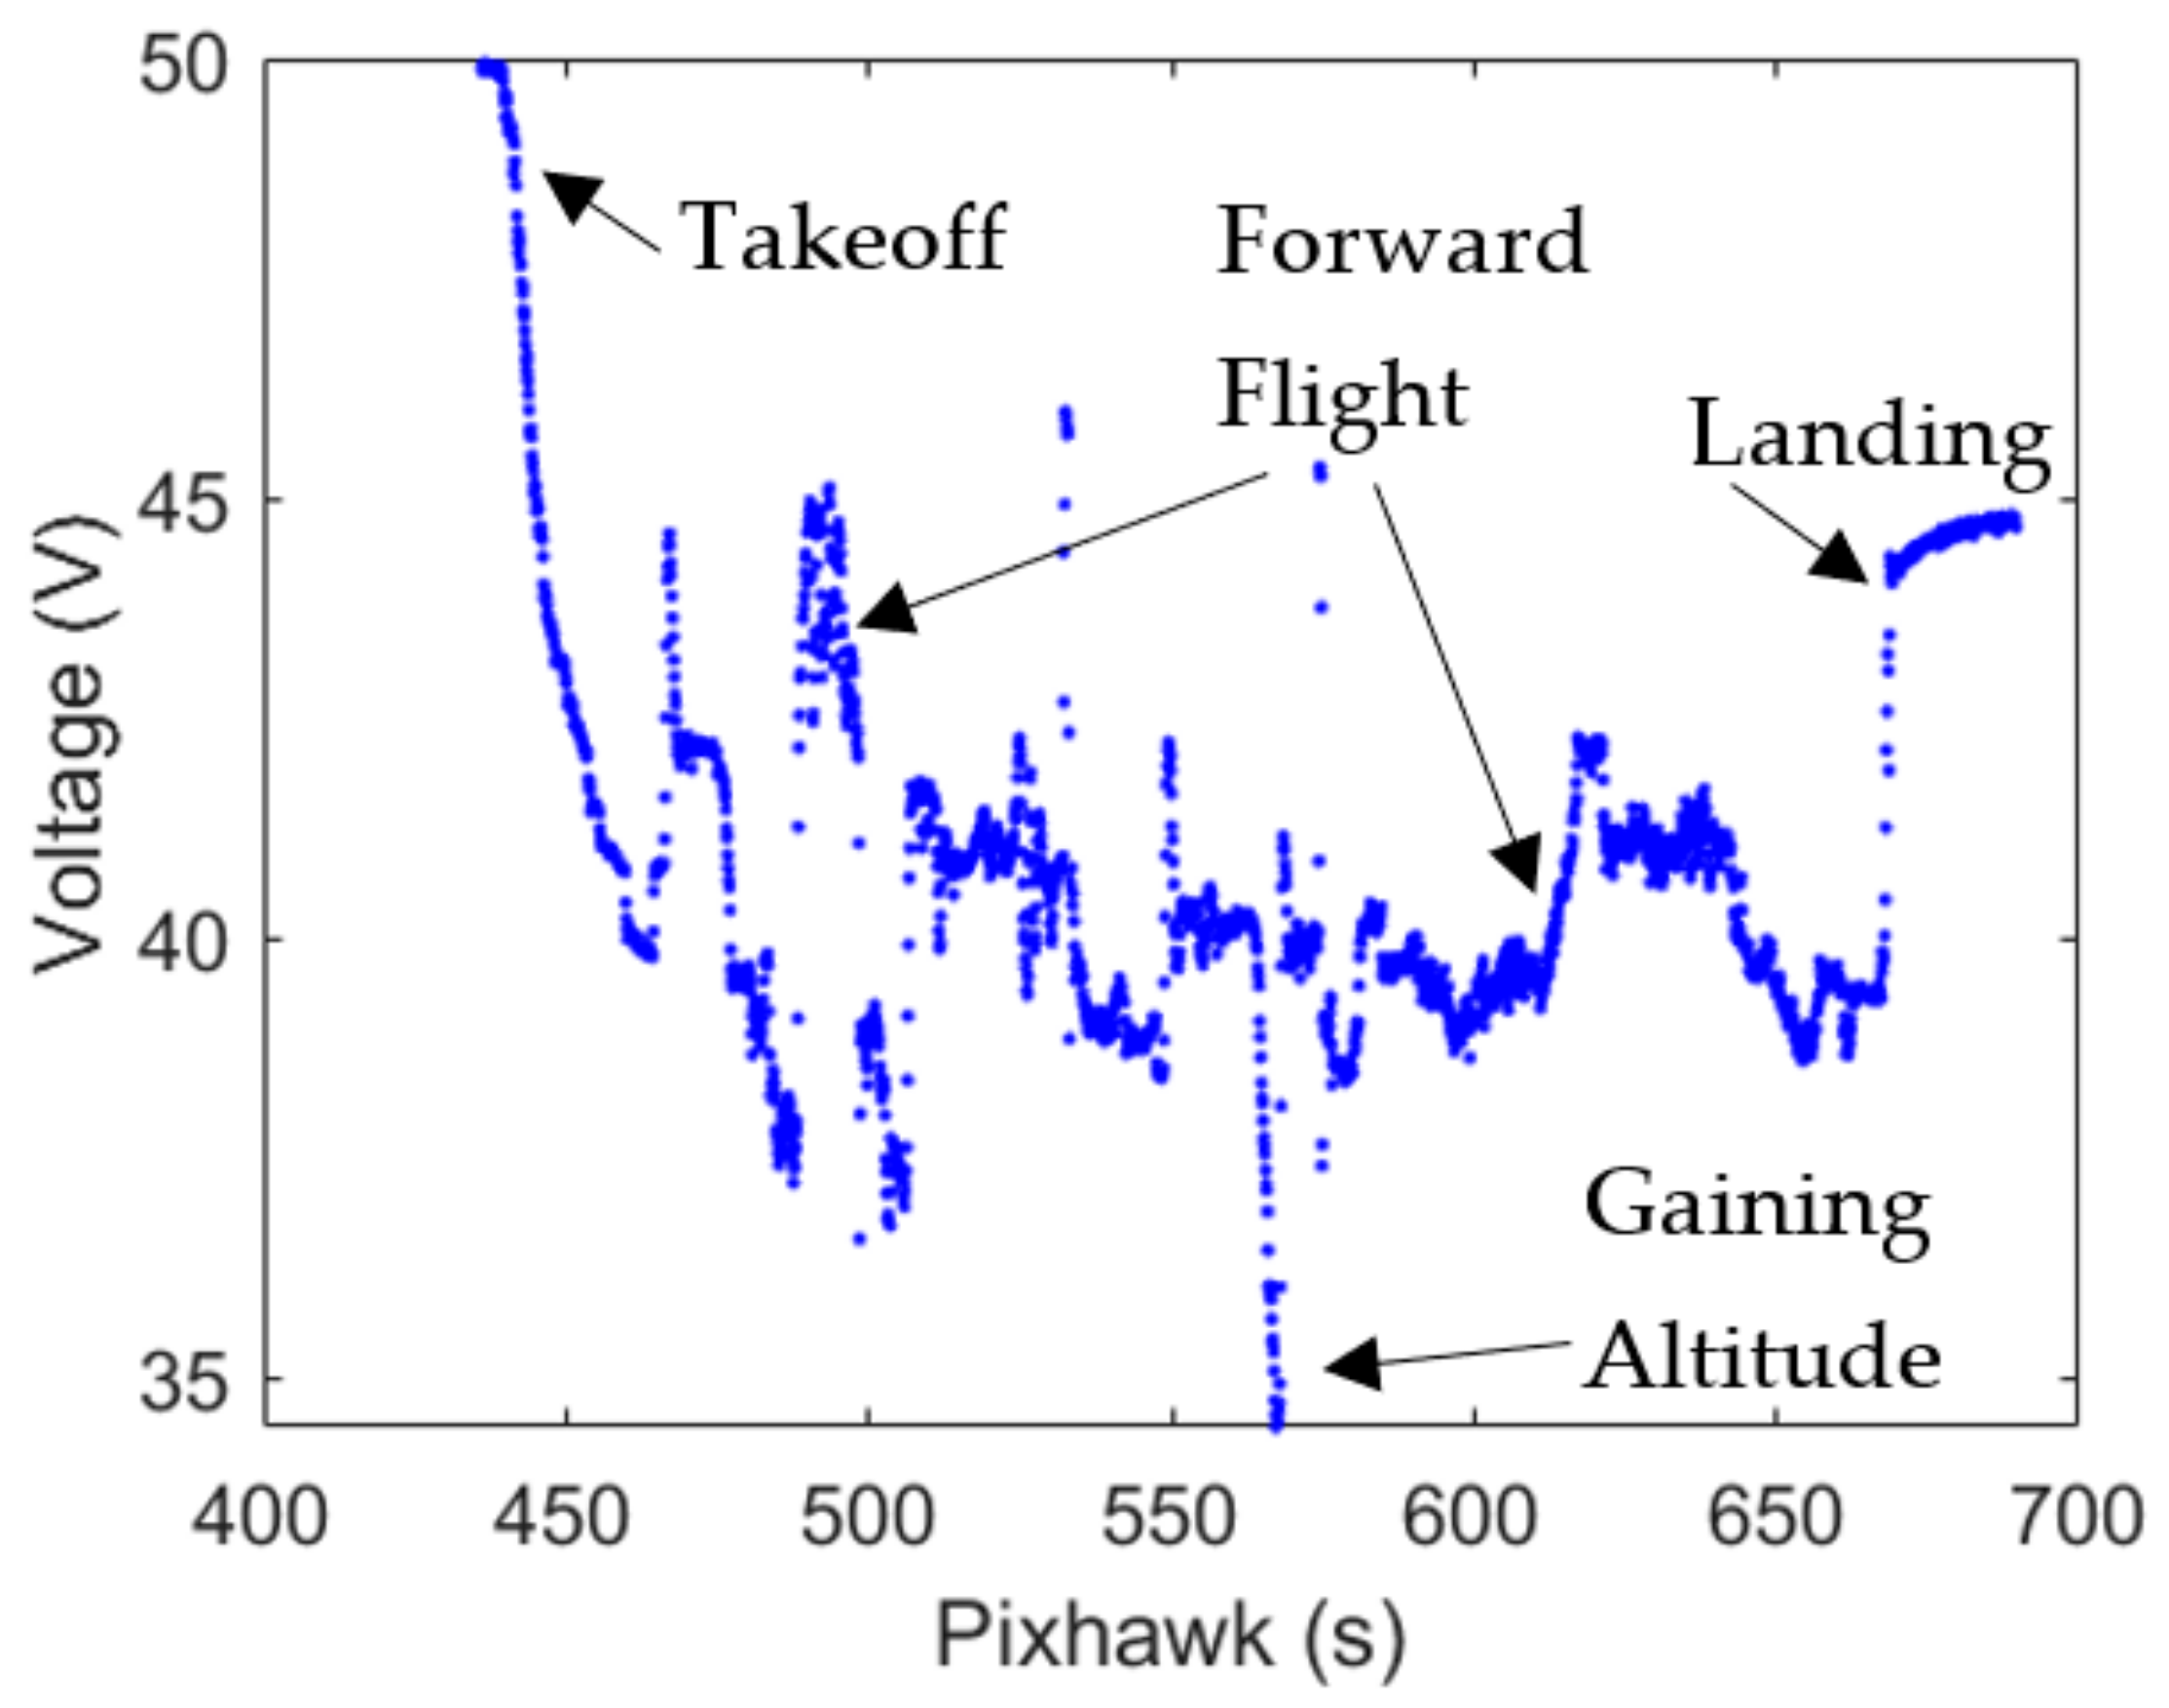
4.1. Power Data
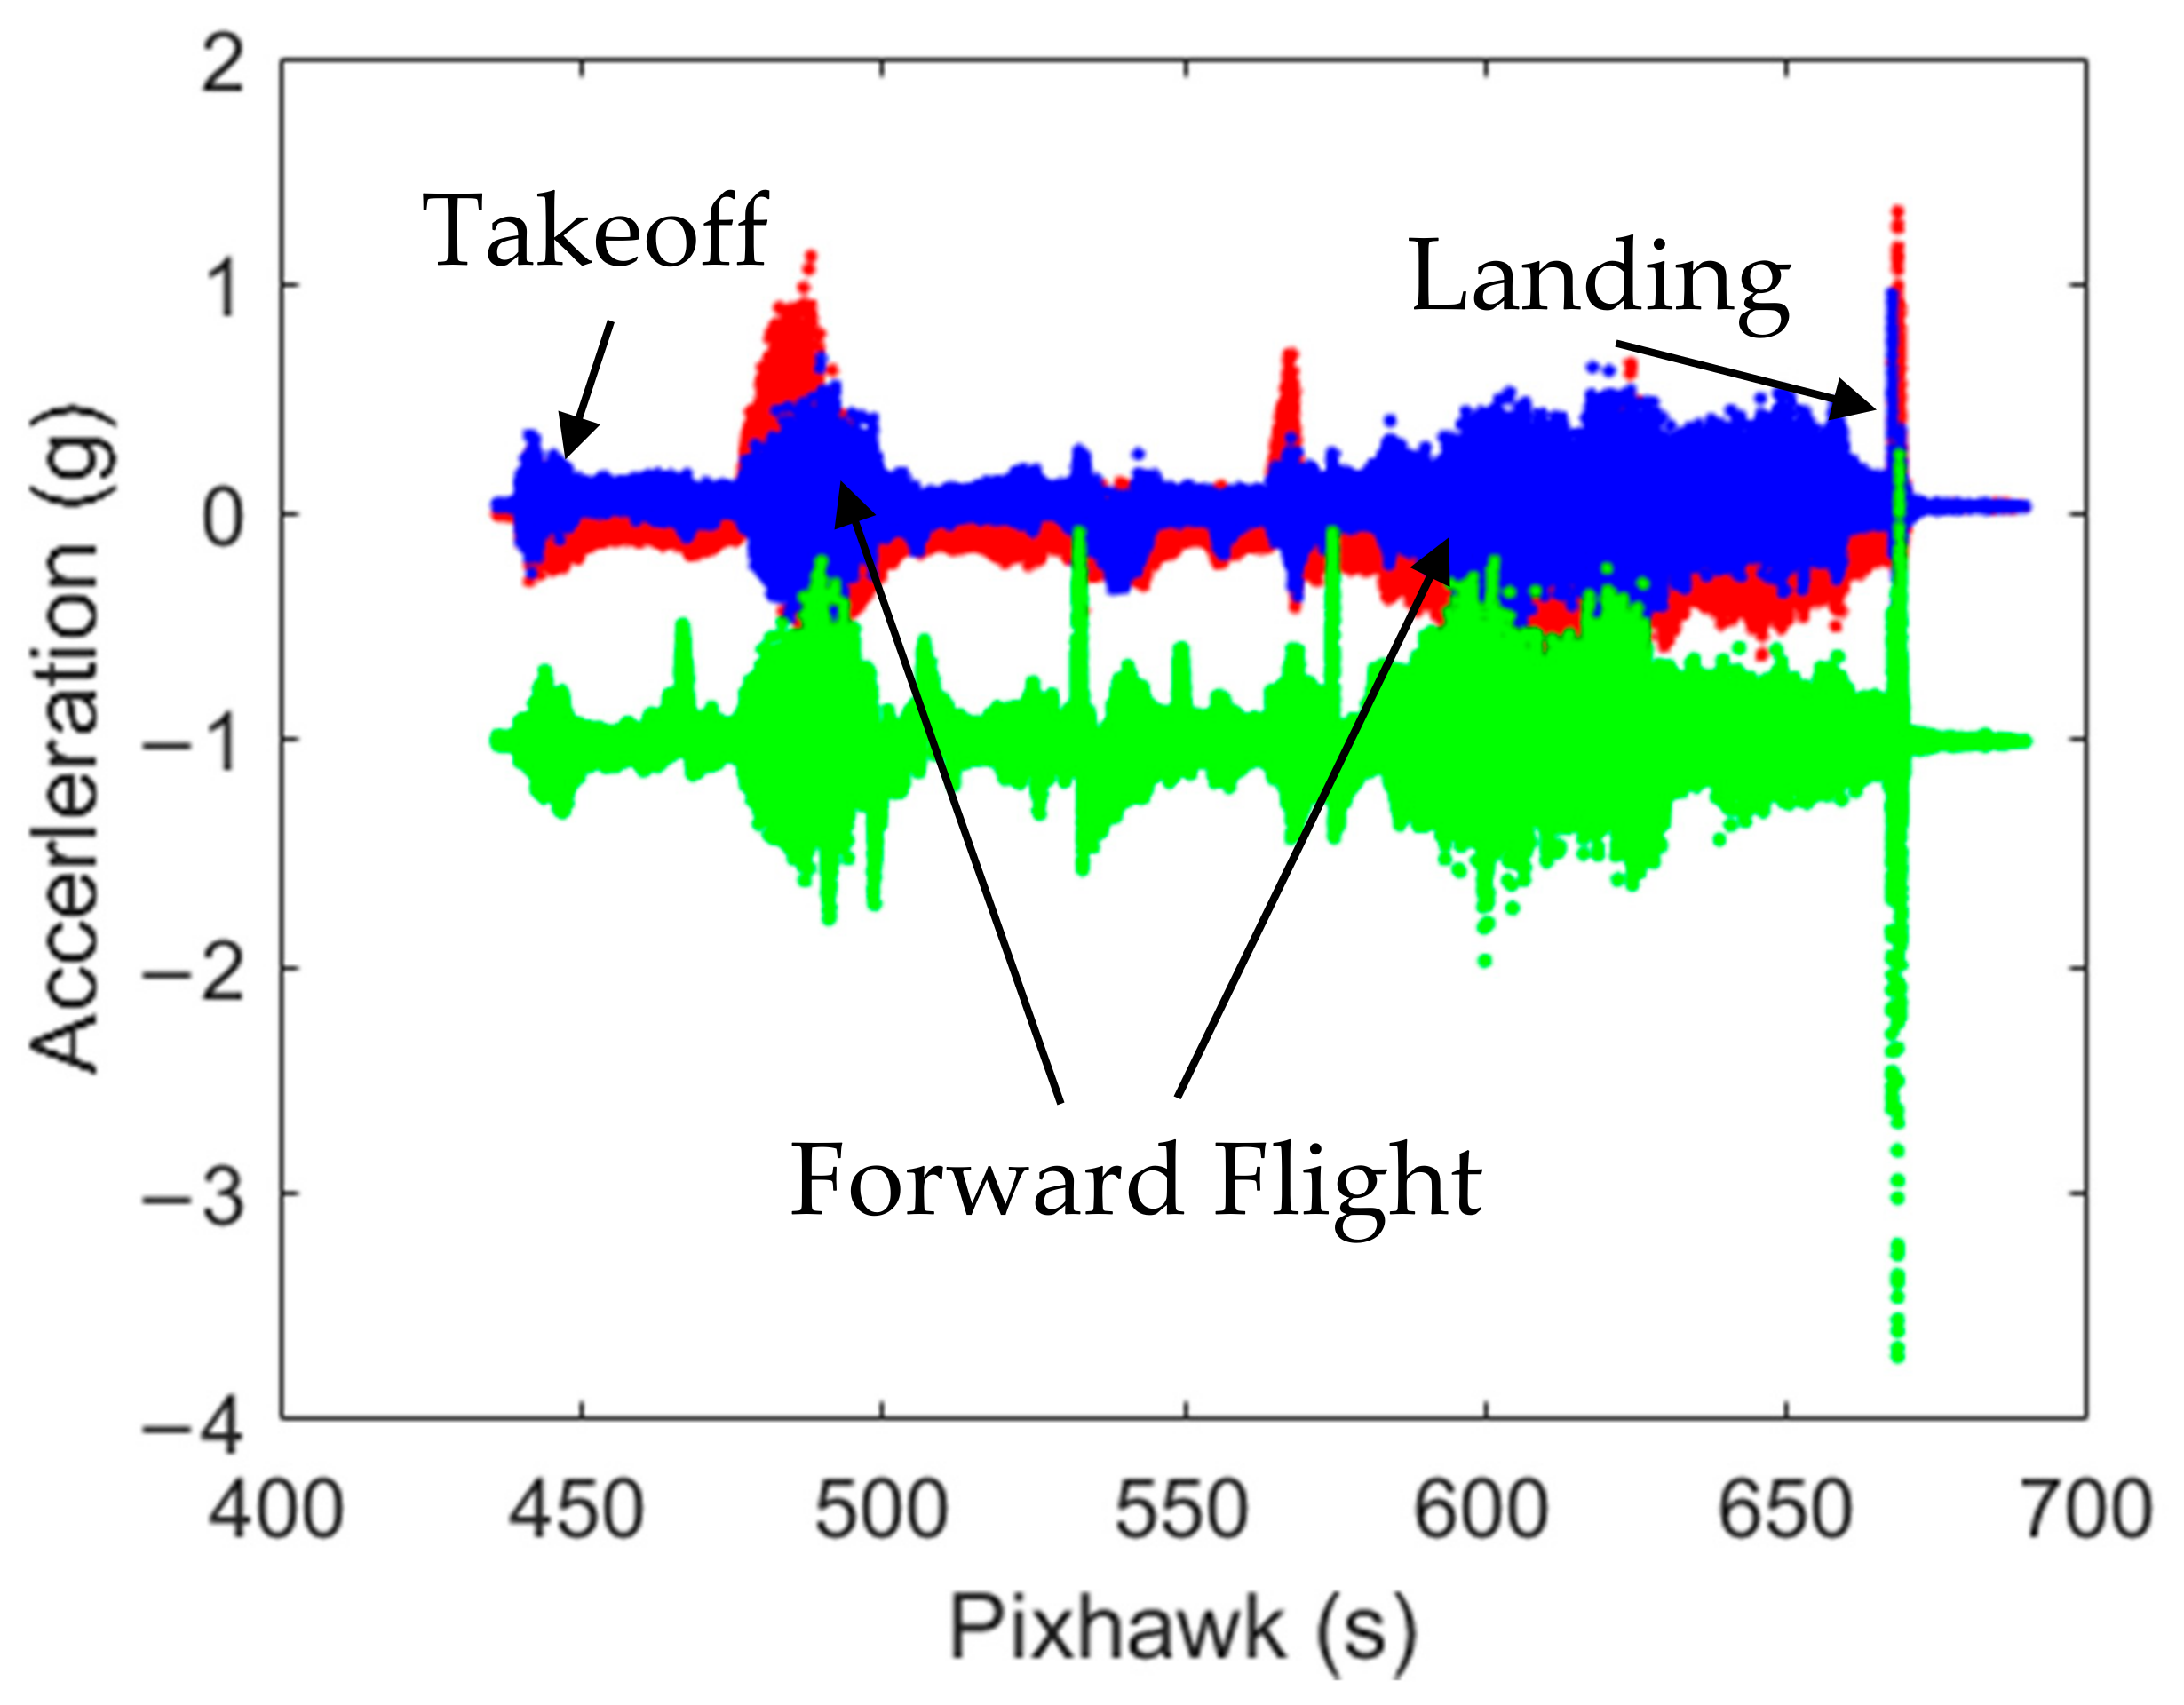
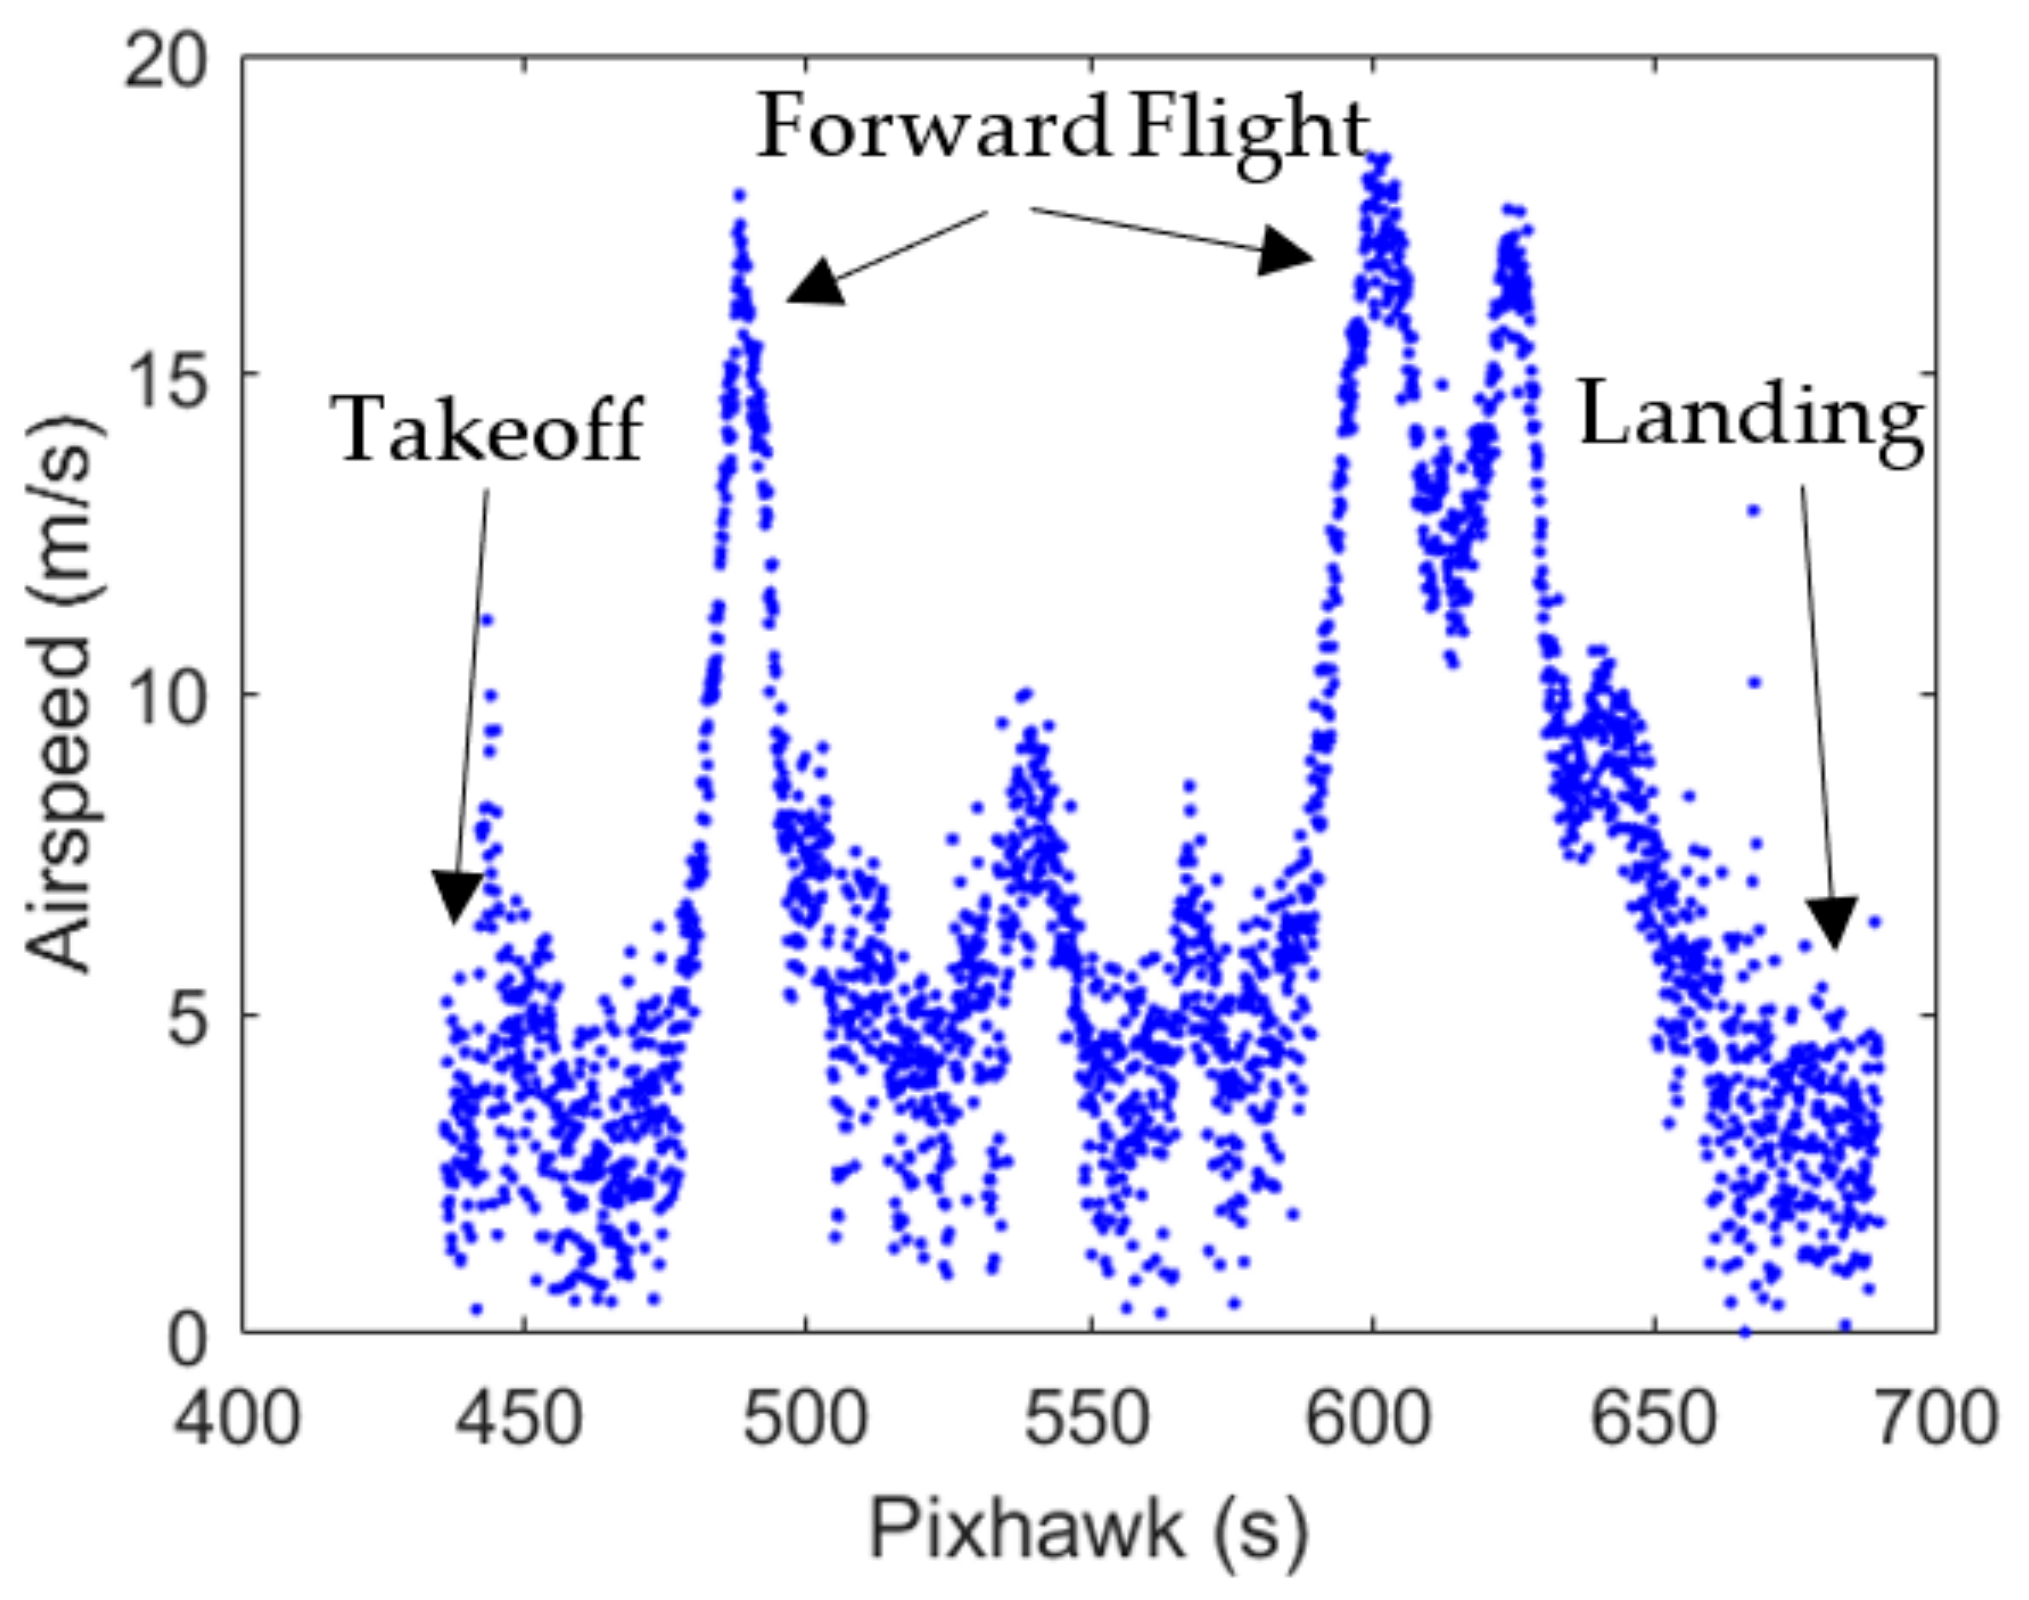
4.2. Vibration and Airspeed
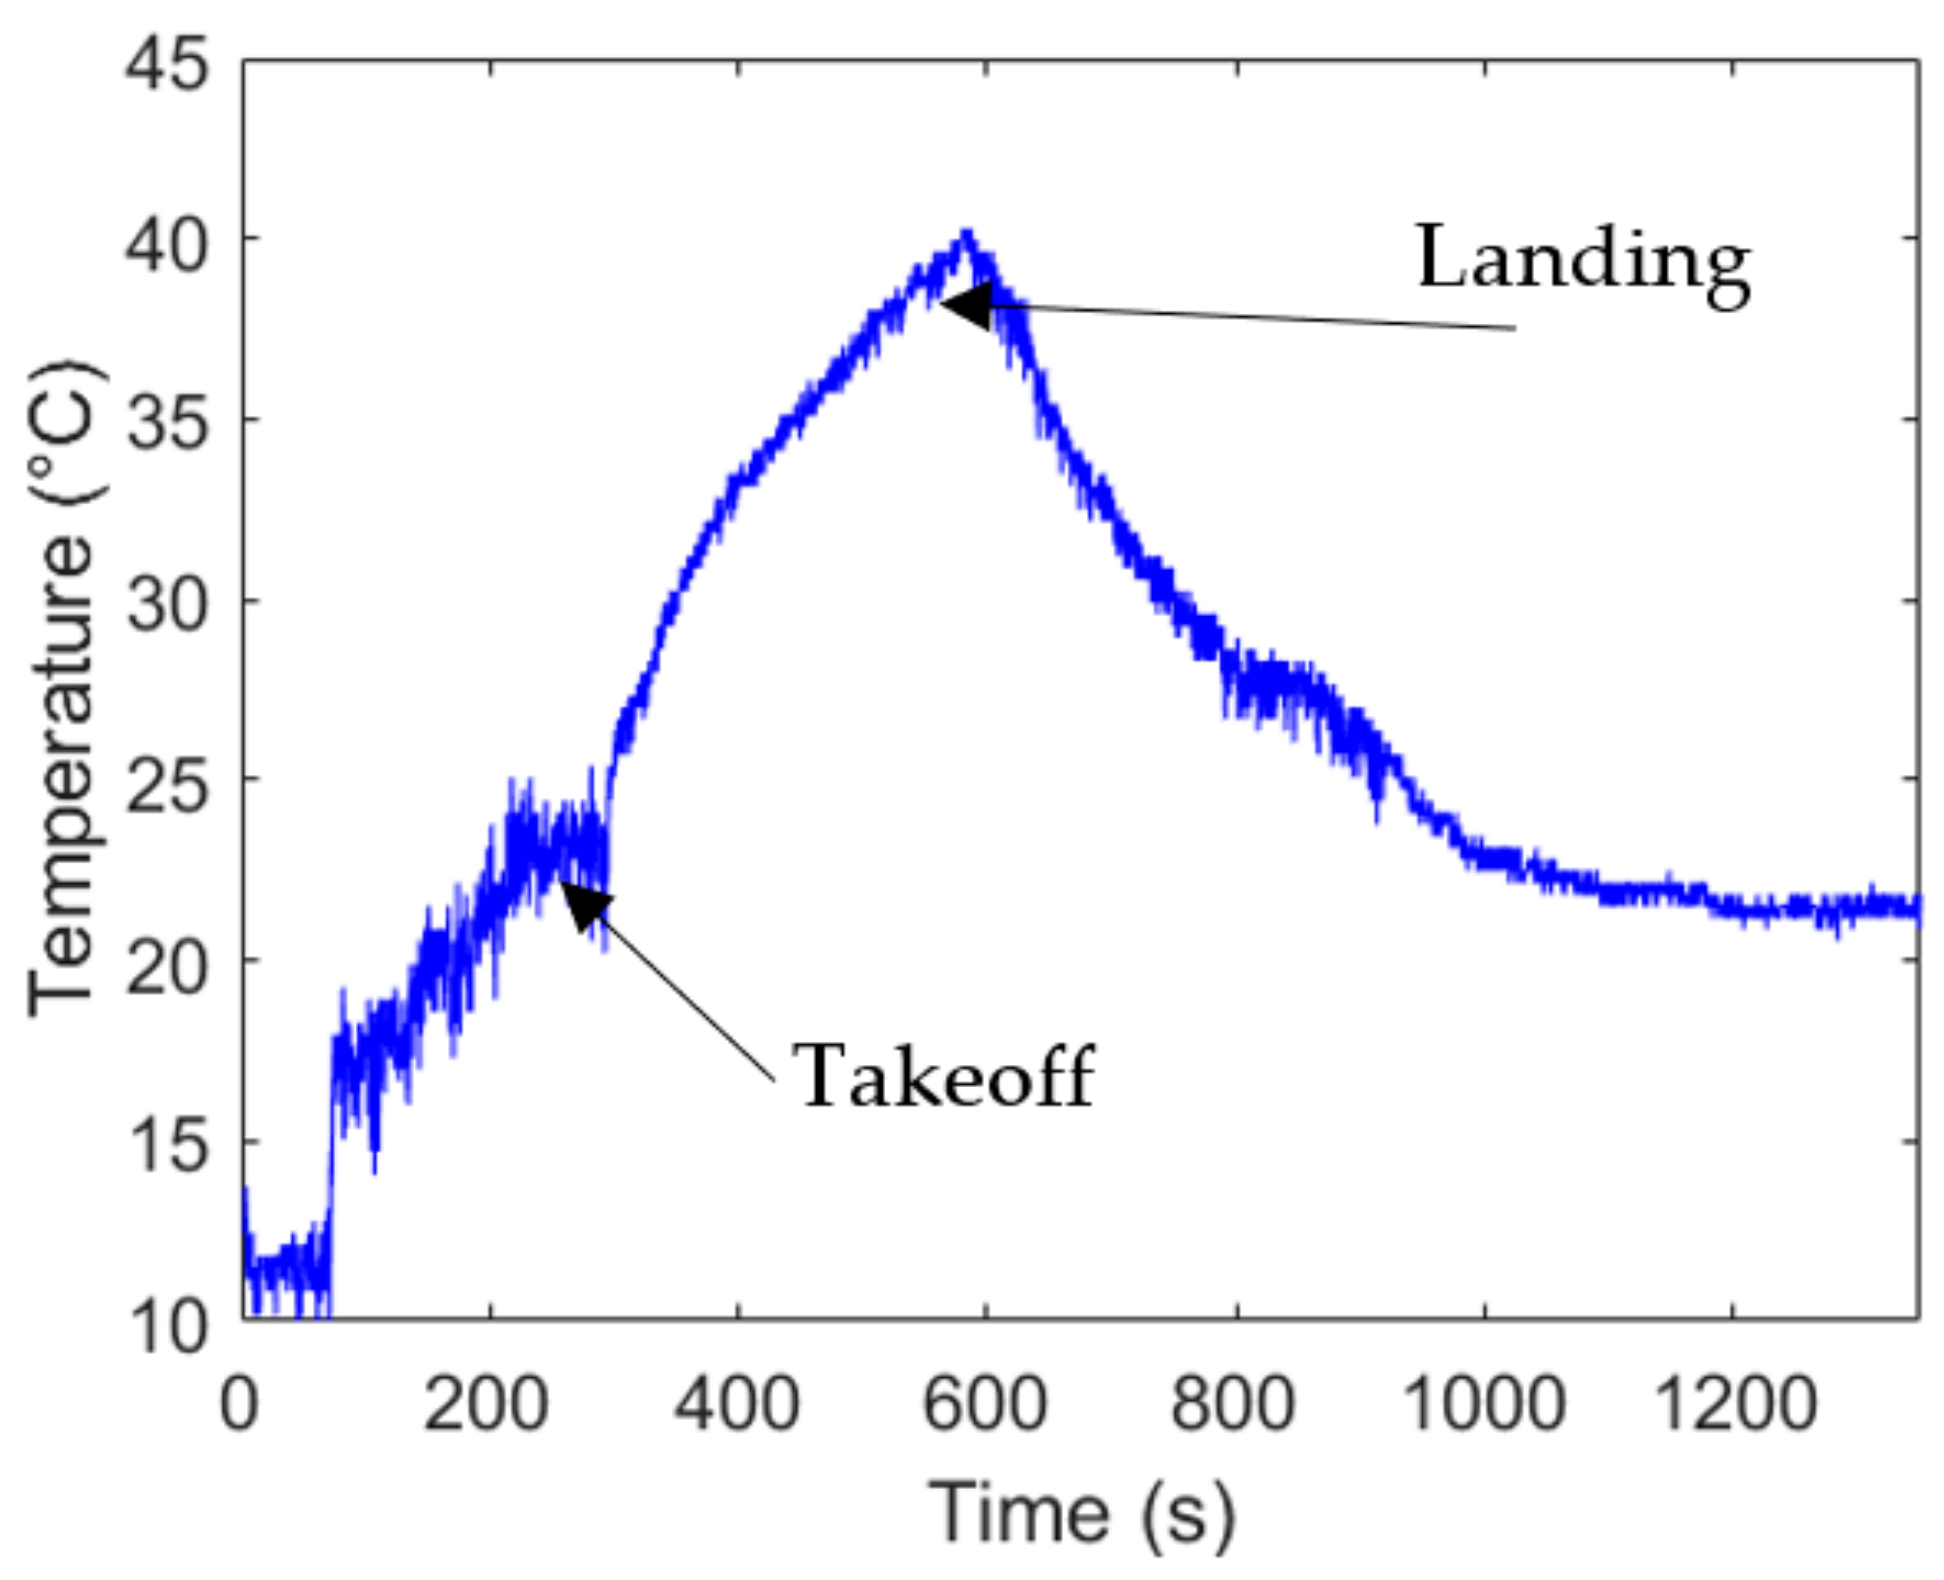
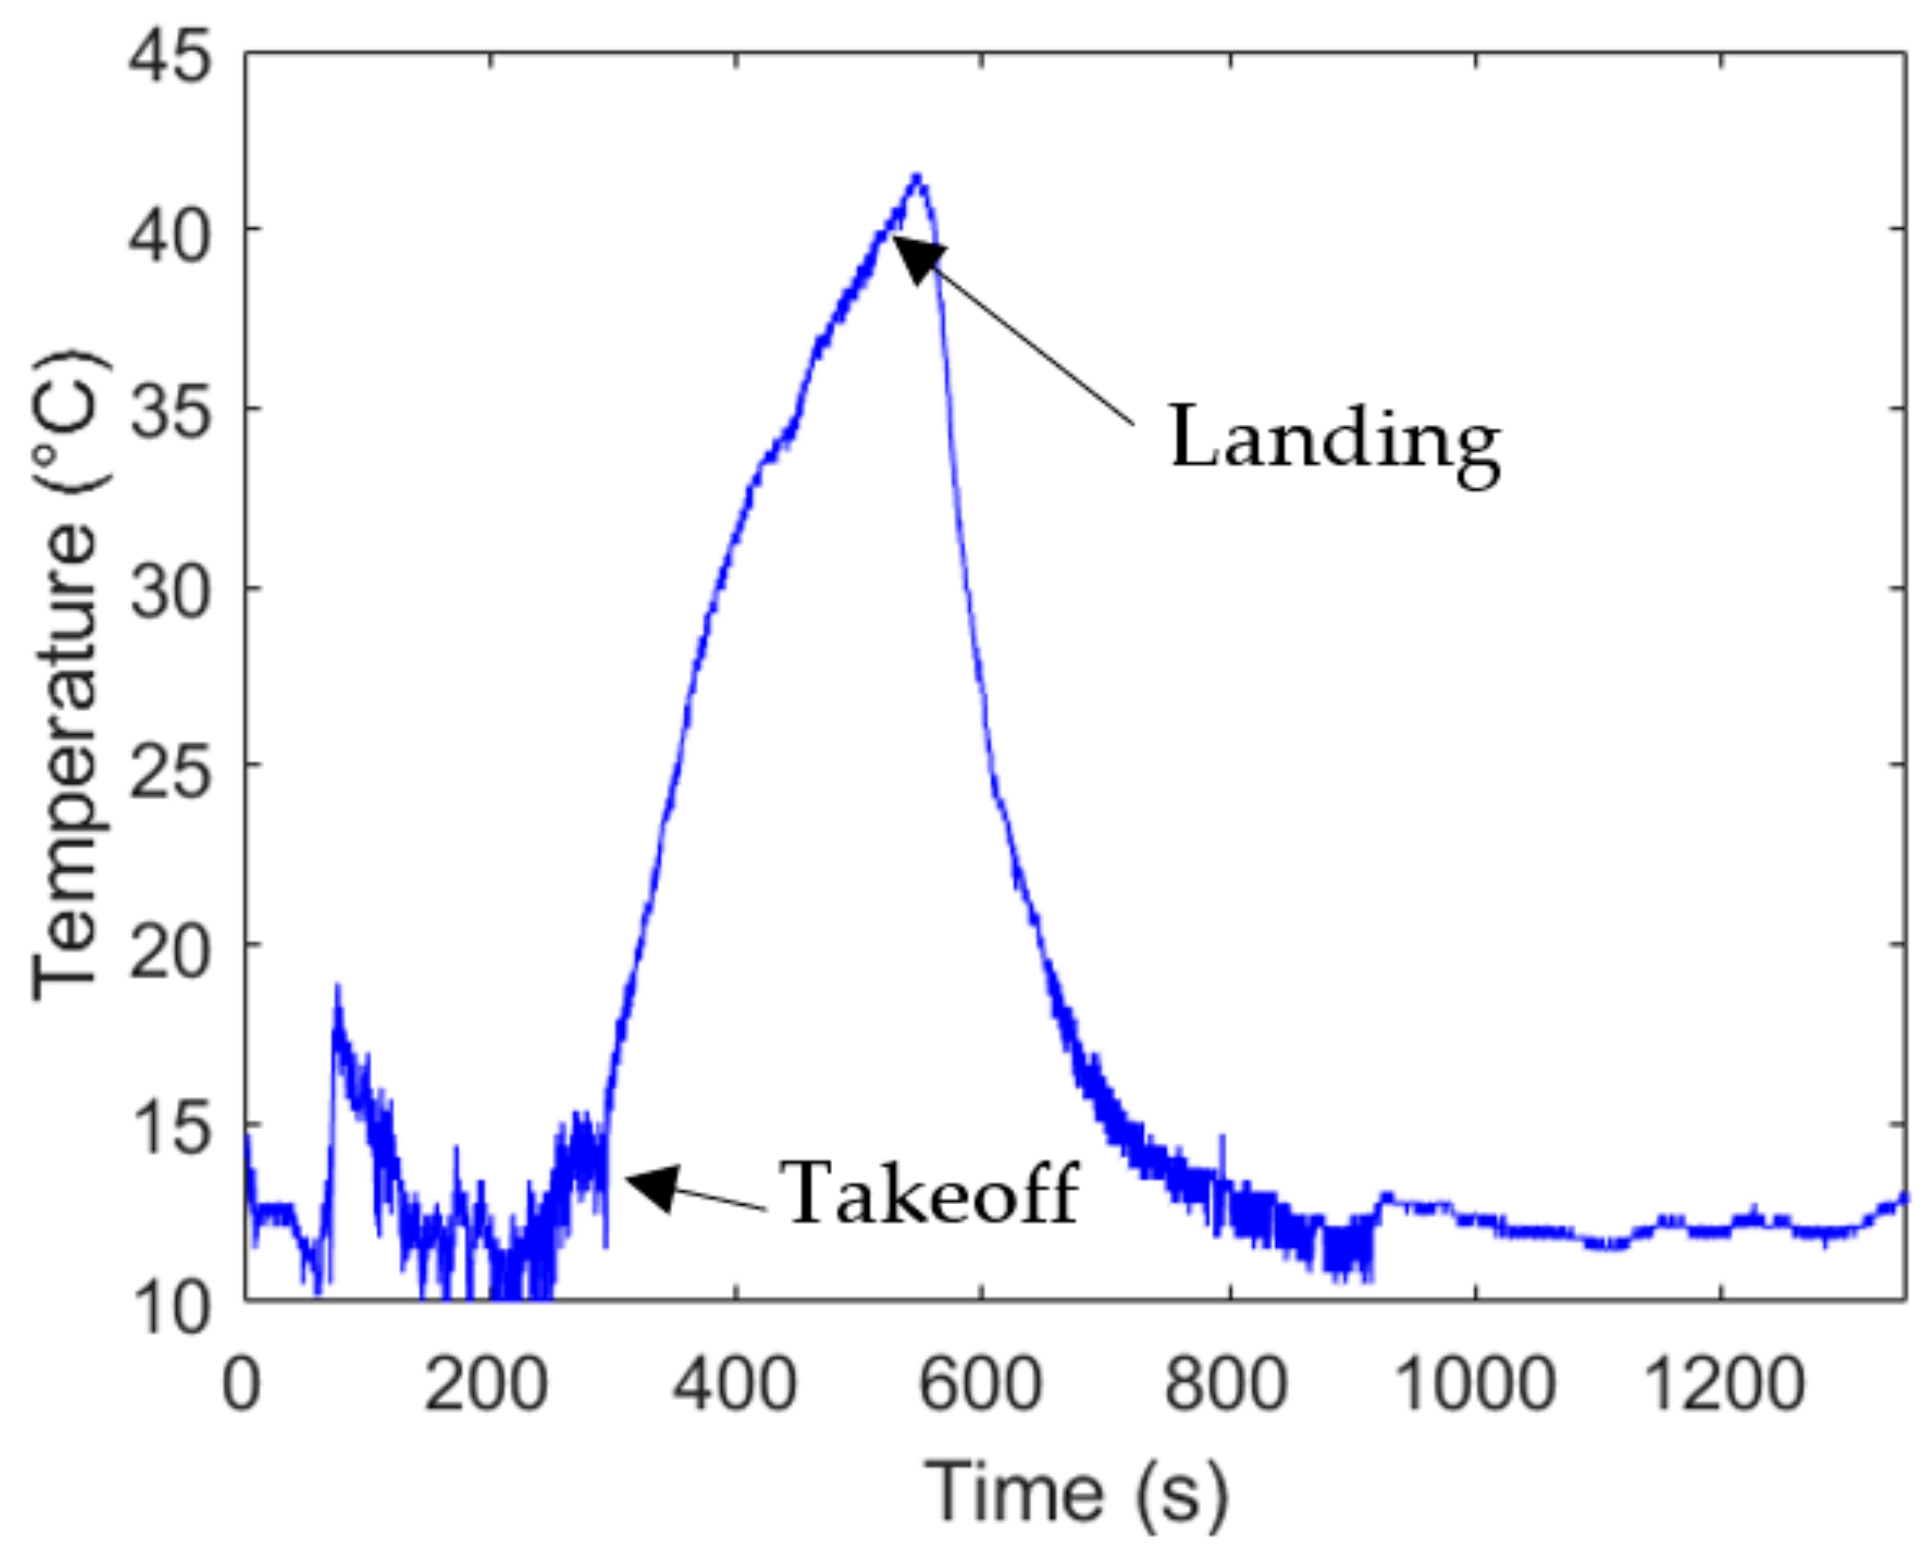
4.3. Thermocouple Data
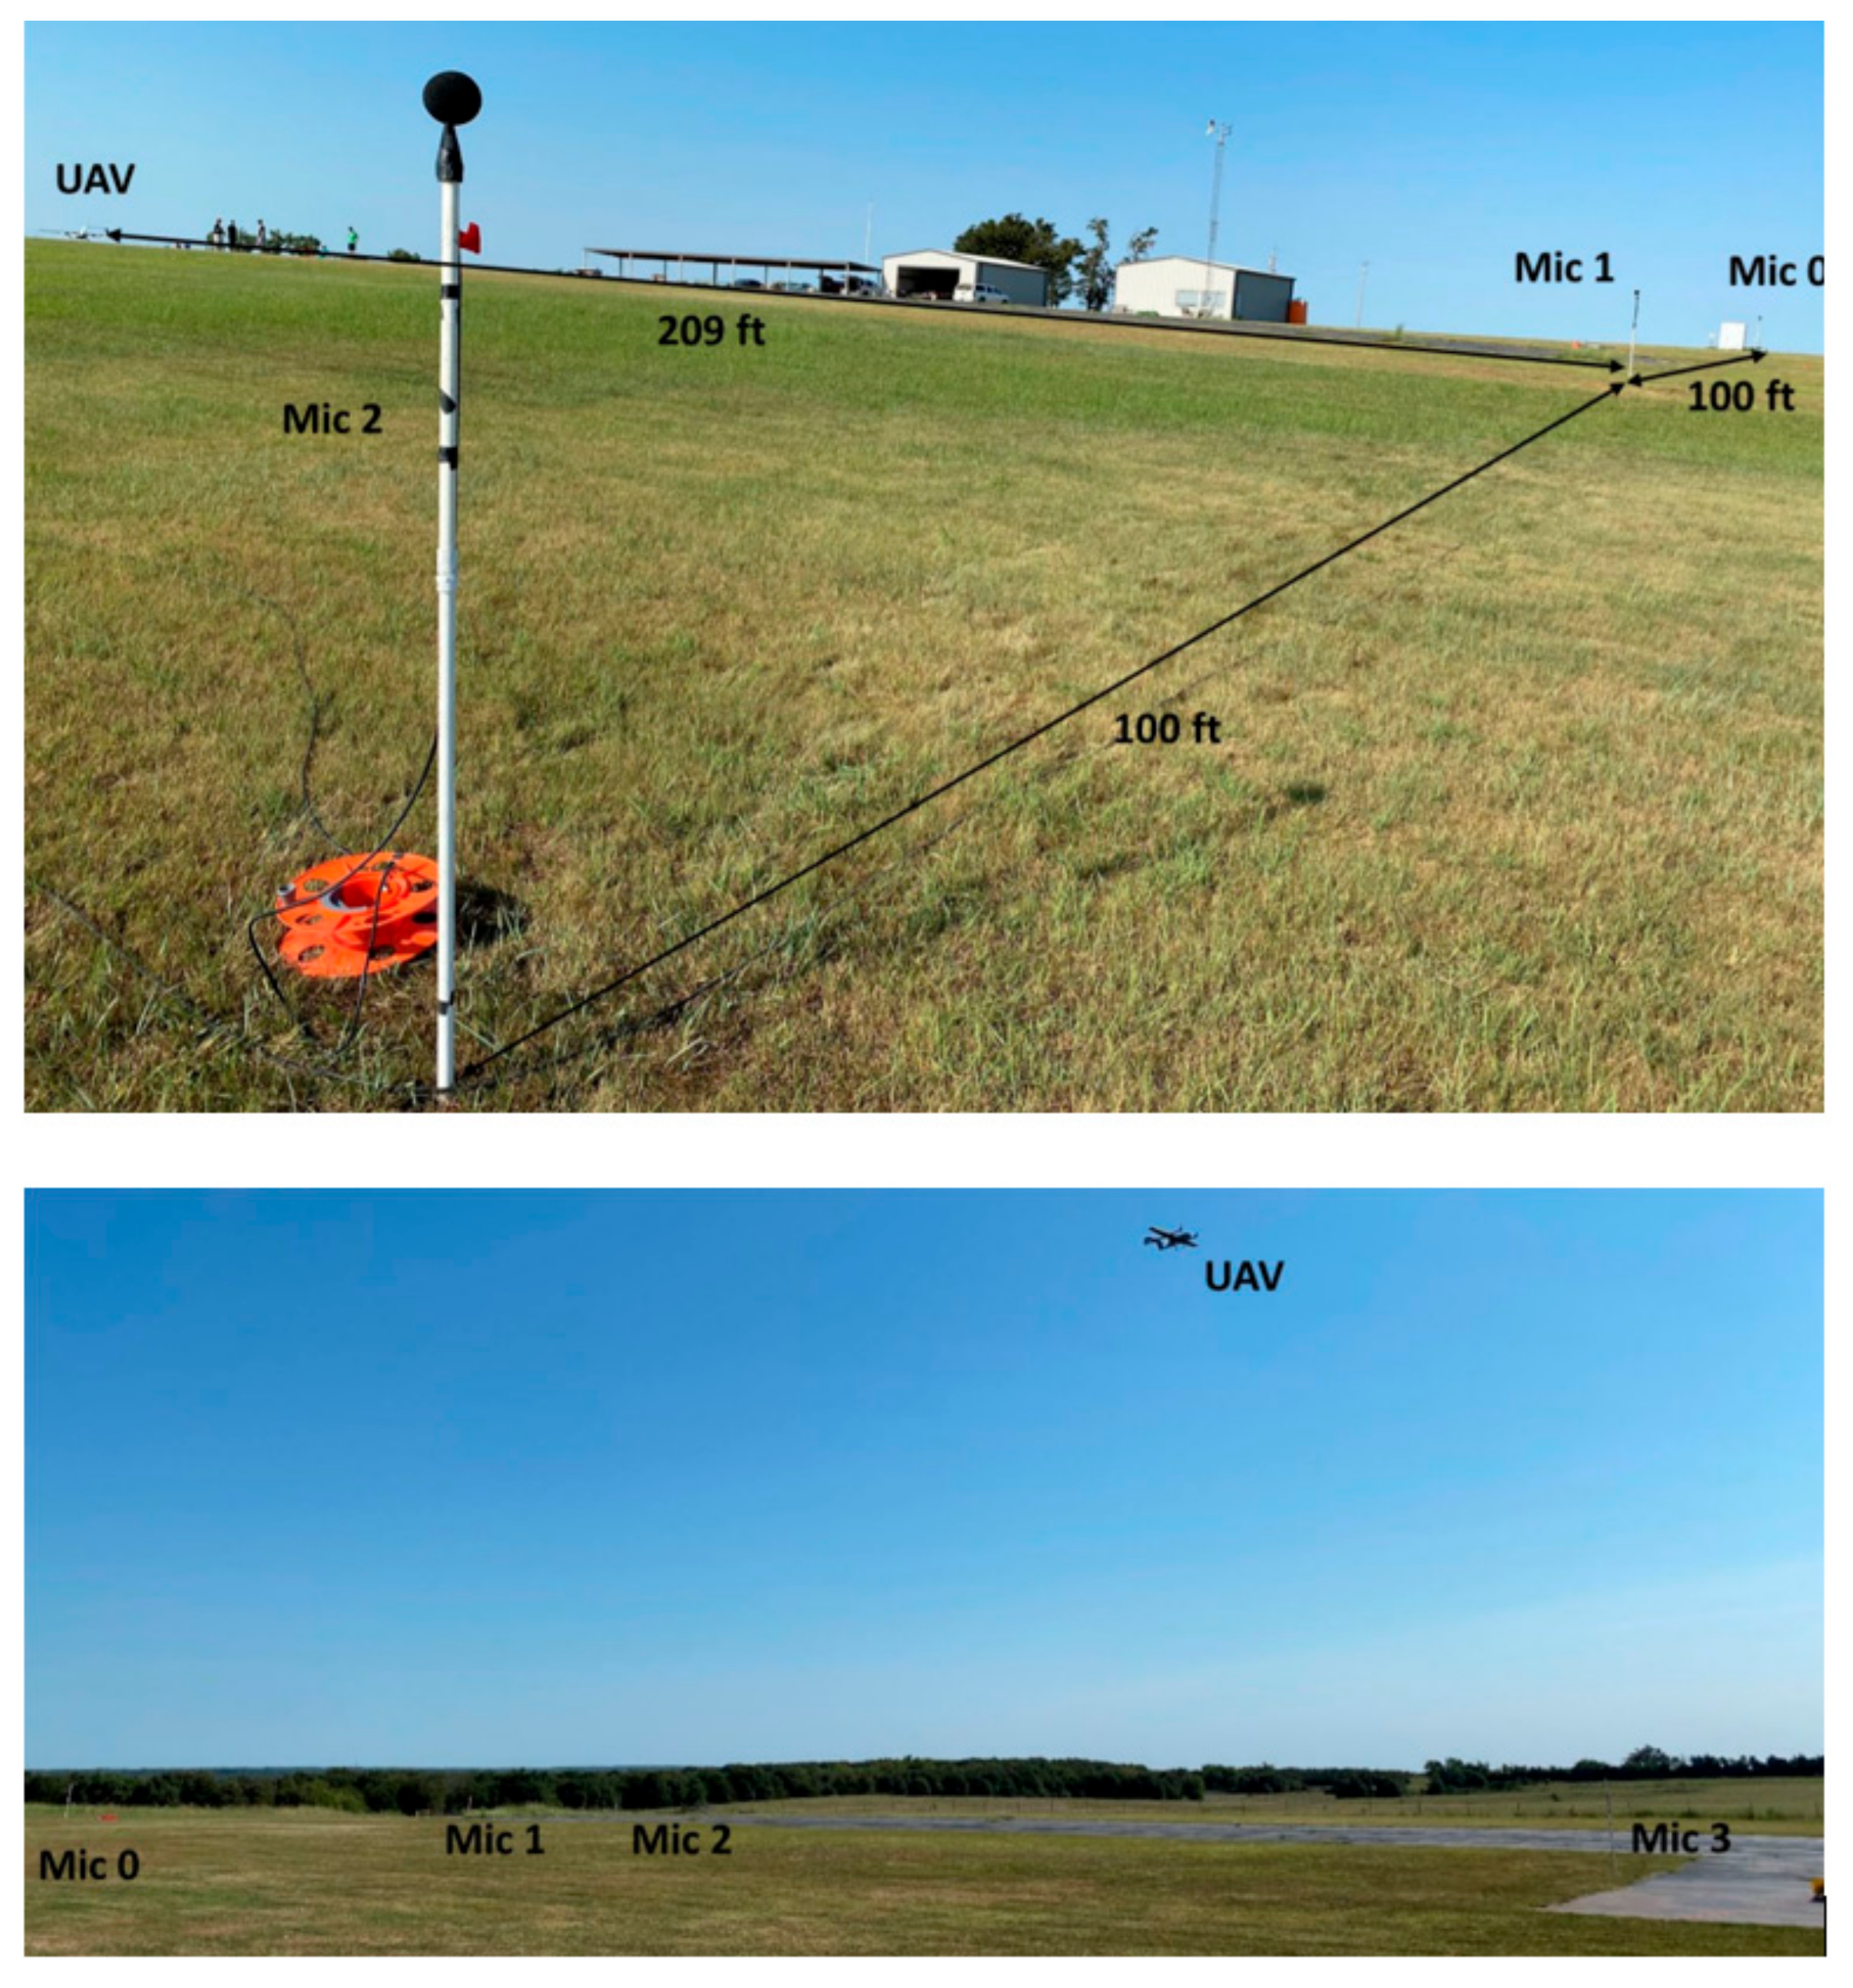
4.4. Far Field Acoustic Data
4.5. Uncertainty
5. Discussion
5.1. Impact of Power Augmentation Battery on Reliability
5.2. Active Cooling Requirements for Safe Operation
5.3. Battery Management for Safe Operation
6. Conclusions and Recommendations
6.1. Power Management
6.2. Thermal Management
6.3. Electrical Safety Features
6.4. Battery Sizing
6.5. Weight Estimation
6.6. Additional Considerations
6.7. Future Studies
Author Contributions
Funding
Institutional Review Board Statement
Informed Consent Statement
Data Availability Statement
Acknowledgments
Conflicts of Interest
References
- Armstrong, M.J.; Ross, C.A.H.; Blackwelder, M.J.; Rajashekara, K. Propulsion System Component Considerations for NASA N3-X Turboelectric Distributed Propulsion System. SAE Int. J. Aerosp. 2012, 5, 344–353. [Google Scholar] [CrossRef]
- Armstrong, M.J.; Blackwelder, M.; Bollman, A.; Ross, C.; Campbell, A.; Jones, C.; Norman, P.; Blackwelder, M.; Bollman, A.; Ross, C.; et al. Architecture, Voltage, and Components for a Turboelectric Distributed Propulsion Electric Grid; NASA: Washington, DC, USA, 2015. [Google Scholar]
- Dae Kim, H.; Felder, J.L.; Tong, M.T.; Berton, J.J.; Haller, W.J. Turboelectric Distributed Propulsion Benefits on the N3-X Vehicle. Aircr. Eng. Aerosp. Technol. 2014, 86, 558–561. [Google Scholar] [CrossRef]
- Scheidler, J.J.; Tallerico, T.F. Design, Fabrication, and Critical Current Testing of No-Insulation Superconducting Rotor Coils for NASA’s 1.4 MW High-Efficiency Megawatt Motor. In Proceedings of the 2018 AIAA/IEEE Electric Aircraft Technologies Symposium, Cincinnati, OH, USA, 9–11 July 2018. [Google Scholar] [CrossRef] [Green Version]
- Jansen, R.H.; Bowman, C.; Jankovsky, A.; Dyson, R.; Felder, J. Overview of NASA Electrified Aircraft Propulsion (EAP) Research for Large Subsonic Transports. In Proceedings of the 53rd AIAA/SAE/ASEE Joint Propulsion Conference, Atlanta, GA, USA, 10–12 July 2017. [Google Scholar]
- Misra, A. Energy Storage for Electrified Aircraft: The Need for Better Batteries, Fuel Cells, and Supercapacitors. IEEE Electrif. Mag. 2018, 6, 54–61. [Google Scholar] [CrossRef]
- Brown, A.; Harris, W.L. Vehicle Design and Optimization Model for Urban Air Mobility. J. Aircr. 2020, 57, 1003–1013. [Google Scholar] [CrossRef]
- Kühnelt, H.; Beutl, A.; Mastropierro, F.; Laurin, F.; Willrodt, S.; Bismarck, A.; Guida, M.; Romano, F. Structural Batteries for Aeronautic Applications—State of the Art, Research Gaps and Technology Development Needs. Aerospace 2021, 9, 7. [Google Scholar] [CrossRef]
- Johnson, W.; Silva, C.; Solis, E. Concept Vehicles for VTOL Air Taxi Operations. In Proceedings of the AHS Technical Conference on Aeromechanics Design for Transformative Vertical Flight, San Francisco, CA, USA, 16–19 January 2018. [Google Scholar]
- Silva, C.; Johnson, W.; Antcliff, K.R.; Patterson, M.D. VTOL Urban Air Mobility Concept Vehicles for Technology Development. In Proceedings of the 2018 Aviation Technology, Integration, and Operations Conference, Atlanta, GA, USA, 25–29 June 2018. [Google Scholar] [CrossRef] [Green Version]
- Hendricks, E.S.; Falck, R.D.; Gray, J.S.; Aretskin-Hariton, E.D.; Ingraham, D.J.; Chapman, J.W.; Schnulo, S.L.; Chin, J.C.; Jasa, J.P.; Bergeson, J.D.; et al. Multidisciplinary Optimization of a Turboelectric Tiltwing Urban Air Mobility Aircraft. In Proceedings of the AIAA Aviation 2019 Forum, Dallas, TX, USA, 17–21 June 2019; pp. 1–20. [Google Scholar] [CrossRef] [Green Version]
- Eqbal, M.; Fernando, N.; Marino, M.; Wild, G. Development of a Turbo Electric Distribution System for Remotely Piloted Aircraft Systems. J. Aerosp. Technol. Manag. 2021, 13. [Google Scholar] [CrossRef]
- Moody, K.J.; Replogle, C.J.; Rouser, K.P. Validation of Analytical Model for Turboelectric Power System for Preliminary Design Purposes. J. Eng. Gas Turbines Power 2020, 142, 081011. [Google Scholar] [CrossRef]
- Moody, K.J.; Replogle, C.; Rouser, K.P. Design, Characterization, and Integration of a Turboelectric Power System for Small Unmanned Multirotor Aircraft. In Proceedings of the AIAA Propulsion and Energy 2019 Forum, Indianapolis, IN, USA, 19–22 August 2019. [Google Scholar]
- Moody, K.J. Design, Analysis, and Integration of a Turboelectric Propulsion and Power System for Unmanned Aircraft. Master’s Thesis, Oklahoma State University, Stillwater, OK, USA, 2020. [Google Scholar]
- Runnels, T.R.; Burgess, J.M.; Johnsen, J.P.; Rouser, K.P. Experimental Study of 5-KW, 7-KW, and 13-KW Unmanned Aircraft Turboelectric Power Systems. In Proceedings of the AIAA Propulsion and Energy 2021 Forum, Virtual, 9–11 August 2021. [Google Scholar]
- Burgess, J.; Runnels, T.; Johnsen, J.; Drake, J.; Rouser, K. Experimental Comparison of Direct and Active Throttle Control of a 7 KW Turboelectric Power System for Unmanned Aircraft. Appl. Sci. 2021, 11, 10608. [Google Scholar] [CrossRef]
- Johnsen, J.P.; Runnels, T.; Burgess, J.M.; Rouser, K.P. Integration of a 7-KW Turboelectric Power System in a Vertical Take-Off and Landing Unmanned Aircraft. In Proceedings of the AIAA Propulsion and Energy 2021 Forum, Virtual, 9–11 August 2021. [Google Scholar] [CrossRef]
- Bowman, C.L.; Felder, J.L.; Marien, T.V. Turbo- and Hybrid-Electrified Aircraft Propulsion Concepts for Commercial Transport. In Proceedings of the 2018 AIAA/IEEE Electric Aircraft Technologies Symposium (EATS), Cincinnati, OH, USA, 12–14 July 2018; pp. 1–8. [Google Scholar]


| Component | Description | Specification |
|---|---|---|
| Flight Controller | Pixhawk 2.1 Orange Cube | 14 output pins, GPS, accelerometer, and compass. (Data log rate of 25 Hz) Accelerometer 0 g to 30 g, error ±0.001 g |
| Secondary GPS | Here2 GNSS GPS Module | Extra compass, GPS, accelerometer |
| Radio Remote/Transmitter | Futaba 14SG | 14 Channel 2.4 GHz Transmitter |
| Radio Receiver | Futaba S.Bus Rec HV 2.4 GHz | S-Bus 2.4 GHz Receiver |
| Telemetry Radio Transmitter | RFD 900+ | 1 Watt output power, 9 mile range |
| Telemetry Radio Receiver | RFD 900+ | 1 Watt output power, 9 mile range |
| Pitot Airspeed Telemetry | mRo I2C Airspeed Sensor | I2C 5 V transducer (Range of 7 kPa and error of ±0.84 Pa) |
| Servo Power Board | PowerBox Competition | 12 channels, S-Bus |
| Digital Servo Motors | Savox SC-1256TG | 5 Volt, digital servo |
| Current and Voltage Sensor | Mauch Power Module HV 200 Amp 2x | Current Range 3 A to 200 A (400 A for two in parallel) ± 1.2% output error, Voltage range 0 V to 60 V ± 0.15 V |
| Temperature Sensor | TMP36GZ Thermocouple | Max of 125 °C, Min −40 °C, (±2 °C) |
| Component | Weight (N) | Weight (lbf) | Percentage |
|---|---|---|---|
| Power Battery Weight | 33.4 | 7.5 | 9% |
| Avionics Battery Weight | 12.0 | 2.7 | 3% |
| Fuel Weight | 26.7 | 6.0 | 7% |
| Turboelectric System | 78.7 | 17.7 | 21% |
| Empty Aircraft | 227.2 | 51.0 | 60% |
| Total Flight Weight | 378.0 | 84.9 | 100% |
Publisher’s Note: MDPI stays neutral with regard to jurisdictional claims in published maps and institutional affiliations. |
© 2022 by the authors. Licensee MDPI, Basel, Switzerland. This article is an open access article distributed under the terms and conditions of the Creative Commons Attribution (CC BY) license (https://creativecommons.org/licenses/by/4.0/).
Share and Cite
Johnsen, J.; Runnels, T.; Burgess, J.; Jdiobe, M.; Rouser, K. Integration and Flight Test of a 7 kW Turboelectric Vertical Take-Off and Landing Unmanned Aircraft. Appl. Sci. 2022, 12, 7961. https://doi.org/10.3390/app12167961
Johnsen J, Runnels T, Burgess J, Jdiobe M, Rouser K. Integration and Flight Test of a 7 kW Turboelectric Vertical Take-Off and Landing Unmanned Aircraft. Applied Sciences. 2022; 12(16):7961. https://doi.org/10.3390/app12167961
Chicago/Turabian StyleJohnsen, Joshua, Timothy Runnels, Johnathan Burgess, Muwanika Jdiobe, and Kurt Rouser. 2022. "Integration and Flight Test of a 7 kW Turboelectric Vertical Take-Off and Landing Unmanned Aircraft" Applied Sciences 12, no. 16: 7961. https://doi.org/10.3390/app12167961
APA StyleJohnsen, J., Runnels, T., Burgess, J., Jdiobe, M., & Rouser, K. (2022). Integration and Flight Test of a 7 kW Turboelectric Vertical Take-Off and Landing Unmanned Aircraft. Applied Sciences, 12(16), 7961. https://doi.org/10.3390/app12167961