Abstract
A numerical study is conducted for converging stepped spillways with various spillway slopes, sidewall convergence and flow discharges to understand the influences of converging sidewalls on skimming flows. Compared with the traditional uniform-width stepped spillway, the converging sidewall changes the skimming flow features by generating standing waves on the free-surface, curving the mainstream streamlines and squeezing and distorting the bottom rotations. For free-surface, mainstream and bottom rotations, the width of disturbed regions by the converging sidewall varies, with that for bottom rotations being 1.5 times that for mainstream and 3 times that for free-surface. The variation rules of disturbed region widths along the spillway are obtained, and the maximum widths increase as the convergence angle and incoming flow discharge increase, and the spillway slope decreases. Three equations are established for predicting the maximum widths of disturbed regions for free-surface, mainstream and bottom rotations of skimming flow. Since the disturbed region of skimming flow generated by the converging sidewall is characterized by strong standing waves, high flow velocity and low air concentration, appropriate engineering measurements should be taken for the disturbed region to meet the challenges to overtopping, energy dissipation and cavitation control.
1. Introduction
Stepped spillways are spillways with successive steps on the spillway chute. These steps create bottom rotations beneath descending water, which help with energy dissipation and eliminate the need for further energy dissipators downstream. Simultaneously, the flow turbulence created by the steps improves free-surface air–water transfer, reducing the possibility of cavitation.
The stepped spillways are generally uniform in width along the flow channel. With increasing discharge, three distinct flow regimes of nappe, transition and skimming have been found, and their flow performances, energy dissipation efficiencies, pressure characteristics and air–water flow properties have been thoroughly investigated [1,2,3,4,5,6,7,8,9,10].
Another type of stepped spillway includes converging sidewalls that cause the chute width to decrease continually throughout the flow path. These converging stepped spillways can accommodate some unique geological and topographical limits while also improving discharge capacity. The hydraulic performance of the air–water flow over the steps is affected and complicated by sidewall convergence in converging stepped spillways. One typical flow phenomenon occurring on the converging stepped spillways is the creation of standing waves near the sidewalls, especially during the skimming flow regime [11,12,13,14,15]. Hunt et al. [13] experimentally measured the depth of standing waves over a converging stepped spillway with a mild bottom slope of θ = 18.4° and found when the sidewall convergence angle Φ = 15°, 30° and 52°, the maximum standing wave depth can reach 1.0hc, 1.75hc and 3.0hc, respectively. Herein, hc = (q2/g)1/3 represents the critical flow depth at the spillway entrance, q represents the unit discharge at the spillway entrance, and g = 9.81 m∙s−2 is the gravity constant. As comparison, the flow depth of the region further away from the converging sidewalls should be smaller than hc because the flow pattern is supercritical with a Froude number Fr > 1. Prafull et al. [14] experimentally found that under a steep slope of θ = 45°, the maximum flow depth near the converging sidewall ranges from 2.35hc to 5.55hc, which is significantly higher than the values reported by Hunt et al. [13] under the milder slope (θ = 18.4°). Zindovic et al. [15] experimentally studied hydraulic characteristics within the standing waves of skimming flows over a converging stepped spillway of θ = 48.3°. They considered the standing wave to be the disturbed region by the sidewall, while the region outside the standing wave to be the undisturbed region, which has the same hydraulic characteristics as the flow over the stepped spillway with uniform-width; they found that the disturbed region has higher flow velocity and lower air concentration than the undisturbed region, and the width of the disturbed region increases with increasing convergence angle.
For the differences between the converging and uniform-width stepped spillways, the recent studies mainly focused on the features and width of standing waves above the free-surface [16,17,18]. The impact of converging sidewalls on the mainstream and bottom rotations of the skimming flow, on the other hand, is rarely explored. To the best of our understanding, whether the regions of the mainstream and the bottom rotations disturbed by the converging sidewall have the same widths as the standing wave still remains unclear. The disturbed widths of the converging sidewall for the mainstream and bottom rotations should vary depending on the incoming flow discharge and the geometry parameters of the converging stepped spillway, although no research or knowledge exists.
The purpose of this paper is to reveal how the converging sidewall affects the free-surface, mainstream and bottom rotations of the skimming flow and to explore the differences in width for the disturbed free-surface, mainstream and bottom rotations. Because the skimming flow over the converging stepped spillway is three-dimensional and its bottom rotations are difficult to visualize in experiments, numerical simulation is used in this study. On each step of the stepped spillways, the disturbed free-surface, mainstream, and bottom rotations by converging sidewalls are visualized, and their widths are measured and analyzed. The impacts of unit discharge at the spillway entry q, the spillway slope θ, and the sidewall convergence angle Φ are taken into account, and their relationships with the disturbed region widths are established to provide references for engineering design, construction and operation.
2. Materials and Methods
In this paper, the computational fluid dynamics (CFD) software Fluent was performed to solve the Reynolds-averaged Navier–Stokes (RANS) equations given below:
where t is the time, ui and uj are time-averaged components of velocity, p is the pressure, ρ is the fluid density, μ is the dynamic viscosity, δij is the Kronecker delta (δij = 1 if i = j and δij = 0 if i ≠ j), and is the Reynolds stress and represents the effect of turbulence. The volume of fluid (VOF) method was used to characterize the interface between air and water. In each computational cell, the sum of the volume fractions of air, αa, and water, αw, is unity and can be given as:
where both αa and αw are equal to or larger than 0.
The skimming flow over converging stepped spillways has a high Reynolds number and is characterized by strong streamline curvature and distorted bottom rotations. The velocity and turbulent energy of the standing wave and the mainstream are high, and there is strong shear stress between the mainstream and bottom rotations. The realizable k-ε model is a high Reynolds model, and it can well capture the mean flow of complex structures and is good for flows involving rotation, boundary layers under strong adverse pressure gradients, separation and recirculation, according to Fluent User’s Guide [19]. Therefore, the realizable k-ε model is adopted in this study. Qian et al. [20] compared four turbulence models (i.e., realizable k-ε model, SST k-ε model, ν2-ƒ model and LES model) and considered the realizable k-ε model as the most efficient in simulating skimming flows over stepped spillways. The realizable k-ε model was also successfully applied to simulating the skimming flow over a V-shaped stepped spillway by Bai et al. [21] and the stepped spillway with chamfers and cavity blockages by Li et al. [22].
The software Gambit was used for geometric modeling and meshing. Figure 1 illustrates the computational domain, which includes an inlet basin, a stepped spillway model and an outlet channel. The inlet basin is 2000 mm long and 355 mm deep to ensure that the incoming flow to the stepped spillway is stable. The outlet channel is 2000 mm long, allowing for uniform unrestricted drainage. The sidewall is 300 mm above the spillway and channel bottom to avoid overflow. Because converging stepped spillways are symmetrical, only half of the geometry was simulated, and the symmetry boundary (marked yellow) was set at the central plane. The upstream boundary of the inlet basin and the downstream boundary of the outlet channel were determined as the mass flow inlet (marked green) and pressure outlet (marked blue) boundaries, respectively. The top boundary of the stepped spillway model was defined as the pressure outlet (marked dark blue) boundary with zero relative pressure, and all the solid geometry surface was set as the no-slip wall boundary with standard wall functions.
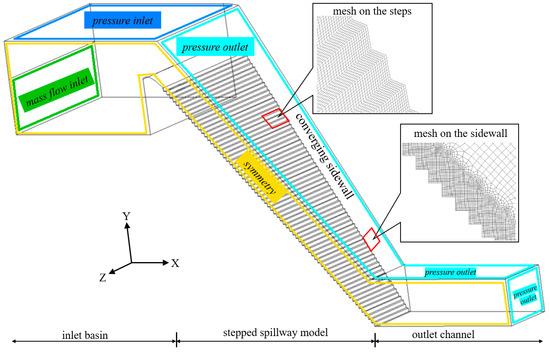
Figure 1.
Computational domain, boundary conditions and mesh distribution of converging stepped spillway, inlet basin and outlet channel (with θ = 48.3°, B = 22.5 mm and Φ = 22.6° as an example).
As the bottom slope θ is an important geometry parameter of stepped spillways and should influence the skimming flow, three stepped spillway models with θ = 11.3°, 30.0° and 48.3° were designed and tested, and they were connected to the inlet basin with a WES profile. The mild slope model of θ = 11.3° was designed based on an undergoing drainage project in Shanghai according to Froude similarity with the scale of 1:33, the width of the spillway entrance Wi = 1500 mm, the total step number N = 15 and the step height B = 30.0 mm. For the moderate slope model, the dimensions were θ = 30.0°, Wi = 1500 mm, N = 30 and B = 60.0 mm. The steep slope model of θ = 48.3° was designed according to the experimental model of converging stepped spillway studied by Zindovic et al. [15] with Wi = 1000 mm, N = 65 and B = 22.5 mm. Four sidewall convergence angles of Φ = 0°, 12°, 18.8° and 22.6°, as well as three dimensionless inlet critical flow depths of hc/B = 3.36, 3.69 and 4.02 were investigated for each stepped spillway model. The Weber number We ranged from 51 to 173 and the Reynold number Re ranged from 6.5 × 10⁴ to 1.23 × 10⁶ at the spillway outlet. Table 1 summarizes the detailed parameters of the total 33 cases that were tested. Because the converging sidewall limits the total length of the spillway and the milder spillway has a longer step length than the steeper spillway, the total step number N decreases as the spillway slope θ increases.

Table 1.
Tested cases.
To verify the accuracy of the whole numerical procedure, an additional case of the skimming flow over a stepped spillway was created according to the experiment of Hunt et al. [23] with Wi = 1800 mm, B = 38 mm, θ = 14.04°, N = 40, Φ = 0° and hc/B = 3.53. This simulation was repeated using Grid sets 1 to 3 for a grid sensitivity analysis. All grid sets are intensive close to the steps and the converging sidewalls. Grid sets 1 to 3 feature total grid numbers of 1.25, 2.50 and 5.00 million, respectively, with the cell sizes near the steps of 3.3 mm × 3.3 mm, 2.2 mm × 2.2 mm and 1.5 mm × 1.5 mm, respectively.
Figure 2 compares the computed velocity profiles of V along flow depth h on the edge of several steps and the experiment data from Hunt et al. [23]. The velocity profiles of Grid set 2 and 3 were found to be indistinguishable and to correlate well with experimental measurements on steps of n = 3, 6 and 12, demonstrating the viability of the existing numerical model in simulating the skimming flow over stepped spillways. Grid creation for the scenarios indicated in Table 1 was referred to Grid set 2 in terms of calculation precision and efficiency.
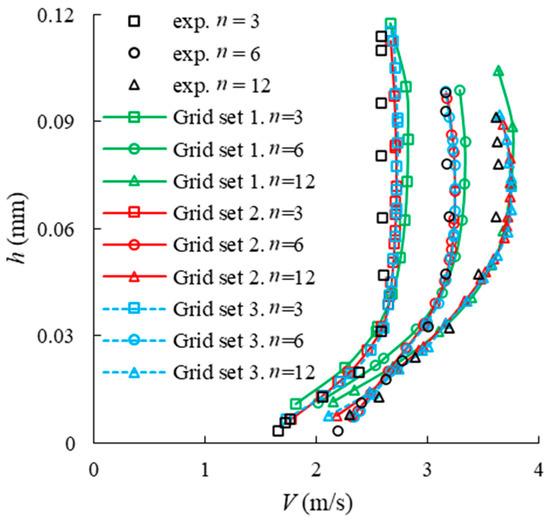
Figure 2.
Comparisons of velocity profiles on various steps between our numerical simulation and experiment data from Hunt et al. [23].
3. Results
3.1. Flow Pattern
Figure 3 shows the typical skimming flow pattern of the converging stepped spillway, including the free-surface (air concentration C = 0.9), streamlines in the mainstream (originating at the half flow depth at the spillway entry) and the bottom rotations between the mainstream and the step surface. For the free-surface, the standing wave is generated since the water depth along the converging walls rapidly increases. For the mainstream, the streamlines close to the sidewall are practically parallel to the sidewall, and their direction quickly changes as they move away from the sidewall, eventually becoming parallel to the central plane. The bottom rotations exhibit a 2-dimensional profile at the central plane, which is remarkably similar to the rotation structure seen on uniform-width stepped spillways [24]. The bottom rotations lengthen as they move away from the central plane, forming a cone shape with the sharp apex facing the sidewall. The bottom rotations become entirely deformed and exceedingly chaotic 3-dimensional profiles as they move closer to the sidewall.
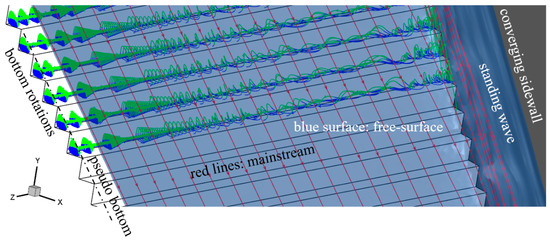
Figure 3.
Typical skimming flow pattern of the converging stepped spillway with θ = 48.3°, B = 22.5 mm, hc/B = 3.36 and Φ = 22.6°. Blue surface: free-surface; red lines: mainstream; green and blue rotating lines: bottom rotations.
Figure 4a depicts the top view of the skimming flow through the converging stepped spillway, and the free-surface color is coded by the flow depth h perpendicular to the pseudo bottom (i.e., the line linking the step edges). Because of the increased flow velocity, the flow depth along the central plane falls throughout the spillway, and the flow pattern is similar to that of stepped spillways with uniform-width. The standing wave begins at the first step and continues to the spillway outlet, with the standing wave’s height gradually increasing along the spillway. Figure 4b shows the cross sections of standing wave on the edge of various steps, and the cross section color is coded by the air concentration C. The water depth grows slowly at first, then rapidly, and eventually gently as the distance to the converging walls decreases. The place with the highest growing rate of water depth can be considered the standing wave’s boundary. Due to the increase of the unit discharge along the spillway and the squeezing of the sidewall, the standing wave generally rises taller and wider. A vortex is created from the free-surface near the standing wave boundary during steps 20 to 35, and it enters the standing wave and advances toward the sidewall as n increases. The vortex causes air entrainment and leads to a relatively high aeration region in the standing wave, which is supported by the experimental observation of Zindovic et al. [15] on the converging stepped spillway.
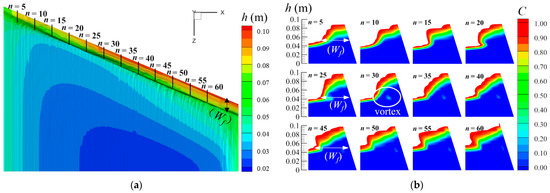
Figure 4.
Standing wave above free-surface of skimming flow along the converging stepped spillway with θ = 48.3°, B = 22.5 mm, hc/B = 3.36 and Φ = 22.6°: (a) top view, the color is coded by the flow depth h perpendicular to the pseudo bottom; (b) cross sections on the edge of several steps, the color is coded by the air concentration C.
Figure 5 compares the streamlines of the mainstream over the converging stepped spillway and the stepped spillway with uniform-width. For the uniform-width stepped spillway, all streamlines are parallel to the central plane, while for the converging stepped spillway, the streamlines near the converging sidewall are roughly parallel to the sidewall and have considerable angles with the central plane. As the distance from the sidewall increases, the streamlines gradually shift from parallel with the sidewall to parallel with the central plane.
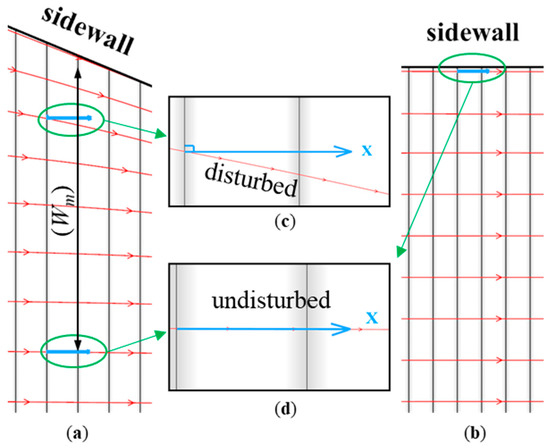
Figure 5.
Streamlines of mainstream over: (a) converging stepped spillway; (b) uniform-width stepped spillway with θ = 48.3°, B = 22.5 mm, hc/B = 3.36 and Φ = 22.6°; (c) streamlines within disturbed region; (d) streamlines within undisturbed region.
Figure 6 compares the bottom rotations above the uniform-width stepped spillway (Figure 6a) and the converging stepped spillway (Figure 6b). Most of the bottom rotations in the uniform-width stepped spillway exhibit 2-dimensional properties such as a rotating disc parallel to the central plane and are not stretched in the width direction of the spillway. Kaouachi et al. [24] obtained similar bottom rotations when simulating the skimming flow over uniform-width stepped spillways. The bottom rotations along the central plane in the converging stepped spillway are similarly 2-dimensional (Figure 6c). In the spillway width direction, the 2-dimensional bottom rotations stretch into cone-shapes as the distance to the central plane increases (Figure 6d). The streamlines of the 2-dimensional and cone-shape bottom rotations are mostly parallel to the central plane. The bottom rotations become more chaotic as the distance between them and the converging walls further decreases (Figure 6e). The bottom rotations are squashed along the converging walls, and the angles between their streamlines and the central plane are visible.
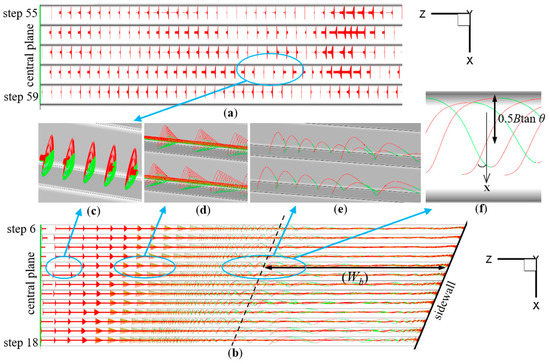
Figure 6.
Bottom rotations above the: (a) uniform-width stepped spillway; (b) converging stepped spillway with θ = 48.3°, B = 22.5 mm, hc/B = 3.36 and Φ = 22.6°. Different shapes of bottom rotation: (c) 2-dimensional rotations; (d) cone-shape rotations; (e) chaotic-shape rotations; (f) definition of disturbed region boundary for bottom rotations.
3.2. Widths of Disturbed Regions for Free-Surface, Mainstream and Bottom Rotations
Because the converging sidewall has various effects on the free-surface, mainstream and bottom rotations of the skimming flow, the disturbed regions for free-surface, mainstream, and bottom rotations should be different as well. The boundary of the disturbed regions by converging sidewall are defined as follows for quantitative analysis and comparison. The disturbed region boundary for the free-surface is where the water depth increases at the fastest rate in the width direction (see Figure 4b). The disturbed region boundary for the mainstream is when the streamlines begin to run parallel to the central plane (see Figure 5c,d). The disturbed region boundary for bottom rotations is defined as the point at which the streamline of bottom rotations with a distance of (0.5Btan θ) from the step vertical face is exactly parallel to the converging sidewall (see Figure 6f). Based on these definitions, the widths of the disturbed regions for free-surface, mainstream and bottom rotations are represented by Wf, Wm and Wb in Figure 4, Figure 5 and Figure 6, respectively. The disturbed region width increases from free-surface to mainstream to bottom rotations, implying that Wf < Wm < Wb persists at all times.
Figure 7 shows the dimensionless disturbed region width of Wf/hc for free-surface varying along the spillway. In general, with increasing step number n, Wf/hc climbs fast and reaches its maximum within the first half of the spillway; then, it remains almost constant or begins to fall as the spillway approaches its exit. In scenarios with steep spillway slope and big convergence angle (θ = 48.3° and Φ = 22.6°), Wf/hc grows continually along the spillway and reaches a maximum at the spillway exit. Wf/hc is observed to be higher when the spillway slope θ is milder and the convergence angle Φ is larger. Wf/hc increases somewhat as hc/B decreases, indicating that hc/B has a limited effect on Wf/hc.
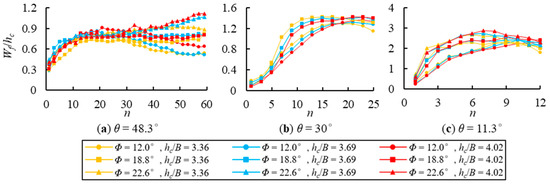
Figure 7.
Dimensionless disturbed region width of Wf/hc for free-surface: (a) θ = 48.3°; (b) θ = 30°; (c) θ = 11.3°.
Figure 8 shows the dimensionless disturbed region width of Wm/hc for mainstream. For all cases, Wm/hc increases constantly with increasing n and reaches its maximum at the spillway outflow. With decreasing spillway slope θ and dimensionless critical flow depth hc/B as well as rising convergence angle Φ, the maximum Wm/hc increases. For the mild and moderate spillways with θ = 11.3° and 30.0°, the growing rate of Wm/hc is large when close to the spillway entrance and gradually reduces with increasing n. For the steep spillways with θ = 48.3°, the increasing rate of Wm/hc is small when n ≤ 30, but grows significantly further downstream. The reason for the different increasing rate of Wm/hc is that the spread of the sidewall disturbance in the spillway width direction is related and limited by the inertial force of flow that increases with flow velocity, while it is promoted by the vortex generated from the free-surface by the sidewall squeezing (shown in Figure 4b). For the mild and moderate spillways with θ = 11.3° and 30.0°, the flow velocity and inertial force are minimal when close to the spillway entry and gradually rise with increasing n, which is opposed to the growing rate of Wm/hc. The flow velocity and inertial force are substantial across the spillway with θ = 48.3°, and the vortex created by the sidewall accelerates the propagation of the sidewall disturbance when n ≥ 30.
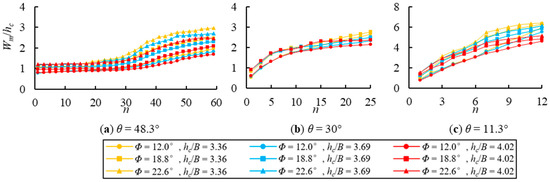
Figure 8.
Dimensionless disturbed region width of Wm/hc for mainstream: (a) θ = 48.3°; (b) θ = 30°; (c) θ = 11.3°.
Figure 9 shows the dimensionless disturbed region width of Wb/hc for bottom rotations. Wb/hc dramatically increases with n in the first half of the spillway and quickly reaches its maximum. Further downstream, Wb/hc nearly remains constant for θ = 48.3°, whereas it slightly falls after reaching the maximum for θ = 11.3 and 30.0°. The maximum of Wb/hc increases with decreasing spillway slope θ and dimensionless critical flow depth hc/B as well as increasing convergence angle Φ.
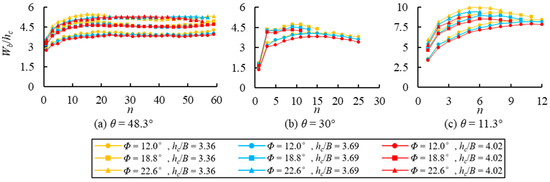
Figure 9.
Dimensionless disturbed region width of Wb/hc for bottom rotations: (a) θ = 48.3°; (b) θ = 30°; (c) θ = 11.3°.
3.3. Maximum Disturbed Region Width
Figure 10 illustrates the maximum disturbed region widths of max(Wf/hc), max(Wm/hc) and max(Wb/hc) for free-surface, mainstream and bottom rotations. There is always max(Wb/hc) > max(Wm/hc) > max(Wf/hc). With increasing convergence angle Φ, max(Wb/hc), max(Wm/hc) and max(Wf/hc) all rise, with max(Wb/hc) and max(Wf/hc) having the biggest and smallest growing rates, respectively; max(Wb/hc), max(Wm/hc) and max(Wf/hc) also increase with the decrease of θ and the increase of hc/B.
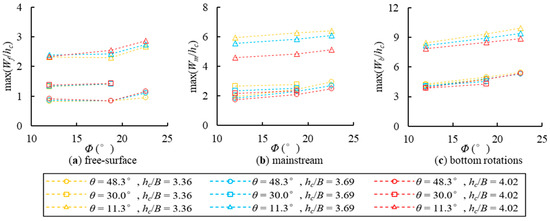
Figure 10.
Maximum disturbed region widths of max(Wf/hc), max(Wm/hc) and max(Wb/hc) for (a) free-surface; (b) mainstream; and (c) bottom rotations.
A basic form of regression equations for predicting the maximum dimensionless disturbed region widths for free-surface, mainstream and bottom rotations is proposed by studying the influence of the dimensionless critical flow depth hc/B, the spillway slope θ, and the convergence angle Φ:
where D, E, F and G are coefficients to be determined.
By substituting all the experimental data of Figure 10 into Equation (4), we can anticipate max(Wf/hc), max(Wm/hc) and max(Wb/hc) by the following equations
For Equations (5)–(7), the coefficients of E, F and G can be constant for free-surface, mainstream and bottom rotations; max(Wb/hc) is almost 1.5 times as large as max(Wm/hc) and 3 times as large as max(Wf/hc) based on the variations in the coefficient D between Equations (5)–(7). Figure 11 compares the experimental data of max(Wf/hc), max(Wm/hc) and max(Wb/hc) with their predicted value by Equations (5)–(7), and all the data plot within the error deviation boundaries of ±25%. The prediction performances of Equations (5)–(7) were evaluated by the mean relative deviation (MRD).
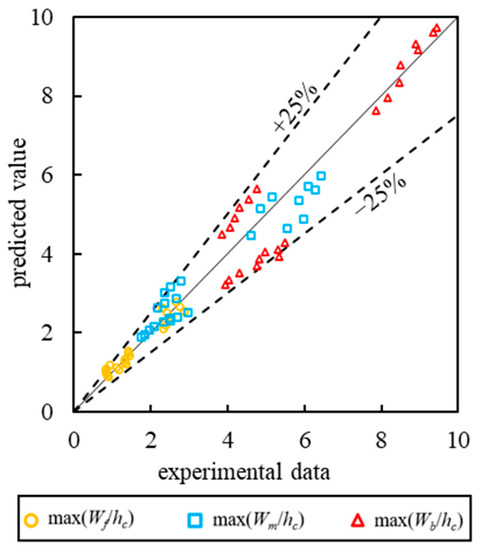
Figure 11.
Comparison of predicted max(Wf/hc), max(Wm/hc) and max(Wb/hc) from Equations (5)–(7) with experimental data in Figure 10.
It is found that MRD are 9.6%, 11% and 13.1% for max(Wf/hc), max(Wm/hc) and max(Wb/hc), respectively, demonstrating the predicting accuracy of Equations (5)–(7).
4. Conclusions and Outlook
The skimming flow over the converging stepped spillway is investigated in this research using a numerical simulation. The results reveal that the converging sidewall has considerable impact on the free-surface, mainstream and bottom rotations. For the free-surface, the standing wave is formed from the first step, and a vortex zone is seen within the standing wave, causing air entrainment and a relatively high aeration region. For the mainstream, the streamlines near the converging sidewall are almost parallel to the sidewall, and as the distance from the sidewall rises, they gradually move to parallel with the central plane. For the bottom rotations, 2-dimensional rotations, cone-shape rotations and chaotic rotations are observed in turn with decreasing distance to the converging sidewall. The streamlines of 2-dimensional rotation and cone-shape rotation are nearly parallel to the central plane. Near the converging sidewall, the bottom rotations are squeezed, and the angles between the rotation streamlines and the central plane are visible.
The widths of the disturbed regions for free-surface, mainstream and bottom rotations are defined, obtained and compared. For the free-surface, the dimensionless disturbed region width Wf/hc increases to the maximum and then slightly decreases along the spillway. The increasing rate and maximum of Wf/hc increase with increasing convergence angle Φ and decreasing spillway slope θ. When the critical flow depth hc/B increases, the maximum of Wf/hc increases, and the maximum point travels to the spillway upstream. For the mainstream, Wm/hc continues to increase along the spillway, peaking on the last step. The maximum of Wm/hc increases with increasing of Φ and decreasing hc/B. For bottom rotations, Wb/hc increases sharply to the maximum and then remains constant for θ = 48.3°, but Wb/hc slightly decreases after reaching the maximum for θ = 11.3° and 30.0°. The maximum of Wb/hc increases with increasing Φ and decreasing hc/B, and the maximum point moves upstream with the increase of Φ and hc/B. The prediction equations are established for the maximum disturbed region widths of max(Wf/hc), max(Wm/hc) and max(Wb/hc) for free-surface, mainstream and bottom rotations of skimming flow. It is stated that max(Wb/hc) > max(Wm/hc) > max(Wf/hc) always exists, and max(Wb/hc) is nearly 1.5 times as large as max(Wm/hc) and 3 times as large as max(Wf/hc).
Based on the achievements from our numerical study and the experiments of Zindovic et al. [15] and Hunt et al. [18], the disturbed region of skimming flow generated by the converging sidewall potentially causes risks for engineering. The standing waves placing higher demands on the sidewall height design, and the disturbed region has higher flow velocity and lower air concentration than the undisturbed flow region, presenting a challenge to cavitation control and energy dissipation. Our study provides knowledge about the range of the disturbed regions; therefore, appropriate engineering measurements can be taken to provide protection for this region during the spillway design, construction and operation. Furthermore, because spillways are often used to discharge excess flows from a sediment basin [25], the standing waves, the squeezed mainstream and the distorted bottom rotations can change the sediment transport capacity of the skimming flow, and the sediment deposition in the converging stepped spillway and its downstream is noteworthy for future study.
Author Contributions
Conceptualization, Y.C., S.Q. and H.X.; methodology, Y.C. and G.L.; Data curation, Y.C. and G.L.; Formal analysis, J.F. and X.W.; Validation, Y.C. and G.L.; Writing—original draft preparation, Y.C. and G.L.; Writing—review and editing, S.Q. and H.X.; Project administration, S.Q.; Resources, S.Q. and H.X.; Funding acquisition, S.Q. All authors have read and agreed to the published version of the manuscript.
Funding
This research was funded by the National Natural Science Foundation of China (Grant No. 51809079).
Data Availability Statement
Not applicable.
Conflicts of Interest
The authors declare no conflict of interest.
Notations
| B | step height (mm) |
| C | air concentration |
| N | total step number |
| V | velocity (m∙s−1) |
| Wi | initial width of first step (mm) |
| Wf | disturbed region width of the free-surface (mm) |
| Wm | disturbed region width of the mainstream (mm) |
| Wb | disturbed region width of the bottom rotations (mm) |
| a | step length (mm) |
| g | gravity acceleration constant (m∙s−2) |
| h | water depth vertical to pseudo bottom (mm) |
| hc | critical flow depth (mm) |
| max | dimensionless maximum disturbed region width |
| max(Wf/hc) | dimensionless maximum disturbed region width of the free-surface |
| max(Wm/hc) | dimensionless maximum disturbed region width of the mainstream |
| max(Wb/hc) | dimensionless maximum disturbed region width of the bottom rotations |
| n | step number |
| q | the unit discharge at the spillway entrance (m2∙s−1) |
| θ | spillway slope (°) |
| Φ | convergence angle of sidewall (°) |
References
- Chanson, H.; Paintal, A.S. Hydraulics of Stepped Chutes and Spillways. Appl. Mech. Rev. 2003, 56, B10–B11. [Google Scholar] [CrossRef]
- Zhang, G.F.; Chanson, H. Air-water flow properties in stepped chutes with modified step and cavity geometries. Int. J. Multiph. Flow. 2018, 99, 423–436. [Google Scholar] [CrossRef] [Green Version]
- Hunt, S.L.; Kadavy, K.C. Inception Point for Embankment Dam Stepped Spillways. J. Hydraul. Eng. 2013, 139, 60–64. [Google Scholar] [CrossRef]
- Boes, R.M.; Lucas, J.; Hager, W.H. Aerated flow characteristics of skimming flow over stepped chutes. J. Hydraul. Research. 2013, 50, 427–434. [Google Scholar] [CrossRef]
- Husain, S.M.; Muhammed, J.R.; Karunarathna, H.U.; Reeve, D.E. Investigation of pressure variations over stepped spillways using smooth particle hydrodynamics. Adv. Water Resour. 2014, 66, 52–69. [Google Scholar] [CrossRef]
- Felder, S.; Chanson, H. Simple Design Criterion for Residual Energy on Embankment Dam Stepped Spillways. J. Hydraul. Eng. 2015, 142, 4015062. [Google Scholar] [CrossRef] [Green Version]
- Qian, S.T.; Wu, J.H.; Ma, F. Hydraulic Performance of Ski-Jump-Step Energy Dissipater. J. Hydraul. Eng. 2016, 142, 5016004. [Google Scholar] [CrossRef]
- Wu, J.H.; Qian, S.T.; Wang, Y.; Zhou, Y. Residual Energy on Ski-Jump-Step and Stepped Spillways with Various Step Configurations. J. Hydraul. Eng. 2020, 146, 6020002. [Google Scholar] [CrossRef]
- Qian, S.T.; Wu, J.H.; Xu, H.; Ma, F. Transition flow occurrence on stepped channels. J. Hydraul. Res. 2022, 60, 487–495. [Google Scholar] [CrossRef]
- Wu, J.H.; Qian, S.T.; Ma, F. A new design of ski-jump-step spillway. J. Hydrodyn. Ser. B 2016, 28, 914–917. [Google Scholar] [CrossRef]
- Sun, J.K.; Qian, S.T.; Xu, H.; Wang, X.S.; Feng, J.G. Three-dimensional numerical simulation of stepped dropshaft with different step shapes. Water Supply 2020, 21, 581–592. [Google Scholar] [CrossRef]
- Ren, W.C.; Wu, J.H.; Ma, F.; Qian, S.T. Hydraulic performance of helical-step dropshaft. Water Sci. Technol. 2021, 84, 954–965. [Google Scholar] [CrossRef]
- Hunt, S.L.; Kadavy, K.C.; Abt, S.R.; Temple, D.M. Impact of Converging Chute Walls for Roller Compacted Concrete Stepped Spillways. J. Hydraul. Eng. 2008, 134, 1000–1003. [Google Scholar] [CrossRef]
- Prafull, J.W.; Aniruddha, D.G.; Narendra, V.D. Comparative analysis for estimation of the height of training wall of convergent stepped spillway. Int. J. Eng. Technol. 2015, 4, 294–303. [Google Scholar] [CrossRef] [Green Version]
- Zindovic, B.; Vojt, P.; Kapor, R.; Savic, L. Converging stepped spillway flow. J. Hydraul. Res. 2016, 54, 699–707. [Google Scholar] [CrossRef]
- Biethman, B.; Ettema, R.; Thornton, C.; Hogan, T.; Lan, Y.Q. Air Entrained in Flow along a Steep-Stepped Spillway: Data and Insights from a Hydraulic Model. J. Hydraul. Eng. 2021, 147, 5021001. [Google Scholar] [CrossRef]
- Biabani, S.; Hamidi, M.; Neya, B.N. Numerical simulation of the pier geometry effects on forming the transverse wave in converged spillways. Int. J. Mod. Phys. C 2021, 32, 23. [Google Scholar] [CrossRef]
- Hunt, S.L.; Kadavy, K.C. Estimated Splash and Training Wall Height Requirements for Stepped Chutes Applied to Embankment Dams. J. Hydraul. Eng. 2017, 143, 6017018. [Google Scholar] [CrossRef]
- Ansys, Inc. Fluent User’s Guide; Ansys, Inc.: Canonsburg, PA, USA, 2020. [Google Scholar]
- Qian, Z.D.; Hu, X.Q.; Huai, W.X.; Amador, A. Numerical simulation and analysis of water flow over stepped spillways. Sci. China Ser. E Technol. Sci. 2009, 52, 1958–1965. [Google Scholar] [CrossRef]
- Bai, Z.L.; Zhang, J.M. Comparison of Different Turbulence Models for Numerical Simulation of Pressure Distribution in V-Shaped Stepped Spillway. Math. Probl. Eng. 2017, 2017, 3537026. [Google Scholar] [CrossRef] [Green Version]
- Li, S.C.; Yang, J.; Li, Q.L. Numerical Modelling of Air-Water Flows over a Stepped Spillway with Chamfers and Cavity Blockages. KSCE J. Civ. Eng. 2020, 24, 99–109. [Google Scholar] [CrossRef]
- Hunt, S.L.; Kadavy, K.C. The effect of step height on energy dissipation in stepped spillways. In Proceedings of the World Environmental and Water Resources Congress, Kansas City, MO, USA, 17–21 May 2009; ASCE: Great Rivers, NY, USA, 2009; pp. 3061–3071. [Google Scholar]
- Kaouachi, A.; Carvalho, R.F.; Lopes, P.; Benmamar, S.; Gafsi, M. Numerical investigation of alternating skimming flow over a stepped spillway. Water Supply 2021, 21, 3837–3859. [Google Scholar] [CrossRef]
- Juez, C.; Bühlmann, I.; Maechler, G.; Schleiss, A.J.; Franca, M.J. Transport of suspended sediments under the of bank macro-roughness. Earth Surf. Processes Landf. 2018, 43, 271–284. [Google Scholar] [CrossRef]
Publisher’s Note: MDPI stays neutral with regard to jurisdictional claims in published maps and institutional affiliations. |
© 2022 by the authors. Licensee MDPI, Basel, Switzerland. This article is an open access article distributed under the terms and conditions of the Creative Commons Attribution (CC BY) license (https://creativecommons.org/licenses/by/4.0/).