Article

Soil Liquefaction and Other Seismic-Associated Phenomena in the City of Chone during the 2016 Earthquake of Coastal Ecuador

1
Department of Civil Engineering, University of Alicante, 03690 Alicante, Spain
2
Departamento de Construcciones Civiles, Facultad de Ciencias Matemáticas, Físicas y Químicas, Universidad Técnica de Manabí (UTM), Av. José María Urbina, Portoviejo 130111, Ecuador
3
Instituto de Investigación Geológico y Energético (IIGE), De las Malvas E15-142 y de los Perales, Quito 170503, Ecuador
4
Departamento de Ciencias de la Tierra y de la Construcción, Universidad de las Fuerzas Armadas ESPE, Sangolquí 171103, Ecuador
*
Author to whom correspondence should be addressed.
Appl. Sci. 2022, 12(15), 7867; https://doi.org/10.3390/app12157867
Submission received: 13 July 2022 / Revised: 1 August 2022 / Accepted: 3 August 2022 / Published: 5 August 2022
(This article belongs to the Section Civil Engineering)

Abstract

:
The city of Chone, being situated on the Ecuadorian coast, was affected due to the close-by epicenter of the earthquake of 16 April 2016, which reached a magnitude of Mw 7.8. This catastrophic event presented settlements in the ground, sand boils and land subsidence, being the most damaging in a variety of civil works among these several buildings. The main objective of the current study is to select data using the standard penetration test (SPT) for the evaluation of the probability of liquefaction considering a maximum acceleration seismic risk of amax = 0.5 g. With the tabulated information, a liquefaction hazard map was generated for the city of Chone, where a safety factor of 1228 was obtained, determining the potentially liquefiable strata at an approximate depth between 9 and 11 m. Hereby, we were able to demonstrate results that were obtained experimentally through a quantitative analysis, indicating that the urban area of the city of Chone has a high probability of liquefaction, which was supported due to the presence of Holocene-aged soils developed in alluvial deposits, located in an alluvium mid catchment area. This novel research, due to the combination of a variety of used tools in the seismic risk evaluation, provides a relevant contribution to territorial planning and risk management in construction, in addition to the territorial reorganization of the canton as an example for different regions worldwide with similar geodynamics, soil mechanics and seismic vulnerabilities.

1. Introduction

Earthquakes can be caused by various triggers, of which among the most common are tectonic plate movements releasing their energy within or along capable geological faults [1,2]. The earthquake-induced soil liquefaction causes a variety of damages [3], including the partial or complete destruction or collapse of buildings, severe damages of the road networks and further fundamental infrastructures [4,5,6]. Therefore, such a hazard appears to be one of the most relevant issues nowadays in geotechnical and geological engineering, based on numerous seismic movements due to ground vibrations [7,8]. This has led to the development of new techniques that allow to evaluate the strata characterizing them.
There are several simplified methods that were developed from some databases of field records in places where the phenomenon of liquefaction occurred [9,10]. The most fundamental and frequently used are in situ testing techniques, such as the standard penetration test (SPT), the cone penetration test (CPT), and the shear wave velocity measurements [11,12]. For the current research, we have used the methodology based on the SPT trial as according to Toprak and Holzer [13], there is confirmation between the SPT database and the CPT-based approach for the liquefaction susceptibility analysis of soil layers [3], being the method that has been commonly used in most countries [14,15,16]. There are several investigations regarding the SPT test, where the compactness of the lithologies of the soil can be determined as well as the variability of its properties [17]. The number of blows of the SPT has been used as a parameter that allows determining the resistance of sandy soils to liquefaction [18]. The conditions of young soils that correspond to the Holocene contain relatively unfavorable environments for geotechnical designs, as they lack the ability to provide resistance capable of withstanding direct loads [19].
The approach based on SPT for the determination of the liquefaction potential reflects several conditions that makes it one of the most used methods, allowing to know the history of stresses and deformations, the structure of the soil, the horizontal effective stress [18], as well as the combination of relative density and vertical stress, factors that influence resistance to liquefaction in sands [20]. The SPT is considered a shear strength test in undrained conditions and due to the fast deformation rate as well as due to the low cost, it allows obtaining more data, generating a larger universe of samples [21]. The SPT-based technique has been shown to be effective in saturated soils of narrow valley sedimentary environments.
In the study area of the current research being situated in western, coastal Ecuador, within the Chone canton (province of Manabí), as a result of what has already been mentioned, collapses of buildings and failures in the pavement structures were evidenced and nicely documented [22]. In present day, the analyses of earthquake environmental effects require intensity assessment as well as more detailed geotechnical data, allowing mitigation measures and emergency response plans to be better informed about the hazards related specifically to earthquakes [23]. There are investigations performed on liquefaction and earthquake-induced soil failures [24,25]. The initial studies about the liquefaction phenomenon started in the early 1960s of the last century due to the 1964 earthquake in Alaska and Niigata, presenting a very high number of considerable damages among these faults in slopes, bridges and foundations [26]. Subsequently, elaborated liquefaction risk maps in areas susceptible to this phenomenon obtained a great relevance for decision makers and site planners. These maps result from the calculation of the liquefaction potential (LPI) and the cumulative frequency distribution of the LPI in the different soil layers, giving an approach to the evaluation of the quantitative results when evaluating liquefaction [27].
In Ecuador, within the recent years, several investigations have been conducted about the Mw 7.8 Pedernales earthquake on 16 April 2016 and its coseismic effects [28,29,30]. The most frequent coseismic ground effects were local settlements and sinkholes, coherent and disrupted landslides and liquefaction-induced lateral spreading in the various cantons belonging to the coastal provinces of Manabí and Esmeraldas. The main aim of the current research is based on analyzing the coseismic liquefaction-induced ground deformation in Chone, being situated just 85 km south of the epicenter of the earthquake of 2016, using geotechnical and geological data through the standard penetration test (SPT) in the field, for its subsequent calculation of the safety factor (Fs) and the probability of liquefaction (PL). This research is intended to contribute to the municipal territorial reorganization, allowing the identification of the most susceptible areas to liquefaction. Even more so, all the given results can contribute to the reduction of the potential loss of human lives and infrastructure when corresponding land use planning and ordering measures are applied.

2. The Study Area

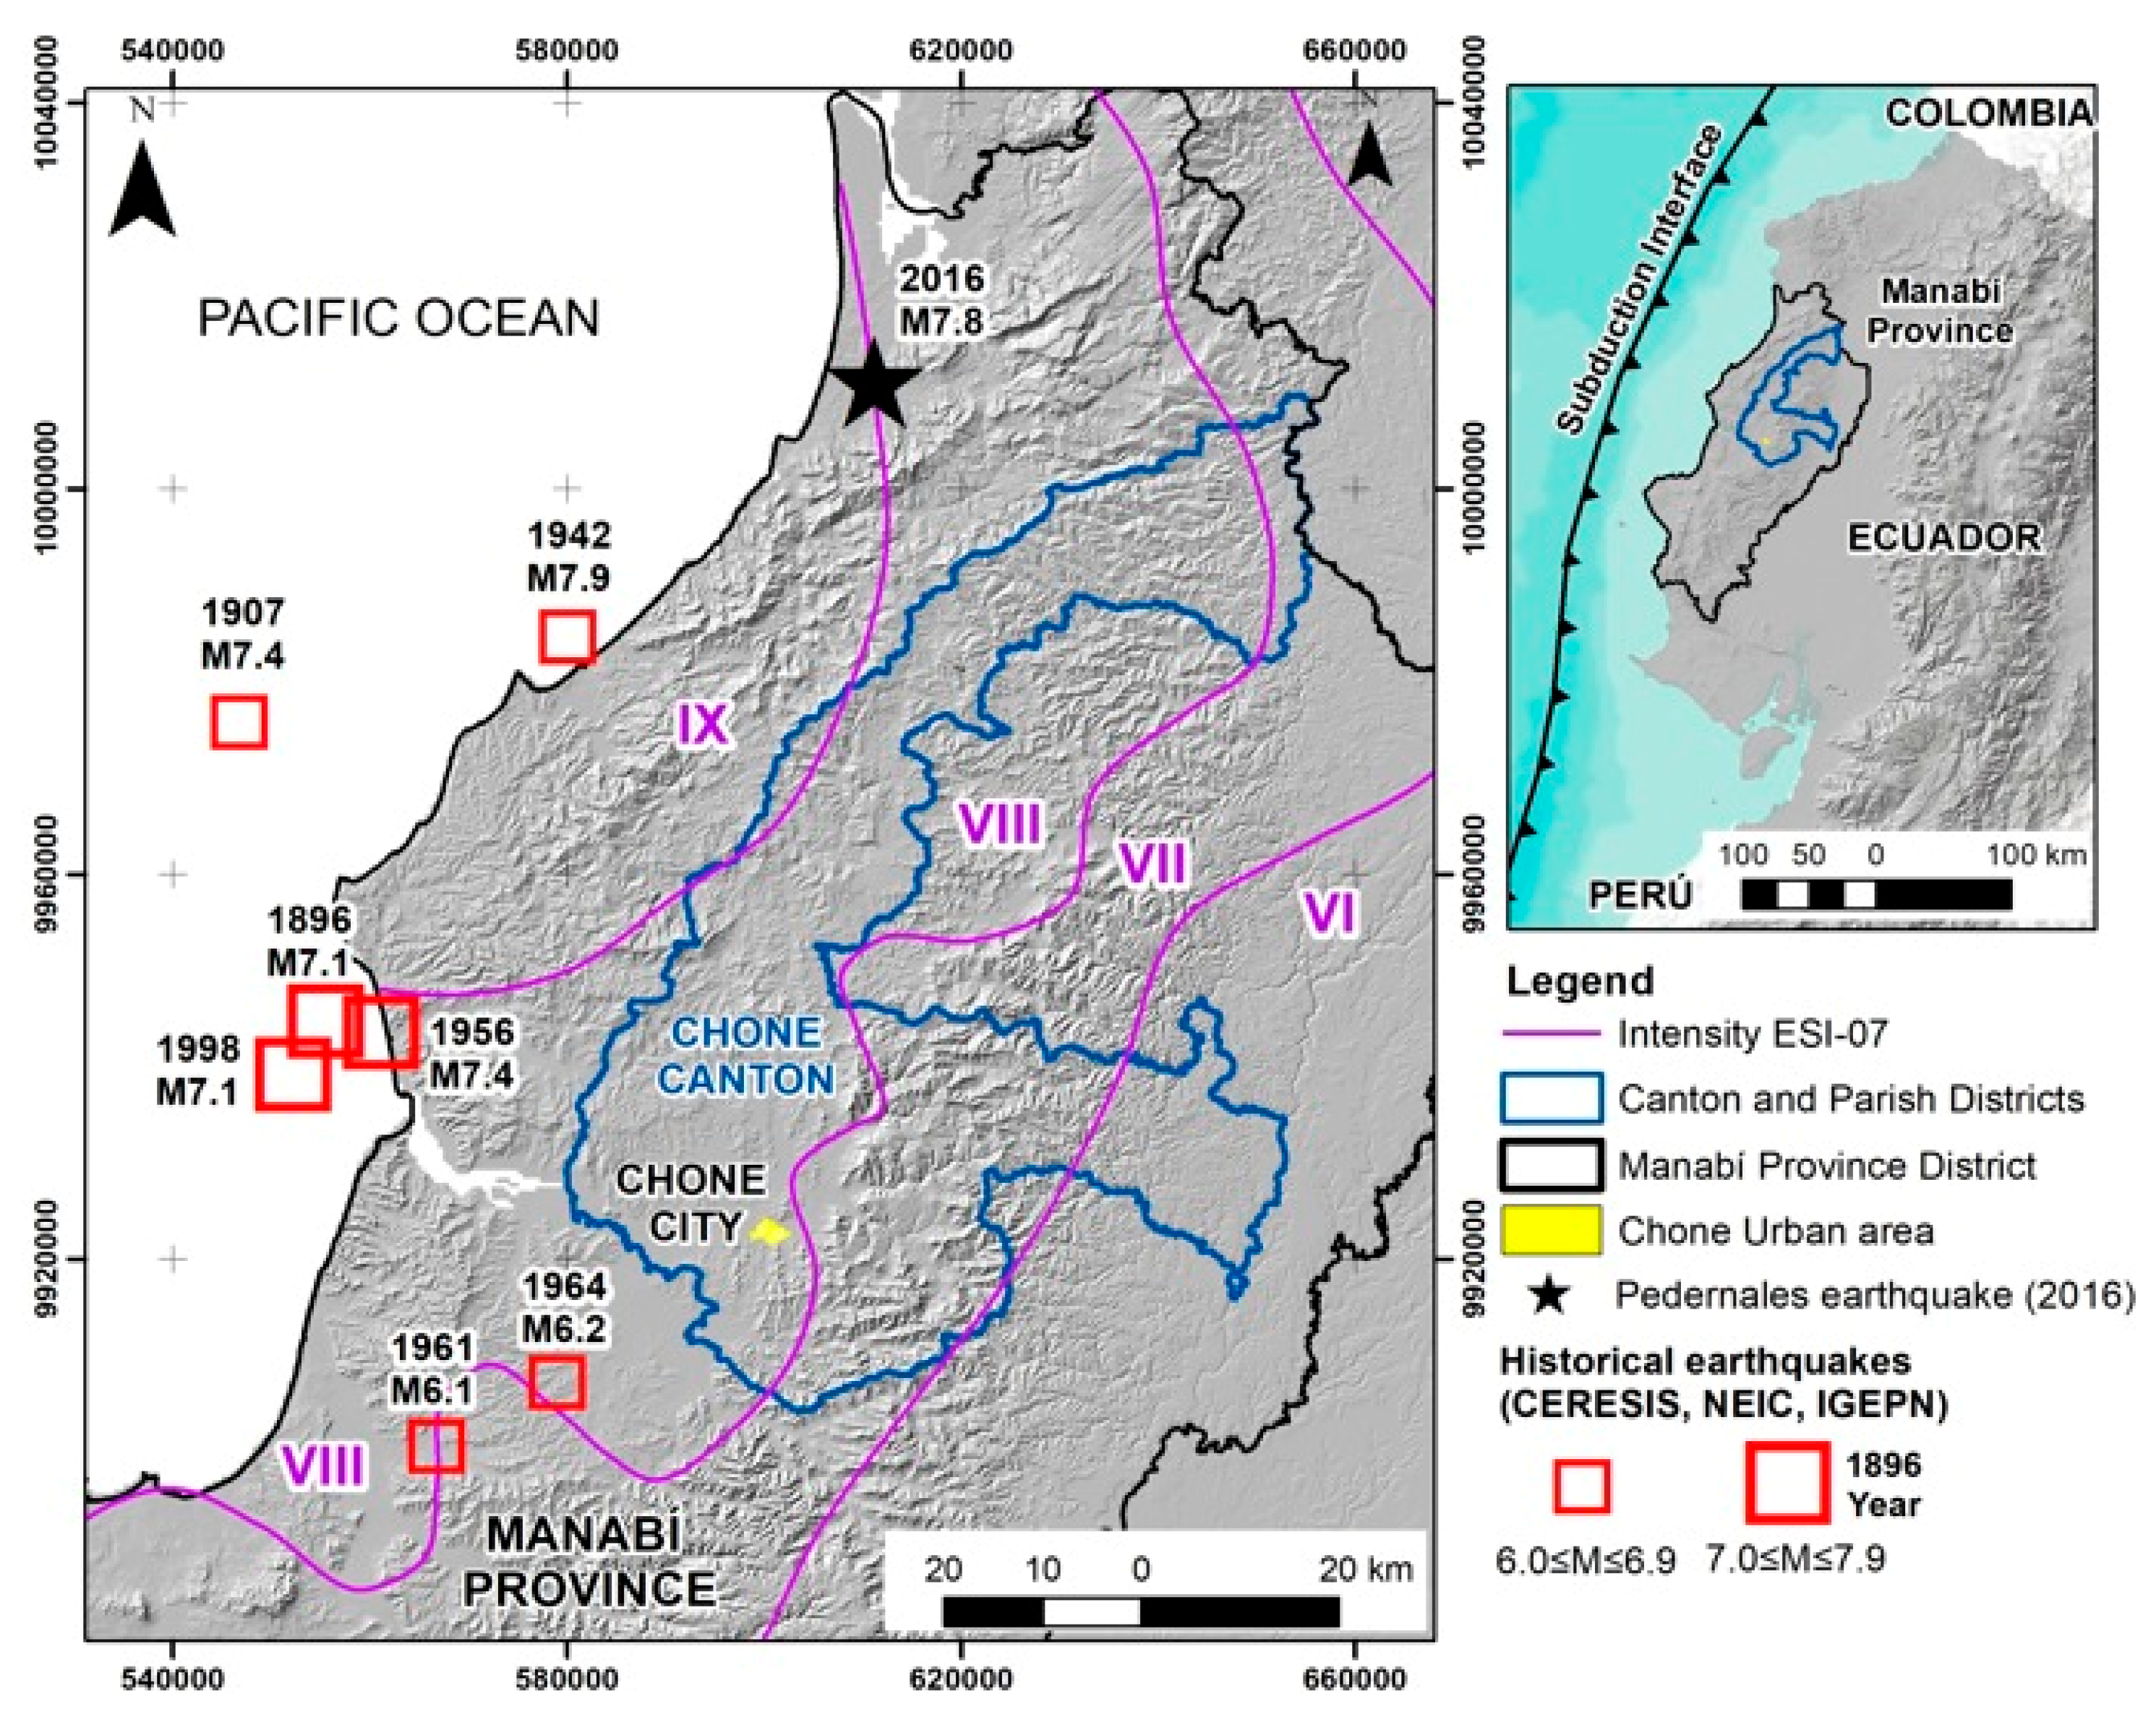
2.1. Geodynamic and Geomorphological Setting

The Ecuadorian subduction zone is the main seismogenic structure and is divided in five well-differentiated tectonic segments [31]. The province of Manabí has the shortest seismic recurrence associated with subduction earthquakes, where the northeast moving Nazca oceanic plate collides and subducts the continental segment of the North-Andean block or Caribbean and South American continental crust (Figure 1) [32]. The recorded seismic history for the province of Manabí begins in 1896, where earthquakes with magnitudes in the order of 7 degrees are recurrent for about every 20 years, while the strongest ones are in the order of 8 degrees for about every 70 to 80 years (Table 1).
For the province of Manabí, many of its cities are built in narrow valleys between hills, where saturated and unsaturated soils of alluvial and alluvial–colluvial environments are predominant. The highest intensities of coseismic geological effects have been documented in these types of soils. For colluvial soils, coherent and disruptive landslides have been evaluated, while for soft and loose soils, various types of soil liquefaction have been recorded. In the current study, reference is made to the city of Chone, which is the capital of the largest canton in the province of Manabí, and with little or scarce geotechnical information on the subsoil in the urban area. An analysis of the seismic risk is analyzed for the entire Chone canton, where its total basin area is approximately 3519 km2 with an average slope of 18.15%, accompanied by elevations that do not exceed 120 m.a.s.l. Urban areas have a degree of inclination that corresponds to 4–35° and are associated with colluvial deposits. The soft soils correspond to areas of alluvial–colluvial and alluvial plains, which presented settlements, soil liquefaction and lateral displacements during the Pedernales earthquake in 2016.
Figure 1. Geodynamic setting of Ecuador and its surrounding. The Galapagos Islands and the Carnegie Ridge form part of the oceanic Nazca plate, which subducts below the South American continent. Note the location of the most recent earthquake in 2016 in coastal Ecuador. Adapted from [32].
Applsci 12 07867 g001
The city of Chone is located in earthquake-prone areas, so its close-by distance from the epicenter of the 2016 earthquake. Chone is the third most populous city in the province of Manabí with 73,681 inhabitants with a surface area of 17 km2 [33]. Indeed, during the Pedernales earthquake in 2016, the structural failure of state health buildings was evidenced. The same buildings with the combination of natural periods of the ground caused the total collapse of the main hospital in the city, increasing the level of health emergency due to the poor response to care for the injured, where mobile tents then functioned as a hospital for several months [29]. In addition, a large amount of structural damage was recorded, with a total of 662 homes being damaged, of which 466 correspond to the urban area [22,34]. In these areas, they present different types of soils for the Borbon formation, basically comprising grayish-blue calcareous sandstones and for the Onzole formation, shales to bluish mudstone siltstones interspersed with white volcanic tuffs and sandstone slats [35]. Furthermore, there are alluvial terraces with saturated and partially saturated soils [28,34]. These geological conditions allowed the elaboration of a map with 21 capable geological faults as illustrated in Figure 2, corresponding to sea floor and continental segments [36,37].
Table 1. Seismic subduction events in coastal Ecuador [30,38].
Sector (Epicenter)DateMagnitude (Mw)
Bahía de Caráquez3 May 18967.1
Esmeraldas31 January 19068.8
Pedernales-Muisne1 June 19077.4
Pedernales14 May 19427.9
Esmeraldas23 October 19446.7
Bahía de Caráquez16 January 19567.4
Esmeraldas19 January 19587.6
Bahía de Caráquez4 August 19987.1
Pedernales16 April 20167.8

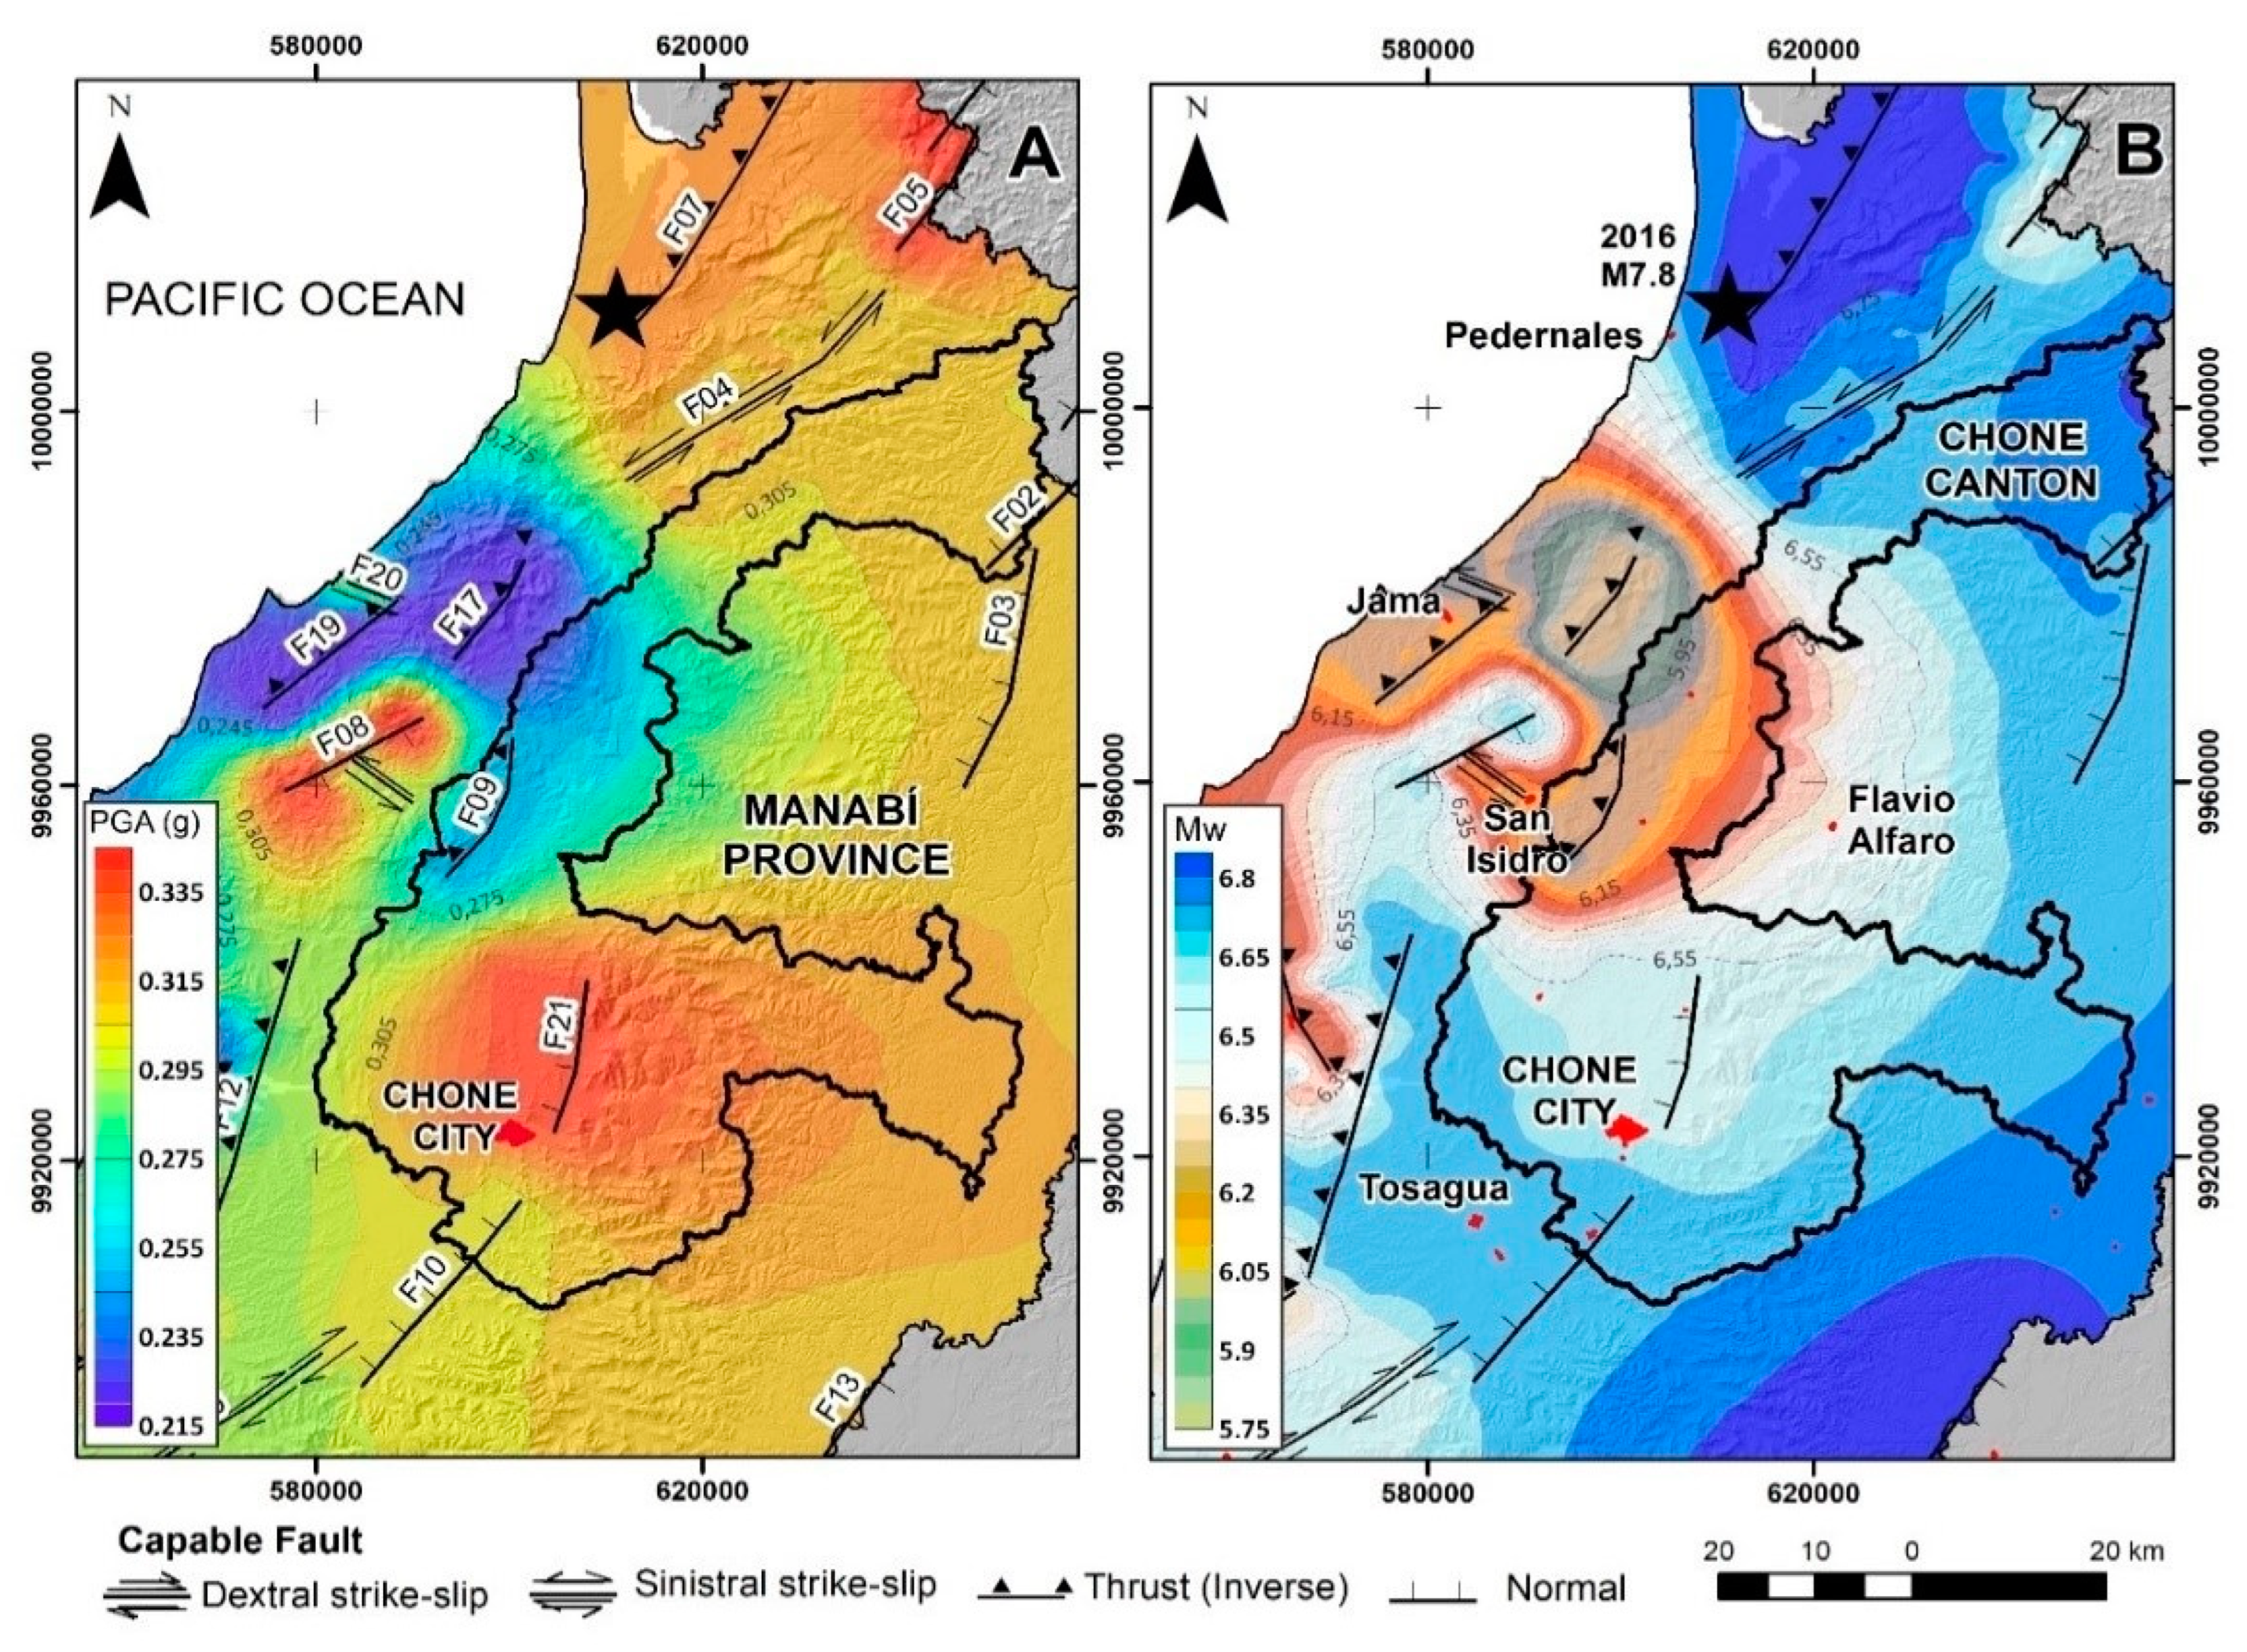
2.2. Structural Geological Context of the Studied Area

A deterministic seismic risk map was realized from 21 capable geological faults near the Chone canton (Table 2). The most appropriate approach to estimate the maximum magnitude of an earthquake is a relationship with the fault rupture length [38]. The first analysis consists of applying equations proposed by Wesnousky in 2008 [39], relations for each type of capable fault:
Strike slip faults: Mw = 5.56 + 0.87Log(Lf)
Normal faults: Mw = 6.12 + 0.47Log(Lf)
Reverse faults: Mw = 4.11 + 1.88Log(Lf)
where Lf is the length of the geological fault.
A second analysis is to obtain the peak ground acceleration of the rocks from geological faults, applying the equation proposed by Fukushima and Tanaka in 1990 [40] by using the proposed equation:
P G A r o c k = ( 10 0.41 M e l o g 10 ( H f + 0.032 × 10 0.41 M e ) 0.0034 H f + 1.3 ) 980  
where H f is the depth of fault and Me the estimated magnitude.
The seismic risk map indicates that the maximum magnitudes expected from the full activation of a tectonic segment of geological fault is in the order of 6.17 ≤ Mw ≤ 7.18 and rock acceleration is between 0.28 ≤ PGA ≤ 0.36. A second scenario considers the activation of 60% of the length of the geological fault, where the expected magnitudes are in the order of 5.79 ≤ Mw ≤ 6.79 and the acceleration in the order of 0.22 ≤ PGA ≤ 0.31. The Ecuadorian Construction Standard named NEC-11 [41] considers 60% of the potential of a seismogenic structure, as these values may be closer to the recurrence and seismic values expected on the coast of Ecuador. Using data from seismic stations and environmental vibration measurements, it is possible to compare the spectral ratio technique with respect to a reference site with that of the spectral ratio (H/V) obtaining consistency in the fundamental frequency values [42] (Figure 3). The phenomenon of seismic amplification in soft sediments near the surface has been studied for several decades, so knowing the characteristics and behavior of soil deposits in high seismic activity is fundamental in order to determine the amplifications of seismic movements and identify resonance conditions in buildings [43].
Table 2. Maximum magnitudes and PGA-rock determination obtained from the analysis of capable geological faults in the canton of Chone. Values determined based on Wesnousky (2008) [41] and Fukushima and Tanaka [40].
Figure 100.MechanismFault Length (km)Fault Depth (km)Distance Fault to City (km)RakeFault Width (km)Magnitude Calculated 100% Fault Rupture LengthMagnitude Calculated 60% Fault Rupture LengthLevels of ReliabilityPGA-Rock (g)
F01Normal391695−90106.876.76deducted0.32
F02Normal291578−9096.816.70deducted0.32
F03Normal271562−9096.796.69deducted0.32
F04Shear fault Sx331573−5106.886.69deducted0.33
F05Normal1612102−9086.696.58deducted0.34
F06Normal2112113−9086.746.64deducted0.35
F07Reverse43169290107.186.76certain0.36
F08Normal161243−9086.696.58certain0.34
F09Reverse1712289086.426.01certain0.31
F10Normal25159−9096.786.67deducted0.32
F11Reverse2215339086.636.22certain0.30
F12Reverse38162690107.086.66deducted0.35
F13Normal441646−90106.896.79certain0.32
F14Normal311570−9096.826.72certain0.32
F15Shear fault Dx151240−17586.586.39deducted0.33
F16Shear fault Dx251532−17596.786.58certain0.32
F17Reverse1312529076.205.79certain0.28
F18Shear fault Sx71038−566.306.10certain0.32
F19Reverse1815529086.476.05deducted0.28
F20Shear fault Sx51058−566.175.98certain0.31
F21Normal16125−9086.696.,58deducted0.34

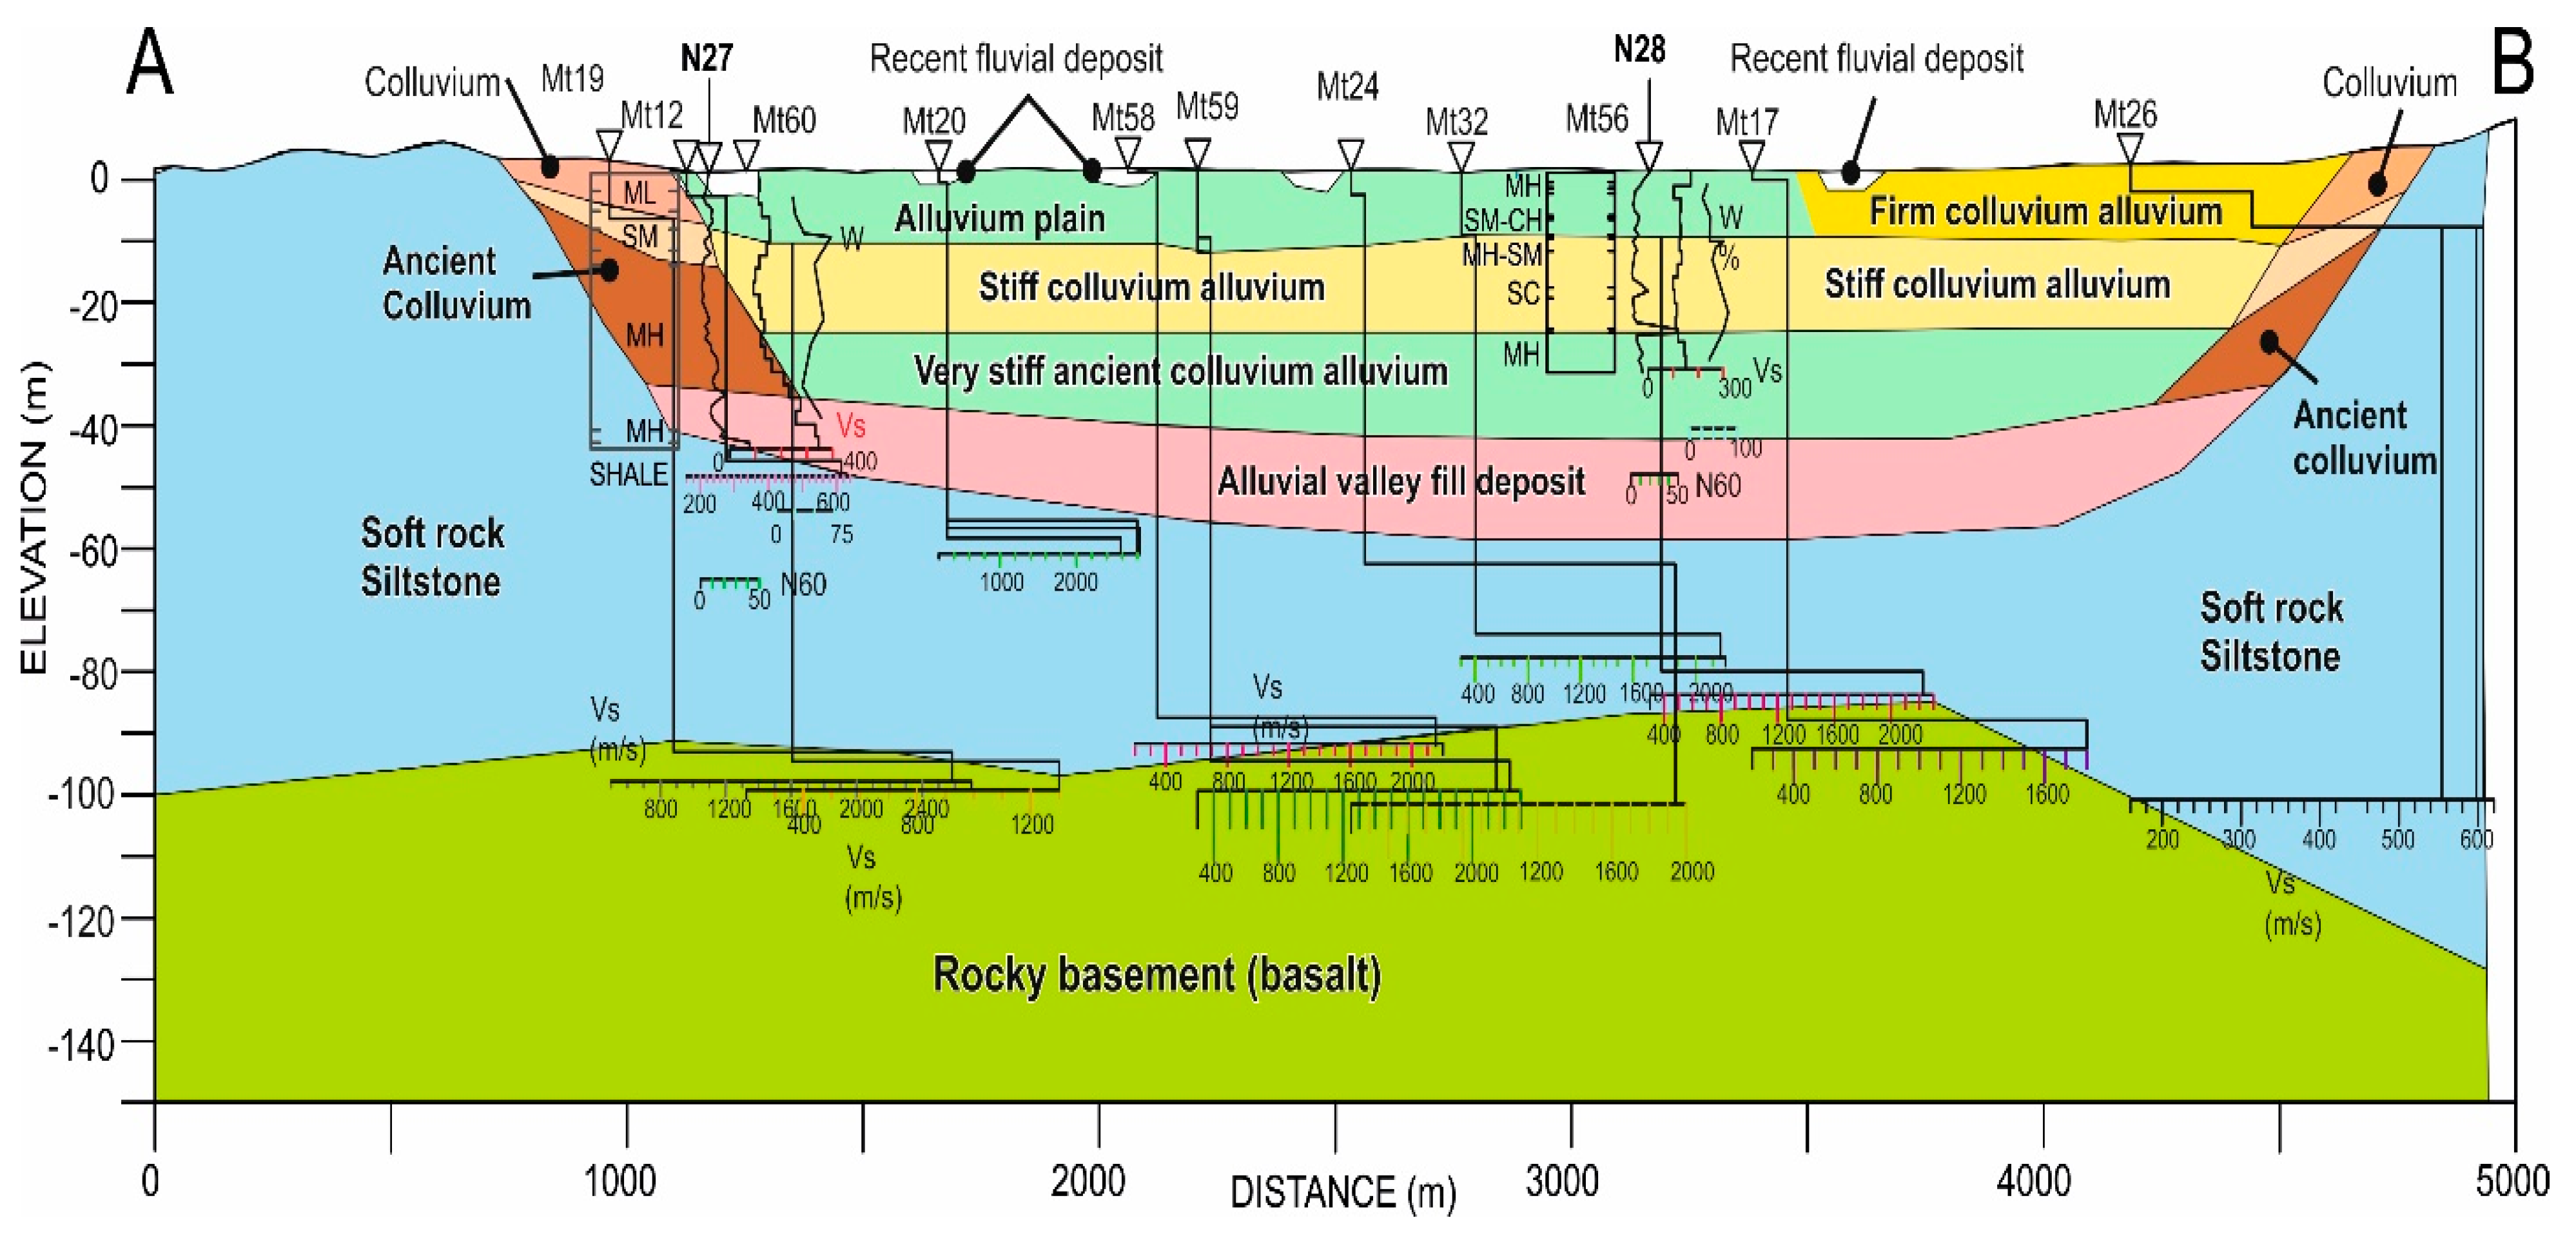
2.3. Geological and Geotechnical Section of the Lithological Structure of the Chone Soil

A geological profile of section A–B in Figure 4, which is approximately 5 km long, was obtained from geophysical tests for the determination of rocky basement strata corresponding to Cretaceous basalts of the Piñon formation [44,45]. There, we yielded wave speeds (Vs) up to 2400 m/s at depths greater than 90 m [34]. In the upper part of the profile, there are strata of soft rocks corresponding to Miocene siltstones and claystones with the Tosagua formation, where (Vs) between 400 and 700 m/s are evident located at depths that range between 20 to 80 m. This layer corresponds to a type C soil profile. The firm soils of the Miocene and Cretaceous represent the rocky substrate covered by dense to very dense sediments defined as fluvial valley material, where the Vs ranges between 200 and 400 m/s, with thicknesses of 10 to 20 m in depth. This depth, according to the soil profile, classifies it as type C [34]. This part corresponds to colluvial sediments. These present (Vs) 220 m/s classified as type D soil that oscillates at depths of up to 12 m and a fundamental period of the soil between 0.35 and 0.9 s. The sedimentary strata corresponding to the alluvial–colluvial deposits of the Pleistocene reach (Vs) between 180 and 300 m/s thicknesses that manage to reach depths of up to 15 m, being classified as type D soil profile [34] and fundamental period of the soil between 0.7 and 1.2 s. Sedimentary units are characterized as Holocene floodplain deposits. These reach (Vs) less than 150 m/s at depths that oxidize between 2 and 8 m, and according to the soil profile classification, they correspond to type E [34] and fundamental period of the soil between 0.9 and 1.2 s. This classification of soil profiles is based on the criteria according to the Ecuadorian Standards Construction NEC-2002, NEC-2011 and NEC-2015 [41,46].
Figure 4. Geological and soil profile in the city of Chone modified from [34].
Applsci 12 07867 g004

3. Materials and Methods

For the current study, geotechnical, geological, and geomorphological data were used to later evaluate the soil profiles, which are susceptible to liquefaction [47,48]. Hereby, the standard penetration test (SPT) was used, being the one of the most used worldwide due to its low cost [49]. SPT samples were able to be obtained at 1.5 m intervals through boreholes in order to determine the grain size distribution and Atterberg limits of soils [50]. A total of 26 perforations were used for the determination of the potential of soil liquefaction for the city of Chone as illustrated in Figure 5.
A depth of 20 m was investigated, allowing the elaboration of SPT, Fs and PL profiles. Later, a map of soil liquefaction hazards was developed, categorized by classes, the method proposed by Chen and Juang [51], where the safety factor was calculated throughout the drilling, relating the cyclic resistance (CRR) and the cyclic stress ratio (CSR). Additionally, the main geological deposits were identified, being predominantly alluvium plains, colluvium–alluvium deposits, alluvium plains, colluvium deposits and ancient alluvium plains. Granulometry, water content (%w), degree of saturation (Sr), liquid limit (LL), and plasticity limit [22] tests were performed, evaluating each of the different strata. The methodology that was followed to determine the probability of liquefaction in the city of Chone is divided into four stages [22]. In the first stage, a database of historical earthquakes and geological faults is created. Then the geotechnical, geological and geophysical results of the area are compiled and analyzed, where there is also field reconnaissance and the elaboration of a map of geological units using GIS technology. The calculation probability (PL) is assessed from SPT tests, considering a seismic hazard of amax = 0.5 g. Finally, a liquefaction hazard map is prepared for the city of Chone, with documented co-seismic evidence as illustrated in Figure 6 of the earthquake in 2016.
Most of the urban area has soft soils, which are classified as sand, silt, and silty clay, and interspersed sand strata. At moderate to high magnitude levels, soil liquefaction is one of the main causes of structural damage in non-cohesive and low plasticity soils [52,53]. In addition, in another investigation, undrained cyclic triaxial tests were conducted using various types of sands under different confining pressures, to establish a relationship between the resistance to liquefaction and the speed of the shear wave [54]. In many cases, areas susceptible to soil liquefaction experienced rapid, unplanned population growth [30]. However, there are few rules of competent organizations with territorial planning that involve types of soil exposed to co-seismic environmental effects [55], that is, they are not considered in municipal cadastre studies for cities.

4. Results and Discussion

4.1. Geological and Geotechnical Database

These exposed data indicate that the city of Chone is located on deposits of alluvial plain sediments and old strata of colluvial deposits, causing them to have unfavorable conditions in terms of soil behavior [30]. Table 3 lists the description by stratum of the Unified Soil Classification System (USCS), the geological units, shear rates and geological ages with their respective thicknesses.
The surface strata identified between 1 and 8 m deep have shear rates that vary between 100 and 150 m/s belonging to the Holocene. With respect to the stiff colluvium alluvium deposits, there are soft to medium compact strata with a Vs ranging from 150 to 400 m/s between depths of 8 and 22 m. The deepest strata of ancient alluvial–colluvial deposits are sedimentary deposits with compactness that varies with depth from soft to firm between 15 and 18 m with Vs ranging from 180 to 300 m/s and soils with firm compactness that are located at greater depths at 25 m presenting Vs greater than 500 m/s.
This analysis was realized in order to first classify the geological units describing which soils are liquefiable where they are considered probably liquefiable when the liquid limit (LL) is less than 37% and the plasticity index (PI) is less than 12% [56]. These would correspond to the soils of the city of Chone at depths between 8 and 14 m deep. Any loose soils with PI < 12 and wc/LL > 0.85 are the most susceptible to liquefaction, while loose soils between 12 < PI < 20 and wc/LL > 0.8 are more resistant to liquefaction but still these are susceptible to cyclic mobility [57]. Figure 7 illustrates the susceptibility results of liquefiable soils based on the criteria proposed by Seed et al. [56], where the perforations are indicated with their respective LL and PI, evidencing that non-liquefiable soils present higher LL values, from 37% to 82%.
These soils present Holocene strata up to 15 m deep with soft to medium compactness and with a degree of saturation (Sr) close to 100%. All these characteristics make them potentially liquefiable soils that belong to alluvial deposits. For the Pleistocene strata that correspond to depths of 15 to 25 m with moderately dense compactness, belonging to alluvial–colluvial deposits, they indicate (Sr) between 77% and 86%. Table 4 illustrates the geotechnical results according to their geological units of the tests performed as Fc, Sr, LL, PI, and N1SPT60 corresponding to the city of Chone.
Figure 7. Analysis of the liquefaction susceptibility based on the criteria proposed by Seed et al. [56]. The red rectangle is distributed spatially to determinate the areas susceptible to soil liquefaction, while the white area indicates the non-liquefiable soils.
Applsci 12 07867 g007
It is indicated that the laboratory tests performed on saturated sands for the liquefaction phenomenon are determined by three main factors. First, the higher the void ratio in the soil, the more easily liquefaction will occur. Second, the lower the confining pressure, the more readily liquefaction will occur. Finally, the higher the cyclic stress, the lower the number of cycles required to induce liquefaction [58].
The content of low plasticity fines does not necessarily provide a higher resistance to liquefaction, and with respect to the grading effect of sands, it is concluded that the triaxial cyclic strength of a well-graded specimen decreases to a lower limit value when adding low plasticity fines up to about 20% [59]. According to the geotechnical results, the strata intercalated between sands and silts that present these soils of the city of Chone vary the coefficient of uniformity (Cu) between 1.82 and 2.80 mm and the coefficient of curvature (Cu) between 0.12 and 2.80.
It was also indicated that soils are liquefiable when they have a degree of saturation (Sr) close to 100%, that a fraction (FC) is less than 35%, and that the diameter of the granulometry must be between 0.05 mm and 1.5 mm, having a uniformity coefficient Cu < 15 [56]. In the present investigation, a quantitative technique is used, where it allows us to determine the probability of liquefaction (PL) up to 20 m depth [30], applying equations proposed by Chen and Juang [60]. Subsequently, a soil liquefaction hazard map was prepared.

4.2. Determination of the Safety Factor for the City of Chone

Once the lithological units were described, the liquefaction potential was evaluated using the standard penetration test (SPT). The simplified method was used to determine the factor of safety (Fs), the cyclic resistance ratio (CRR) and the cyclic stress ratio (CSR). The methods used in this investigation were originally developed by Seed and Idriss [14], and later updated by Seed et al. [15,56], Youd and Idriss [16] and Youd et al. [49].
Fs = CRR/CSR
According to Youd and Idriss [16], the CRR parameter was calculated with the following proposed equation:
CRR = 1 34 ( N 1 ) 60   + ( N 1 ) 60 135 + 50 ( 10 ( N 1 ) 60 + 45 ) 2 1 200
The resistance of the soil to penetration is given by the number of blows N, which is corrected to become (N1)60 as illustrated in Figure 8a. This process is performed by means of the pressure factor of overload Cn, the hammer energy correction (ER) Ce, the borehole diameter Cb, the rod length correction factor Cr and the correction for samplers with or without casing Cs. This factor of (Cn) was calculated according to the equation proposed by Liao and Whitman [9], that is, Cn = (Pa/σ’v)0.5 as a function of (Pa) (atmospheric pressure) and σ’v (effective vertical stress). Subsequently, a “fine content” correction was applied to the calculated value of N1(60) in order to obtain an equivalent clean sand value (N1)60cs given by the equations proposed by Youd et al. [16].
Rd = 1.0 − 0.00765 Z for Z ≤ 9.15 m
Rd = 1.174 − 0.0267 Z for 9.15 m ≤ Z ≤ 23 m
Subsequently, it is divided by a magnitude scale factor (MSF), where it is calculated by the following equation proposed by Youd et al. [16].
MSF = (Mw/7.5)2.56

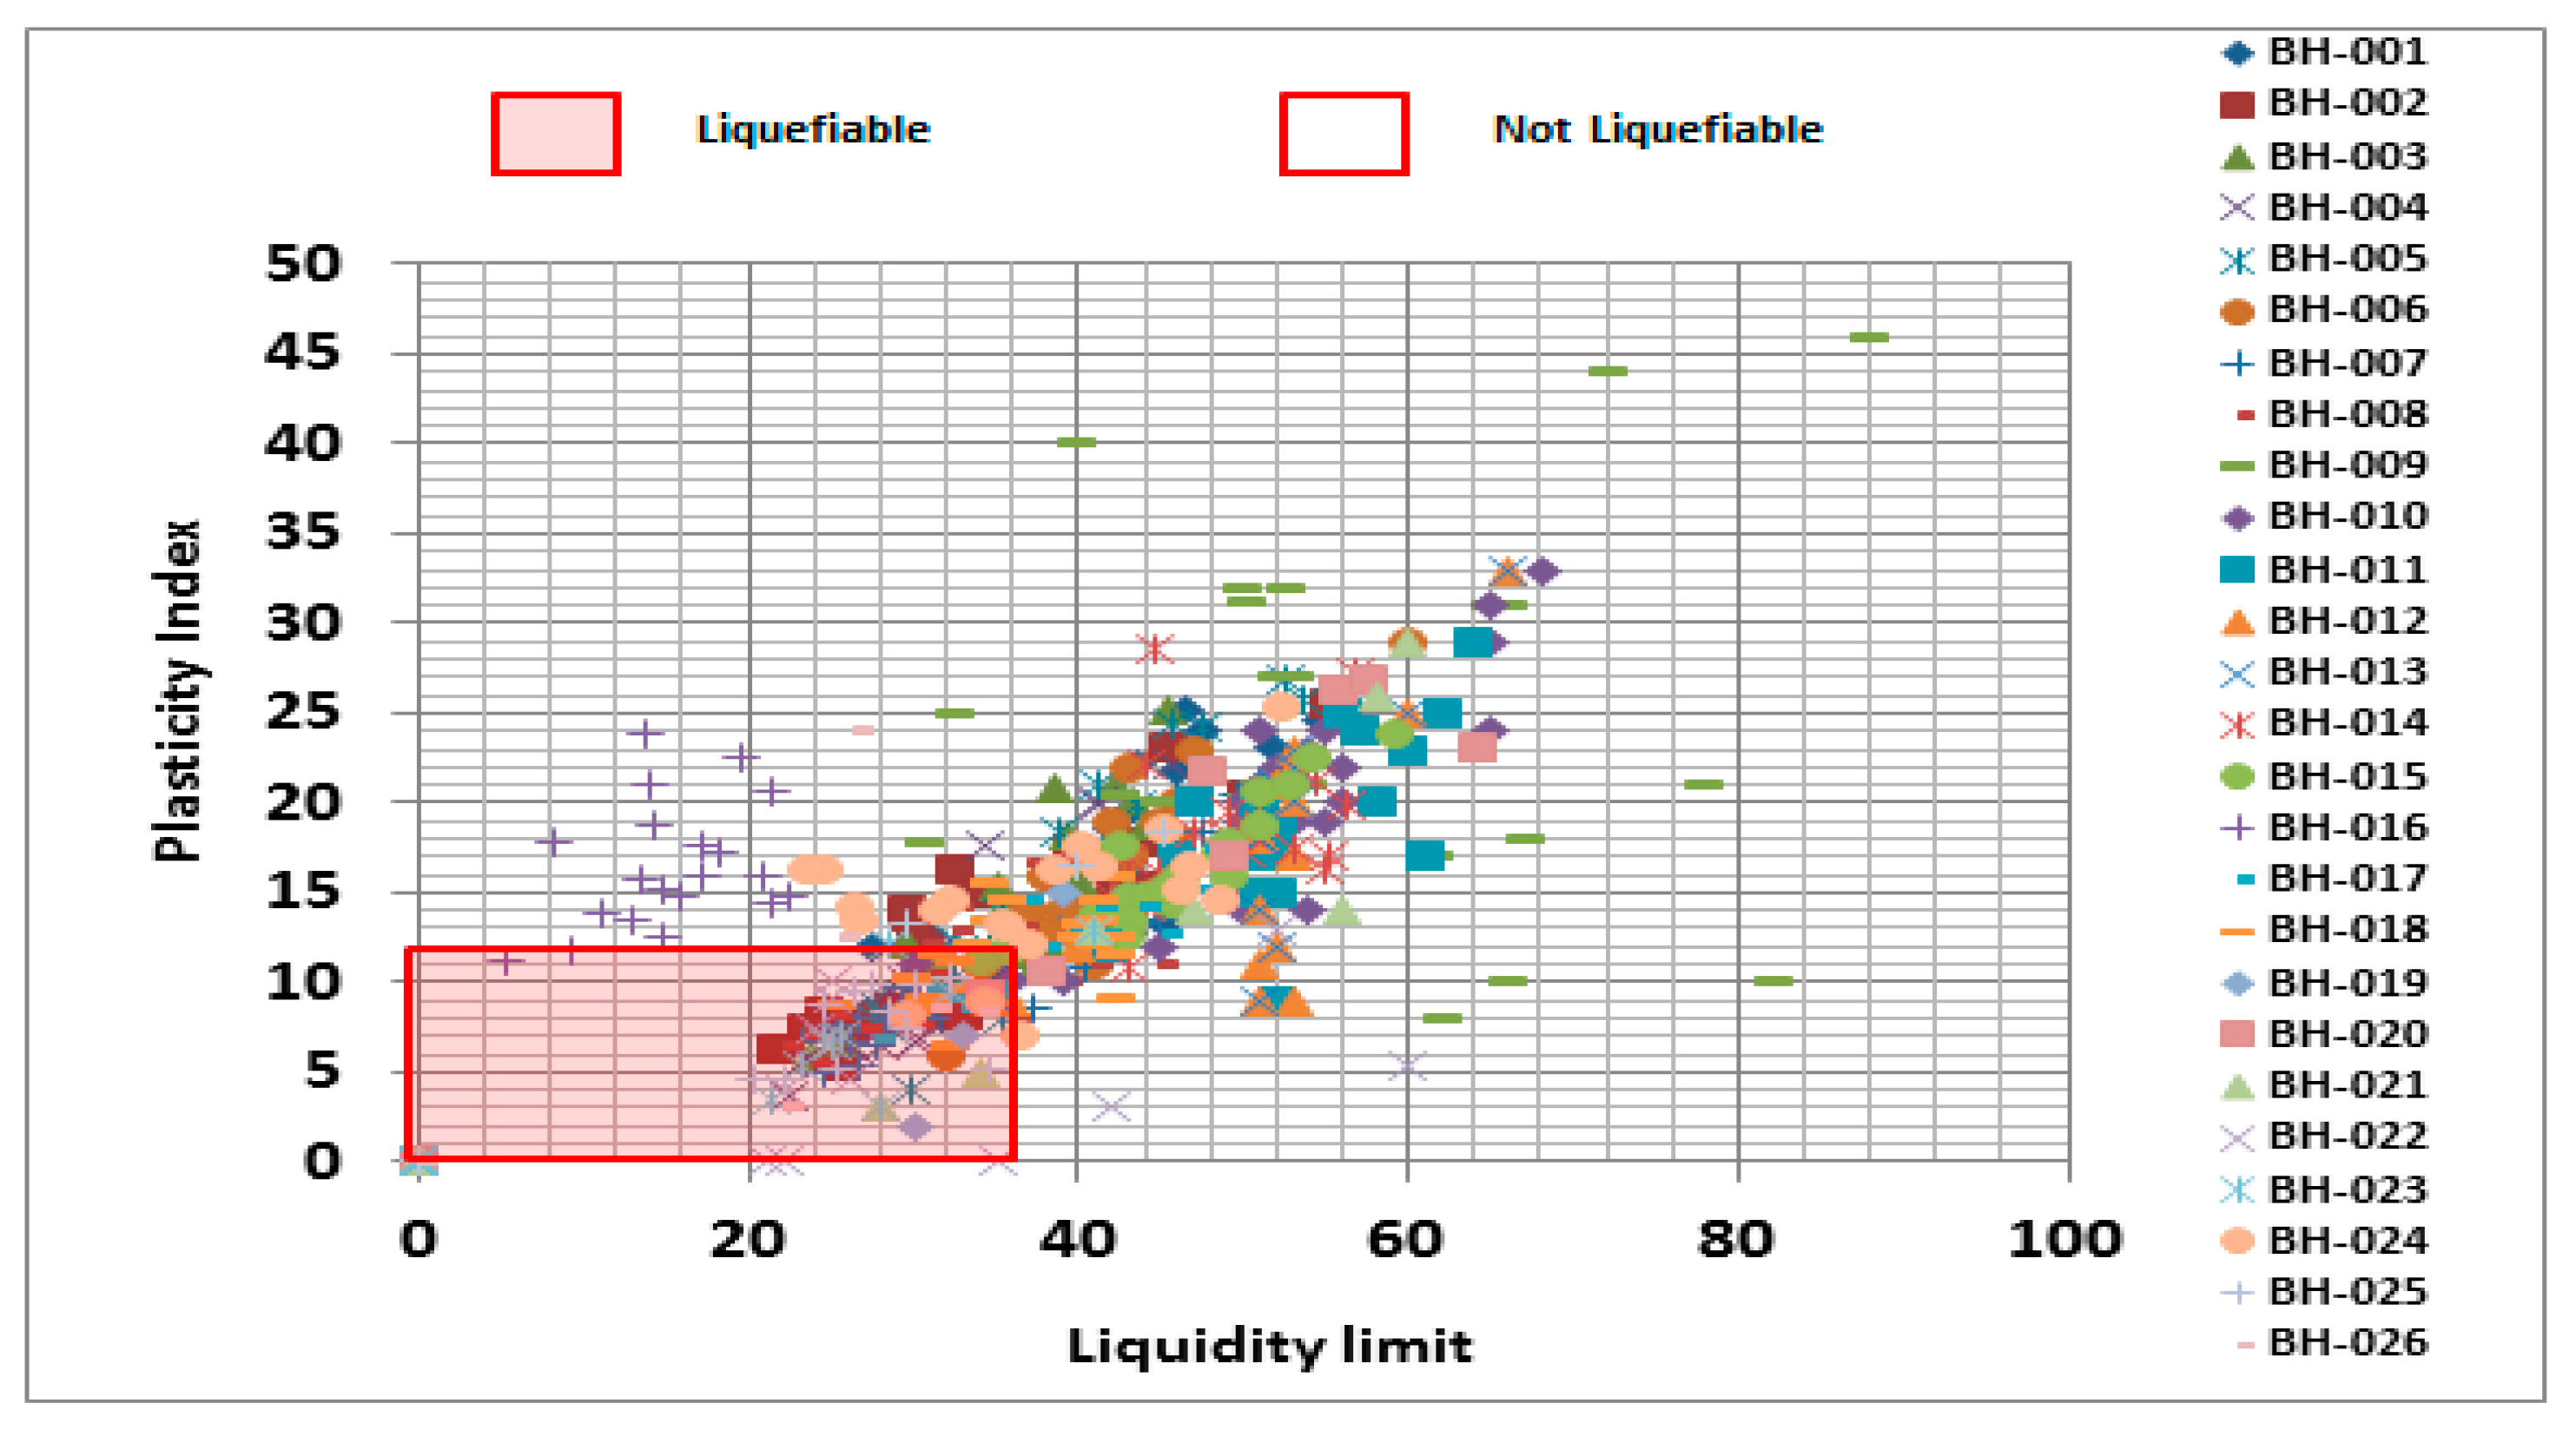
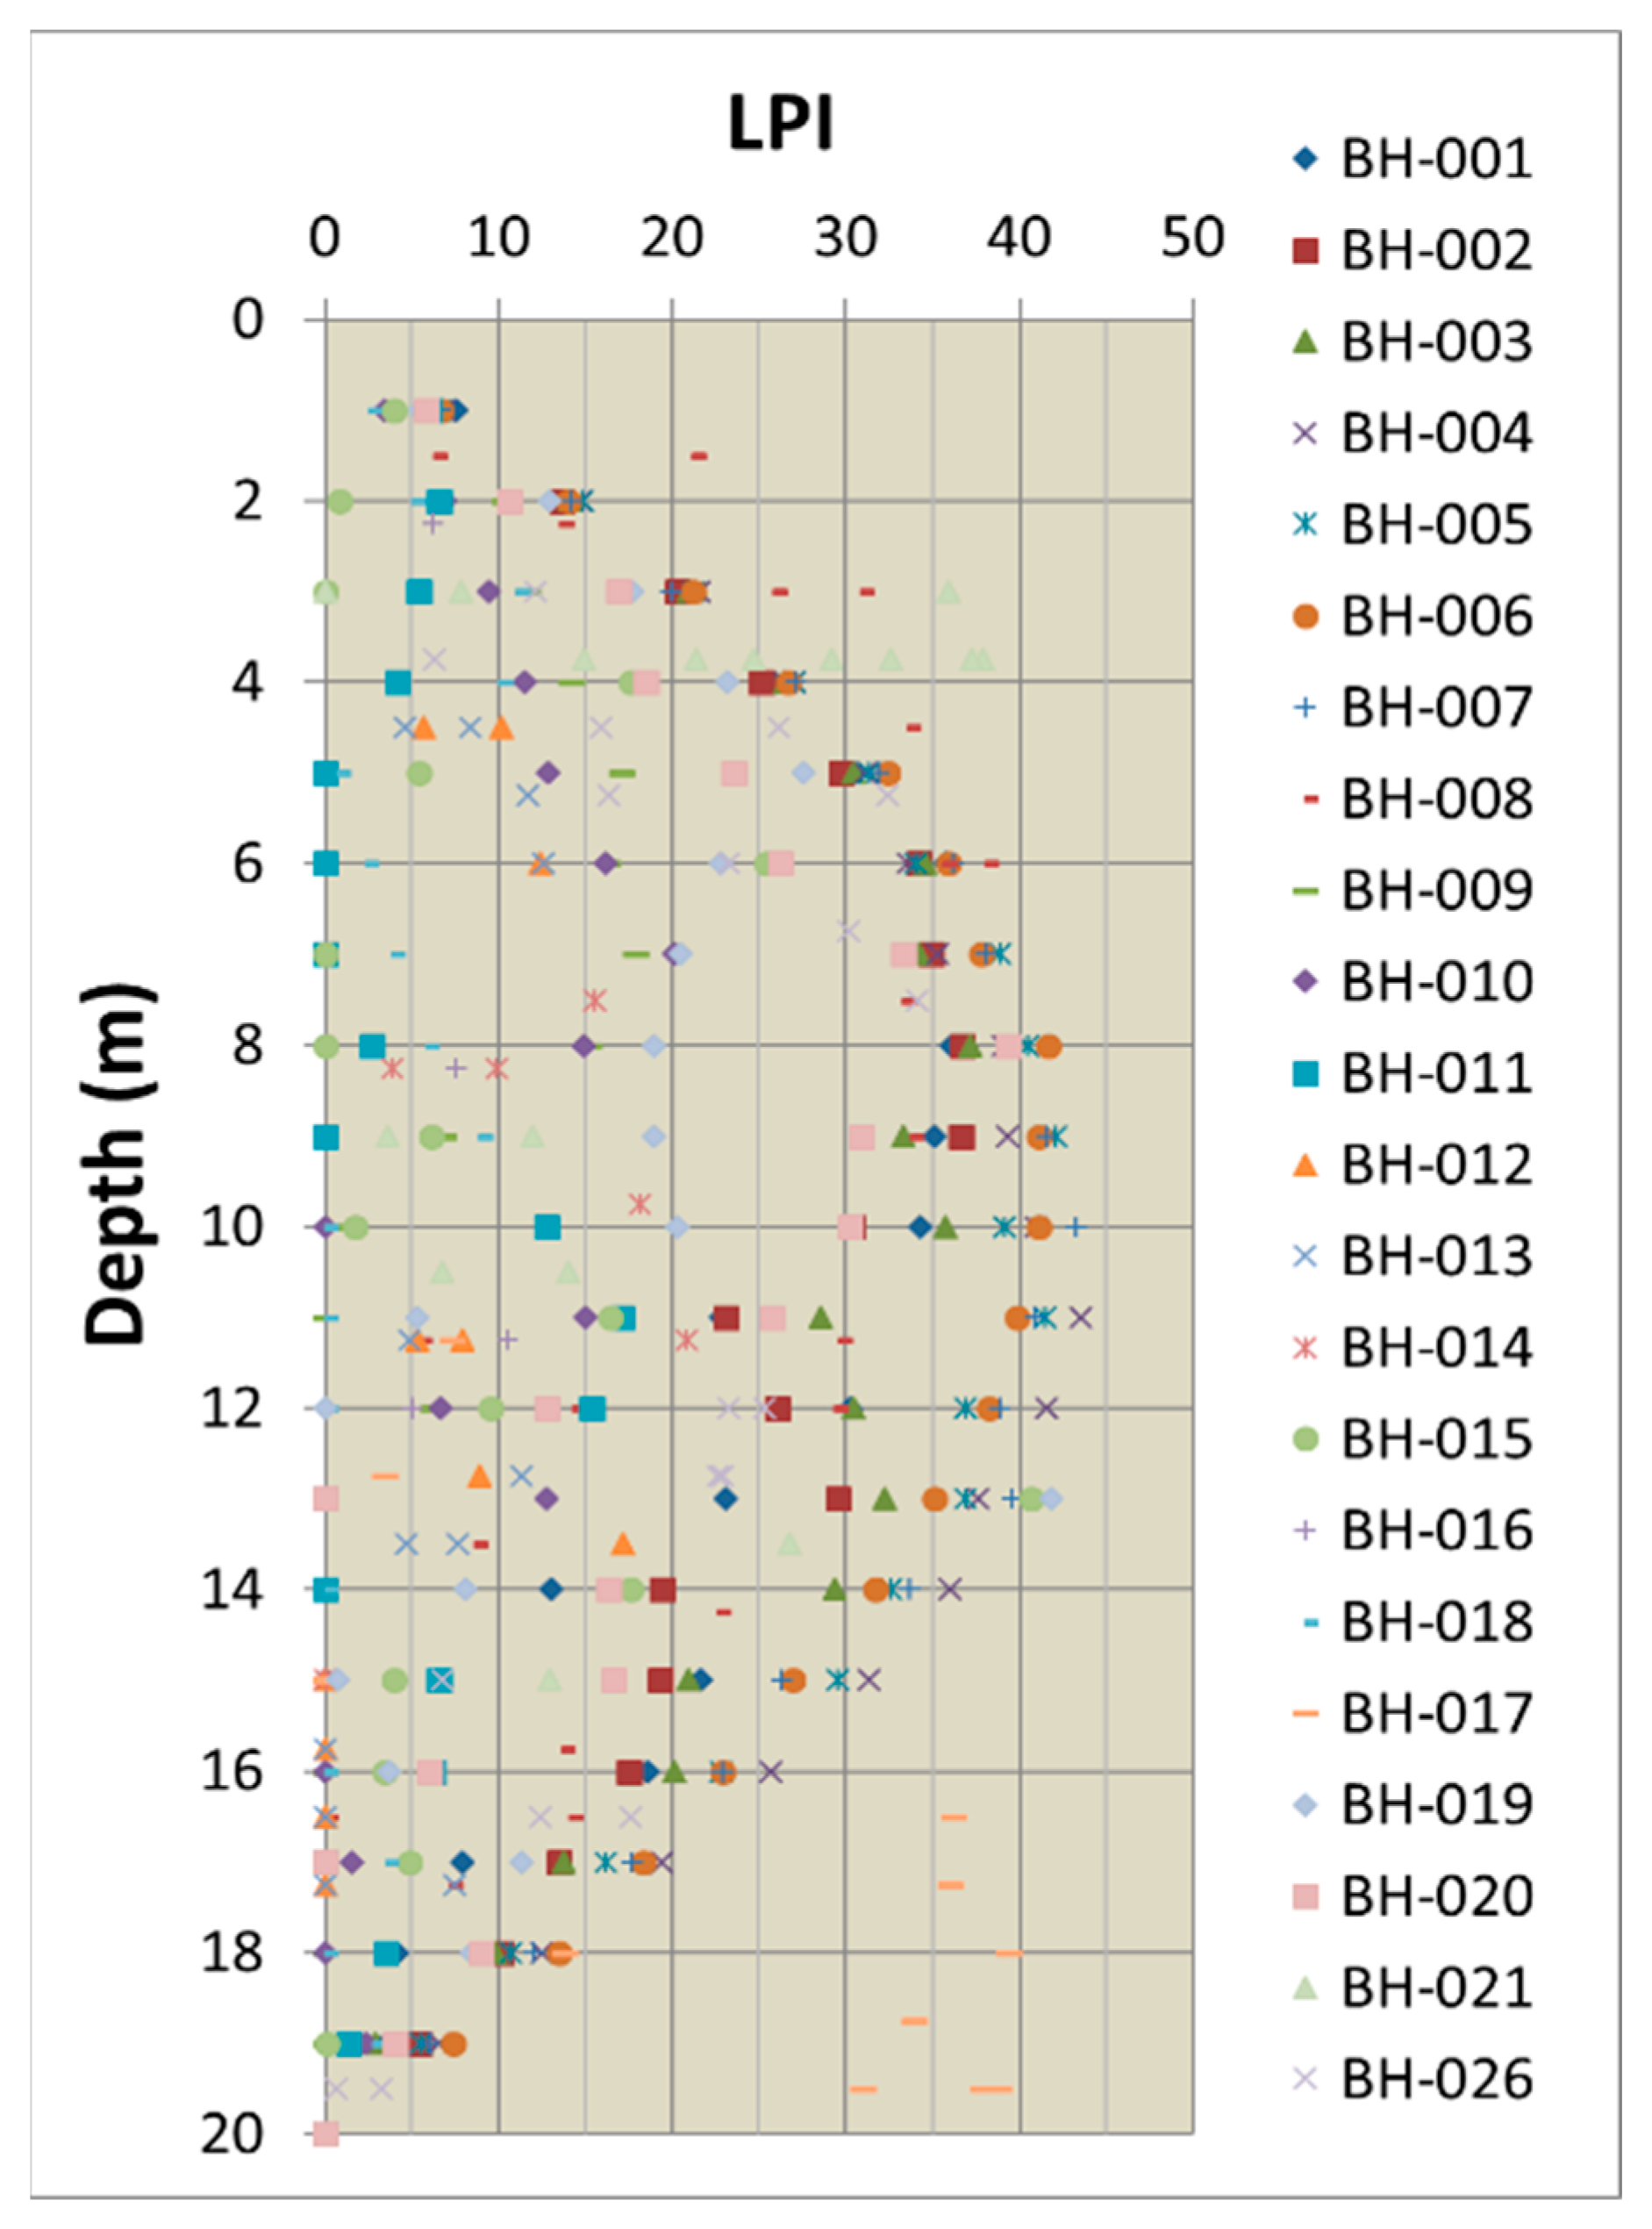
4.3. Analysis of the Liquefaction Potential in the City of Chone

Equation (5) as proposed by Iwasaki et al. [61] is used to calculate the liquefaction potential index (LPI) for the city of Chone as illustrated in Figure 8 which was applied to depths of 20 m.
LPI = 0 z F ( z ) W ( z ) dz
where z is the depth below the ground surface in meters and is calculated as w(z) = 10 − 0.5 z. F(z) is a function of the factor of safety against liquefaction, Fs, where F(z) = 1 − Fs when Fs < 1 and if Fs > 1, then F(z) = 0. Iwasaki et al. [61] categorized the liquefaction potential with the (LPI) according to the severity of damage as indicated in Table 5.
Table 5. Liquefaction severity in the LPI scale.
Liquefaction Potential CategoryIwasaki et al. [61]Sonmez [62]
Very lowLPI = 0No liquefiable (based on Fs ≥ 1.2)
Low0 < LPI < 50 < LPI < 2
Moderate-2 < LPI < 5
High5 < LPI < 155 < LPI < 15
Very highLPI > 15LPI > 15
In addition, using the method of Sonmez [62], the sites have been also categorized according to their LPI value as susceptibility to liquefaction in very low, low, moderate, high, and very high, as listed in Table 5. The LPI values illustrated in Figure 9 demonstrate the strata that have an impact on soil liquefaction.
When evaluating the LPI, which was obtained from the 26 perforations analyzed in the city of Chone, using criteria established by Juang et al. [51] and Chen and Juang [60], it was established that those strata that have a safety factor less than 1.228, obtained from the conditional mean would behave as liquefiable layers and values higher than this would correspond to non-liquefiable soils as illustrated in Figure 8b. These are values that were obtained from the average conditional of the perforations considered in the investigation. The analysis method used in the development of this research allowed to identify the zones classifying them according to the level of occurrence and demonstrating the existence of areas with high and low probability of soil liquefaction; in addition, the PL was identified based on its depth (Figure 8c).
After the analyses obtained and their interpretation of results, as listed in Table 6, a liquefaction hazard map was drawn up for the city of Chone (Figure 10), according to its classes according to its Fs and PL, as proposed by Chen and Juang [60].
Probability   ( liquefaction ) =   1 1 + ( Fs 0.96 ) 4.5
Table 6. Liquefaction probability calculation according to the class proposed by Chen and Juang [60] in the city of Chone.
Description (Likelihood of Liquefaction)ClassBoreholePLFs
Almost certain that it will liquefy5BH010.9790.409
Almost certain that it will liquefy5BH020.9870.365
Almost certain that it will liquefy5BH030.9890.350
Almost certain that it will liquefy5BH040.9980.240
Almost certain that it will liquefy5BH050.9980.236
Almost certain that it will liquefy5BH060.9990.214
Almost certain that it will liquefy5BH070.9990.214
Almost certain that it will liquefy5BH080.9790.408
Liquefaction/non-liquefaction is equally likely3BH090.4011.050
Liquefaction/non-liquefaction is equally likely3BH100.4301.022
Liquefaction/non-liquefaction is equally likely3BH110.4870.971
Liquefaction/non-liquefaction is equally likely3BH120.3731.077
Liquefaction/non-liquefaction is equally likely3BH130.5730.899
Liquefaction/non-liquefaction is equally likely3BH140.5470.921
Very likely4BH150.6840.809
Unlikely2BH160.2361.246
Unlikely2BH170.2601.210
Liquefaction/non-liquefaction is equally likely3BH180.4351.017
Very likely4BH190.9200.558
Almost certain that it will liquefy5BH200.9350.531
Almost certain that it will liquefy5BH210.9640.462
Liquefaction/non-liquefaction is equally likely3BH220.6130.867
Very likely4BH230.8400.664
Liquefaction/non-liquefaction is equally likely3BH240.6410.844
Liquefaction/non-liquefaction is equally likely3BH250.6370.847
Almost certain that it will liquefy5BH260.9320.536
Table 7 indicates the probability of liquefaction, safety factors and their respective classes. With the mean values, PL of 0.989 and Fs of 0.354 were obtained for class 5. Considering for class 4, the mean values of PL are 0.849 and Fs 0.654. For class 3 the PL values are 0.530 and Fs 0935. For class 2, the PL is 0.248 and Fs 1.228. According to the results analyzed, the study area does not present soils corresponding to class 1.
Table 7. Soil liquefaction probability proposed by Chen and Juang [60] for the city of Chone. The values indicated for PL and Fs are the mean values of each class obtained in the present research.
Probability of Liquefaction PLDescription (Likelihood of Liquefaction)Security Factor FsClass
0.989Almost certain that it will liquefy0.3545
0.849Very likely0.6544
0.530Liquefaction/non-liquefaction is equally likely0.9353
0.248Unlikely1.2282
*Almost certain that it will not liquefy*1
* No Class 1 soils were observed in the city of Chone.

4.4. Liquefaction Susceptibility Map, with Maximum Estimates of Magnitude Mw and PGA Values for the City of Chone

A liquefaction susceptibility map was generated for the city of Chone as illustrated in Figure 10, identifying them by zone according to the classes proposed by Chen and Juang as illustrated in Figure 10, contributing to the planning and risk management of the study area. The main earthquakes with magnitude greater than Mw 7.0 are situated in subduction zones located on the coast of Ecuador with a segment of an approximate length of 281 km. Subduction earthquakes, such as the Pedernales earthquake that occurred on 16 April 2016 (Mw 7.8), have a historical reference event due to their similar characteristics to the earthquake that occurred in 1942 in the province of Manabí, which was of about Mw 7.9. Both seismic events caused considerable damage and deaths [63].

5. Conclusions

After evaluating the study area using geological and geotechnical data acquired through standard penetration tests (SPT) to determine the PL and LPI of the various strata down to depths of 20 m and considering as a seismic scenario a maximum recorded peak acceleration of 0.50 g according to the NEC, a hazard map is presented according to the probability of liquefaction. The map proposed divides the Chone area into 5 classes of soil depending on its probability of liquefaction assessed according to Chen and Juang. No soils belonging to the class 1 (almost certain that it will not liquefy) were identified in the city of Chone.
Once the safety factor for the city of Chone was calculated from the geotechnical results, it was determined that the strata with Fs lower than 1228 correspond to liquefiable soils. The maximum values of LPI were found at a depth between 9 and 11 m, where the presence of greater damages due to liquefaction and co-seismic effects are estimated. According to the SPT studies, compactness values between low and high were recorded, as they are settled in deposits of alluvial plains that correspond to Holocene soils up to depths of 15 m.
The liquefaction map generated serves as a relevant contribution to territorial planning, risk management in the construction of civil works and territorial reorganization of the canton. The same can be used by government or private institutions and will serve as an example for regions that have similarities in lithology, geodynamics and seismic vulnerabilities.

Author Contributions

Conceptualization, E.O.-H.; methodology, E.O.-H., J.L.P. and K.C.; software, E.O.-H. and J.L.P.; validation, T.T.; formal analysis, E.O.-H.; investigation, E.O.-H., K.C., J.L.P. and T.T.; resources, E.O.-H.; data curation, E.O.-H., J.L.P. and K.C.; writing—original draft preparation, E.O.-H.; writing—review and editing, T.T.; visualization, E.O.-H. and K.C.; supervision, J.L.P.; project administration, J.L.P.; funding acquisition, E.O.-H. All authors have read and agreed to the published version of the manuscript.

Funding

This research was performed with the support of the private Soil Mechanics Laboratory “Suelcon & Asf” of the province of Manabi.

Institutional Review Board Statement

Not applicable.

Informed Consent Statement

Not applicable.

Data Availability Statement

Not applicable.

Acknowledgments

We are grateful to the comments and recommendations of the three anonymous reviewers of Applied Science. This study was conducted with the support of Soil Mechanics Private Laboratories “Suelcon & Asf” and L.U.P. and the Technical University of Manabí (UTM).

Conflicts of Interest

The authors declare no conflict of interest.

References

  1. Kanamori, H. The energy release in great earthquakes. J. Geophys. Res. 1977, 82, 2981–2987. [Google Scholar] [CrossRef] [Green Version]
  2. Calais, E.; Camelbeeck, T.; Stein, S.; Liu, M.; Craig, T.J. A new paradigm for large earthquakes in stable continental plate interiors. Geophys. Res. Lett. 2016, 43, 10–621. [Google Scholar] [CrossRef]
  3. Dixit, J.; Dewaikar, D.M.; Jangid, R.S. Assessment of liquefaction potential index for Mumbai city. Nat. Hazards Earth Syst. Sci. 2012, 12, 2759–2768. [Google Scholar] [CrossRef] [Green Version]
  4. Papathanassiou, G.; Pavlides, S.; Ganas, A. The 2003 Lefkada earthquake: Field observations and preliminary microzonation map based on liquefaction potential index for the town of Lefkada. Eng. Geol. 2005, 82, 12–31. [Google Scholar] [CrossRef]
  5. Mohindra, R.; Bagati, T.N. Seismically induced soft-sediment deformation structures (seismites) around Sumdo in the lower Spiti valley (Tethys Himalaya). Sediment. Geol. 1996, 101, 69–83. [Google Scholar] [CrossRef]
  6. Hernández, E.H.O.; Moncayo, E.H.O.; Sánchez, L.K.M.; de Calderero, R.P. Behavior of clayey soil existing in the portoviejo canton and its neutralization characteristics. Int. Res. J. Eng. IT Sci. Res. 2017, 3, 1–10. [Google Scholar] [CrossRef] [Green Version]
  7. Obermeier, S.F.; Olson, S.M.; Green, R.A. Field occurrences of liquefaction-induced features: A primer for engineering geologic analysis of paleoseismic shaking. Eng. Geol. 2005, 76, 209–234. [Google Scholar] [CrossRef]
  8. Okamura, M.; Bhandary, N.P.; Mori, S.; Marasini, N.; Hazarika, H. Report on a reconnaissance survey of damage in Kathmandu caused by the 2015 Gorkha Nepal earthquake. Soils Found. 2015, 55, 1015–1029. [Google Scholar] [CrossRef] [Green Version]
  9. Javdanian, H. Evaluation of soil liquefaction potential using energy approach: Experimental and statistical investigation. Bull. Eng. Geol. Environ. 2019, 78, 1697–1708. [Google Scholar] [CrossRef]
  10. Javadi, A.A.; Rezania, M.; Nezhad, M.M. Evaluation of liquefaction induced lateral displacements using genetic programming. Comput. Geotech. 2006, 33, 222–233. [Google Scholar] [CrossRef]
  11. Rahman, M.; Siddiqua, S. Evaluation of liquefaction-resistance of soils using standard penetration test, cone penetration test, and shear-wave velocity data for Dhaka, Chittagong, and Sylhet cities in Bangladesh. Environ. Earth Sci. 2017, 76, 207. [Google Scholar] [CrossRef]
  12. Kayabali, K. Soil liquefaction evaluation using shear wave velocity. Eng. Geol. 1996, 44, 121–127. [Google Scholar] [CrossRef]
  13. Toprak, S.; Holzer, T.L. Liquefaction potential index: Field assessment. J. Geotech. Geoenviron. Eng. 2003, 129, 315–322. [Google Scholar] [CrossRef]
  14. Seed, H.B.; Idriss, I.M. Simplified procedure for evaluating soil liquefaction potential. J. Soil Mech. Found. Div. 1971, 97, 1249–1273. [Google Scholar] [CrossRef]
  15. Bolton Seed, H.; Tokimatsu, K.; Harder, L.F.; Chung, R.M. Influence of SPT procedures in soil liquefaction resistance evaluations. J. Geotech. Eng. 1985, 111, 1425–1445. [Google Scholar] [CrossRef]
  16. Youd, T.L.; Idriss, I.M. Proceeding of the NCEER workshop on evaluation of liquefaction resistance of soils. In Proceedings of the NCEER Workshop on Evaluation of Liquefaction Resistance of Soils, Salt Lake City, UT, USA, 5–6 January 1997; p. 276. [Google Scholar]
  17. Zambrano-Rendón, V.A.; Ortiz-Hernández, E.H.; Alcívar-Moreira, W.S. Caracterización geotécnica de los suelos de la ciudad de Calceta en la provincia de Manabí. Polo Del Conoc. 2021, 6, 77–90. [Google Scholar] [CrossRef]
  18. Tokimatsu, K.; Yoshimi, Y. Empirical correlation of soil liquefaction based on SPT N-value and fines content. Soils Found. 1983, 23, 56–74. [Google Scholar] [CrossRef] [Green Version]
  19. Obermeier, S.F. Use of liquefaction-induced features for paleoseismic analysis—An overview of how seismic liquefaction features can be distinguished from other features and how their regional distribution and properties of source sediment can be used to infer the location and strength of Holocene paleo-earthquakes. Eng. Geol. 1996, 44, 1–76. [Google Scholar] [CrossRef]
  20. Seed, H.B. Soil liquefaction and cyclic mobility evaluation for level ground during earthquakes. J. Geotech. Eng. Div. 1979, 105, 201–255. [Google Scholar] [CrossRef]
  21. Schmertmann, J.H. Use the SPT to Measure Dynamic Soil Properties?—Yes, But.! ASTM International: West Conshohocken, PA, USA, 1978; pp. 341–355. [Google Scholar]
  22. Silva, A.; Montiel, P.O.L. Informe Geotécnico Final; Hospital Napoleón Dávila de Chone: Chone, Ecuador, 2016. [Google Scholar]
  23. Kritikos, T.; Robinson, T.R.; Davies, T.R. Regional coseismic landslide hazard assessment without historical landslide inventories: A new approach. J. Geophys. Res. Earth Surf. 2015, 120, 711–729. [Google Scholar] [CrossRef] [Green Version]
  24. Holzer, T.L.; Bennett, M.J.; Ponti, D.J.; Tinsley, J.C., III. Liquefaction and soil failure during 1994 Northridge earthquake. J. Geotech. Geoenviron. Eng. 1999, 125, 438–452. [Google Scholar] [CrossRef]
  25. Nakamura, S.; Wakai, A.; Umemura, J.; Sugimoto, H.; Takeshi, T. Earthquake-induced landslides: Distribution, motion and mechanisms. Soils Found. 2014, 54, 544–559. [Google Scholar] [CrossRef] [Green Version]
  26. Sonmez, H.; Gokceoglu, C. A liquefaction severity index suggested for engineering practice. Environ. Geol. 2005, 48, 81–91. [Google Scholar] [CrossRef]
  27. Rahman, M.Z.; Siddiqua, S.; Kamal, A.M. Liquefaction hazard mapping by liquefaction potential index for Dhaka City, Bangladesh. Eng. Geol. 2015, 188, 137–147. [Google Scholar] [CrossRef]
  28. Avilés-Campoverde, D.; Chunga, K.; Ortiz-Hernández, E.; Vivas-Espinoza, E.; Toulkeridis, T.; Morales-Delgado, A.; Delgado-Toala, D. Seismically Induced Soil Liquefaction and Geological Conditions in the City of Jama due to the M7. 8 Pedernales Earthquake in 2016, NW Ecuador. Geosciences 2020, 11, 20. [Google Scholar] [CrossRef]
  29. Salocchi, A.C.; Minarelli, L.; Lugli, S.; Amoroso, S.; Rollins, K.M.; Fontana, D. Liquefaction source layer for sand blows induced by the 2016 megathrust earthquake (Mw 7.8) in Ecuador (Boca de Briceño). J. S. Am. Earth Sci. 2020, 103, 102737. [Google Scholar] [CrossRef]
  30. Ortiz-Hernández, E.; Chunga, K.; Pastor, J.L.; Toulkeridis, T. Assessing Susceptibility to Soil Liquefaction Using the Standard Penetration Test (SPT)—A Case Study from the City of Portoviejo, Coastal Ecuador. Land 2022, 11, 463. [Google Scholar] [CrossRef]
  31. UNESCO-IOC. Expert Meeting on Tsunami Sources, Hazards, Risk and Uncertainties Associated with the Colombia-Ecuador Subduction Zone, Guayaquil, Ecuador, 27–29 January 2019; Workshop Report No.295; UNESCO: Paris, France, 2021. [Google Scholar]
  32. Toulkeridis, T.; Chunga, K.; Rentería, W.; Rodriguez, F.; Mato, F.; Nikolaou, S.; D’Howitt, M.C.; Besenzon, D.; Ruiz, H.; Parra, H.; et al. THE 7.8 Mw earthquake and tsunami of 16th April 2016 in Ecuador: Seismic Evaluation, Geological Field Survey and Economic Implications. Sci. Tsunami Hazards 2017, 36, 78–123. [Google Scholar]
  33. Zambrano, G.; Benefrido, W. Análisis de la Evolución en el Sector los Chonanas, Generado por la Construcción de la Vivienda de Interés Social. Repositorio Institucional de la Universidad San Gregorio de Portoviejo. 2021. Available online: http://repositorio.sangregorio.edu.ec/handle/123456789/2422 (accessed on 28 April 2022).
  34. Navia, J.; Chunga, K. Caracterización geotécnica de suelos cohesivos-granulares en la ciudad de Chone. 2020. Available online: https://www.researchgate.net/publication/353209964_Caracterizacion_geotecnica_de_suelos_cohesivos-granulares_en_la_ciudad_de_Chone (accessed on 28 April 2022).
  35. Charfuelán, C.; Armando, D. Geología del cuaternario de la ciudad de Portoviejo y su zona de influencia (escala 1:20000). Bachelor’s Thesis, Carrera de Ingeniería en Geología, Quito, Ecuador, 2018. [Google Scholar]
  36. Chunga, K. Shallow Crustal Earthquakes and Seismic Zonation for Ecuador through the Integration of Geological, Seismological and Morphostructural Data. Ph.D. Thesis, University of Insubria, Varese, Italy, 2010; p. 165. (In Italian). [Google Scholar]
  37. Eguez, A.; Alvarado, A.; Yepes, H.; Machette, M.N.; Costa, C.; Dart, R.L.; Bradley, L.A. Database and map of Quaternary faults and folds of Ecuador and its offshore regions. US Geol. Surv. Open-File Rep. 2003, 3, 289. [Google Scholar]
  38. Chunga, K.; Ochoa-Cornejo, F.; Mulas, M.; Toulkeridis, T.; Menéndez, E. Characterization of seismogenic crustal faults in the Gulf of Guayaquil, Ecuador. Andean Geol. 2019, 46, 66–81. [Google Scholar] [CrossRef]
  39. Wesnousky, S.G. Displacement and geometrical characteristics of earthquake surface ruptures: Issues and implications for seismic-hazard analysis and the process of earthquake rupture. Bull. Seismol. Soc. Am. 2008, 98, 1609–1632. [Google Scholar] [CrossRef]
  40. Fukushima, Y.; Tanaka, T. A new attenuation relation for peak horizontal acceleration of strong earthquake ground motion in Japan. Bull. Seismol. Soc. Am. 1990, 80, 757–783. [Google Scholar]
  41. NEC-11. Norma Ecuatoriana de la Construcción; Registro Oficial No. 413 del 10 de Enero de 2015; NEC: Tokyo, Japan, 2015. [Google Scholar]
  42. Chunga, K.; Pazmiño, N.; Martillo, C.; Quiñonez, M.; Huaman, F. Estimación de máximos niveles de sismicidad para el Litoral Ecuatoriano a través de la integración de datos geológicos y sismo-tectónicos. Rev. Científica Tecnológica UPSE 2013, 1. [Google Scholar] [CrossRef] [Green Version]
  43. Ritta, R.J.; Suárez, L.E.; Pando, M.A. Determinación del período fundamental del suelo usando vibración ambiental y el cociente espectral horizontal/vertical. Mecánica Comput. 2012, 31, 1399–1419. [Google Scholar]
  44. Chunga, K. Reconocimiento Geológico de la Ciudad de Chone. Microzonificación Sísmica de Ciudades Prioritarias de la Costa Ecuatoriana de Conformidad con los Requisitos de la Norma Ecuatoriana de la Construcción NEC; Proyecto BID # EC-T1354. Reporte Técnico 34 pág; Universidad de los Andes: Bogotá, Colombia, 2019. [Google Scholar]
  45. Daza, J.; Trstancho, J.; Caicedo, B. Caracterización Geotécnica y Geofísica de la Ciudad de Chone. Microzonificación Sísmica de Ciudades Prioritarias de la Costa Ecuatoriana de Conformidad con los Requisitos de la Norma Ecuatoriana de la Construcción NEC; Proyecto BID # EC-T1354; Reporte Técnico 94 pág; Universidad de los Andes: Bogotá, Colombia, 2019. [Google Scholar]
  46. CEC. Código Ecuatoriano de la Construcción. Requisitos Generales de Diseño: Peligro Sísmico, Espectros de Diseño y Requisitos Mínimos de Cálculos Para Diseño Sismo Resistente; Registro Oficial No. 382 de 2 de Agosto de 2001; CEC: Quito, Ecuador, 2002. [Google Scholar]
  47. Michetti, A.M.; Esposito, E.; Guerrieri, L.; Porfido, S.; Serva, L.; Tatevossian, R.; Vittori, E.; Audemard, F.; Azuma, T.; Clague, J. Environmental seismic intensity scale-ESI 2007. Mem. Descr. Carta Geol. D’Italia 2007, 74, 7–23. [Google Scholar]
  48. Yao, Y.; Chen, J.; Li, T.; Fu, B.; Wang, H.; Li, Y.; Jia, H. Soil liquefaction in seasonally frozen ground during the 2016 Mw6.6 Akto earthquake. Soil Dyn. Earthq. Eng. 2019, 117, 138–148. [Google Scholar] [CrossRef]
  49. Youd, T.L.; Idriss, I.M. Liquefaction resistance of soils: Summary report from the 1996 NCEER and 1998 NCEER/NSFworkshops on evaluation of liquefaction resistance of soils. J. Geotech. Geoenviron. Eng. 2001, 127, 297–313. [Google Scholar]
  50. Tutuz, T.; Sanver, I.E.; Adil, F. Report on Geological-Geotechnical Investigation of Inegol Municipality Settelement Area; Ankara, Turkey, 2000; 61p. [Google Scholar]
  51. Juang, C.H.; Chen, C.J.; Jiang, T.; Andrus, R.D. Risk-based liquefaction potential evaluation using standard penetration tests. Can. Geotech. J. 2000, 37, 1195–1208. [Google Scholar] [CrossRef]
  52. Goharzay, M.; Noorzad, A.; Ardakani, A.M.; Jalal, M. A worldwide SPT-based soil liquefaction triggering analysis utilizing gene expression programming and Bayesian probabilistic method. J. Rock Mech. Geotech. Eng. 2017, 9, 683–693. [Google Scholar] [CrossRef]
  53. Papathanassiou, G. LPI-based approach for calibrating the severity of liquefaction-induced failures and for assessing the probability of liquefaction surface evidence. Eng. Geol. 2008, 96, 94–104. [Google Scholar] [CrossRef]
  54. Tokimatsu, K.; Uchida, A. Correlation between liquefaction resistance and shear wave velocity. Soils Found. 1990, 30, 33–42. [Google Scholar] [CrossRef] [Green Version]
  55. Quigley, M.C.; Hughes, M.W.; Bradley, B.A.; van Ballegooy, S.; Reid, C.; Morgenroth, J.; Horton, T.; Duffy, B.; Pettinga, J.R. The 2010–2011 Canterbury earthquake sequence: Environmental effects, seismic triggering thresholds and geologic legacy. Tectonophysics 2016, 672, 228–274. [Google Scholar] [CrossRef] [Green Version]
  56. Seed, R.B.; Cetin, K.O.; Moss, R.E.; Kammerer, A.M.; Wu, J.; Pestana, J.M.; Riemer, M.F.; Sancio, R.B.; Bray, J.D.; Kayen, R.E. Recent advances in soil liquefaction engineering: A unified and consistent framework. In Proceedings of the 26th Annual ASCE Los Angeles Geotechnical Spring Seminar, Long Beach, CA, USA, 30 April 2003. [Google Scholar]
  57. Wang, W. Some Findings in Soil Liquefaction; Earthquake Engineering Department, Water Conservancy and Hydroelectric Power Scientific Research Institute: Beijing, China, 1979. [Google Scholar]
  58. Seed, H.B.; Lee, K.L. Liquefaction of saturated sands during cyclic loading. J. Soil Mech. Found. Div. 1966, 92, 105–134. [Google Scholar] [CrossRef]
  59. Koester, J.P. Effects of fines type and content on liquefaction potential of low-to medium plasticity fine-grained soils. In Hazard Assessment Preparedness, Awareness, and Public Education Emergency Response and Recovery Socioeconomic and Public Policy Impacts: Proceedings; U.S. Central United States Earthquake Consortium (CUSEC): Memphis, TN, USA, 1993; pp. 67–75. [Google Scholar]
  60. Chen, C.J.; Juang, C.H. Calibration of SPT-and CPT-based liquefaction evaluation methods. In Innovations and Applications in Geotechnical Site Characterization; American Society of Civil Engineers: Reston, VA, USA, 2000; pp. 49–64. [Google Scholar]
  61. Iwasaki, T.; Tokida, K.I.; Tatsuoka, F.; Watanabe, S.; Yasuda, S.; Sato, H. Microzonation for soil liquefaction potential using simplified methods. In Proceedings of the 3rd International Conference on Microzonation, Seattle, WC, USA, 28 June–1 July 1982; Volume 3, pp. 1310–1330. [Google Scholar]
  62. Sonmez, H. Modification of the liquefaction potential index and liquefaction susceptibility mapping for a liquefaction-prone area (Inegol, Turkey). Environ. Geol. 2003, 44, 862–871. [Google Scholar] [CrossRef]
  63. Chunga, K.; Livio, F.; Mulas, M.; Ochoa-Cornejo, F.; Besenzon, D.; Ferrario, M.F.; Michetti, A.M. Earthquake Ground Effects and Intensity of the 16 April 2016 M w 7.8 Pedernales, Ecuador, Earthquake: Implications for the source characterization of large subduction earthquakes. Bull. Seismol. Soc. Am. 2018, 108, 3384–3397. [Google Scholar] [CrossRef]
Figure 2. Study area within an active fault map.
Applsci 12 07867 g002
Figure 3. Maps of capable geological faults determining PGA (A) and magnitudes (B) for the province of Manabi.
Applsci 12 07867 g003
Figure 5. Geological map and location of drilling of the city of Chone.
Applsci 12 07867 g005
Figure 6. Evidence of the Pedernales earthquake on 16 April 2016, in the city of Chone with affectation in buildings, houses and in the southern zone in the urban area presence of liquefaction. (A) Structural failure in the building caused by construction flaws; (B) non-uniform settlement in the foundation; (C) settlement on soft ground produced by liquefaction effects; (D) deformations or decoupling in pavement structures.
Applsci 12 07867 g006
Figure 8. (a) Results of N SPT values (b) and safety factor (Fs), according to the depth of different geological units in the city of Chone. (c) Probability liquefaction (PL), according to the depth of different geological units in the city of Chone. The results show the average of the 26 boreholes.
Applsci 12 07867 g008
Figure 9. Results of the liquefaction potential index (LPI) according to the depth of each soil strata in the city of Chone.
Applsci 12 07867 g009
Figure 10. Liquefaction probability hazard map of the urban center of Chone city. A seismic hazard scenario corresponding to amax = 0.50 g was used in the predicted probability of liquefaction occurrence.
Applsci 12 07867 g010
Table 3. Classification of the geological materials of the seven present quaternary units and the one Miocene (Tosagua) unit of Chone city.
Geologic UnitsThickness of SedimentsUSCS Soil TypeGeological Age Average Shear Rate (m/s)
Alluvium plain deposits 1 ≤ m ≤ 8MH–MLHolocene100–150
Stiff colluvium alluvium8 ≤ m ≤ 22ML–SMHolocene to Late Pleistocene150–400
Ancient alluvial–colluvial15 ≤ m ≤ 18MH–SMHolocene to Late Pleistocene180–300
Soft rock siltstone>25 mML–MHLate Pleistocene>500
Table 4. Statistical soil parameter analysis results of the city of Chone.
BoreholeFcSrρdLLIPN1SPT60
(%)(%)(g/cm3)(%)(%)
Min–MaxMin–MaxMin–MaxMin–MaxMin–MaxMin–Max
Alluvium plain deposits 6–7896.87–99.871.307–1.74623–464–221–21
Ancient alluvium plain16–9880.45–85.561.566–1.8520–660–336–44
Colluvium–lluvium deposits15–8277.12–86.541.654–1.86625–427–1611–45
Fc—Fraction of fine particles; Sr—Degree of saturation; ρd—Dry density; LL—Liquidity limit; LP—Plasticity limit; NSPT—Standard penetration.
Publisher’s Note: MDPI stays neutral with regard to jurisdictional claims in published maps and institutional affiliations.

