Article

Experimental Investigation on OBD Signal and PN Emission Characteristics by Damaged-DPF Types of 2.0 L Diesel Vehicle

1
Department of Mechanical Engineering, Graduate School, Soongsil University, Seoul 06978, Korea
2
Department of Mechanical Engineering, Undergraduate School, Soongsil University, Seoul 06978, Korea
3
School of Mechanical Engineering, Soongsil University, Seoul 06978, Korea
*
Author to whom correspondence should be addressed.
Appl. Sci. 2022, 12(15), 7853; https://doi.org/10.3390/app12157853
Submission received: 5 June 2022 / Revised: 8 July 2022 / Accepted: 29 July 2022 / Published: 4 August 2022

Abstract

:
A diesel particulate filter (DPF) is an exhaust after-treatment device designed to capture and store exhaust particulate matter, such as soot and ash, to reduce emissions from diesel-powered vehicles. A DPF has a finite capacity and typically uses a substrate made of ceramic material that is formed into a honeycomb structure. Diesel particulate filters play an important role in diesel-fueled vehicles. Failure to maintain these filters can have significant consequences for vehicles. In this study, we investigated the failure type in cordierite DPF substrates. In addition, we experimentally characterized the particle number (PN) emission and on-board diagnostics (OBD) signal of a 2.0 L diesel-fueled vehicle generated by three types of DPF failure (crack, melting, and hollow). Specifically, X-ray photography analysis of the cordierite DPF was performed. The PN and OBD signals were assessed via the KD-147 vehicle driving mode and measured using a DMS-500 (PN measurement device) and global diagnosis tool (GDS) scanner (OBD diagnostic device), respectively. X-ray photography was used to characterize the internal structure of the three DPF-failure samples. A key result was that the maximum value of the OBD data, including airflow mass, boost pressure, and VGT actuator, was distinctly different for each DPF sample. The exhaust temperature gradient for the normal DPF and crack-damaged DPF followed the KD-147 driving pattern. This was because there was no volume damage inside the cordierite DPF substrates. However, in the case of the hollow and melting-damaged DPF, the volume inside the cordierite DPF substrates was reduced or the time for the exhaust gas to stay in the DPF substrates was decreased. The melting-damaged DPF continuously emitted the largest number of nanoparticles (of the order of 109 #/cc). This was regardless of the vehicle driving speed in the KD-147 driving mode. Eventually, an OBD-based algorithm to determine whether a DPF is damaged was derived in this study.

1. Introduction

Sustainability is one of the most noteworthy challenges in the 21st century. Sustainability issues with sustainable vehicle energy and emission management mobility are increasing in several areas of the value chain (design, production, use, and waste management). Furthermore, transportation operations of all sizes are starting to critically consider sustainability.
The demand for mid-sized electric vehicles is an opportunity for all vehicle manufacturers. Nonetheless, most vehicles (particularly highway and long-distance applications) would continue to be driven by diesel-based medium and large vehicles [1].
Diesel powertrains have experienced the largest evolution over the past few years. The most difficult pollutants to control in a diesel engine that widely used in light-duty applications employ in common-rail direct injection (CRDi) are NOx and exhaust particulates [2]. The Euro-6 emission standards were introduced to ensure that diesel vehicle manufacturers limit hazardous emissions below specific limits (0.5 g/km of CO, 0.08 g/km of NOx, 0.005 g/km of particulate matter (PM), 6 × 10¹¹ particles/km of particle number (PN)) that were applicable from the start of Euro-6 for direct injection engine vehicles. For example, PM1.0 comprises small dust with diameters less than 1 μm. It is not emitted through bronchial tubes when inhaled into the human body. However, it can penetrate the lungs and cause respiratory diseases or lung cancer. Stricter Euro-7 emission standards would be introduced in the next few years. Notwithstanding these challenges, a well-designed and -maintained diesel engine remains the key technology for high-power sources. Therefore, a diesel engine should be capable of fulfilling the emission legislation at a reasonable cost without losing its fuel consumption advantage.
The future strategies for diesel engines would include the following: reduce PM and NOx emissions for these to be closer to zero, improve fuel efficiency, enhance the use of low-carbon biofuels, and hybridize.
EGR technology is effective for controlling NOx emissions from diesel engines. It plays an important role in exhaust gas and particulate filters. However, its drawbacks include increased PM emissions and increased fuel consumption. Therefore, a diesel particulate filter (DPF) is essential for EGR engines because it is used to control the increase in PM emissions [3]. The diesel engine after-treatment system cleans hazardous exhaust gases to ensure that the engine satisfies emission regulations. It has three emission control devices: a diesel oxidation catalyst (DOC) to control CO and HC, DPF to control fine PM emissions, and selective catalytic reduction (SCR) to control NOx emissions [4]. Increasingly stringent emission regulations impel the demand for increased energy efficiency and advanced after-treatment strategies. These require that exhaust materials satisfy the increasing demands for the durability and reliability performance of DOC, DPF, and SCR devices.
A DPF works by capturing and removing exhaust PM such as soot and ash from diesel-powered vehicles. A DPF has a finite capacity and typically uses a substrate made of a ceramic, corning in various materials which is formed into a honeycomb structure. Metallic options with various filtration efficiency designs are also available. The DPF is integrated within the exhaust. It reduces the PM by physically removing it by compelling the exhaust gas to flow through the porous walls [5]. That is, when a DPF is used, hazardous PM from the exhaust accumulates on the filter, and the DPF generates oscillations in the exhaust backpressure during normal operation. The exhaust resistance of the diesel engine increases as the particulate deposition increases in the wall-flow DPF. Therefore, periodic cleaning is required, which is referred to as active or passive regeneration. During regeneration, the PM combusts within the filter and is released as CO, CO2, and H2O. The molar ratio CO2/CO is significantly higher in the case of catalytic regeneration compared with thermal regeneration [6,7,8]. Therefore, diesel particulate filters play an important role in the environmentally friendly operation of diesel-fueled vehicles. The DPF is used in conjunction with an exhaust backpressure monitoring system [9].
Failure to maintain these filters can lead to significant consequences for the diesel vehicle. Namely, blocking the DPF has a significant effect on engine performance with increase in particulate depositions. The most common reasons for DPF failures are [10]:
  • Frequent short journeys where the engine doesn’t reach optimum operating temperature
  • EGR valve problems, such as stuck or fouled EGR components
  • Faulty fuel injectors sending too much fuel to the air/fuel mixture
  • The use of the wrong engine oil—low ash, low sulfur oil must be used on DPF equipped vehicles.
  • Turbo failure with oil dripping into the DPF: oil passes through turbo seals into the exhaust housing and the burnt oily residue enters the DPF, causing excessive dense soot loading.
  • High mileage vehicle that will find regeneration harder
As representative damaged type of DPF [11], DPF pinholes are breakages in which 0.1–10 mm holes are generated orthogonal to the flow between channels inside DPF. Moreover, melting failure is a type in which the DPF filter melts due to the high temperature exhaust gas, resulting in the formation of an empty space inside the filter axial direction. Cracking failure occurs in the DPF’s circumferential direction and is known to be caused by a temperature gradient generated by the difference in channel blockage inside the filter. If the DPF becomes clogged, the soot generated by the diesel engine is released into the atmosphere in its natural state.
When the carrier of DPF is damaged, the filtering performance of the PM is lowered. PM contains inhalation particles (PM10 and PM2.5) small enough to penetrate the chest region of the respiratory tract. In the short term (time, day), asthma deterioration, respiratory symptoms and hospitalization increase, and damage occur, and long-term (month, year) exposure increases the mortality rate from cardiovascular and respiratory diseases and lung cancer. The vulnerable groups with lung or heart disease, as well as the elderly and children, are particularly vulnerable [12].
Therefore, it is vital to manage this system under normal operating conditions. The exhaust differential pressure data provide one among various methods for assessing DPF as a diesel after-treatment device. This can be determined by comparing the collected PM with one of the on-board diagnostics (OBD) data criteria for assessment, which is based on whether the collected PM is regenerated. If there is no pressure gradient, the DPF is damaged. In addition to pressure, temperature is a feasible OBD data point. By applying the principle of forcibly burning soot accumulated during DPF regeneration, it is feasible to examine the present state of the DPF and identify whether it is malfunctioning. The other means is a resistance-type PM sensor that diagnoses the state of the post-treatment device by applying a voltage to the surface electrode of the sensor element and measuring the amount of current flowing between the electrodes to determine the quantity of PM emission. It is available commercially. The microwave approach is utilized to determine the soot (ash) load of a DPF by employing two antennas and the resonant frequency as a signal obtained from the reflection coefficient [13].
Failures of DPFs are most commonly attributed to a single catastrophic event such as uncontrolled DPF regeneration or a single upstream engine component failure. DPFs have been widely used commercially for several years, and field observations indicate that non-event-linked DPF failures also occur [14]. Therefore, the DPF manufacturer would require knowledge of the cause of the DPF failure. The present methods are based on the examination of differential pressure sensor signals across DPFs. The measured pressure loss was dependent on several disturbance variables. Thus, differential pressure-based monitoring approaches for DPF would increase the difficulty of complying with future OBD legislation [15]. Ochs, T. et al. demonstrated the EGS-PM-concept PM’s and performance, as well as a novel concept for the OBD of DPFs that utilizes the EGS-PM [16].
The identification of the cause of damage by inspecting the damaged shape of the installed DPF with cracks or holes is an important factor in DPF development and powertrain evaluation [17]. The most effective experimental method involves the visualization of the cause of the DPF damage using X-rays. The ash and soot inside a homogeneous substrate can be measured using an X-ray scan when the X-ray contrast is sufficiently strong and edges can be identified in the image. However, large commercial vehicles with large and complex interior structures encounter difficulties even in this instance. Furthermore, ash and soot loadings frequently exhibit a gradually varying density distribution. This hinders their identification from the density pattern of the substrate [18]. Zandhuis et al. established the feasibility of using the widely available X-ray technology for a nondestructive measurement of ash and soot distribution [19]. Nishina et al. demonstrated the analytical capacity of the Tera-Hz-wave CT by measuring and comparing six samples with established requirements [20]. However, this technology has a disadvantage in that it is difficult to use in a manner that is rigorously regulated in accordance with radiation-related rules throughout the general vehicle inspection and management stage.
However, most of the previous studies were focused on the main functions of DPFs, identification of the types of damage by X-ray technology, effects of DPF damage on the human body, and PM sensor-based OBD measurement. Therefore, it is necessary to systematically analyze their effects under the driving mode condition of a diesel-fueled vehicle in actual operation.
To investigate this issue, it is crucial to evaluate whether additional examination is necessary, or to establish an X-ray site before performing a detailed X-ray examination of the DPF. In this study, the authors investigated the correlation between DPF failures and the OBD signal. This was aimed at detecting the type of damaged DPF.
Figure 1 illustrates the detailed study process. These can be classified into the following four divisions:
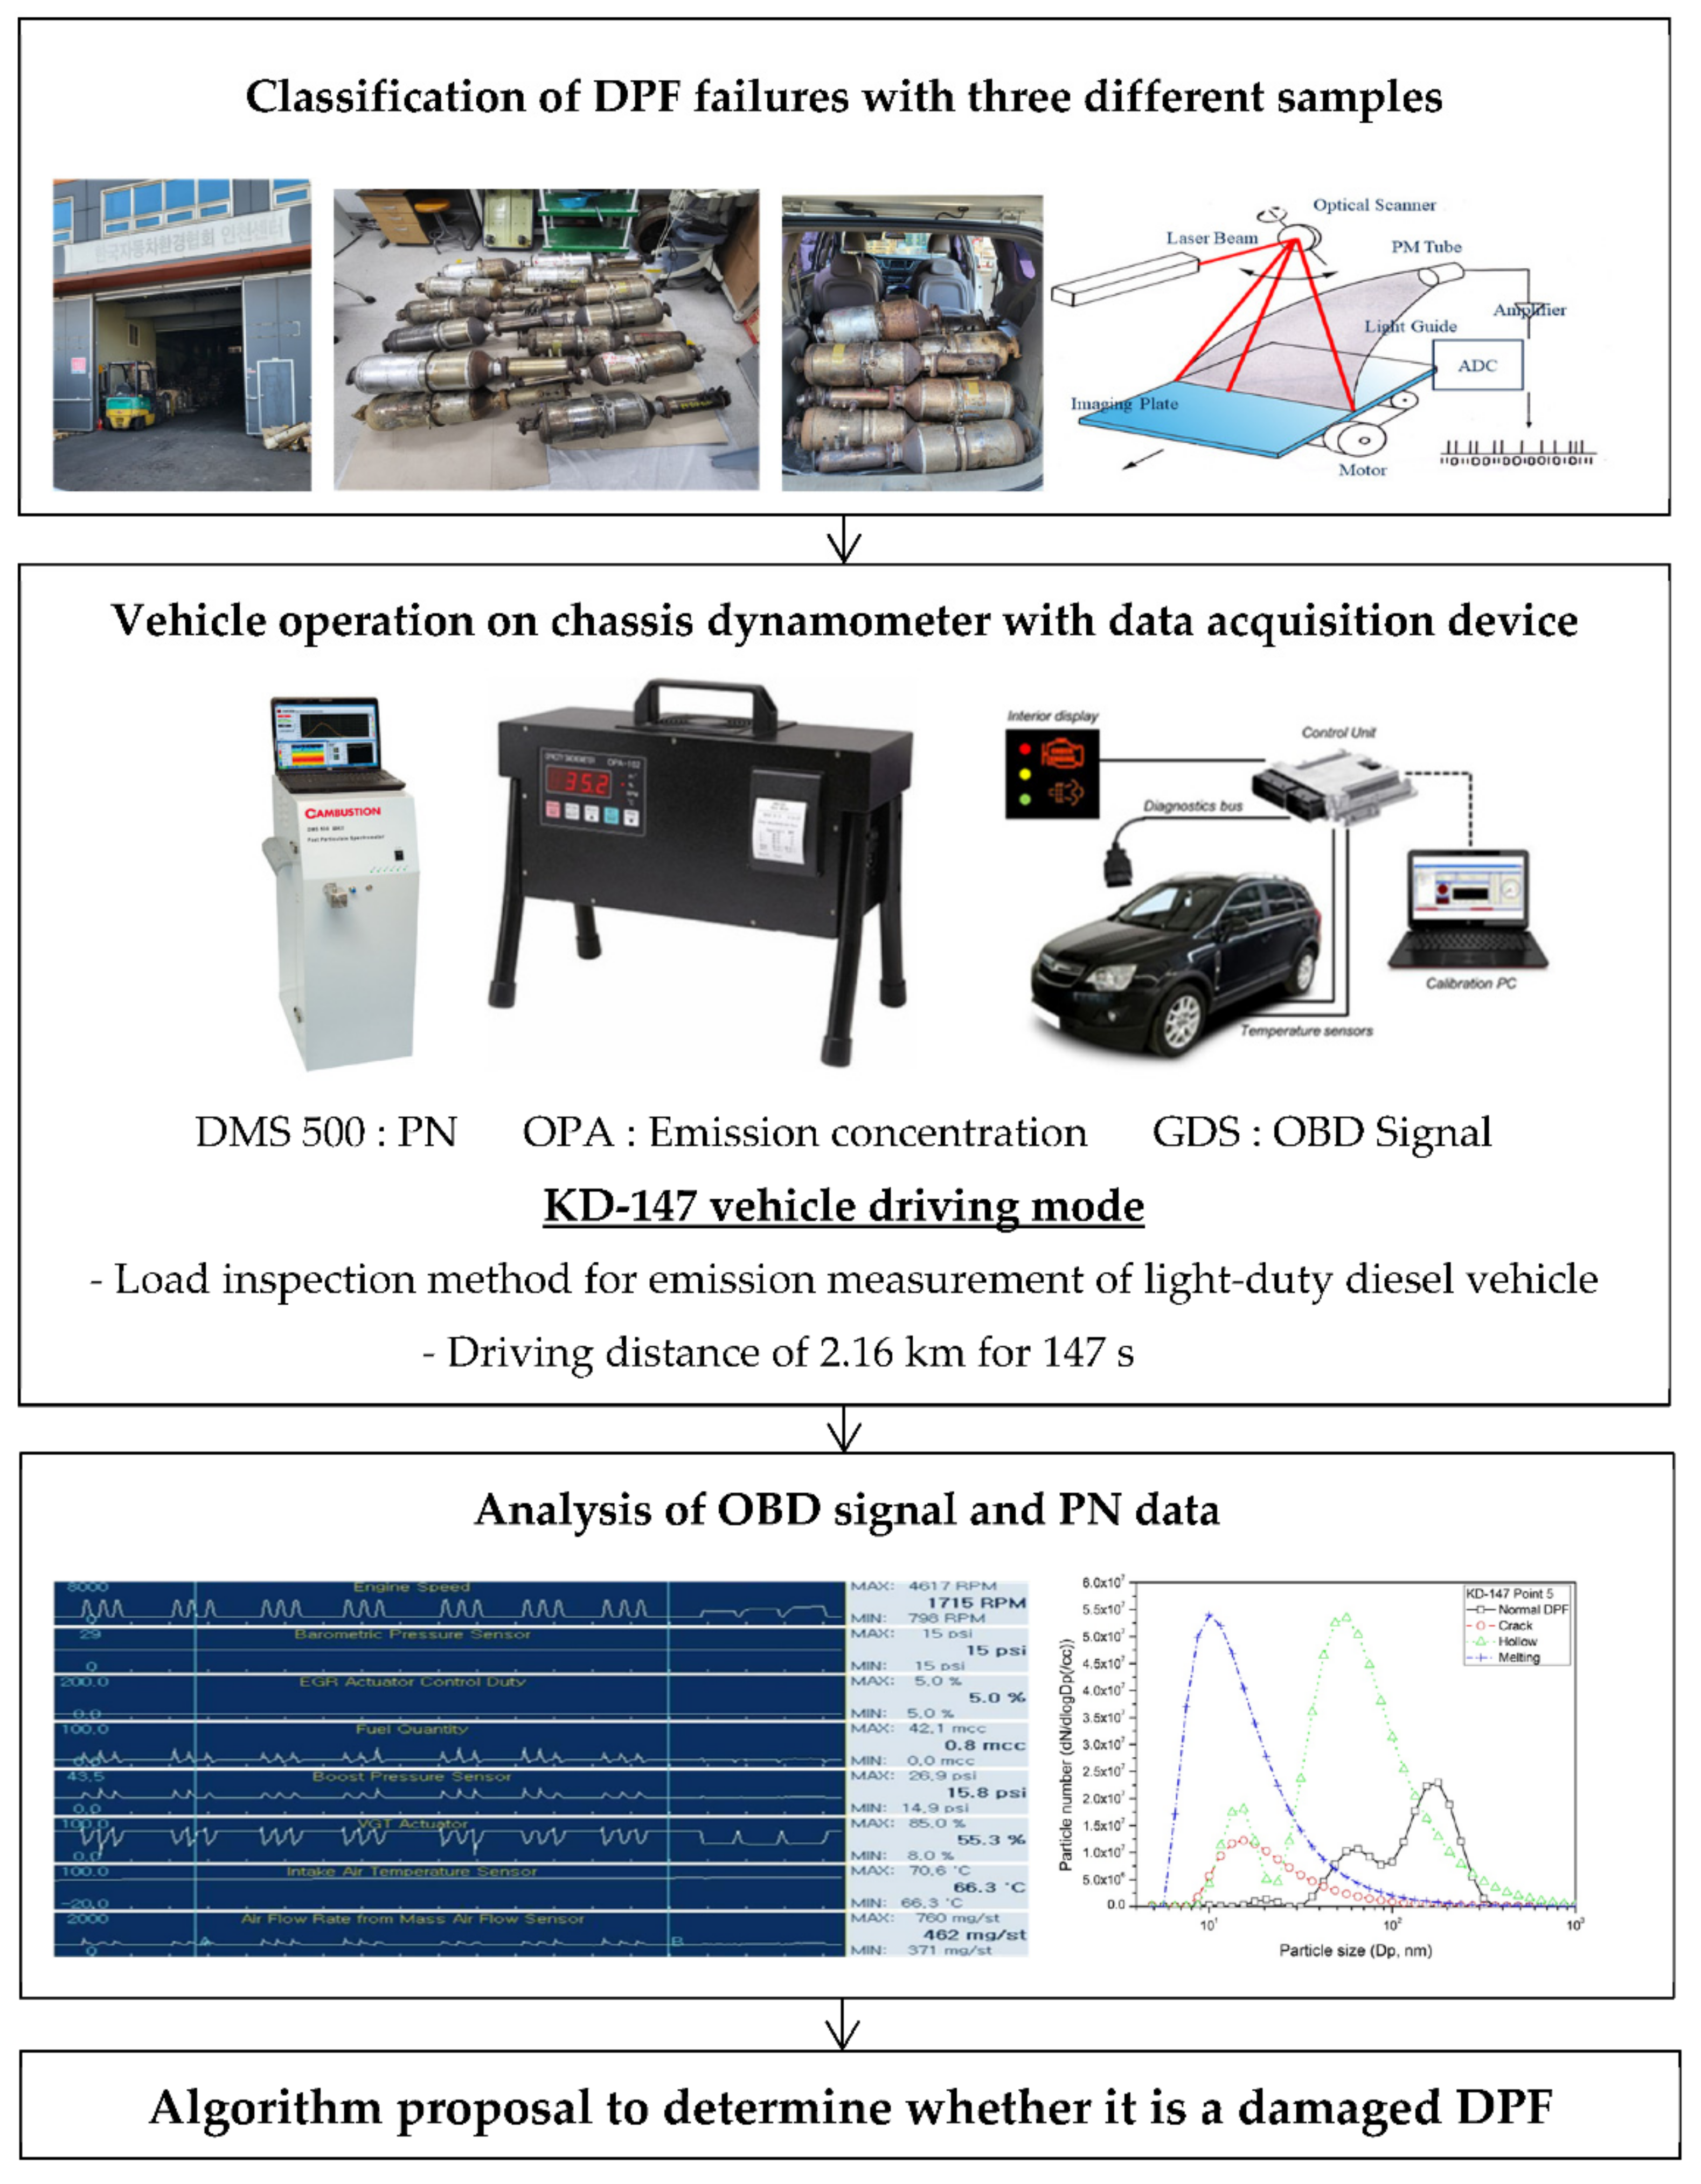
  • Classification of DPF failures with three samples
In Korea, a state subsidy is provided when a DPF device is installed in an old diesel vehicle. Subsequently, when the vehicle is scrapped or the installed DPF device becomes obsolete, the supported DPF device is returned to the government, and the government manages it systematically. Therefore, in this study, DPF devices based on various types of damage were first selected using X-ray photoelectron devices for DPF devices that were old or damaged and retained in the country.
2.
Vehicle operation on chassis dynamometer
Three DPF samples with different types of damage were installed in the test vehicle. The KD-147 driving cycle was performed on a chassis dynamometer.
3.
Analysis of OBD signal and PN data
The OBD signal and PN data were measured from a test vehicle equipped with a damaged DPF device. The OBD data and PN emission characteristics of the DPF damage types were compared and analyzed.
4.
Recommendation of algorithm to detect the type of damaged DPF
Through these research divisions, the study was aimed at investigating the OBD signal and PN emission characteristics of various types of DPF-damage, and at presenting an algorithm for determining various types of DPF damage from vehicle OBD signals. This was because the OBD-based algorithm can rapidly determine whether a DPF is damaged, before precise identification by X-ray devices.

2. Experimental Apparatus and Procedure

2.1. Experimental Setup

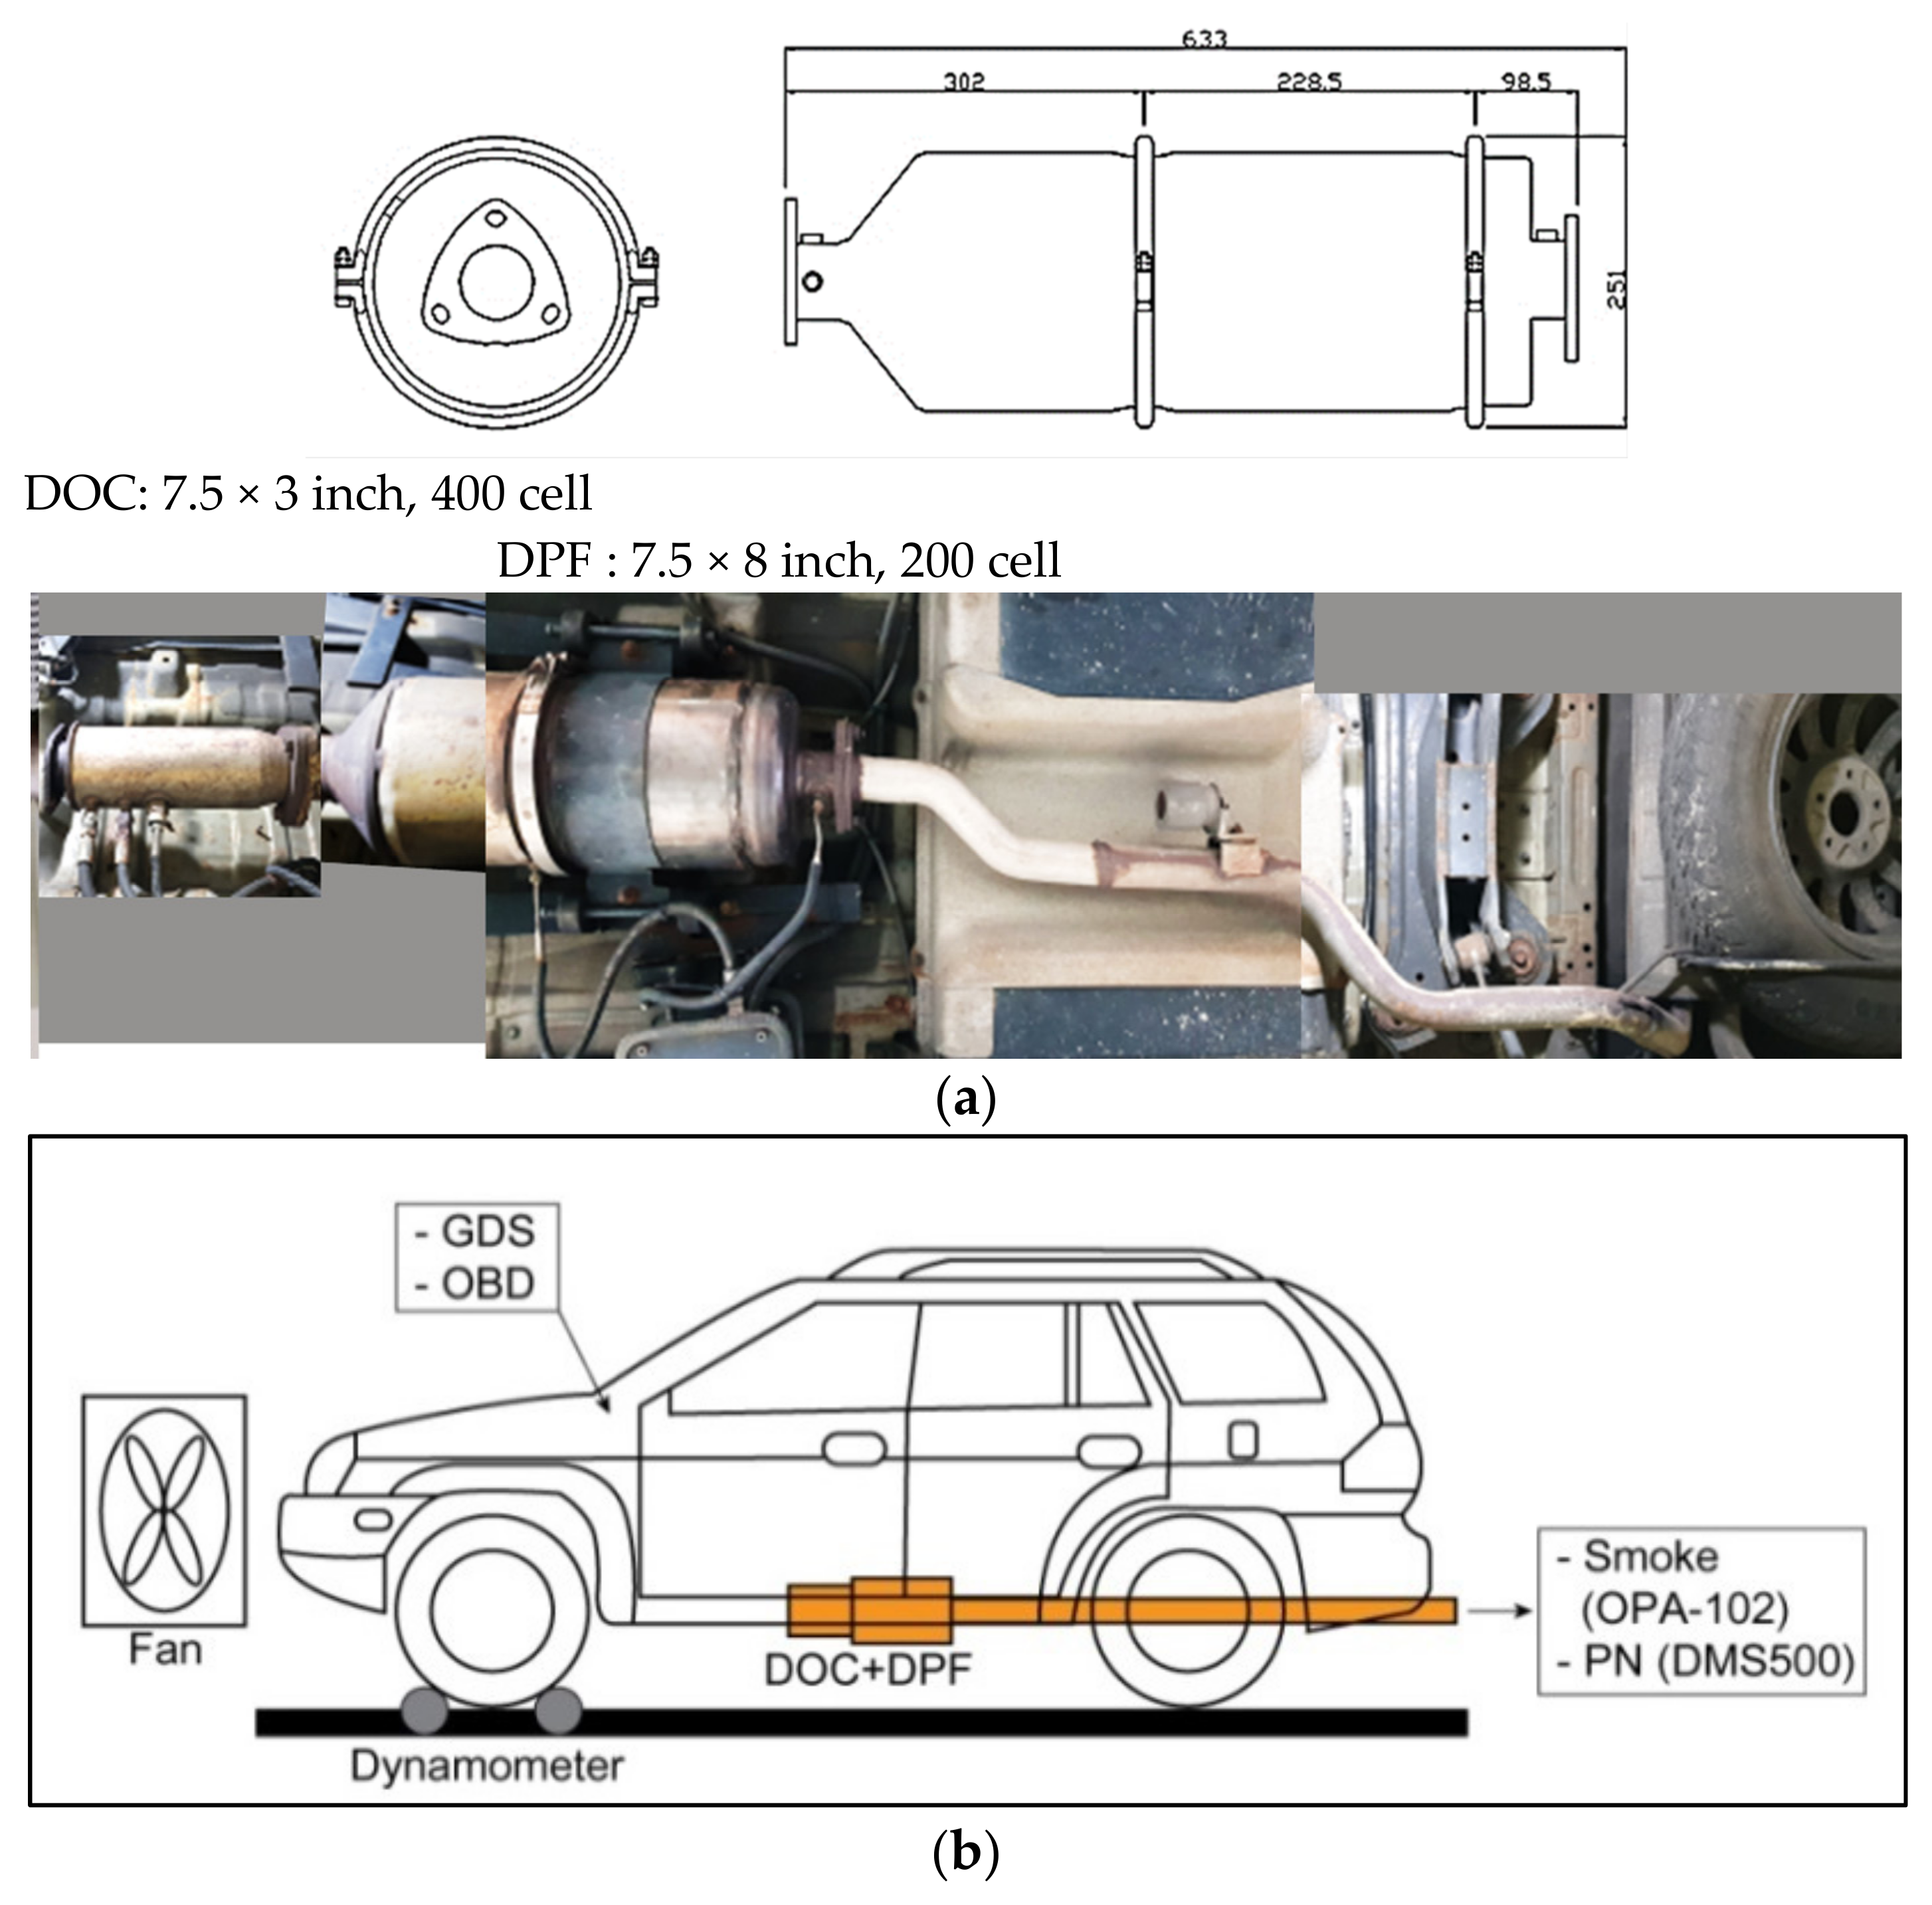
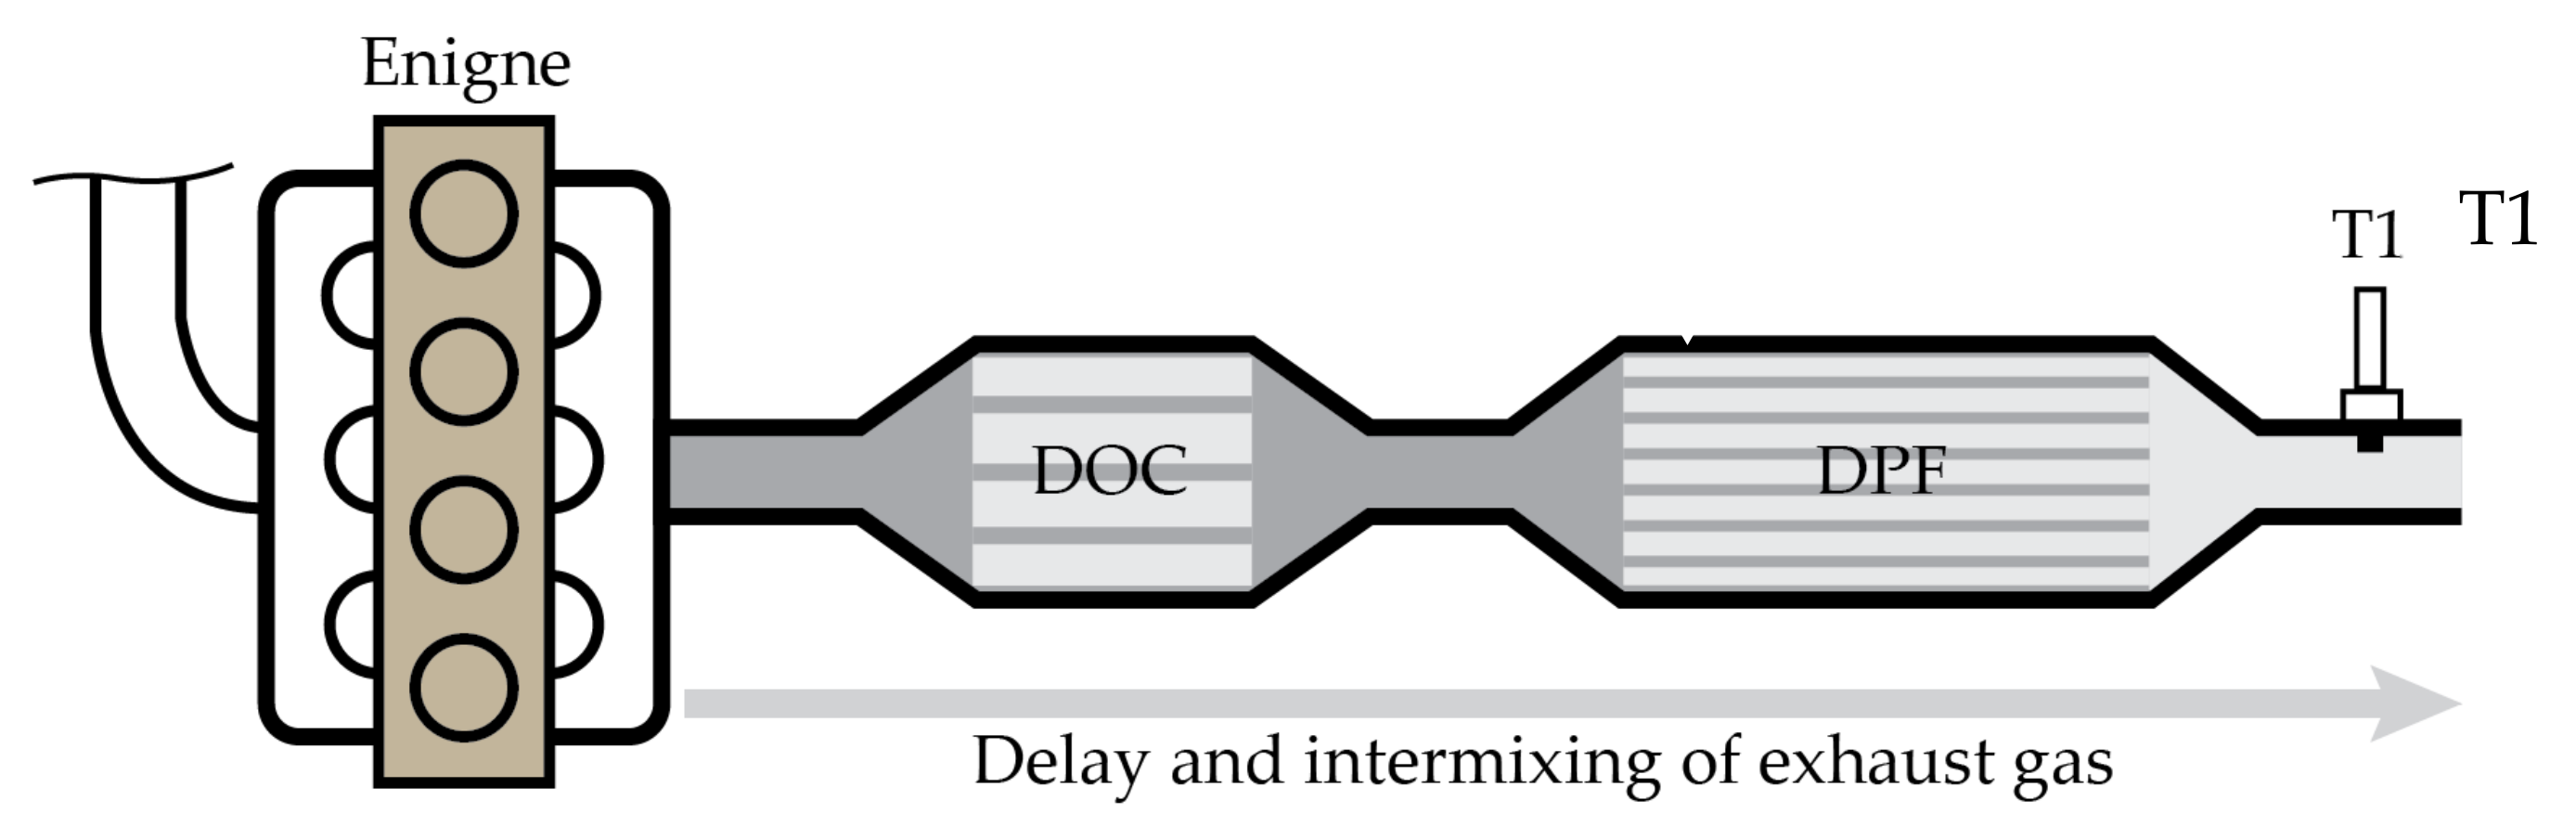
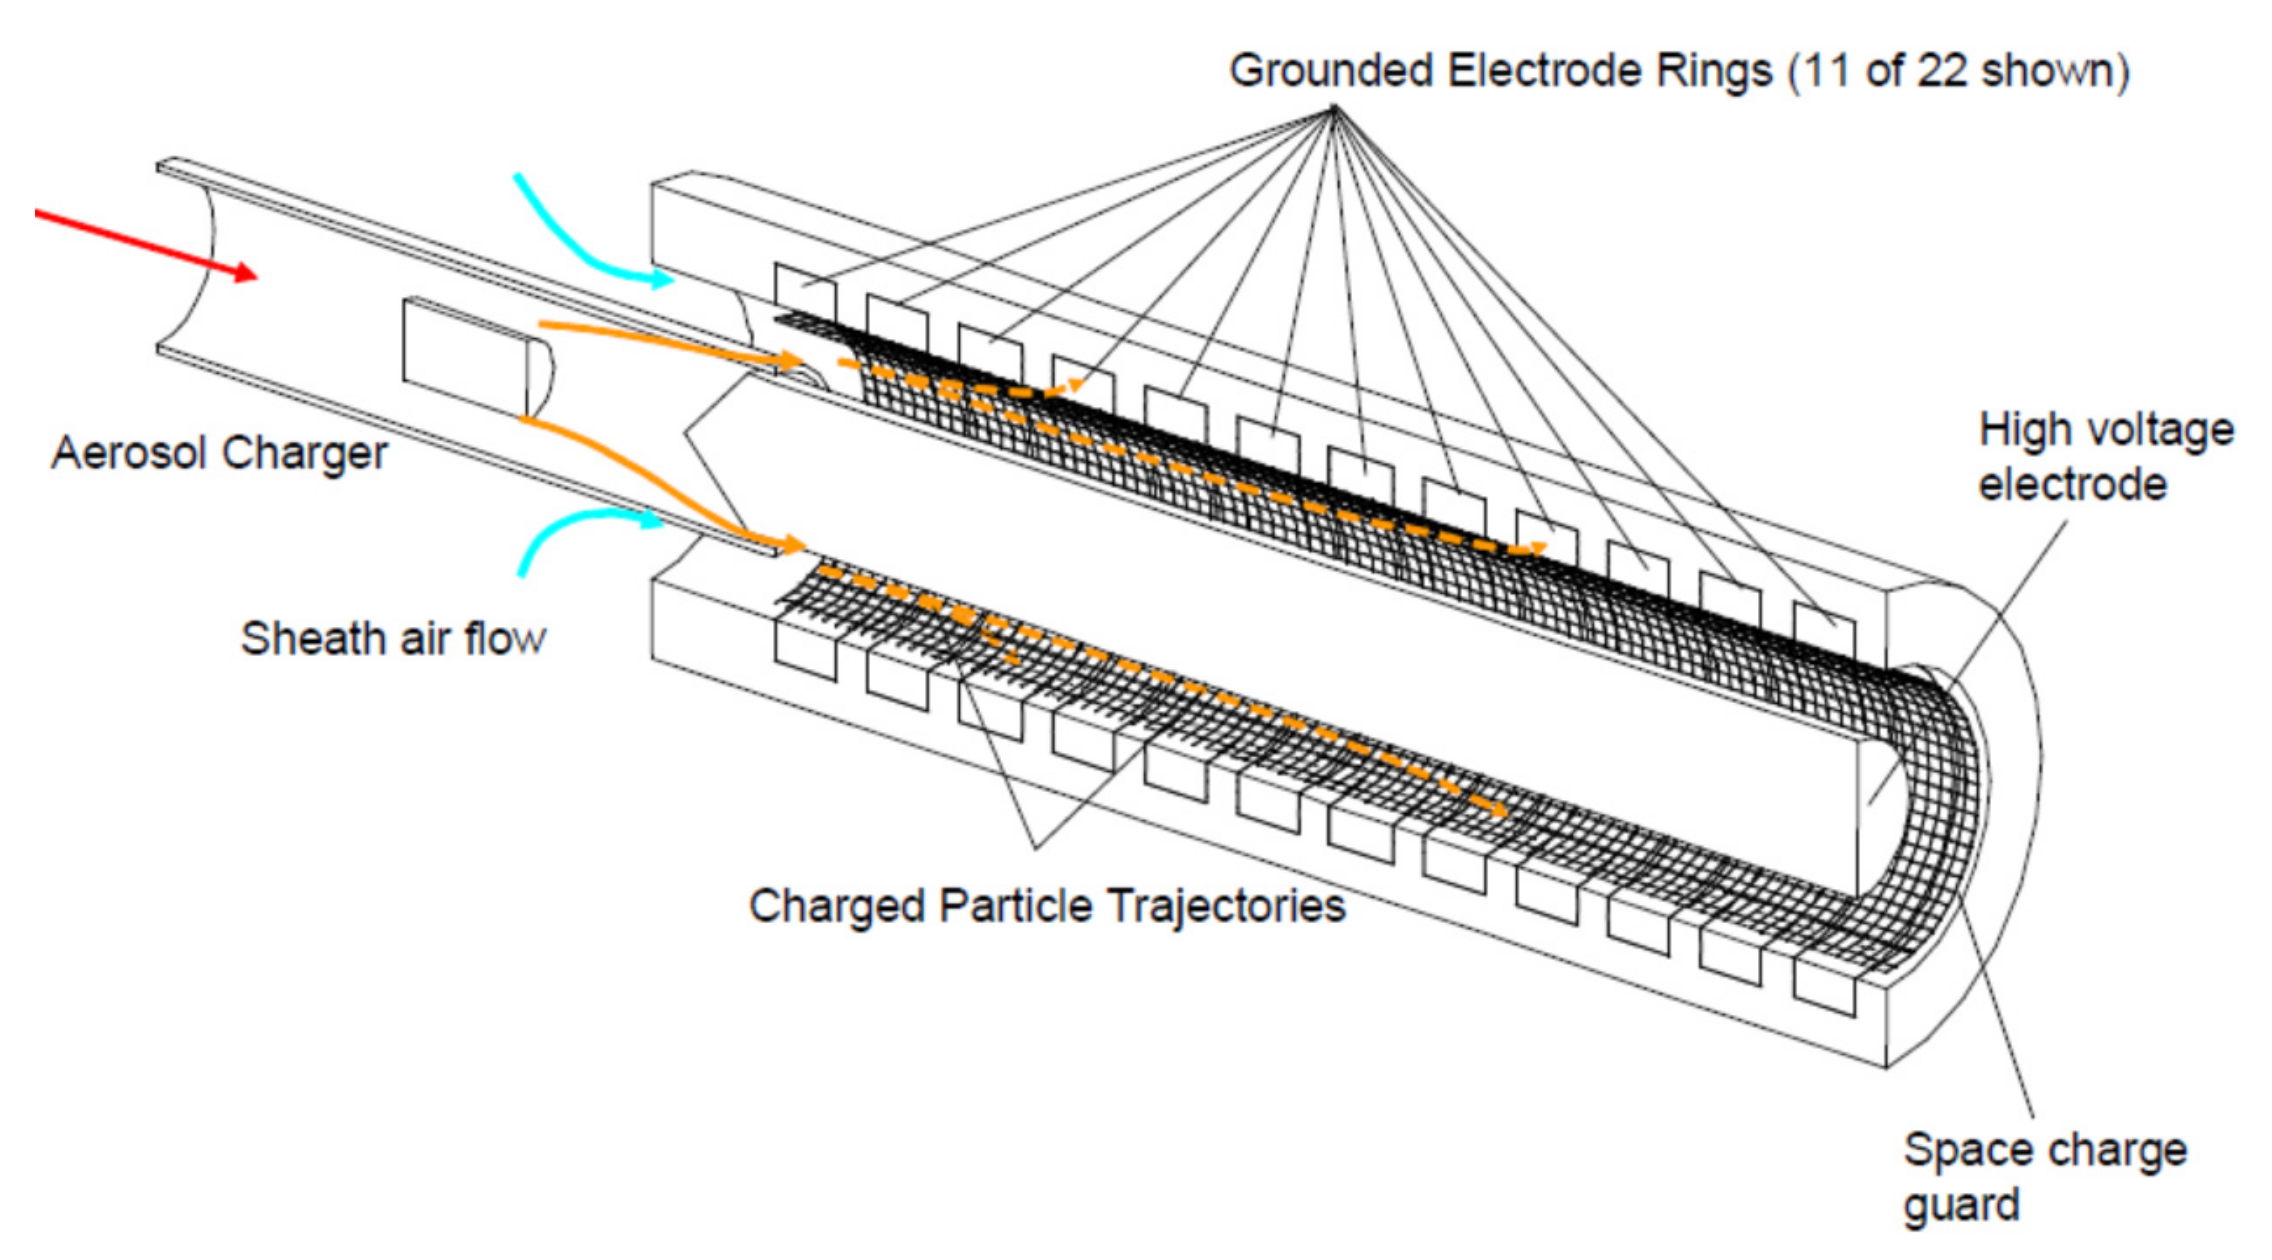
2.1.1. After-Treatment System

The vehicle used in this study was functionally normal. Furthermore, maintenance was completed in advance to ensure its suitability for analyzing the effects of DPF installation on different types of damage. A vehicle experiment was conducted with a front-wheel-drive mid-size 2.0 L diesel-fueled SUV having a monocoque body type (2011 Santa Fe (the best-selling SUV), Hyundai Motor Company, Ulsan, Korea). It is equipped with a retrofit DPF (Econix Inc., Paju, Korea), which has a matrix of compounds coating the passages (such as cordierite), and an active-regeneration system for cleaning and emptying a DPF (see Figure 2). Considering the operating characteristics of the vehicle, it is important to permit the DPF to be regenerated normally. A DOC was used as an auxiliary catalyst in the DPF post-treatment system. The main functionality of the DOC in the emission system is the generation of NO2 to support the DPF operation. In this study, a DOC ceramic monolith substrate (7.5 (diameter) × 3 (length) in, 400 cells per in2) and cordierite wall-flow type DPF (7.5 (diameter) × 8 (length) in, 200 cells per in2) were used for the vehicle experiment. These devices were installed on a diesel SUV with a 2.0 L CRDi engine. The specifications of the diesel engine used in this study are listed in Table 1.
As explained above, NO emissions are oxidized to NO2 on the front DOC and react with the trapped PM on the DPF. The DPF has the shape of a catalytic converter and is located at the rear end of the DOC (see Figure 3). A frame-by-frame reaction of NO2 with trapped PM is likely. The DPF generates a marginal back pressure during the operation. Thereby, the OBD device of the vehicle is effective for DPF diagnosis to monitor its functionality.

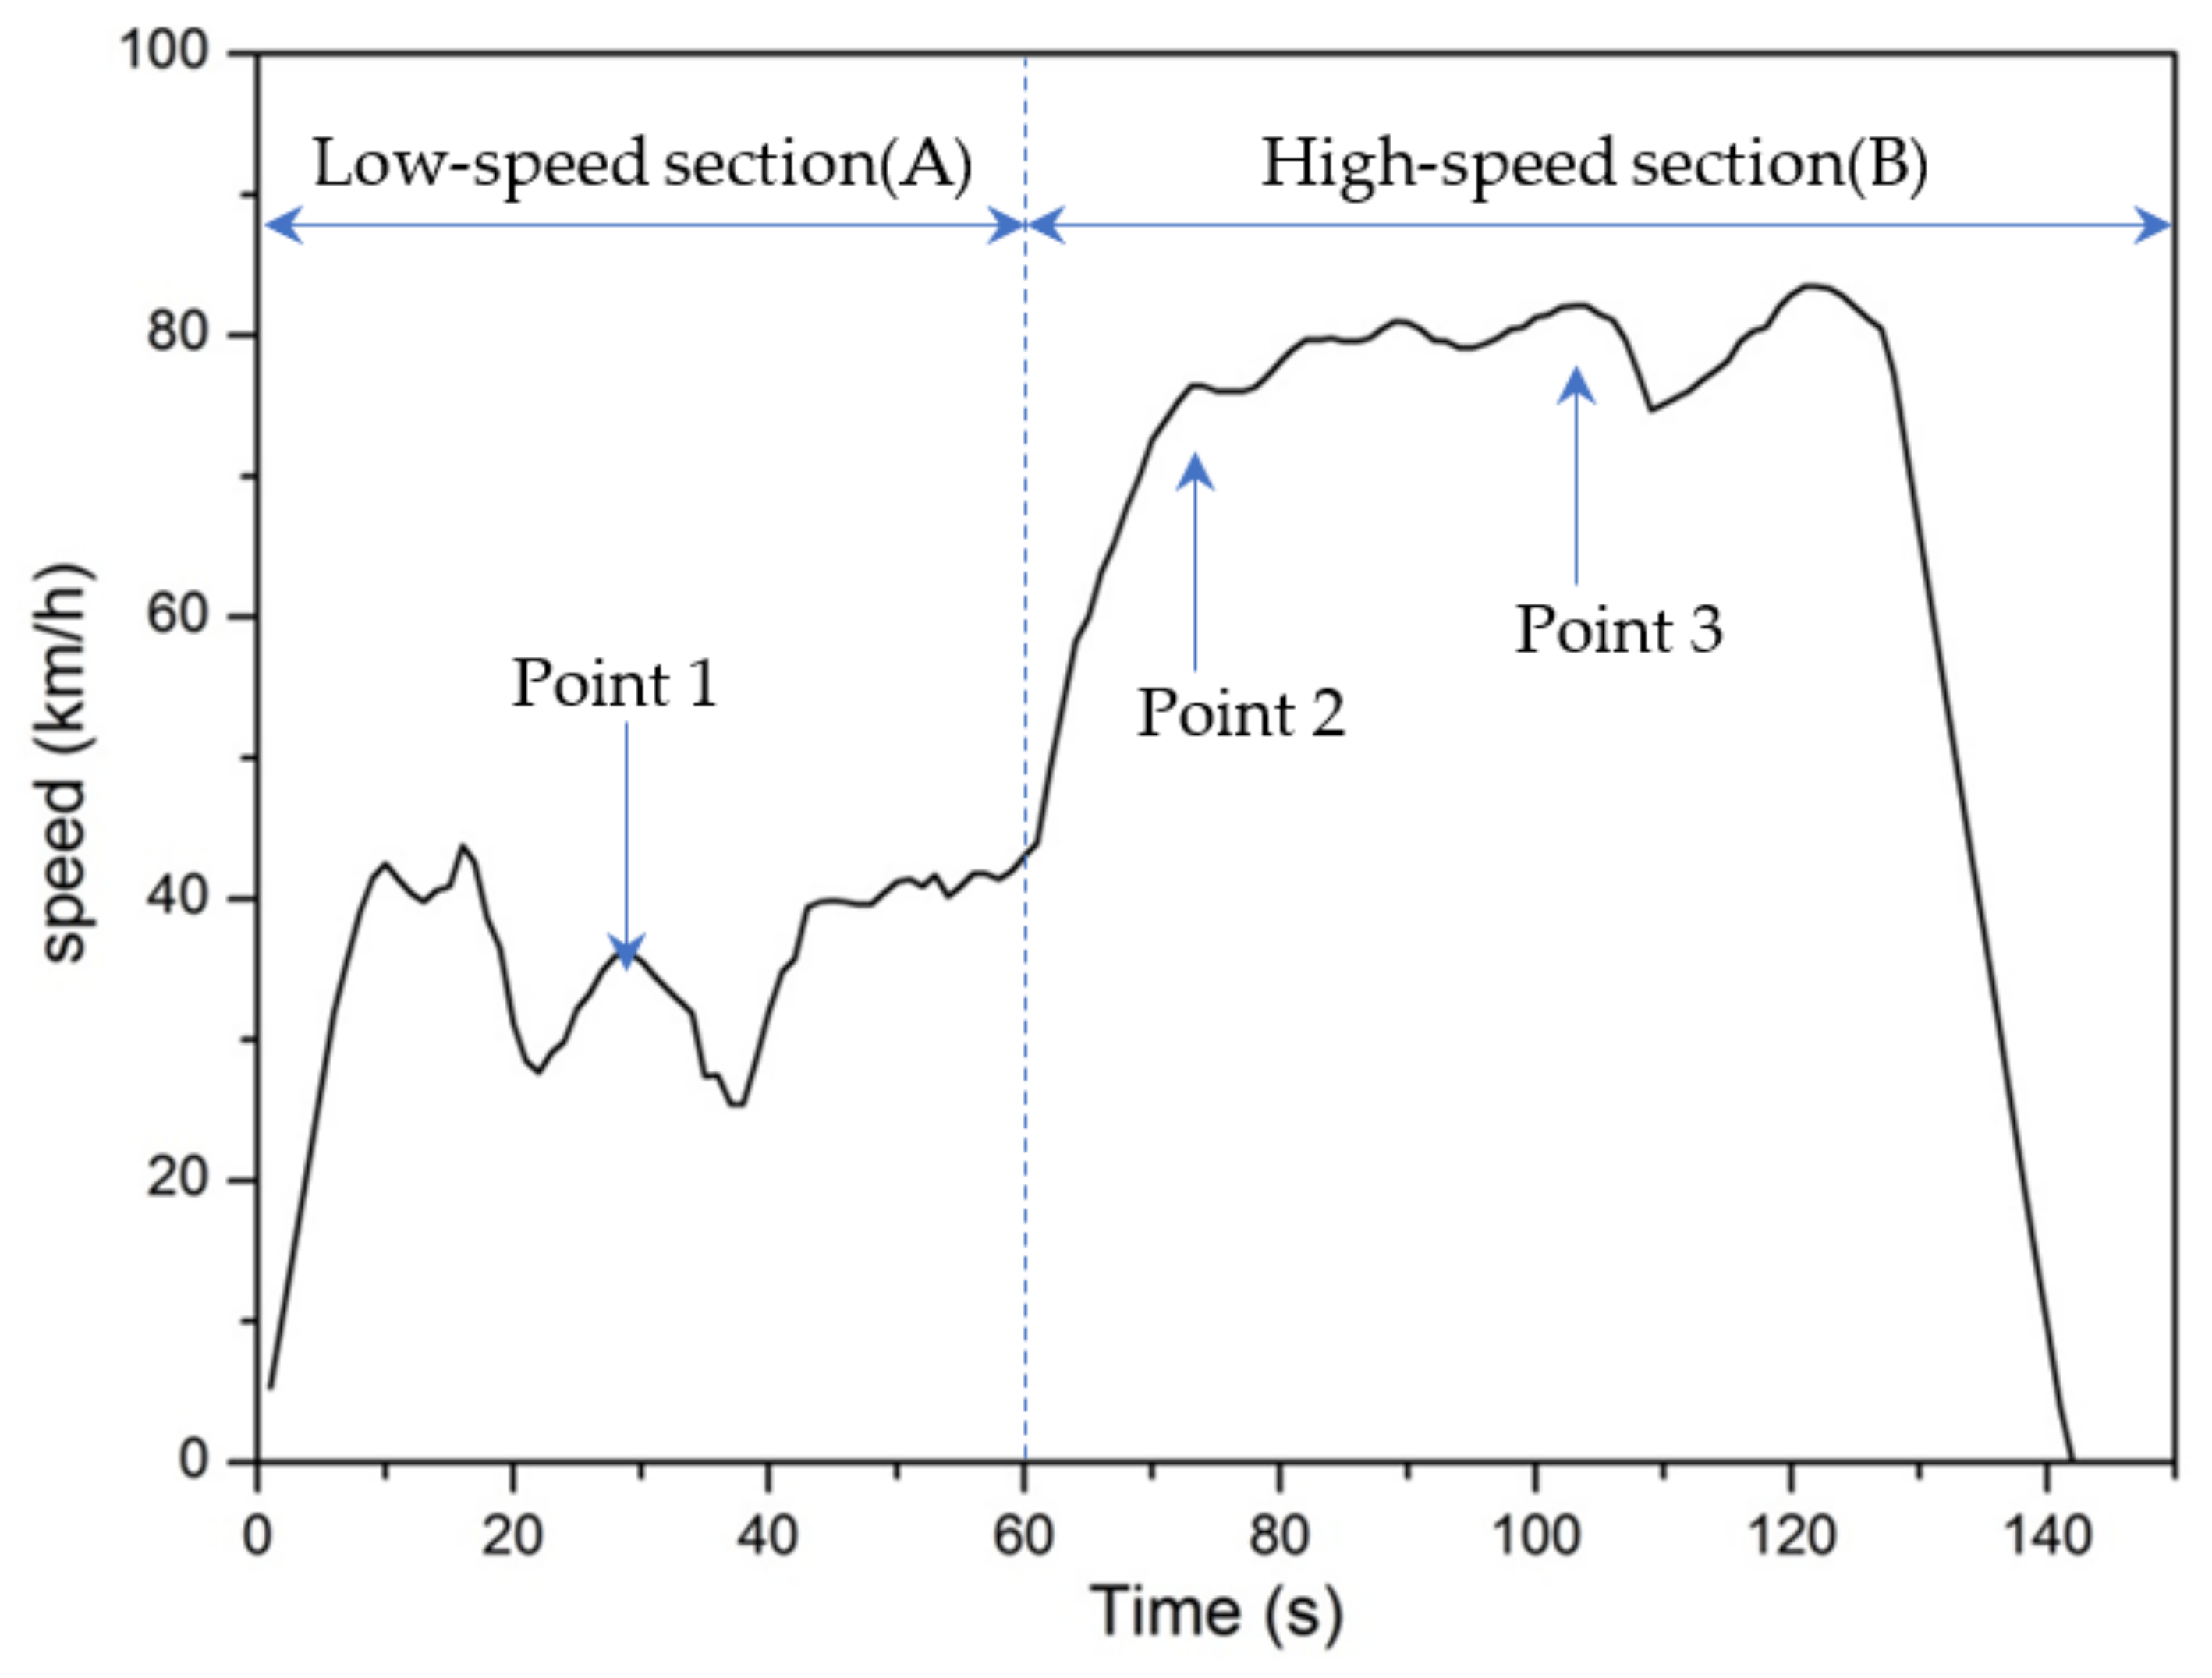
2.1.2. Vehicle Driving Cycle (KD-147 Mode)

The SUV driving cycle was conducted in the KD-147 mode (see Figure 4). The inspection of the exhaust emission of light-duty diesel vehicles can be largely divided into no-load rapid acceleration method and load inspection method. The no-load rapid acceleration measurement method has a problem: the measured value of the PM fluctuates significantly depending on the speed at which the driver presses the accelerator pedal. Because the actual driving conditions of a diesel vehicle are always loaded, the measurement of PM with no-load rapid acceleration does not reflect the actual driving conditions of the vehicle. Owing to these problems, a method for measuring PM under conditions in which a load is applied to a vehicle has been introduced gradually in Korea. The PM measurement method using the KD-147 mode is a representative load-inspection method. In the KD-147 driving mode, it selects an appropriate gearbox from 0 km/h (idle) to a maximum speed of 83.5 km/h for 147 s according to the prescribed vehicle speed. In addition, it performs rapid acceleration, acceleration, constant speed travel, deceleration, and rapid deceleration. Furthermore, it records the vehicle speed, engine speed, exhaust gas emission, etc. The tolerance of the vehicle driving speed control is within ±3.2 km/h from the specified speed, and the vehicle speed should attain the specified speed within 1 s. During the entire measurement period of 147 s, a large amount of exhaust gases is emitted in section A (wherein the vehicle accelerates from standstill) and section B (wherein the vehicle speed increases from 40 km/h to 80 km/h), as corresponding between point 3 and point 4 in Figure 4.

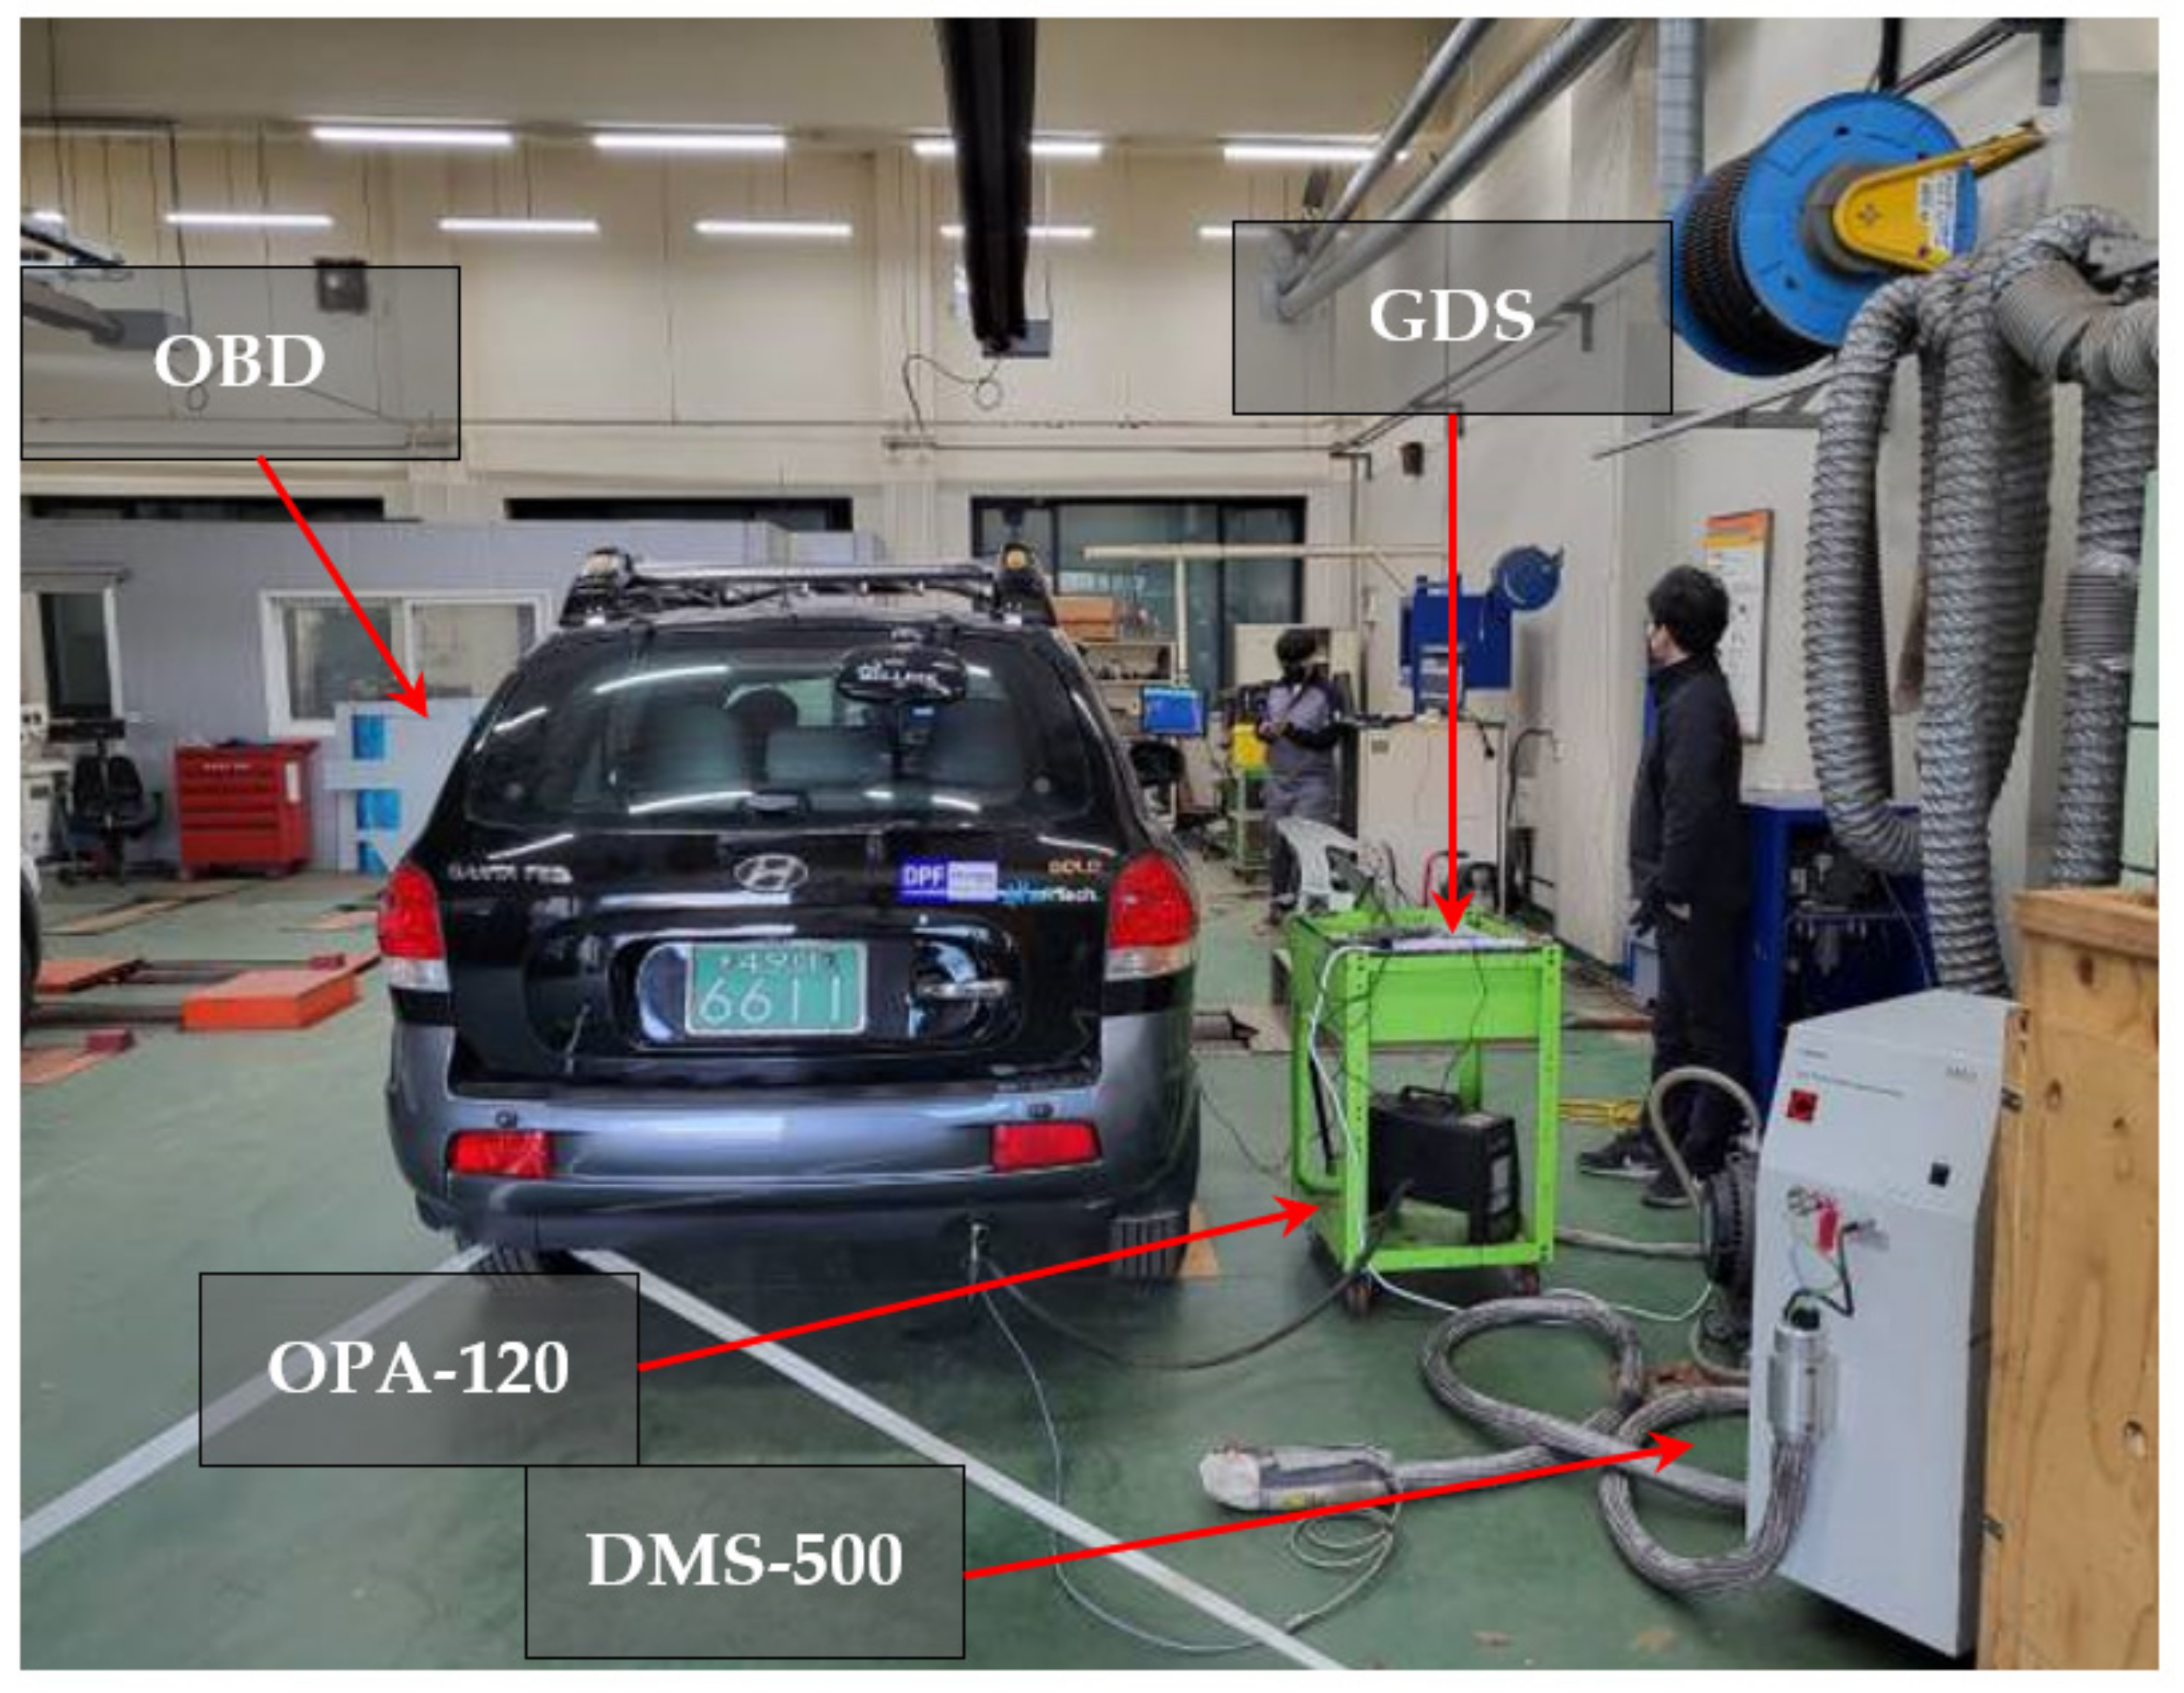
2.1.3. Vehicle Emission and OBD Data Acquisition Devices on Chassis Dynamometer

Figure 5 shows the chassis dynamometer (eddy-current dynamometer, Jastec, Sungnam, Korea) and diesel-fueled SUV (2011 Santa Fe, Hyundai Motors, Seoul, Korea) used in the vehicle-driving experiment. It also shows the site of the dynamo experiment where the KD-147 mode driving was performed. During the vehicle driving in the KD-147 mode, an opacity smoke-meter (OPA-102, KSRnD, Bucheon, Korea) and a PN measuring instrument (DMS-500, Cambustion, Cambridge, UK) were used to measure the particulate emission. An OBD-II monitoring system (GDS, Hyundai Motors, Ulsan, Korea) was used to measure the signals from the engine and DPF. Table 2 and Table 3 show the specifications of the instruments for measuring emission (OPA-102 and DMS-500, respectively).
Figure 6 is a schematic diagram of the classifier column and charger inside the differential mobility spectrometer system DMS500. This system combines the classification of the electrical mobility of particles with sensitive electrometer detectors. This enables the generation of particle sizes (5–1000 nm) and number distributions in real time. The measurement principle of the DMS system is based on the differences in mobility of particles with different sizes/charges and subjected to electrostatic and flow resistive forces (see Figure 6). DMS500 has an integrated two-stage dilution system, wide dynamic range, and heated sample line. It is suitable for a variety of DPF applications, including the detection of faulty filters.

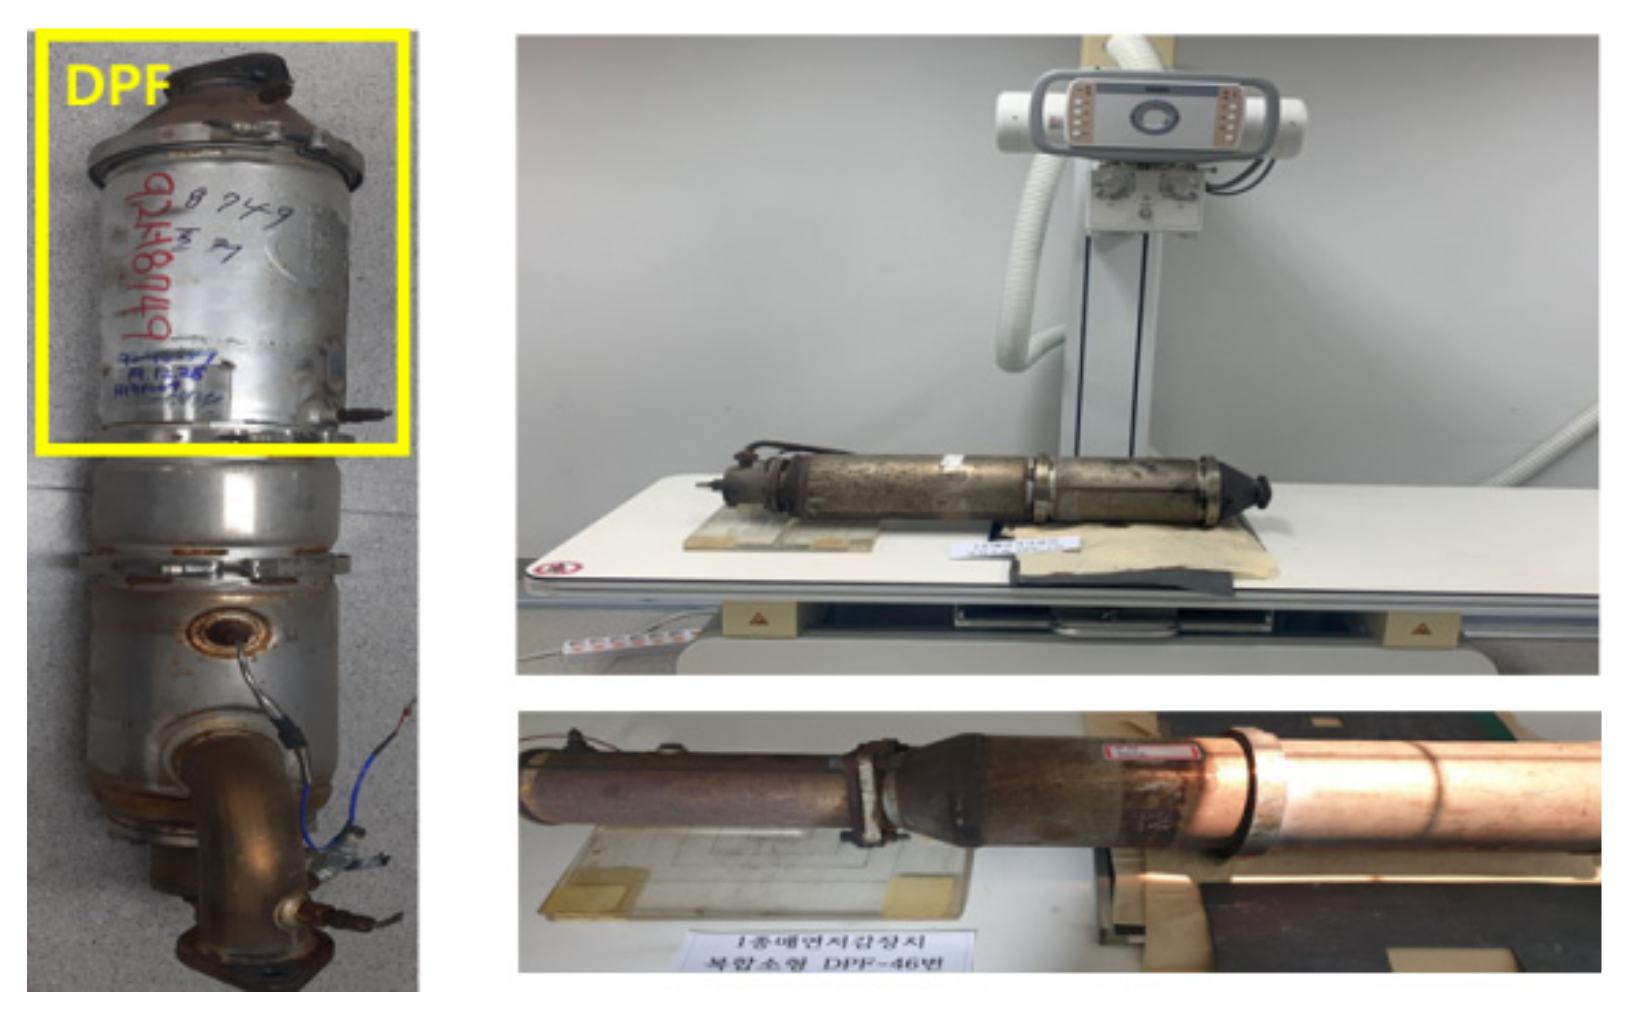
2.2. Three DPF Samples with Different Types of Damage (Crack, Melting and Hollow)

The aging DPFs were secured with the support of the Korea Automobile Environmental Association (KAEA). Then, imaging was performed using an X-ray radiograph generator (REX-650RF/IRF-600-150, 70 kV–125 kV, LISTEM Co., Wonju, Korea) to photograph and analyze various types of DPF damage. Figure 7 shows a photograph of the interior of the DPF obtained using an X-ray generator. After adjusting the distance between the X-ray generator and IP to 100 cm, the filter part of the DPF was placed in the center of the IP. The image was captured while varying the tube voltage and tube current of the X-ray. This study could obtain an appropriate photographic image using a tube voltage of 125 kV.
Table 4 lists the three types of DPF damage observed in the X-ray images. Vehicle-driving experiments were performed by installing a damaged DPF device. In this study, the failure types in cordierite DPF substrates were classified into the following: cracks in the material inside the DPF, melting, and hollow fractures.

2.3. Experimental Condition

In the vehicle operation, the KD-147 driving cycle was performed four times on the chassis dynamometer after installation in the test vehicle, for each damaged DPFs (crack, melting, and hollow) and the normal DPF. In these experiments, the OBD signals were monitored continuously by the vehicle global diagnosis tool (GDS). It was connected to the vehicle communication interface (VCI) and vehicle measurement interface (VMI). The VCI was connected to an OBD-II terminal in the vehicle, and the signal data were sent to a PC via wireless transmission while conducting the test. With GDS, it is feasible to monitor only one control system at a time. Therefore, a CAN analyzer was adapted to the GDS to log the data and to provide access to another system simultaneously while testing. These experimental conditions are listed in Table 5.

3. Experimental Results and Discussions

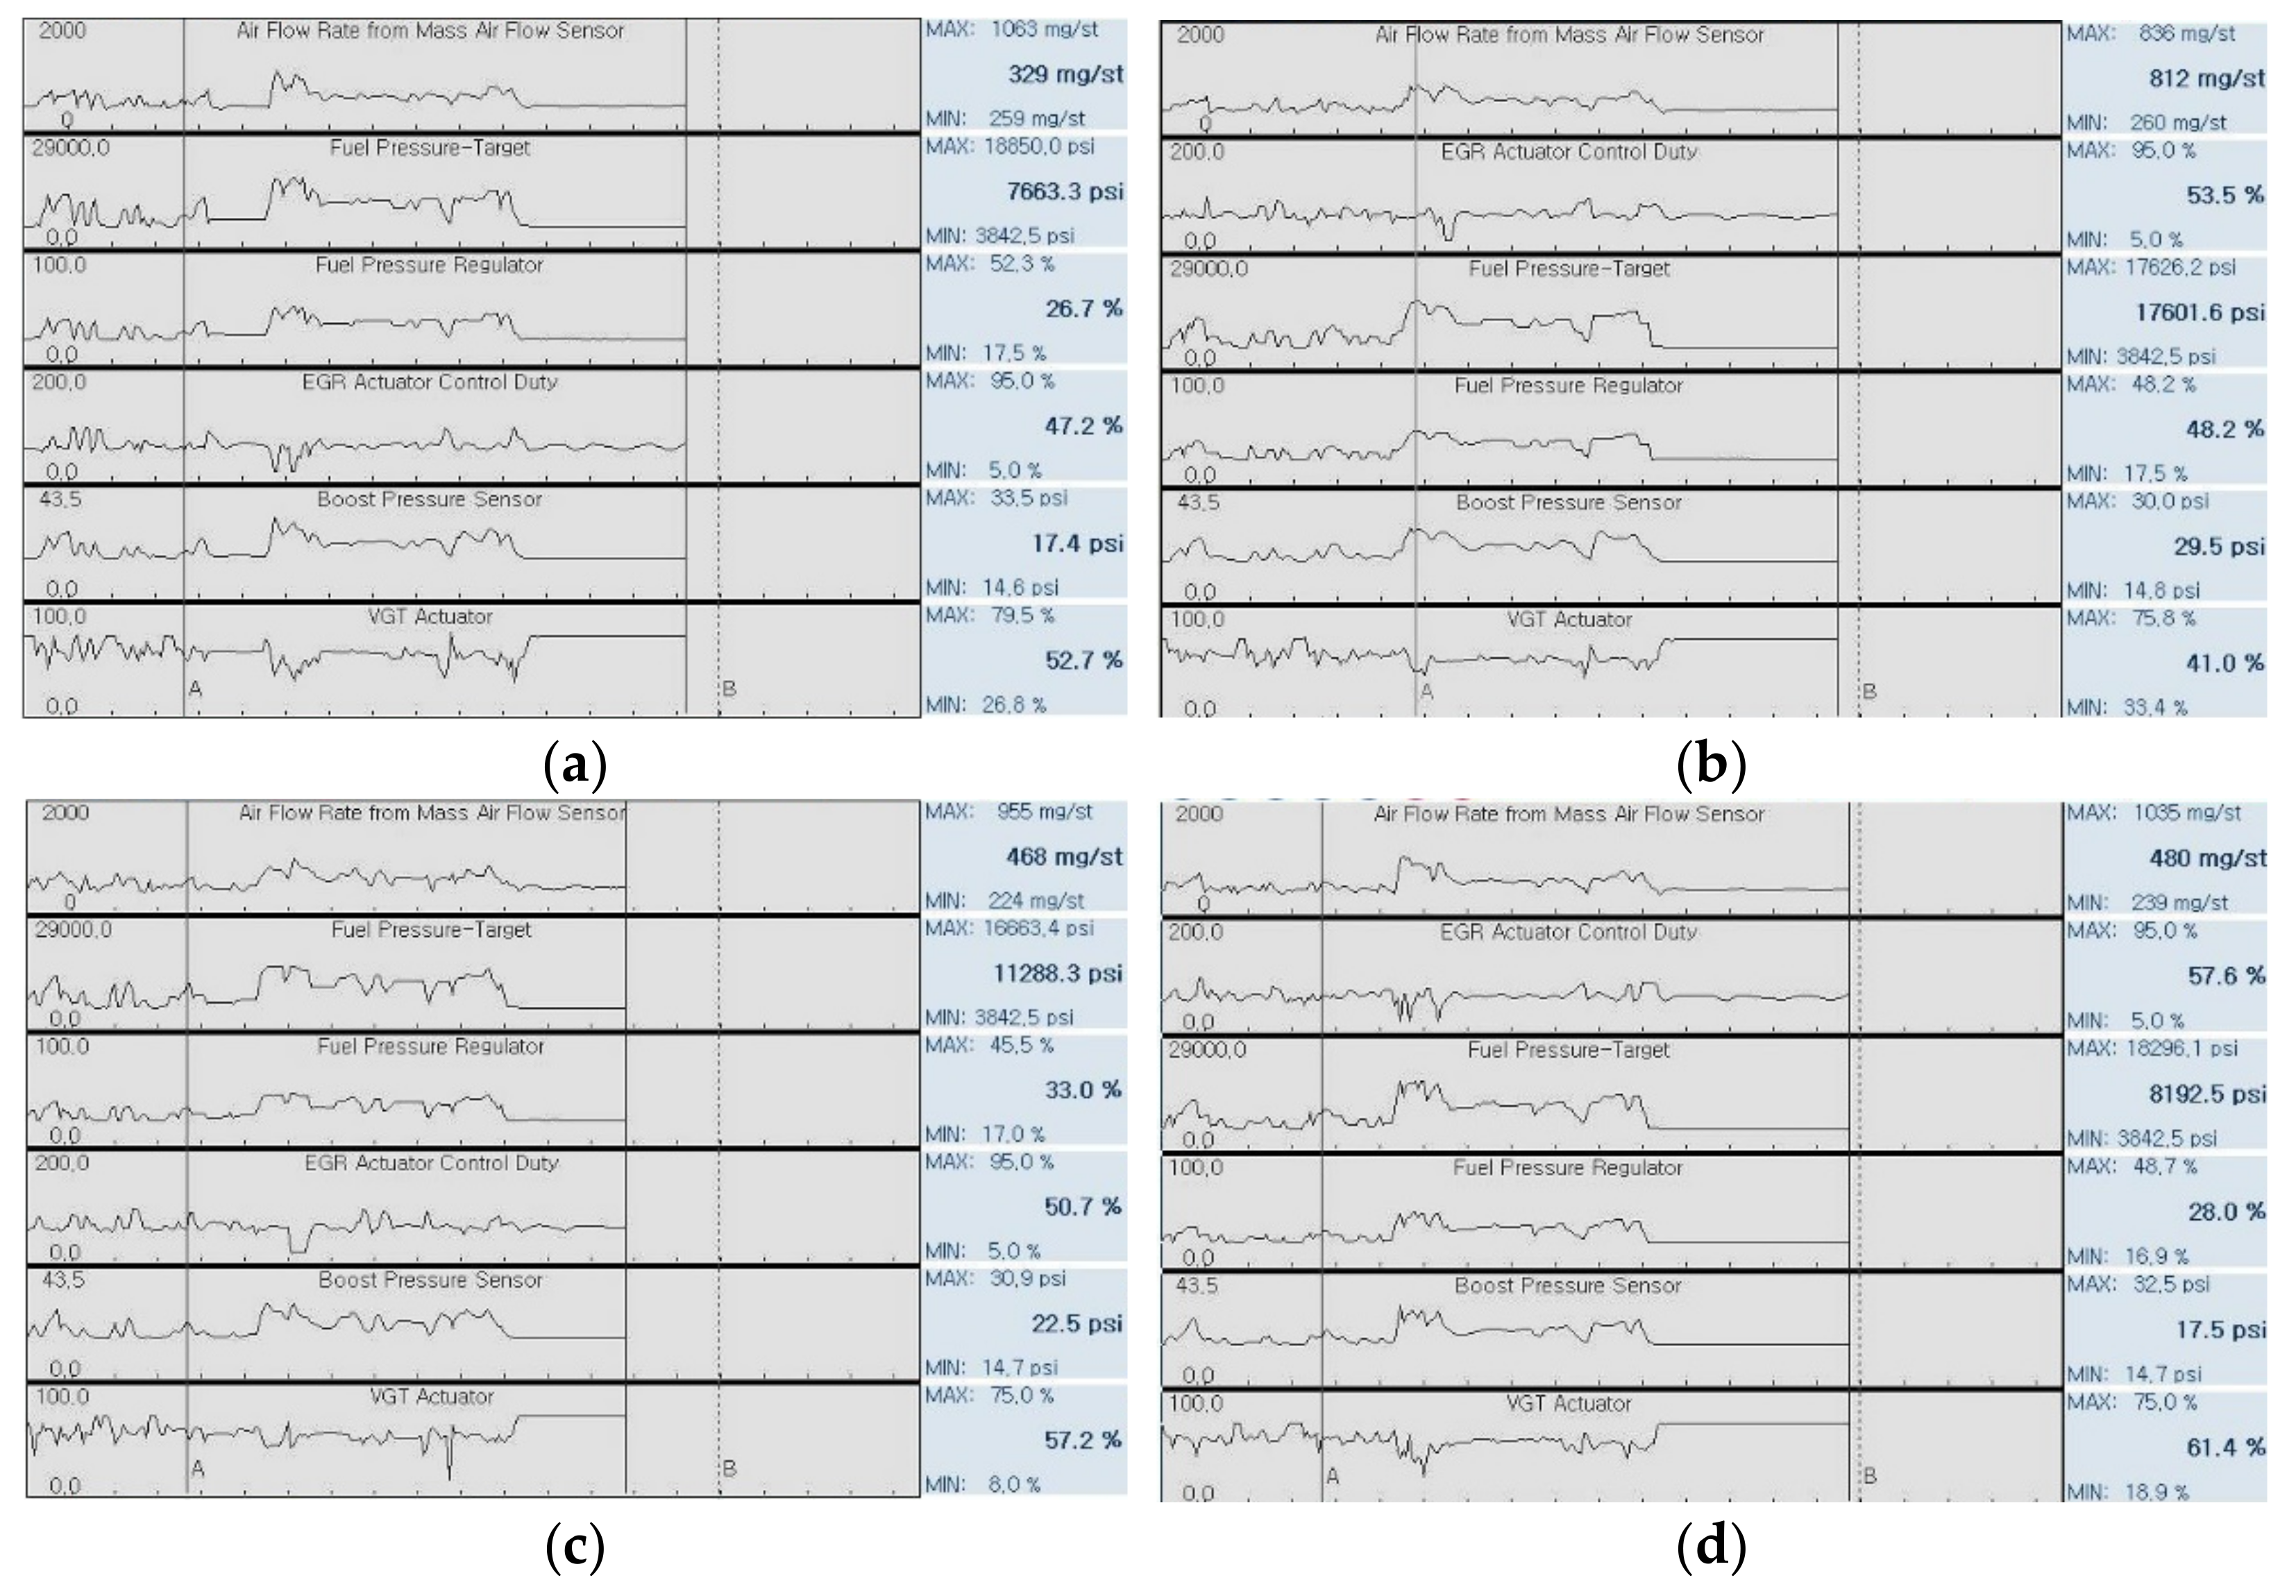
3.1. OBD Signal Comparison

Figure 8 shows the vehicle’s OBD signal obtained by GDS in the KD-147 driving cycle for the four types of DPF samples used in this study. For these four types, the following were the comparable signals measured by the GDS diagnostic on the SUV: air-flow mass rate, EGR actuator (duty ratio), fuel pressure, boost pressure, and VGT actuator (duty ratio). In addition, in this study, the characteristics of each DPF failure were compared and analyzed using the data stored in the GDS for the maximum and minimum values of these signals.
Table 6 shows the maximum and minimum values of the four OBD data obtained by the GDS under the KD-147 driving mode with each of the four DPFs installed on the test vehicle. It is observed that the difference in maximum value of OBD data of the four types of DPF was larger than the difference in minimum value. In particular, it is observed that the maximum values of the three parameters (airflow mass, boost pressure, and VGT actuator) related to the amount of air aspirated into the engine cylinder were distinctly different for each of the four DPF types (see Table 7).
Figure 9 shows the variation in the airflow mass signal measured by GDS under the KD-147 driving mode for the four types of DPF samples. A comparison of the maximum values of GDS data of the airflow mass (see Figure 9b) reveals that the maximum airflow mass decreases with the increase in the degree of damage to the DPF filter. Accordingly, it is conjectured that the degree of damage of the crack-damaged DPF sample was significantly more severe than that observed in X-ray images.
Figure 10 shows the variation in the exhaust temperature obtained by the stand-alone OBD unit fitted with a retrofit DPF in a test vehicle. A comparison of the exhaust temperature at the position T1 (which is the rear end of the DPF) reveals that the exhaust temperature gradient of the normal DPF and crack-damaged DPF follows the KD-147 driving pattern. There was no volume damage inside the cordierite DPF substrates. Hence, it is considered that the characteristics of the heat energy accumulation and emission of the inflow exhaust gas were similar. However, in the case of hollow and melting-damaged DPF, the volume inside the cordierite DPF substrates was reduced or the time for the exhaust gas to stay in the DPF substrates was decreased. This revealed a relatively smooth shape pattern.

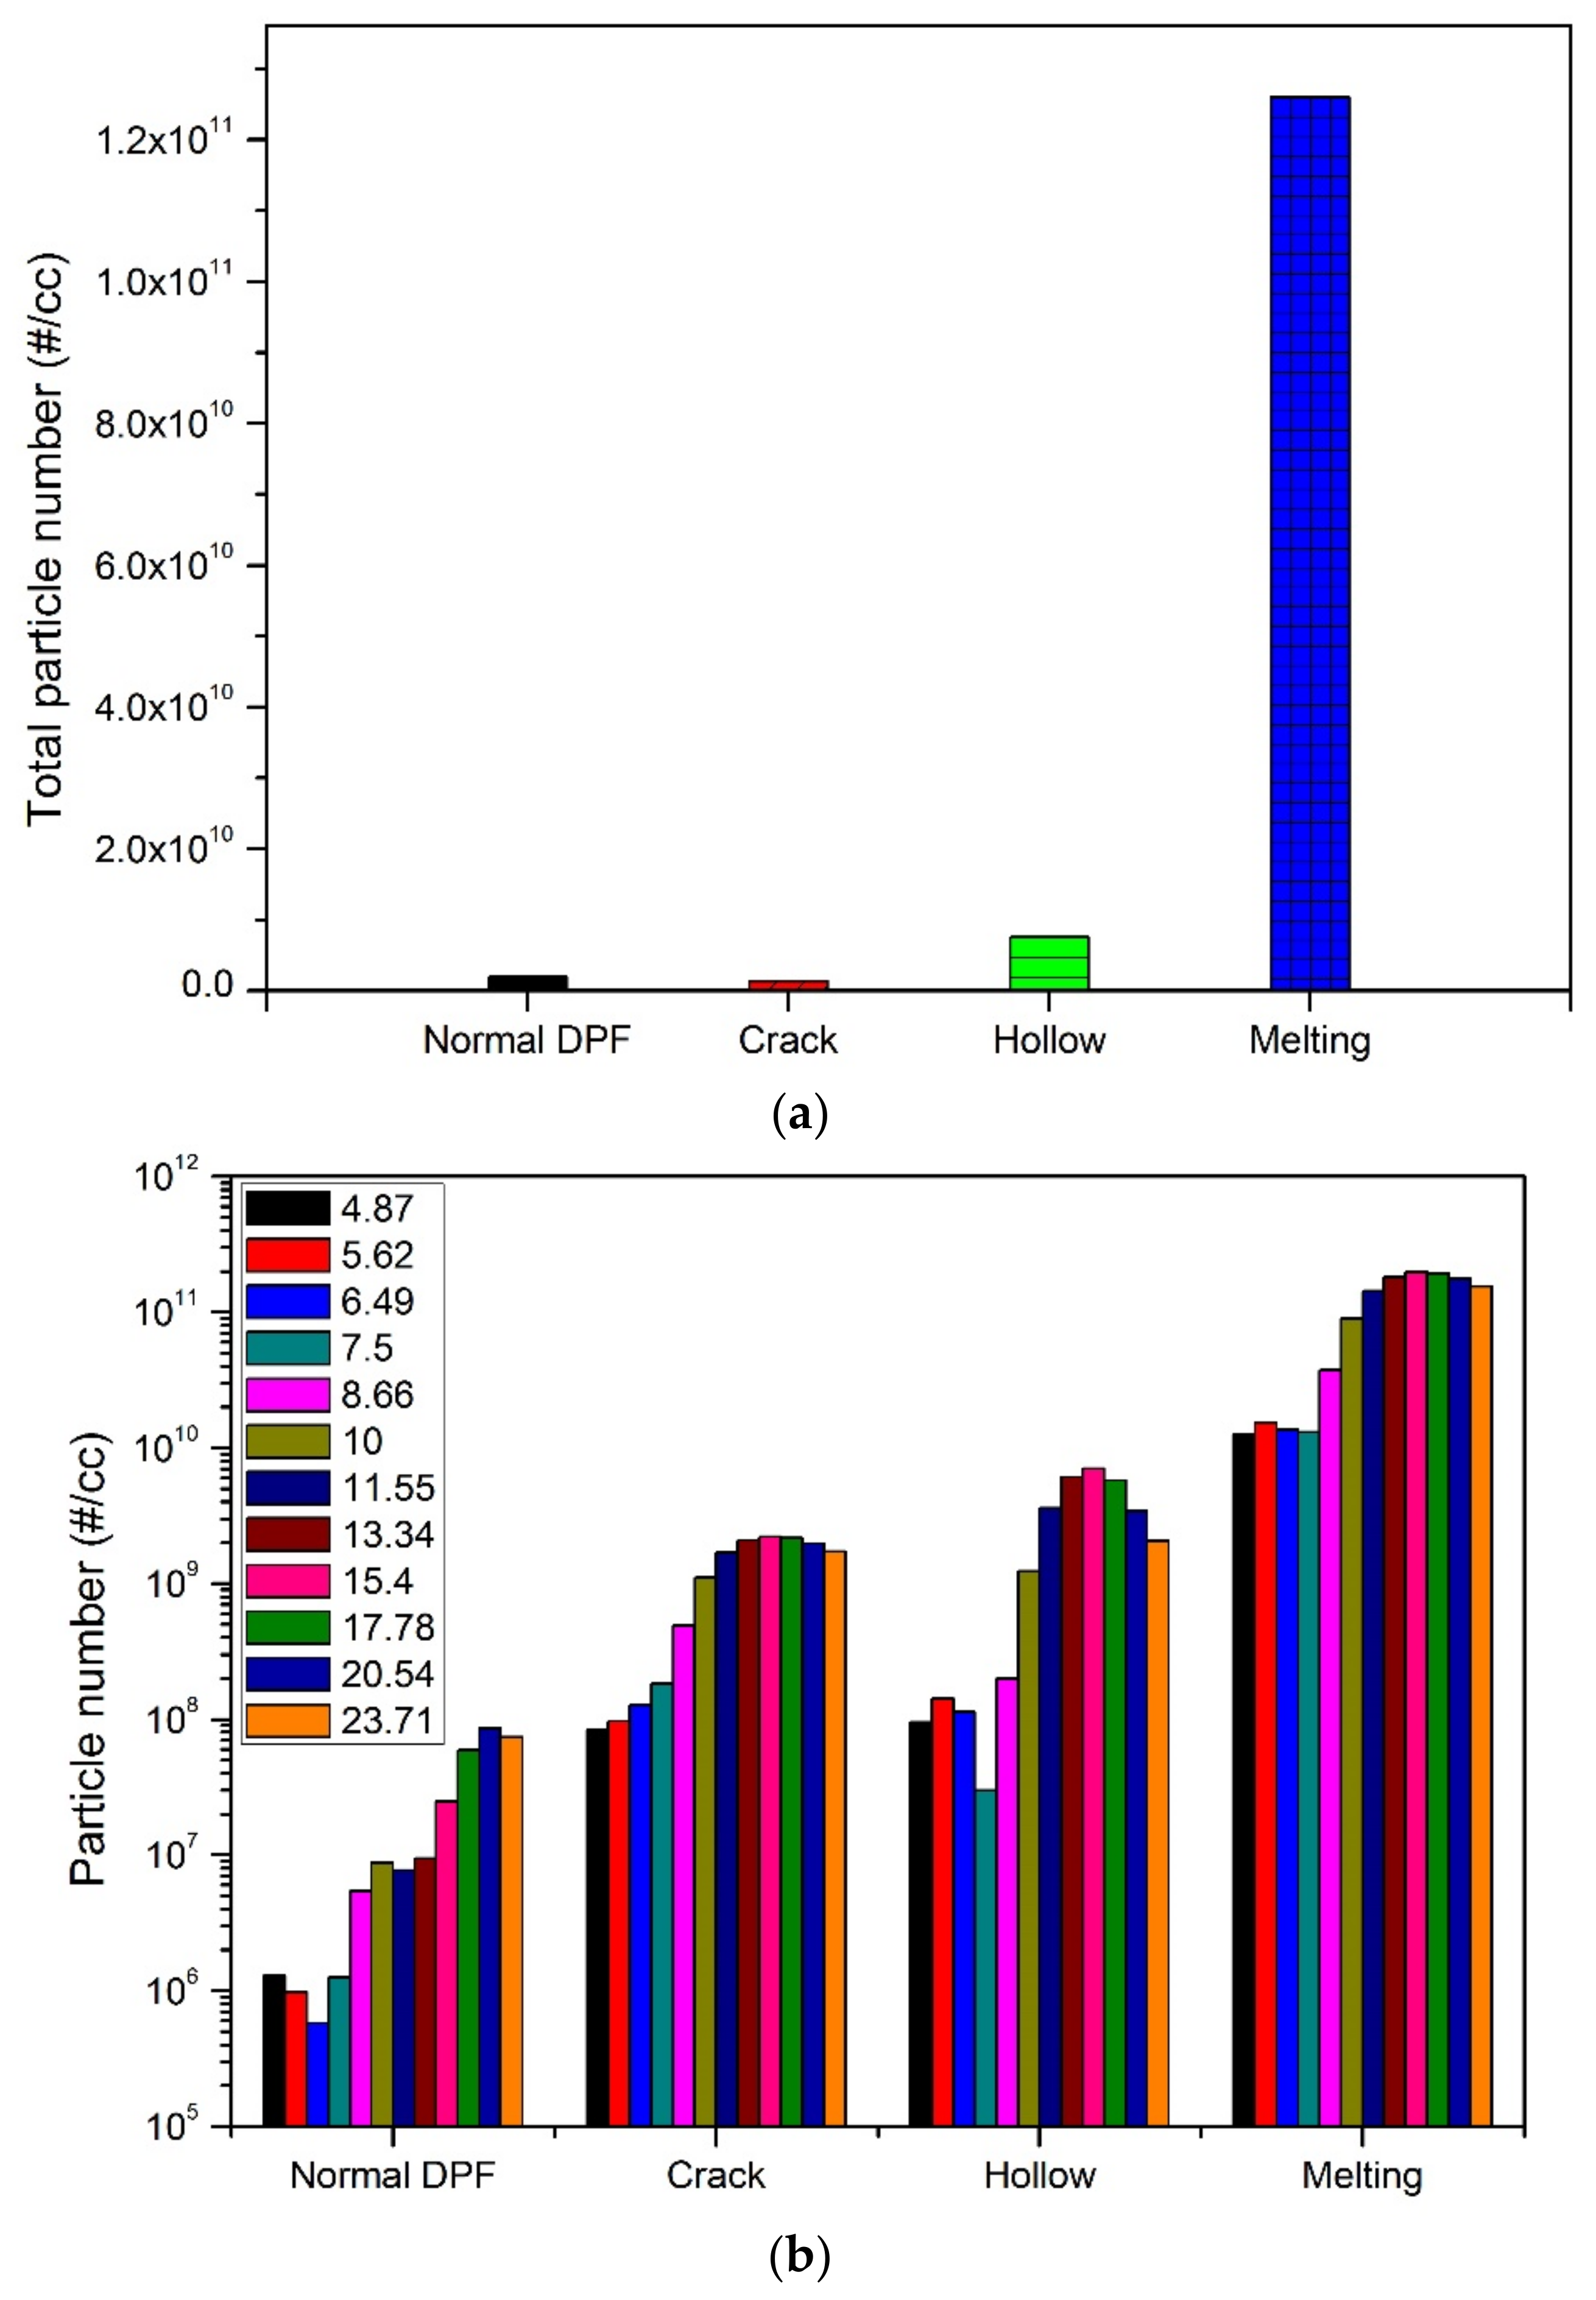
3.2. Particulate Emission Comparison

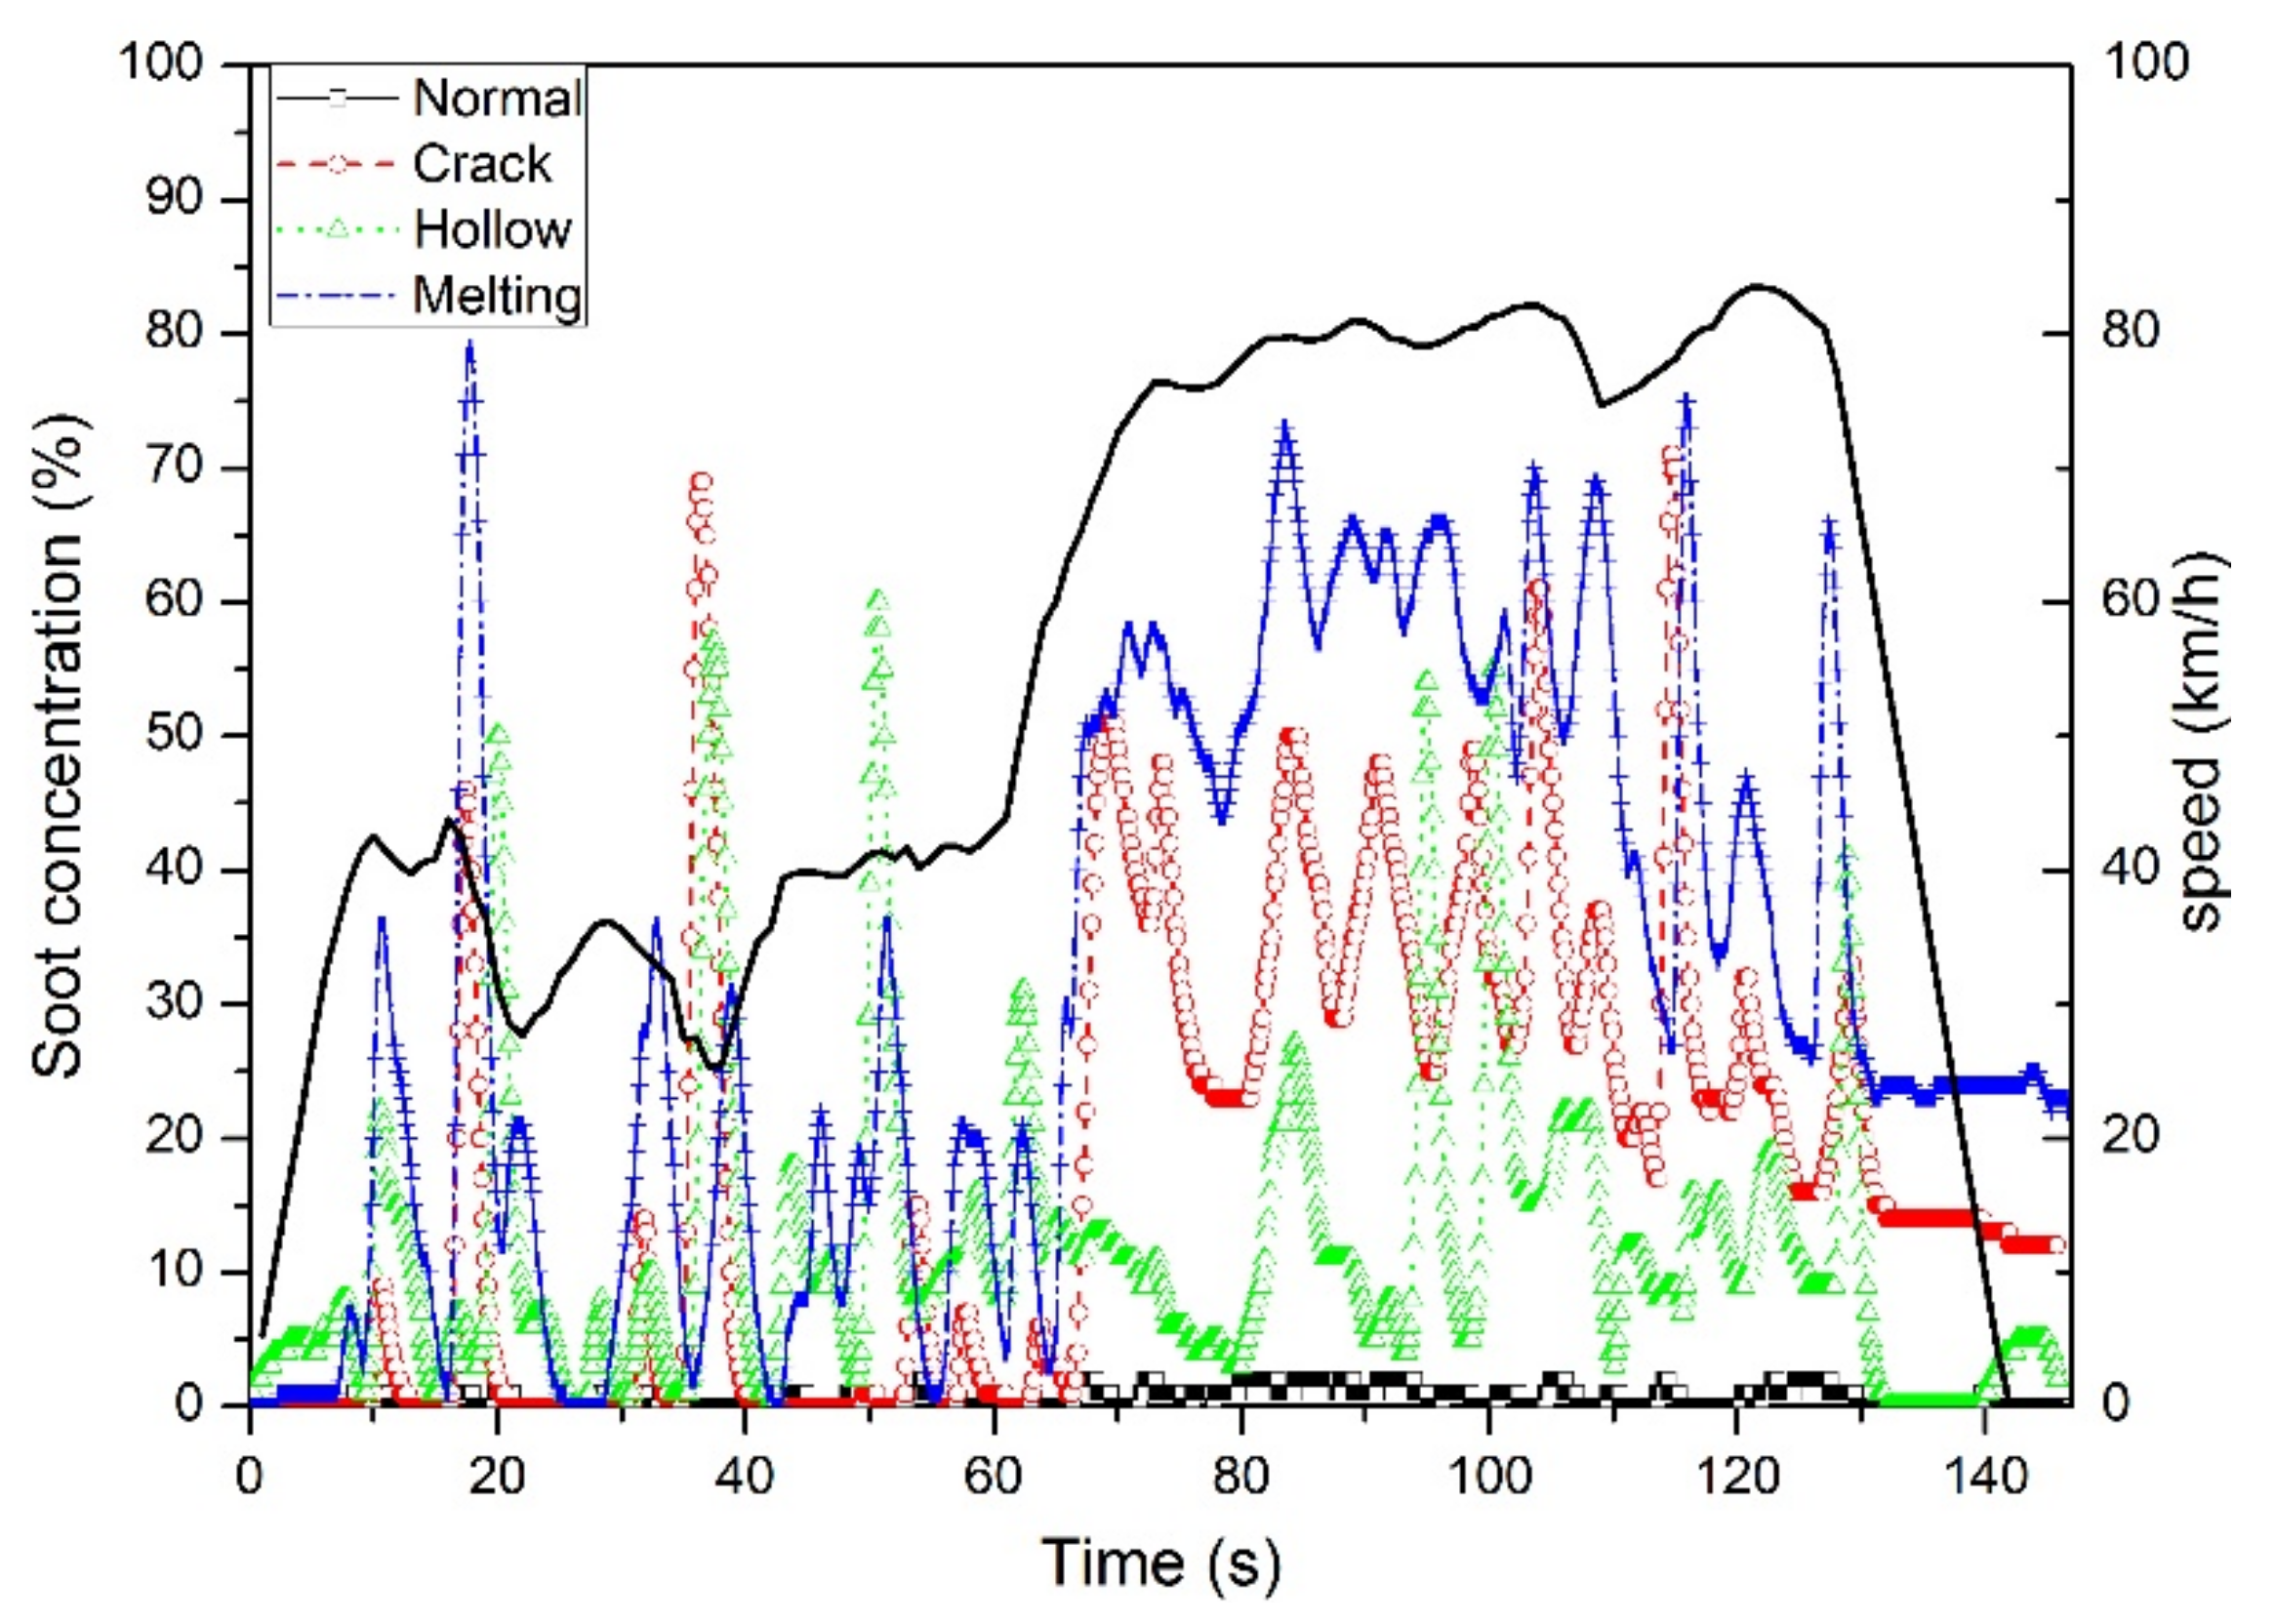
3.2.1. Soot Emission Concentration

Figure 11 and Figure 12 show the variation in soot emissions measured by the opacimeter (OPA-102) during vehicle driving in the KD-147 mode. In the case of a normal DPF device, the emission is less than 10% of the permissible exhaust emission for diesel vehicles in Korea. Meanwhile, the values for the three damaged DPFs exceed this permissible value. Because the filter function cannot be expected under severe carrier-damage conditions, such as melting or hollow, the emission concentration was at least 20%. Crack damage is characterized by a level of emission concentration similar to that for melting. It is inferred that the damage is more severe than that observed in X-ray images.
Figure 12 shows the soot emission concentrations of the four types of DPF samples. The hollow and melting-damaged DPF samples are considered the most severely damaged. These are essentially incapable of capturing particulate emissions. However, the particulate emission levels for the cracked DPF sample (which is conjectured to be a relatively marginal damage) were similar to those of the hollow and melting-damaged DPF samples. This is considered to be owing to the damage inside cordierite DPF substrates that were not identified effectively by X-ray imaging.

3.2.2. Particle Number and Size Concentration

Figure 13 shows the total PN density acquired by DMS500 during vehicle driving under the KD-147 mode. It is displayed on a log scale owing to the significant difference in emission level. The normal DPF sample showed the lowest maximum total particle emission levels (within 107 #/cc). Meanwhile, the crack- and hollow-damaged DPF samples showed total PN emission levels within 108 #/cc.
Figure 14 illustrates the PN density by particle size at three points (32, 77, and 108 s) during the KD-147 driving mode for the four types of DPF samples.
Comparing Figure 14a corresponding to the low-speed section A in the KD-147 mode, particles with sizes of at most 102 nm were mainly emitted. In the case of the crack- and hollow-damaged DPF, nanosized PN density of the order of 107 #/cc was emitted continuously. This occurred owing to the smooth internal flow caused by the damage to the DPF channel. Meanwhile, the melting-damaged DPF sample emitted a large amount of particles of the order of 109 #/cc at 32 s (see Figure 14).
Comparing Figure 14b,c corresponding to the high-speed section B in the KD-147 mode, a large PN density (of the order of 109 #/cc) was detected continuously in the melting-damaged DPF sample.
Considering that DPF regeneration did not occur during the KD-147 driving mode, nanosized particles continued to be detected in the measuring instrument (DMS500) in the case of the three damaged DPFs. Meanwhile, particles with sizes of at most 102 nm were generally filtered in the normal DPF sample, and particles of relatively large sizes were measured owing to agglomeration (see Figure 14c).
These experimental results revealed that the melting-damaged DPF continuously emitted the largest number of nanoparticles regardless of the vehicle driving speed in the KD-147 driving mode. Furthermore, a substantial number of nanoparticles (of the order of 107 #/cc) were emitted from the crack- and hollow-damaged DPFs.
Figure 15 shows a comparison of the total PN and nanosized particles (≤23 nm) measured by DMS500 during the KD-147 driving mode for the four types of DPF samples. The melting-damaged DPF sample (see Figure 15a) showed the most characteristics in total PN density with a particle size of 5 nm–1 μm (similar to soot emission). The more severe the damage to the DPF, the higher the PN of emissions. In addition, DPF damage that is difficult to detect, such as cracks, emits significantly higher PN density than a normal DPF. Therefore, it needs to be managed. In particular, nanoparticles that are small (size ranging from 1 to 100 nm; undetectable by the human eye) can exhibit physical and chemical properties significantly different from those of DPF materials. Figure 15b reveals that even a normal DPF emits a significant number of nanoparticles with sizes of at most 23 nm.

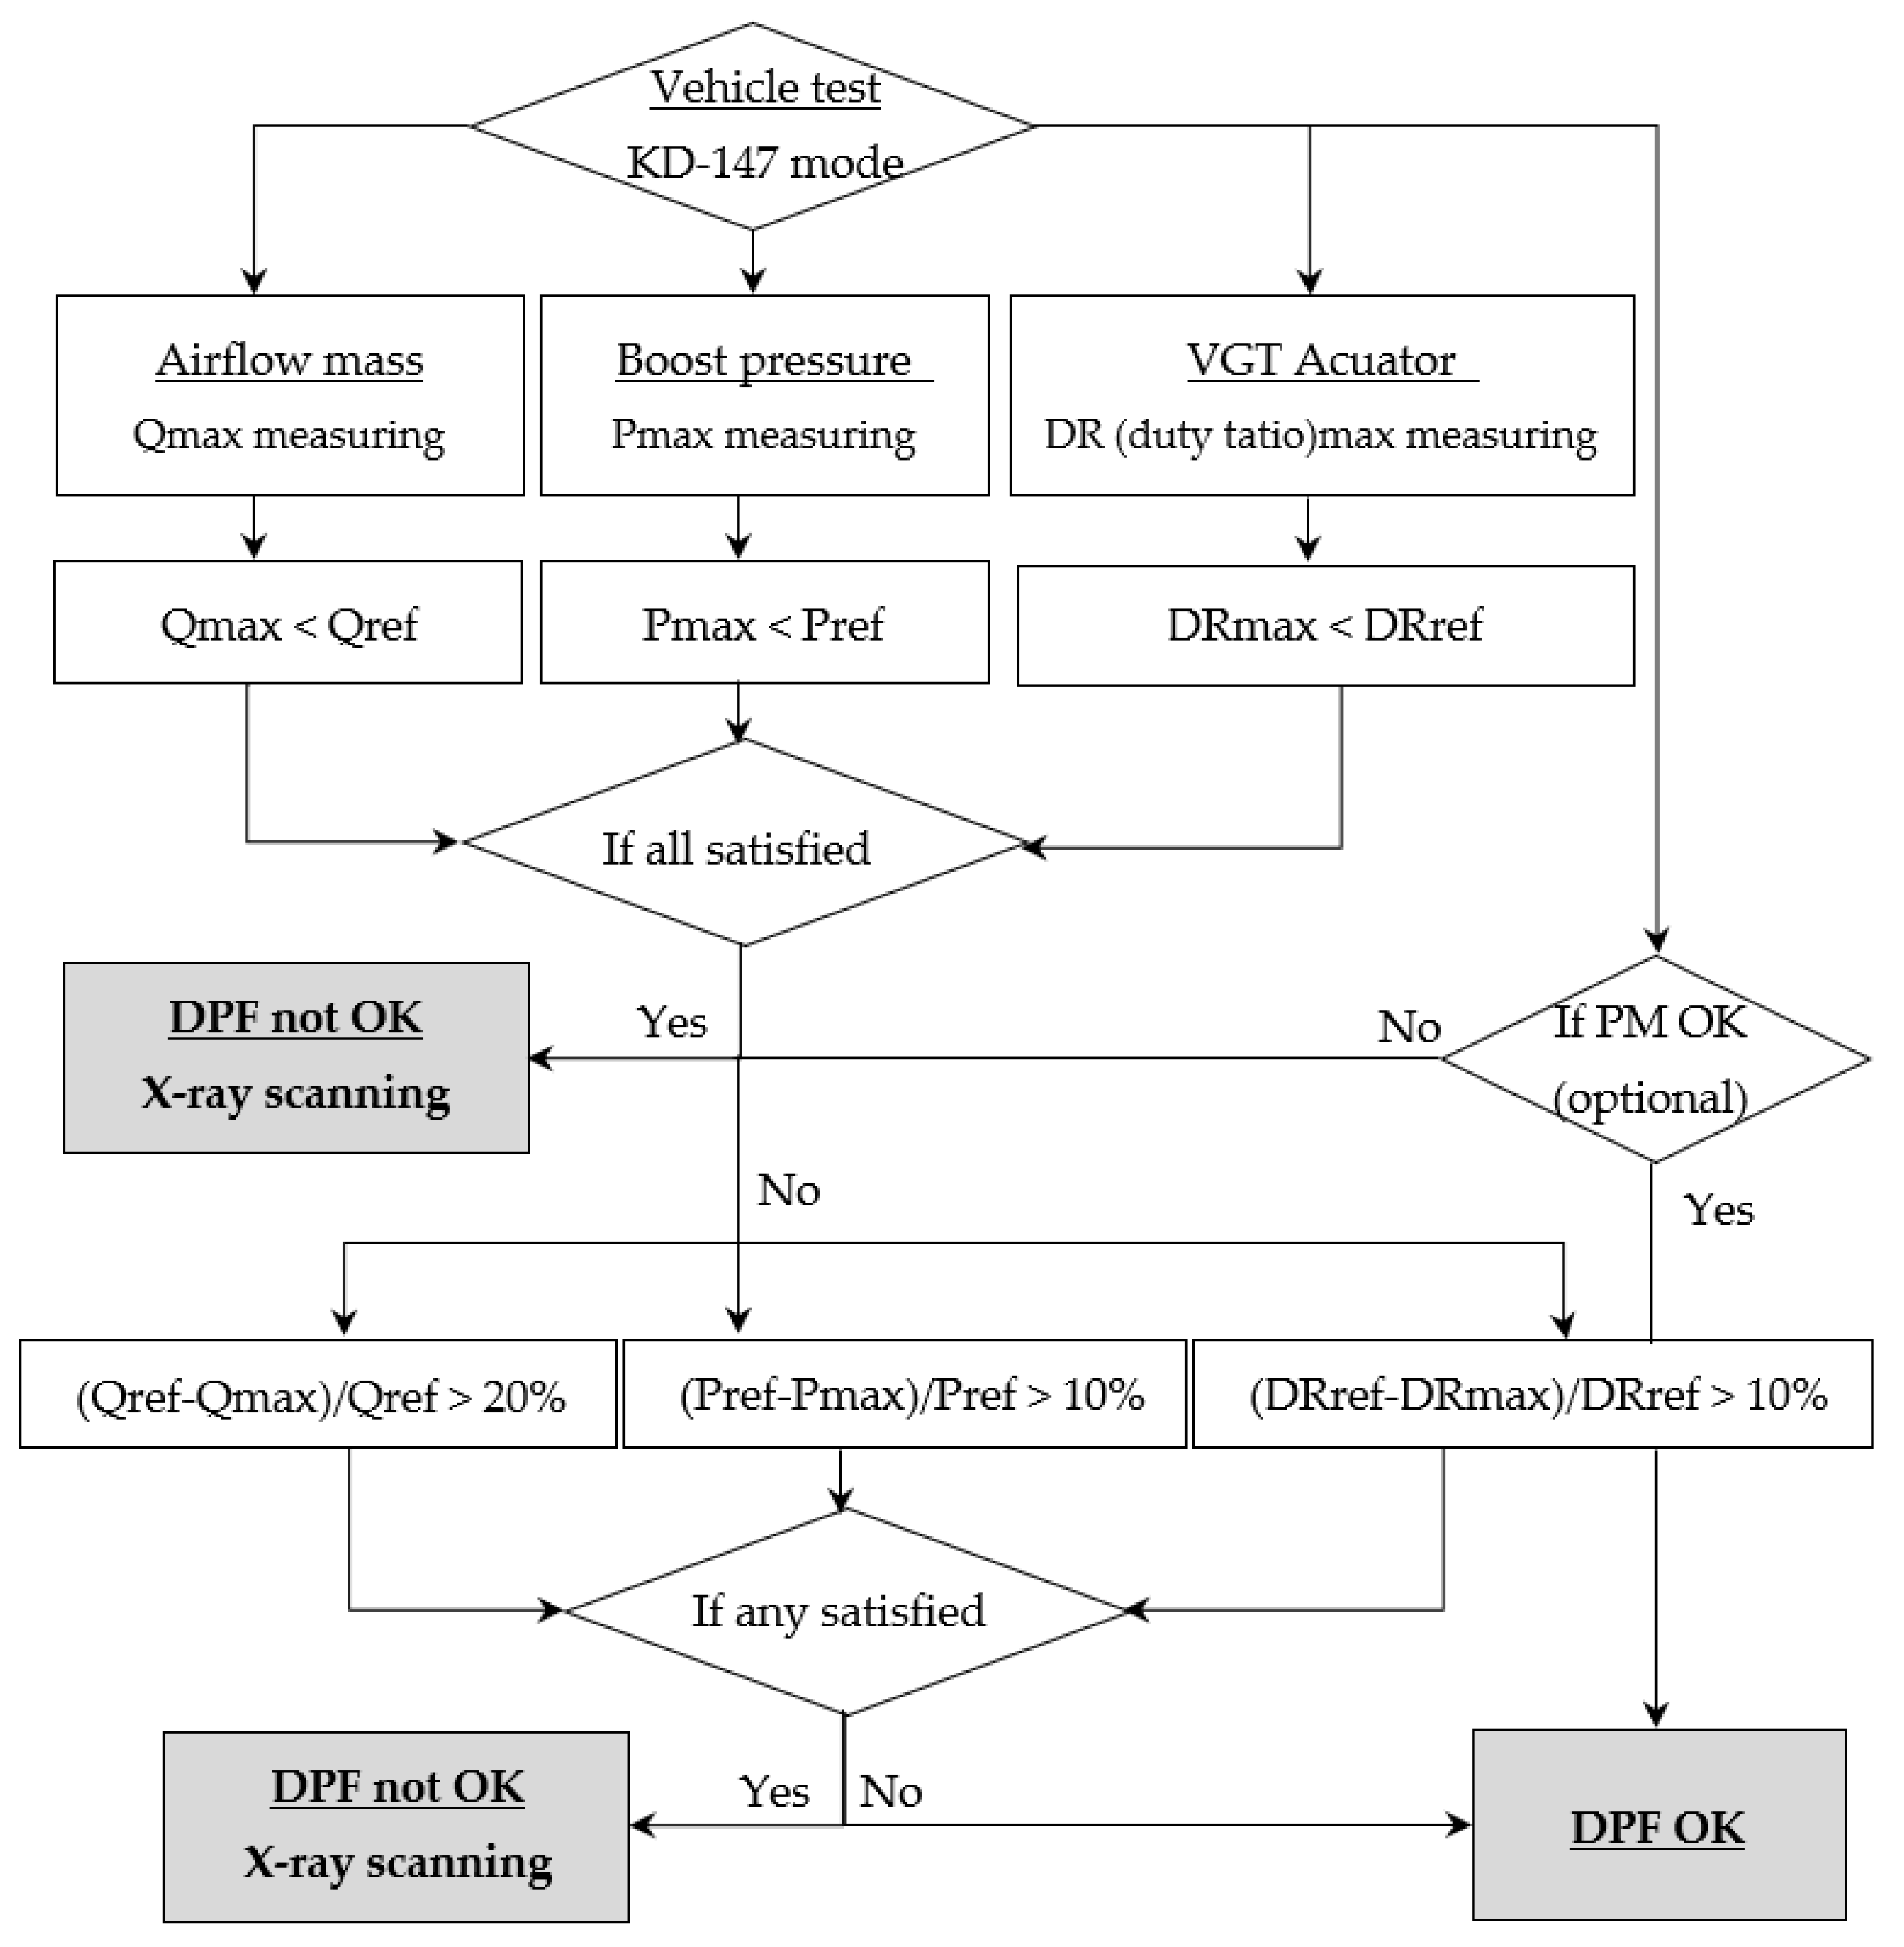
3.3. Algorithm for Determining Damaged DPF

As explained in Section 3.1, the airflow mass rate, EGR actuator (duty ratio), fuel pressure, boost pressure, and VGT actuator (duty ratio) were measured by the GDS diagnostic as comparable signals to determine whether it is a damaged DPF. And it was observed that the maximum value of the three parameters (airflow mass, boost pressure, and VGT actuator) was distinctly different for each of the four DPF types (see Table 7).
Based on these experimental results, the OBD-based algorithm was derived from the airflow mass, boost pressure, and VGT actuator control duty signals, as shown in Figure 16. Whether the DPF is damaged is determined primarily by comparing the maximum value of these three variables with the reference value. Therefore, X-ray scanning should be performed for a detailed inspection. If it is not satisfied whether the DPF is damaged, DPF is determined secondarily by determining whether the measured value for each of the three variables exceeds the given range. If the PM sensor is used as an auxiliary indicator for this algorithm, the accuracy of the algorithm decision can be improved based on the accumulated PM actually emitted.

4. Conclusions

It is essential to systematically manage DPFs. These are the most effective exhaust after-treatment control systems for reducing the amount of particle emissions (mass/PM, number/PN) generated by a diesel-fueled engine. Failure to maintain DPFs can have significant consequences for vehicles.
The purpose of this study was to investigate the OBD signal and PN emission characteristics of DPFs with different types of damage and to present an OBD-based algorithm for determining various types of DPF damage from vehicle OBD signals. In this study, three DPF samples with different types of damage (crack, hollow, and melting) were installed on the exhaust system of the test SUV with a 2.0 L diesel-fueled engine. The KD-147 driving cycle was carried out on a chassis dynamometer. An OBD-II monitoring system was used to measure signals from the engine and DPF. In addition, an opacity smoke-meter and an instrument that measures particle number were used to measure the particulate emission. The main results of this study are summarized below:
  • The three types of DPF damage were identified using X-ray images with a tube voltage of 125 kV. The failures in the cordierite DPF substrates were classified into the following types: cracks in the material inside the DPF, its melting, and hollow fractures.
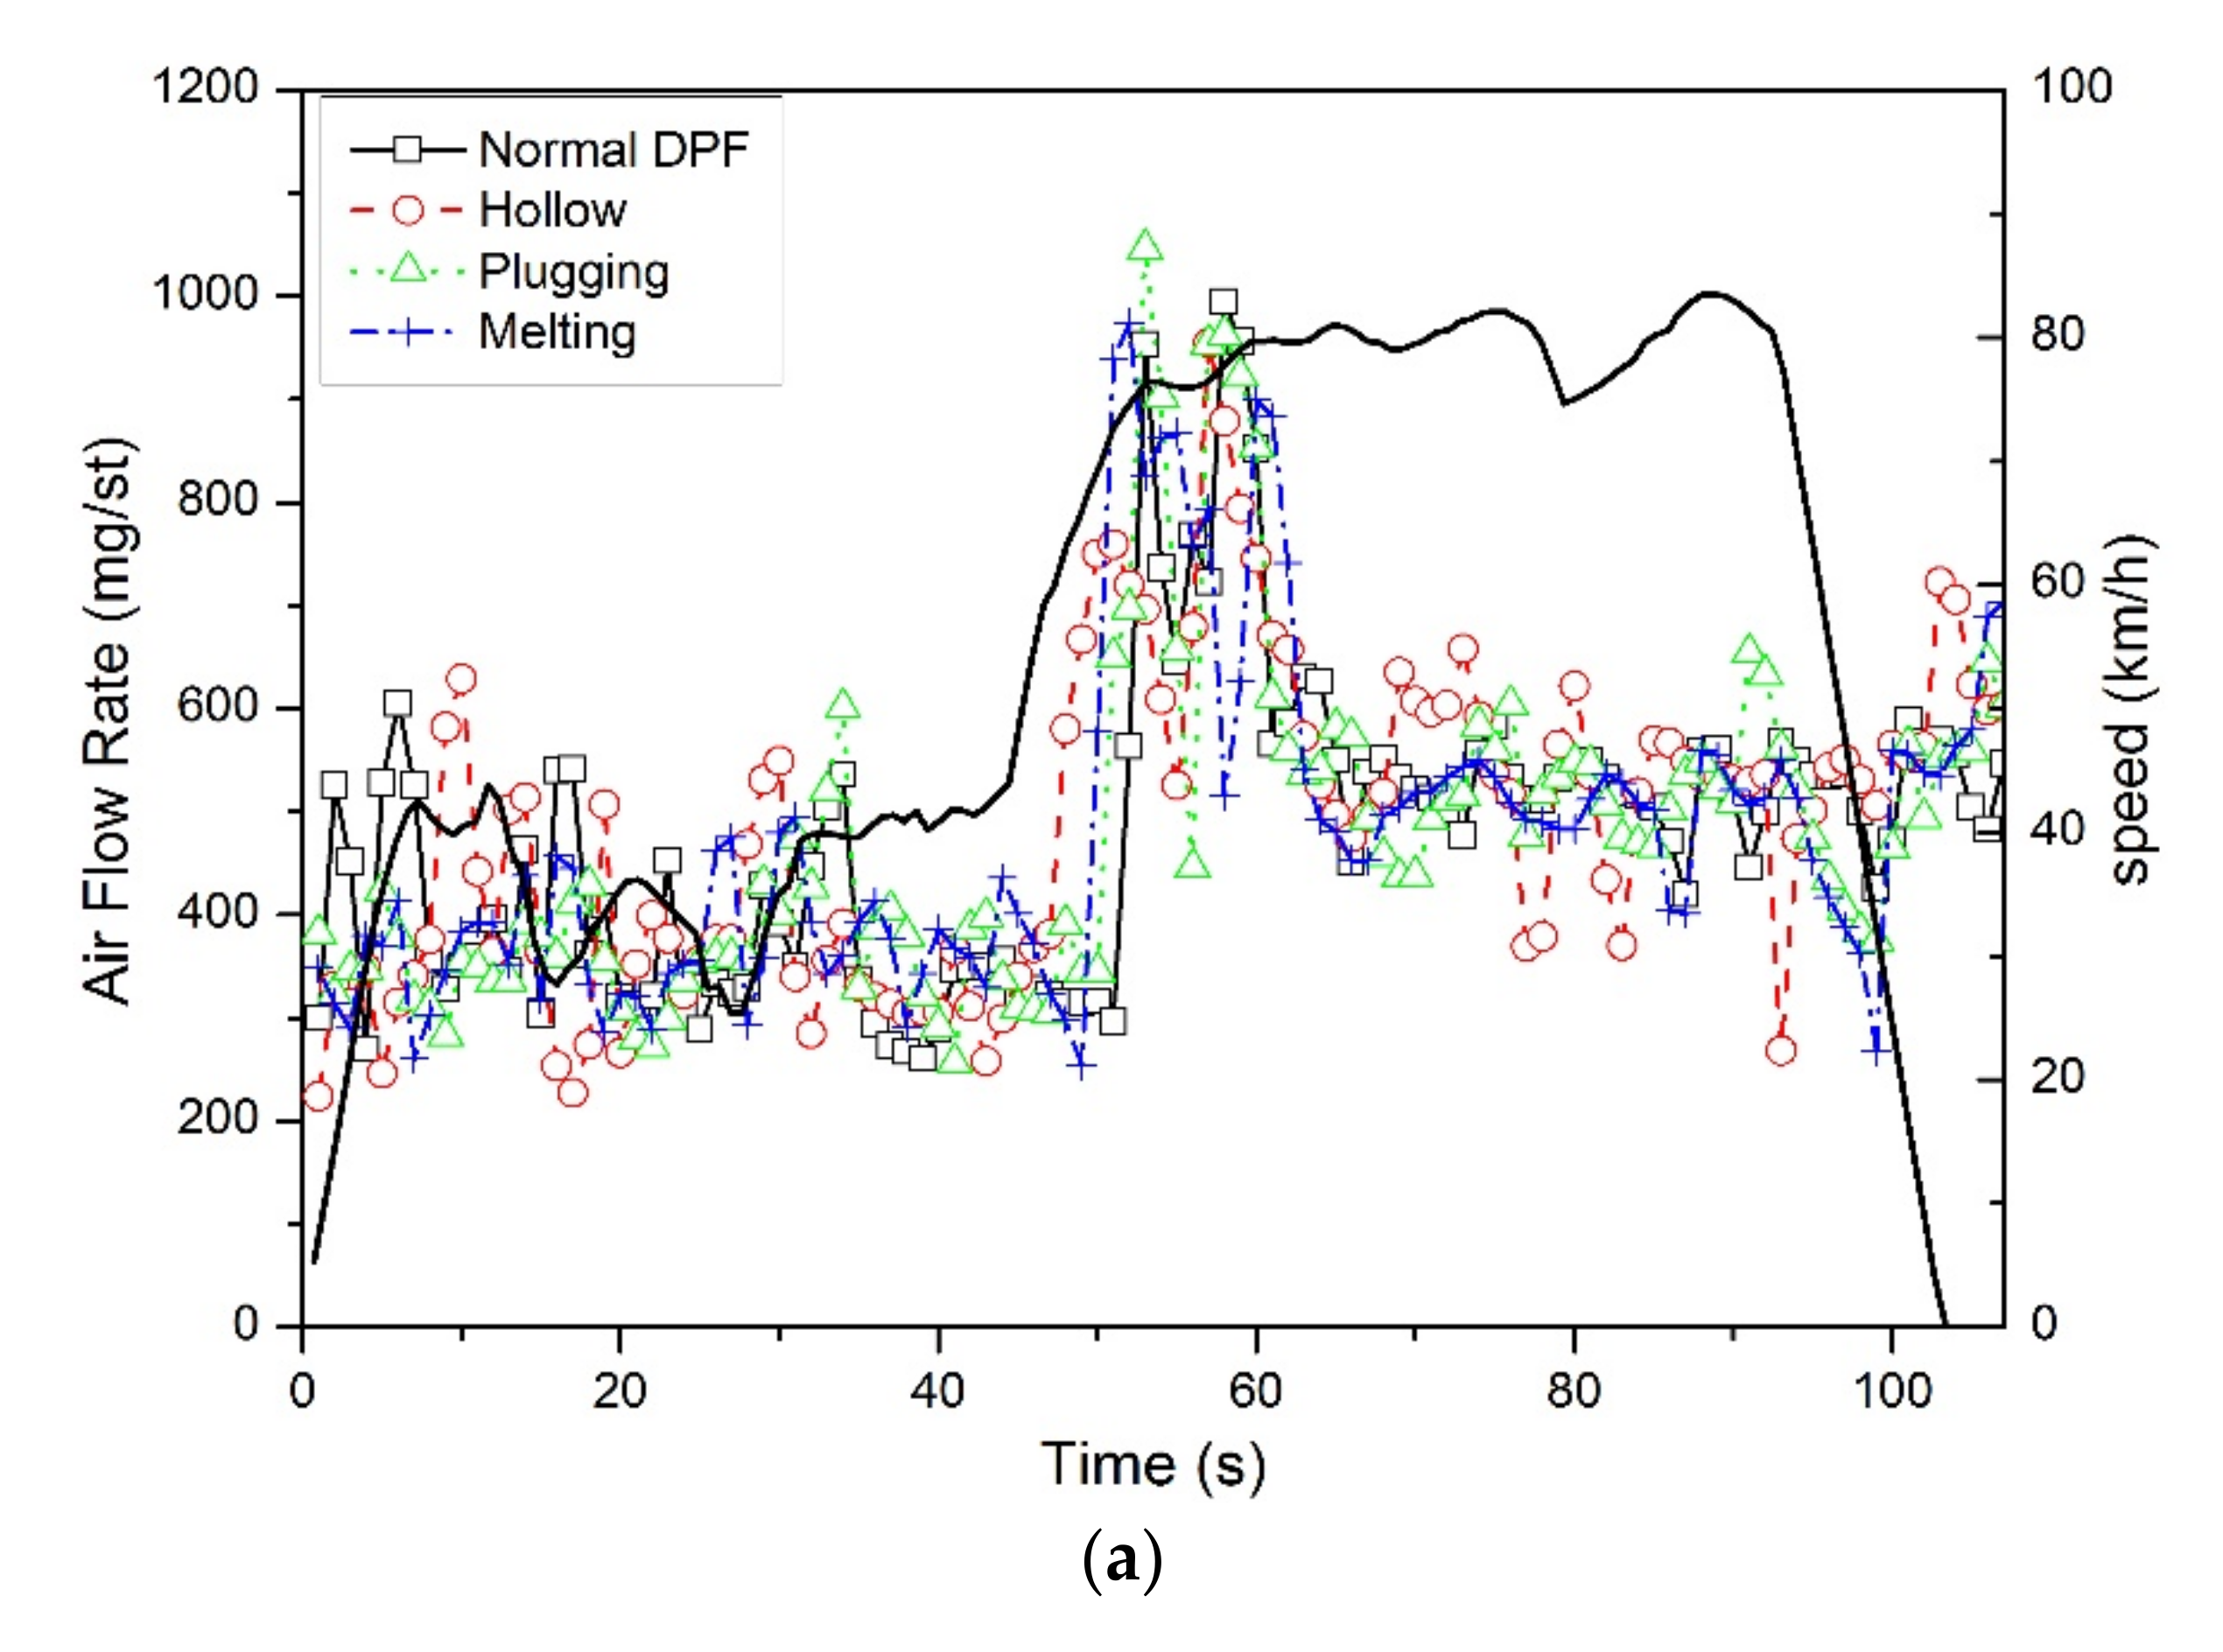
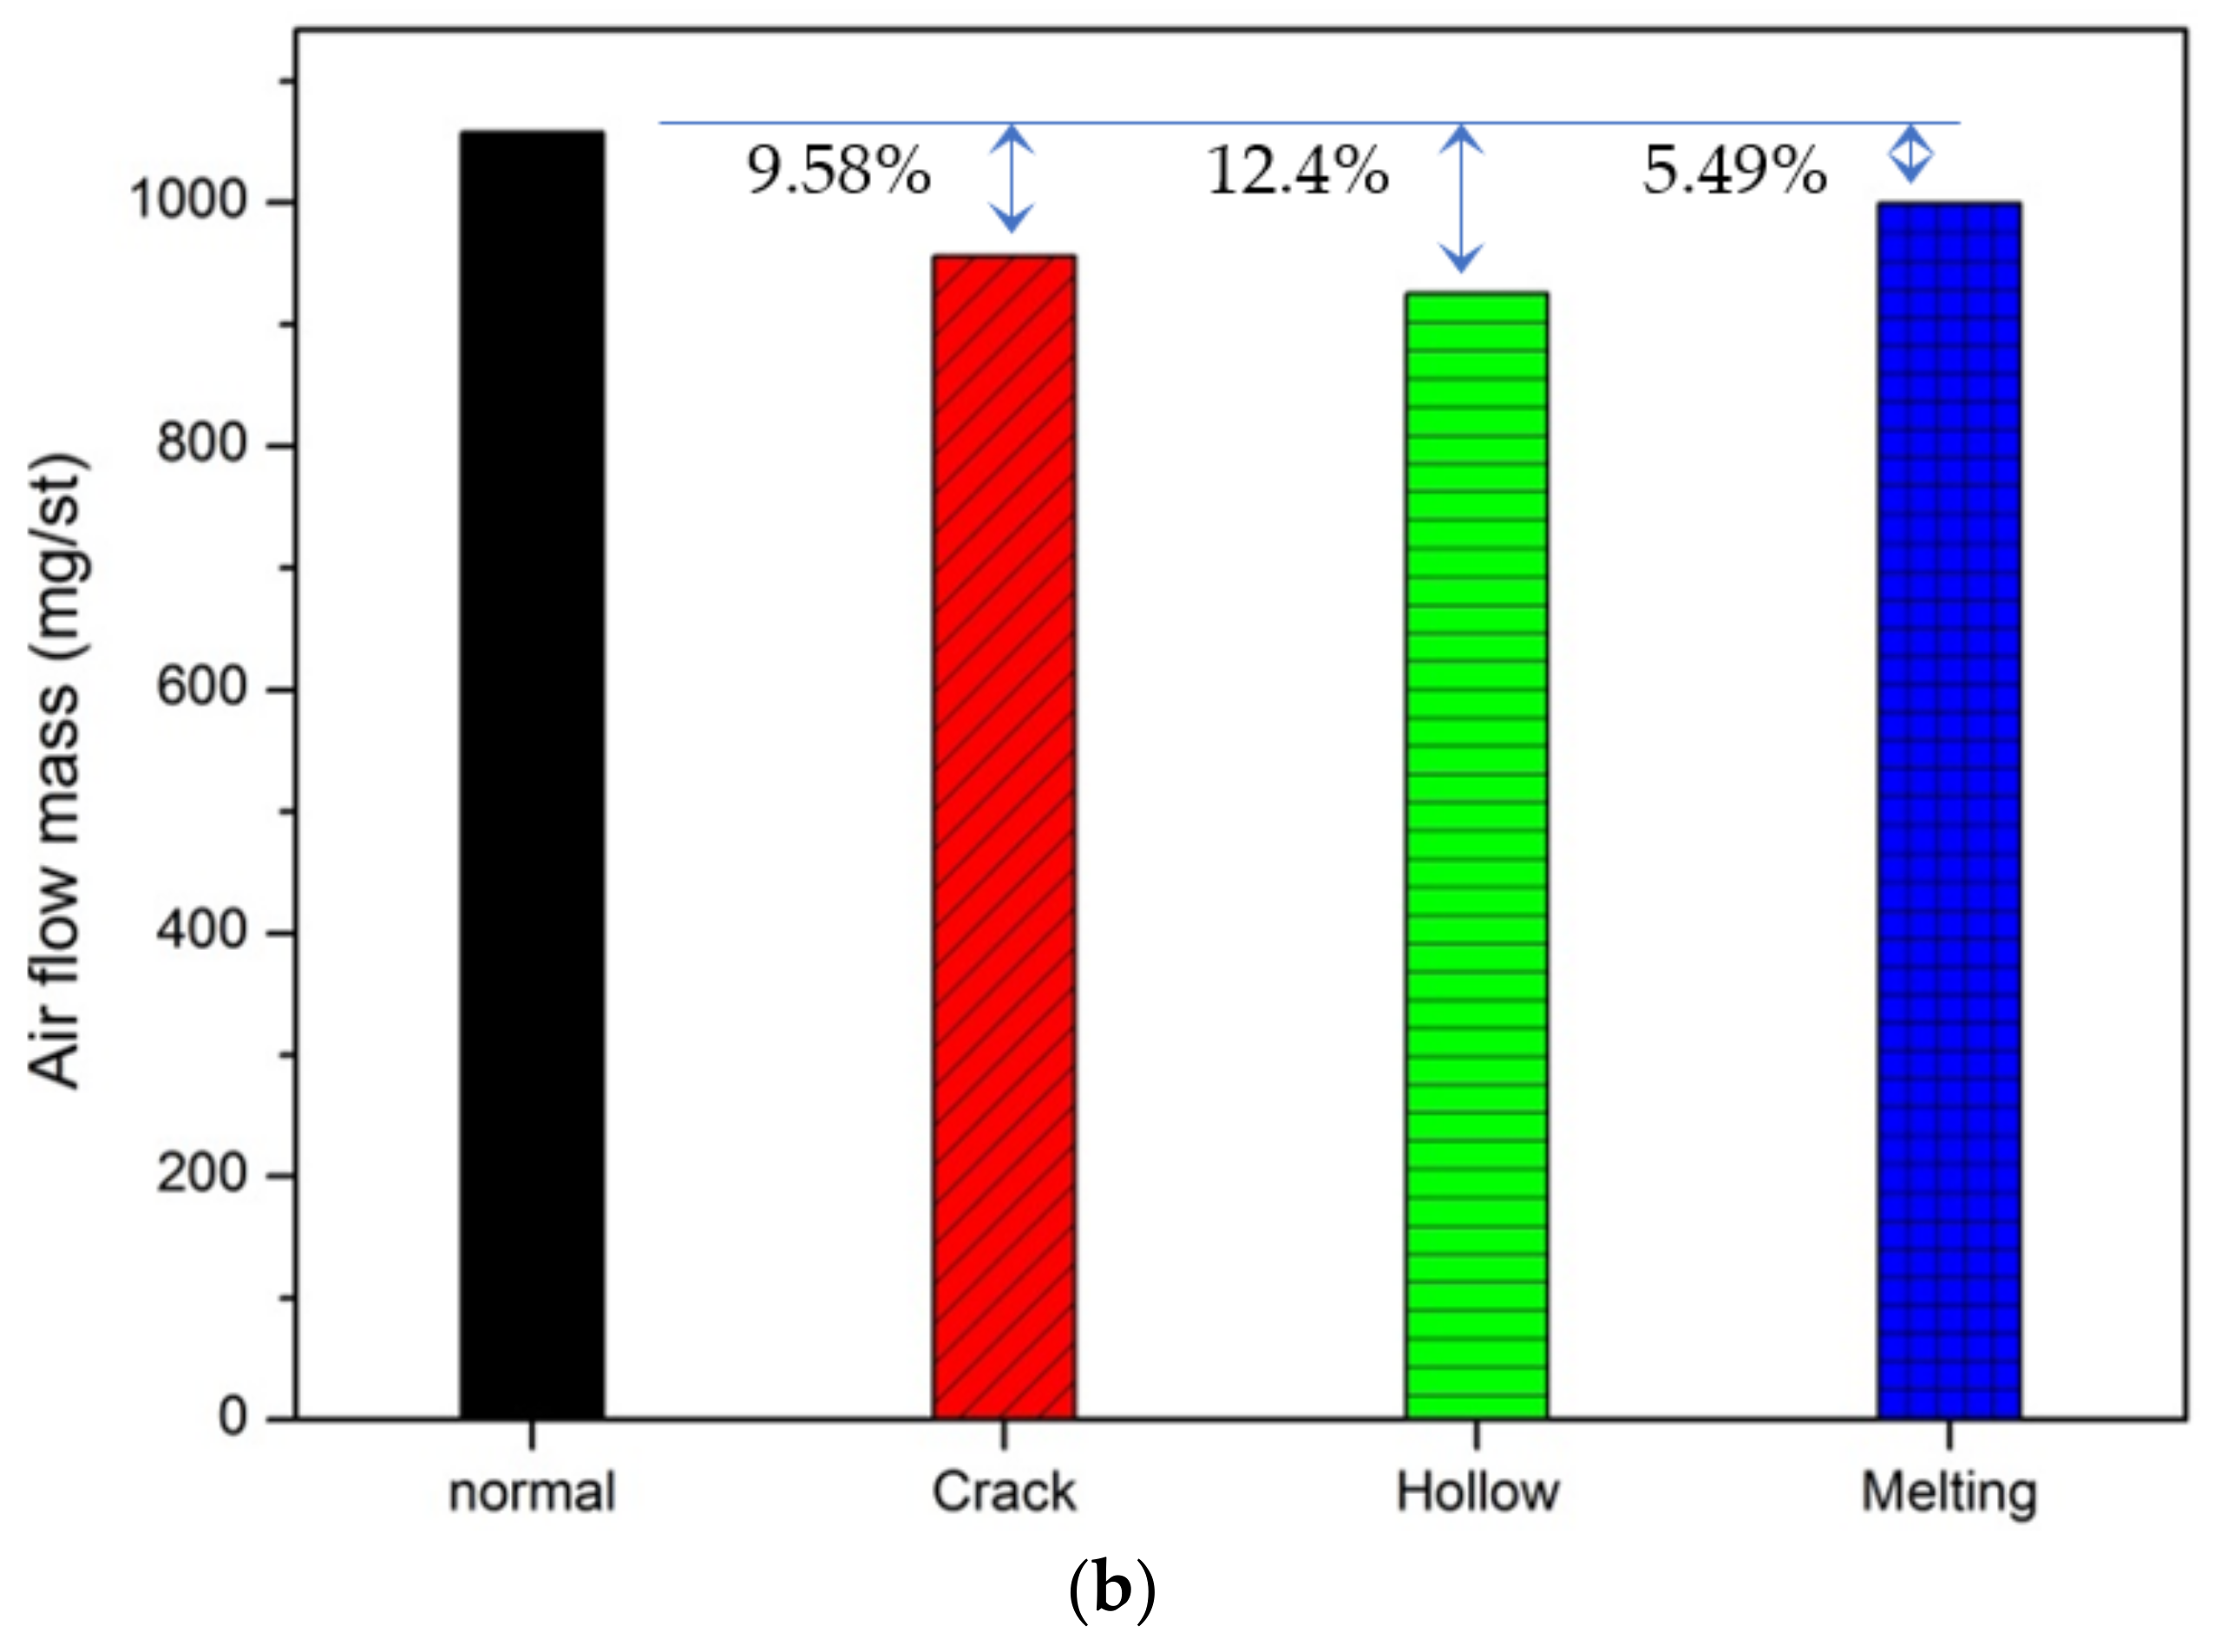
  • A comparison of the characteristics of the OBD data obtained by the GDS under the KD-147 driving mode with each of the DPF samples revealed that the difference in maximum value of the OBD data was larger than the difference in minimum value. In particular, the maximum values of the three parameters (airflow mass, boost pressure, and VGT actuator) were distinctly different for each of the DPF samples.
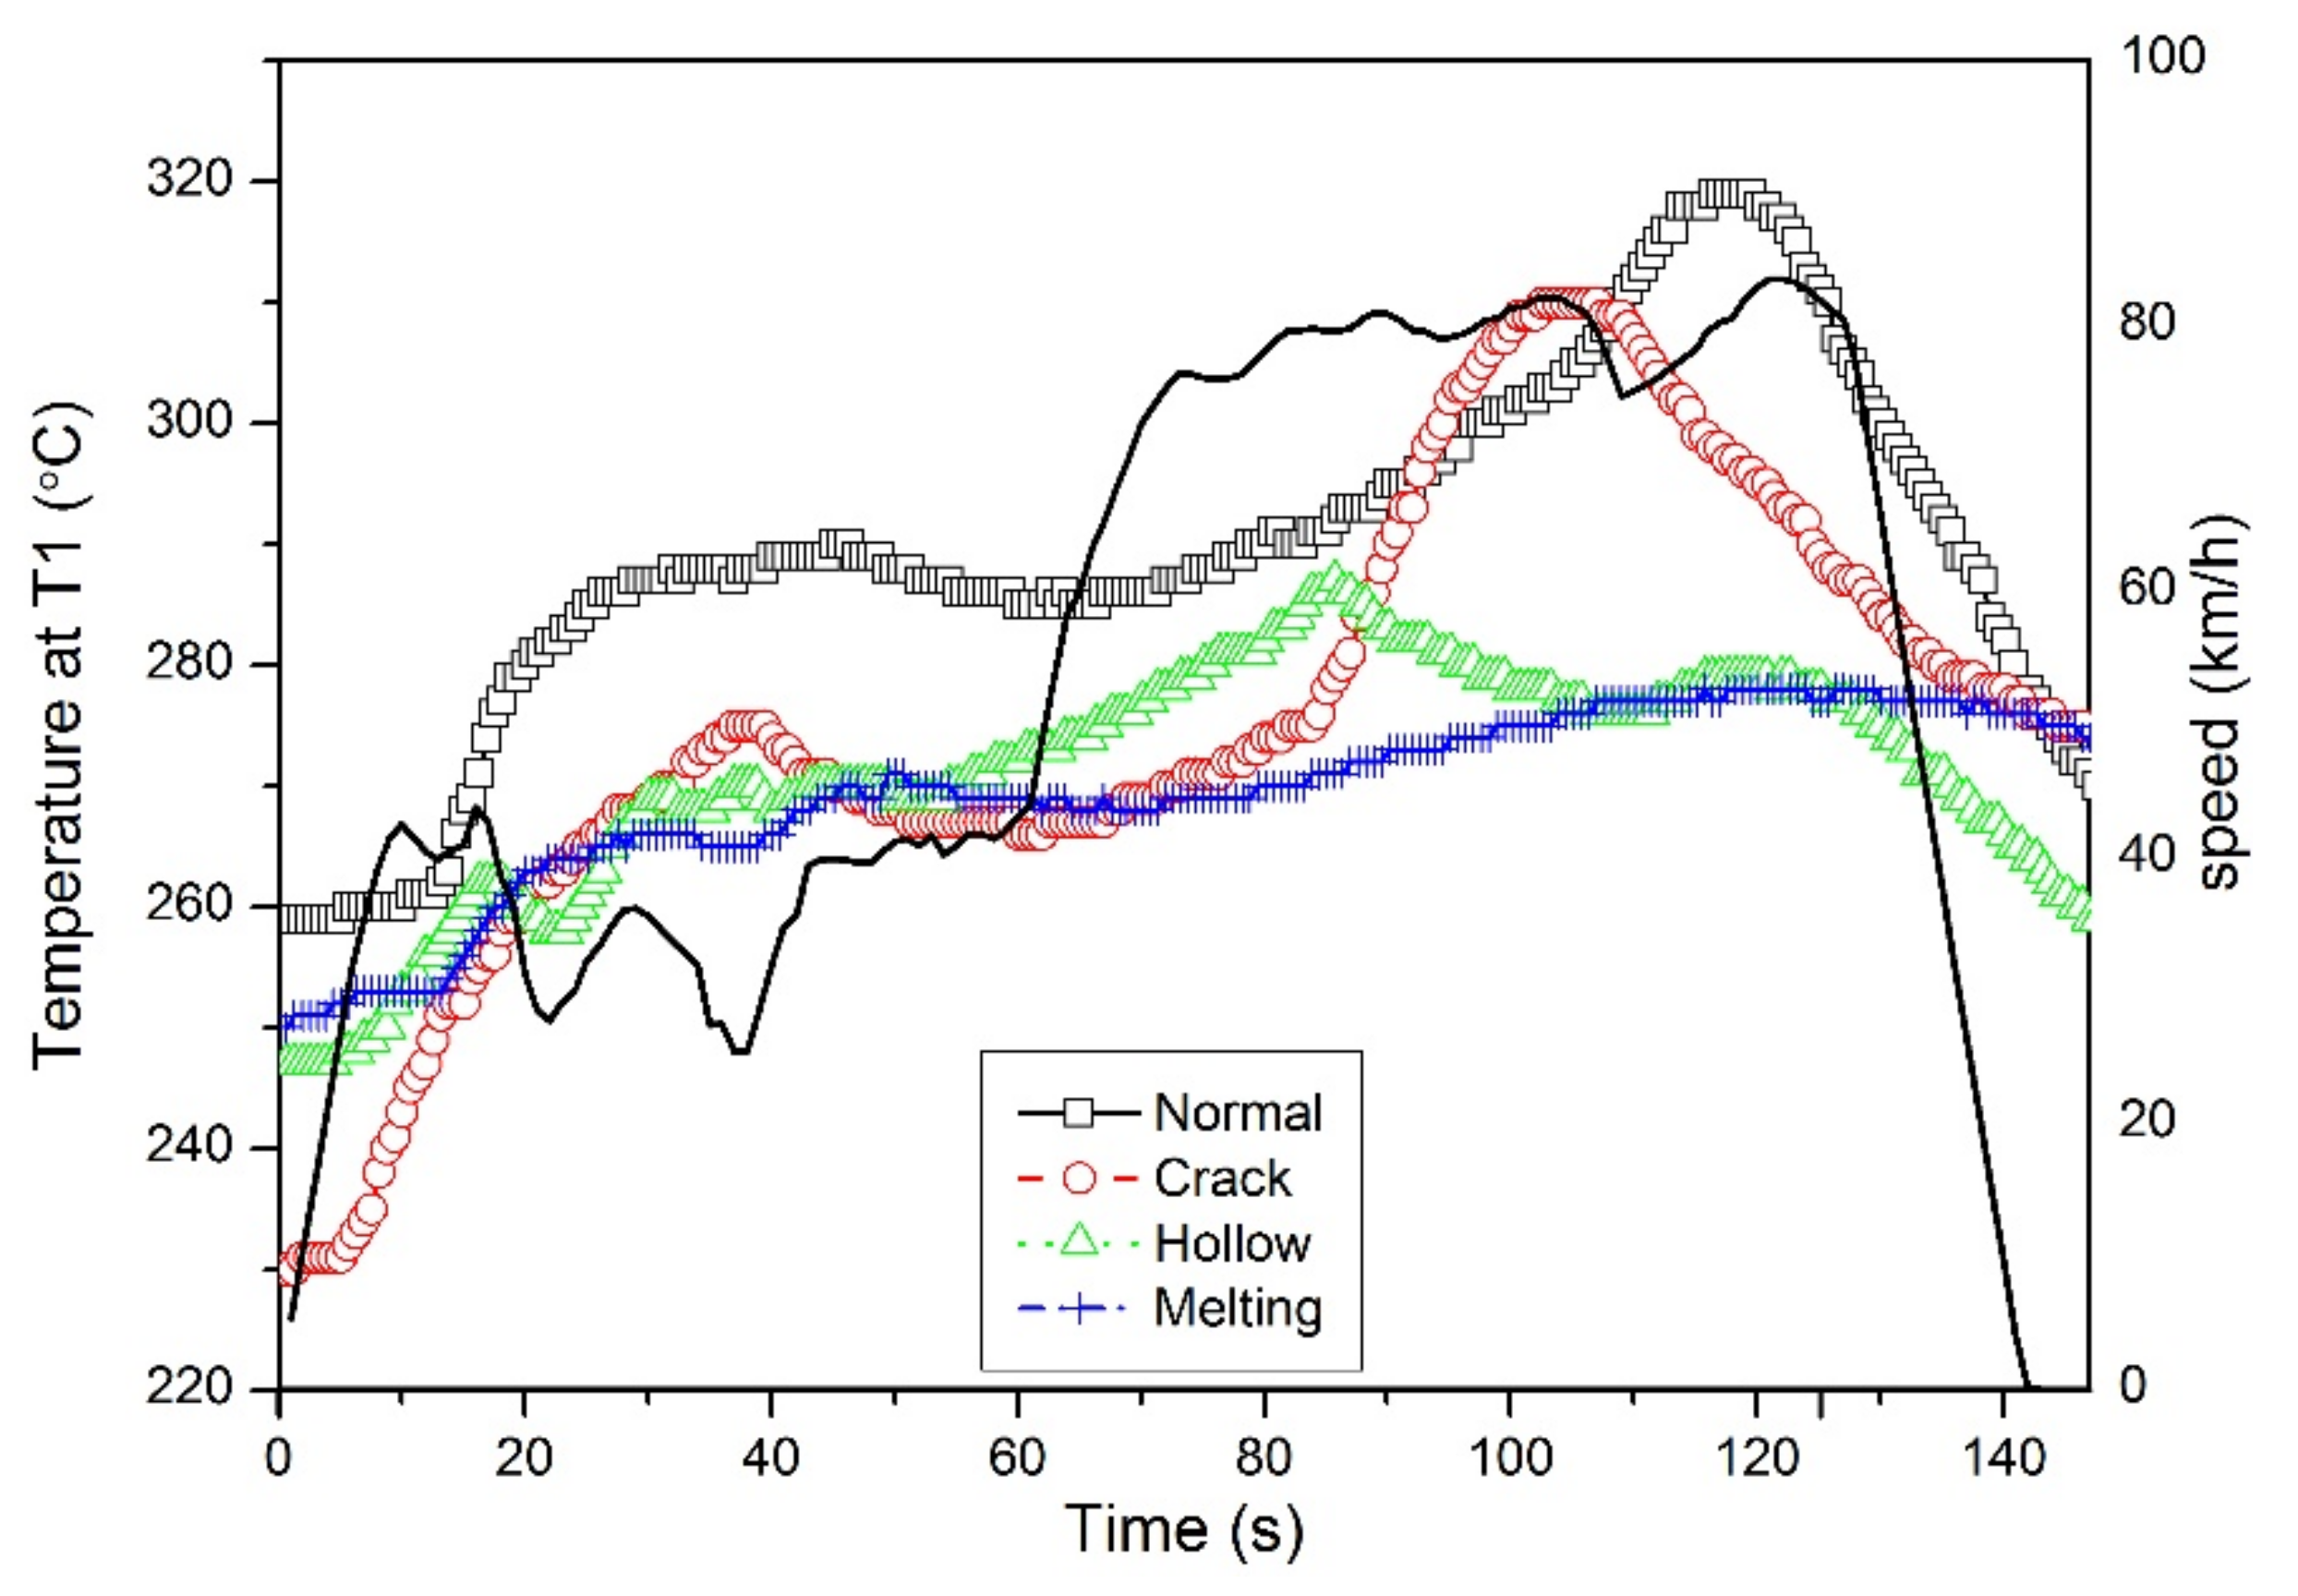
  • A comparison of the exhaust temperature at the rear end of the DPF revealed that the exhaust temperature gradient in the case of the normal DPF and crack-damaged DPF followed the KD-147 driving pattern. This was because volume damage had not occurred inside the cordierite DPF substrates. However, in the case of the hollow- and melting-damaged DPFs, the volume inside the cordierite DPF substrates reduced, or the time for the exhaust gas to stay in the DPF substrates decreased. Thereby, these present relatively smooth shape patterns.
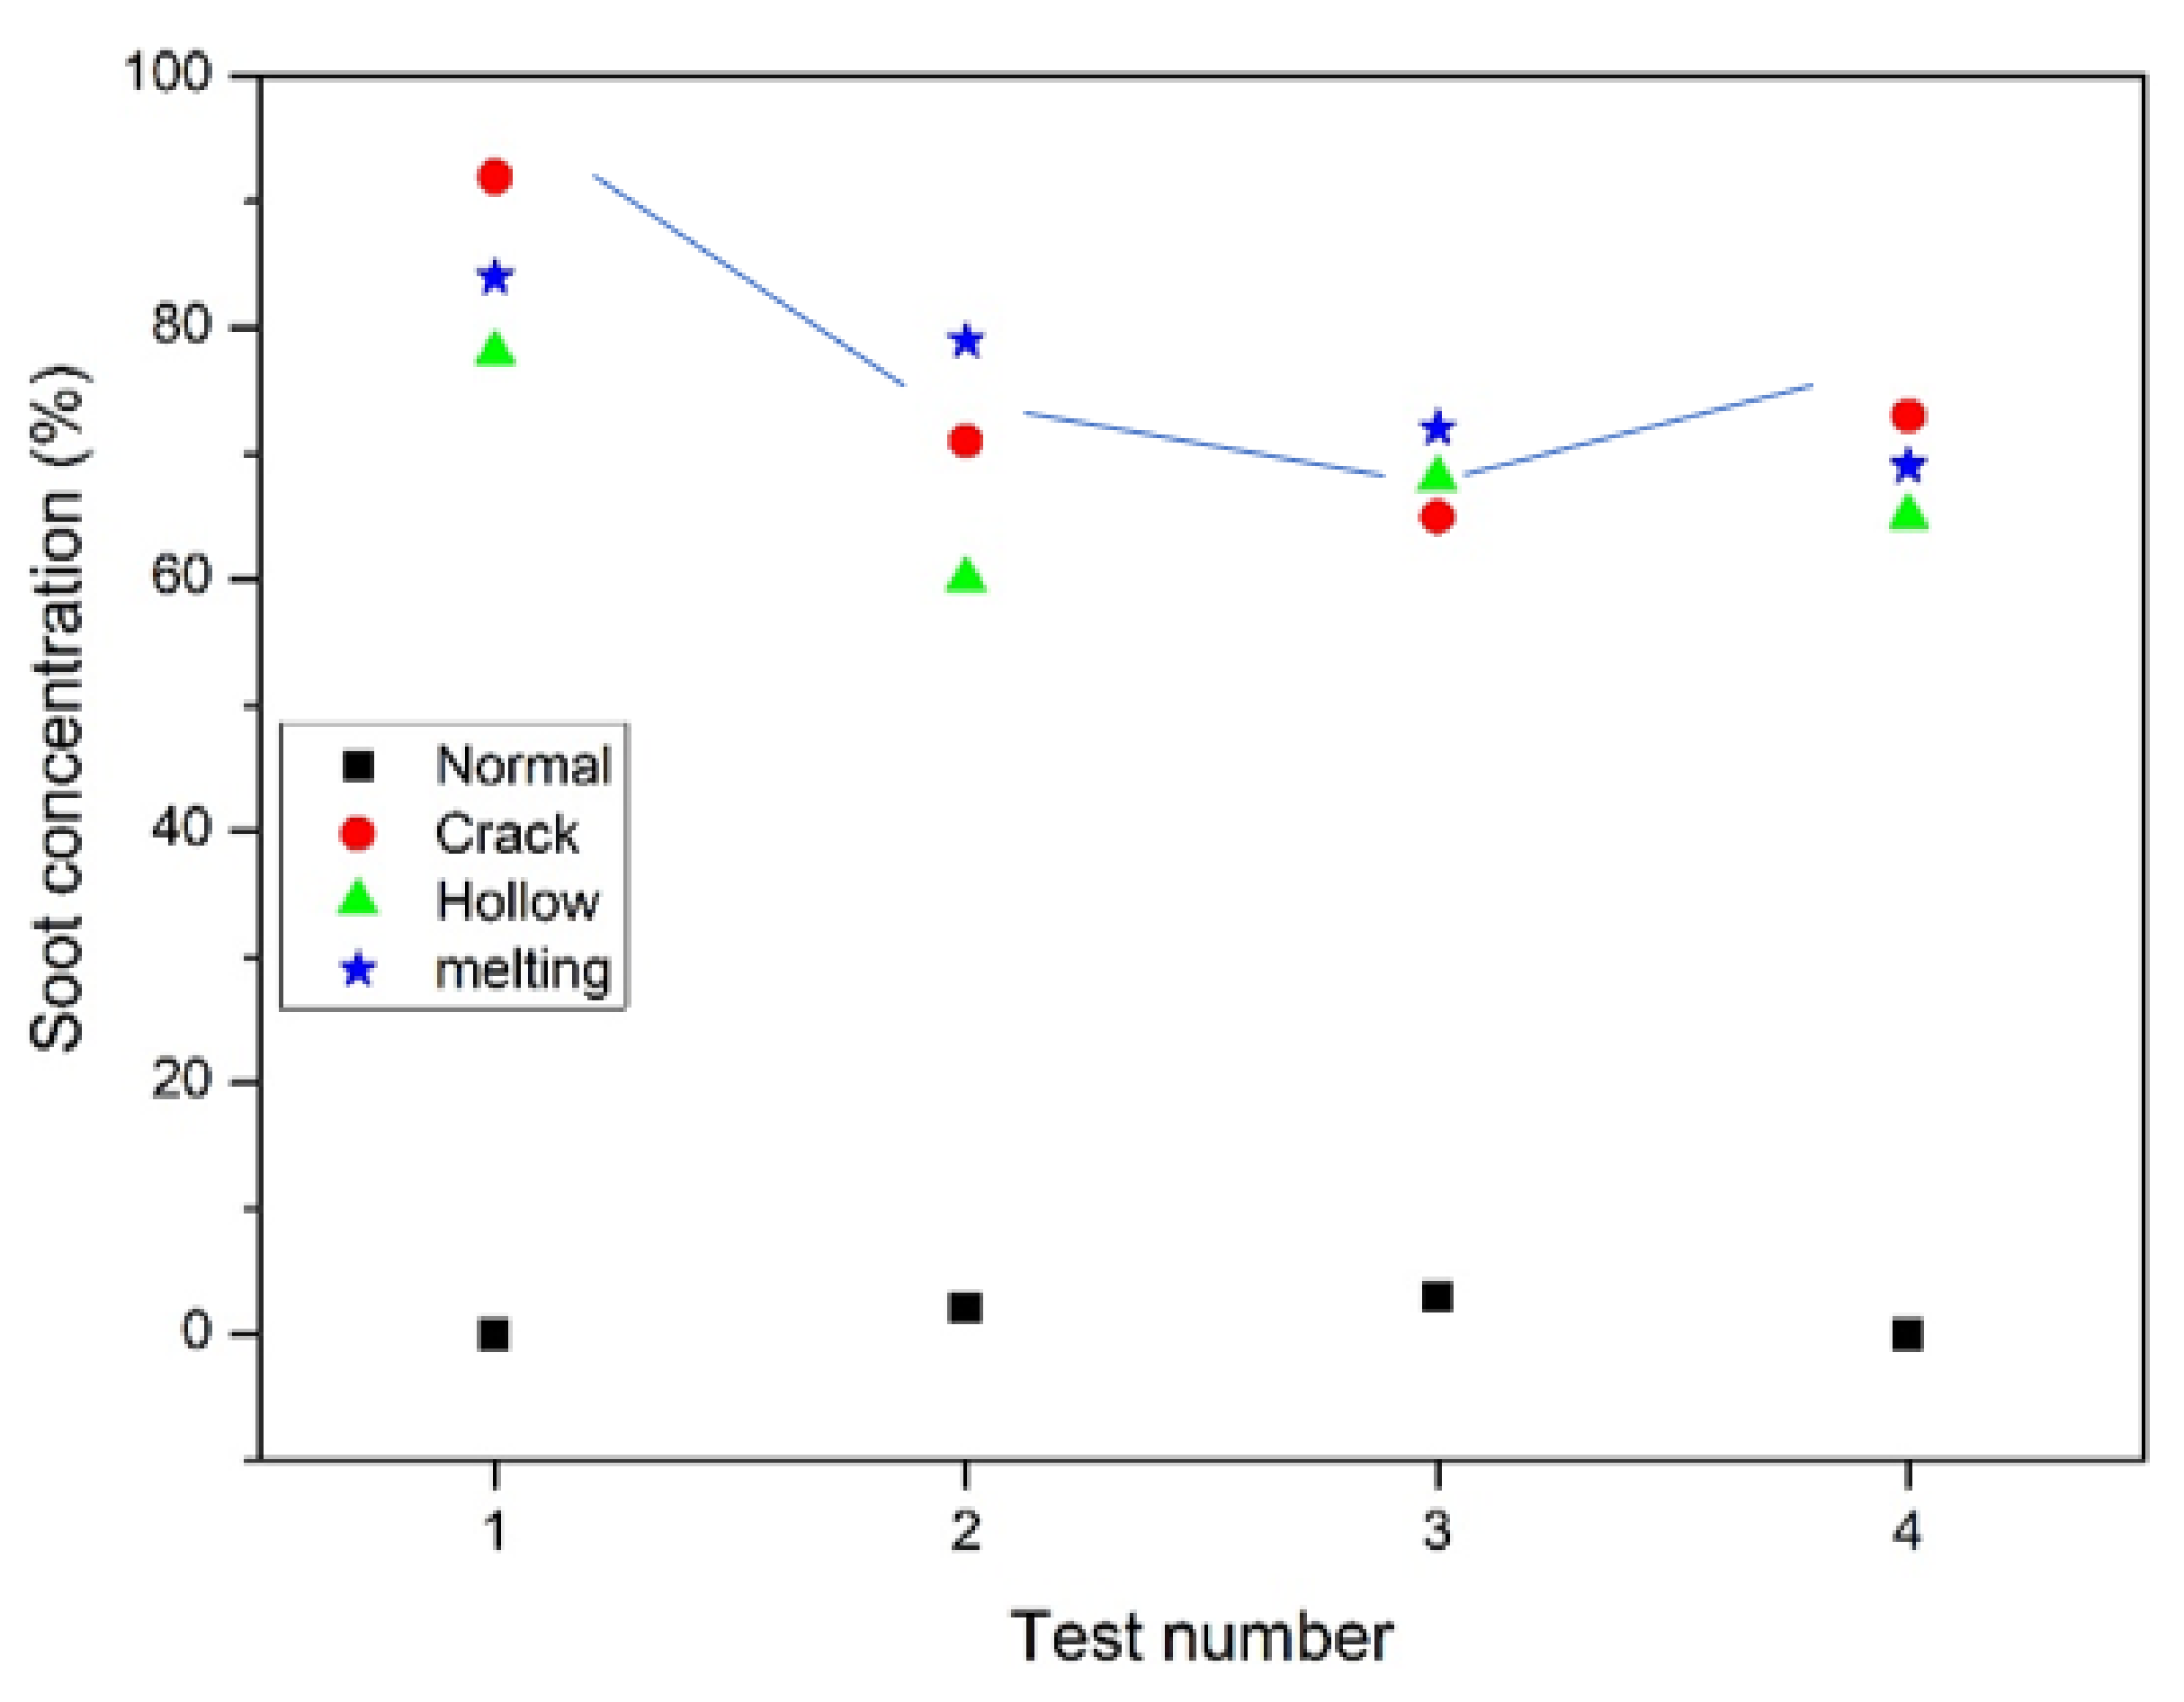
  • In the case of the normal DPF device, the emissions were less than 10% of the permissible exhaust emissions for diesel vehicles in Korea. Meanwhile, the emissions with each of the three damaged DPFs exceeded this value.
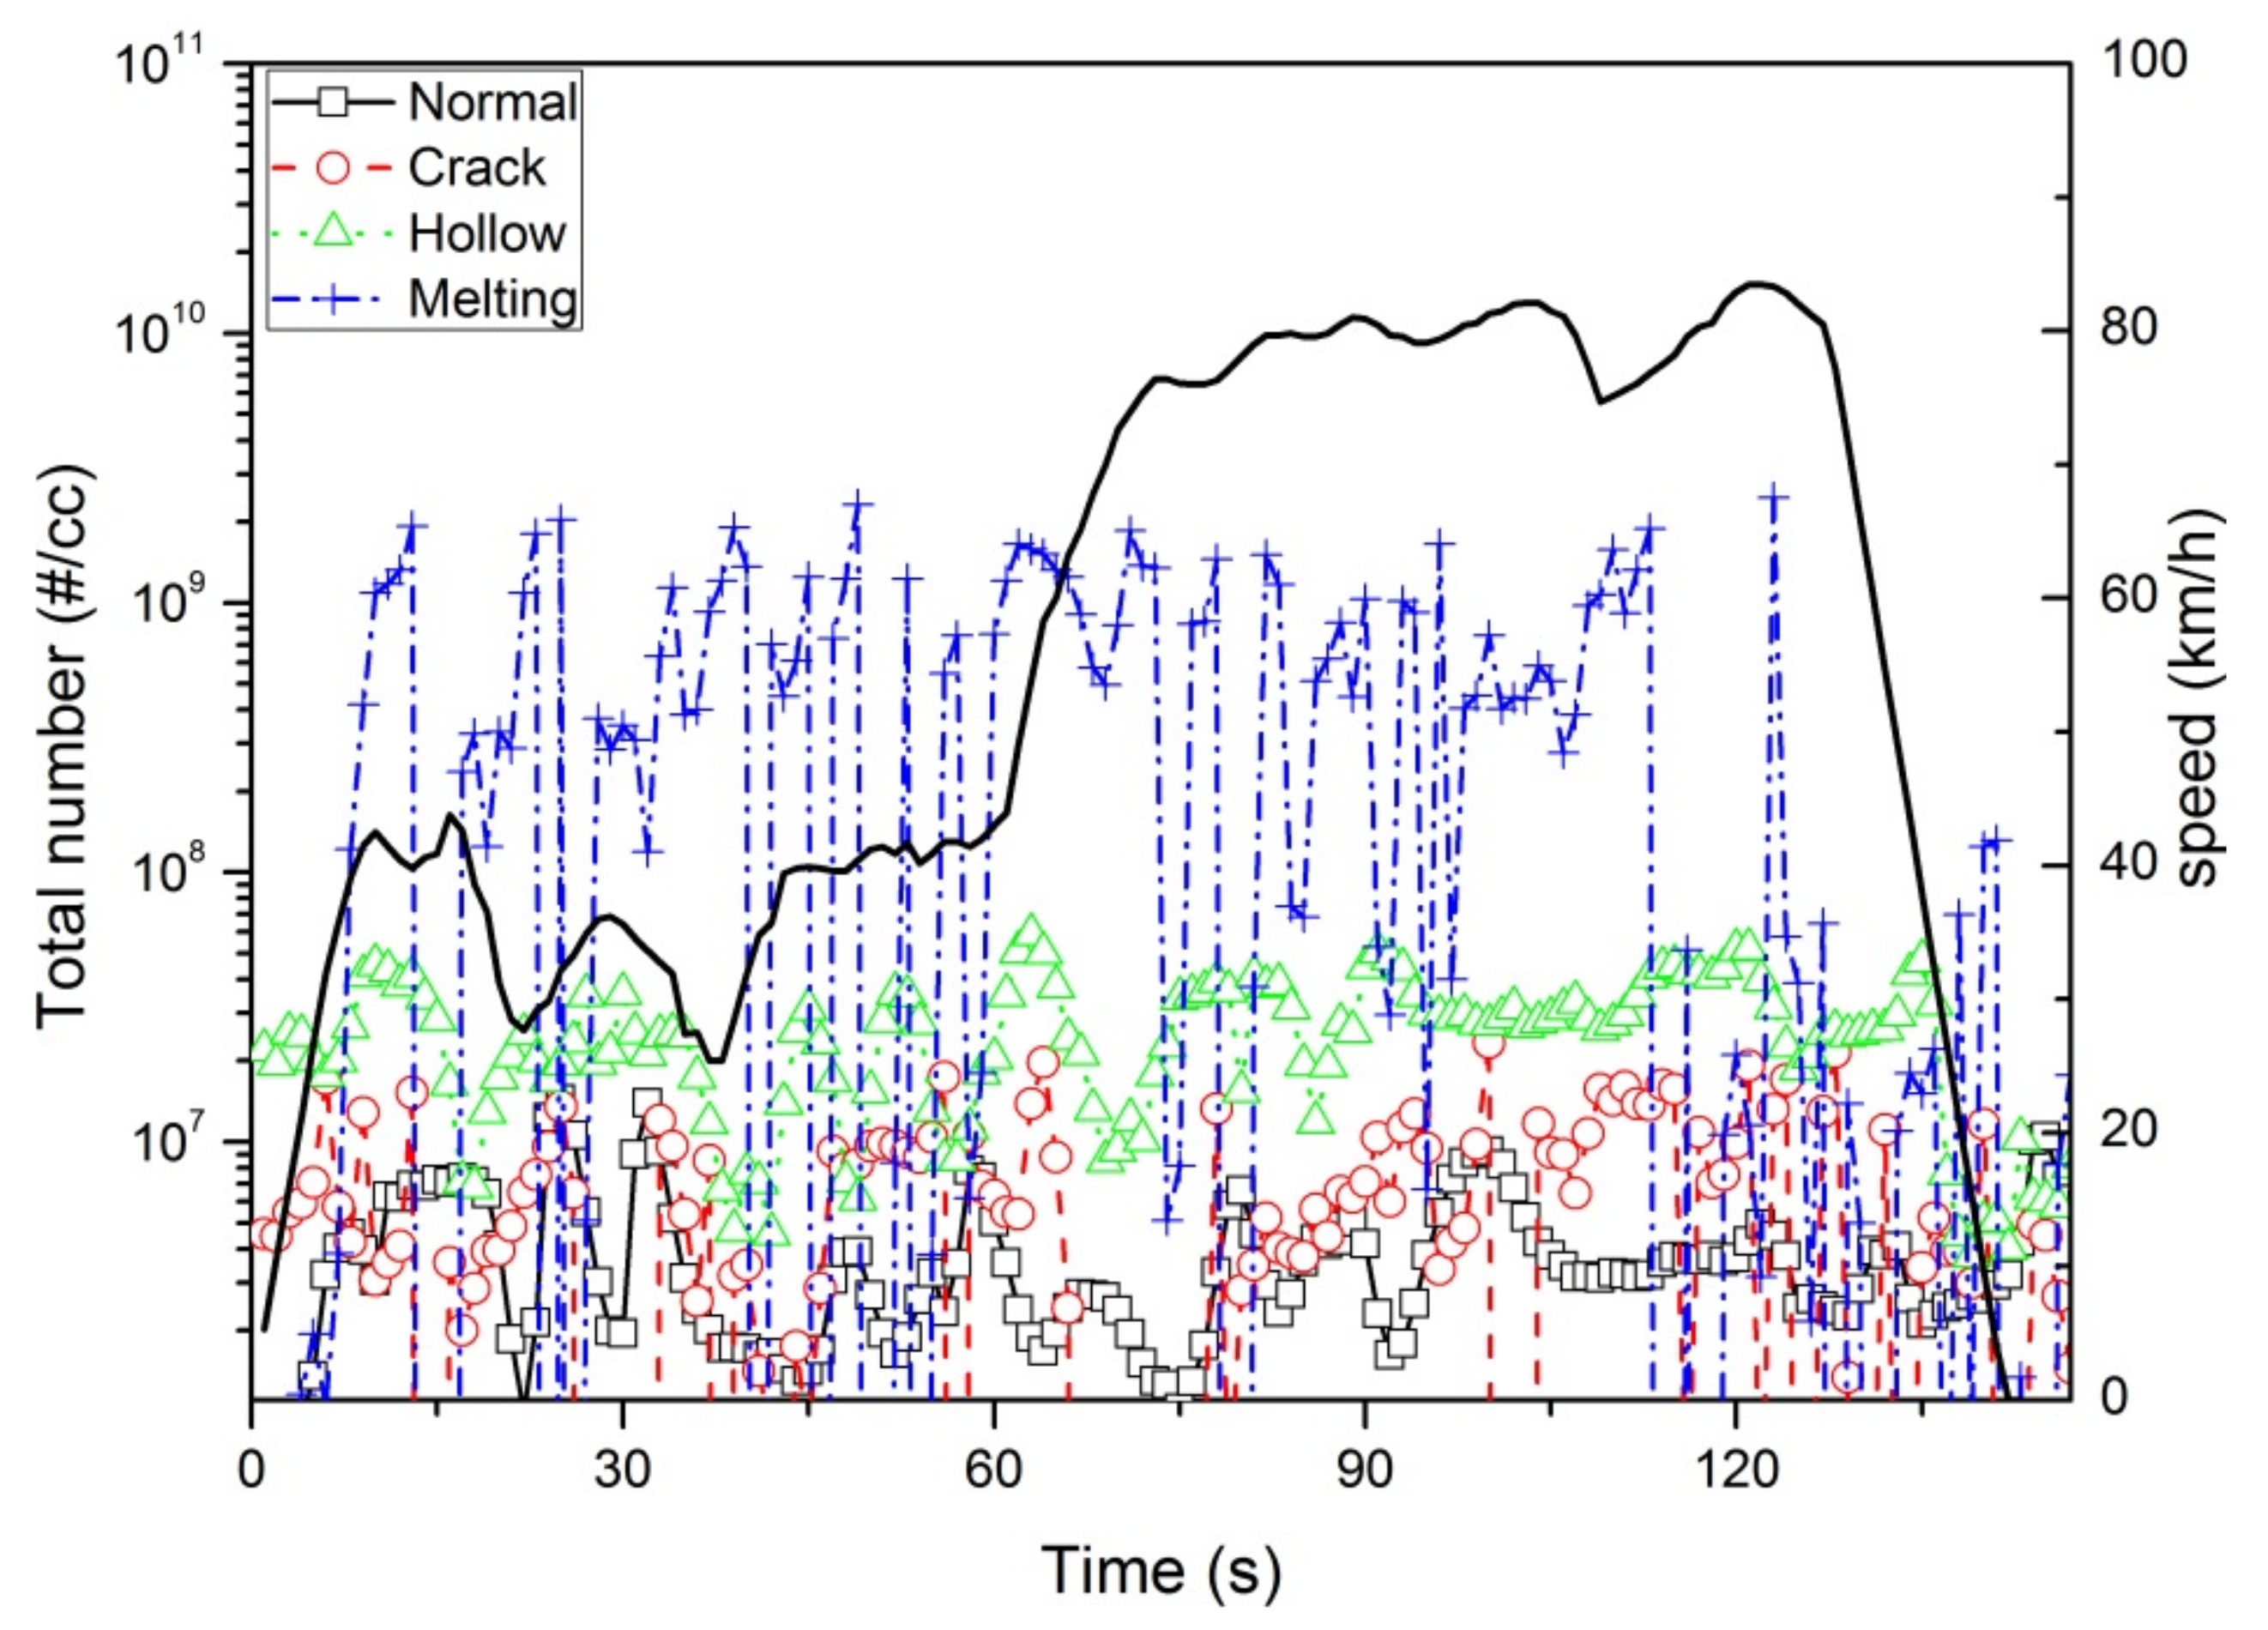
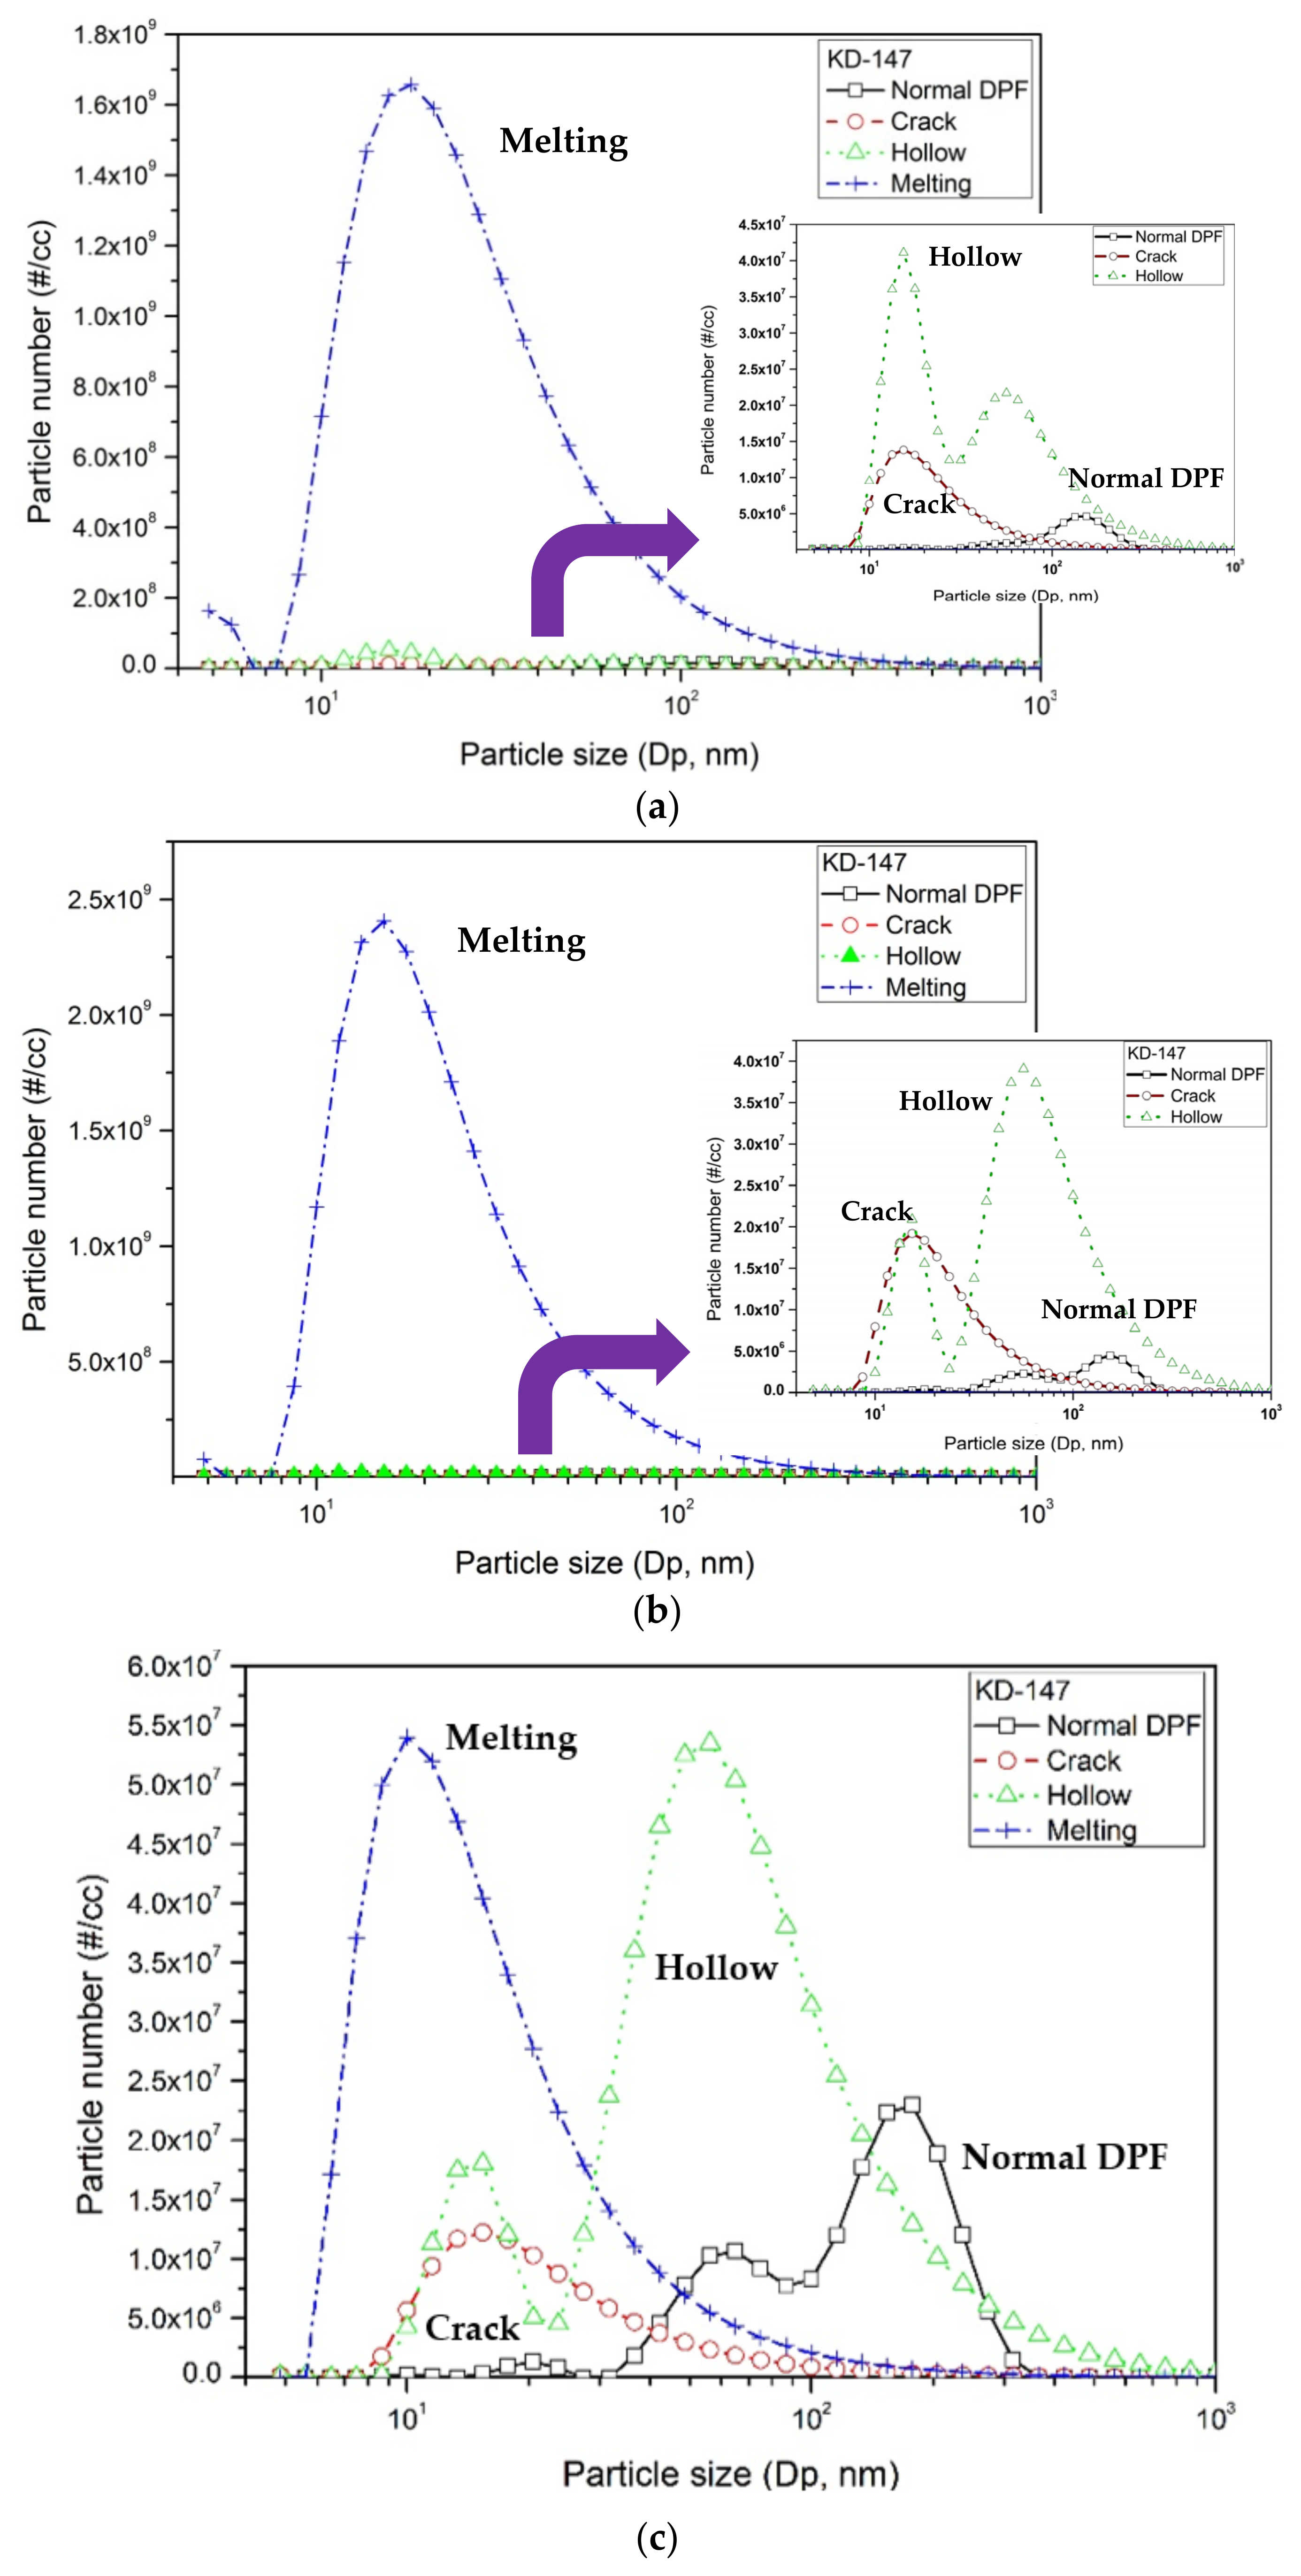
  • At particle number and size concentration, the normal DPF sample showed the lowest maximum number of total particle emission levels (within 107). Meanwhile, the crack- and hollow-damaged DPF samples showed total PN emission levels within 108. The melting-damaged DPF continuously emitted the largest number of nanoparticles (of the order of 109 #/cc) regardless of the vehicle driving speed in the KD-147 driving mode. The normal DPF also emitted a significant number of nanoparticles with sizes of at most 23 nm.
  • Finally, the OBD-based algorithm to determine whether a DPF is damaged was developed from the airflow mass, boost pressure, and VGT actuator control duty data measured by the GDS diagnostic as comparable signals. It is anticipated that prior to obtaining an X-ray image to determine whether the DPF is damaged, it can be primarily selected using the algorithm developed in this study.
The EURO-7 environmental regulation necessitates the installation of a DPF device for diesel-fueled vehicles. In certain DPF-equipped vehicles, the filter may cause problems depending on the driving conditions and durability. In this case, it is inefficient to perform an X-ray inspection on all vehicles. Therefore, it is more efficient to filter out vehicles with problems in advance by using the DPF device, and to perform an X-ray inspection on only these vehicles. In this respect, the results of this study are highly effective. Based on these results, future research could analyze the characteristics of various combinations of DPF and selective catalytic reduction systems.

Author Contributions

Conceptualization, J.L.; methodology, J.L. and I.C.; project administration, J.L.; supervision, J.L.; validation, J.L.; writing—review & editing, J.L.; investigation, I.C., I.M., D.K. and T.P.; data curation, I.C.; formal analysis, I.C.; writing—original draft preparation, I.C.; writing—review & editing, I.M., D.K., T.P., D.L. and J.L. All authors have read and agreed to the published version of the manuscript.

Funding

This research was funded by an R&D project (2022) of the Korea Environmental Industry & Technology Institute (grant number: 2020003070001) in the Republic of Korea (Ministry of Environment).

Institutional Review Board Statement

Ethical review and approval are not applicable for this study not involving humans or animals.

Informed Consent Statement

Informed consent was obtained from all subjects involved in the study.

Data Availability Statement

The data presented in this study are available on request from the corresponding author.

Acknowledgments

This research was supported by an R&D project (2022) of the Korea Environmental Industry & Technology Institute (KEITI) in the Republic of Korea. We thank Kookmin University for the cooperation.

Conflicts of Interest

The authors declare no conflict of interest.

References

  1. Zoldy, M.; Szalmane Csete, M.; Kolozsi, P.P.; Bordas, P.; Torok, A. Cognitive Sustainability. Cogn. Sustain. 2022, 1, 1. [Google Scholar] [CrossRef]
  2. Cloudt, R. Diagnostics development for cost-effective temperature sensor based particulate matter OBD method. SAE Int. J. Passeng. Cars-Electron. Electr. Syst. 2014, 7, 573–582. [Google Scholar] [CrossRef]
  3. Gill, S.; Turner, D.; Tsolakis, A.; York, A. Understanding the Role of Filtered EGR on PM Emissions. In SAE Technical Paper 2011-01-2080; SAE: Warrendale, PA, USA, 2011. [Google Scholar] [CrossRef]
  4. Automobile Magazine. Available online: https://www.autmag.co.kr/660 (accessed on 7 November 2021).
  5. York, A.P.; Watling, T.C.; Ramskill, N.P.; Gladden, L.F.; Sederman, A.J.; Tsolakis, A.; Herreros, J.M.; Lefort, I. Visualization of the Gas Flow Field within a Diesel Particulate Filter Using Magnetic Resonance Imaging. In SAE Technical Paper 2015-01-2009; SAE: Warrendale, PA, USA, 2015. [Google Scholar] [CrossRef]
  6. Di Sarli, V.; Landi, G.; Lisi, L.; Di Benedetto, A. Catalytic diesel particulate filters with highly dispersed ceria: Effect of the soot-catalyst contact on the regeneration performance. Appl. Catal. B Environ. 2016, 197, 116–124. [Google Scholar] [CrossRef]
  7. Di Sarli, V.; Landi, G.; Lisi, L.; Di Benedetto, A. Ceria-coated diesel particulate filters for continuous regeneration. AIChE J. 2017, 63, 3442–3449. [Google Scholar] [CrossRef]
  8. Di Sarli, V.; Landi, G.; Lisi, L.; Di Benedetto, A. Synergy Between Ceria and Metals (Ag or Cu) in Catalytic Diesel Particulate Filters: Effect of the Metal Content and of the Preparation Method on the Regeneration Performance. Top Catal. 2021, 64, 256–269. [Google Scholar] [CrossRef]
  9. Technical Bulletin: Diesel Particulate Filter Operation and Maintenance. Available online: https://www.epa.gov/sites/production/files/2016-03/documents/420f10027.pdf (accessed on 7 November 2021).
  10. Liu, S.; Lü, M. Fault diagnosis of the blocking diesel particulate filter based on spectral analysis. Processes 2019, 7, 943. [Google Scholar] [CrossRef] [Green Version]
  11. Yang, K.; Fox, J.T.; Hunsicker, R. Characterizing diesel particulate filter failure During commercial fleet use due to pinholes, melting, cracking, and fouling. Emiss. Control Sci. Technol. 2016, 2, 145–155. [Google Scholar] [CrossRef] [Green Version]
  12. Health Effects of Particulate Matter. Policy Implications for Countries in Eastern Europe, Caucasus and Central Asia. WHO. 2013. Available online: https://www.euro.who.int/__data/assets/pdf_file/0006/189051/Health-effects-of-particulate-matter-final-Eng.pdf (accessed on 3 July 2022).
  13. Moos, R. Microwave-based catalyst state diagnosis—State of the art and future perspectives. SAE Int. J. Engines 2015, 8, 1240–1245. [Google Scholar] [CrossRef]
  14. C.A.R.B. Evaluation of Particulate Matter Filters in on Road Heavy Duty Diesel Vehicle Application. 2015. Available online: http://www.arb.ca.gov/sites/default/files/2020-08/dpfeval_0.pdf (accessed on 28 July 2022).
  15. Hoepfner, A.; Roduner, C. PM Sensor Based on-board diagnosis of particulate filter efficiency. In SAE Technical Paper 2013-01-1515; SAE: Warrendale, PA, USA, 2013. [Google Scholar] [CrossRef]
  16. Ochs, T.; Schittenhelm, H.; Genssle, A.; Kamp, B. Particulate matter sensor for on Board Diagnostics (OBD) of diesel particulate filters (DPF). SAE Int. J. Fuels Lubr. 2010, 3, 61–69. [Google Scholar] [CrossRef]
  17. Premchand, K.; Raghavan, K.; Johnson, J. A modeling study of the exhaust flow rate and temperature effects on the particulate matter thermal oxidation occurring during the active regeneration of a diesel particulate filter. In SAE Technical Paper 2015-01-1044; SAE: Warrendale, PA, USA, 2015. [Google Scholar] [CrossRef]
  18. Meloni, E.; Palma, V. Most recent advances in diesel engine catalytic soot abatement: Structured catalysts and alternative approaches. Catalysts 2020, 10, 745. [Google Scholar] [CrossRef]
  19. Zandhuis, J.; Finney, C.; Toops, T.; Partridge, W.; Daw, C.; Fox, T. Nondestructive X-ray inspection of thermal damage, soot and ash distributions in diesel particulate filters. In SAE Technical Paper 2009-01-0289; SAE: Warrendale, PA, USA, 2009. [Google Scholar] [CrossRef]
  20. Nishina, S.; Takeuchi, K.; Shinohara, M.; Imamura, M.; Shibata, M.; Hashimoto, Y.; Watanabe, F. Novel nondestructive imaging analysis for catalyst Washcoat loading and DPF soot distribution using terahertz wave computed tomography. SAE Int. J. Fuels Lubr. 2012, 5, 343–351. [Google Scholar] [CrossRef]
Figure 1. Flowchart detailing this research process.
Applsci 12 07853 g001
Figure 2. Vehicle experimental schematic with after-treatment device. (a) Exhaust system with DPF device; (b) Schematic of vehicle after-treatment system.
Applsci 12 07853 g002
Figure 3. After-treatment layout with retrofit DPF system used in this study.
Applsci 12 07853 g003
Figure 4. Profile of KD-147 driving mode.
Applsci 12 07853 g004
Figure 5. Vehicle operation setting on chassis dynamometer.
Applsci 12 07853 g005
Figure 6. Schematic diagram of classifier column and charger inside DMS-500 system.
Applsci 12 07853 g006
Figure 7. Photographing of the inside of DPF using an X-ray generator.
Applsci 12 07853 g007
Figure 8. GDS raw signal measured during KD-147 driving mode for 4 types of DPF sample. (a) Normal (b) Crack (c) Hollow (d) Melting.
Applsci 12 07853 g008
Figure 9. Comparison of air-flow mass rate by GDS signal for 4 types of DPF sample. (a) Variation in air-flow mass during KD-147 driving mode (black line) (b) Difference of maximum air-flow mass value.
Applsci 12 07853 g009aApplsci 12 07853 g009b
Figure 10. Temperature variation during KD-147 driving mode (black line) at position T1 in Figure 3.
Applsci 12 07853 g010
Figure 11. Variation in soot emission during KD-147 driving mode (black line) for 4 types of DPF sample.
Applsci 12 07853 g011
Figure 12. Smoke concentration with each with various DPF samples.
Applsci 12 07853 g012
Figure 13. Total PN density during KD-147 driving mode (black line) for 4 types of DPF sample.
Applsci 12 07853 g013
Figure 14. Particle number density by particle size at three positions during KD-147 driving mode. (a) Point 1 (at 32 s) during KD-147 mode. (b) Point 2 (at 77 s) during KD-147 mode. (c) Point 3 (at 108 s) during KD-147 mode.
Applsci 12 07853 g014
Figure 15. Comparison of particle number density for 4 types of DPF sample. (a) Total particle number. (b) Particle number with nano-sized of 23 nm or less (decimal logarithm).
Applsci 12 07853 g015
Figure 16. DPF diagnosis algorithm developed in this study.
Applsci 12 07853 g016
Table 1. Engine specification of the vehicle used in this study.
Engine TypeUnitD4EA (CRDi VGT)
Type of fuel-Diesel
Rated powerPS/RPM126/4000
Displacementcc1991
DOC + DPFcpsi400 (ceramic type DOC)
200 (cordierite type DPF)
Curb vehicle weightkg1745
Gross vehicle weightkg2185
Table 2. Specification of OPA-102 for measuring diesel particulate(soot) emission.
ItemUnitParticulate (Soot) Analyzer
Target Subject%
m−1
°C
Smoke Opacity
Light extinction coefficient
Temperature (option)
Principle-Light extinction method
(Partial-flow sampling type)
LED TypenmGreen LED (565)
Detector-Photo Diode
Range%0.0~100.0 (0.00~21.42 m−1)
Accuracy%Less than 1
Table 3. Specification of DMS-500 for measuring diesel particle number density.
ItemParticle Analyzer
Particle size range5 nm~1 μm
Spectral Elements38 (1 μm) (at 16/decade, 32/decade available)
Size ClassificationElectrical Mobility
Dilution Factor Range1~6 (1st Dilution), 1~3000 (1st and 2nd)
Maximum 1st dilution/
Heated Line temperatures
150 °C
Sample Flow rate8 slpm (1 μm range), All at 0 °C + 100 kPa
Time ResponseT10–90% 200 ms (1 μm range)
Maximum Concentration≈1011 dN/dlogDp/cc (diluter on)
Table 4. Three types of DPF damage used in this study.
Damaged TypeCrackHollowMelting
PhenomenonCracked inside cordierite DPF substratesHollow failure from front to rear of DPFMelting inside DPF substrates
X-ray image captured in this study
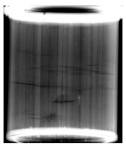
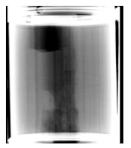
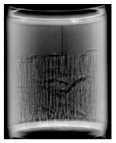
 Applsci 12 07853 i001 Applsci 12 07853 i002 Applsci 12 07853 i003
Table 5. Experimental condition.
Driving ModeMeasurement
Device
DPF
Sample
Number of
Experiment
KD-147 cycleGDS
OPA-120
DMS-500
Normal DPF
Crack
Melting
Hollow
4 times in each DPF sample
Table 6. OBD data with GDS device for KD-147 driving test.
ParameterUnit NormalCrackHollowMelting
Air-flow massmg/stMax.1057.3956.0925.7919.3
min.246.7254.0234.3228.3
EGR ACD *%Max.95.094.094.695.0
min.5.05.05.05.0
Fuel Pressure psiMax.18,725.818,337.218,499.618,572.6
min.3842.53842.53842.53842.5
Boost PressurepsiMax.32.531.531.832.3
min.14.614.814.814.6
VGT Actuator%Max.77.876.675.475.0
min.28.525.723.623.0
* EGR ACD: EGR actuator control duty.
Table 7. Maximum value of three GDS parameters related to air quantity.
Air-Flow MassBoost
Pressure
VGT
Actuator
Normal DPF1057.332.577.8
Damaged
DPF
Crack956.031.576.6
Hollow925.731.875.4
Melting919.332.375.0
Publisher’s Note: MDPI stays neutral with regard to jurisdictional claims in published maps and institutional affiliations.

