1. Introduction
In recent years, there has been a spike in interest in exploring various environmentally friendly and renewable energy–harvesting designs that can address global energy and environmental concerns. The use of wind energy and the delivery of power for electronic devices via aeroelastic vibration has been studied. Some researchers have focused on collecting aeroelastic energy from aerofoils, while others have concentrated on converting energy created by vortex-induced vibrations (VIV). VIV is an energy harvesting method that uses the vortex shedding phenomena, in which an oscillating lift force is applied to a body, and the interaction between the fluid and the solid structure, which in practice is an elastic structure, allows engineers to generate electricity [
1]. The VIV of a structure is often related to various engineering problems. For example, VIV can cause vibrations in heat exchanger tubes and change the dynamics of riser tubes that convey oil from the seabed to the surface. VIV also has ramifications for marine and land vehicle design and causes large-amplitude vibrations in anchored structures in the ocean. On the positive side, a long cylinder mounted on a flexible structure can be used to gather energy created by VIV. The cylinder is susceptible to vortices that regularly shed, causing transverse vibrations. The vibrations can then be transformed into electric power using piezoelectric generators mounted on the cylinder. Most VIV harvesters have a narrow output band around wind speed, where the structure’s inherent frequency equals the vortex shedding frequency.
The presence of real-world scenarios such as the vibrations of offshore structures and riser pipes, building vibrations, and fluid movement in a heat exchanger, among others, has generated interest in studying VIV. VIV was initially thought to have harmful effects. The viscous effects of a fluid flowing over a cylindrical body, for example, separate it from the surface. When the liquid separates from the surface, new forces emerge on the surface, which are large enough to cause the structures to vibrate, triggering them to break. A thorough understanding of the nature of VIV from a design standpoint is required to use these vibrations to create energy and avoid technical failures. While aeroelastic resonance is considered a nuisance, it provides the technological underpinning of wind energy conversion.
Over the last two decades, several researchers have investigated the problem of harvesting energy from flow-induced vibrations [
2,
3]. In an experimental context, Li et al. [
4] examined a bio-inspired leaf architecture that transfers wind energy into usable electric power. In addition, energy harvesting devices were proposed by Abdelkefi et al. [
5] and Jung and Lee [
6] employing piezoelectric and electromagnetic transduction technologies with vibrations produced by wake galloping.
Lock-in or synchronization of VIV happens when one of the inherent frequencies of the dynamic design equals the frequency of vortex shedding, resulting in vortex-induced vibrations (VIVs). Through experiments, Akaydin et al. [
7] employed flexible piezoelectric material under VIV for energy gathering. Mehmood et al. [
8] investigated energy harvesting from circular cylinder VIV. Abdelkefi et al. [
5] investigated the effects of Reynolds number and electrical load resistance on the lock-in zone as well as the performance of the energy harvester. Finally, Akaydin et al. [
9] conducted another experiment in which the energy harvester’s output performance was investigated by altering the flow speed and testing the self-excited energy harvester subjected to uniform cross flows. Based on the experimental work of Akaydin et al. [
9], Dai et al. [
10] developed a theoretical distributed-parameter model and used the Euler–Lagrange method to achieve reasonable agreement with the experimental results. Another comparison study was undertaken by Dai et al. [
10] on four alternative orientations of the circular cylinder while subjected to vortex-induced vibrations, including tests for different wind speed areas for each harvester design. They also recommended the best orientations for various wind speeds. Variations in wind speed cause the obtained energy levels to drop substantially due to the restricted range of the synchronization region, which is a severe setback for energy collection. This setback restricts VIV energy harvesting’s ability to achieve efficient performance and the intended design. As a result, scientists are working on novel approaches to creating broadband energy harvesting systems susceptible to flow-driven vibrations or base harmonic excitations. The foundation of these solutions is the use of external axial loading or magnetic forces to introduce nonlinear restoration forces. These new nonlinear forces increase power generation by hardening or softening behavior, resulting in a wide range of resonant frequencies. Structures can be monostable or bistable depending on the magnitude of the force due to the buckling instability generated by these nonlinear features. The biostable structure is reported to produce broadband resonant regions for base-excited energy harvesters. Furthermore, Masana and Daqaq [
11] demonstrated that multiple acceleration levels are required to activate the biostable configuration to produce too-vast broadband resonant regions. R. Naseer et al. [
12] used vortex-induced vibrations in a study in which two sets of attracting magnets were positioned so that the harvester could be buckled to extend the synchronization zone and enhance the power-collected performance level. Sun and Wang [
13] introduced magnetic force to design a bi-directional U-shaped piezoelectric energy harvester for vortex-induced vibrations. They claimed that by adding magnets to their design, significant improvement of the lock-in region and the peak voltage were noticed. Dai et al. [
14] constructed a set of representative coupled equations that account for the transverse displacement of the bluff body and the induced electromagnetic current. Nonlinear analysis was also performed in their study to investigate the effects of the electrical load resistance and wind speed on the harvester’s outputs. Marqui and Erturk [
15] analyzed two airfoil-based aeroelastic energy harvesters using piezoelectric transduction and electromagnetic induction. Adding piezoelectric and electromagnetic couplings, they investigated an airfoil with two degrees of freedom. Minazara et al. [
16] developed a piezoelectric generator that harvests mechanical vibration energy on a bicycle. Jayarathne et al. [
17] developed a vibration energy–harvesting device using the cantilever-type configuration to harvest vibration energy from vehicles. Lead zirconate titanate (PZT) was selected as the piezoelectric material.
Ishihara and Li [
18] investigated the mechanism of suppression for VIV of circular cylinder by helical wires using the LES turbulence model. Numerical models for free-vibrating circular cylinders with and without helical wires were presented and experimentally validated. The steady and unsteady aerodynamic forces of circular cylinders with and without helical wires were examined to clarify the mechanism of VIV suppression in their study. Li and Ishihara [
19] investigated the wake galloping of tandem circular cylinders using the LES turbulence model. They proposed a numerical model for a transversely free-vibrating circular cylinder in the wake of another fixed cylinder and validated its accuracy. They also examined the flow patterns and the characteristics of wake galloping and dynamic fluid forces on the downstream cylinder to clarify the effect of mass and spacing ratios.
This paper utilizes wind energy power generation using VIV-based fluid-structure wind interaction technology to avoid the trouble-prone mechanical shafts and gears in conventional wind turbines. The rigidity of the resonant structure can be modified by applying magnetic forces to it, increasing the operational life and applicable wind speed range. The energy from the rhythmic movement can be converted into electricity using electromagnetic induction.
This paper aims to develop a VIV wind energy–harvesting device that converts mechanical energy (vibrations) to electric energy. The proposed device generates energy while utilizing aeroelastic resonance phenomena. The device is bladeless and has an elastic rod that oscillates when the frequencies of both the material of the elastic rod and the airflow become equal. The device uses piezoelectric sensors located at three different locations to harness energy. Different geometrical designs were used to gauge the performance of each and determine the optimal shape/geometrical design that may increase the harvested energy. In the following section, the design methodology of the suggested design is introduced.
2. Design Methodology
The design methodology of the proposed design can be explained in the following statements. When a steady fluid flow is applied to an elastic bluff body at high enough Reynolds numbers (Re > 100), the flow breaks from the body surface, resulting in an unsteady broad wake. Two unstable shear layers on each side of the body roll up to form vortices, which characterize the flow pattern. These vortices that were produced lead to oscillation (mechanical energy), which is then converted to electric energy through the components of the proposed energy harvesting device. The undisturbed flow speed U and the size of the cross-sectional body D are connected by the well-known Strouhal relationship, , and with a frequency of , these vortices are shed to the wake periodically. The frequency of vortex shedding increases as the flow velocity increases from zero, and there is a flow velocity at which vortex shedding has a frequency close to the body’s natural frequency of oscillations , and significant oscillations can be induced in the body for low mass and mechanical properties. When a body oscillates, it creates a complex interaction with the flow field surrounding it, which has two unique features: (i) a range of flow velocities exists where the vortex shedding frequency is synced with the oscillation frequency (lock-in regime), resulting in large oscillations; and (ii), with jumps in oscillation amplitude and the fluid forces acting on the body, the cylinder response may exhibit hysteresis. The proposed design incorporated these two qualities. However, at low wind speed, achieving a frequency where equals remains a challenge that the proposed design in this study should be able to address.
The wind flow is incompressible with constant density, and the effect of viscosity is negligible far from the walls of the VIV design in this study.
The conservation of mass and momentum equations are the most fundamental equations in every fluid flow domain. However, according to the turbulent nature of wind flow in this study, the momentum equation should be written so that the effect of turbulent stresses is considered. Therefore, the conservation of mass seen in Equation (1) and the conservation of momentum (the Cauchy equation) Equation (2) were utilized in this work, as follows:
where
is the density,
is time,
is the velocity field,
is the pressure, and
is the turbulent stress tensor and would be calculated based on the selected model in the CFD software.
Solving these equations, the Lift coefficient is attainable, which is necessary for power generation calculations as in Equation (3):
where
is lift force;
is reference area, and
is freestream velocity.
Also, the Strouhal number (
), which is mandatory for finding vortex shedding frequency, can be calculated using Equation (4).
where
St is the Strouhal number,
is the vortex shedding frequency, and
is the characteristic length.
The harvested power of the VIV device can be determined using Equation (5), considering the defined parameters and their values reported in
Table 1:
The following section provides the suggested VIV design model, including component descriptions and specifications, design calculations for the forces the device will encounter when interacting with wind, and harvested power calculations.
The Proposed VIV Design
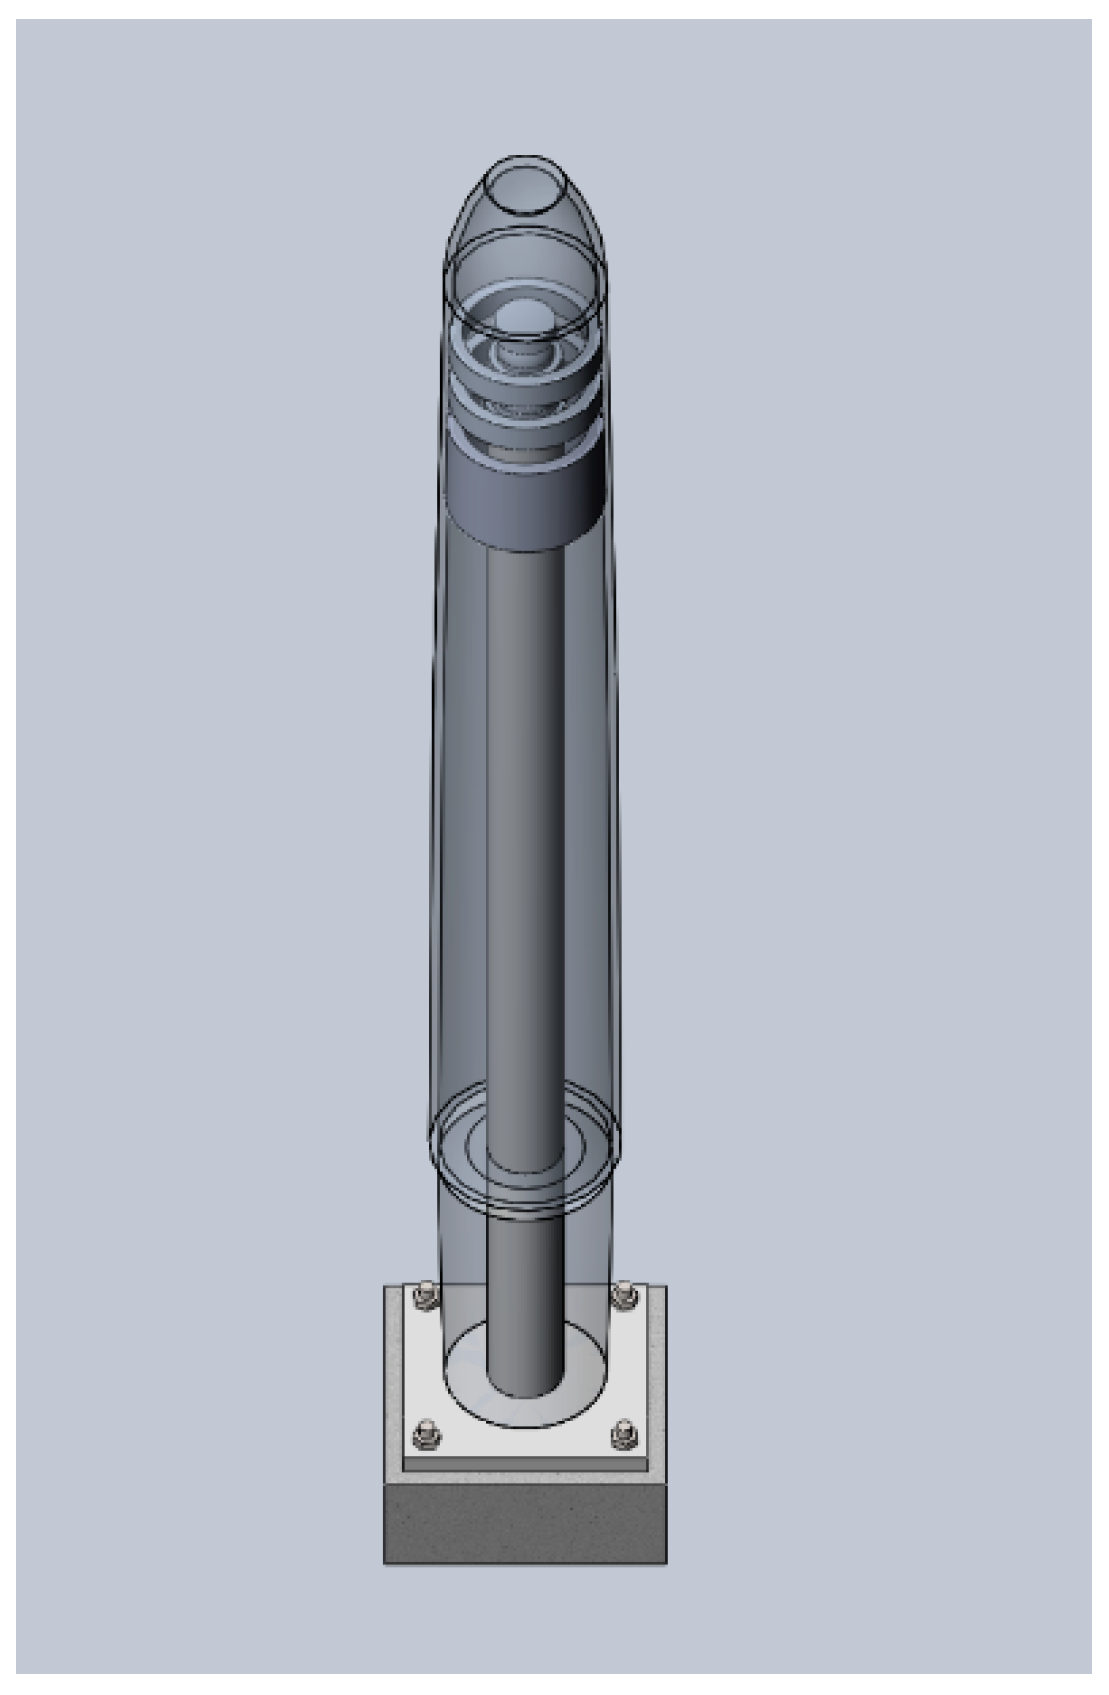
This section displays the suggested design geometry and structure. While still linked to the bottom rod, the outer cylinder should be mostly stiff and able to vibrate. The top of the cylinder is unbound, and the amplitude of its oscillations is the largest. The structure comprises polymers reinforced with carbon and/or glass fiber, commonly utilized in wind turbine blades. The mast is supported at the top of the rod, while the bottom is firmly attached to the ground. It is made of a carbon fiber–reinforced polymer with excellent fatigue resistance and minimal energy leakage when oscillating. Naturally, the design of such a wind turbine is much different from that of a traditional turbine. The energy collecting design shown in
Figure 1 is proposed in place of the typical tower, nacelle, and blades.
Table 2 displays a list of the components utilized in the proposed VIV device design, together with their descriptions and materials:
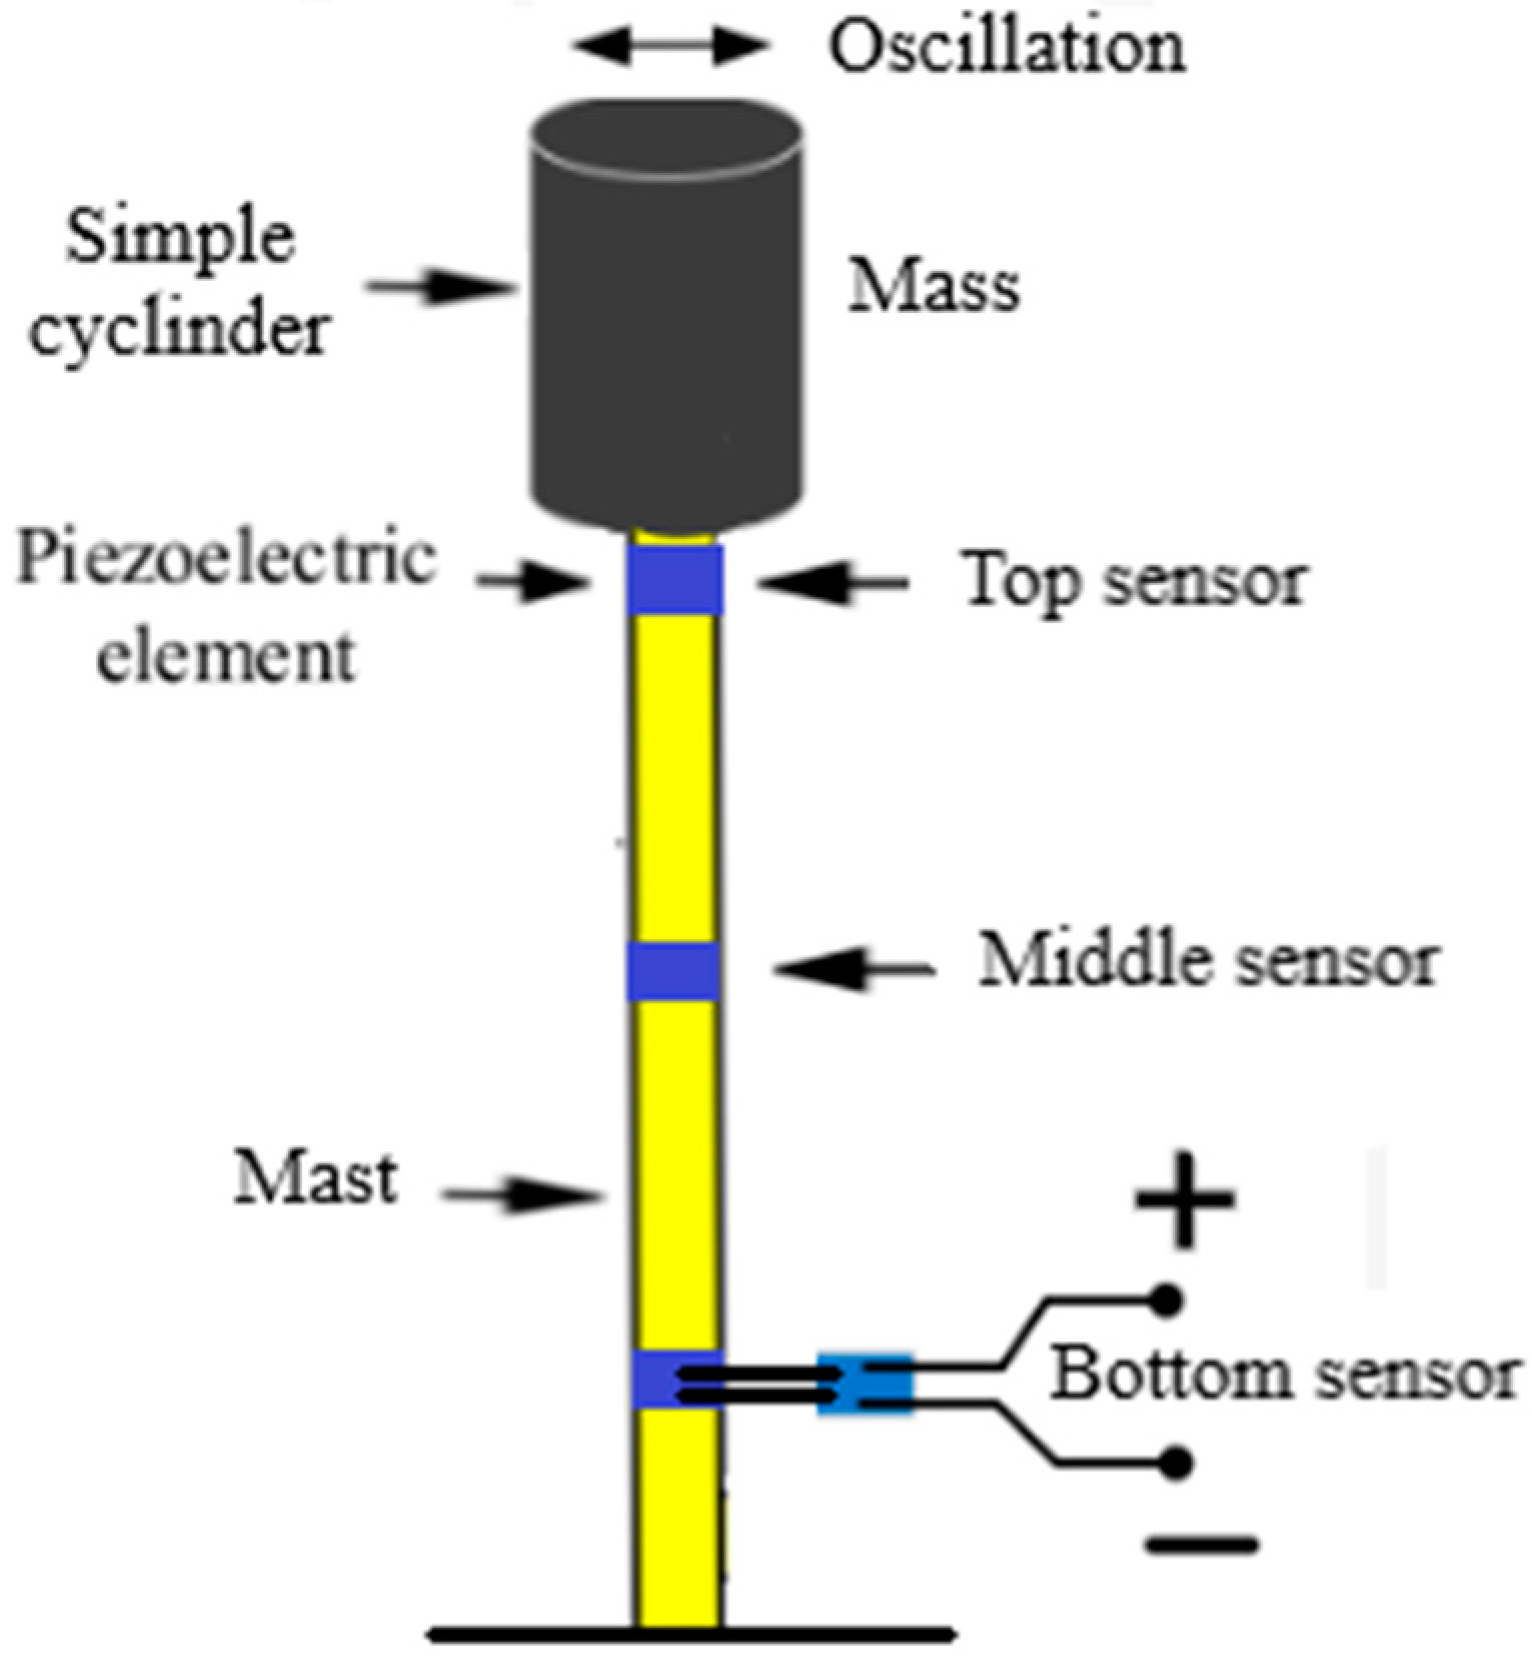
Figure 2 presents the proposed design and the locations of the piezoelectric sensors that convey readings of harnessed energy at three different locations as soon as the elastic rod starts to oscillate due to airflow–structure interactions.
Table 3 displays the sensor sensitivity information used in this work. Three sensors were mounted on each design. They were tested at room temperature (25 °C)
3. Computational Fluid Dynamics (CFD) Simulation Results
The work in this part is targeted at applying a computational fluid dynamics (CFD) approach to simulate vortex-induced vibrations of the flexible rising rods (mast). The current CFD capabilities may produce results that are reasonably close to the experimental data and may be used to calibrate existing low-order analytical models and provide a generic framework for various flow characteristics and boundary conditions. CFD flow models of numerous hollow mast designs were examined based on a theoretical review of these designs. CFD is utilized to visualize the flow patterns, while the experimental work is conducted to be able to measure the amount of harvested energy, in addition to verifying the CFD results. The following section describes the wind flow trajectories and pressure distribution on the hollow mast. Different hollow mast designs with various diameters and heights were explored, and CFD results are presented in this section.
Based on the experimental results, which showed that 15 m/s is the airflow speed where a good amount of energy can be generated, a lower wind speed of 10 m/s and a higher wind speed of 20 m/s were chosen to focus on in addition to 15 m/s. The step size of 5 m/s was chosen based on that fact that there is no significant change when the speed step size is smaller than that. In
Appendix A,
Table A1,
Table A2,
Table A3 and
Table A4 display the experimental results with a step size of 1 m/s, which proves that there is no significant change when the step size is small.
The convergence criterion should be the first thing to check the convergence of the executed simulation. It helps in understanding the global and local imbalances in an iterative way in a CFD simulation. In this paper, residuals that represent the solution imbalances were considered as the convergence criterion to check for numerical accuracy. Residuals are expected to be as small as possible to indicate the accuracy of simulations. Residuals below 1 × 10⁻³ were taken as a good starting point to move to the next check.
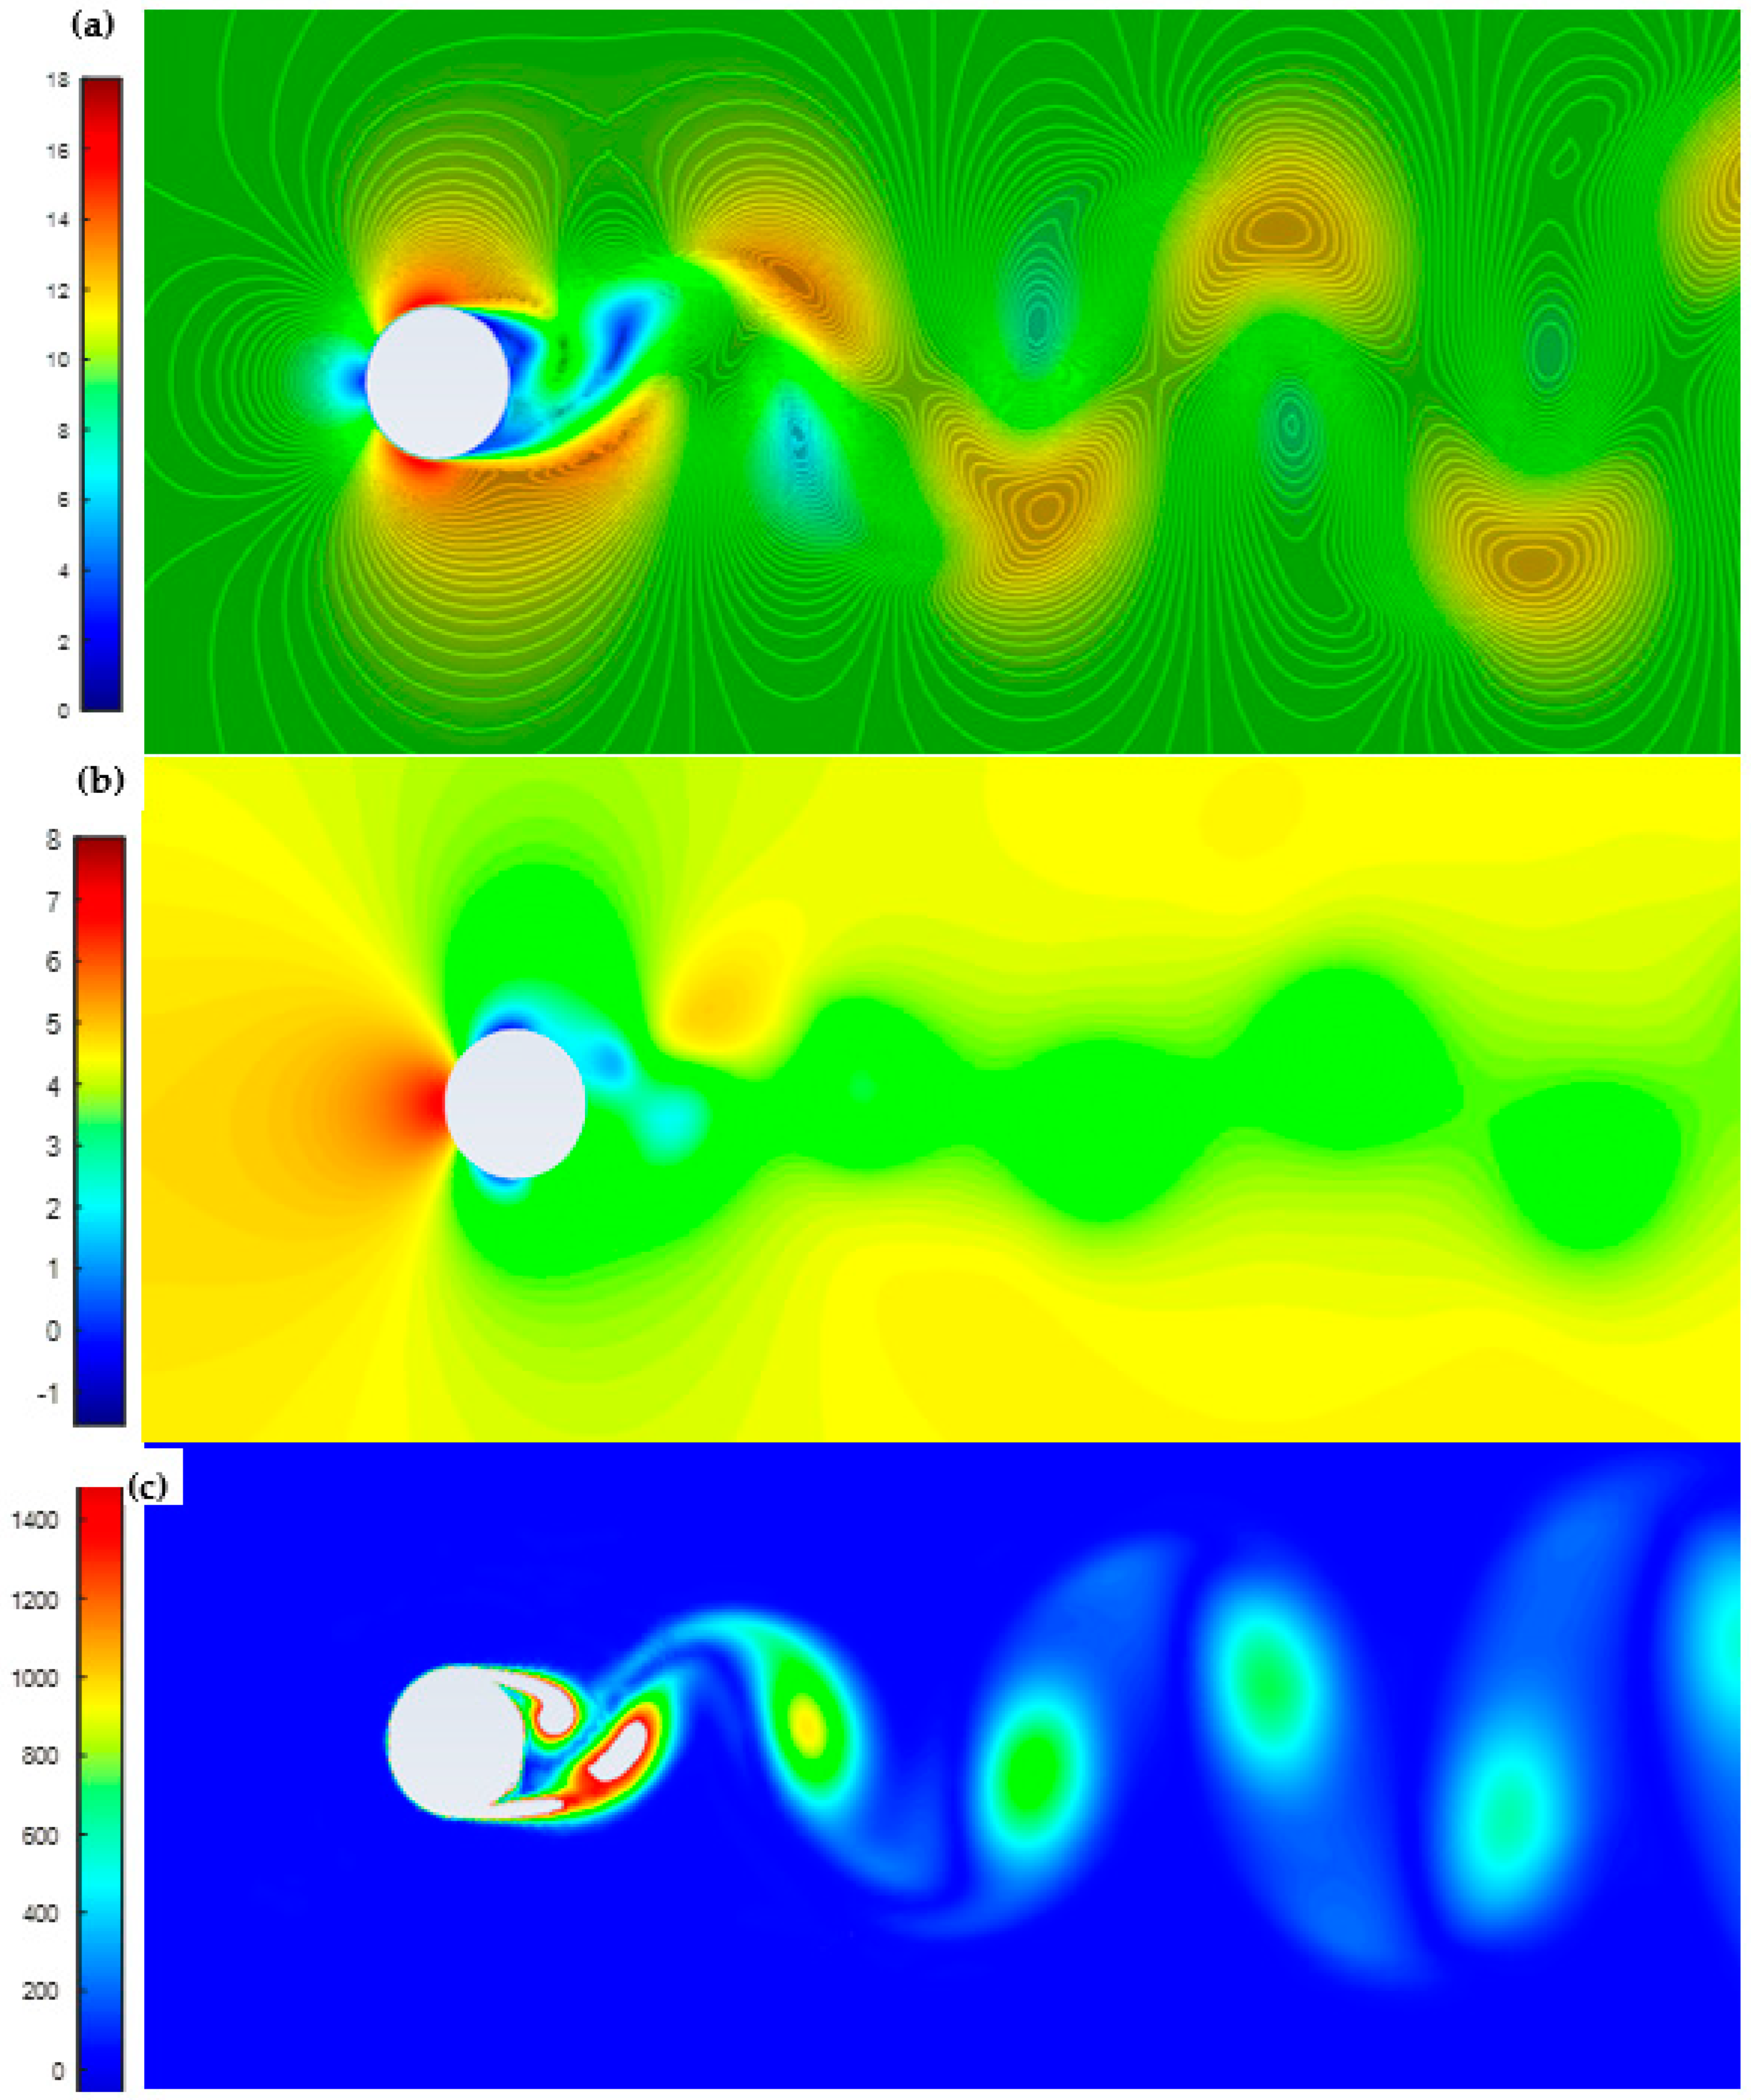
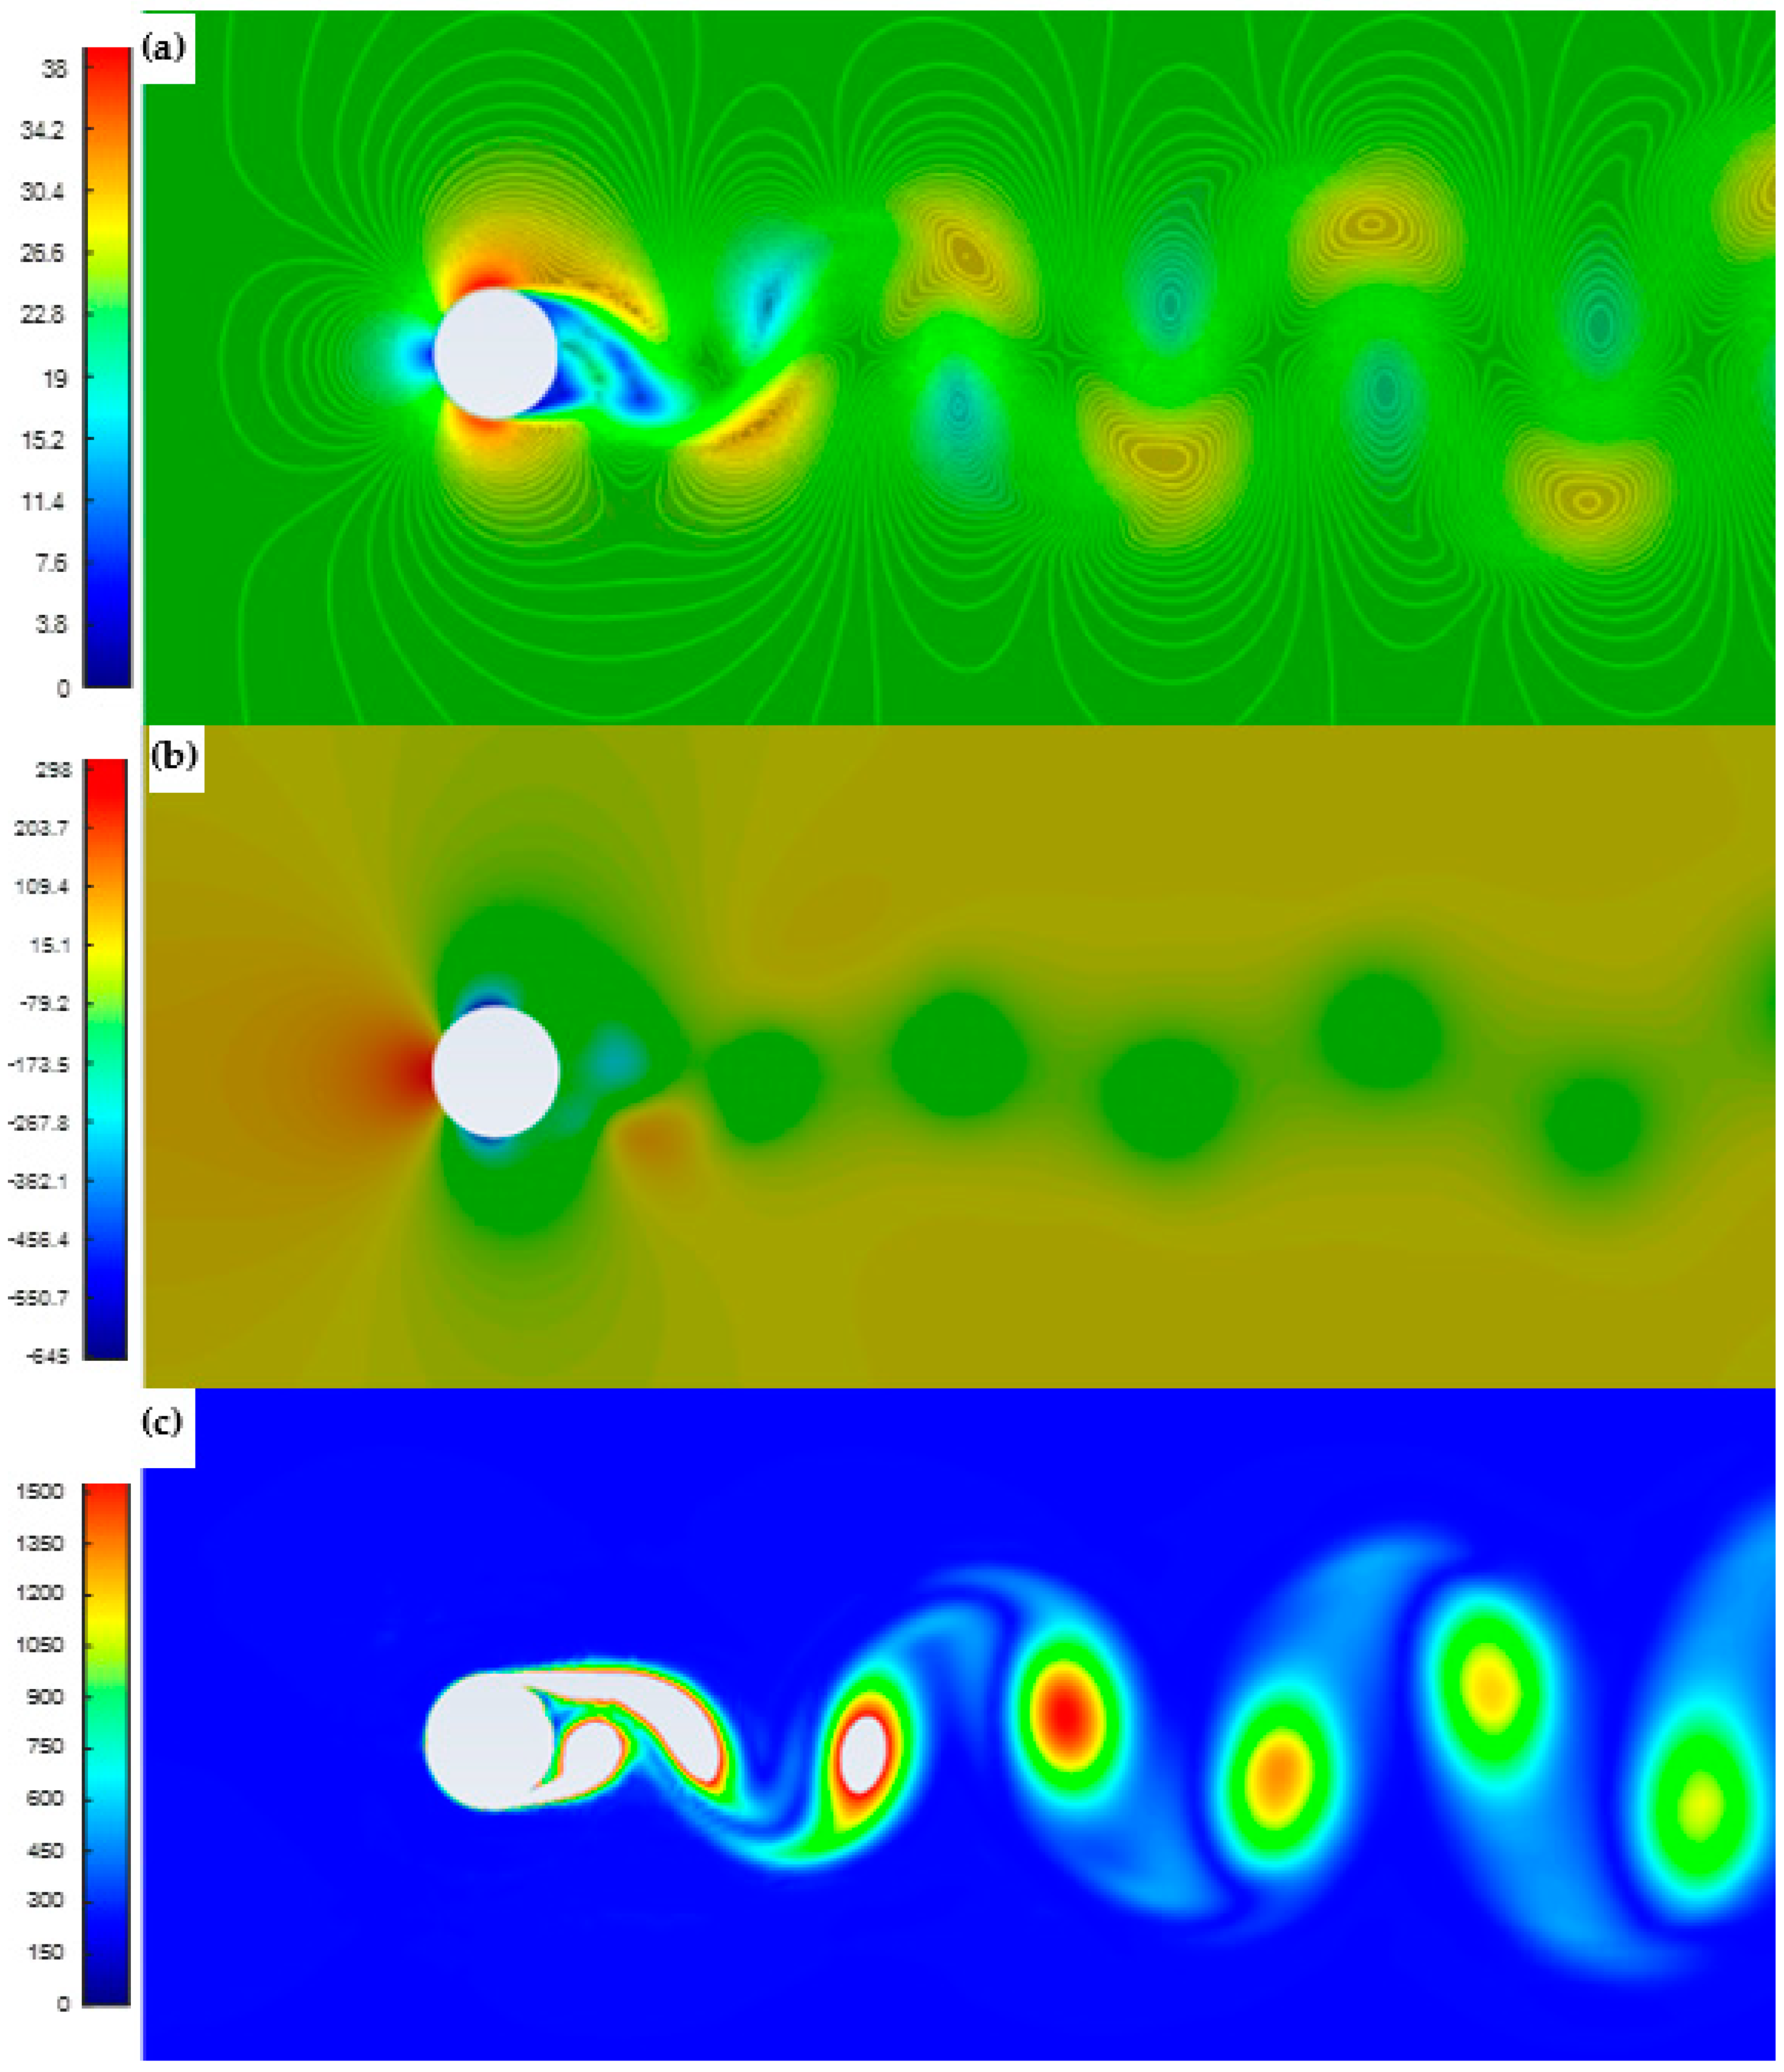
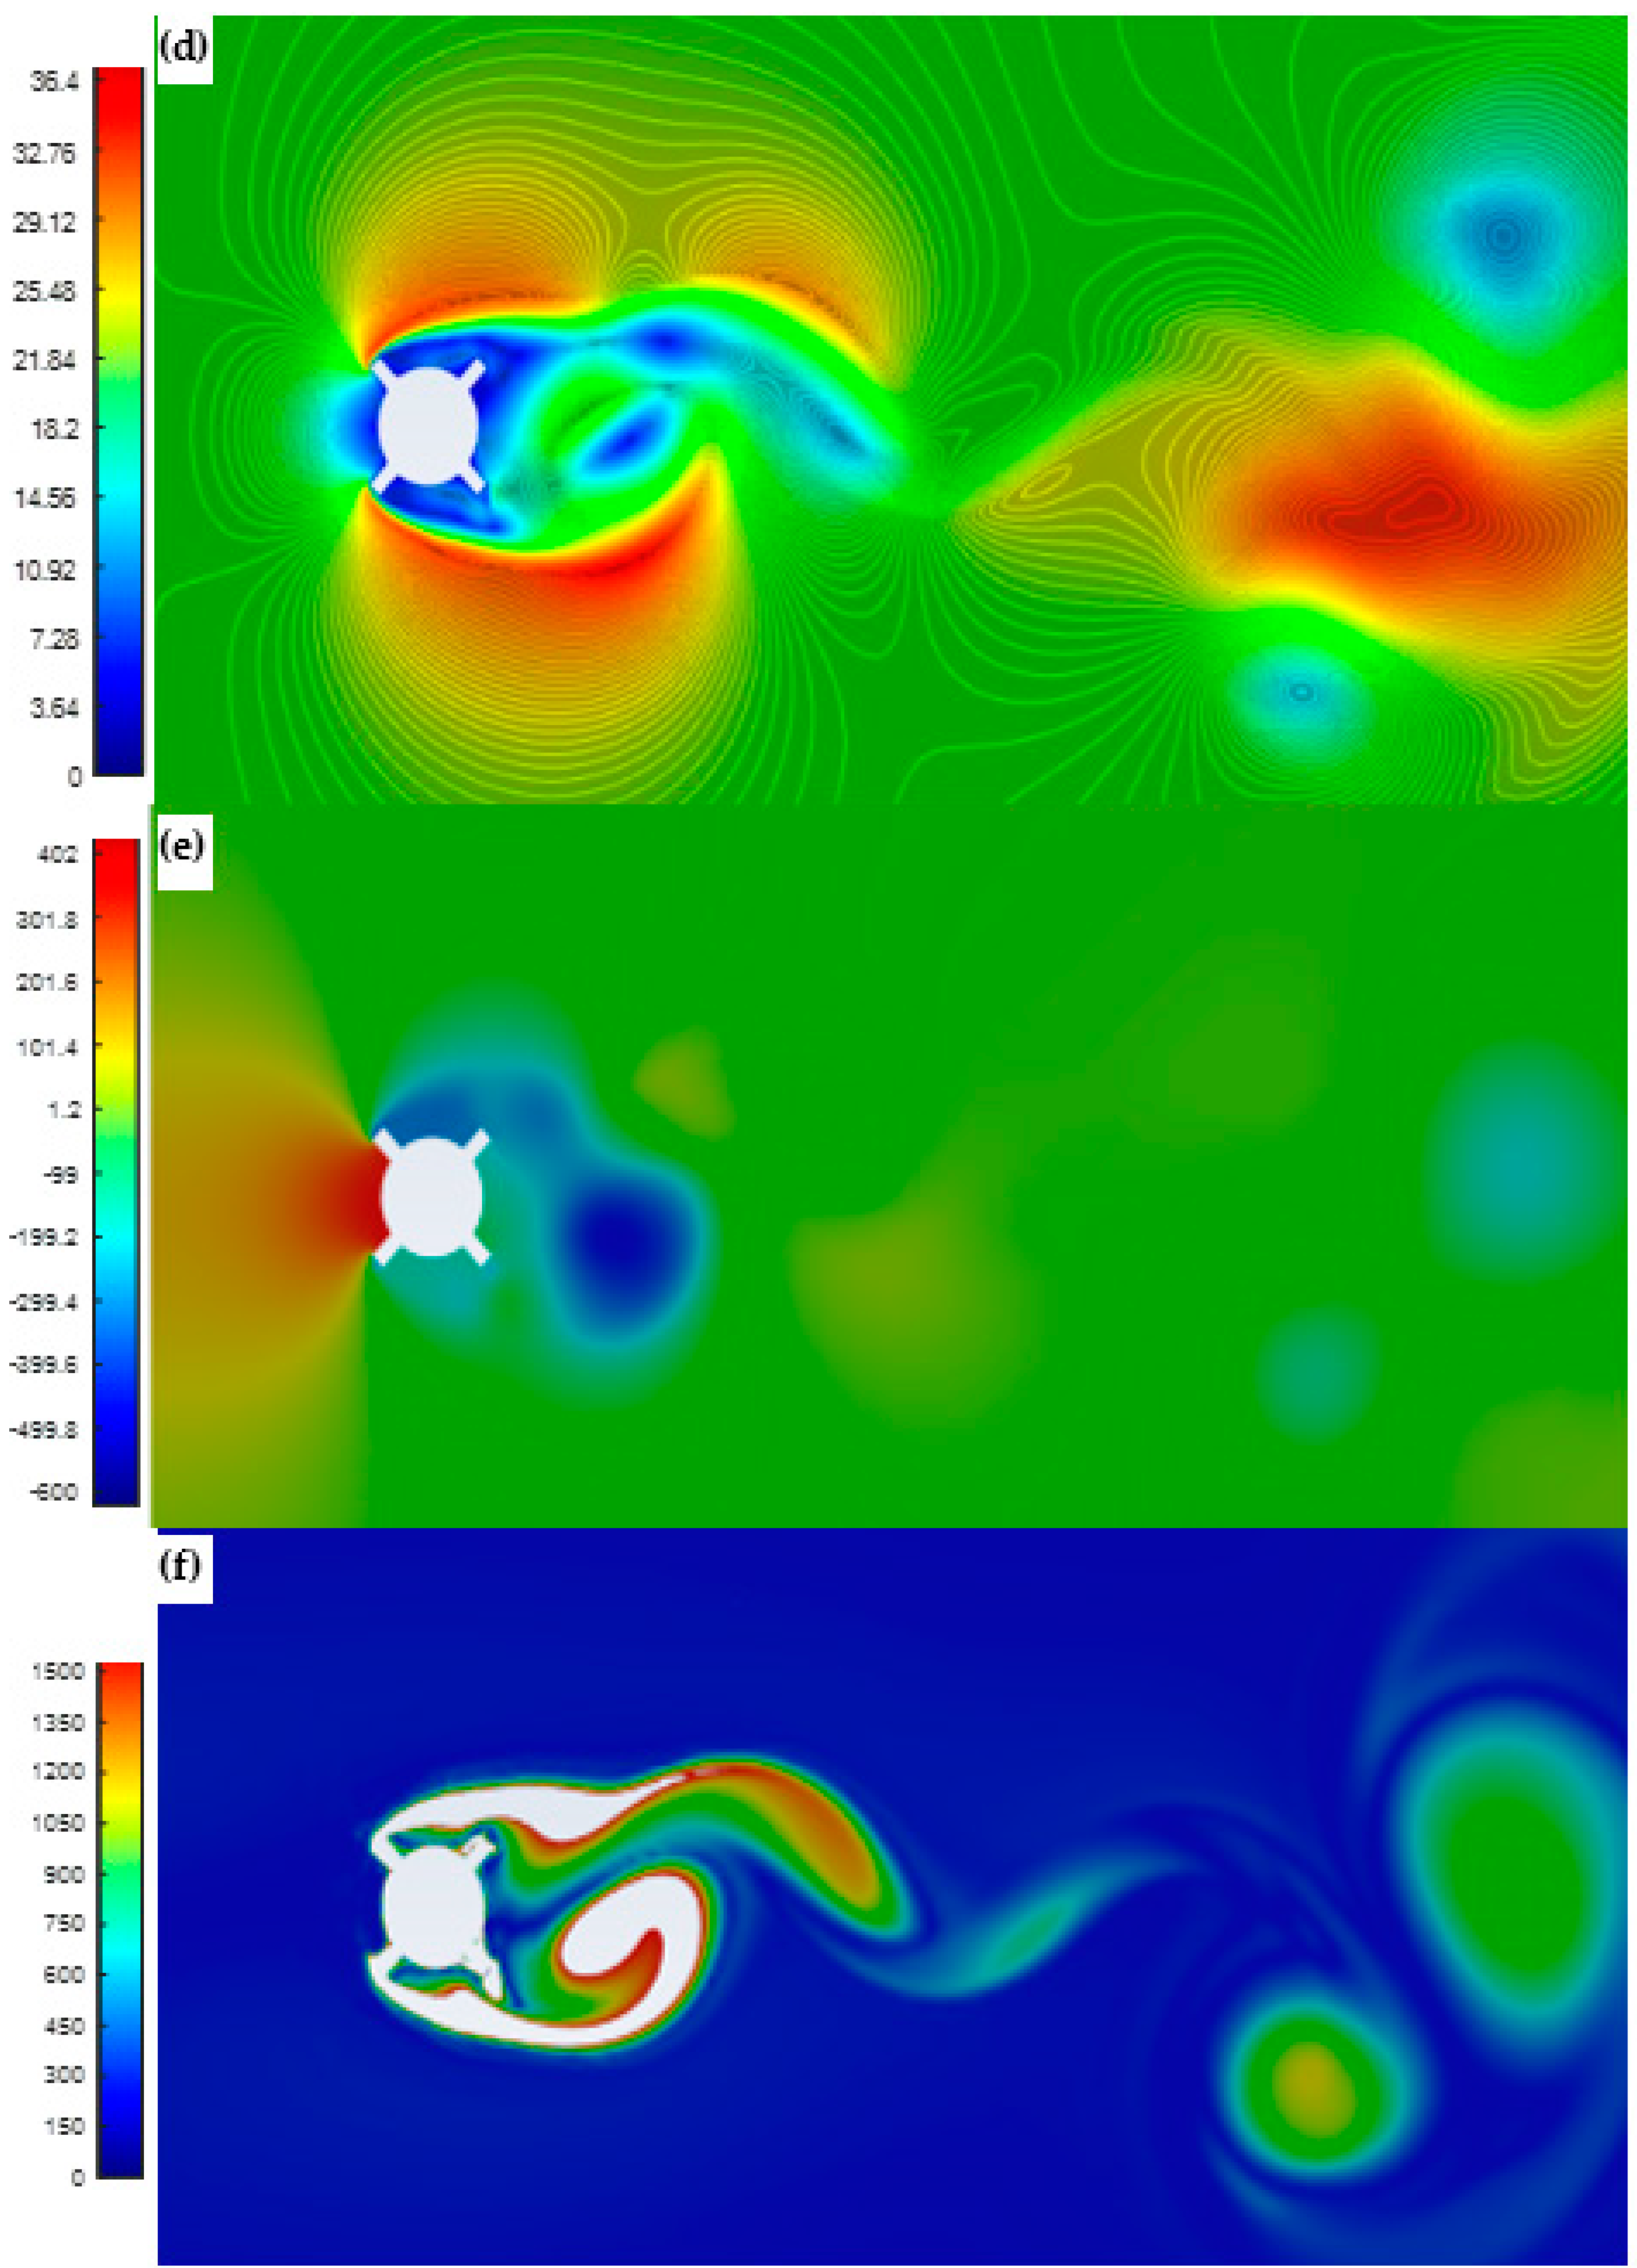
The results of the CFD simulations for two different geometries (simple cylinder and complex cylinder) at a wind speed of 10 m/s are presented.
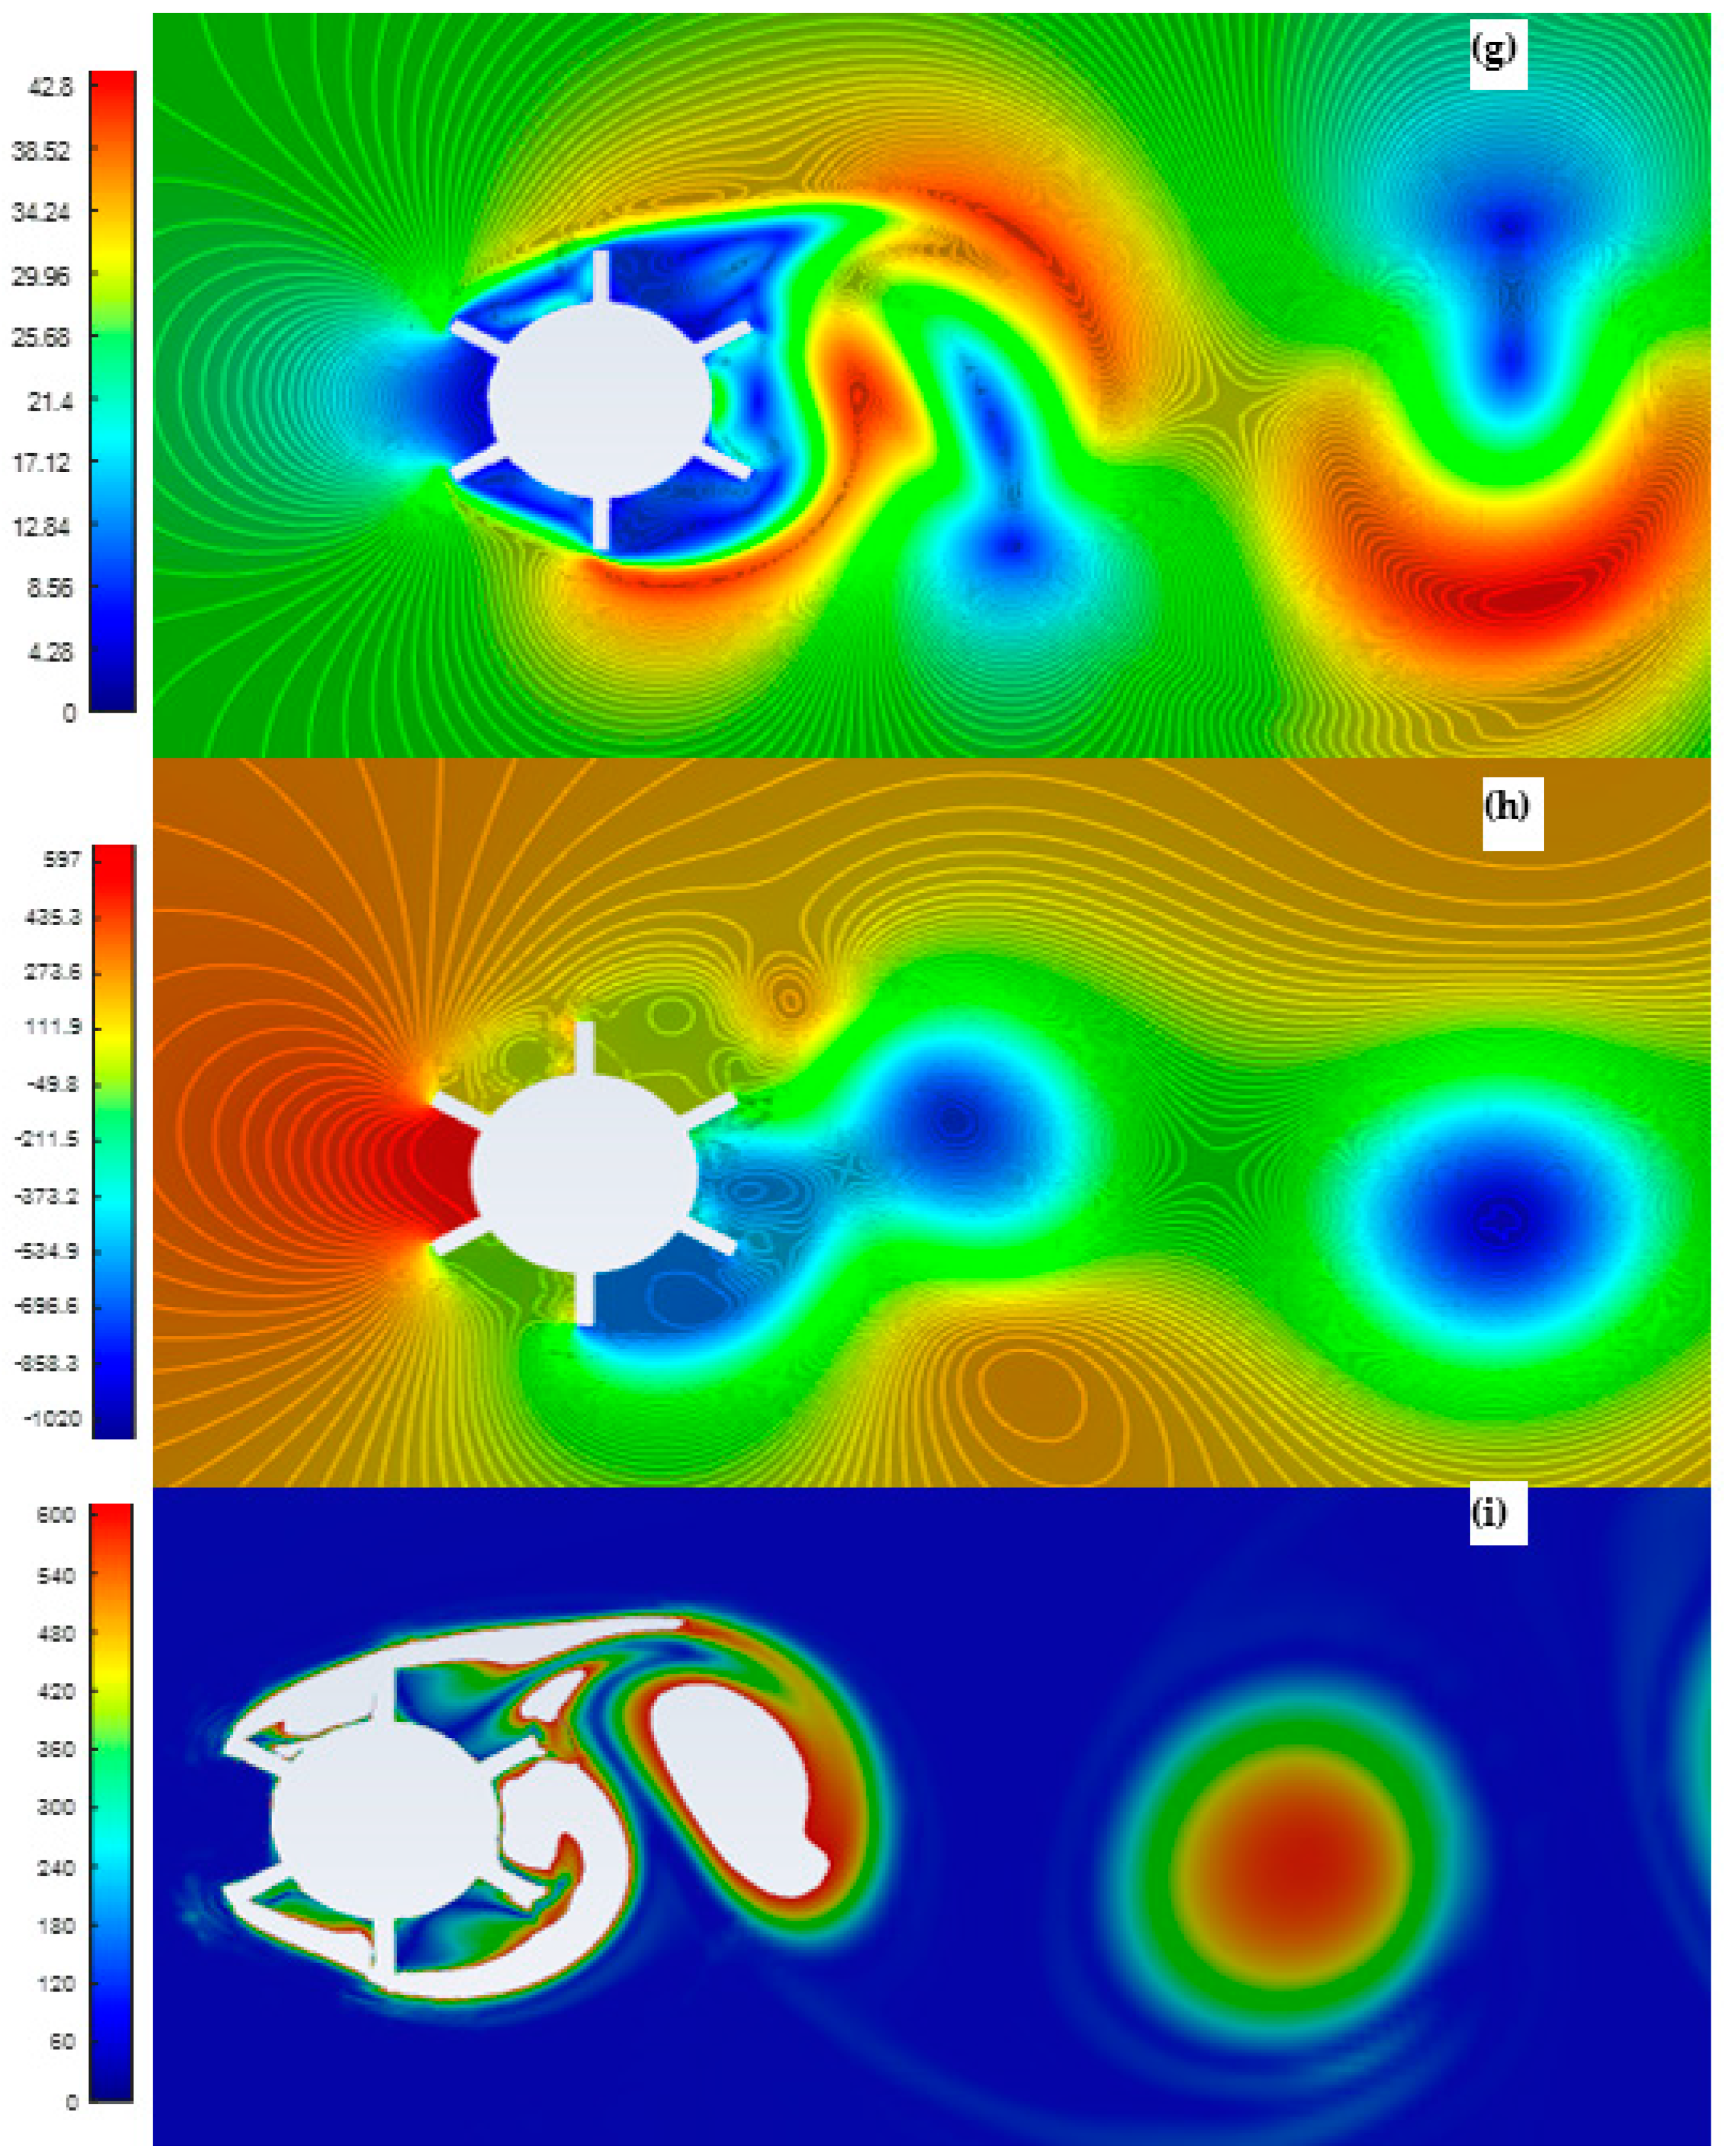
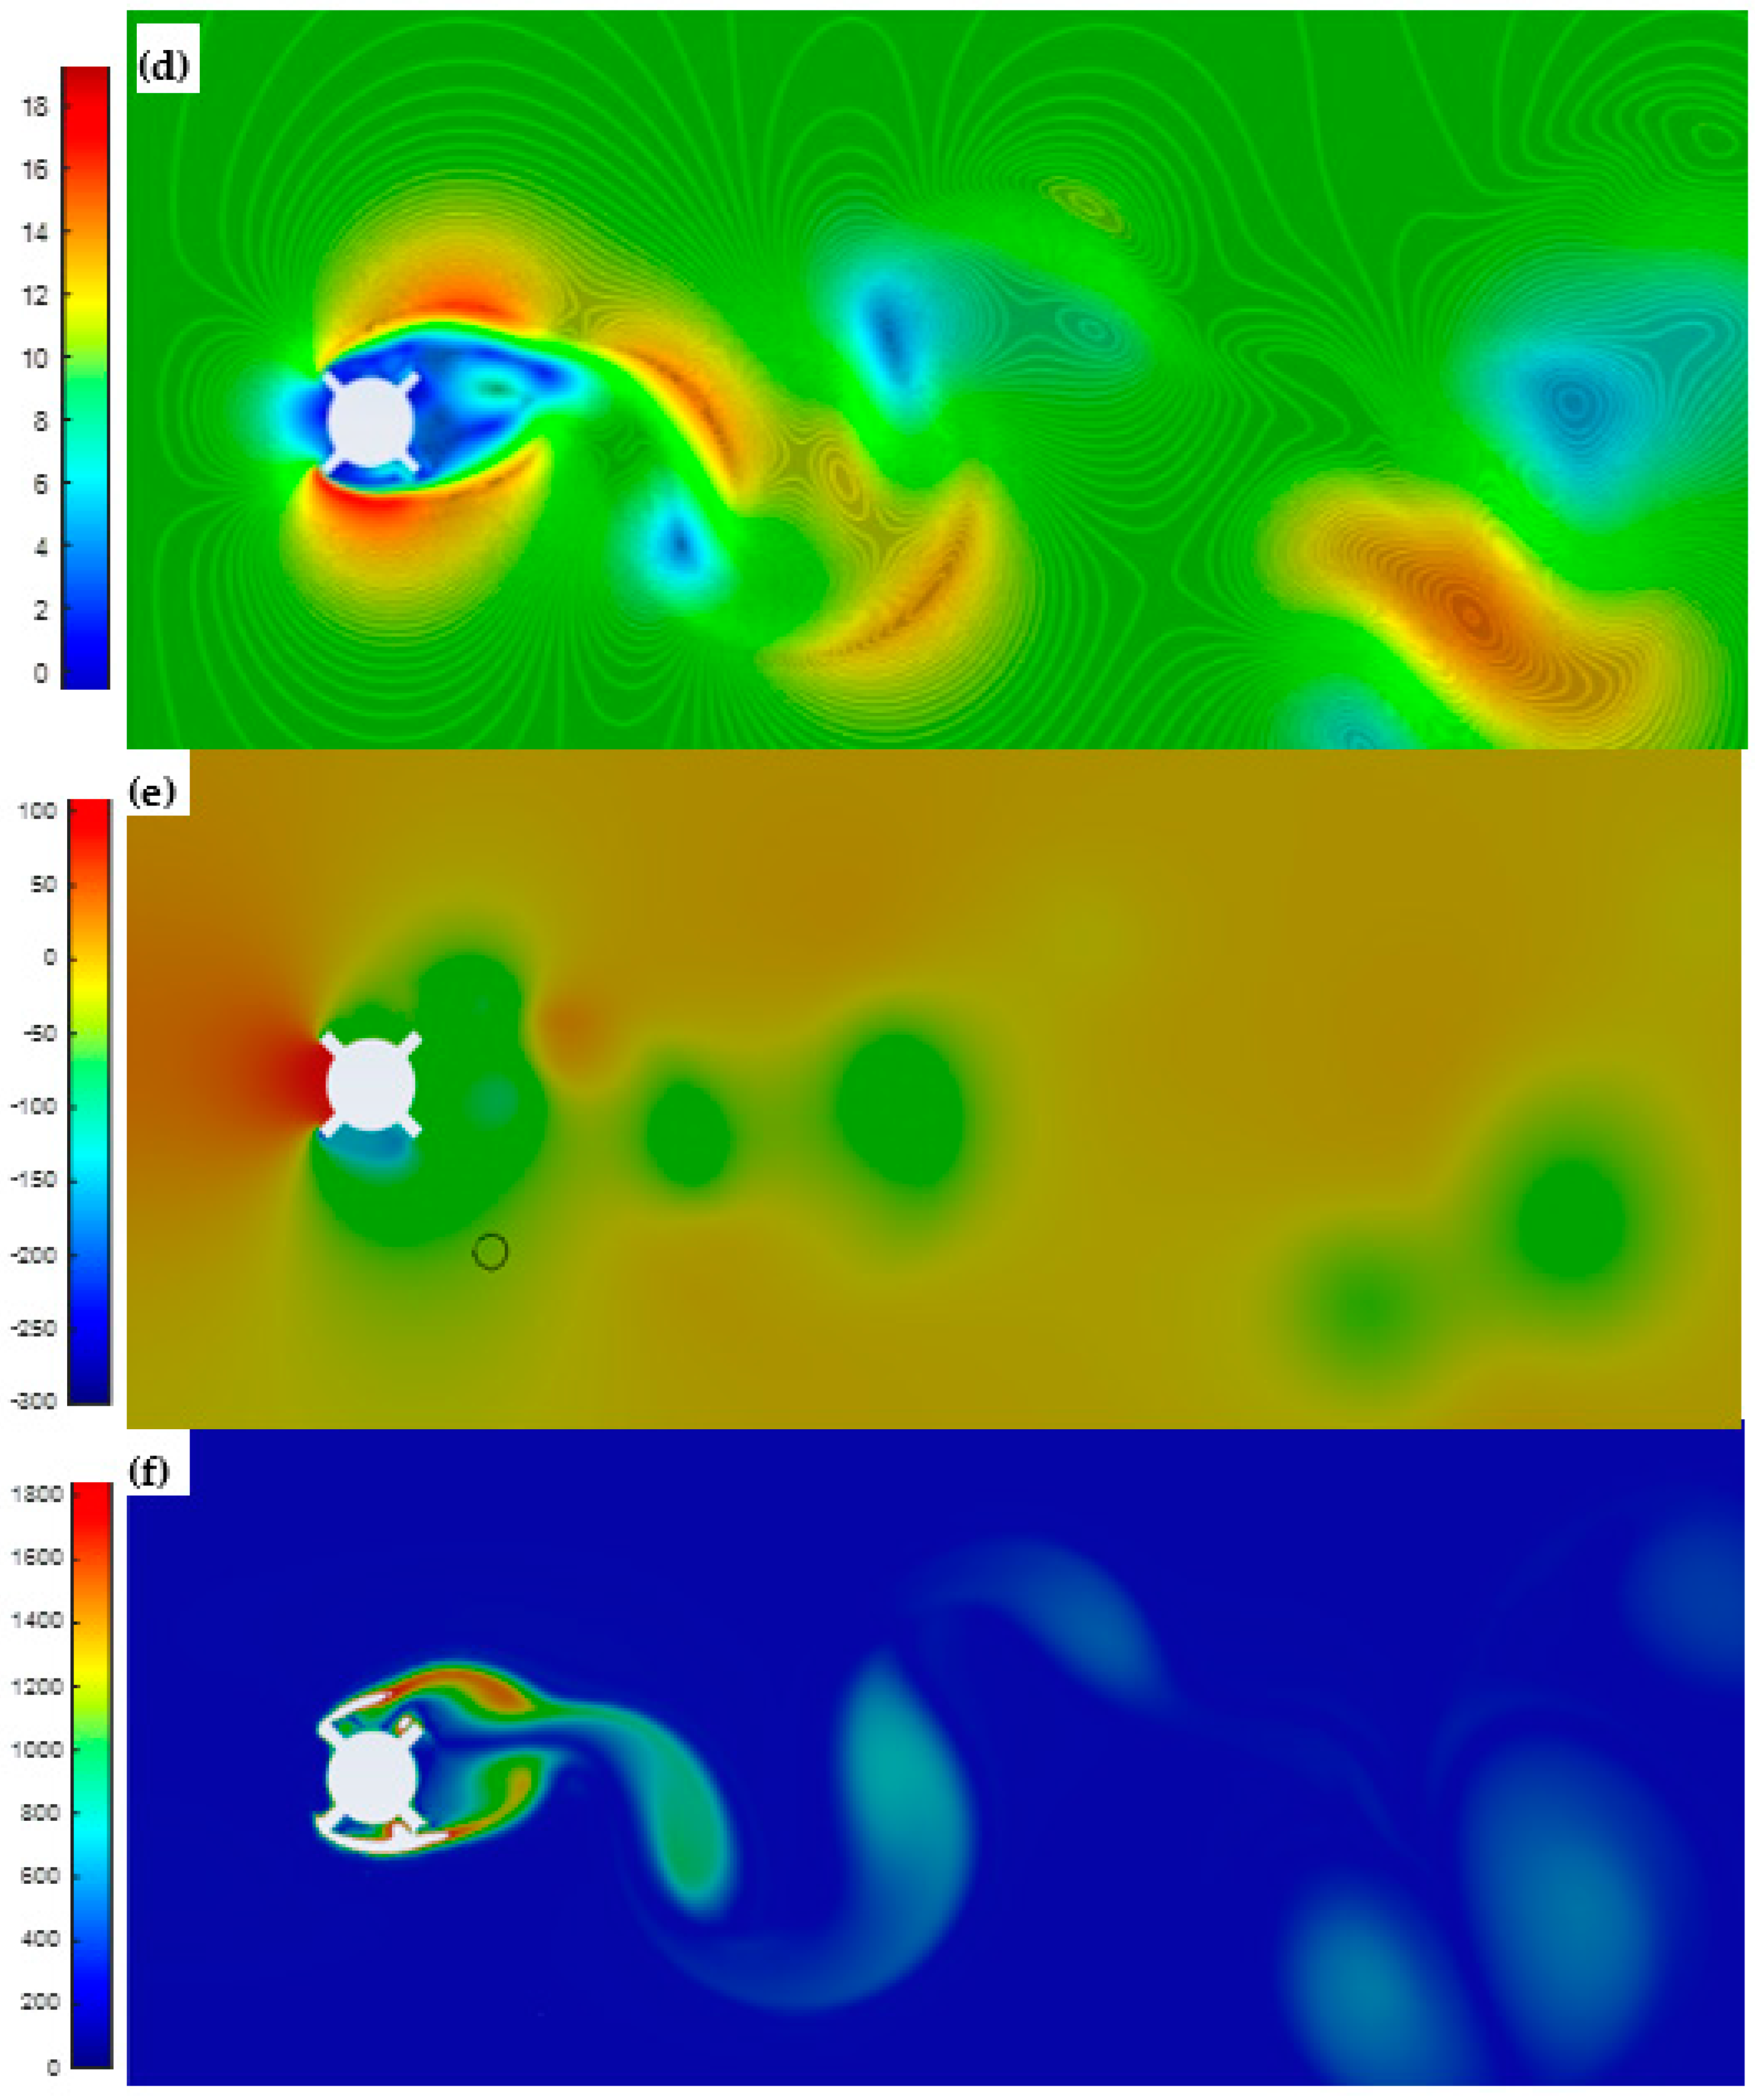
Figure 3 shows the vorticity contours for simple cylinders and complex cylinders, respectively. It can be noticed that the complex cylindrical shape produced more flow disturbance and intensive vortices. This essentially motivates the mast to vibrate and, hence, produce energy.
Figure 3 below shows CFD simulation results and a comparison of two different shape designs. In addition, the velocity, pressure, and vorticity contours for both the simple cylinder and modified cylinder designs at wind speed equal to 10 m/s were investigated and are presented in
Figure 3. CFD simulations revealed that the modified cylinder design at low wind speed yields no difference from the simple cylinder design. This indicates that a modified cylinder design at low wind speed (10 m/s) may not produce as much oscillation as intended.
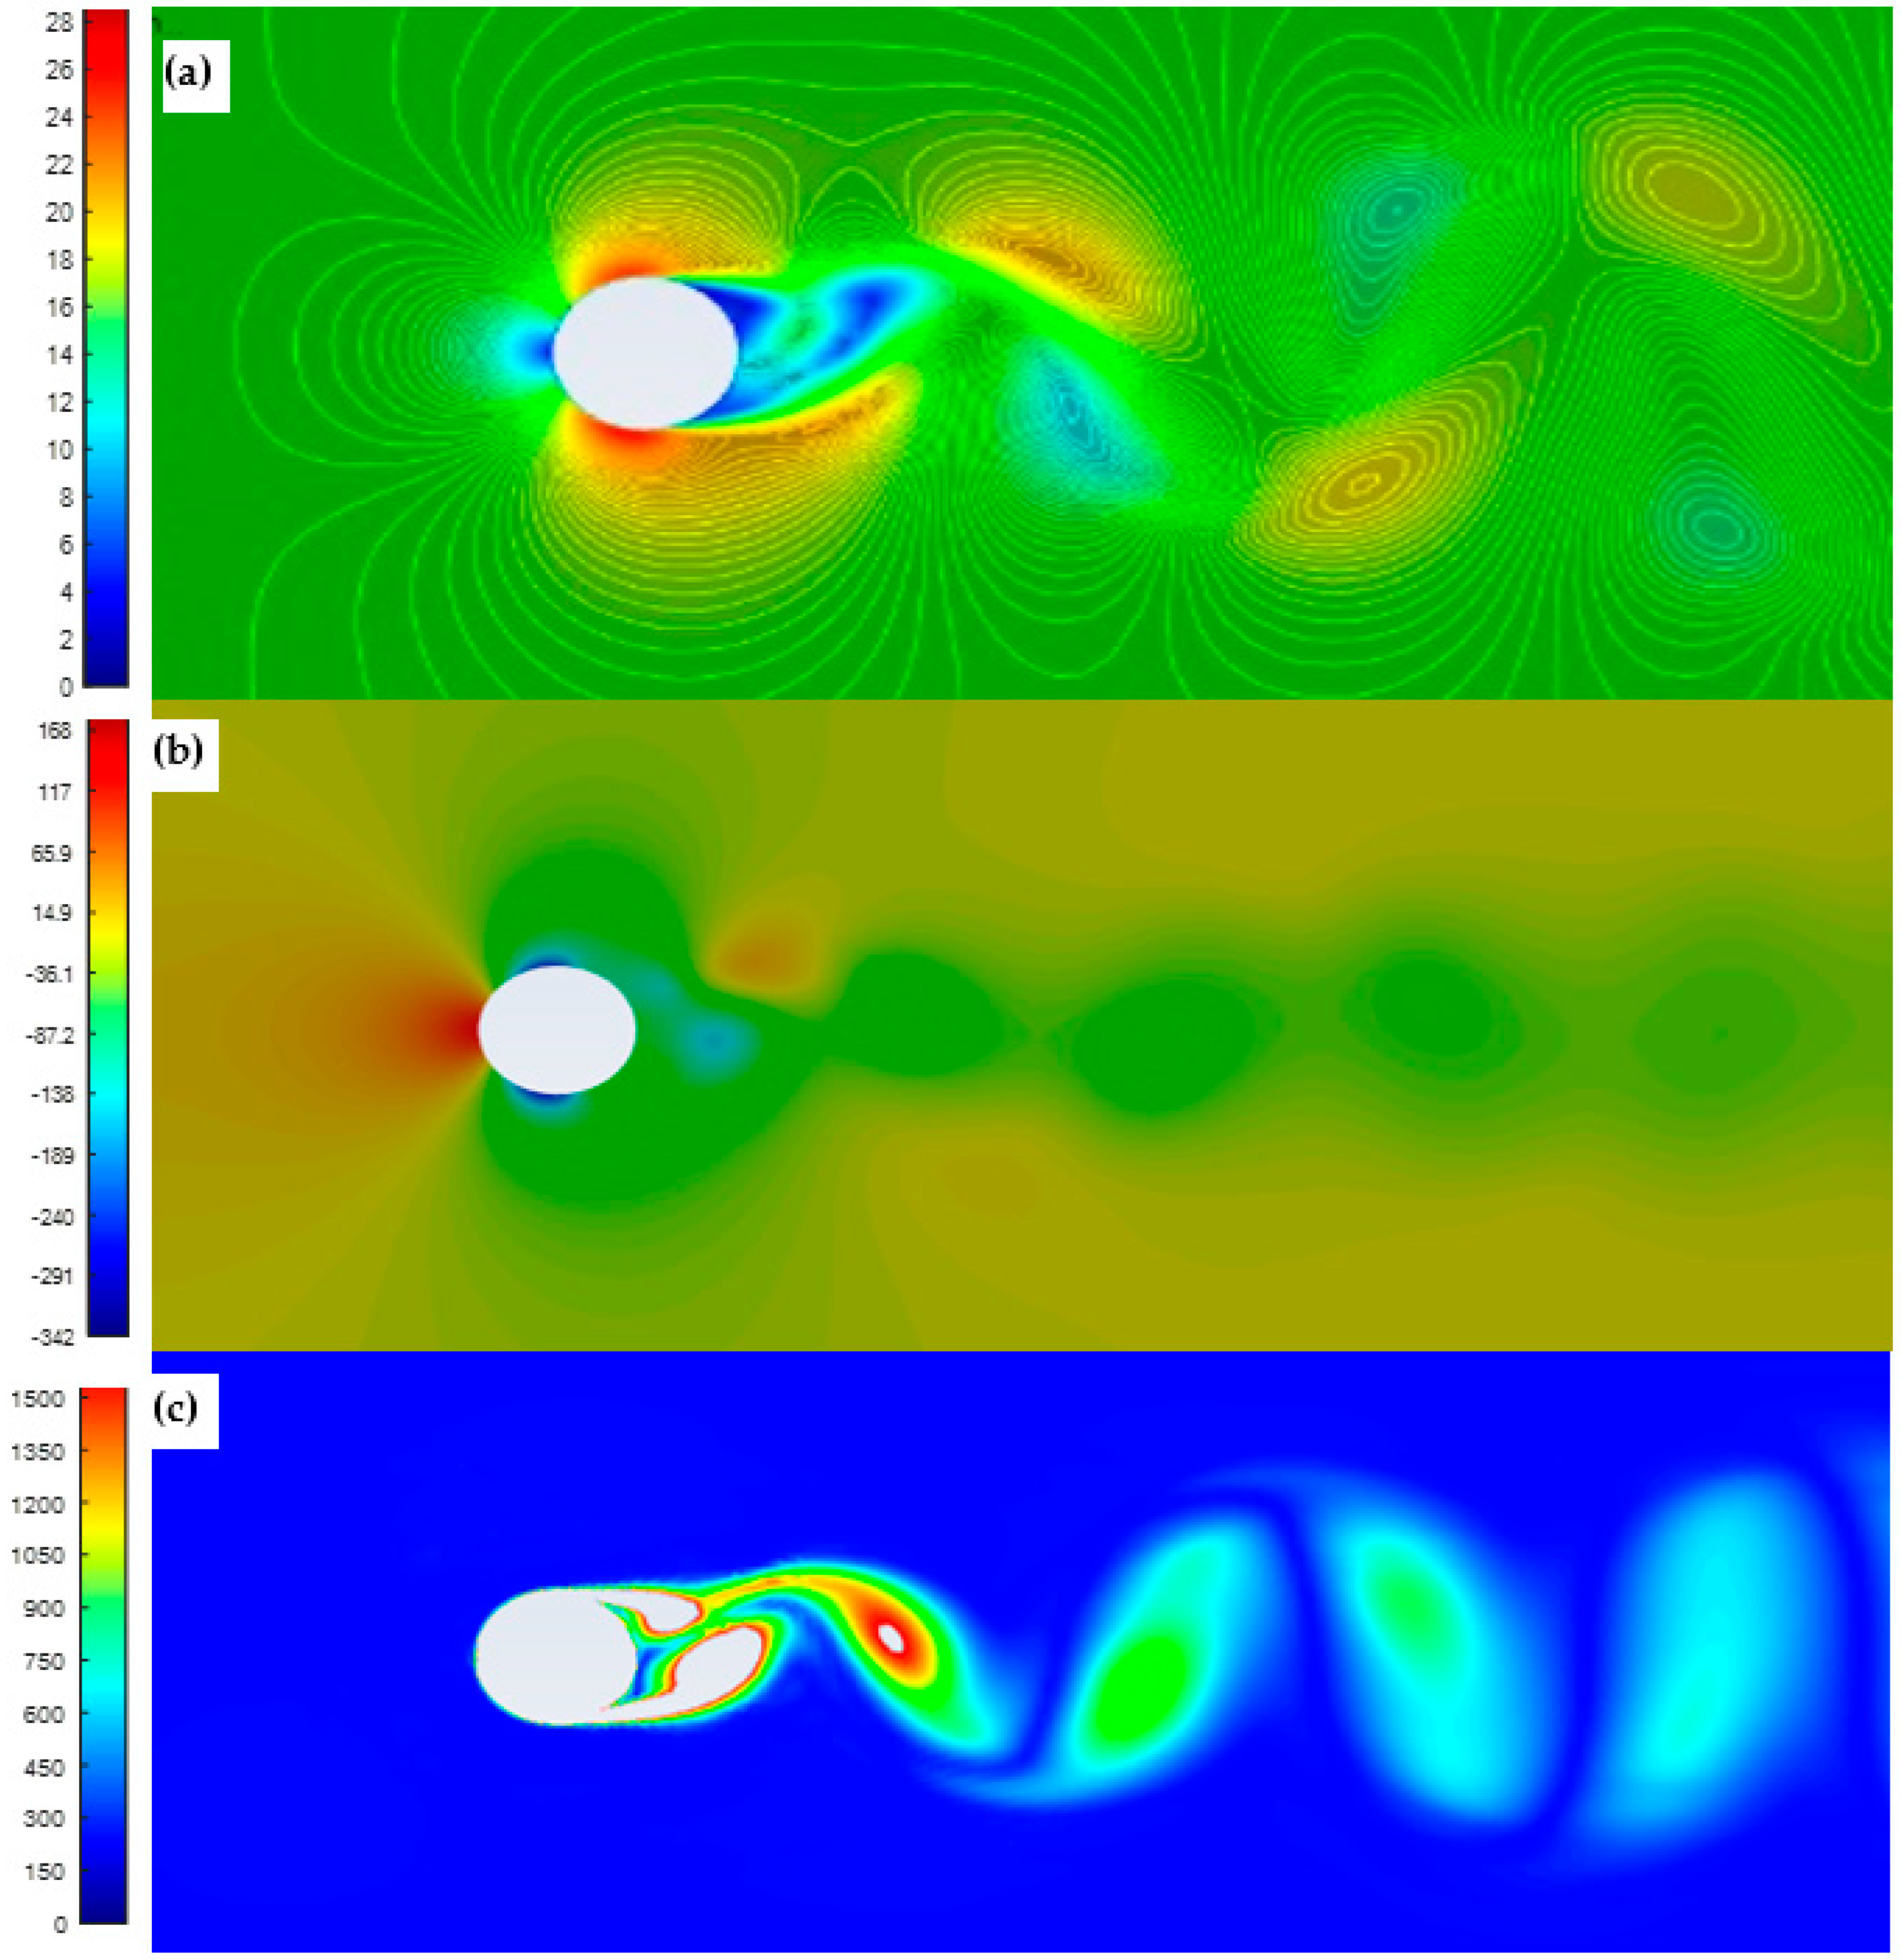
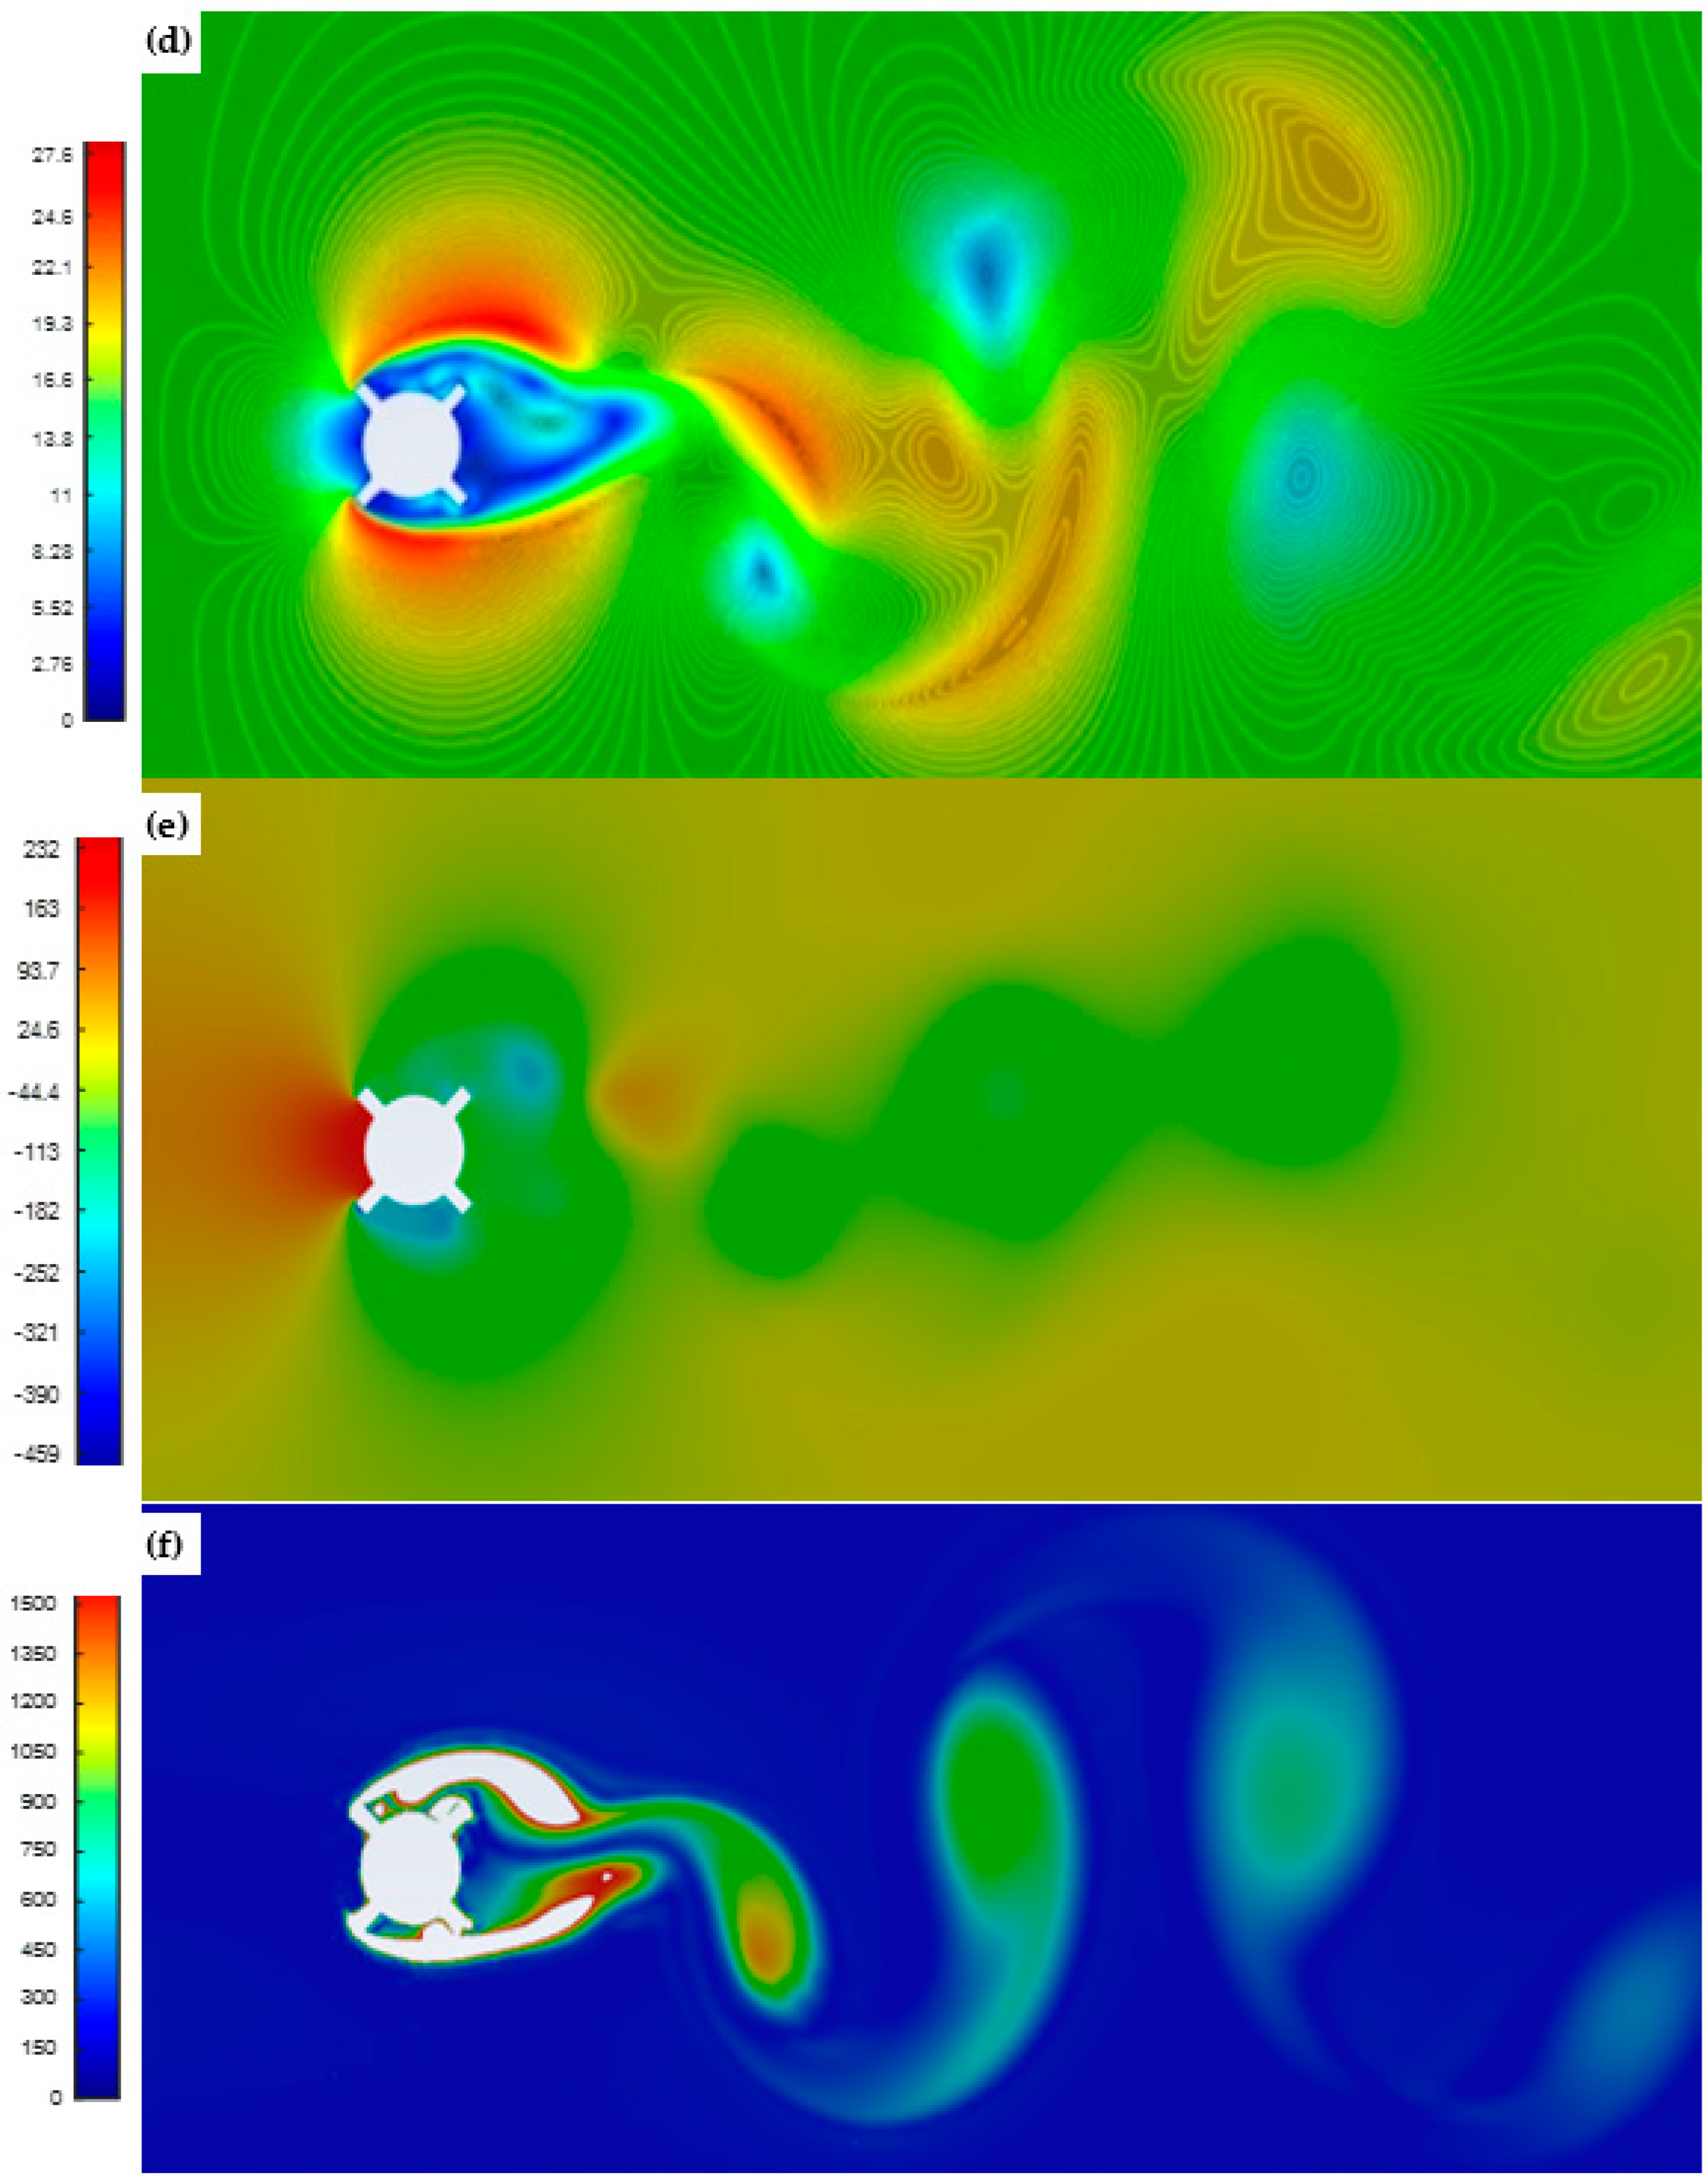
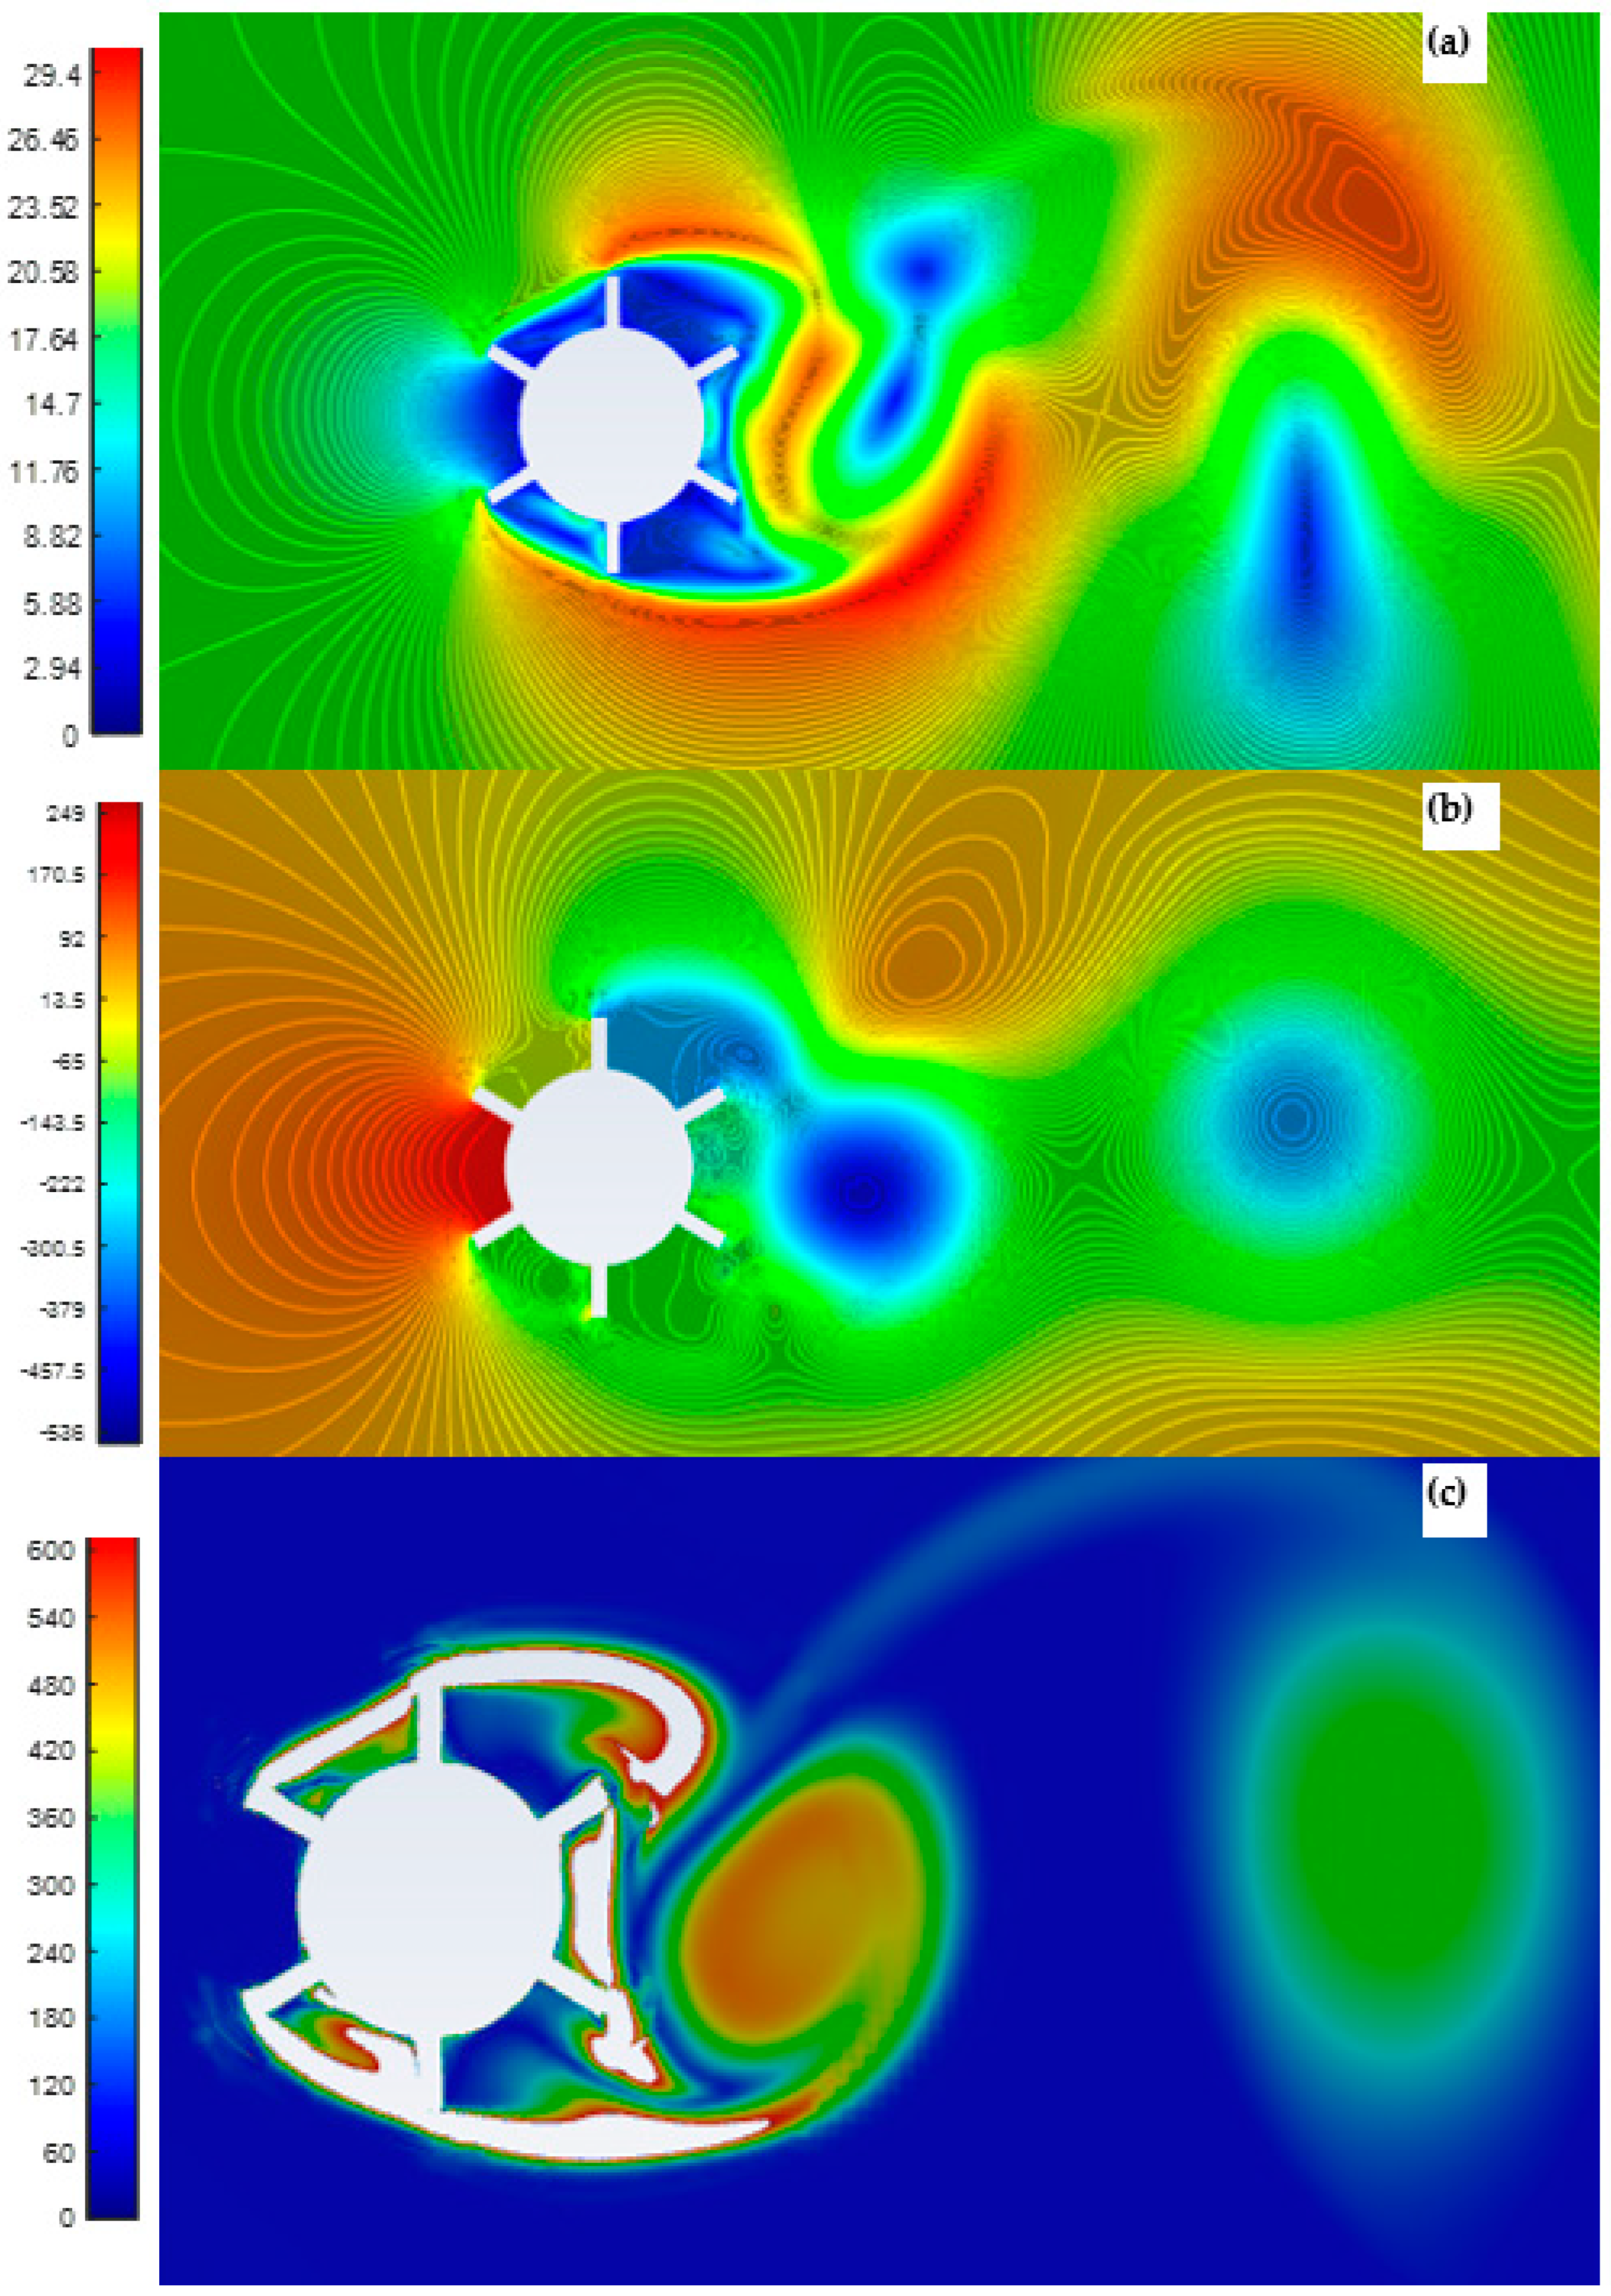
In
Figure 4, the wind speed increased to 15 m/s, and CFD simulations were carried out to study the effect of changing the wind speed and the design shape. The simulation results shown in
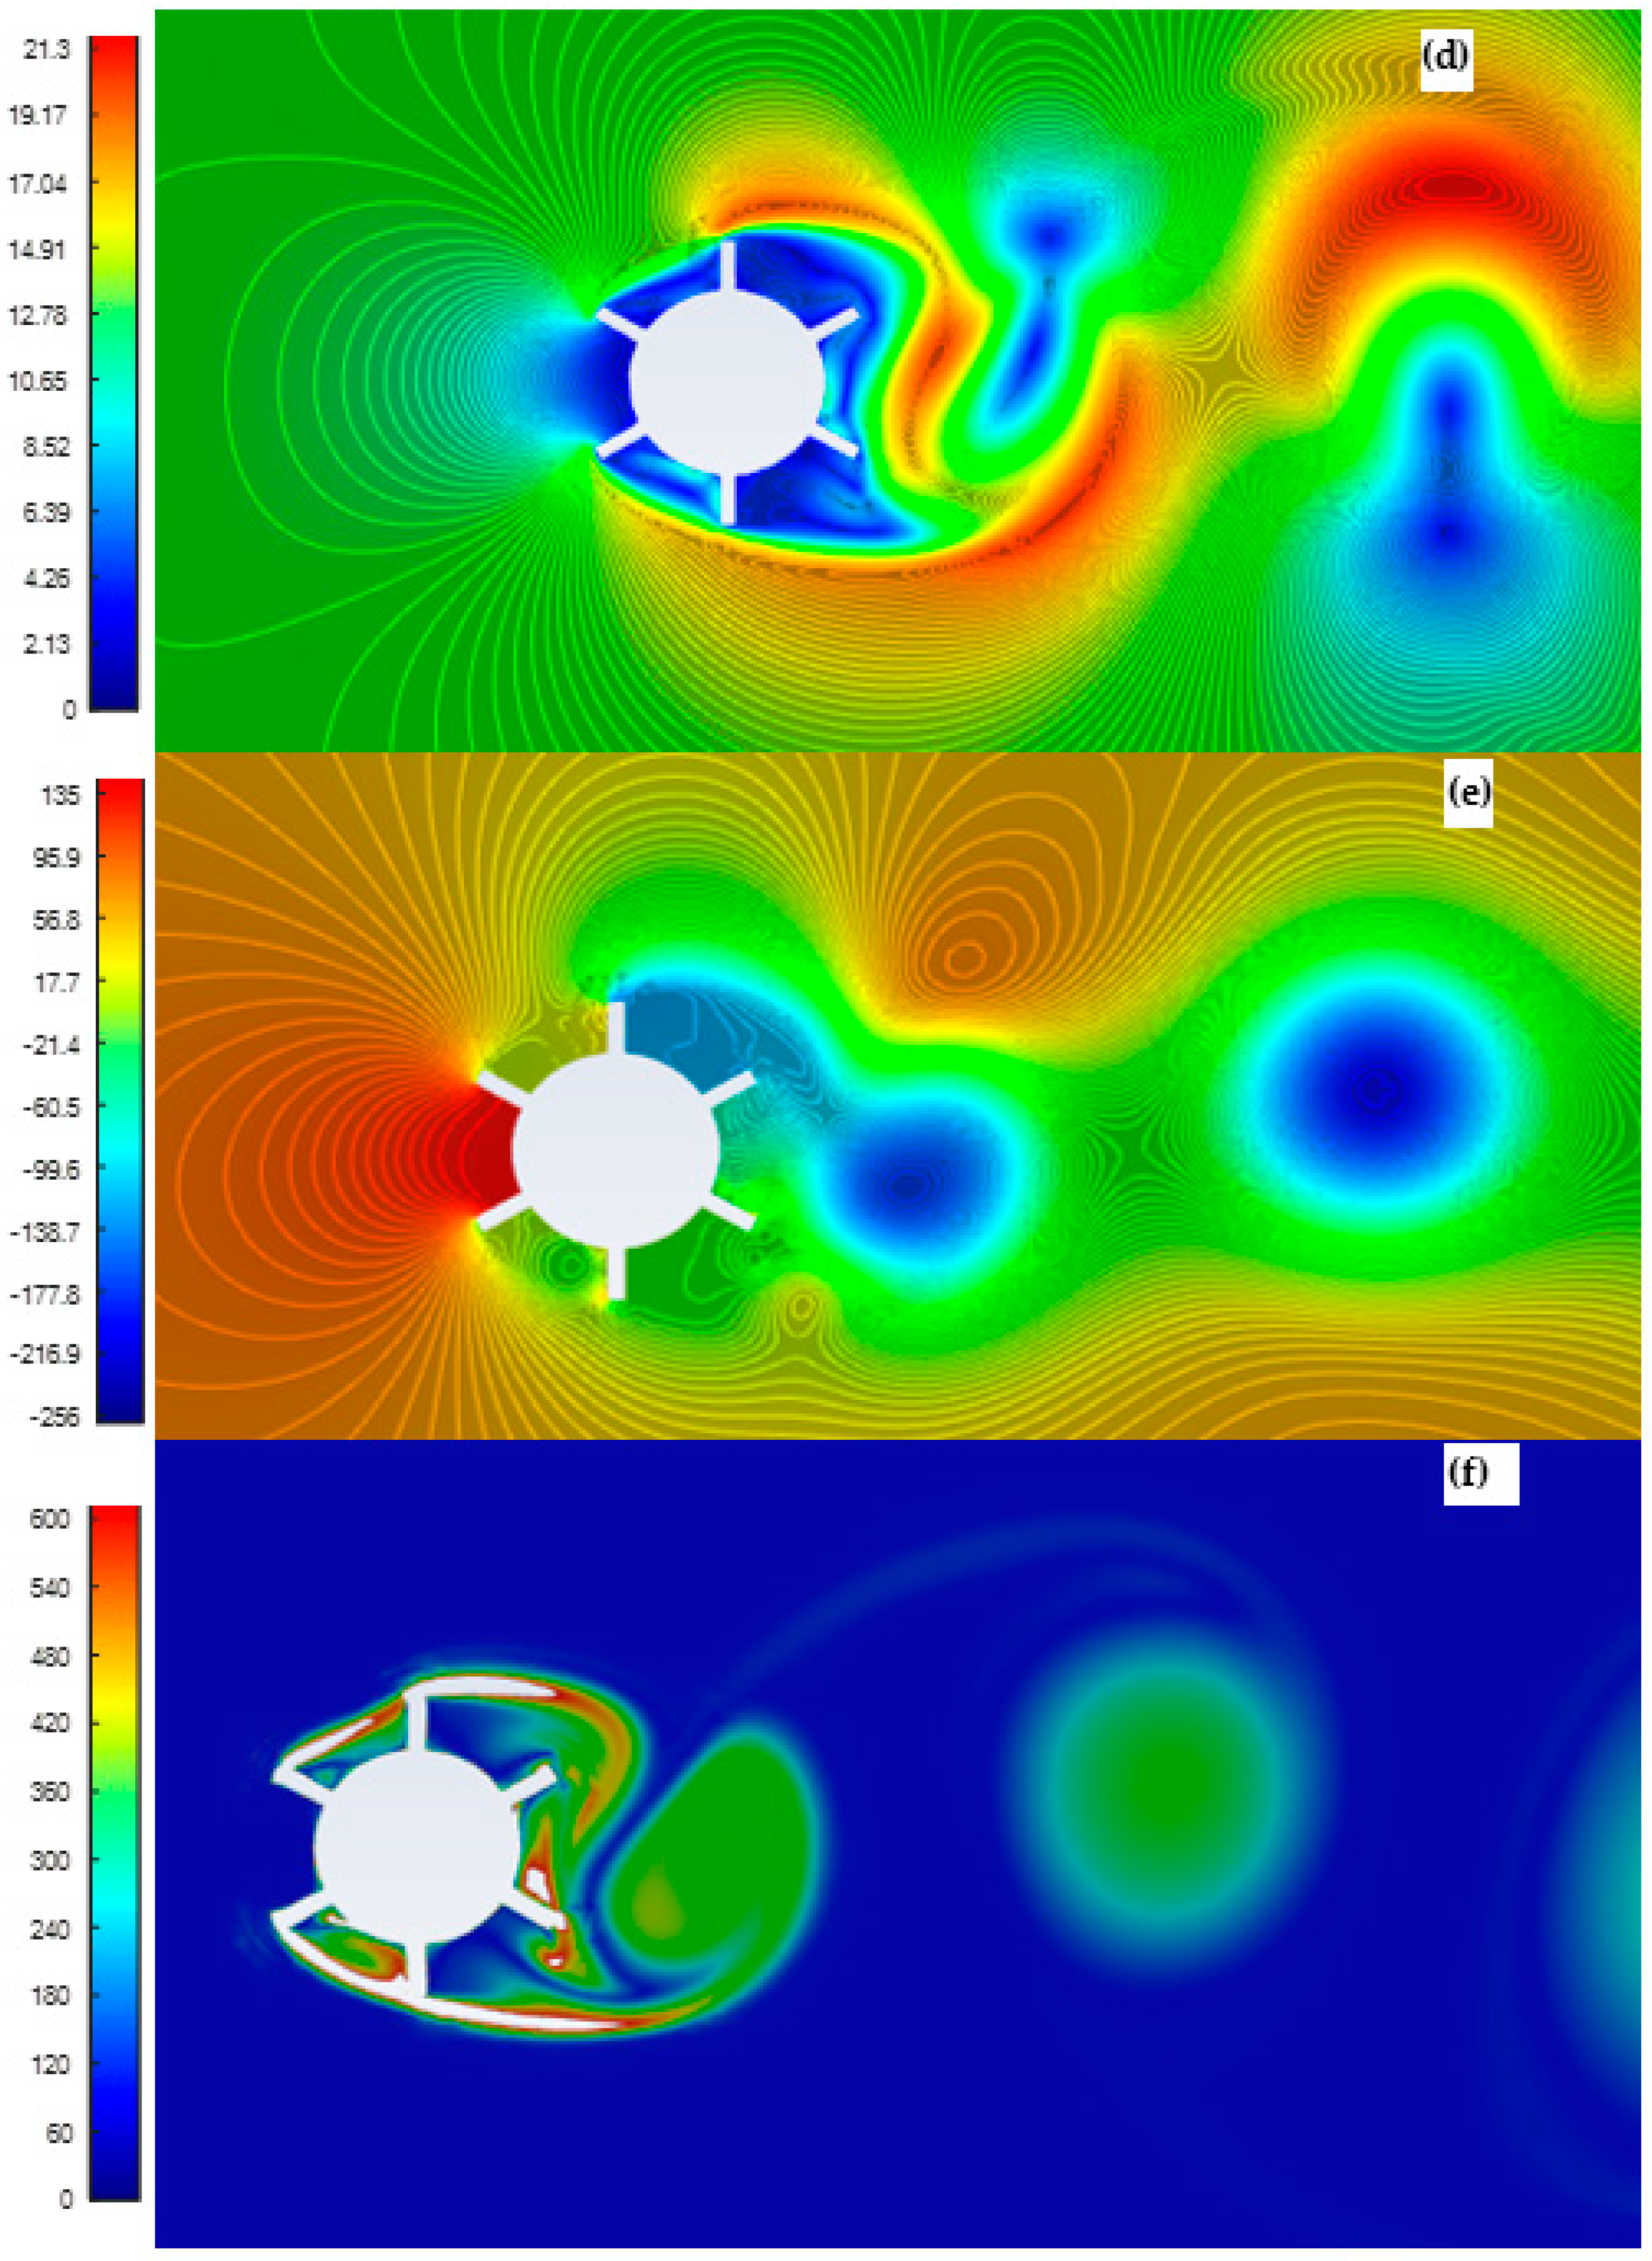
Figure 4 show that when the wind speed is increased, the effect becomes evident that more pressure and more intense vortices are generated. Hence, more oscillations and more power are generated. It becomes even better when the wind speed goes up to 20 m/s, as shown in
Figure 5. More pressure contributes to increasing lift forces that are translated as oscillations and more intense vortices, indicating turbulence that causes more vibrations in the design and generates more energy. CDF simulation results showed that the investigated two factors, geometrical design shape and wind speed, play a significant role in creating the oscillations and vibrations that produce more energy. Therefore, it can be concluded that complex cylindrical design shapes and wind speed in the range of 15–20 m/s contribute largely to harvesting more energy.
CFD simulations were carried out on the mast using its actual dimensions, including mast height, length, and diameter of the cylinder, and on the proposed design of both shapes of simple and complex cylinder geometries. The results showed that high pressure is created even at low wind speed, producing higher lift force and more vibrations. The intensity of vertices at low wind speed for complex shape design grows more extensive and even better at wind speeds equal to 15 and 20 m/s, as shown in
Figure 6. A considerable amount of power can be harvested from the complex shape design at wind speeds as low as 5–20 m/s.
5. Experimental Results
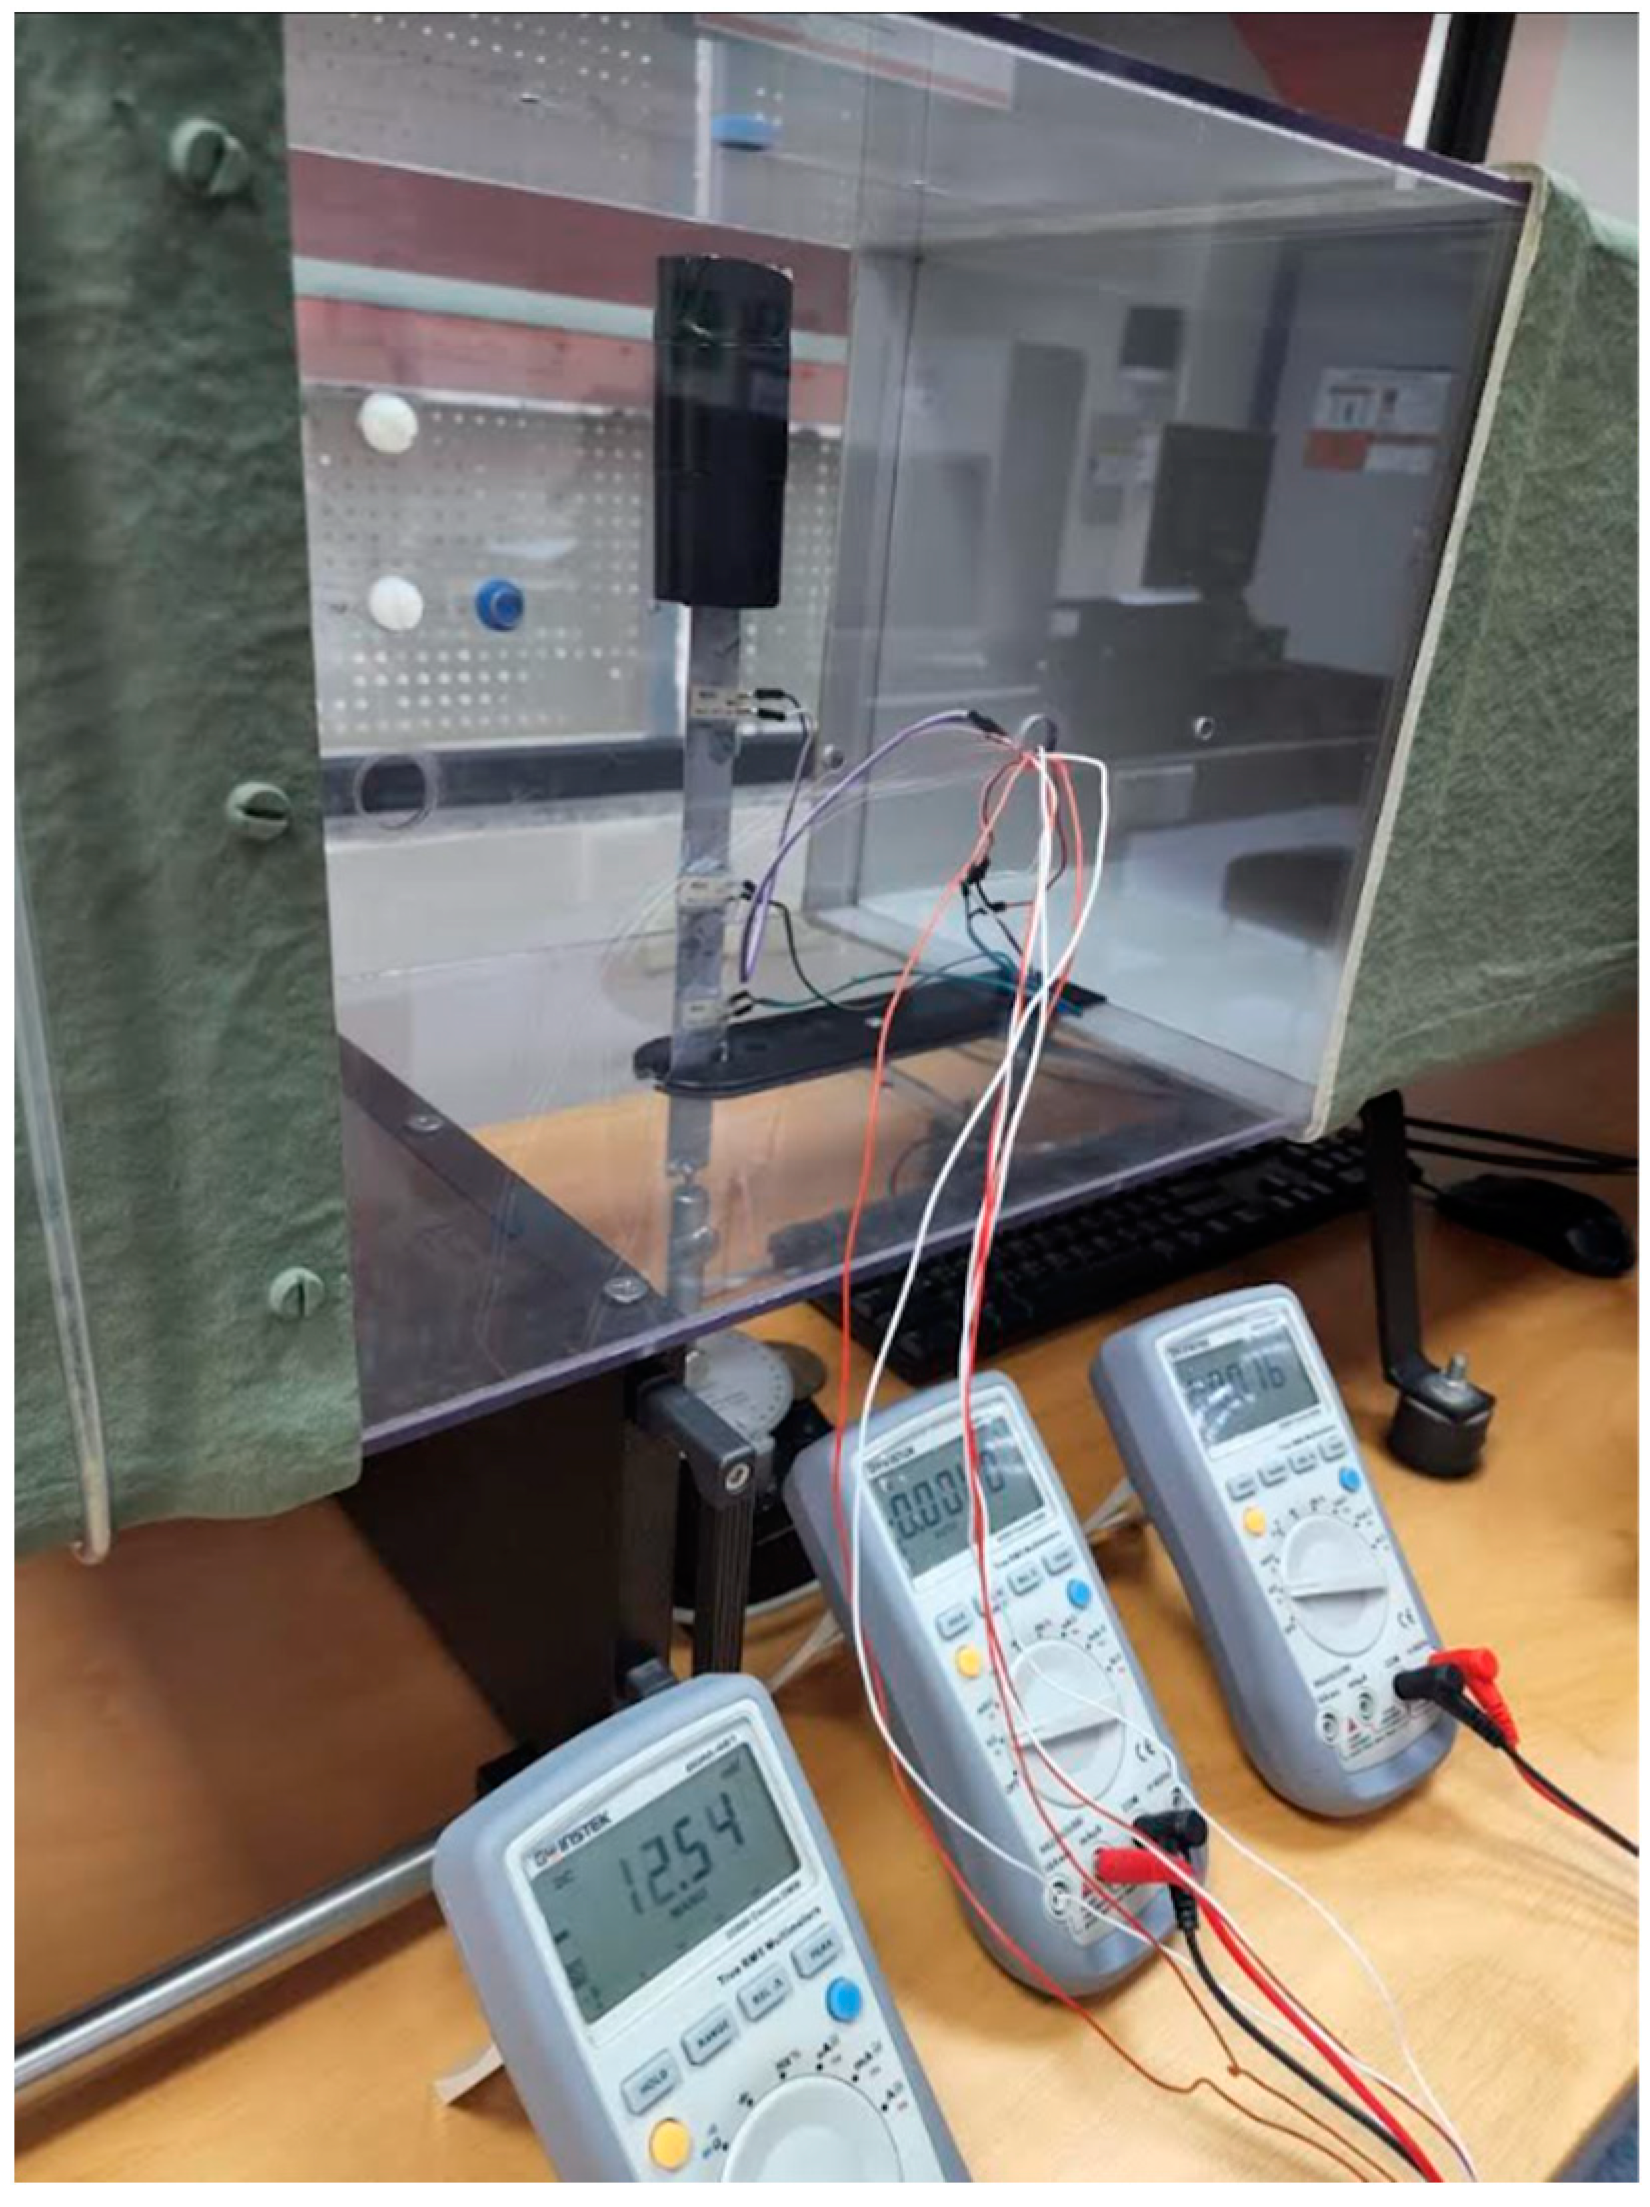
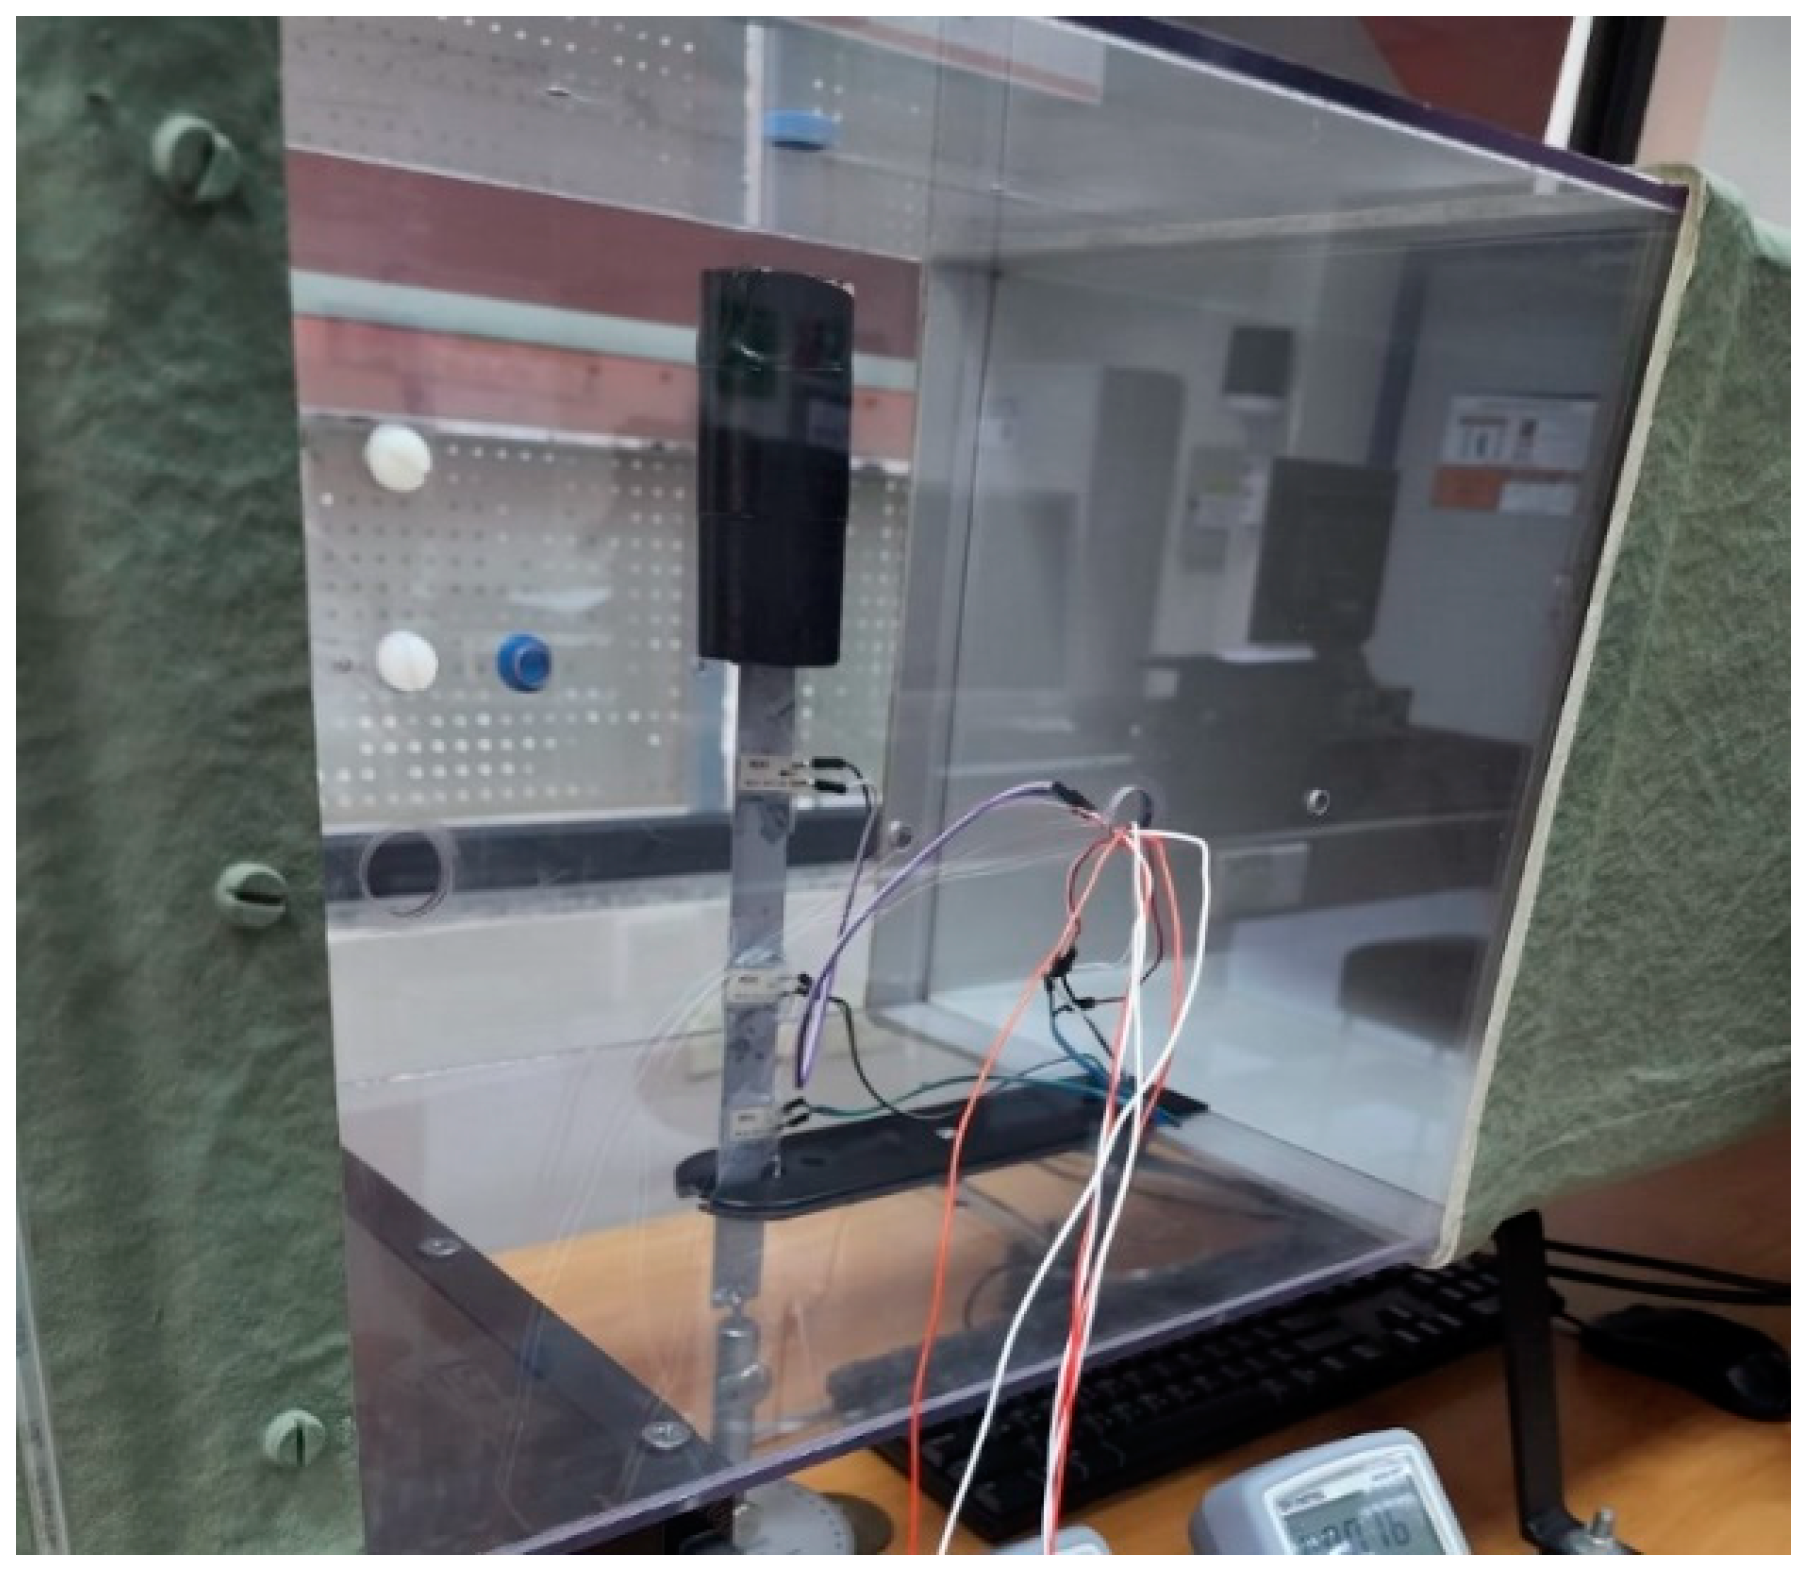
This section presents the results of the prepared experimental setup shown in
Figure 8 for the simple cylinder and in
Figure 9 for the modified cylinder. The data are related to the three locations of the piezoelectric component, i.e., top, middle, and bottom of that component, and for two different angles of attack, i.e., 0 and 5 degrees, and are presented in
Table A1,
Table A2,
Table A3 and
Table A4. As predicted by numerical results, increasing velocity increases the amount of applied force on the vortex generator. Furthermore, adding complexity increases the lift force slightly; however, this change was extensive in the numerical results, which could be related to the non-precise shape of the object added to the primary geometry and the accuracy of the measurement. Similarly, placing the piezoelectric component farther from the vortex generator object induces more electrical voltage in the piezoelectric element. Nevertheless, this phenomenon cannot be observed when the piezoelectric member is in the middle of the mast. The mast becomes an obstacle in the turbulent wind flow, which is neglected in the numerical simulation. This effect probably affects the wind flow around the mast and vortex generator object and enhances the vibrations of this part of the mast. Additionally, considering a constraint for the mast movement and fixing the mast to the ground changes the mast vibration pattern. Finally, it should be noted that the angle of attack almost does not impact the exerted lift force.
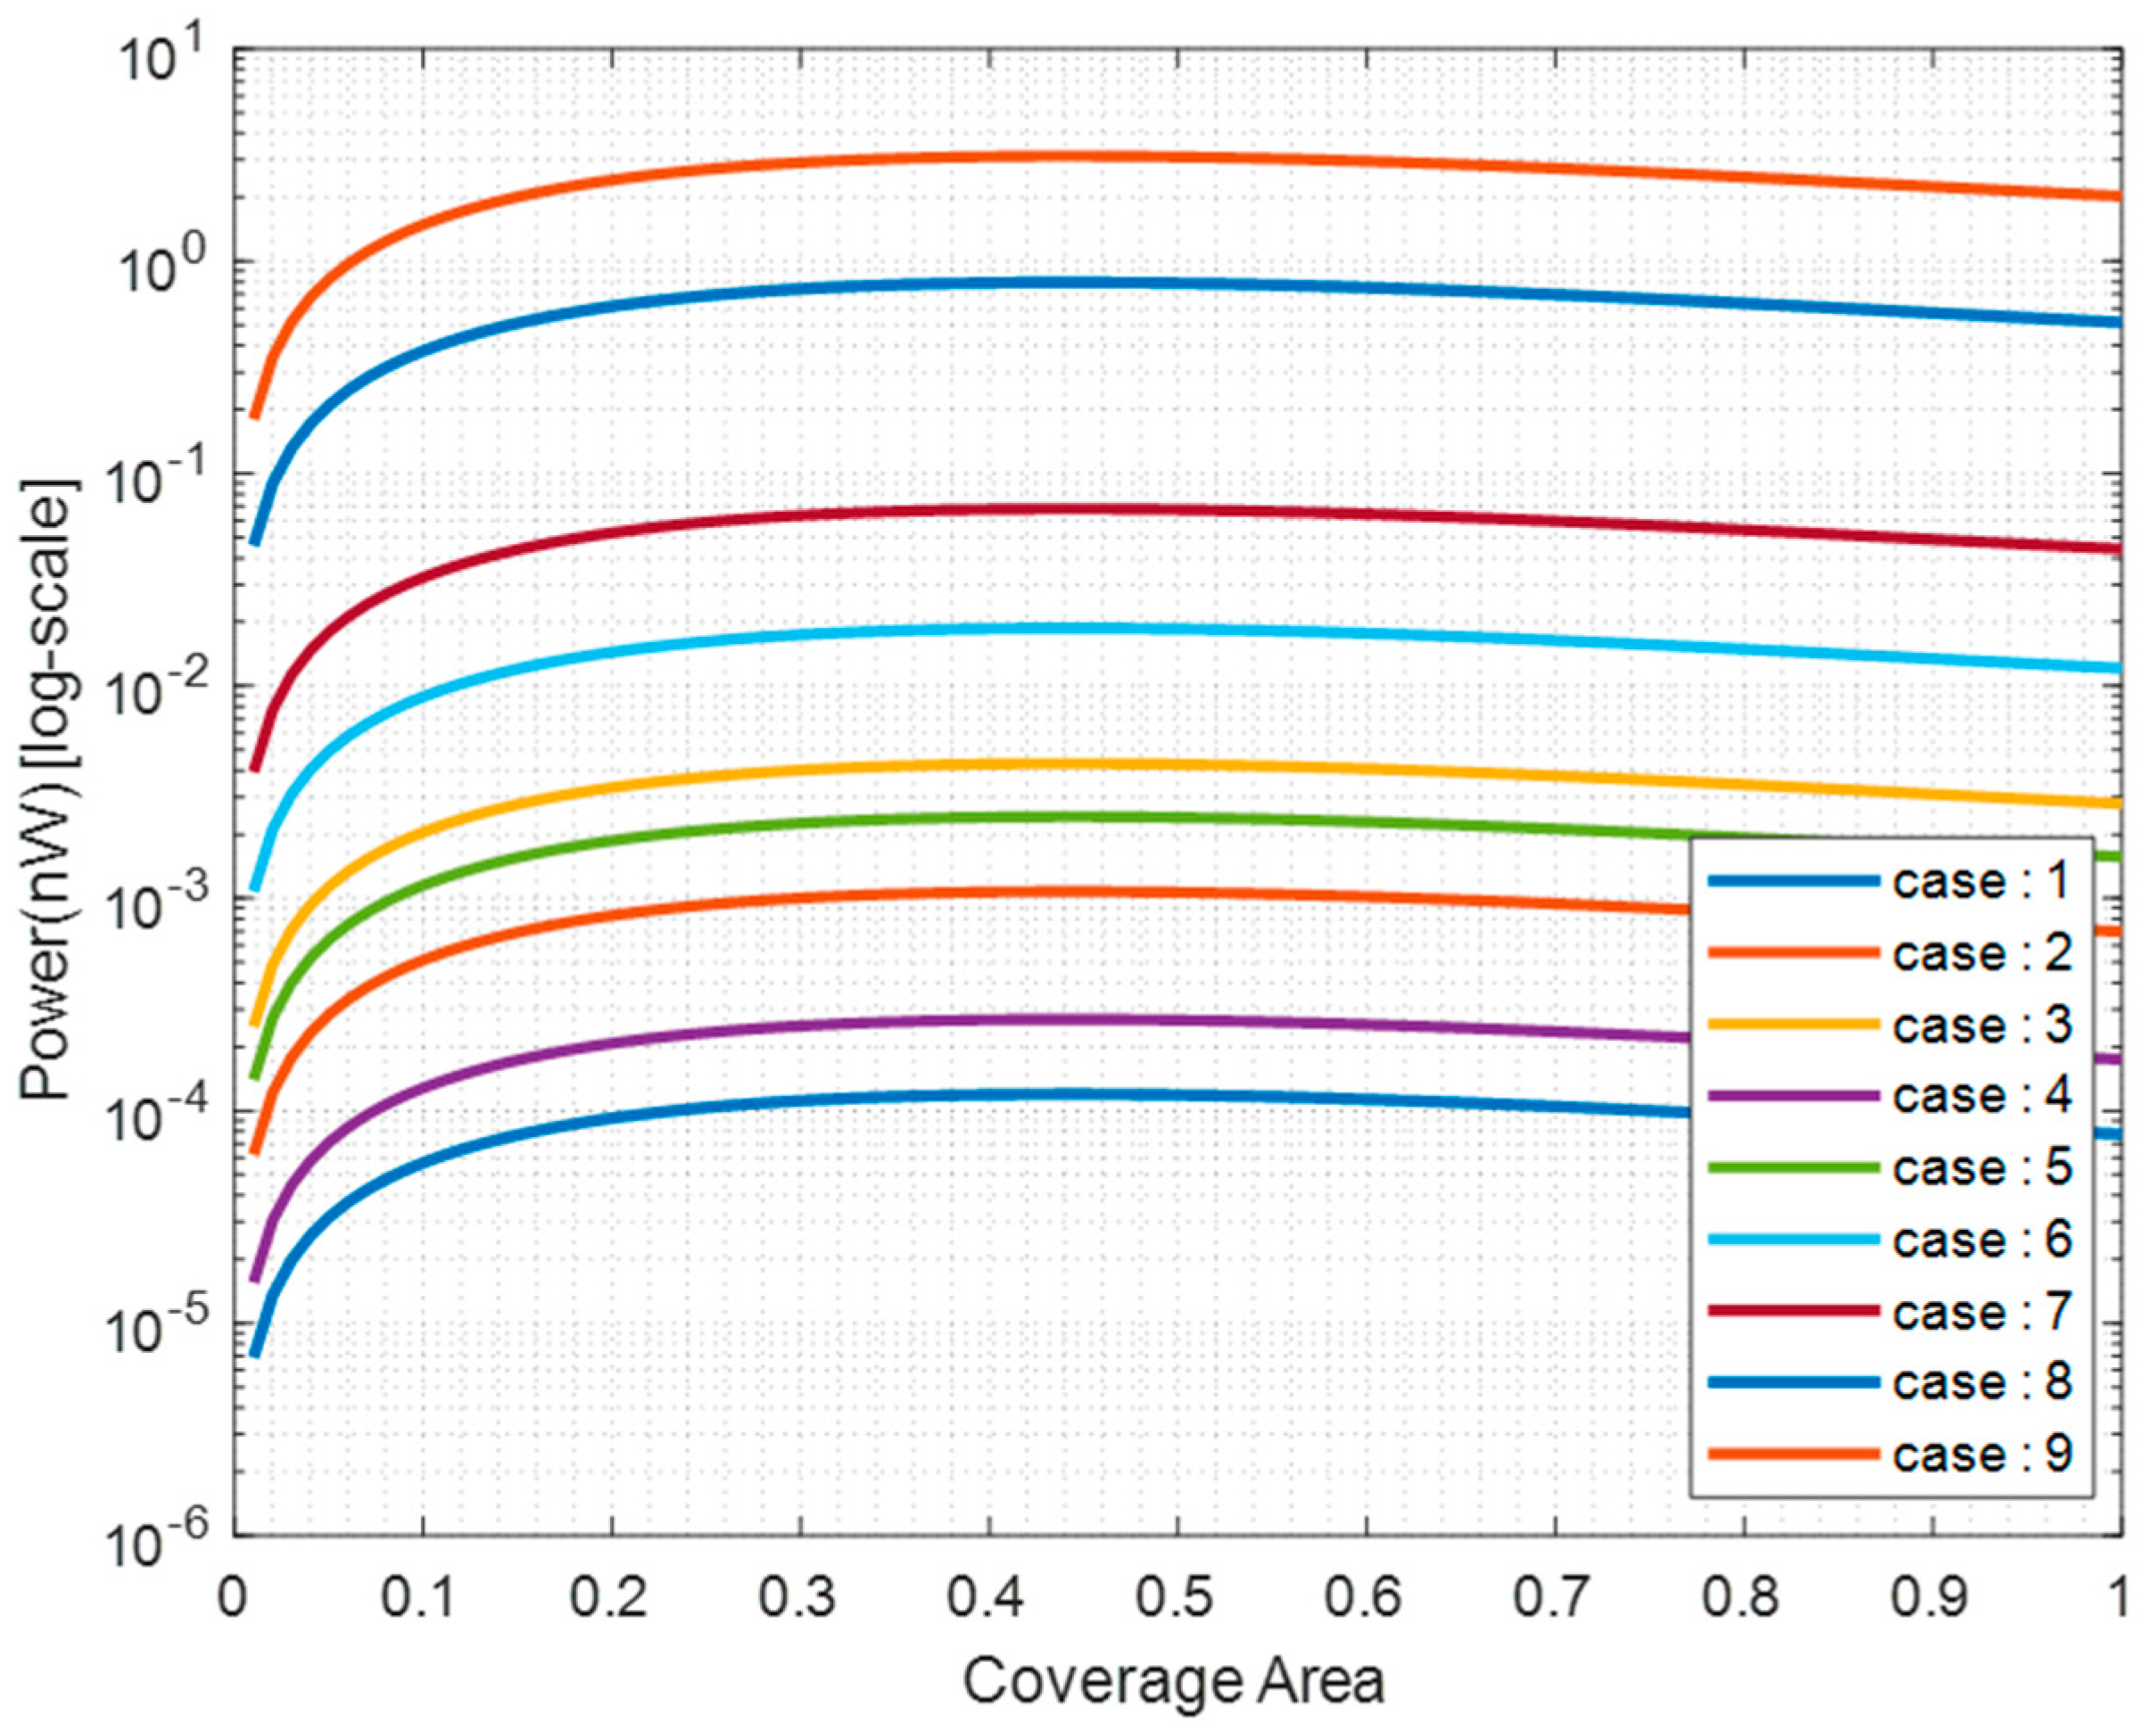
Maximum attainable power for each case when the piezoelectric sensor is located near the vortex generator utilizing Equation (5) is presented in
Table 4. The amount of power obtained experimentally at different locations of the piezoelectric element is plotted in
Figure 10.
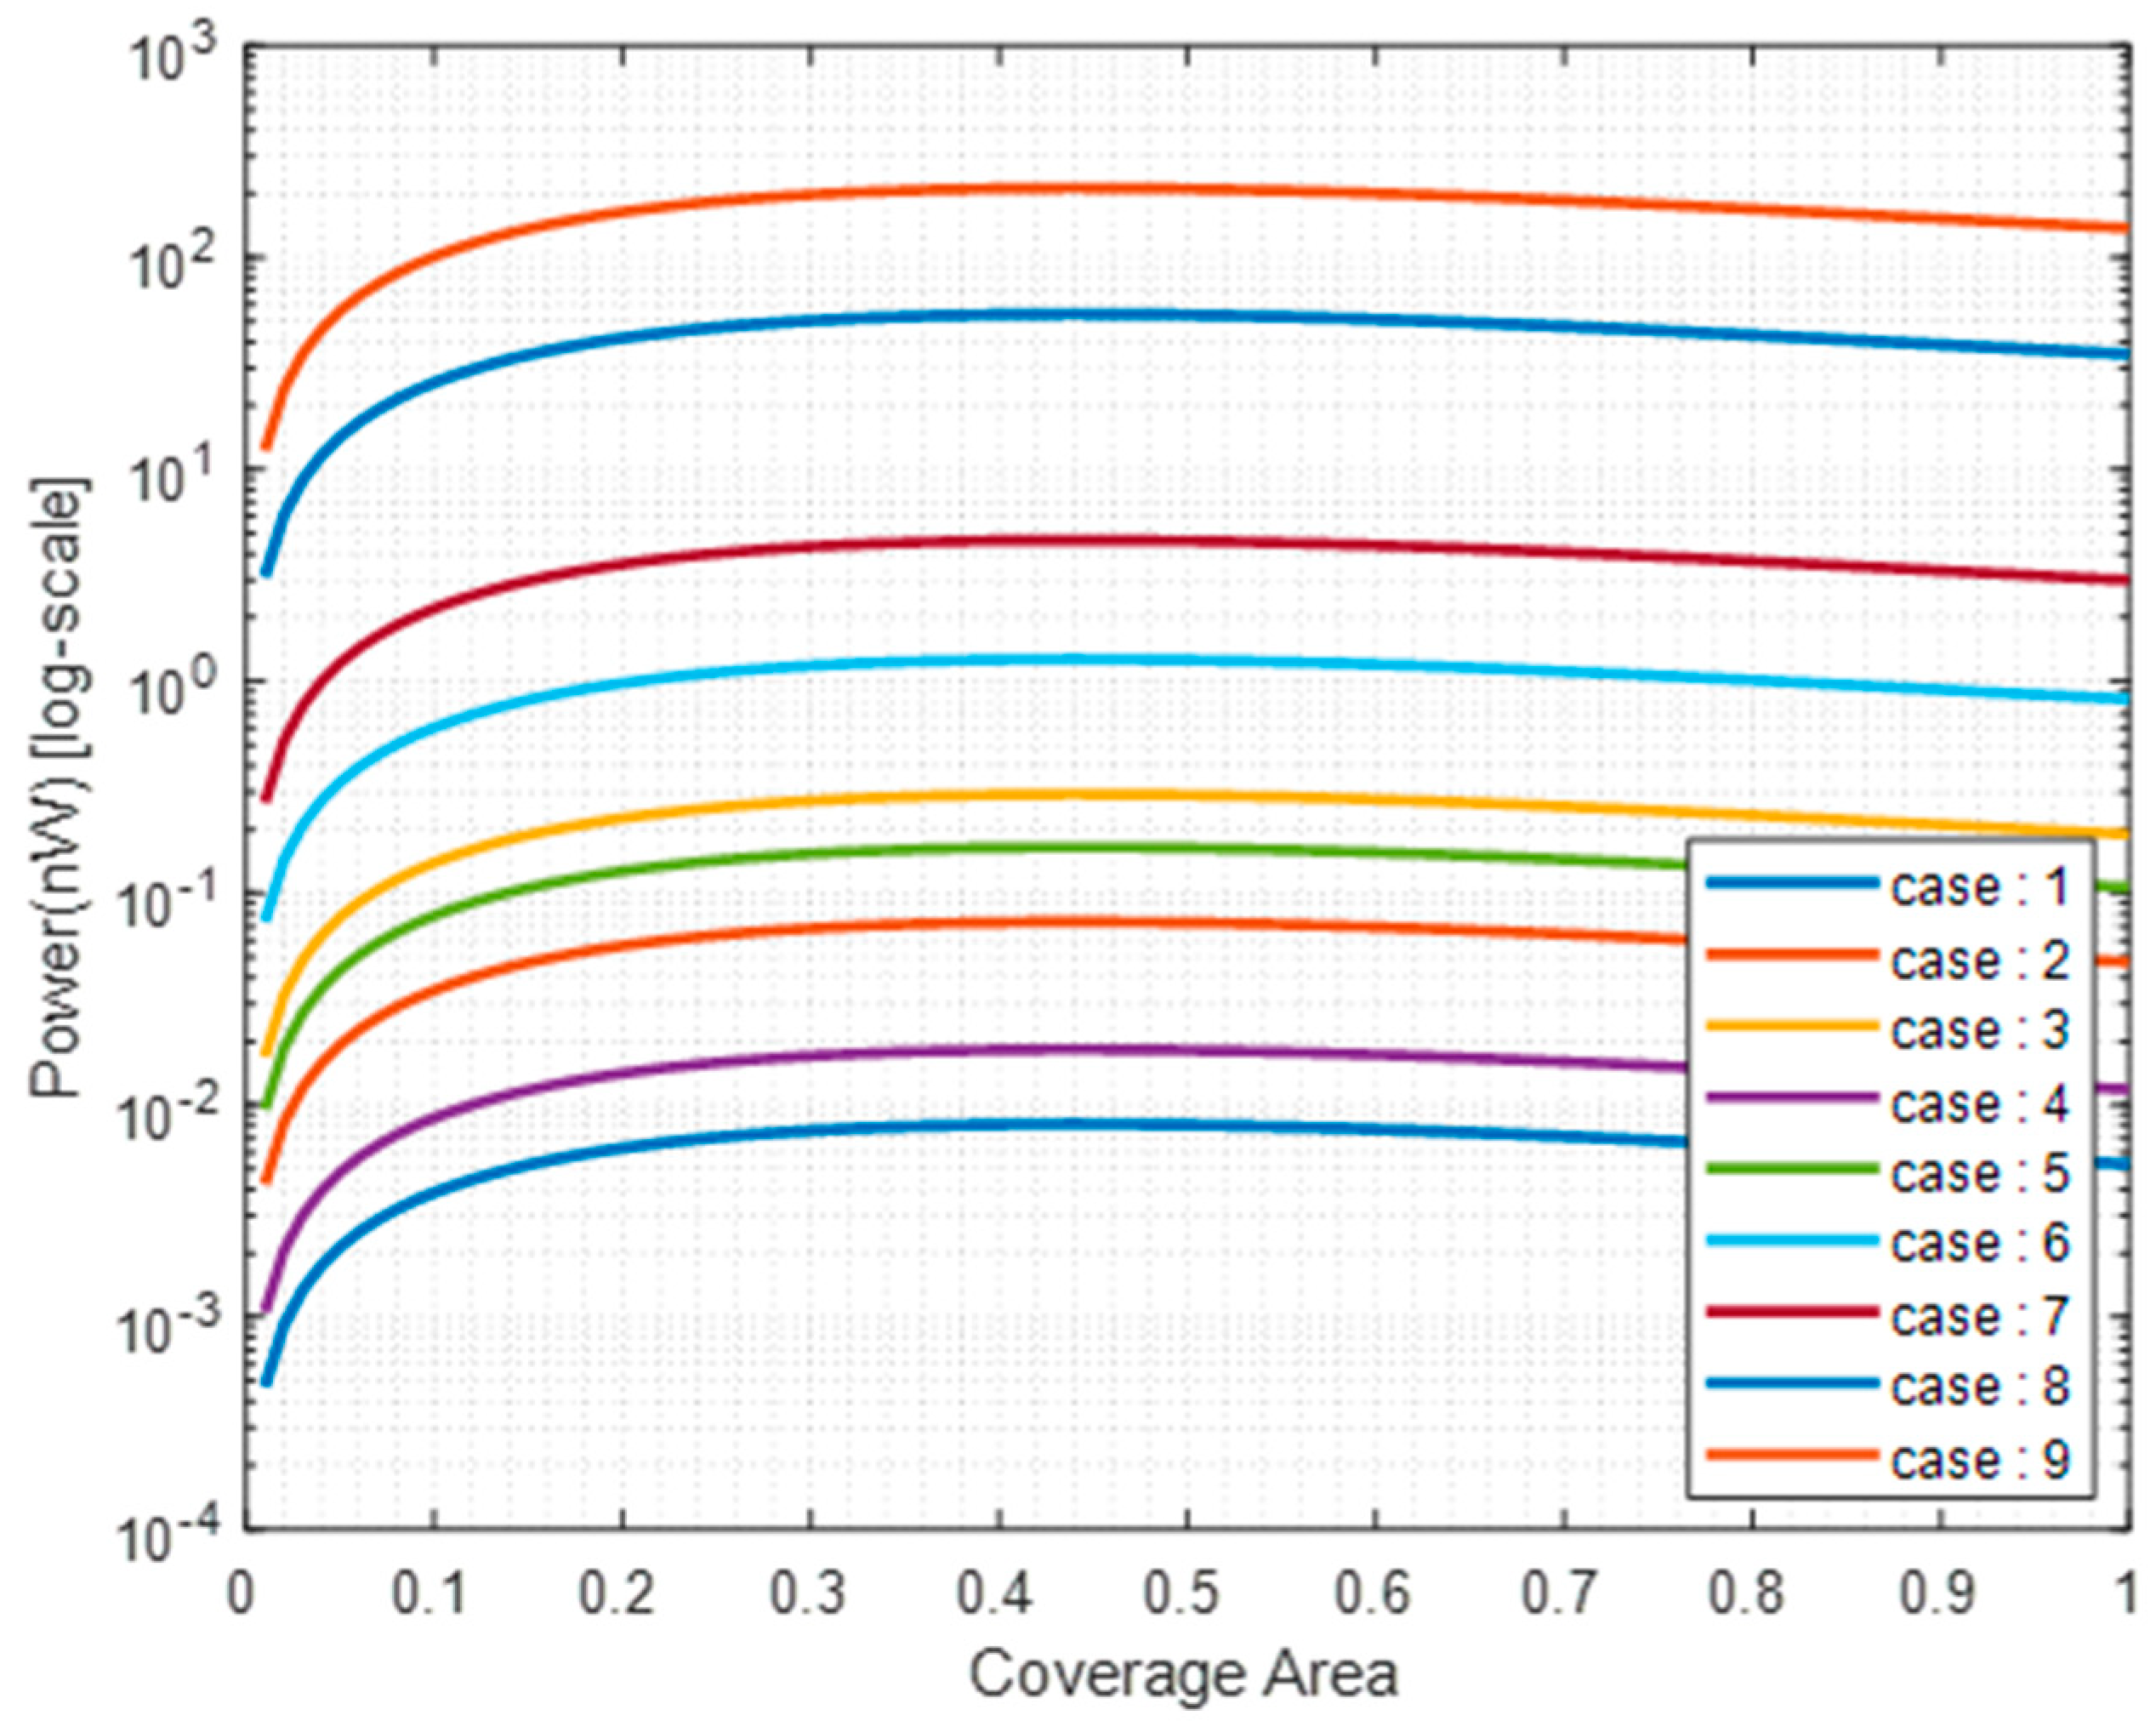
In addition, when the piezoelectric component is located at the bottom of the mast, more power can be harvested, as seen in
Figure 11. The results are reported in
Table 5 and plotted in
Figure 11. The maximum harvested amount of energy is 212.473 nW at a wind speed of 20 m/s using a modified cylinder with real-life dimensions. This result is promising for small electronic devices and can later be improved to generate more power.
It is evident from the above results that placing the piezoelectric component as far as possible from the vortex generator (bottom of the mast) provides more attainable power for the piezoelectric component.
As was expected, high wind velocity with the effect of adding complexity to the geometry, which are the contributing factors in the lift coefficient increase, positively affected the generated power by the piezoelectric component.
The experimental data obtained from the experimental work on the proposed designs are reported in
Table A1,
Table A2,
Table A3 and
Table A4. The experimental data represent the voltage readings at the piezoelectric locations on the mast and both the drag and lift forces that were experimentally monitored using a data acquisition system connected to the wind tunnel.
Figure A1,
Figure A2 and
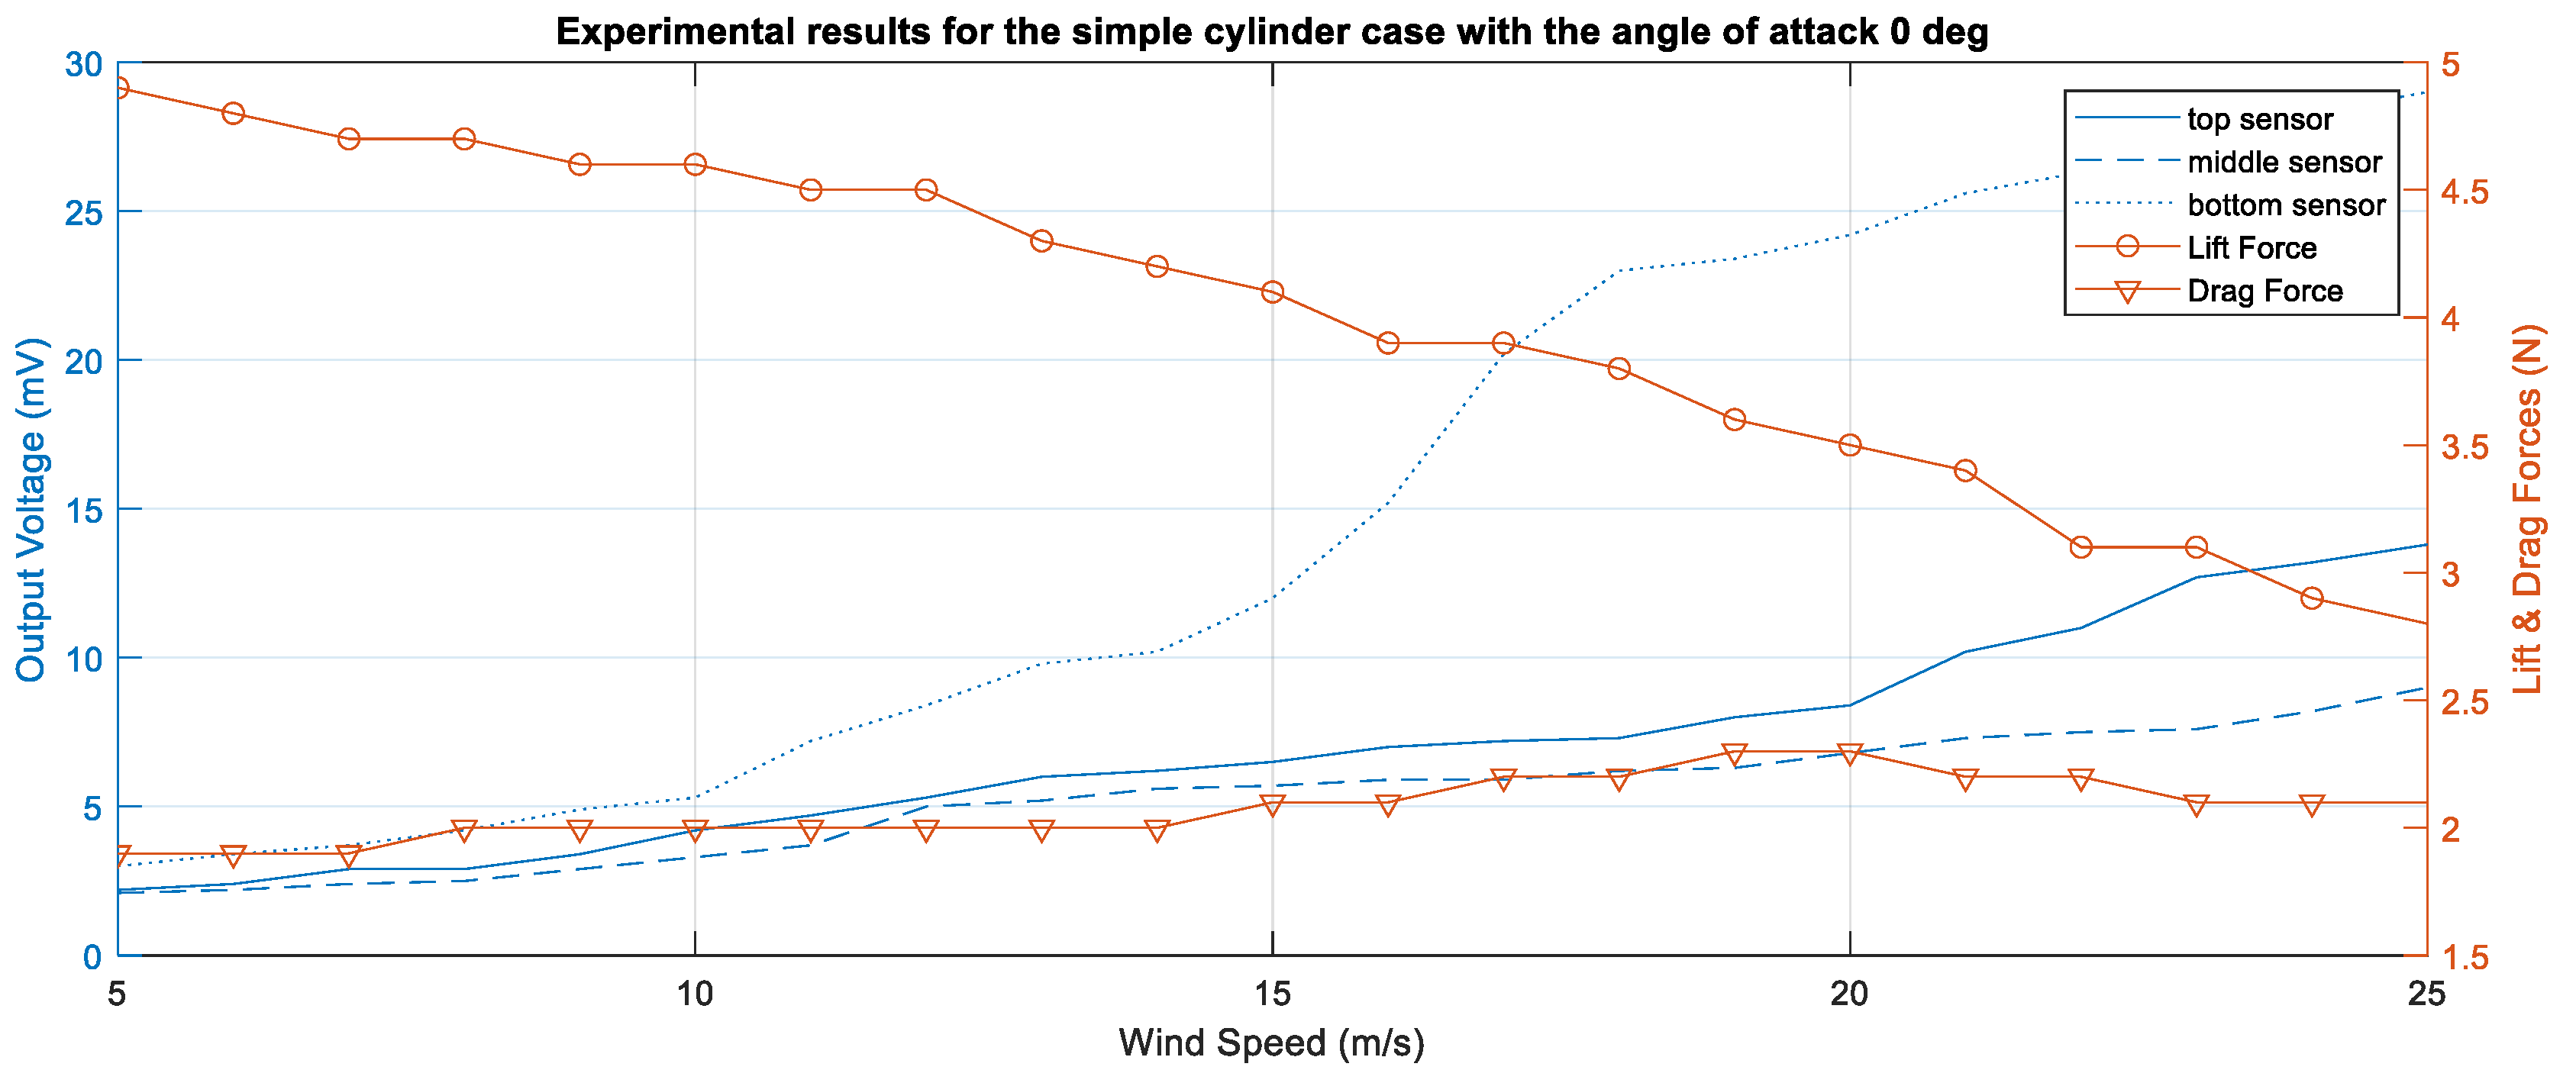
Figure A3 present measured voltage from the piezoelectric sensors located at the top, middle, and bottom of the mast at different wind speeds with a mast angle of 0 degrees. The mast is now facing the flow stream with no deviation.
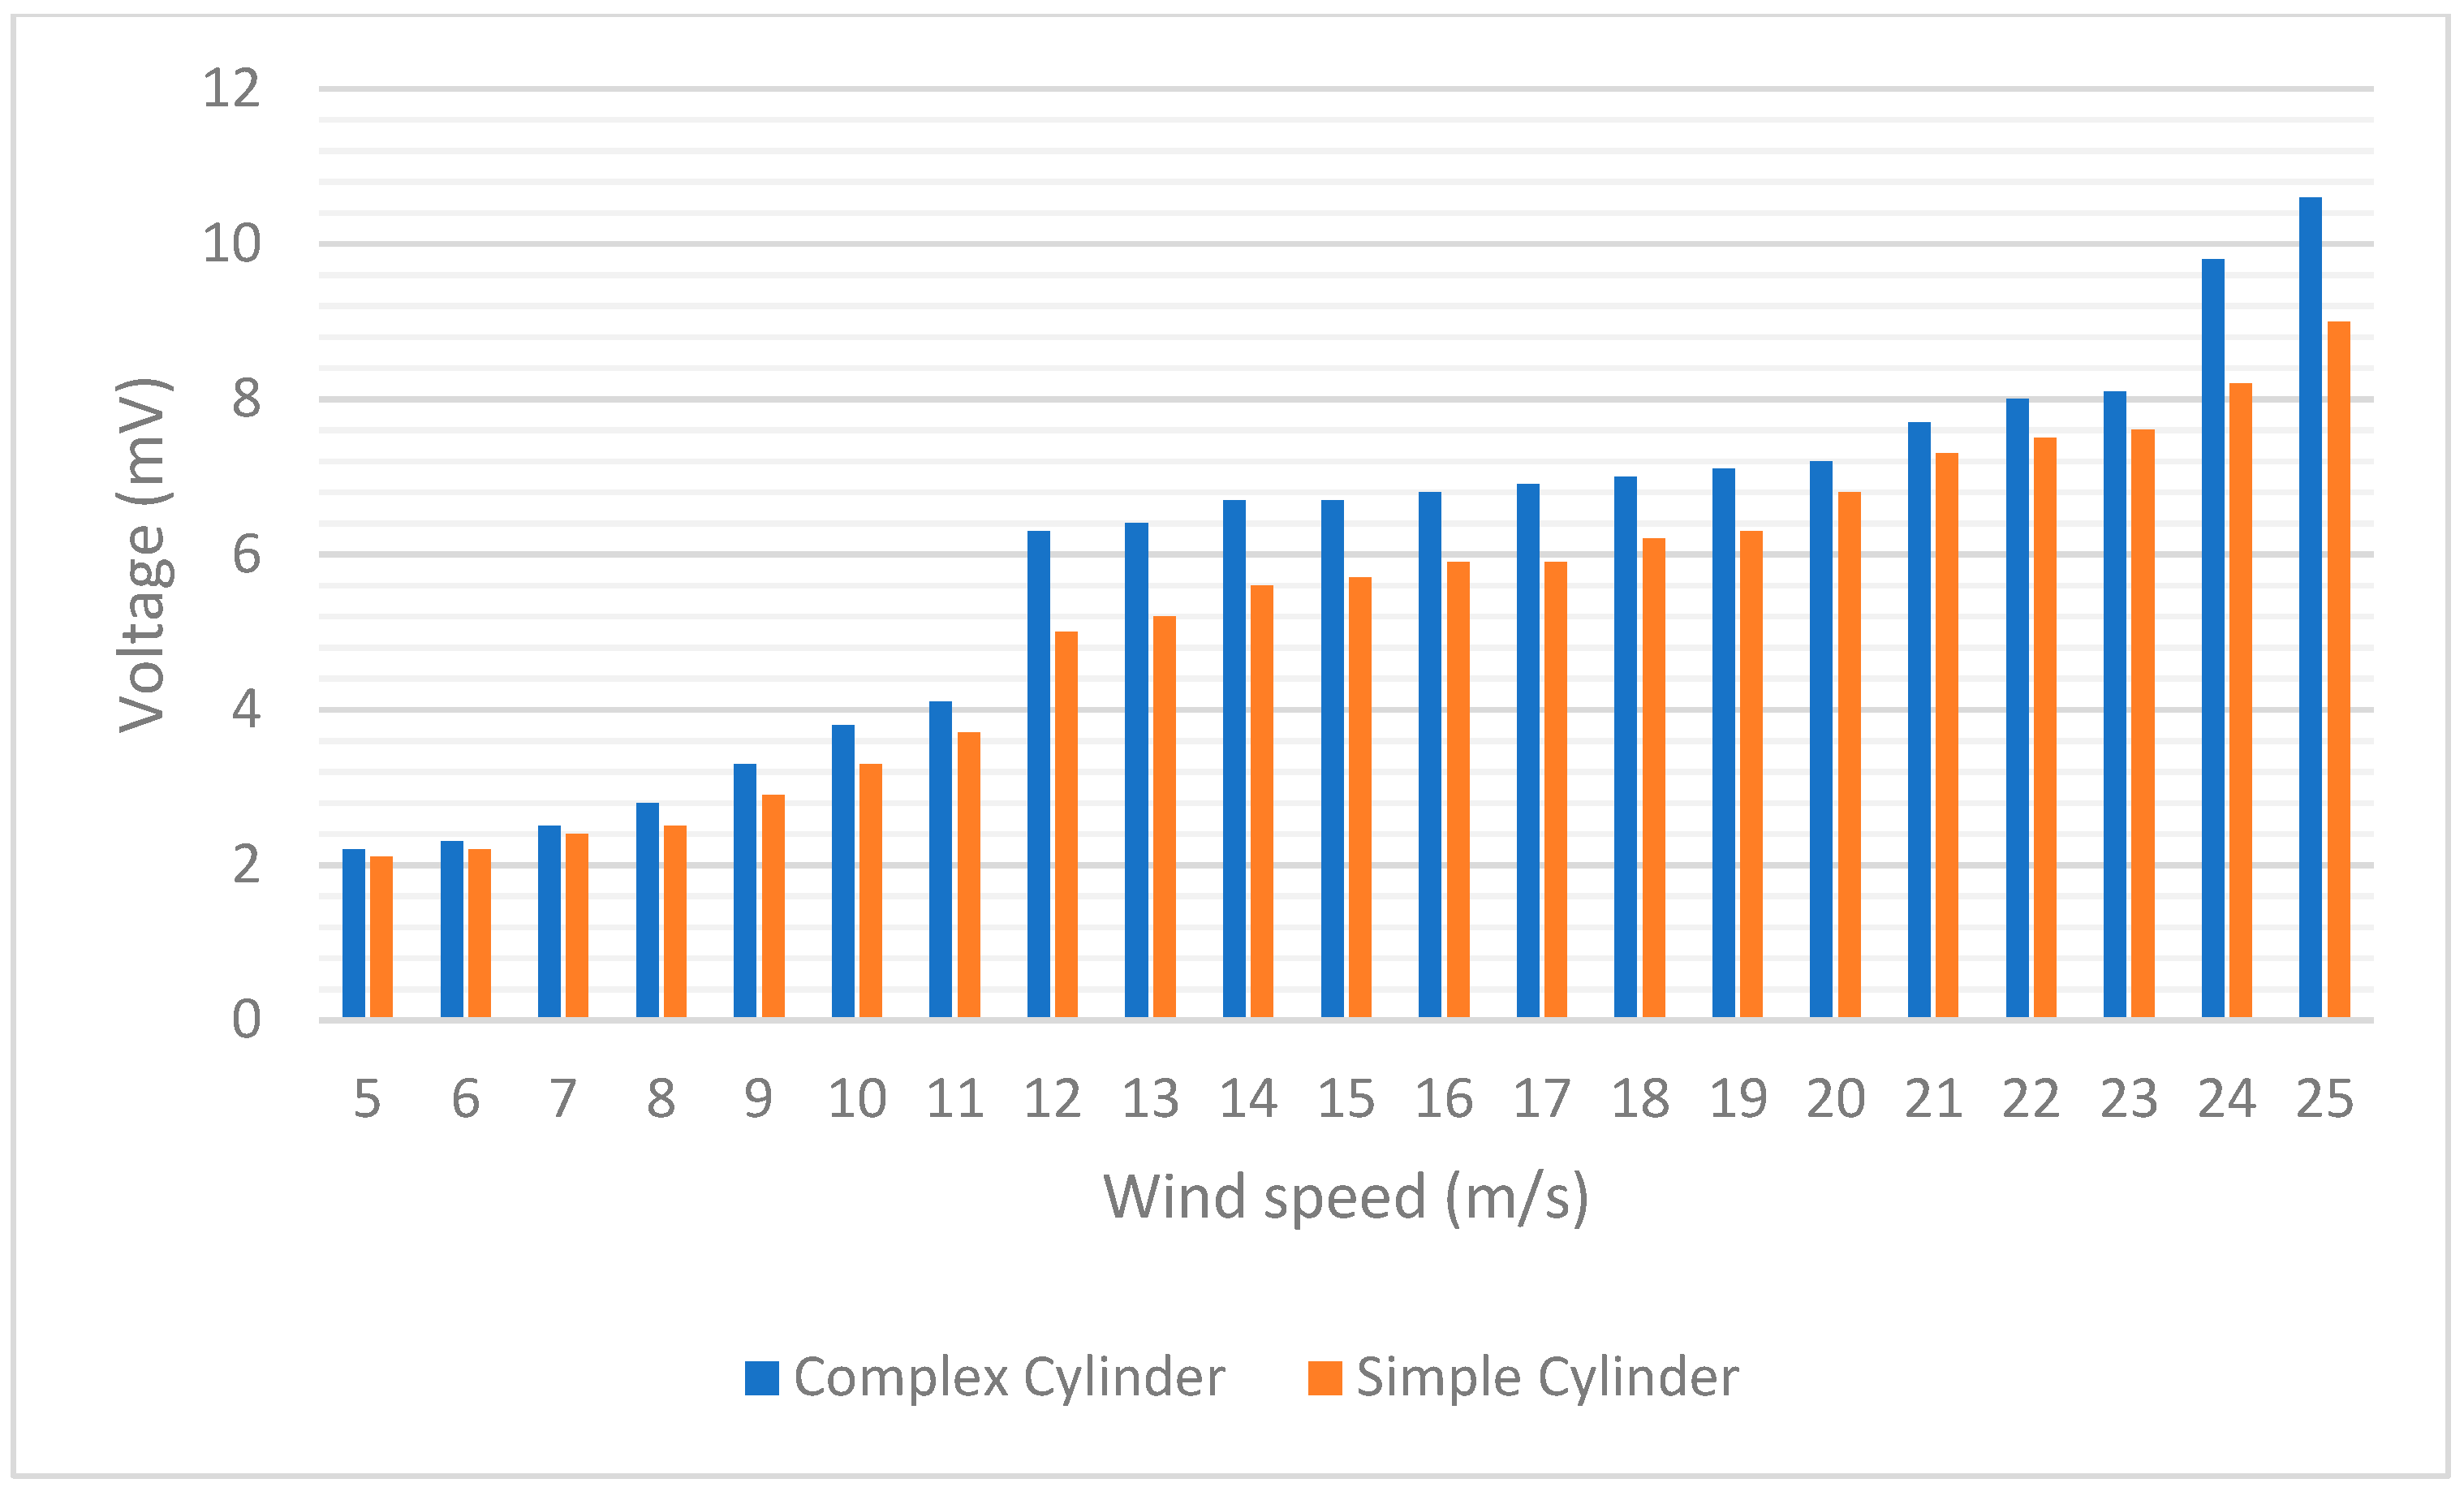
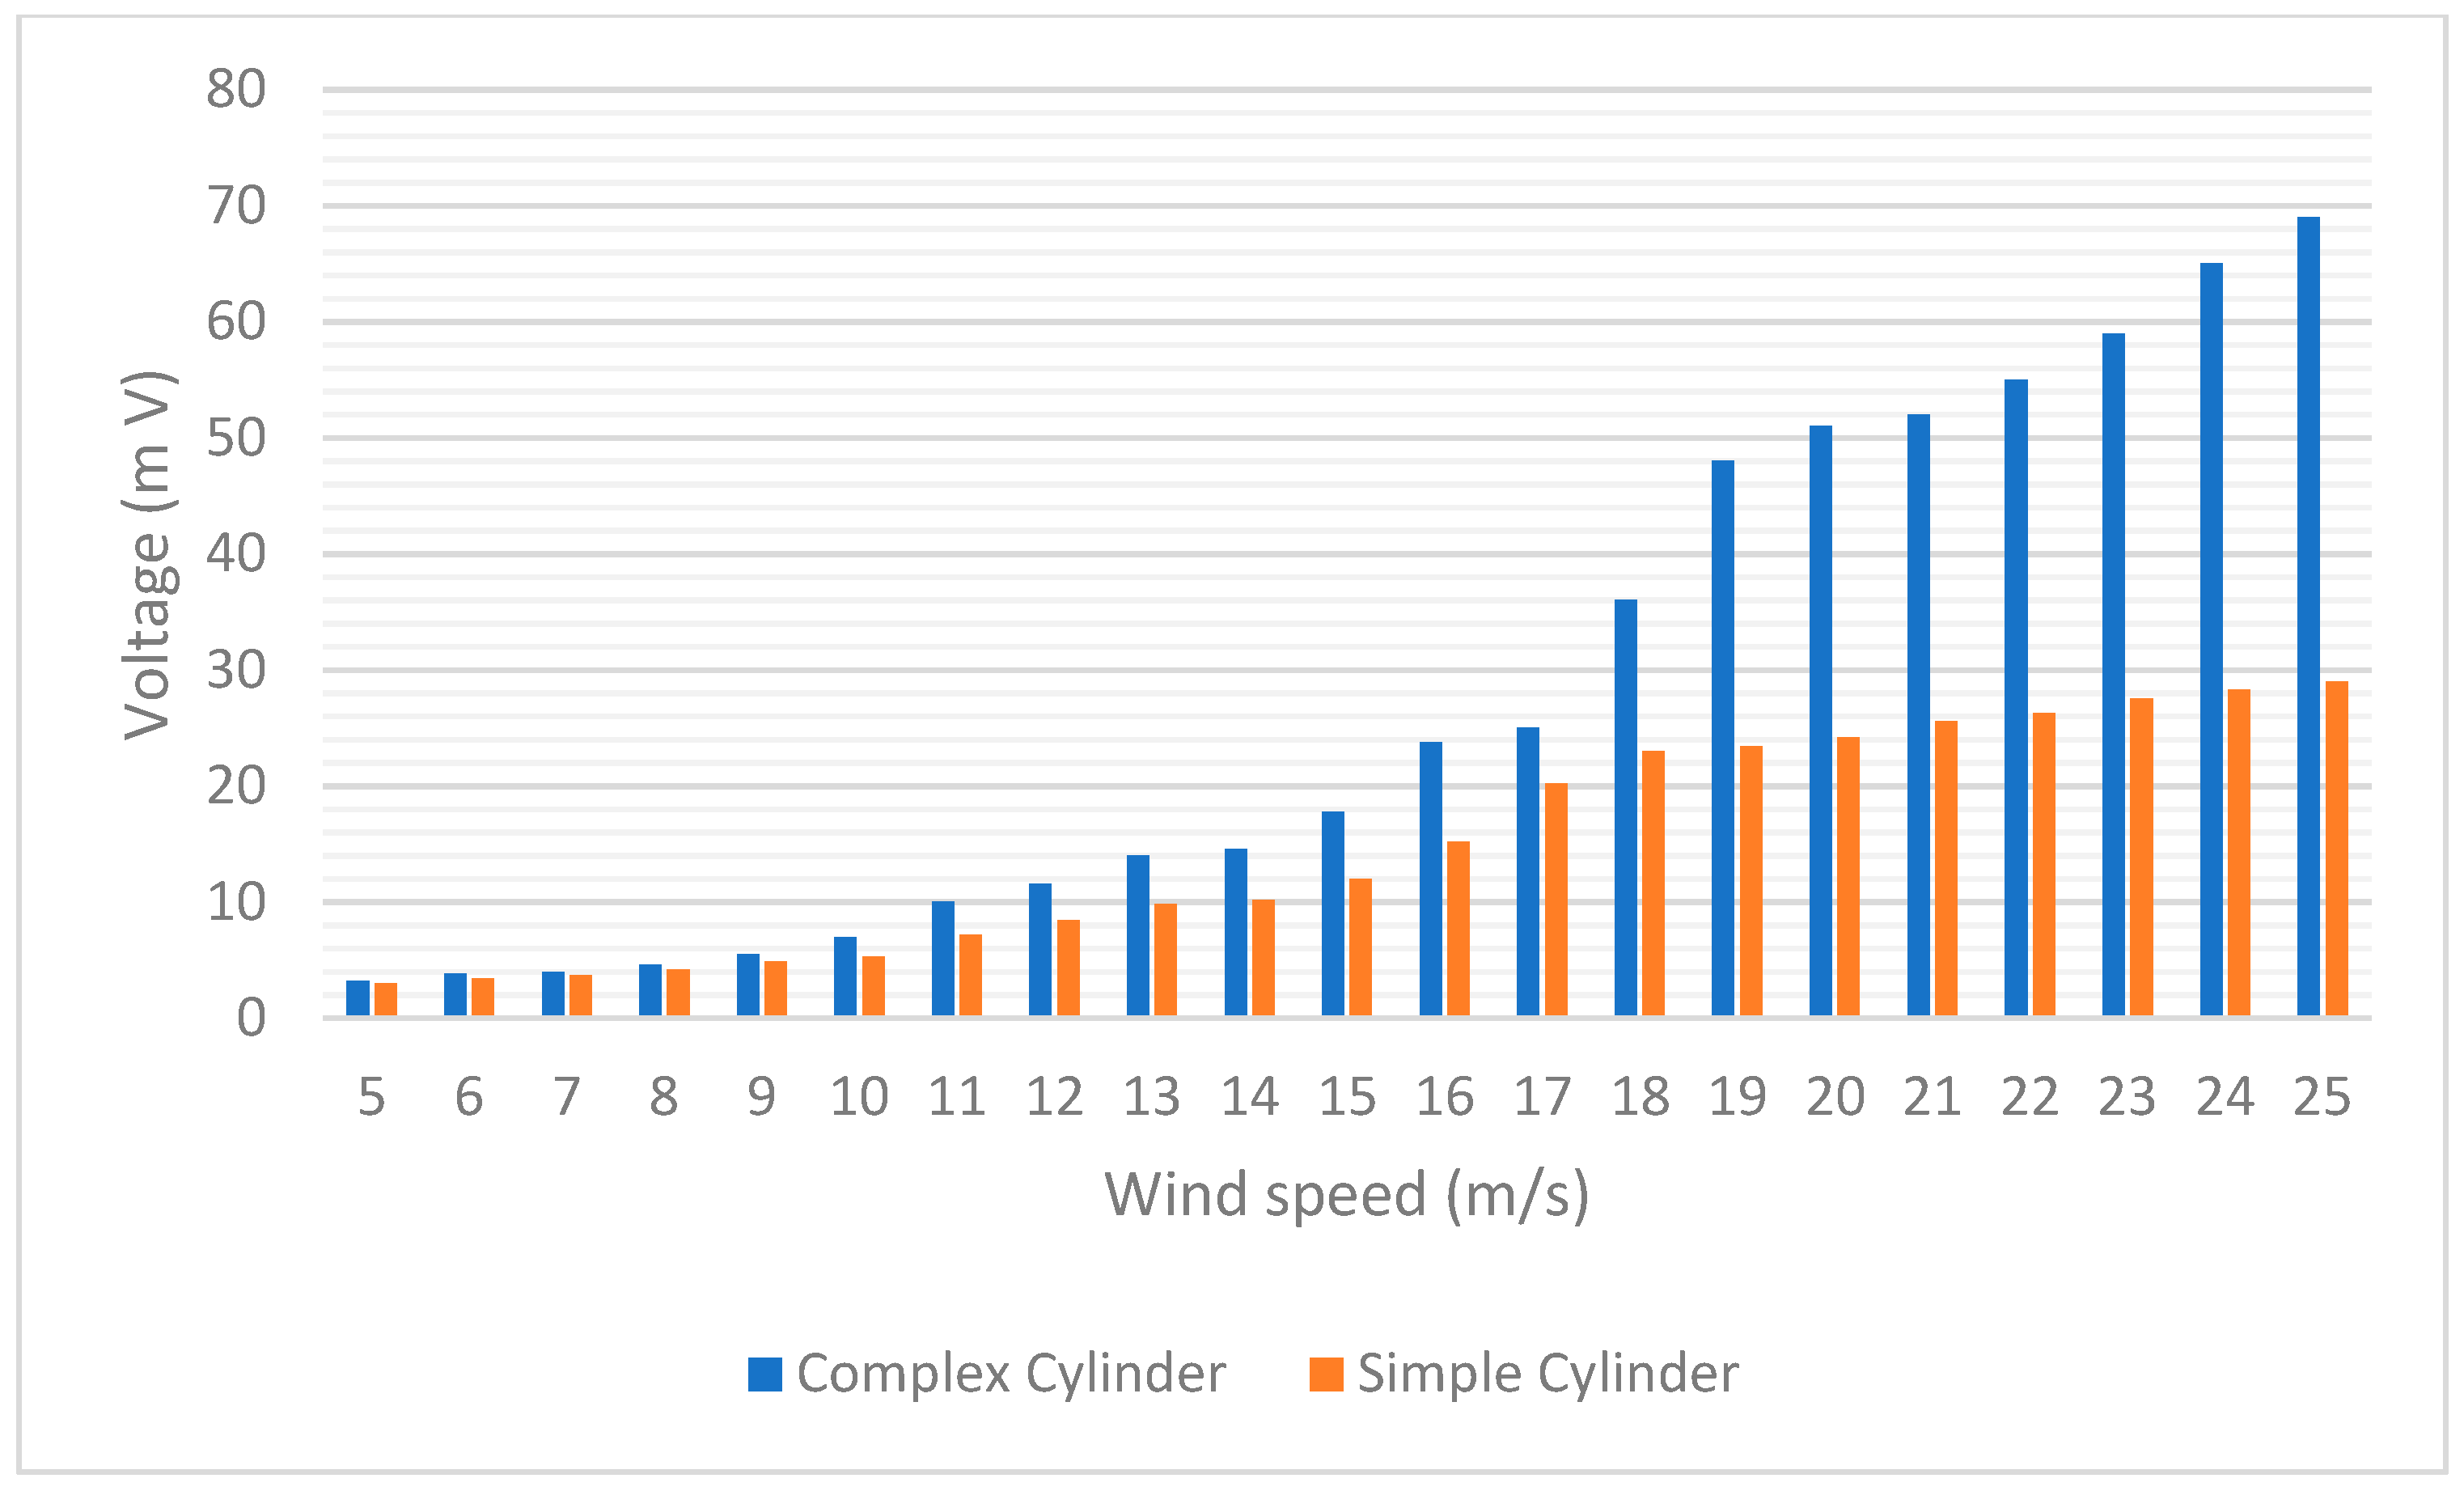
Figure A4 displays the measured voltage of all simple cylinders using the sensors located at the top, middle, and bottom of the mast at an angle of 0 degrees.
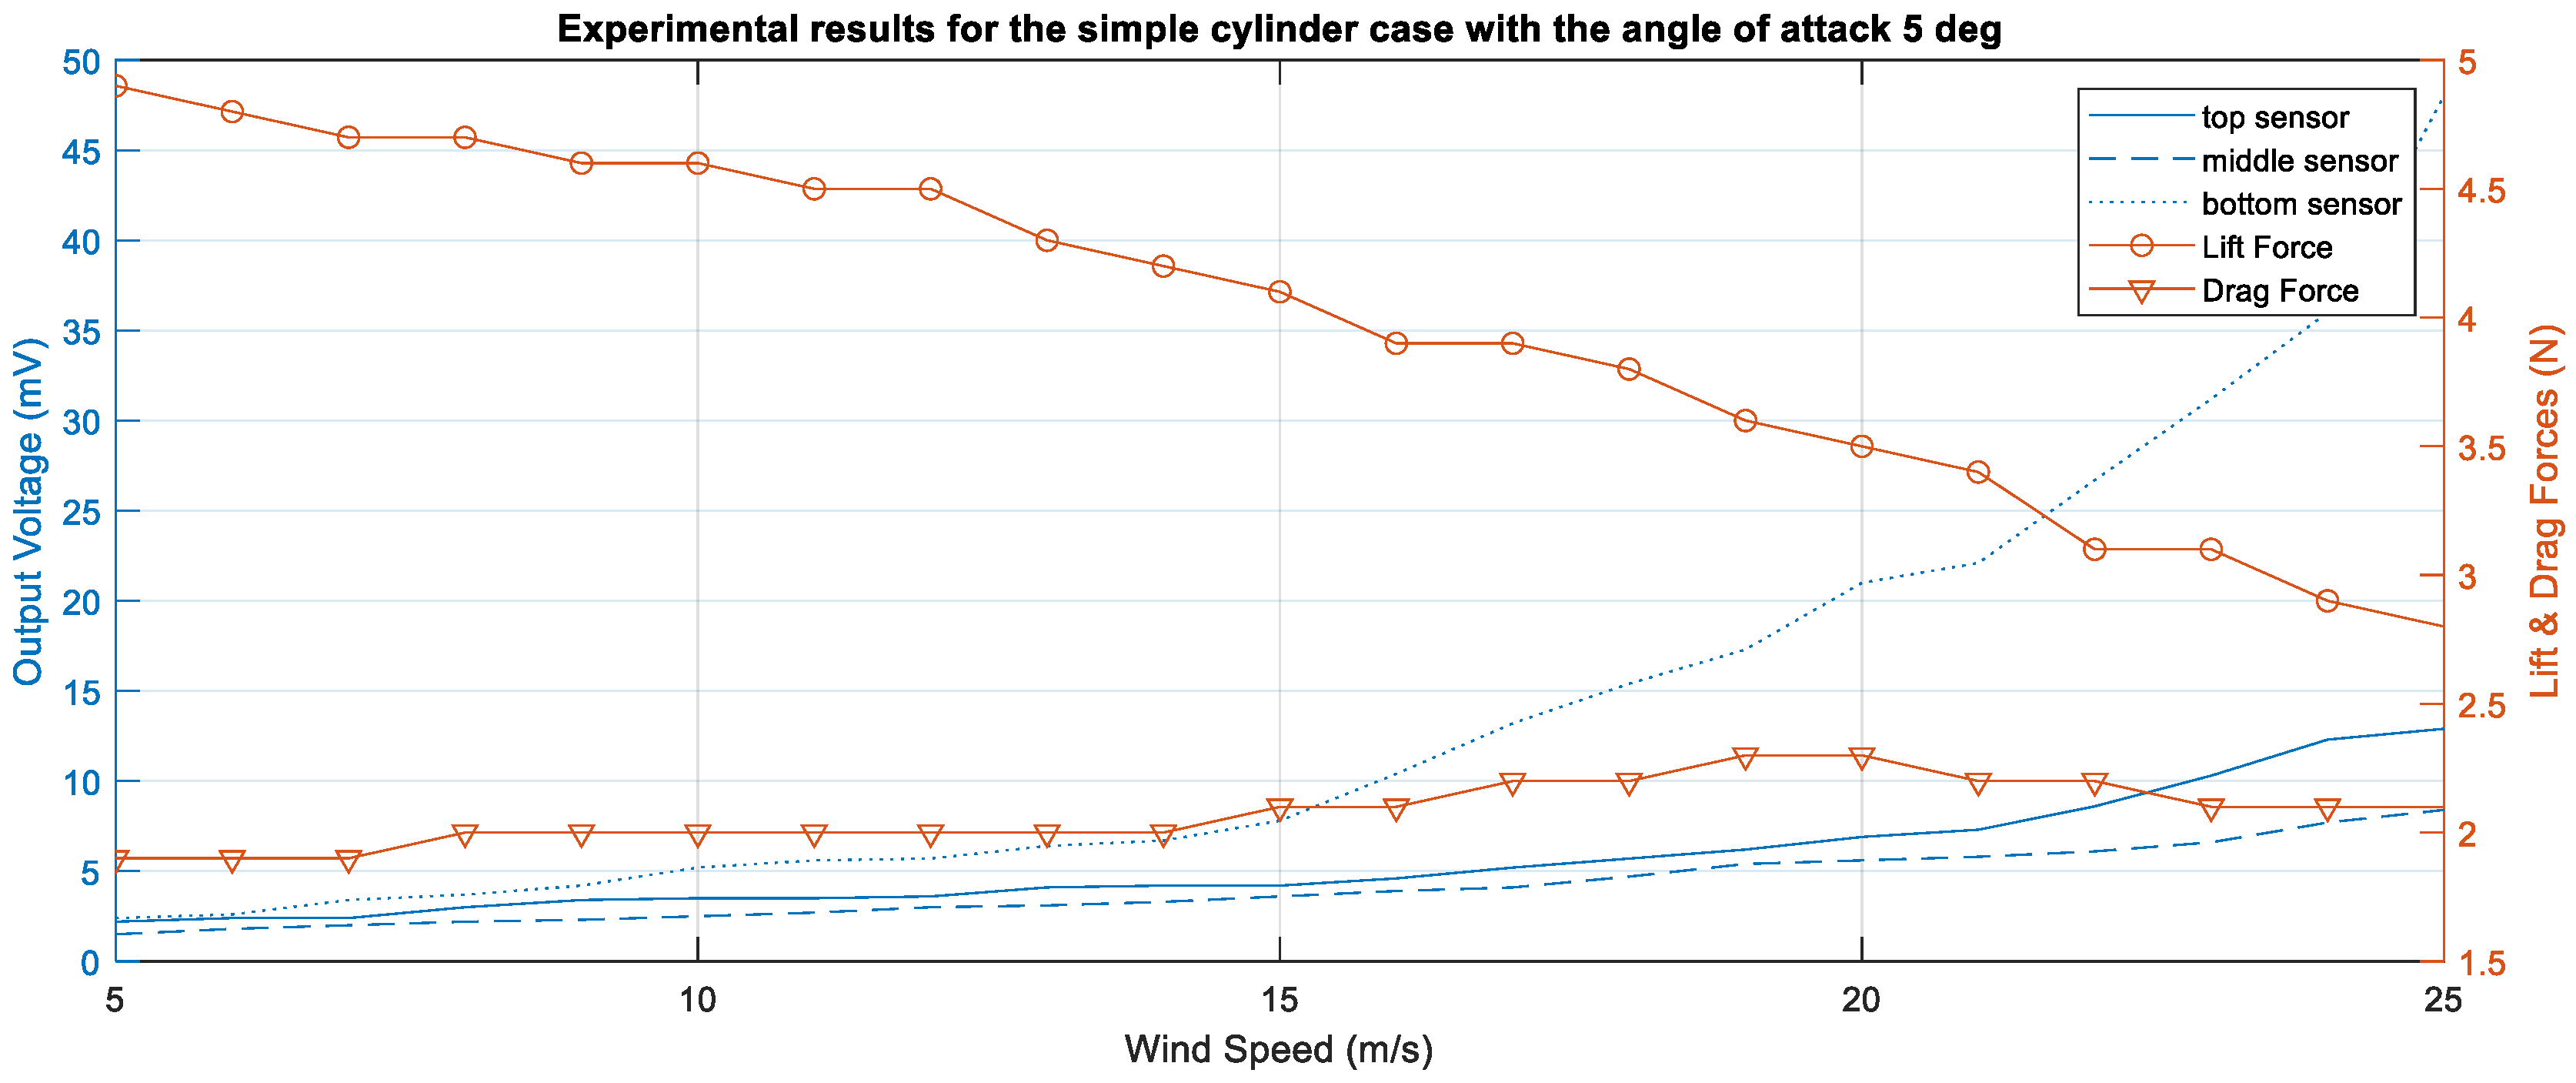
The angle of the mast was adjusted to be 5 degrees, and experimental work was carried out to investigate the effect of the mast angle of attack on the attainable power.
Figure A5 reports the experimentally harvested voltage and voltage readings using the piezoelectric sensor located at the top of the mast, at different wind speeds at a mast angle of 5 degrees, meaning the mast deviates by 5 degrees from the flow stream.
Figure A6 reports the experimentally harvested voltage using the piezoelectric sensor located at the middle of the mast with a mast angle of 5 degrees.
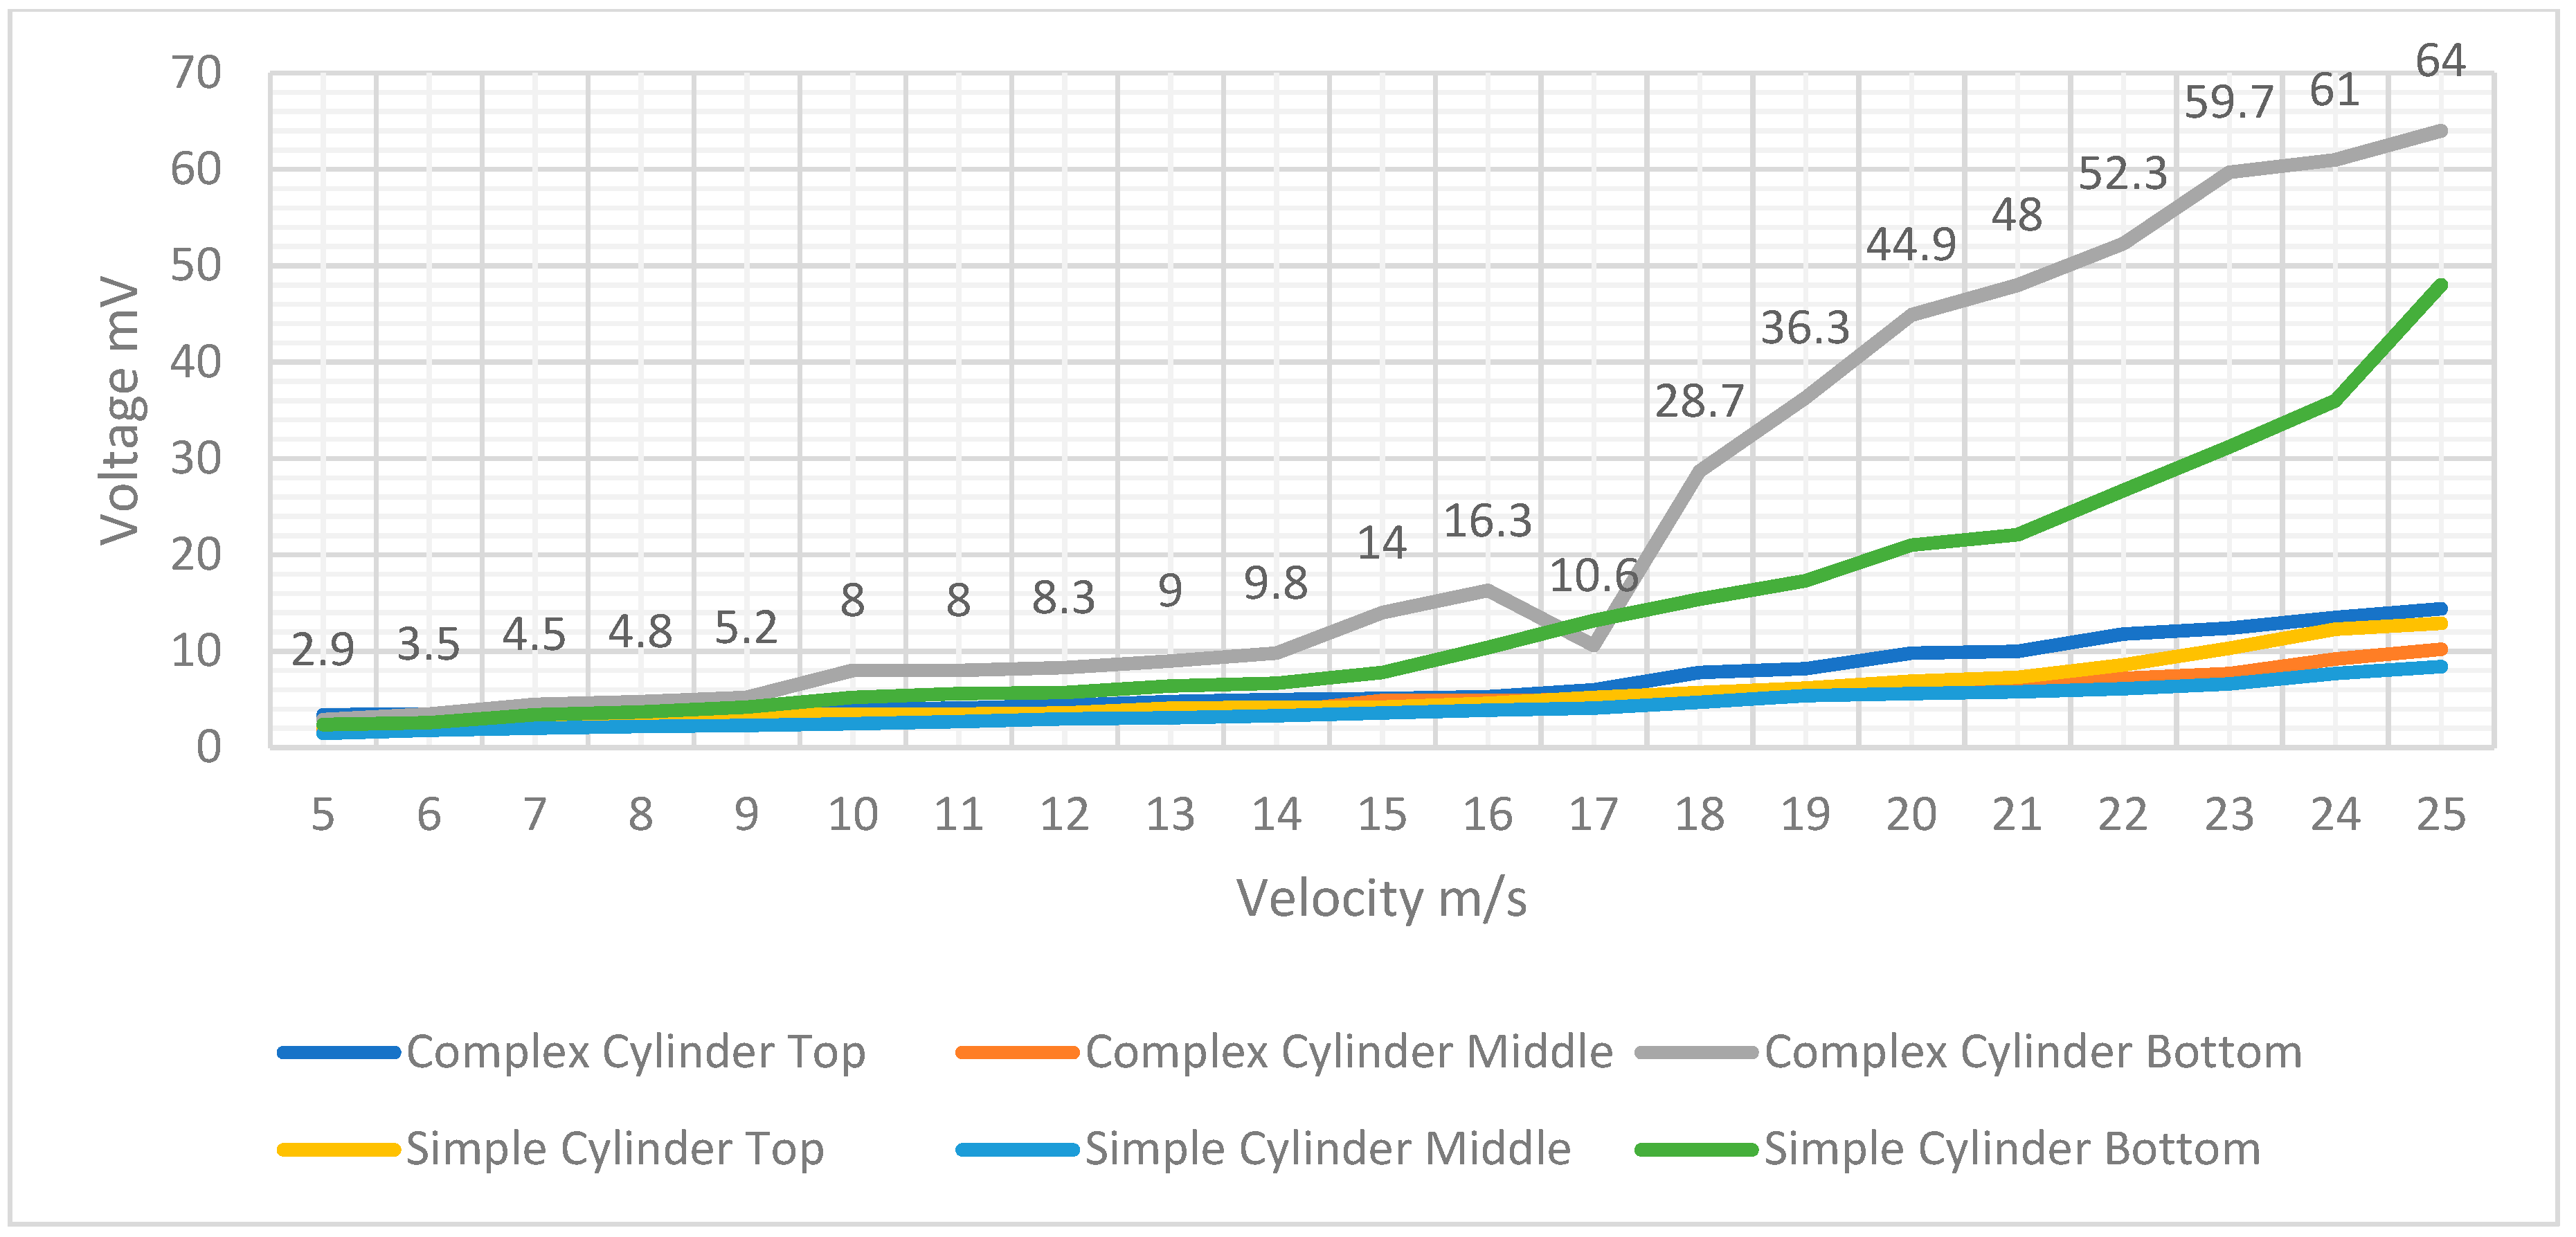
Figure A7 reports the experimentally harvested voltage using the piezoelectric sensor located at the bottom of the mast with a mast angle of 5 degrees.
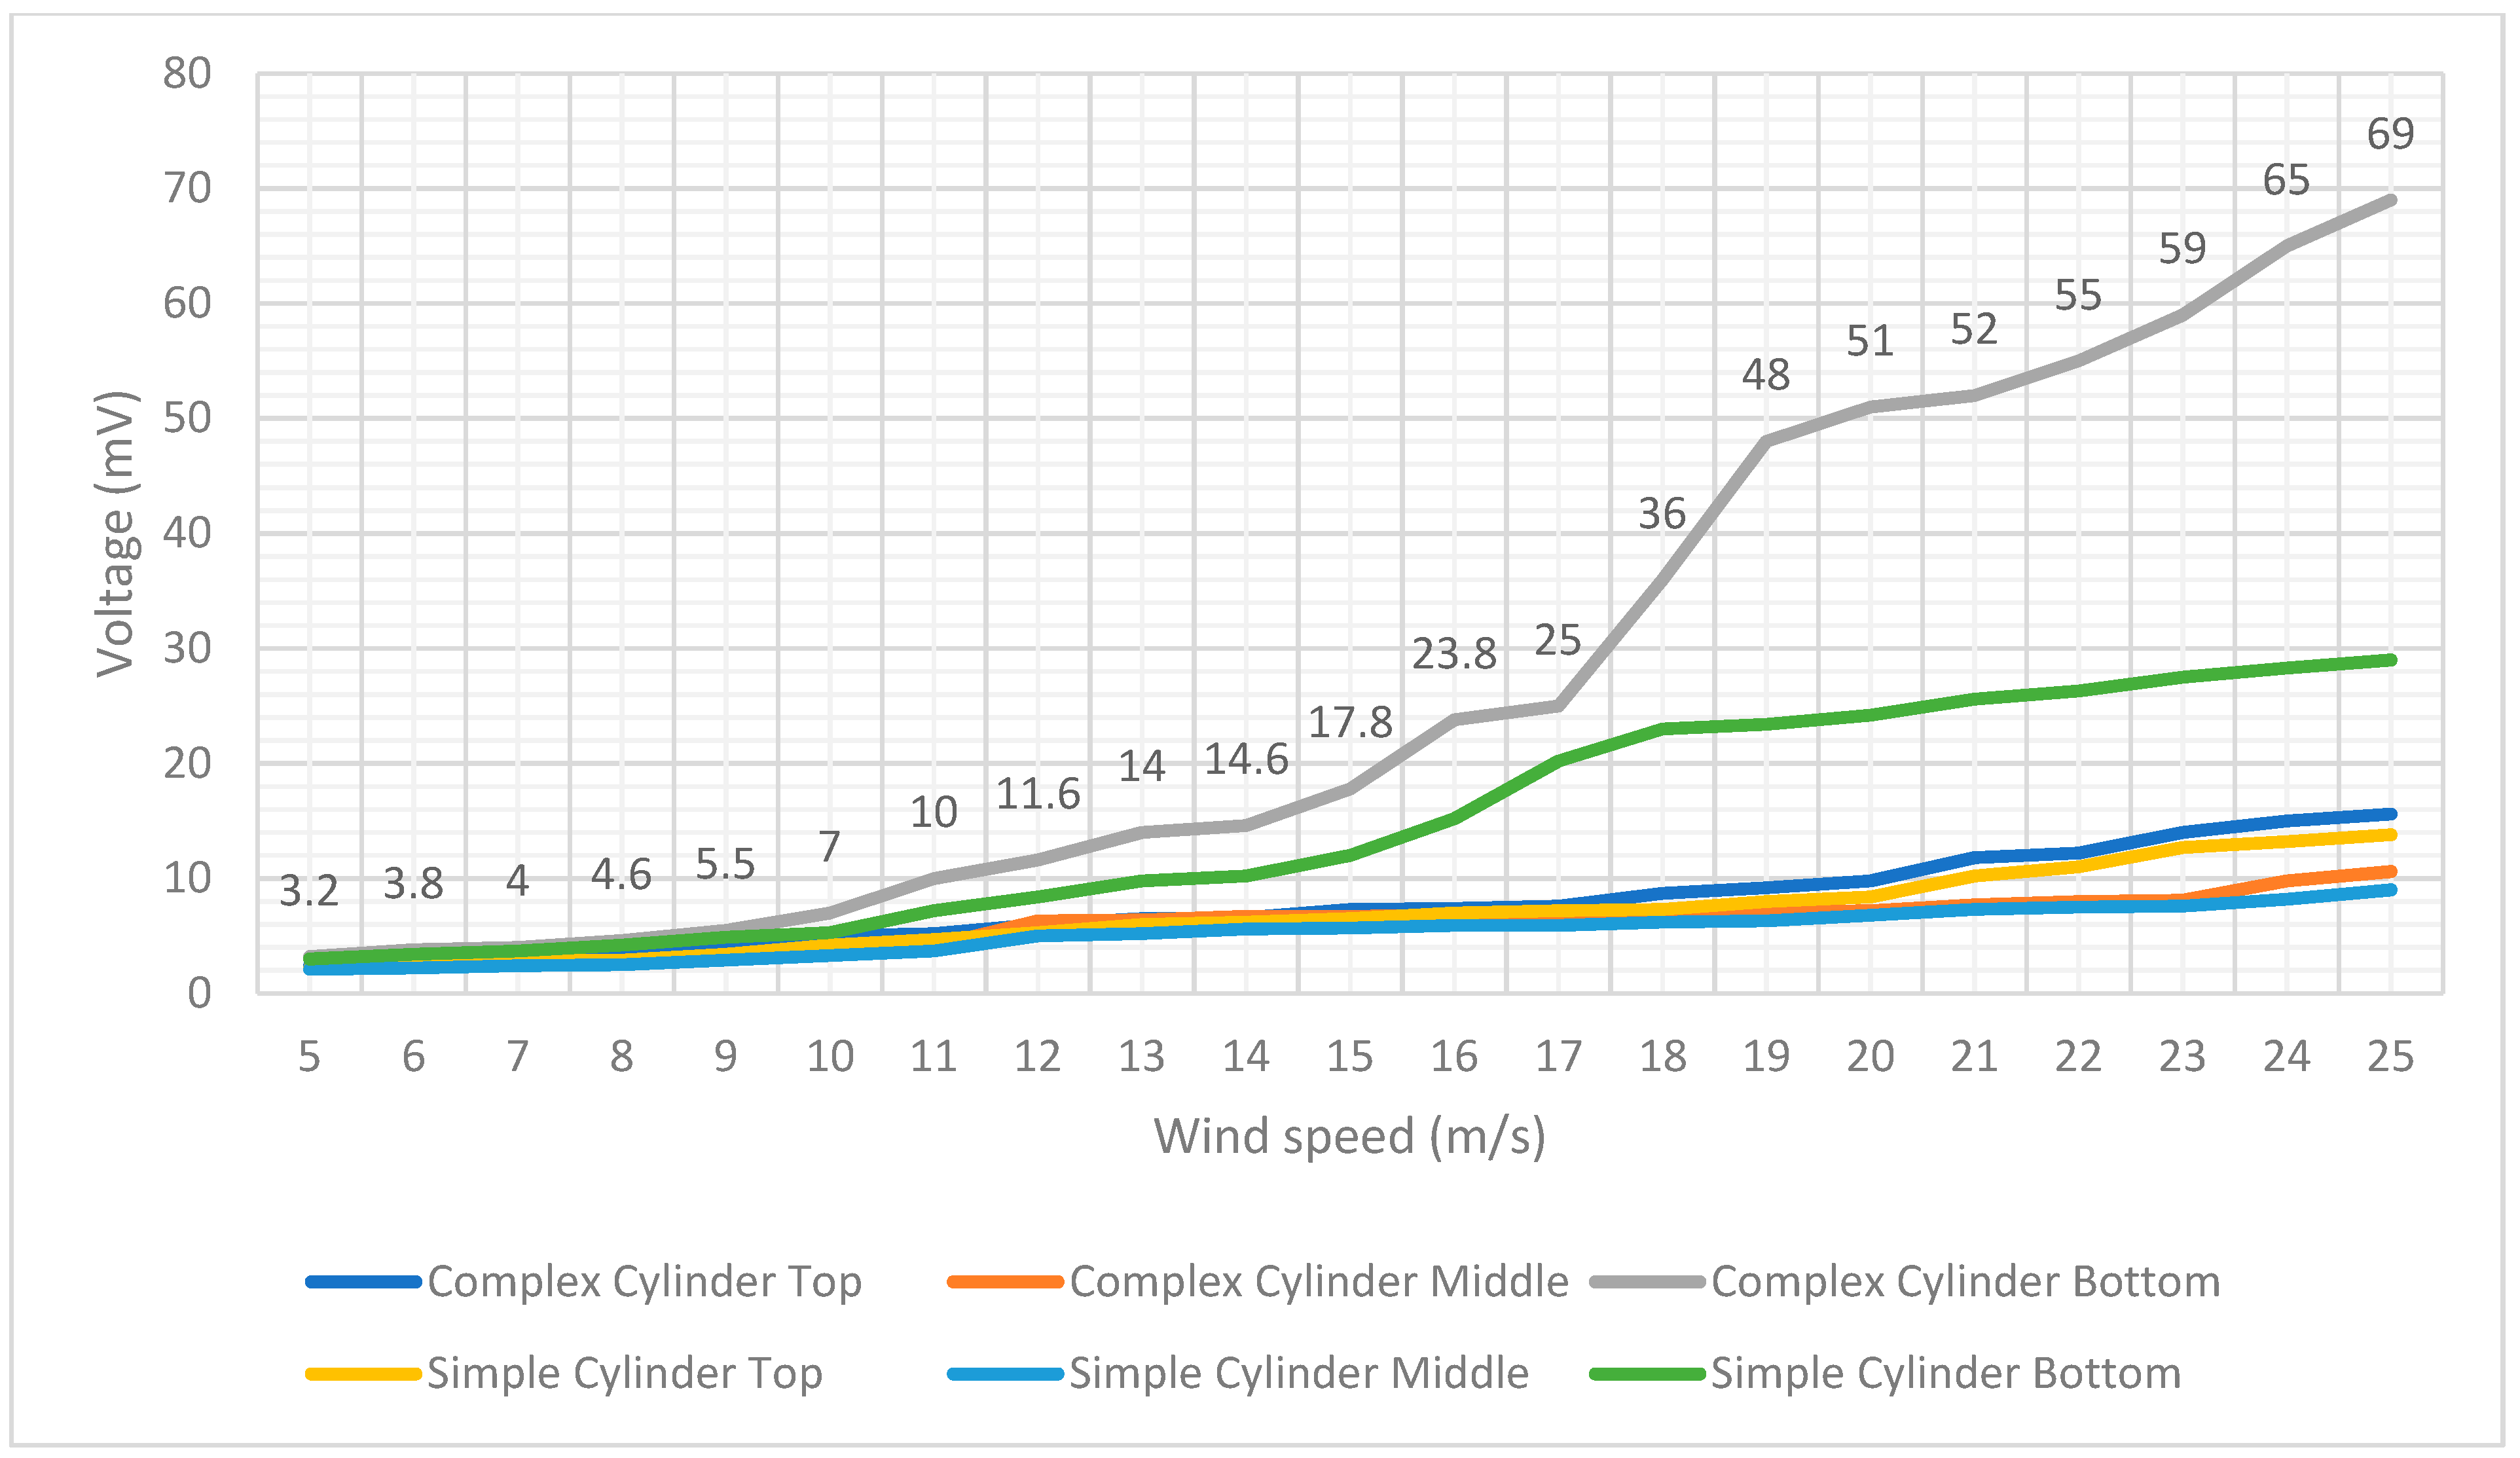
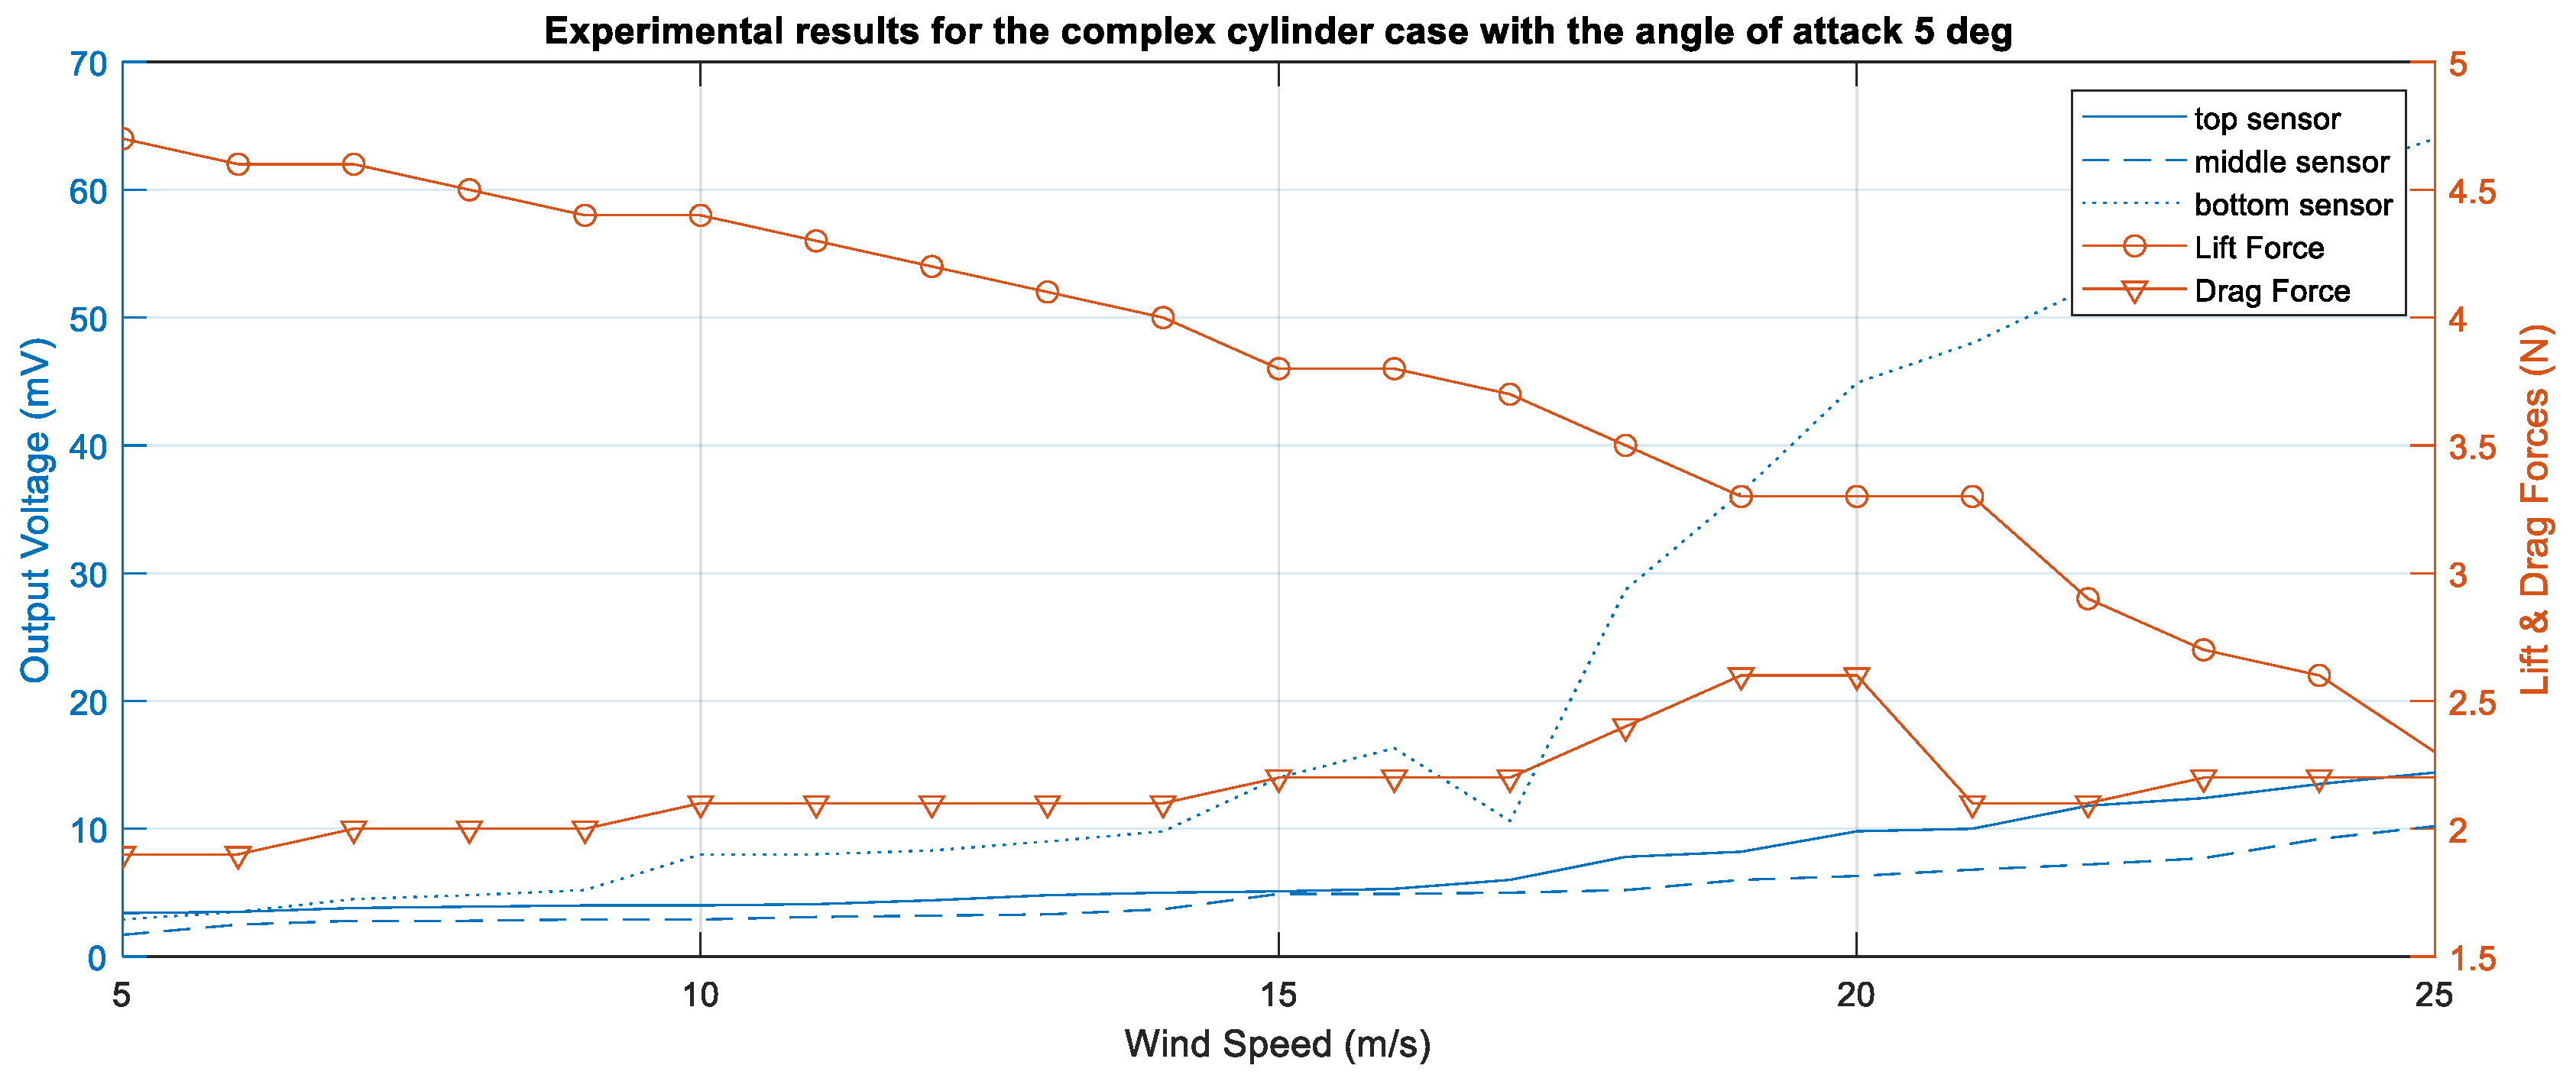
Figure A8 displays the harvested voltage of all simple cylinders using sensors located at the mast’s top, middle, and bottom with a mast angle of 5 degrees.
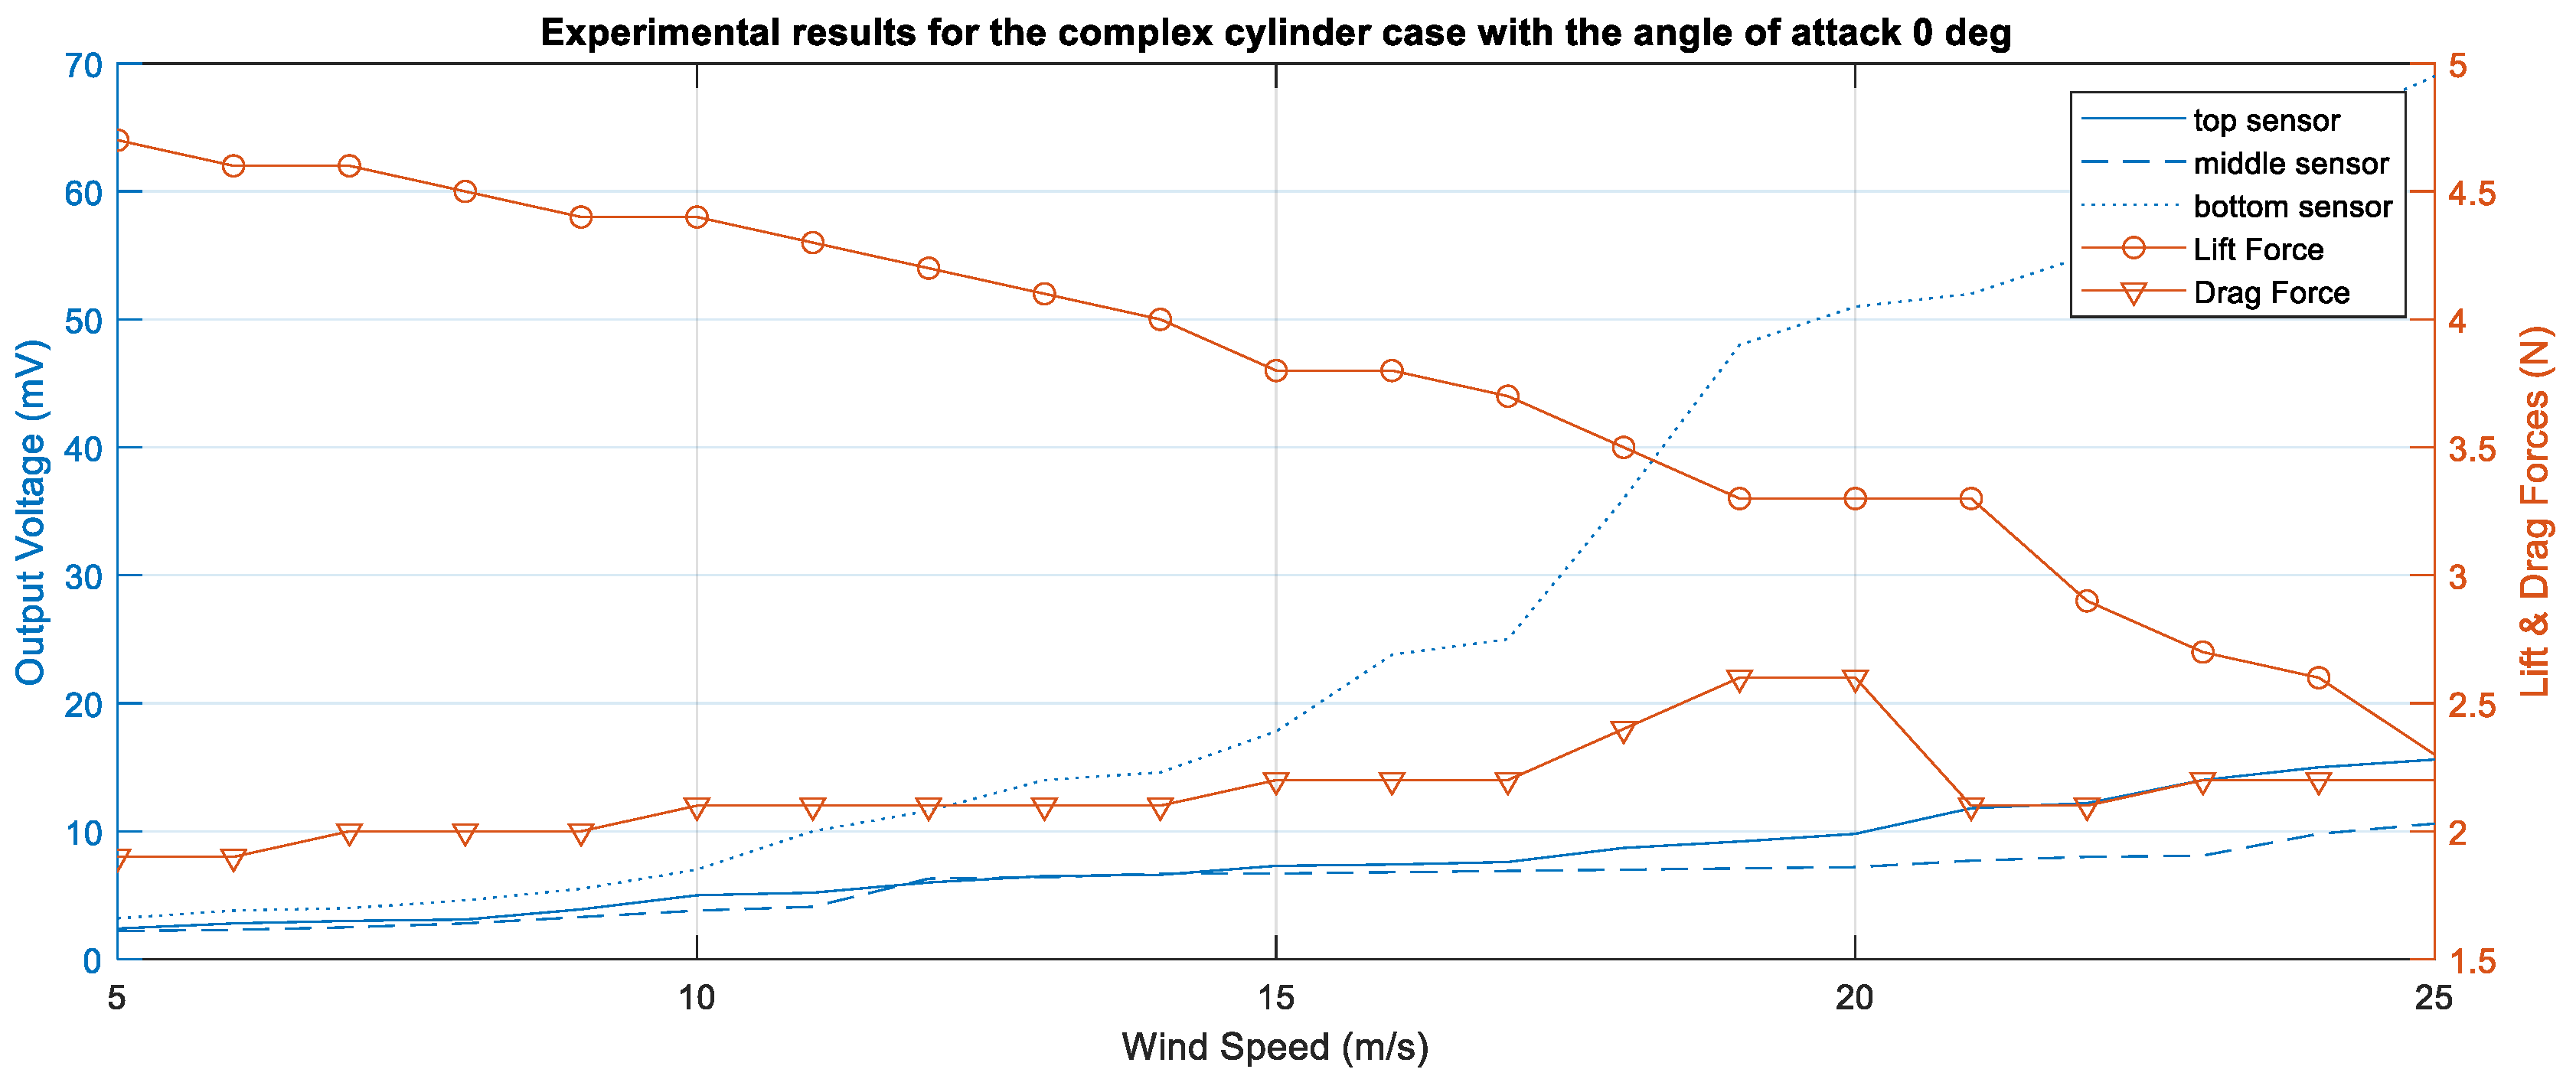
Figure A8 clearly shows that a complex cylinder design with the piezoelectric sensor placed at the bottom of the mast produced the highest amount of energy. The measured voltages were 64 mV at a wind speed of 25 m/s and 44.9 mV at a wind speed of 20 m/s compared to the other designs at both angles and at all possible locations of the piezoelectric sensors. A simple cylinder design with the piezoelectric sensor placed at the bottom comes in second place, generating 49 mV at a wind speed of 25 m/s and 21 mV at a wind speed of 20 m/s. Therefore, based on the obtained results, it can be concluded that the complex cylinder vortex generator design is more feasible and efficient than the other tested designs. Moreover, the best option for the complex cylinder design configuration turned out to be at a 0-degree angle with the piezoelectric sensor placed at the bottom. There is a slight deviation in the results because the voltage reached 69 mV, while other trials reached maximum values of 64 mV at a 5-degree angle. The full-power harnesses achieved by complex cylinder design are 212 nW at a wind speed of 20 m/s.
6. Conclusions
This paper proposed a novel and new VIV design to harvest and convert mechanical energy to electric energy using a vortex-induced vibration technique. The proposed design is a bladeless elastic rod that vibrates when wind interacts with it. Out of the mechanical vibrations and rod oscillations, electric energy can be harvested through piezoelectric sensors attached to the mast at three locations. The design is environmentally friendly, with comparably good reliability. The effect of changing the vortex generator shape on the VIV phenomenon and VIV energy harvesting was investigated numerically and experimentally. Three different inlet wind velocities were investigated for three different vortex generator geometries: a simple cylinder, a modified cylinder, and a real-world-sized complex cylinder vortex generator. CFD simulations were performed to investigate the flow pattern and the generated vortices. Velocity, pressure, and vorticity contours were generated and analyzed. Piezoelectric sensors were utilized to measure generated power. Their optimal locations were also investigated. More importantly, the transient behavior of the lift coefficient over time is given for each case. The results of the numerical study demonstrate that increasing the inlet wind velocity increases the maximum magnitude of the lift coefficient, its frequency, and the time needed to reach the pseudo-steady situation in this problem, which has a transient nature. In addition, adding complexity to the cylinder geometry substantially enhances the maximum lift force applied to the vortex generators and can boost the efficiency of VIV energy harvesting. The trends of the numerical results are found to be in good agreement with those of the experimental tests. The experimental results show that the location of the piezoelectric sensor influences the amount of generated power. Increasing the distance from the vortex generator object does not directly increase the generated power, and this could be because the mast obstructed the wind flow around the vortex generator and the constraint for mast movement. If such designs are refined and enhanced in terms of design geometry and the materials utilized in manufacturing the mast of the VIV design, a good quantity of power can be created. The developed and tested methods yielded good results.


 ,
, 