Article

A Study on the Estimations of the Tension of the Overhead Wires Using Data from Acceleration Sensors

Smart Power Distribution Laboratory, Korea Electric Power Corporation Research Institute, Daejeon 34056, Korea
*
Author to whom correspondence should be addressed.
Appl. Sci. 2022, 12(15), 7736; https://doi.org/10.3390/app12157736
Submission received: 12 July 2022 / Revised: 25 July 2022 / Accepted: 28 July 2022 / Published: 1 August 2022
(This article belongs to the Special Issue IoT-Enhancing the Industrial World)

Abstract

:
One of the important tasks of the distribution system is to operate the distribution system in consideration of the safety. It is also important to minimize and prevent possible failures in the distribution system. In terms of overhead wires, it is necessary to measure the tension of it for the purpose of ensuring safety. However, it is difficult to install sensors for measuring the tension of the overhead wires in the field as there would be huge difficulties to re-install facilities such as existing wires after dismantling them. Thus, it is difficult to manage the risk of overhead wires through tension measurement. To solve and alleviate this problem, this paper proposed and verified a method of attaching an acceleration sensor that does not require dismantling or re-installation of existing facilities to the overhead wires and estimating the tension using the data measured from the sensors. As a result of the verification, it was confirmed that the estimated tension showed a significant level of accuracy with an average of 90.39%, and on the basis of this result, it is expected to contribute to safety management of overhead wires in the future.

1. Introduction

Currently, the Korea Electric Power Corporation (KEPCO) checks the dips of the overhead wires, which are measured for the purpose of managing their safety. In KEPCO’s distribution system design standards, it stipulates that a dip is calculated and managed as described in Table 1 [1].
In principle, after the criteria for allowable tension are derived through the above formula, it is necessary to check whether the allowable tension is exceeded to confirm the safety of the wires and cables, yet it is not easy to measure the tension in the actual field. This is because, in general, measurement of the tension of the overhead wires requires the installation of a specific tension measurement sensor. As already mentioned above, installation of such a sensor is necessary to dismantle the existing parts such as wires and re-install it. Nevertheless, the facts that the asset management paradigm is changing from one-time consumption to efficient asset management and the overhead wires can actually be failed due to fatigue damage accumulation suggests the necessity for the tension measurement.
Nevertheless, there is no suitable way to estimate the tension of the overhead wire except for the use of a tension sensor. Accordingly, in the field, the subjective judgment of the person in charge determines whether there is an abnormality in the tension of the overhead wire. This research proposed a method to estimate the tension of an overhead wire using an acceleration sensor that is easy to install additionally on the overhead wire, unlike the tension sensor. Obviously, there are many studies or approaches to solve various problems in the field using acceleration sensors, but research conducted focusing on the aspect of tension of the overhead wire is extremely limited, and most of the studies estimate tension of cables applied to bridges, not power facilities. This study differs from previous studies as an acceleration sensor was used for the method to estimate the tension of an overhead wire whose tension was continuously fluctuated by wind, among other factors.
The composition of this paper is as follows: the reviews of related studies are described in Section 2, and Section 3 describes a method of estimating the tension of an overhead wire using the proposed mechanism. Section 4 describes the verification of the proposed method, and Section 5 describes the conclusions.

2. Related Works

In Reference [2], a new non-destructive evaluation method for cable tension monitoring was proposed on the basis of the elasto-magnetic effect and the self-induction phenomenon. The method was called the elasto-magnetic induction (EMI) method. This paper simplified the primary coil and induction unit of the traditional elasto-magnetic (EM) sensor into a self-induction coil. In addition, experimental verification of steel cable specimens was performed to verify the validity of EMI methods, and data processing and tension calculation methods were proposed to handle tension monitoring. Reference [3] deals with the analysis of subsea cable tension, which is essential for laying work to place subsea cables. In [2], the fatigue failure of subsea cables was mainly studied. Mathematical modeling was used in consideration of a number of parameters to solve and analyze the problems. Two types of subsea cable tension analyses have been studied: tensional analysis of catenary configurations and tensional analysis of lazy wave configurations. The two analyses were solved using minimization through a gradient-based approach to tension analysis of different subsea cables. Reference [4] proposed for the accurate measurement of cable tension, which is essential in the construction and maintenance stages for cable-supported bridge systems. In addition, to replace the numerical iterative process based on the transverse vibration equation of a cable, a practical formula for estimating the cable tension in a simple explicit form including bending stiffness of the cable has been proposed. Reference [5] proposed a practical formula for the vibration method considering the effect of flexural rigidity and sag of a cable into account. The corresponding formula is based on a high-accuracy approximation to the equation of the inclined cable with flexural rigidity, and the cable tension is easily estimated by these formulas using the measured natural frequency in the low-order modes. In [6], the authors proposed a novel technique for estimating cable tension from measured natural frequencies. The proposed method can simultaneously grasp the tension, flexural rigidity, and axial rigidity of the cable system. First, a finite element model that can consider both sag-expandability and flexural rigidity for the target cable system was built. Next, a frequency-based sensitivity update algorithm to identify the model was applied. Previous theories of calculating cable tension can cause unacceptable errors in many applications because cable sag and bending stiffness are ignored. Therefore, Reference [7] proposed the empirical formulas to estimate cable tension on the basis of the cable fundamental frequency only, which could be derived by using the solutions by means of energy method and fitting the exact solutions of cable vibration equations where the cable sag and bending stiffness are, respectively, considered. Conventional vibration methods for estimating cable tension are mainly based on measured acceleration responses. These methods are relatively expensive and time-consuming because they require the installation of contact sensors and data collection systems. In [8], a contactless vision-based sensor was proposed as an alternative to determining cable tension. The proposed method was applied to measure the cable forces for the cable-supported roof structure of the Hard Rock Stadium in Florida, and a series of field tests were conducted at various roof erection stages to ensure that the cable force reached its design values. In [9], the authors proposed an automated cable tension monitoring system using deep learning and wireless smart sensors that can estimate cable tension forces. Using a region-based convolution neural network, a fully automated peak-picking algorithm tailored to cable vibration was developed, and a vibration-based tension estimation method to automated cable tension monitoring was applied. The developed system features embedded processing in wireless smart sensors, including data acquisition, power spectral density calculation, peak picking, post-processing for peak selection, and tension estimation. Contact sensors that are attached to cables to check the condition of cables can malfunction under severe weather conditions, making it impossible to estimate the condition of cables under such unfavorable conditions. Therefore, in [10], a fully contactless video-based stay-cable tension measurement technique for recording videos using a moving handheld camera at a significant distance from the structure itself was proposed. In [11], a framework was proposed that takes wireless sensor data as input, then reconstructs packet loss samples, and provides real-time tension estimation as output. The framework first adopts a compressive sensing algorithm to reconstruct the data due to packet loss. Then, real-time frequency fluctuations were estimated using the Blind Source Separation (BSS) technique by synthesizing the reconstructed responses from several sensors. Finally, real-time cable tension was estimated from frequency variations using the taut-string theory. In [12], the effect of structural and aerodynamic nonlinearity on dynamic wind loads on overhead wires was investigated. A time hysteresis response analysis was performed on the overhead wire to derive an equivalent static wind load when the wind is weak for snowfall conditions. Considering the two main effects of aerodynamic and structural nonlinearity, they proposed a modified method to enable the use of design methods based on equivalent static wind loads. In systems for railway catenary, the tension on the contact wires affects the performance of the line. In [13], a method for monitoring the status of such tension is proposed on the basis of the dependence of the waves propagating through the tensioned wire on the force pulling the wire itself. An analytical formula for propagation of waves in a tensile wire has been proposed, which has been used to obtain vertical acceleration of the wire when the external force acts as a concentrated input. In [14], the dropper span of the catenary system is modeled to investigate the effect of contact wire tension on dropper stress. The response equation of the contact wire and the theoretical equation of the dropper stress are inferred.
However, most of the previous studies focus on the cable tension for the purpose of enduring loads such as bridges and the tension of subsea cables, and the research on the overhead wires in the distribution system has been extremely limited. Therefore, we conducted a study on the tension estimation of the overhead wires in the distribution system, which is essential to check and manage the condition of the overhead wires, by using acceleration sensor data.

3. Estimation of the Tension of the Overhead Wires

3.1. Theoretical Background of Estimating Tension of the Overhead Wires

The tension of the overhead wire is generated by the force produced by the load of the overhead wire itself and the force produced by the movement of the overhead wire by wind, etc. In the case of a force due to a load on the overhead wire itself, it can be considered as a fixed factor. On the other hand, force produced by the movement of the overhead wire should be considered as a variable that varies due to various factors. In other words, if the movement of the overhead wire is quantified, the tension of it can be estimated. The movement of an overhead wire can be intuitively quantified using acceleration sensors, and if the relationship between the data of the acceleration sensors and the tension of the overhead wire can be derived, the tension of the overhead wire can be estimated. The theoretical background of this study is schematized in Figure 1 below.

3.2. Experimental Operation and Condition

3.2.1. Acceleration Sensor Installation Environment

As repeatedly described above, in this study, acceleration sensors were attached to existing overhead wires and utilized to estimate their tension. Moreover, in the case of the acceleration sensor, they were installed to be located in the middle of the wires as much as possible. A schematic diagram of the installation location and an actual installation example are shown in the Figure 2 below.

3.2.2. Experimental Operation and Condition

This study was conducted at Gochang Electric Power Testing Center of Korea Electric Power Corporation (KEPCO), a Korean electric power utility. As the main purpose of this study is to estimate the tension of the overhead wire using data collected from the acceleration sensor attached to the overhead wire, a tension sensor is also required to verify the estimated tension.
In general, a tension sensor is attached to the withdrawal part of the overhead wire. Moreover, in the case of an acceleration sensor, although there is no specific instruction for the attachment point, it was installed at the center of the overhead wire that had the greatest sag. Furthermore, the acceleration sensor collected data once a second, and the tension sensors collected data twice a minute. Since it is necessary to match the time to analyze the correlation of the data, the representative data were calculated per minute, and for this purpose, the one-minute average of each sample was selected as representative data. Figure 3 is a schematic diagram of the attachment of each sensor, and Figure 4 is the actual attachment example in the test center.

3.3. Measured Data and Pre-Processing

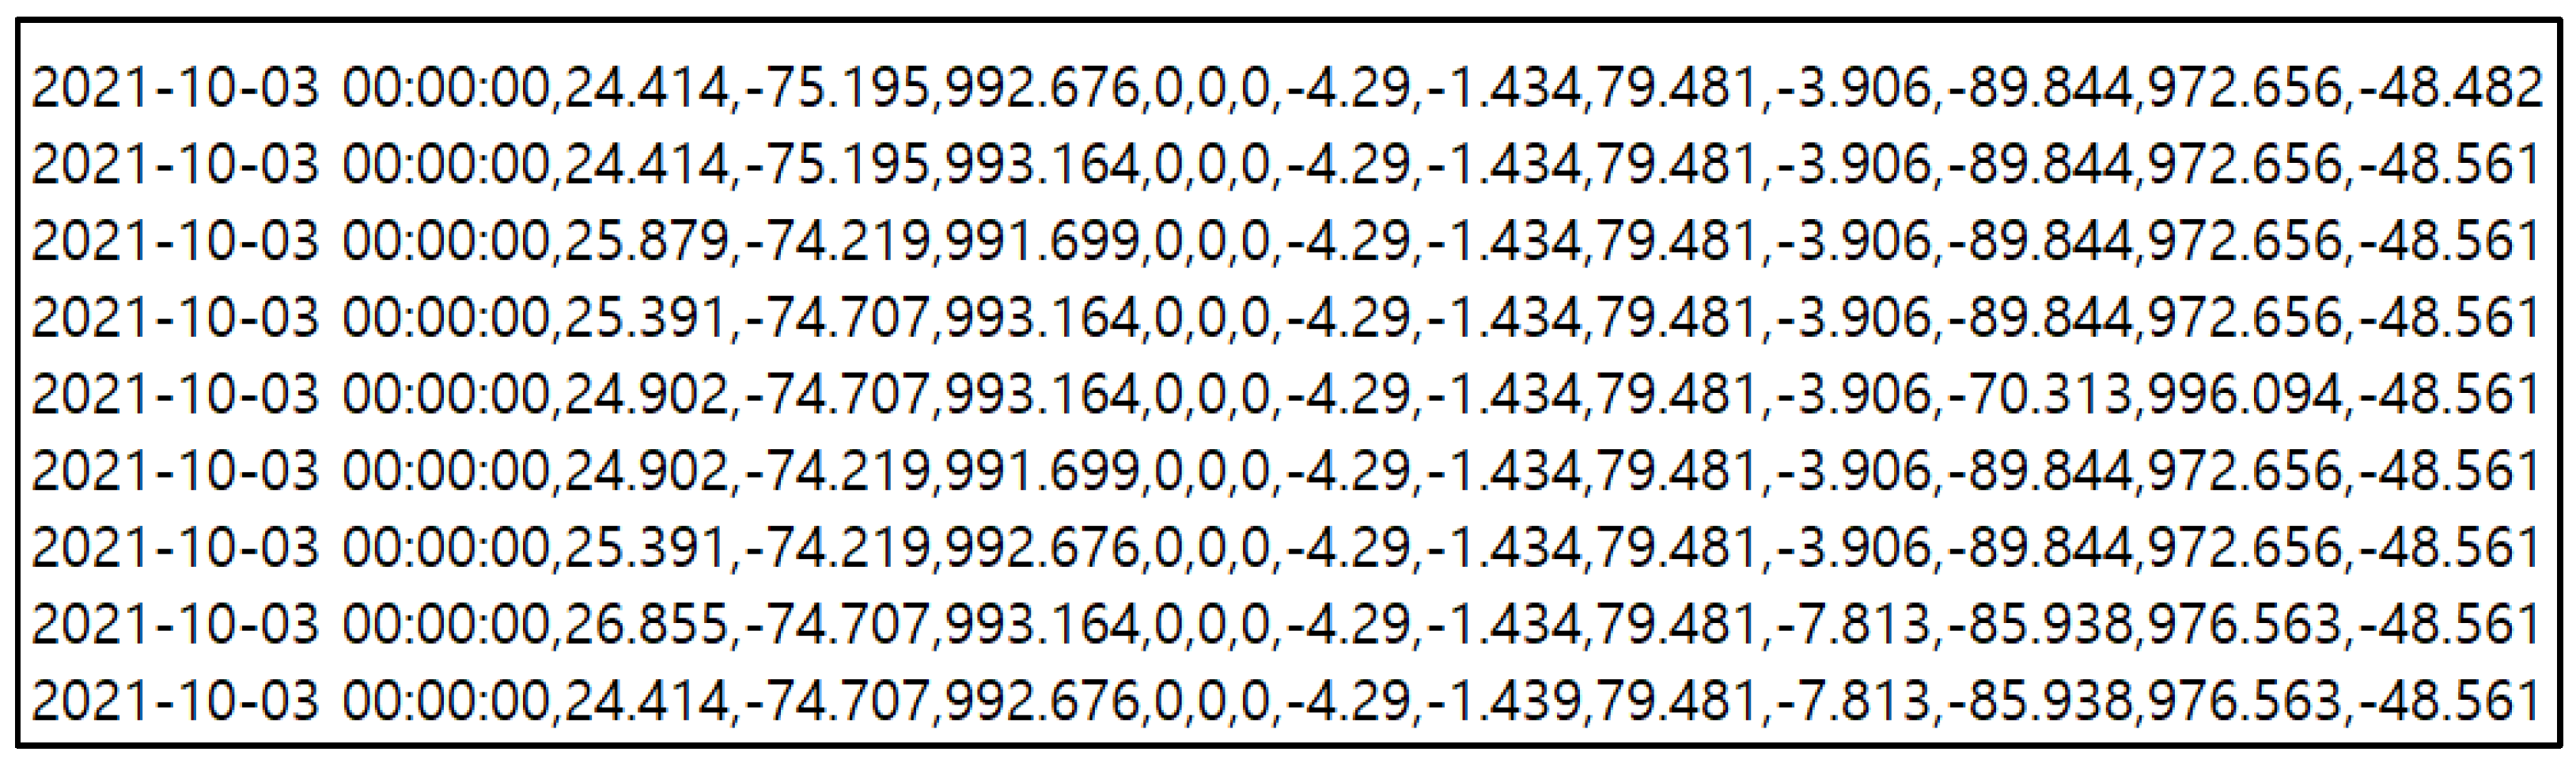
3.3.1. Example of the Measured Data

In the established experimental environment, the data collected from the acceleration sensor were stored on the server in the form of txt and are showed in the following Figure 5.

3.3.2. Data Normalization

In addition, prior to the analysis, data normalization was performed on the basis of the central limit theorem. The corresponding normalization is converted using the maximum and minimum values and is calculated through the following equation. The central limit theorem assumes that more than 30 data samples approximate a normal distribution. Moreover, if the sample size from two or more groups is different, standardization and normalization is required, as direct comparison between multiple groups is not possible.
D n o r m = D r a w D m i n D m a x D m i n
Here, D n o r m : normalized data, D r a w : collected data from the acceleration sensor, D m a x : max value among the collected data from the acceleration sensor, D m i n : min value among the collected data from the acceleration sensor.

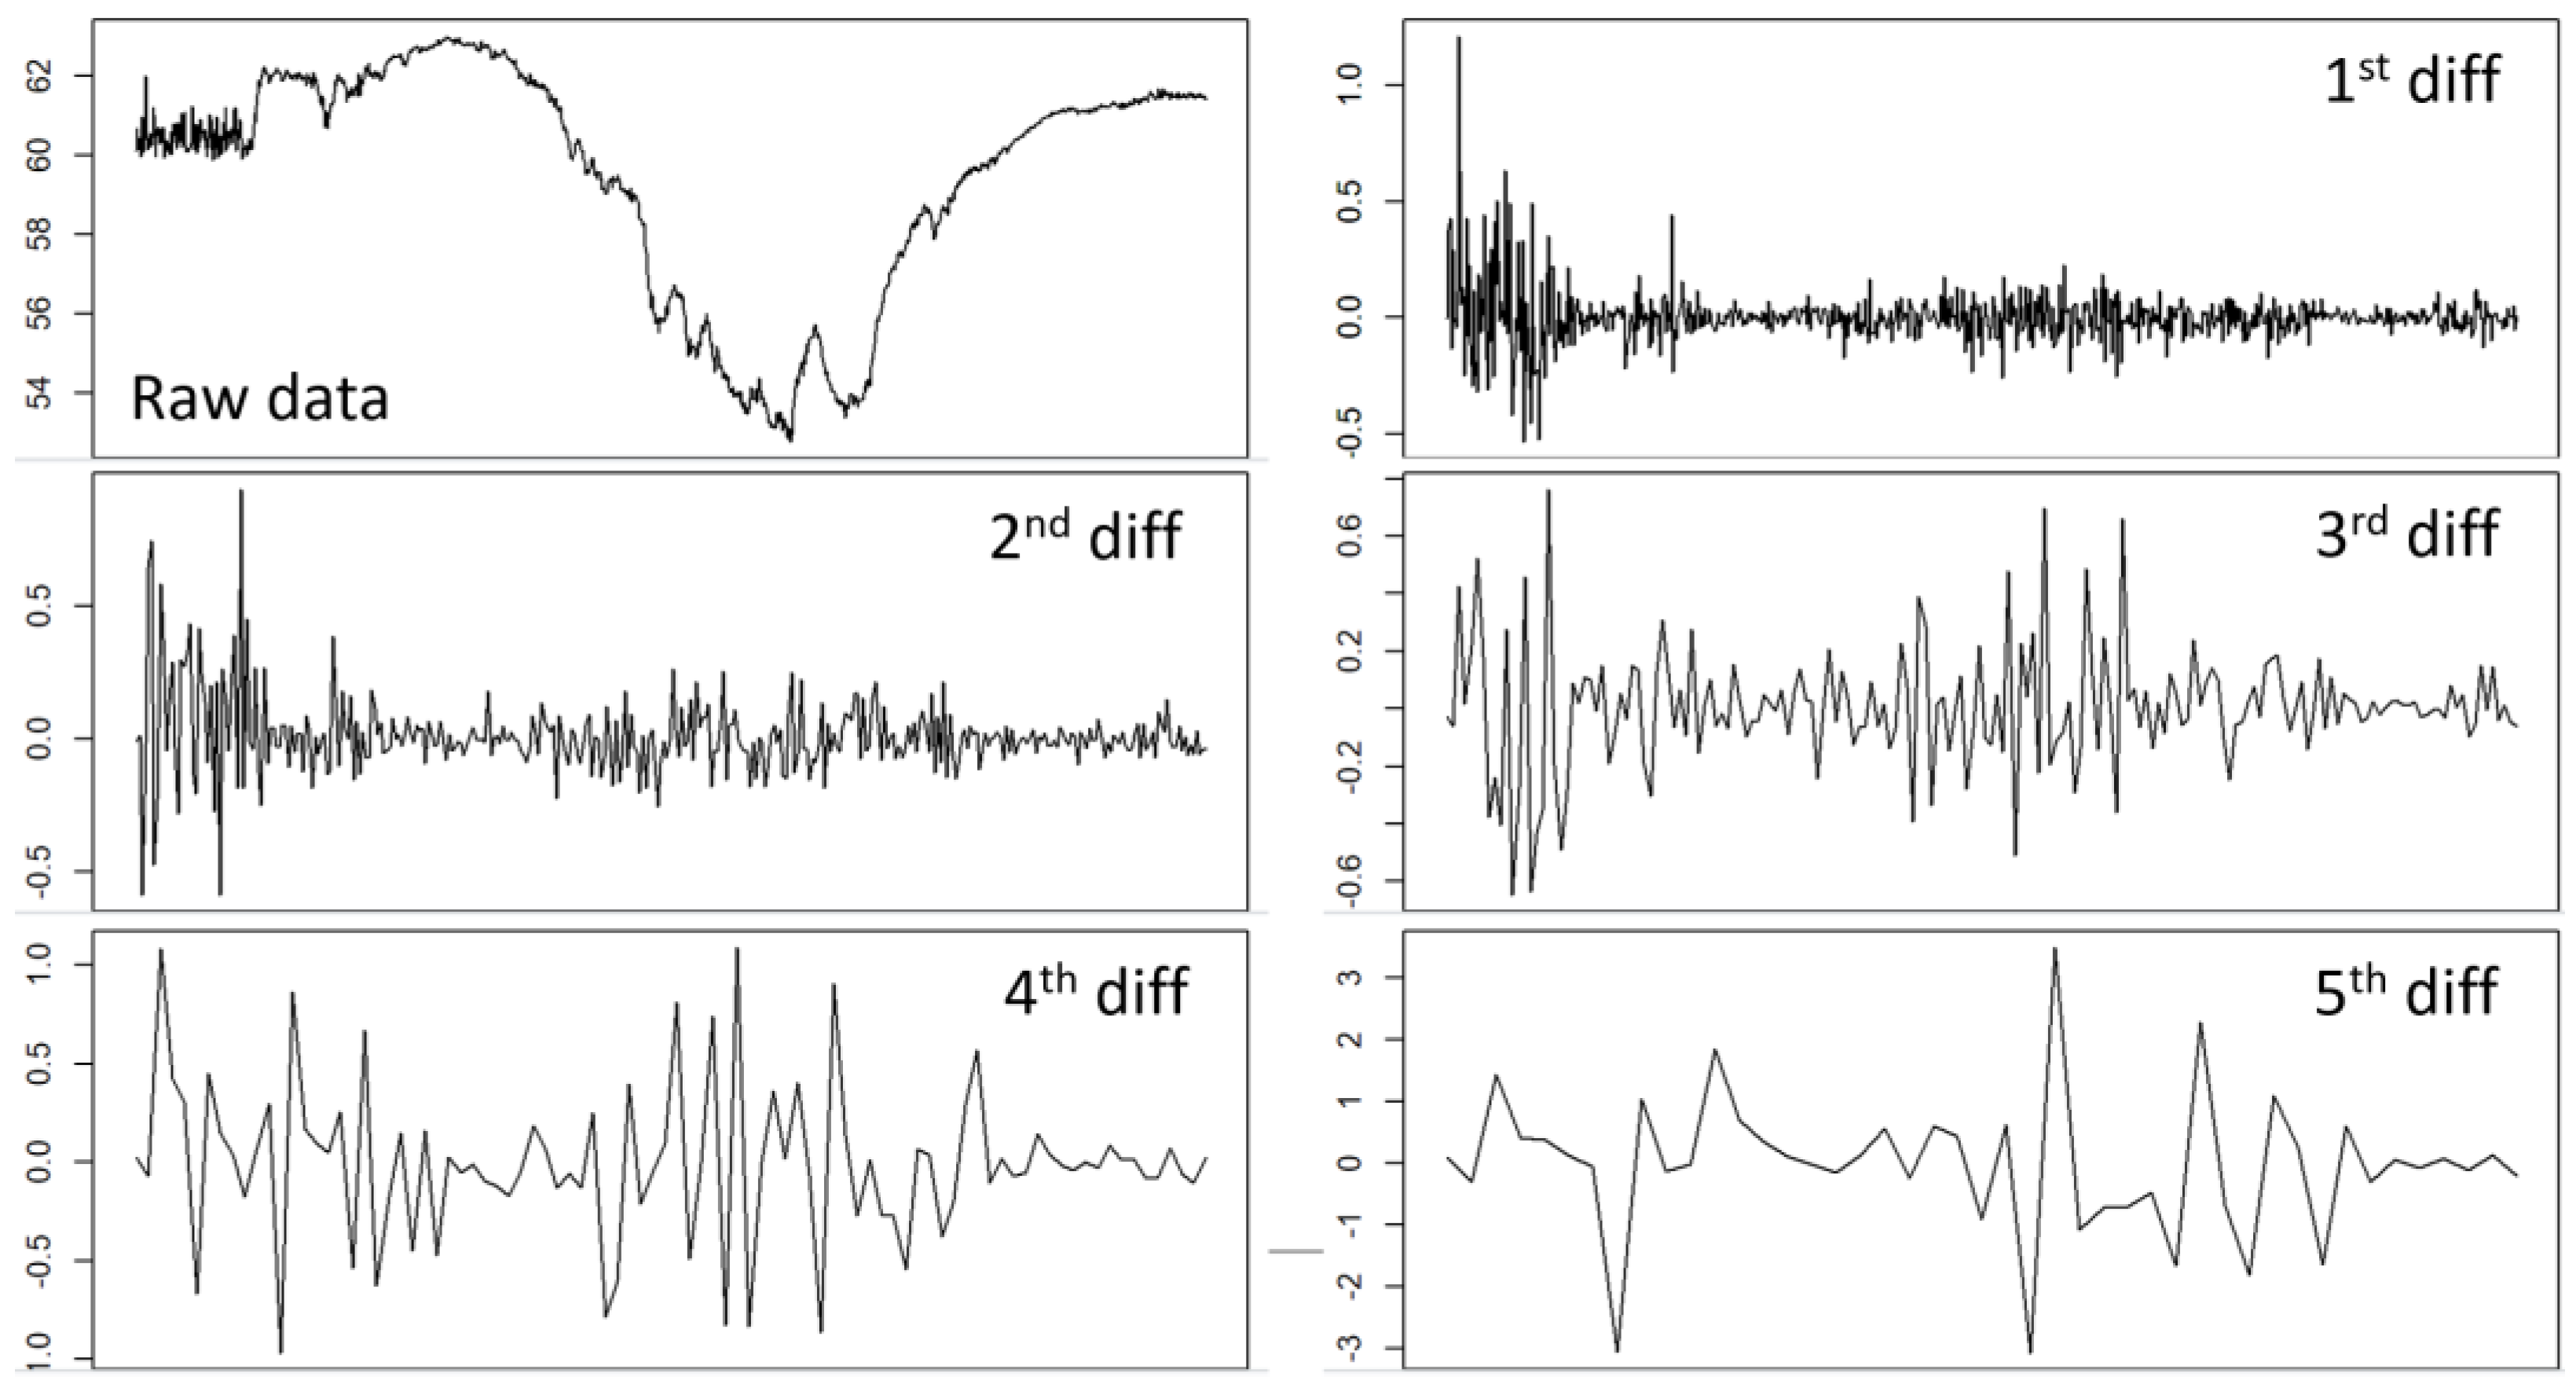
3.3.3. Data Conversion

In the case of time series data observed over time, they should basically satisfy the normality for time series analysis. To satisfy this normality, (1) the mean should be constant, (2) the variance should be not time-dependent, (3) the covariance depends only on parallax and is not time dependent. However, time series data generally do not have the normality, so additional processing is required to normalize time series data. In general, normality is secured through differencing, and therefore, in this study, normality is secured through it. Moreover, discrete wavelets transform (DTW) and a big data analysis program R were used [15,16]. Figure 6 shows an example of data changes according to the differencing. In this study, DTW third-order data were used for similarity analysis through heuristic analysis of the big data. However, it is specified that the differencing can be changed depending on the collected data.

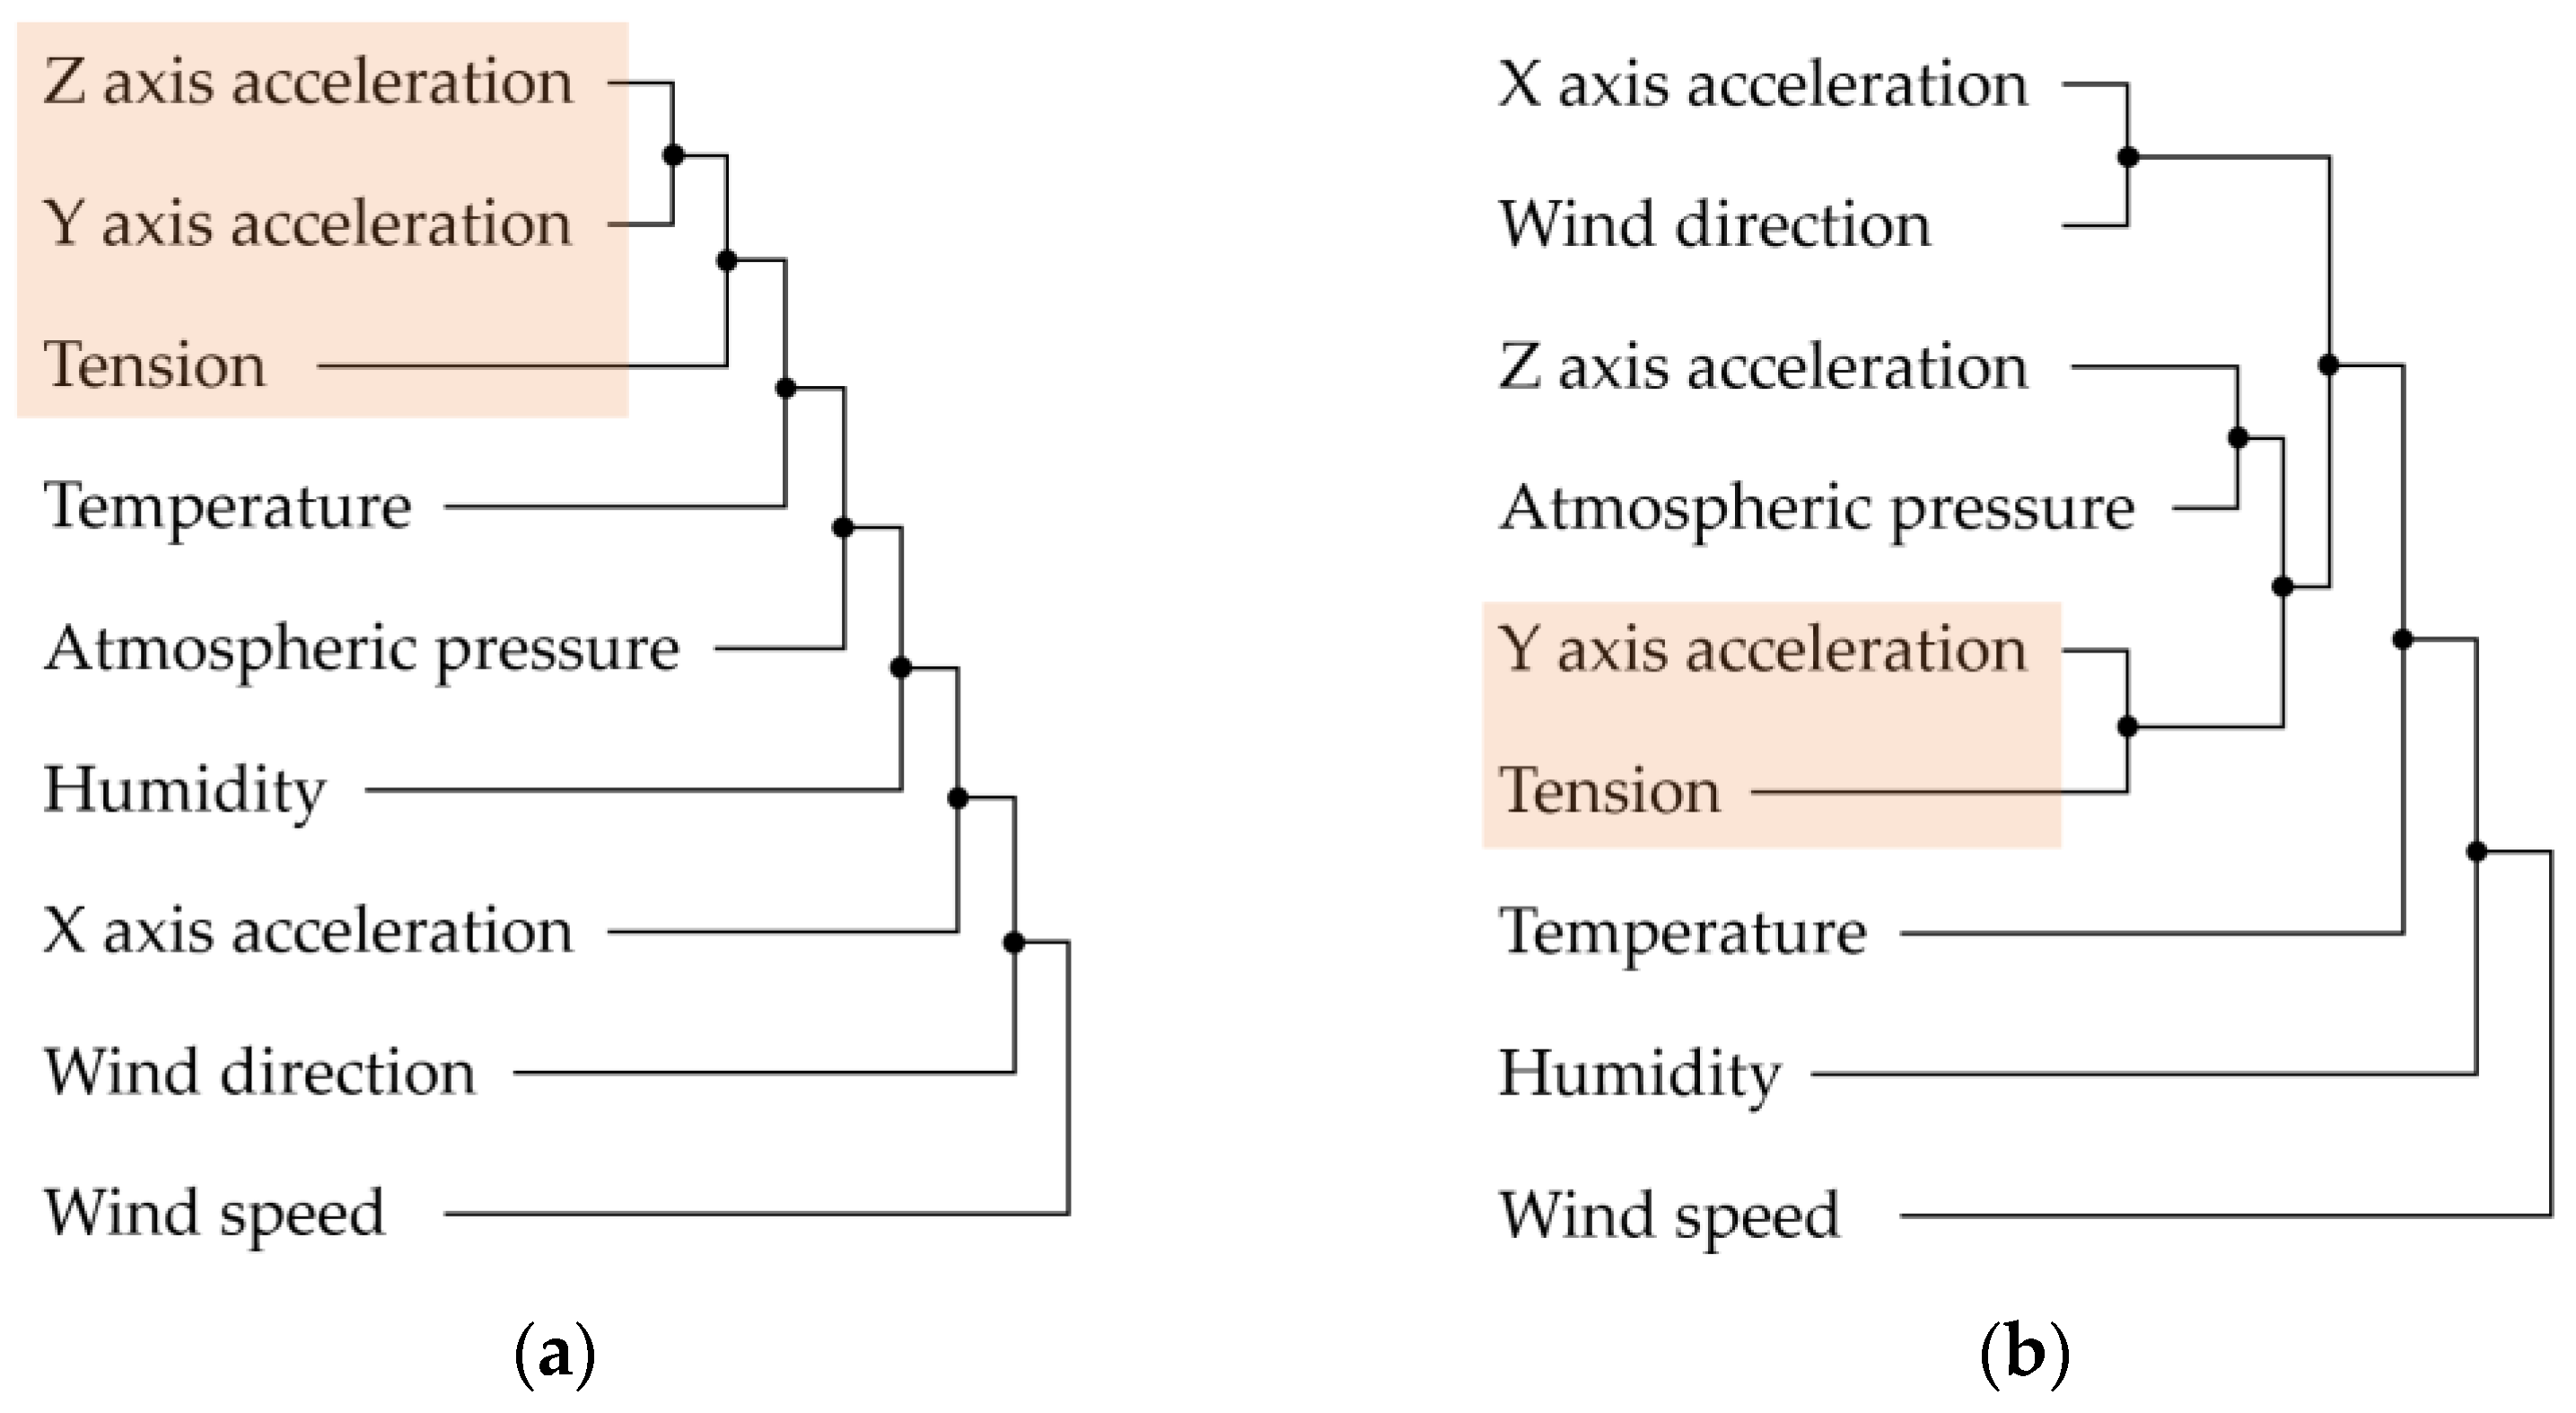
3.4. Analysis of the Similarity of the Data

In order to derive the relationship between acceleration sensor data and the tension of the overhead wires, integrated data were constructed on the basis of the measured data from heterogeneous sensors. In the end, the tension of the overhead wire was derived using only the data of the acceleration sensor, but for the purpose of comparative verification, the tension measurement sensor was installed separately. In addition, the data measured by the acceleration sensor and the tension sensor were analyzed after time synchronization. For the correlation analysis of data, third-order differencing data through DWT was used, and important factors were selected by performing Pearson’s correlation and clustering-based similarity analysis. The Pearson’s correlation coefficient was calculated on the basis of Equation (2) below, and the results of Pearson correlation analysis from 3 September 2021 to 29 September 2021 are shown in Table 2. As a result of the analysis, it may be seen that in the case of Pearson’s correlation analysis, the tension and the Y-axis acceleration have the highest correlation.
ρ = C o v ( X , Y ) σ X σ Y = σ X Y σ X σ Y     ( 1 ρ 1 )
Here, ρ : Pearson’s correlation coefficient, σ : standard deviation, C o v ( X , Y ) : covariance between X and Y.
In addition, in the case of clustering-based similarity analysis of time series data, three methods were applied: time-series clustering (TS clustering), dynamic time warping clustering (DTW clustering), and normalized dynamic time warping clustering (N-DTW clustering). In addition, six clusters for the cluster analysis were selected and were simulated on the basis of the sum of the squared deviations from each observation and the cluster centroid. An example of the result of detailed analysis for TS clustering and DTW clustering are shown in Figure 7.
The TS clustering results indicate that the tension of the overhead wire and the Y-axis and Z-axis acceleration data have the highest correlation. On the other hand, the results of DTW clustering and N-DTW clustering indicate that tension of the overhead wire and Y-axis acceleration data had the highest correlation. In other words, it suggests that the Y-axis acceleration and the tension data had a significant correlation in each correlation analysis method. Thus, the correlation between the tension of the overhead wire and Y-axis acceleration is required to be analyzed in detail according to regression analysis.

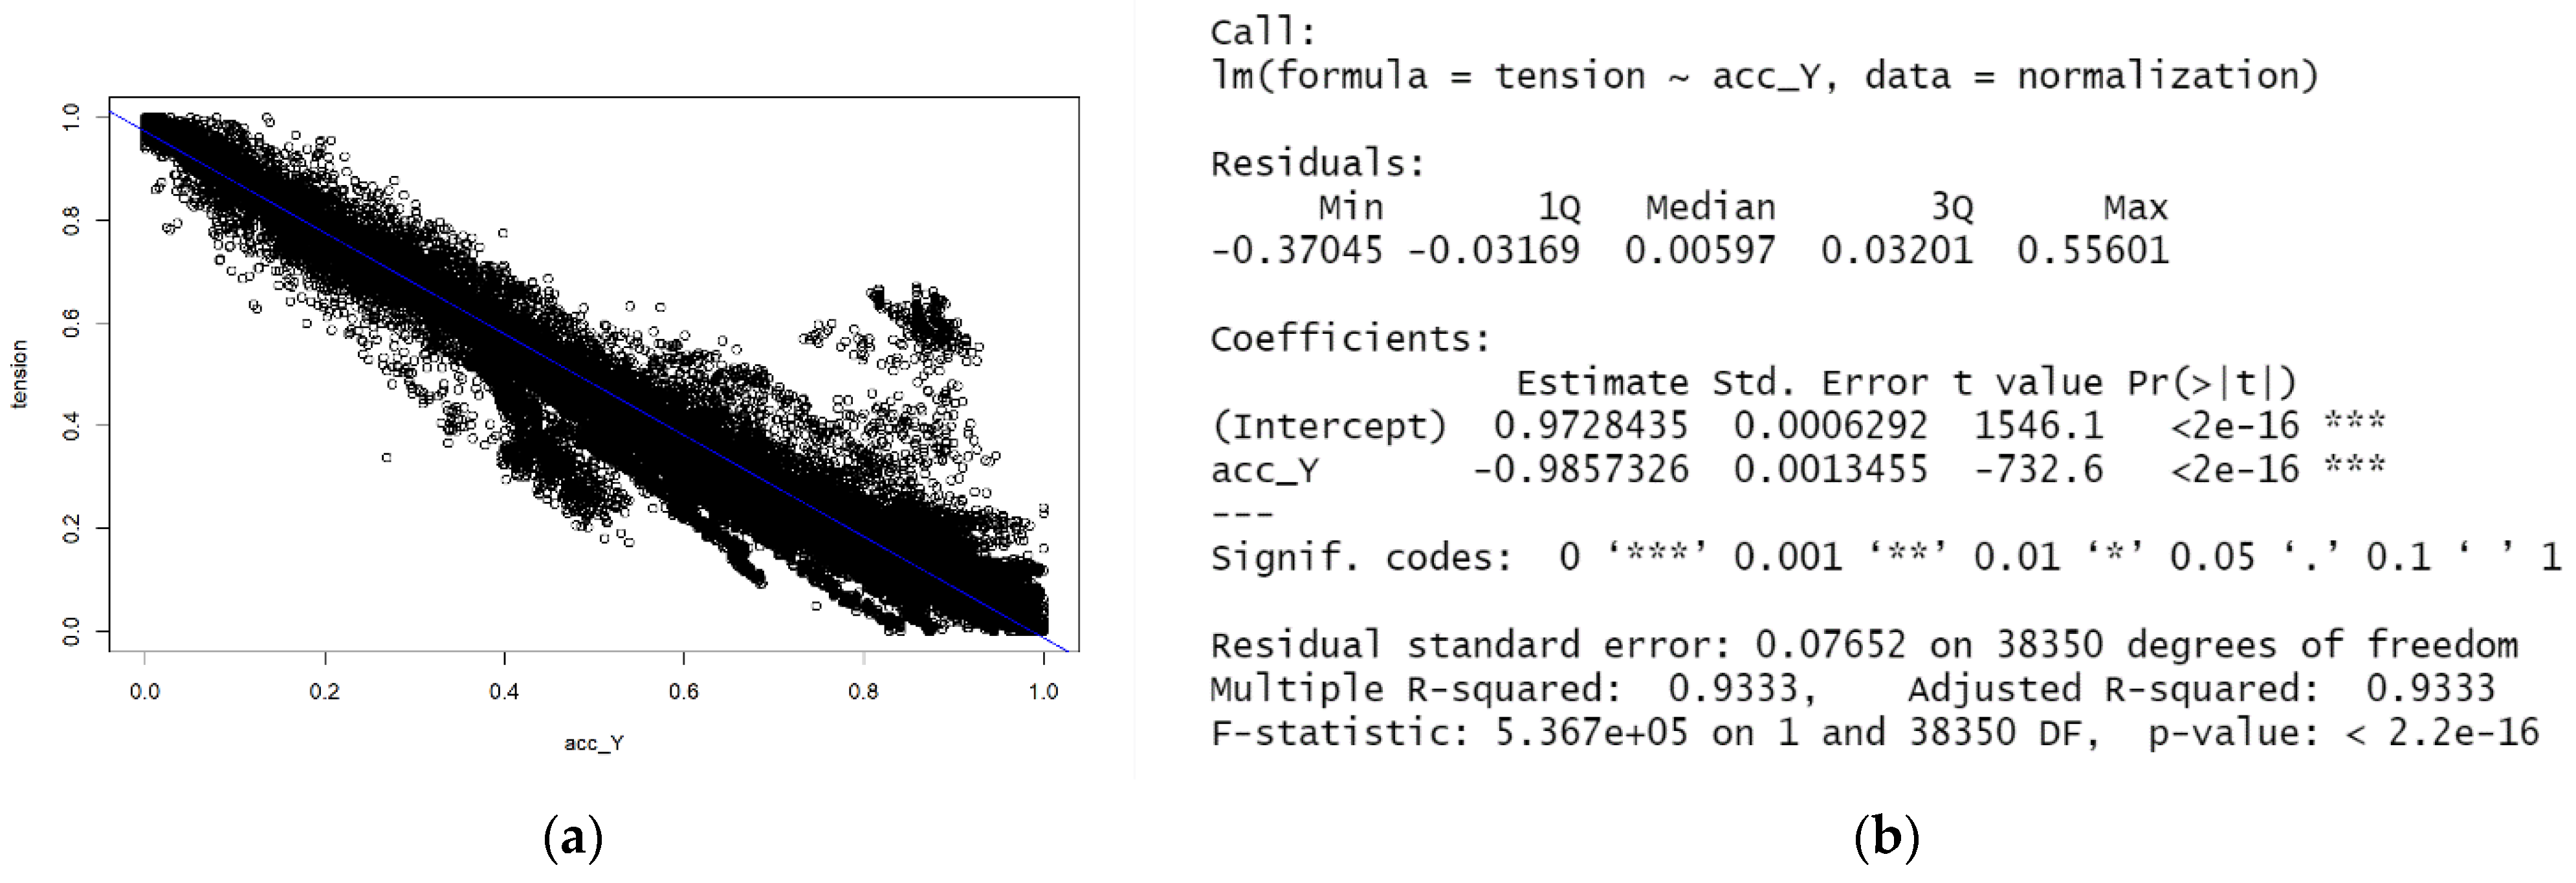
3.5. Deduction of the Formulations for Estimated Tension of the Overhead Wires

A significant correlation between tension of the overhead wire and Y-axis acceleration data was derived previously, and a correlation coefficient was derived through regression analysis between those two variables as the next step. For this purpose, a univariate linear regression analysis was performed. A correlation diagram between the tension of the overhead wire and the Y-axis acceleration of the day are attached to the Figure 8 below.
As a result of linear regression analysis between tension of the overhead wire and Y-axis acceleration for the analyzed period, the R-squared value has a very high correlation coefficient of 0.9333, as shown in Figure 8b above. In addition, it was analyzed that the correlation coefficient was −0.9857326, and intercept was 0.9728435. This result implies that there is a high linear correlation between the Y-axis acceleration data and the tension, as expected in this study, and suggests that the tension of the overhead wire can be estimated using the Y-axis acceleration data. More specifically, as already mentioned, the tension of the overhead wire consists of two parts: the load of the overhead wire itself and the force generated by the movement of the overhead wire. Because the Y-axis acceleration data have a high linear correlation with tension, it indicates that the force generated by the load of the overhead wire itself can be ignored. In addition, the overall tension of it can be simply estimated, taking into account the force generated by the movement of the overhead wire using the acceleration sensor data. It can simply be formulated as shown in (3) below.
T e s t i m a t e d = α × ( A C C Y Y i n t e r c e p t ) = 0.9857326 ( A C C Y 0.9728435 )

4. Verifications of Proposed Method

4.1. Verifications of Normalized Patterns for the Tension of the Overhead Wires

For the verification of the derived equation, the estimated and the measured tension of the overhead wire were compared and analyzed. The comparison of the estimated and the measured tension of the overhead wire for each corresponding day is shown in Table 3 below. In the case of the tension, the upper and lower limits were determined through standardization and normalization, so the accuracy was calculated on the basis of the normalized value of the average tension of the overhead wire, and it was confirmed that the average accuracy was 96.95% for the 5 analyzed days.

4.2. Conversion of the Tension and Verifications of Tension Value of the Overhead Wires

Previously, the high similarity of the normalized tension data was confirmed. However, it only can be used when the process of converting it into an actual tension value is accompanied. Since a reference tension value is required for the conversion, statistically handled actual tension data were applied in this study. In the case of tension, statistical analysis was performed by removing the bottom 5% and the top 5% as temporary abnormal values may be included. Moreover, the bottom 5% and the top 5% values were set to the minimum and maximum values, respectively. The tension values reflecting this are described in Table 4 and Figure 9.
The analyzed results showed that the accuracy of the estimated tension based on the maximum tension had minimum accuracy of 83.87% and average accuracy of 90.39%. As already mentioned, it is assumed that reference tension data are required in these series of processes. Nevertheless, the fact that the tension can be estimated by combining the data of the acceleration sensor while requiring minimum numbers of tension sensor can be a great advantage in terms of field utilizations.

5. Conclusions

In this study, a tension estimation method based on an acceleration sensor data was studied to minimize the installation of a tension sensor that is difficult to use in the field and to estimate the tension value. As a result of comparing and verifying the measured tension values with the estimated ones through the proposed method, it was confirmed that the average accuracy was 90.39%. It is meaningful that the proposed method suggested the possible utilization method of acceleration sensor that could replace tension sensors. In particular, it is expected that it would be possible to estimate tension values within the acceptable range through the proposed method. In addition, it is expected to contribute to the analysis of fatigue damage accumulation of the overhead wire by collecting estimated tension data and establishing big data through acceleration sensors.

Author Contributions

Conceptualization, J.-H.K. and B.-S.L.; methodology, J.-H.K.; software, J.-H.K.; formal analysis, J.-H.K. and J.-M.J.; data curation, J.-H.K. and J.-M.J.; writing—original draft preparation, J.-H.K.; writing—review and editing, J.-H.K.; supervision, J.-M.J. and B.-S.L. All authors have read and agreed to the published version of the manuscript.

Funding

This research received no external funding.

Institutional Review Board Statement

Not applicable.

Informed Consent Statement

Not applicable.

Data Availability Statement

Data available on request due to restrictions.

Conflicts of Interest

The authors declare no conflict of interest.

References

  1. DS-3300; Distribution System Design Standard. KEPCO: Naju-si, Korea, 2022.
  2. Zhang, S.; Zhou, J.; Zhou, Y.; Zhang, H.; Chen, J. Cable Tension Monitoring Based on the Elasto-Magnetic Effect and the Self-Induction Phenomenon. Materials 2019, 12, 2230. [Google Scholar] [CrossRef] [PubMed] [Green Version]
  3. Jasman, N.A.; Normisyidi, N.A.L.; Hoe, Y.S.; Zainal Abidin, A.R.; Mohd Haniffah, M.R. Numerical Calculation of Two-Dimensional Subsea Cable Tension Problem Using Minimization Approach. MATEMATIKA Malays. J. Ind. Appl. Math. 2019, 35, 15–32. [Google Scholar] [CrossRef]
  4. Fang, Z.; Wang, J. Practical Formula for Cable Tension Estimation by Vibration Method. J. Bridge Eng. 2012, 17, 161–164. [Google Scholar] [CrossRef]
  5. Zui, H.; Shinke, T.; Namita, Y. Practical Formulas for Estimation of Cable Tension by Vibration Method. J. Struct. Eng. 1996, 122, 651–656. [Google Scholar] [CrossRef]
  6. Kim, B.H.; Park, T.H. Estimation of cable tension force using the frequency-based system identification method. J. Sound Vib. 2007, 304, 660–676. [Google Scholar] [CrossRef]
  7. Ren, W.-X.; Chen, G.; Hu, W.H. Empirical formulas to estimate cable tension by cable fundamental frequency. Struct. Eng. Mech. 2005, 20, 363–380. [Google Scholar] [CrossRef]
  8. Feng, D.; Scarangello, T.; Feng, M.Q.; Ye, Q. Cable tension force estimate using novel noncontact vision-based sensor. Measurement 2017, 99, 44–52. [Google Scholar] [CrossRef]
  9. Jeong, S.; Kim, H.; Lee, J.; Sim, S.-H. Automated wireless monitoring system for cable tension forces using deep learning. Struct. Health Monit. 2021, 20, 1805–1821. [Google Scholar] [CrossRef]
  10. Jana, D.; Nagarajaiah, S. Computer vision-based real-time cable tension estimation in Dubrovnik cable-stayed bridge using moving handheld video camera. Struct. Control. Health Monit. 2021, 28, e2713. [Google Scholar] [CrossRef]
  11. Jana, D.; Nagarajaiah, S.; Yang, Y.; Li, S. Real-time cable tension estimation from acceleration measurements using wireless sensors with packet data losses: Analytics with compressive sensing and sparse component analysis. J. Civ. Struct. Health Monit. 2021, 1–19. [Google Scholar] [CrossRef]
  12. Matsumiya, H.; Taruishi, S.; Shimizu, M.; Sakaguchi, G. Equivalent Static Wind Loads on Snow-accreted Overhead Wires. Struct. Eng. Int. 2022, 32, 78–91. [Google Scholar] [CrossRef]
  13. Derosa, S.; Nåvik, P.; Collina, A.; Rønnquist, A. Railway catenary tension force monitoring via the analysis of wave propagation in cables. J. Rail Rapid Transit 2020, 235, 494–504. [Google Scholar] [CrossRef]
  14. He, F.; Guo, D.; Chen, L. Numerical study of contact wire tension affecting dropper stress of a catenary system. Adv. Mech. Eng. 2021, 13, 1687814021995041. [Google Scholar] [CrossRef]
  15. R Wavelets User Manual: Functions for Computing Wavelet Filters, Wavelet Transforms and Multiresolution Analyses. Eric Aldrich. 2020. Available online: https://cran.r-project.org/web/packages/wavelets/wavelets.pdf (accessed on 11 July 2022).
  16. Borivoje, F. Encyclopedia of Multimedia; Springer: New York, NY, USA, 2006. [Google Scholar]
Figure 1. The theoretical background of the estimation of the tension for the overhead wire.
Applsci 12 07736 g001
Figure 2. (a) WT61 module. (b) Utilized acceleration sensor in KEPCO. (c) Example of installed acceleration sensor in KEPCO.
Applsci 12 07736 g002
Figure 3. Schematic diagram of the sensor attachment of each sensor.
Applsci 12 07736 g003
Figure 4. Sensor attachment example in the Gochang Electric Power Testing Center.
Applsci 12 07736 g004
Figure 5. Sample data collected from the acceleration sensor.
Applsci 12 07736 g005
Figure 6. Example of data conversion using DTW.
Applsci 12 07736 g006
Figure 7. Clustering-based similarity analysis results: (a) TS clustering; (b) DTW clustering.
Applsci 12 07736 g007
Figure 8. (a) Diagram between the tension and Y-axis acceleration data. (b) Result of the linear regression analysis using R.
Applsci 12 07736 g008
Figure 9. Estimated vs. actual tension of overhead wire: (a) 7 September 2021; (b) 10 September 2021; (c) 13 September 2021; (d) 16 September 2021; (e) 21 September 2021.
Applsci 12 07736 g009
Table 1. Fundamentals of calculation for dip (KEPCO).
Fundamentals of Calculation for Dip
The tension of the wires shall be set so that the wire tension (estimated maximum tension) when the worst condition is expected to be applied to the wire under the prescribed applied wind load is less than the allowable maximum tension of the wire. This calculation is based on the following equation:
T 1 = T F
T 1 : allowable tension (kg);
T : tensile load on the wire (kg);
F : safety margin
Here, the allowable tension of the wire when the safety margin is set to the minimum (Fmin) is called the allowable maximum tension.
Table 2. The results of Pearson’s correlation analysis.
TensionWind SpeedWind
Direction
TemperatureHumidityAtmospheric PressureAcc_XAcc_YAcc_Z
Tension1.000.23−0.04−0.380.080.030.06−0.74−0.21
Wind speed0.231.00−0.050.06−0.30−0.100.03−0.200.10
Wind direction−0.04−0.051.000.050.060.020.040.020.00
Temperature−0.380.060.051.00−0.43−0.150.200.280.38
Humidity0.08−0.300.06−0.431.000.09−0.09−0.05−0.18
Atmospheric pressure0.03−0.100.02−0.150.091.00−0.100.00−0.12
Acc_X0.060.030.040.20−0.09−0.101.00−0.120.26
Acc_Y−0.74−0.200.020.28−0.050.00−0.121.000.20
Acc_Z−0.210.100.000.38−0.18−0.120.260.201.00
Table 3. Accuracy of the average correlation coefficient (measured tension vs. estimated tension).
7 September 202110 September 202113 September 202116 September 202121 September 2021
Measured tension0.55350.71520.56790.62810.6592
Estimated tension0.52240.74590.57970.61060.6561
Accuracy (%)94.3895.7197.9297.2199.53
Table 4. Summary of the verifications using converted data (actual scaled).
DateTypeMinFirst QuartileMeanAverageThird QuartileMaxAccuracy (%)
7 September 2021Measured67.5669.3270.1069.8970.4371.7798.06
Estimated55.1362.7165.7864.8567.273.16
10 September 2021Measured60.2565.0066.7066.0867.868.493.04
Estimated55.1366.4971.5969.0072.473.16
13 September 2021Measured59.5161.4463.2063.056565.7488.71
Estimated55.1360.6066.7365.9171.373.16
16 September 2021Measured54.9359.4861.9461.5764.165.588.31
Estimated55.1363.0767.7866.4970.2673.16
21 September 2021Measured52.7758.0560.5259.5161.646383.87
Estimated55.1365.3970.0067.3370.9773.16
Publisher’s Note: MDPI stays neutral with regard to jurisdictional claims in published maps and institutional affiliations.

