
Integrated Carbonate Rock Type Prediction Using Self-Organizing Maps in E11 Field, Central Luconia Province, Malaysia

 ,
,  ,
, 
Abstract
:1. Introduction
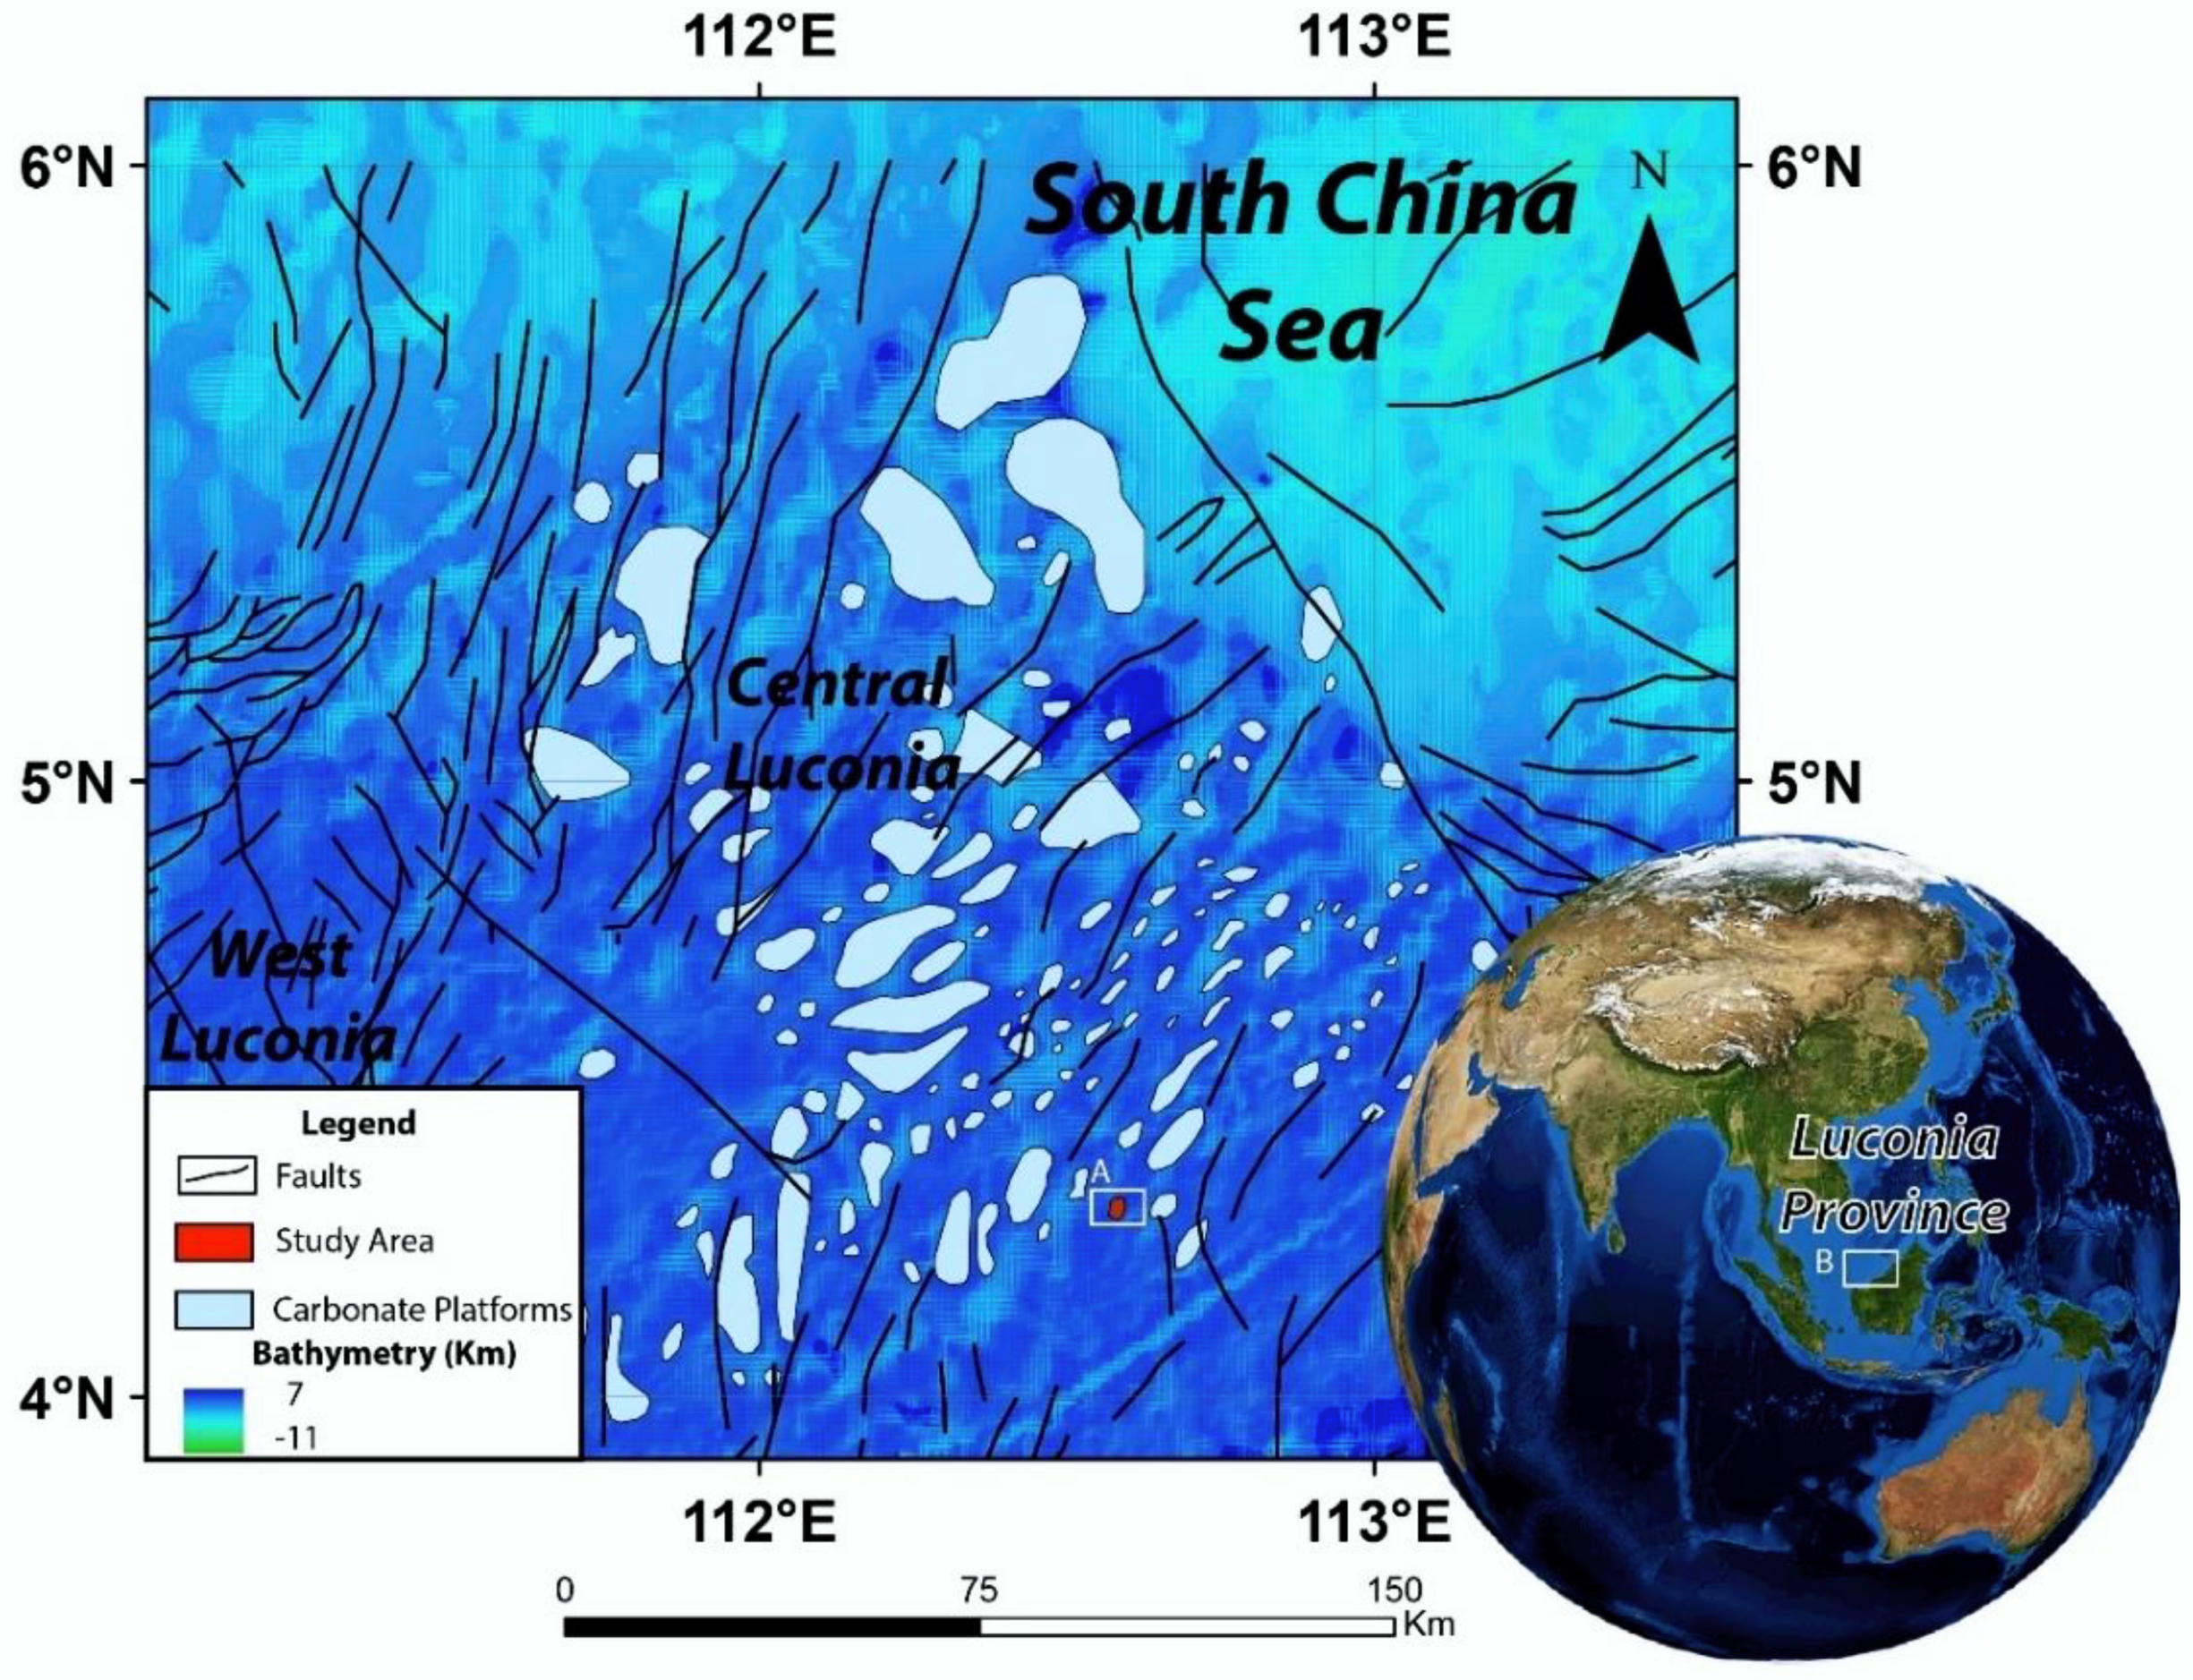
2. Study Area
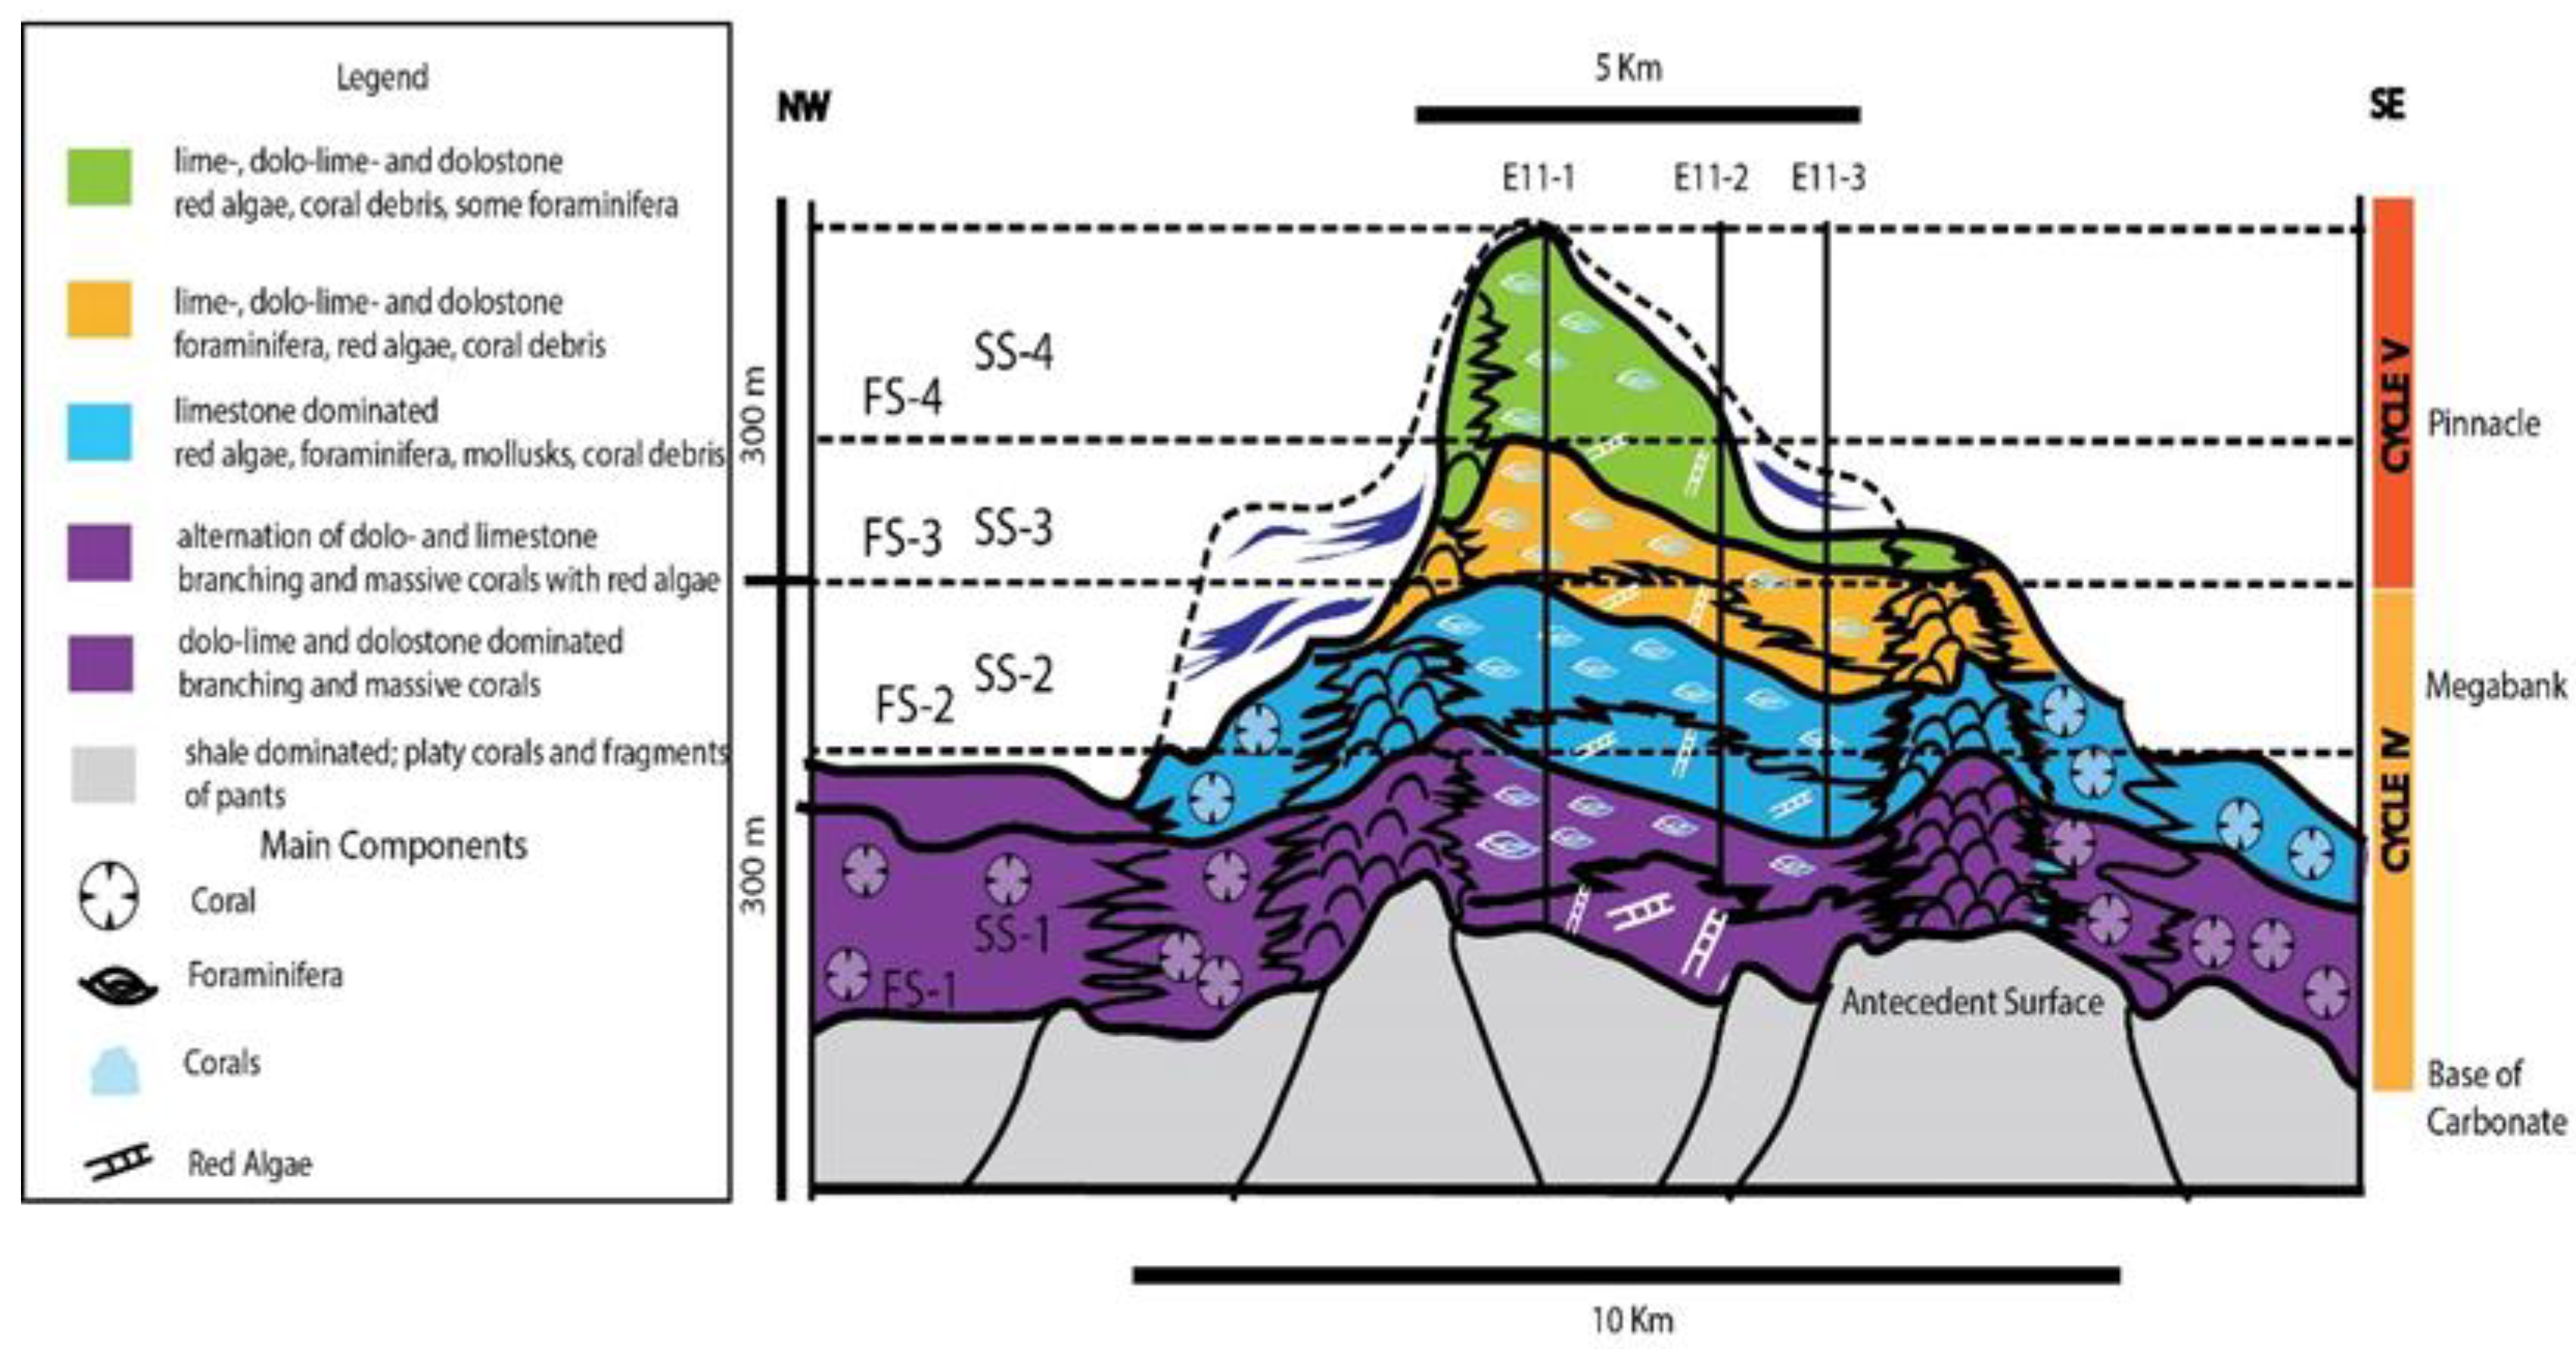
- Megaplatform complex Cycle IV FS1, SS1, FS2, and SS2
- Pinnacle carbonate Cycle V F3S, SS3, FS4, SS4
3. Materials and Methods
3.1. Core and Log Data
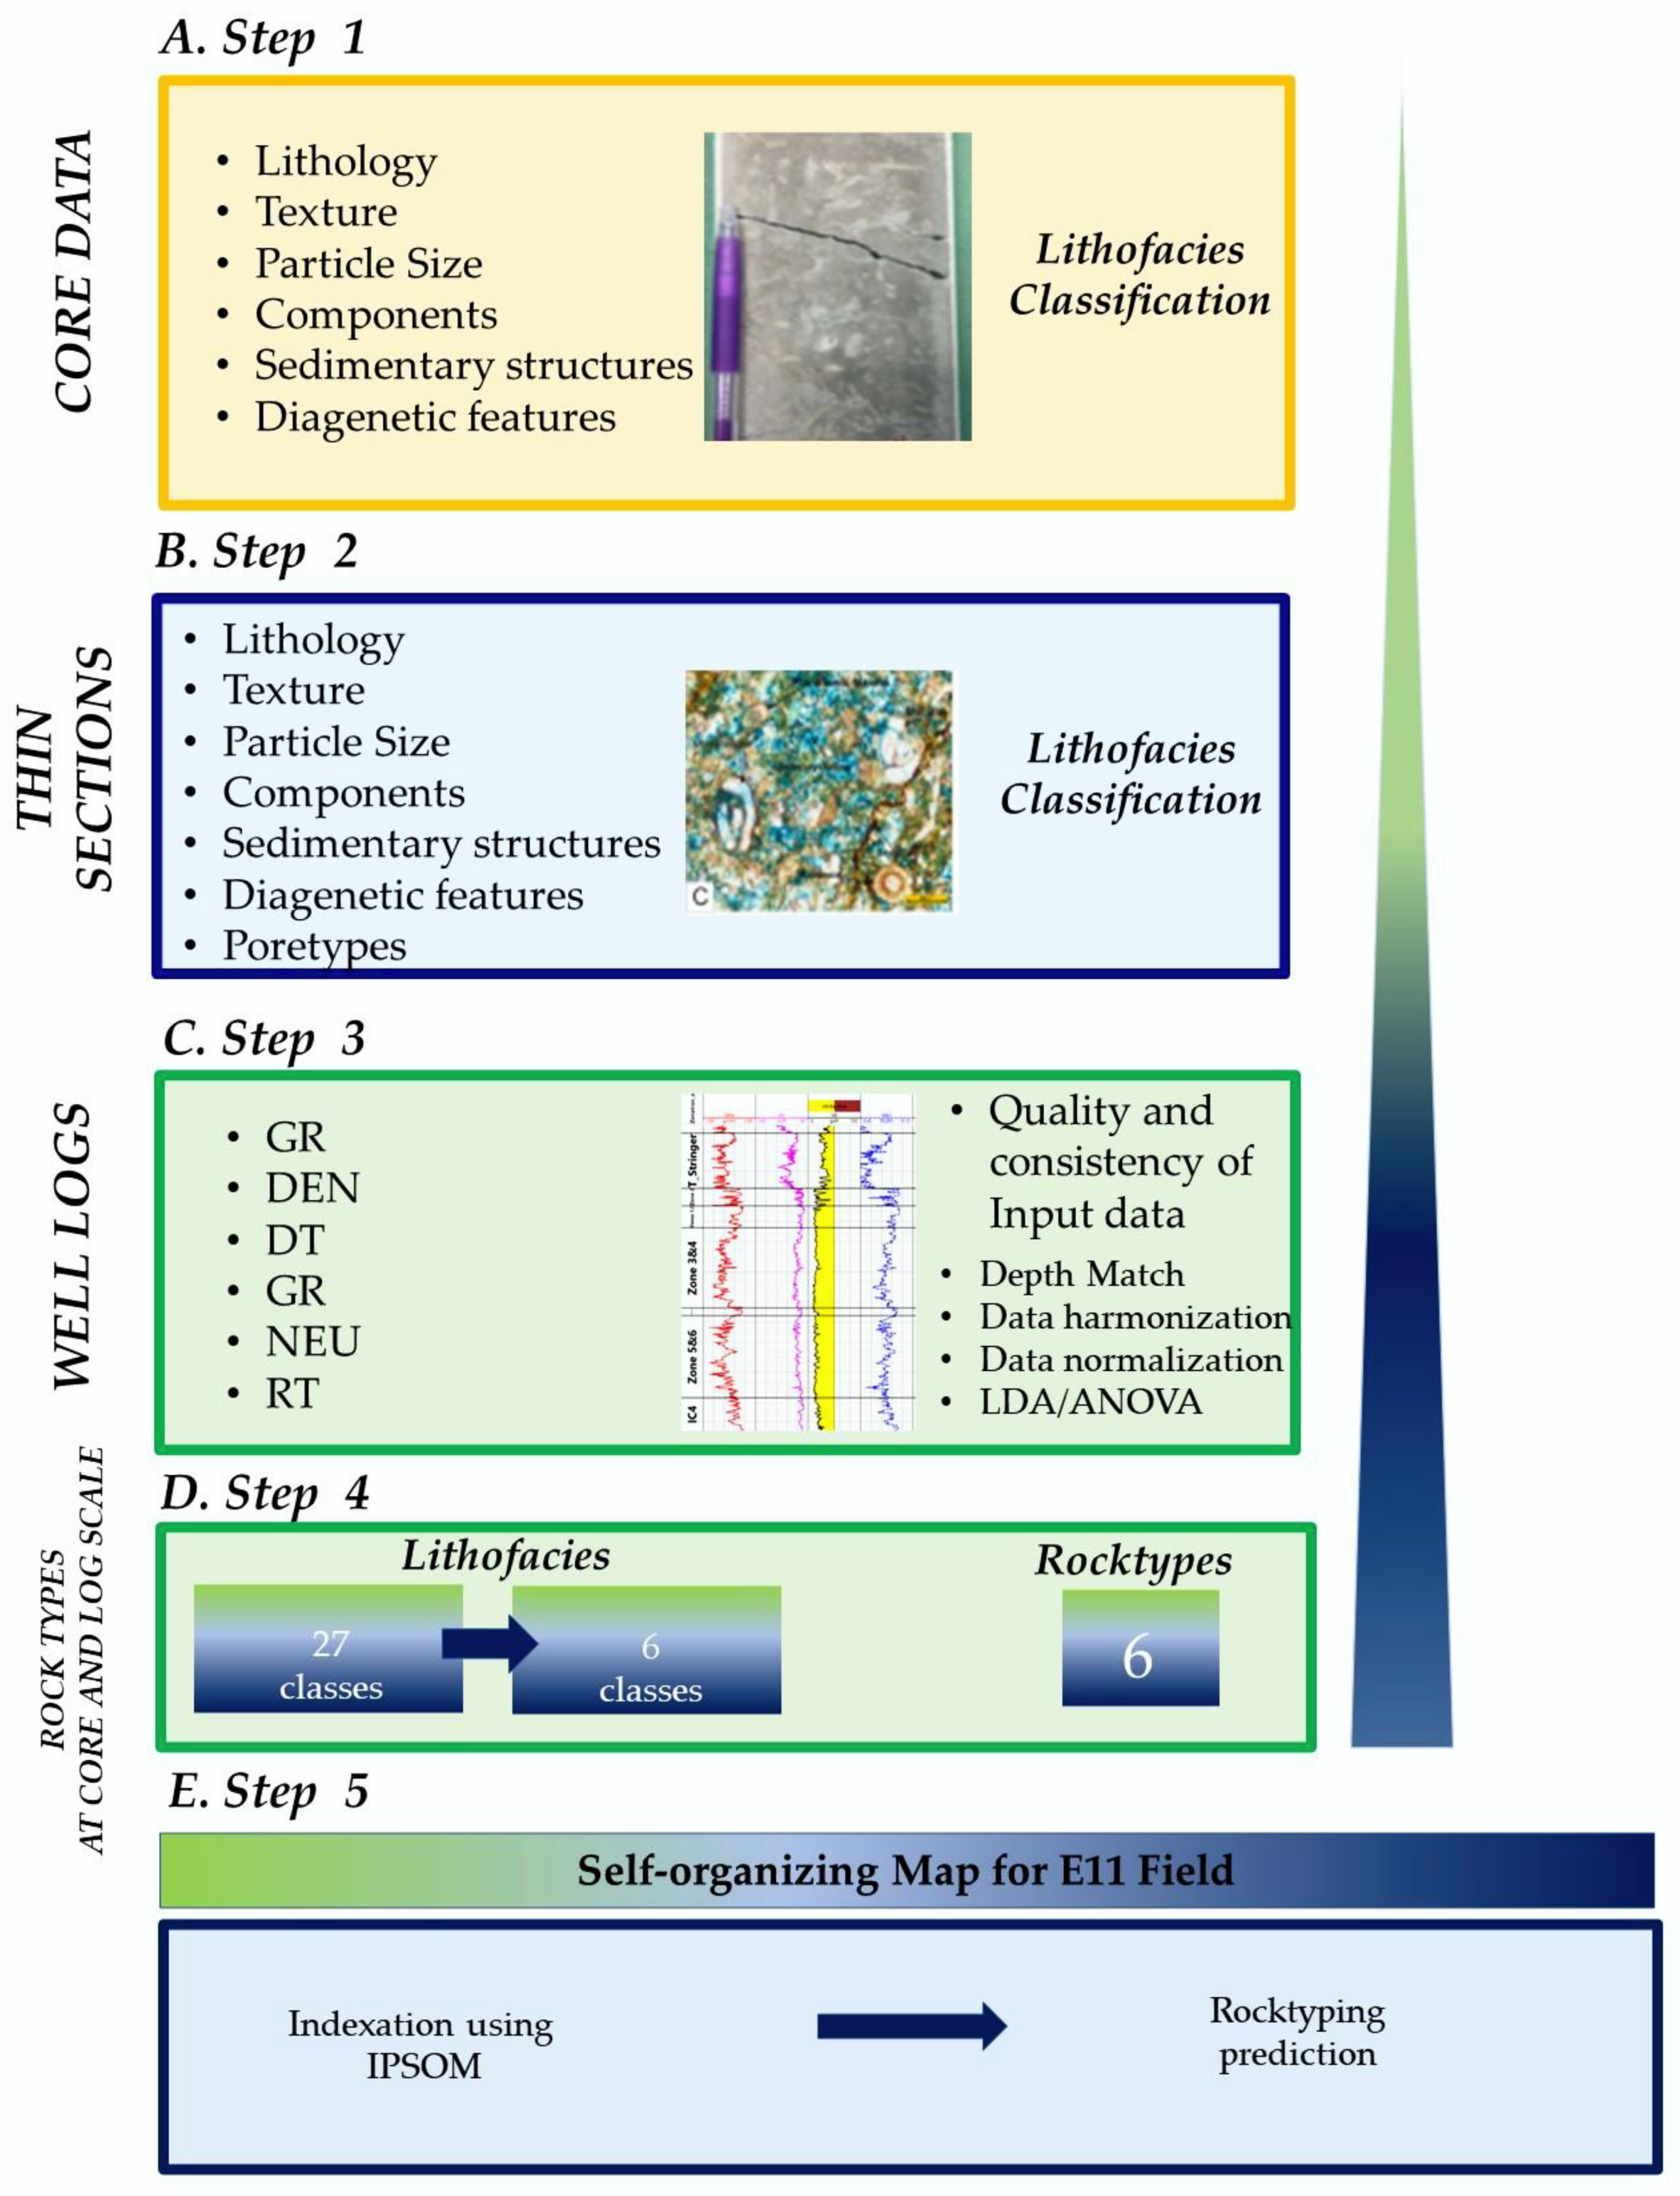
3.2. Multiscale Methodology
- (a)
- Step 1: Core Data Description
- (b)
- Step 2: Thin Section Description
- (c)
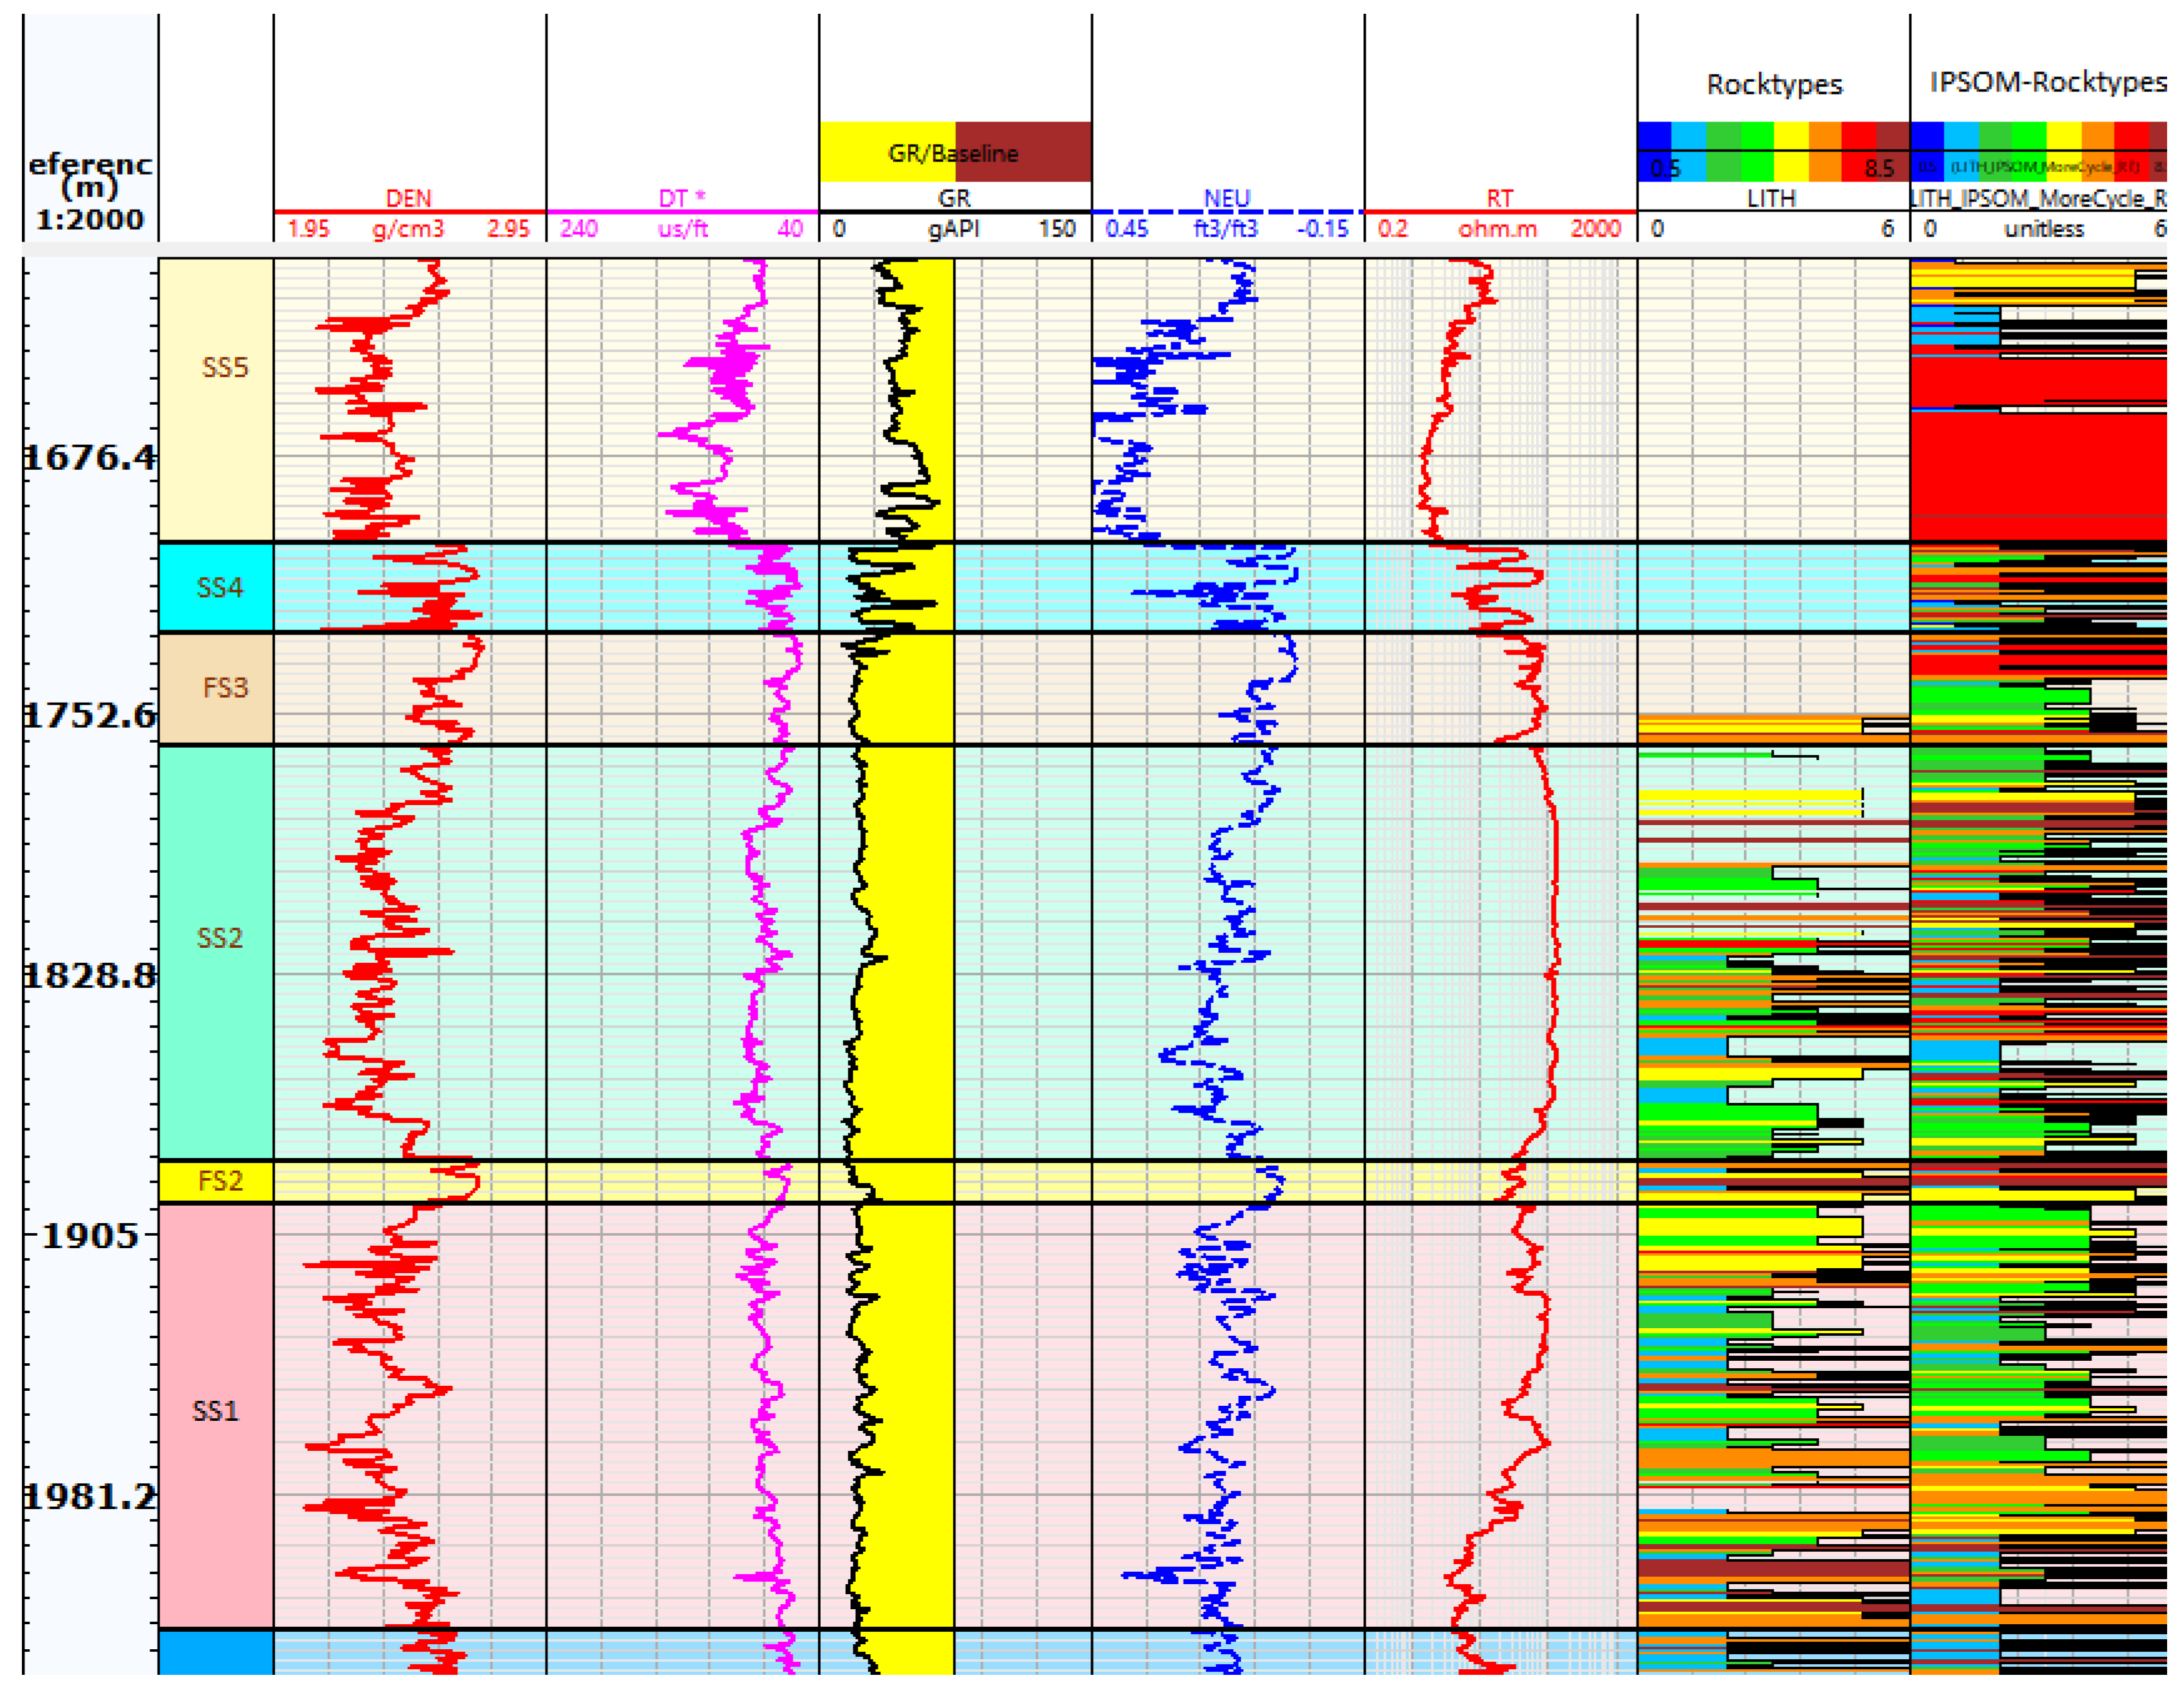
- Step 3: Well Log Harmonization, Normalization, and Interpretation
- (d)
- Step 4: Lithofacies and Rock Typing Analysis
- (e)
- Step 5: IPSOM: Probabilized Self-Organizing Maps for Facies Prediction SOM
- (a)
- Verify the quality and consistency of the well-input data (wireline and facies logs).
- (b)
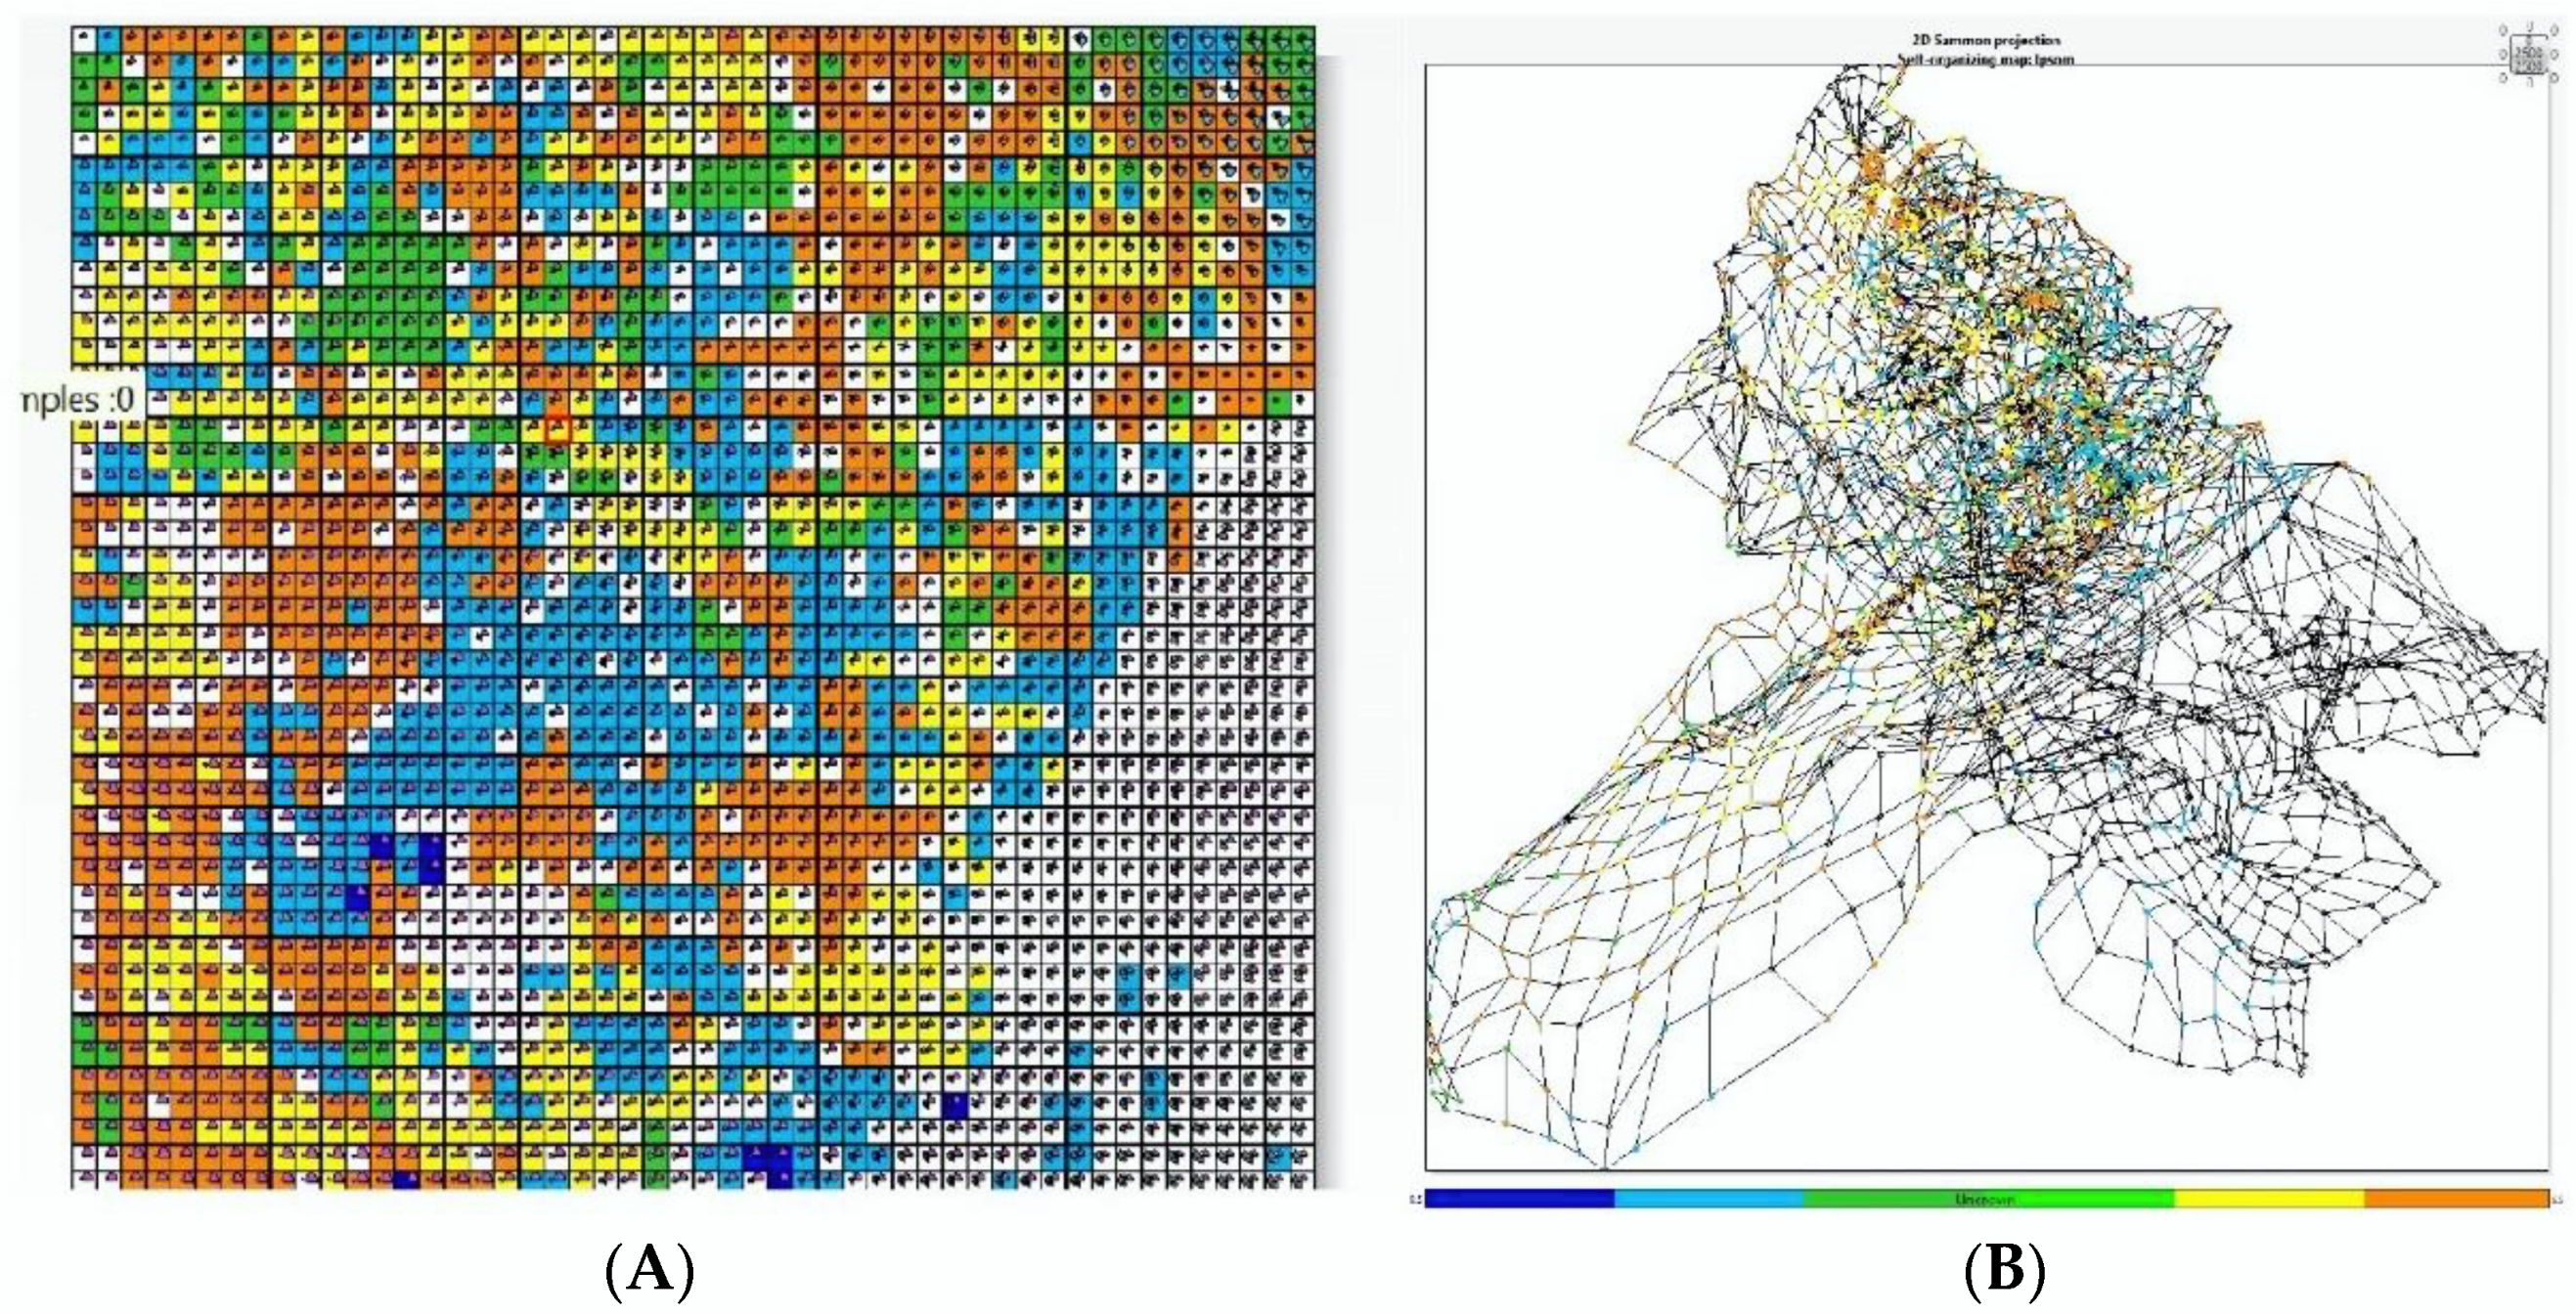
- Activate SOM to sort and organize the data into bins within which the multivariate data “patterns” are similar to each other.
- (c)
- Assign a class name to each bin indexation.
- (d)
- Refine the representation using the core log calibration data to improve the prediction.
- (e)
- Finally, a trained IPSOM model is produced to propagate the rock type logs in the wells without available core data.
4. Results
4.1. Lithofacies/Rock Types of Analysis
- Dense argillaceous shale RT1, from fair to poor reservoir rocks porosity of 10–25%, permeability 1–100 Md.
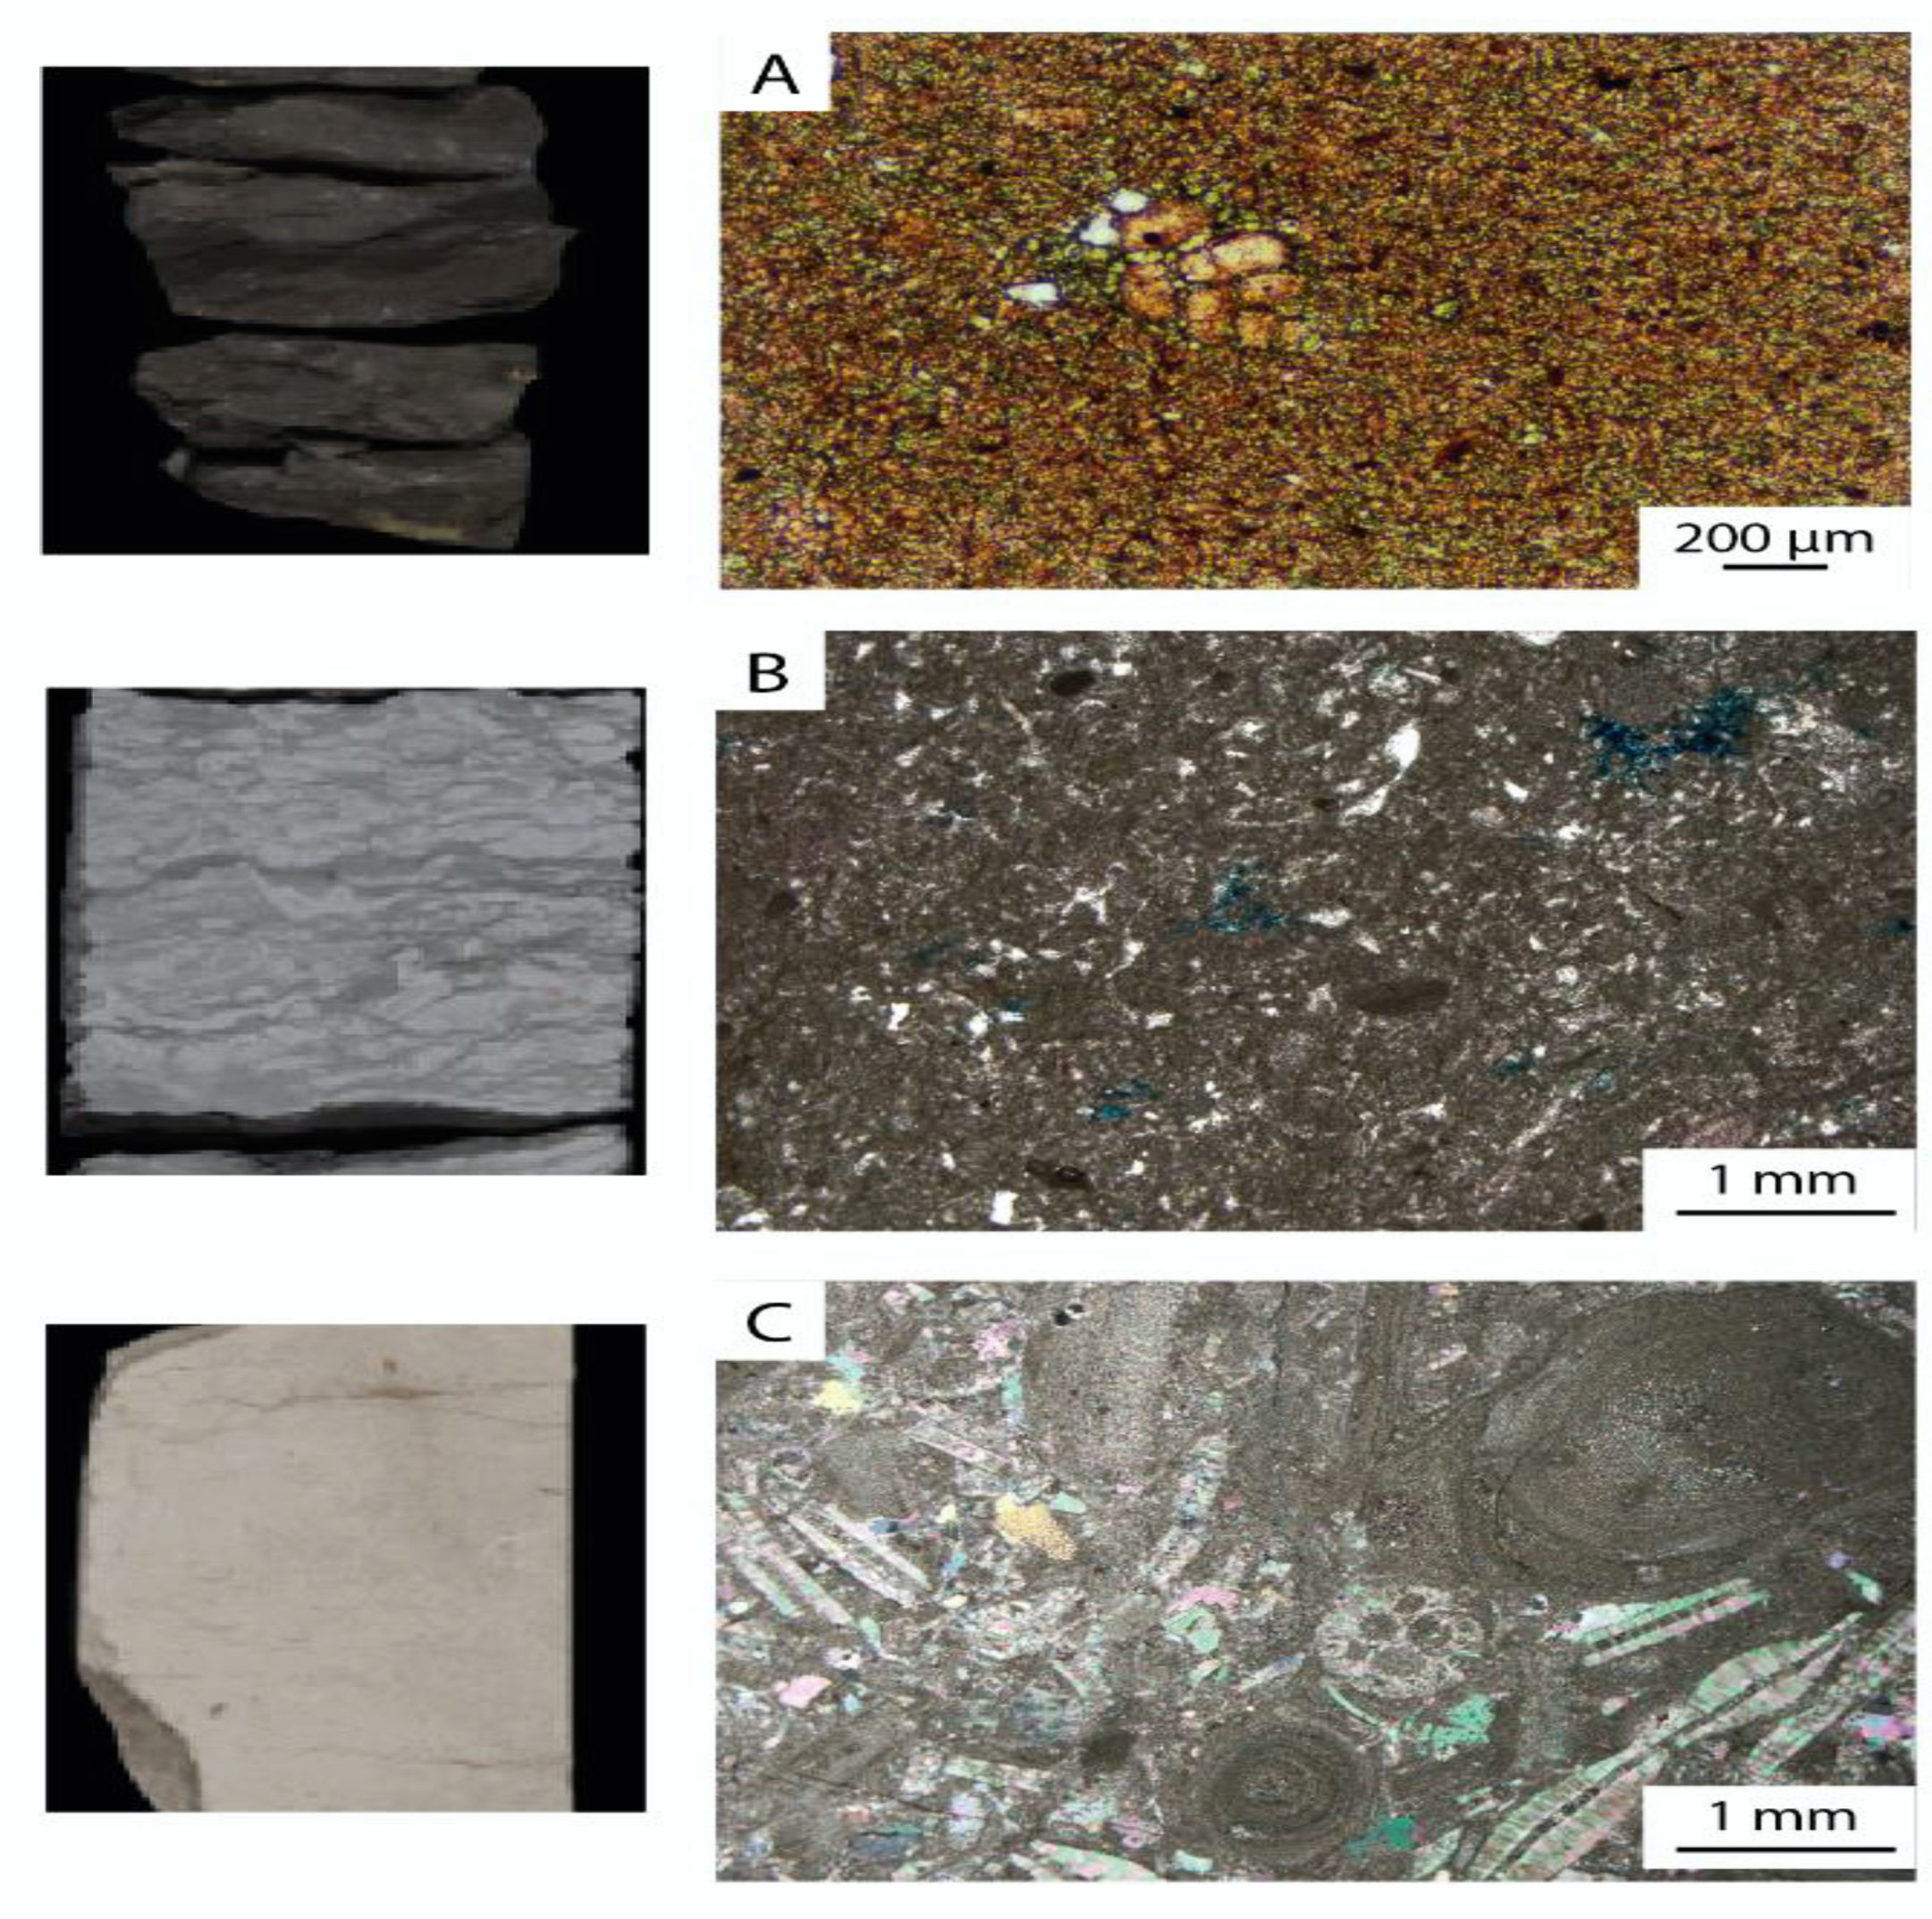
- Tight argillaceous limestone RT2 is considered the poorest reservoir rock porosity 2–8% and permeability of 1–5 Md. From the core observation, these intervals are considered tight thin intervals, formed by the abundant occurrence of massive crystalline corals or intermittent emergence horizons (Figure 6B).
- Mouldic limestone RT3, a rock type that forms thick intervals of good reservoir quality. Porosities are 20–40% and permeabilities 10–400 mD (Figure 6C).
- Chalkified limestones RT4 are widespread and constitute reservoirs with porosities ranging between 10 and 25% and permeabilities between 5 and 50 Md. Their porosity originated from fine interparticle microsolution chalkification (Figure 6D).
- Sucrosic dolomites RT5, from equally good reservoir rocks as mouldic limestones but, on a regional scale, they are less abundant than the latter. The sucrosic dolomites originated from mud-supported carbonates and have porosities of 15–30% and permeabilities of 10–500 mD (Figure 6E).
- Mouldic sucrosic dolomites RT6 exhibit fossil mould in addition to their intercrystalline porosity. They form excellent reservoir rocks but have a limited distribution not exceeding 10% of the total rock volume. Porosities are 25–40% and permeabilities 100–3000 mD (Figure 6F).
- (a)
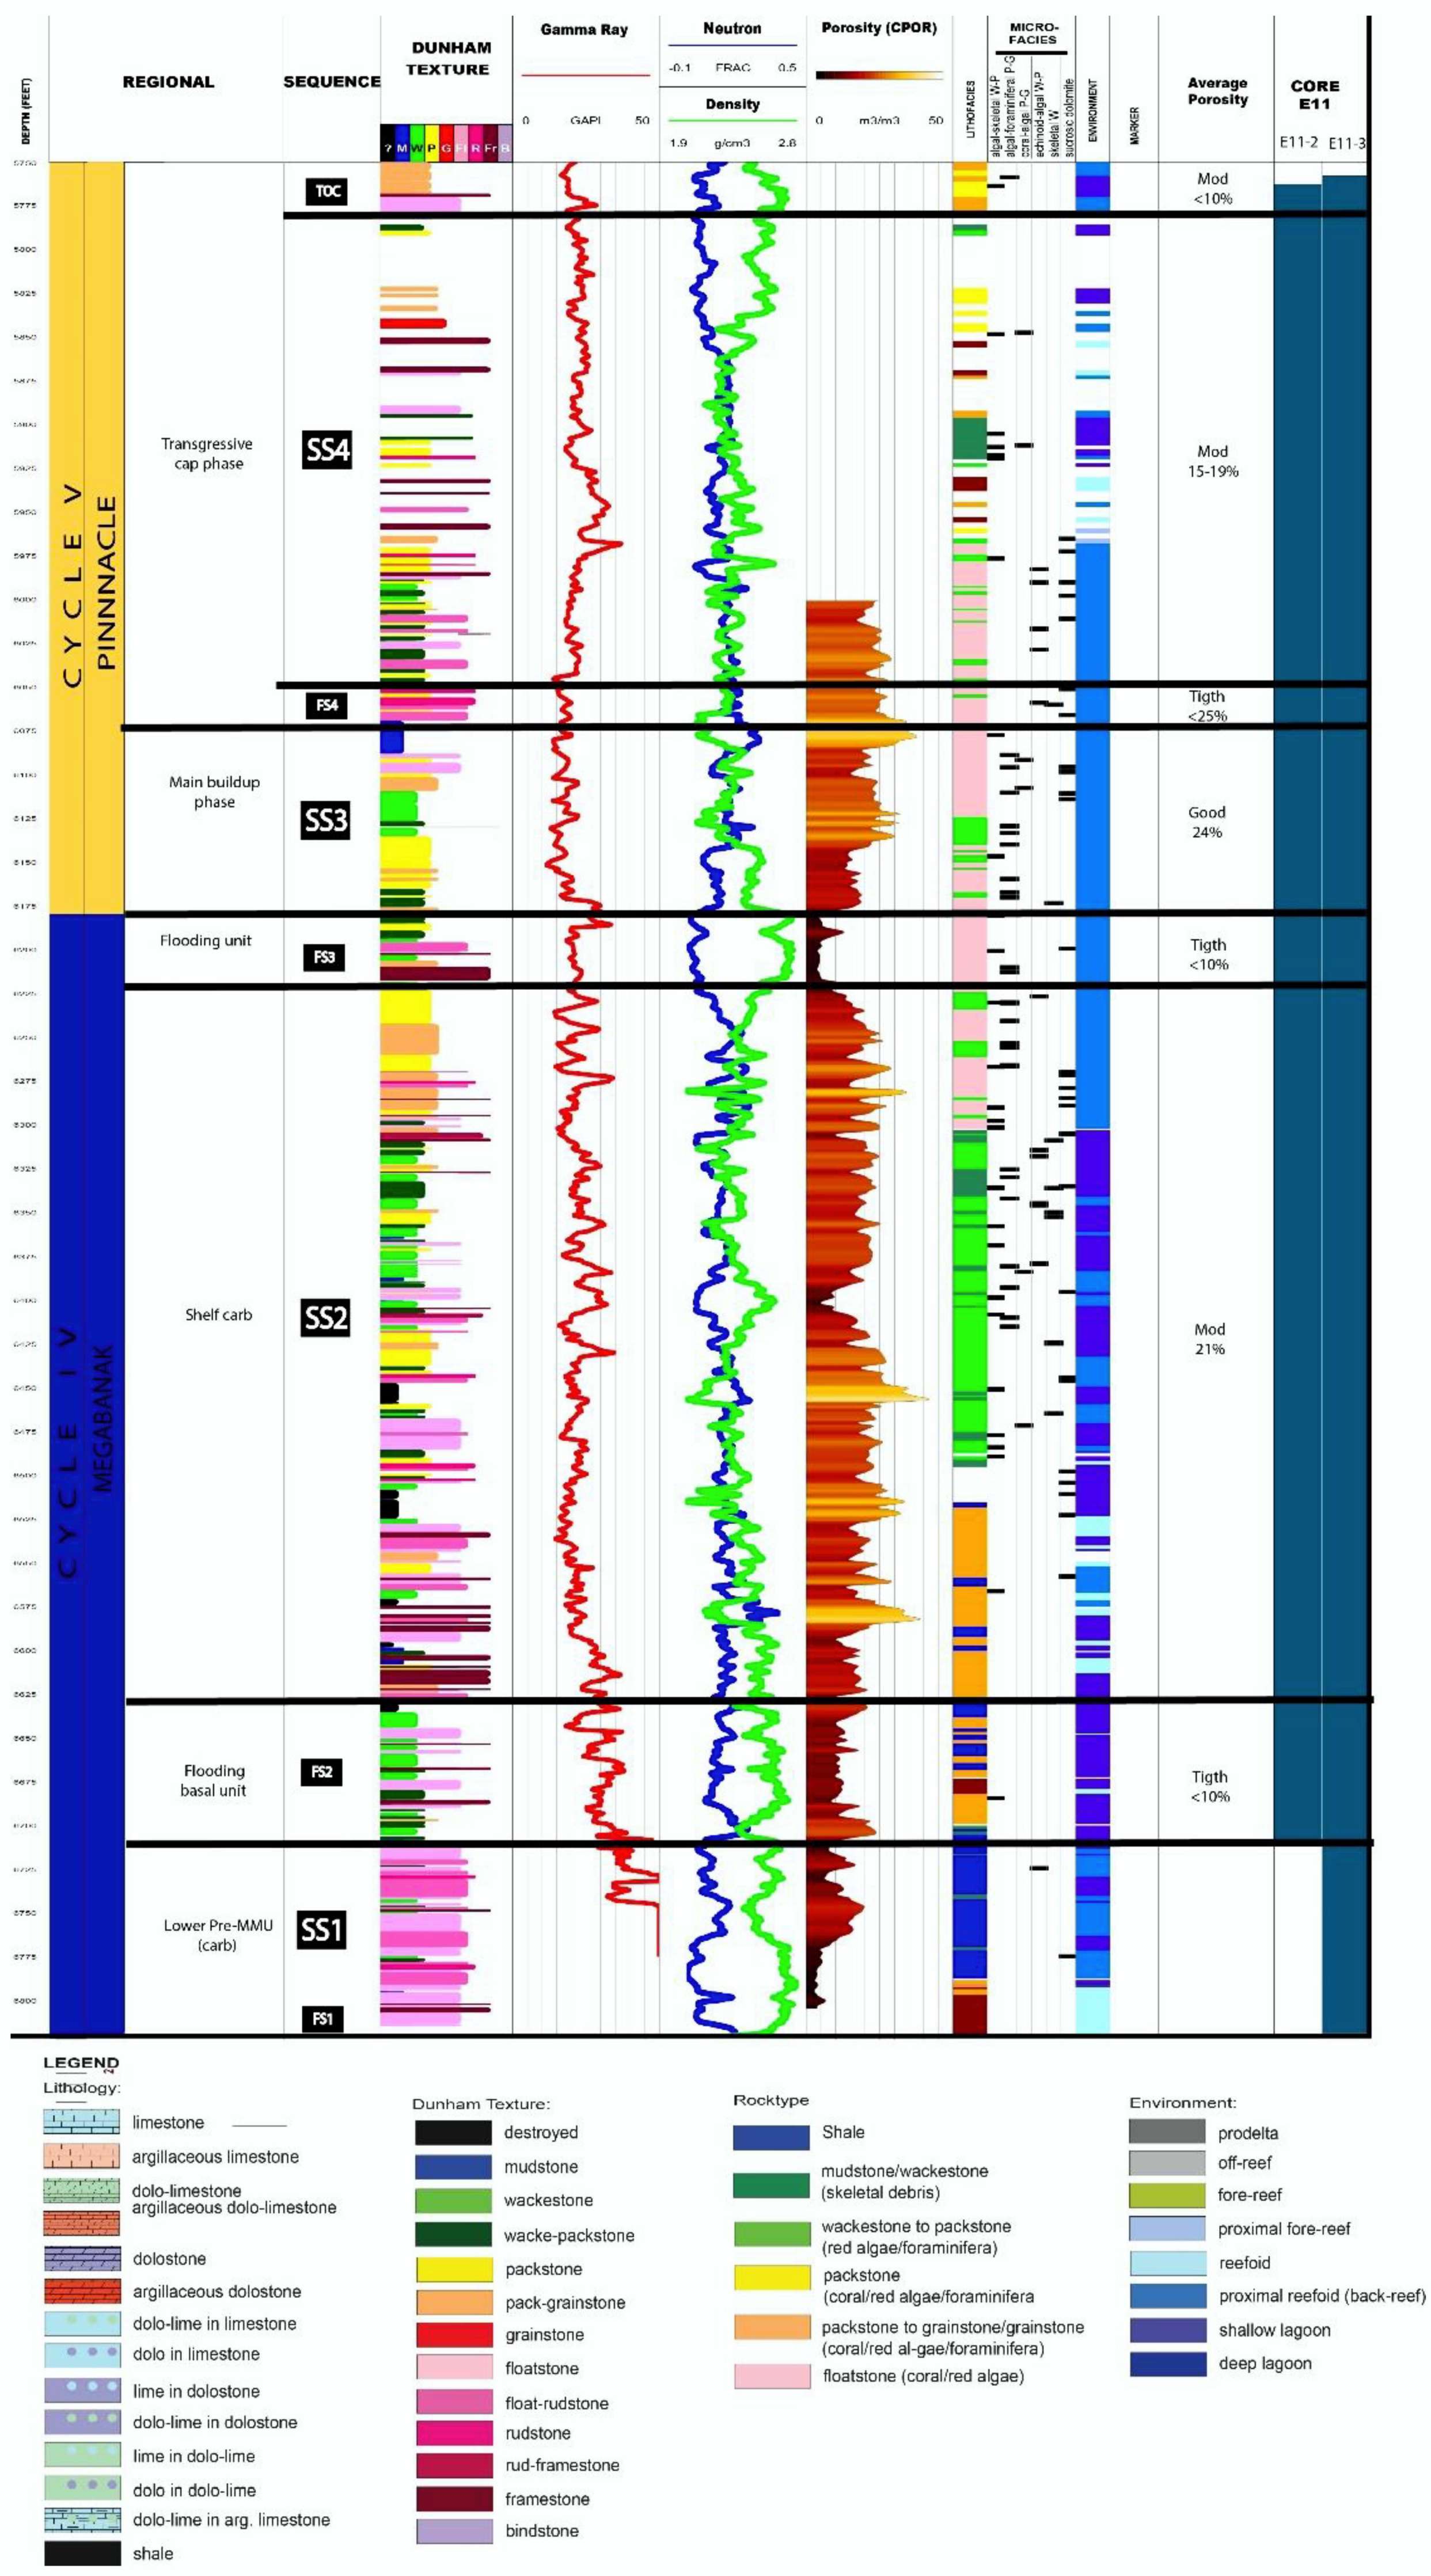
- Sequence SS1 Cycle IV
- (b)
- Sequence SS2 Cycle IV
- (c)
- Sequence SS3 Cycle IV
- (d)
- Sequence SS4 Cycle V
4.2. Self-Organizing Maps
- (a)
- Neural Analysis
- (b)
- Model Propagation
- (c)
- Correlation
5. Discussion
6. Conclusions
Author Contributions
Funding
Acknowledgments
Conflicts of Interest
References
- Epting, M. The Miocene carbonate buildups of central Luconia, offshore Sarawak. In Atlas of Seismic Stratigraphy; Bally, A.W., Ed.; AAPG: Tulsa, OK, USA, 1989; pp. 168–173. [Google Scholar]
- Wilson, M.E. Cenozoic carbonates in Southeast Asia: Implications for equatorial carbonate development. Sediment. Geol. 2002, 147, 295–428. [Google Scholar] [CrossRef]
- Epting, M.; Berhad, L.S.S. Sedimentology of Miocene Carbonate Buildups, Central Luconia, Offshore Sarawak. Bull. Geol. Soc. Malays. 1980, 12, 17–30. [Google Scholar] [CrossRef]
- Bracco Gartner, G.L. High-Resolution Impedance Model of Outcrops and Their Application in Seismic Interpretation. Ph.D. Thesis, Vrije Universiteit, Amsterdam, The Netherlands, 2000; pp. 105–123. [Google Scholar]
- Zampetti, V.; Schlager, W.; van Konijnenburg, J.-H.; Everts, A.-J. Architecture and growth history of a Miocene carbonate platform from 3D seismic reflection data; Luconia province, offshore Sarawak, Malaysia. Mar. Pet. Geol. 2004, 21, 517–534. [Google Scholar] [CrossRef]
- Jamaludin, S.F.; Pubellier, M.; Menier, D. Relationship between syn-depositional faulting and carbonate growth in Central Luconia Province, Malaysia. Bull. Geol. Soc. Malays. 2014, 60, 77–83. [Google Scholar] [CrossRef]
- Ali, S.H.; Poppelreiter, M.C.; Shah, M.M.; Saw, B.B.; Schlaich, M. Diagenetic understandings based on quantitative data, Miocene carbonate buildup, Offshore Sarawak Malaysia. Pet. Coal 2018, 60, 1275–1282. [Google Scholar]
- Rankey, E.C.; Schlaich, M.; Mokhtar, S.; Ghon, G.; Ali, S.H.; Poppelreiter, M. Seismic architecture of a Miocene isolated carbonate platform and associated off-platform strata (Central Luconia Province, offshore Malaysia). Mar. Pet. Geol. 2019, 102, 477–495. [Google Scholar] [CrossRef]
- Warrlich, G.; Adams, E.; Ryba, A.; Tam, T.; Ting, K.; Tang, H. What matters for flow and recovery in carbonate gas reservoirs: Insights from the mature Central Luconia Province, offshore Sarawak, Malaysia. AAPG Bull. 2019, 103, 691–721. [Google Scholar] [CrossRef]
- Jiménez Soto, G.; Latiff, H.A.; Poppelreiter, M.C.; Rahmatsyah, K.; Rahman, S.; Bing, S.B.; Habel, W.B. Application of Spectral Decomposition as a Tool for Carbonate Geobodies Extraction. In Proceedings of the 82nd EAGE Annual Conference & Exhibition, Amsterdam, The Netherlands, 18–21 October 2021; Volume 2021, pp. 1–5. [Google Scholar]
- Vahrenkamp, V.C. Miocene carbonates of Luconia Province, offshore Sarawak: Implication for regional geology and reservoir properties from strontium isotope stratigraphy. Bull. Geol. Soc. Malaysia. 1998, 42, 1–13. [Google Scholar] [CrossRef]
- Skalinski, M.; Kenter, J.A.M. Carbonate petrophysical rock typing: Integrating geological attributes and petrophysical properties while linking with dynamic behaviour. Geol. Soc. Lond. Spéc. Publ. 2014, 406, 229–259. [Google Scholar] [CrossRef]
- Jolley, S.J.; Fisher, Q.J.; Ainsworth, R.B. Reservoir compartmentalization: An introduction. Geol. Soc. Lond. Spéc. Publ. 2010, 347, 243–255. [Google Scholar] [CrossRef]
- Ahr, W.M. Geology of Carbonates: The Identification, Description, and Characterization of Hydrocarbon Reservoirs in Carbonate Rocks; John Wiley & Sons: Hoboken, NJ, USA, 2008. [Google Scholar]
- Ghon, G.; Grana, D.; Rankey, E.C.; Baechle, G.T.; Bleibinhaus, F.; Lang, X.; de Figueiredo, L.P.; Poppelreiter, M.C. Bayesian facies inversion on a partially dolomitized isolated carbonate platform: A case study from Central Luconia Province, Malaysia. Geophysics 2021, 86, B97–B108. [Google Scholar] [CrossRef]
- Wong, L.J.; Mohamad, A.H.; bt Ishak, N.A.; Shields, D.J.; Ali, F.H.B.; Amdan, A.B.; Panting, A.T.P. Rock Typing for a Carbonate Gas Field in Central Luconia Province—An Integrated Approach from Microscale to Macroscale. In Proceedings of the Third EAGE Integrated Reservoir Modelling Conference, Kuala Lumpur, Malaysia, 5–7 December 2016; Volume 2016, pp. 1–4. [Google Scholar]
- Koša, E. Sea-level changes, shoreline journeys, and the seismic stratigraphy of Central Luconia, Miocene-present, offshore Sarawak, NW Borneo. Mar. Pet. Geol. 2015, 59, 35–55. [Google Scholar] [CrossRef]
- Yusliandi, A.; Sautter, B.; Poppelreiter, M.C. The Various Controls on The Platform Architecture of Carbonate Buildups in the Central Luconia Province, Offshore Sarawak. Pet. Coal 2019, 61, 1425–1437. [Google Scholar]
- Dixit, N.; McColgan, P.; Kusler, K. Machine Learning-Based Probabilistic Lithofacies Prediction from Conventional Well Logs: A Case from the Umiat Oil Field of Alaska. Energies 2020, 13, 4862. [Google Scholar] [CrossRef]
- Jiménez Soto, G.; Arshad Berg, M.; Poppelreiter, M.C.; Rahmatsyah, K. Multiple Point Statistics Carbonate Facies Modelling Workflow using Core Data and Spectral Decomposition Attributes: A Case Study from TX Field in Central Luconia Province, Malaysia. Pet. Coal J. 2020, 62, 1209–1224. [Google Scholar] [CrossRef]
- Gunter, G.; Sahar, M.Y.; Viro, E.; Negahban, S.; Allen, D.F. Introducing a ten-step integrated petro-physical rock type verification process that combines deterministic methods, saturation height modeling, advanced. In Proceedings of the Abu Dhabi International Petroleum Exhibition & Conference, Abu Dhabi, United Arab Emirates, 12–15 November 2018. [Google Scholar]


| Field | Well | Spud Year | GR | NGS | SP | CAL | RES | DEN | NEU | DTS | Shear Sonic | RFT/FMT | Core |
|---|---|---|---|---|---|---|---|---|---|---|---|---|---|
| E11 | E11-1 | X | X | X | X | X | X | X | |||||
| E11-101 | X | X | X | X | X | X | X | X | |||||
| E11-102 | 1983 | X | X | X | X | X | X | X | X | X | |||
| E11-105 | 1983 | X | X | X | X | X | X | X | X | ||||
| E11-107 | X | X | X | X | X | ||||||||
| E11-108 | 1983 | X | X | X | X | X | X | X | |||||
| E11-109 | 1983 | X | X | X | X | X | X | X | |||||
| E11-112 | 1983 | X | X | X | X | X | X | X | X | ||||
| E11-2 | 1983 | X | X | X | X | X | X | X | X | ||||
| E11-3 | 1983 | X | X | X | X | X | X | X | X |
| Lithology | argillaceous and non-argillaceous limestone, dolo-limestone, dolostone, and shale |
| Texture | mudstone, wackestones, packstone, grainstone, floatstone, rudstone, framestone, and bindstone |
| Particle size | clay, silt; fine, medium, and coarse arenite and rudite |
| Components | massive, branching, and platy corals, coralline red algae, benthic foraminifera, bivalves, brachiopods, bryozoans, gastropods, oncoids, skeletal debris, intra-clasts, and echinoids (0: absent, 1: rare, 2: common, 3: abundant). |
| Sedimentary structures | bioturbation (0: absent, 1: rare, 2: common, 3: abundant), micro-karst, karst features, rootlets |
| Diagenetic features | stylolite frequency per foot: 1 (1), 2 (2 to 3), 3 (4 to 10), 4 (11–30), 5 (>30); horsetails, solution seams (0: absent, 1: rare, 2: common, 3: abundant); mechanical compaction, dissolution/leaching, cementation, and recrystallization |
| 1 | Shale | LTF1 |
| 2 | Mudstone to wackestone (skeletal) | LTF2 |
| 3 | Mudstone to wackestone (red algae) | LTF3 |
| 4 | Wackestone (skeletal) | LTF4 |
| 5 | Wackestone (coral) | LTF5 |
| 6 | Wackestone (red algae) | LTF6 |
| 7 | Wackestone (benthic foraminifera) | LTF7 |
| 8 | Wackestone to packstone (skeletal) | LTF8 |
| 9 | Wackestone to packstone (coral) | LTF9 |
| 10 | Wackestone to packstone (red algae) | LTF10 |
| 11 | Wackestone to packstone (benthic foraminifera) | LTF11 |
| 12 | Packstone (skeletal) | LTF12 |
| 13 | Packstone (coral) | LTF13 |
| 14 | Packstone (red algae) | LTF14 |
| 15 | Packstone (benthic foraminifera) | LTF15 |
| 16 | Packstone to grainstone (skeletal) | LTF16 |
| 17 | Packstone to grainstone (coral) | LTF17 |
| 18 | Packstone to grainstone (benthic foraminifera) | LTF18 |
| 19 | Grainstone (benthic foraminifera) | LTF19 |
| 20 | Floatstone (coral) | LTF20 |
| 21 | Floatstone to rudstone (coral) | LTF21 |
| 22 | Floatstone to rudstone (red algae) | LTF22 |
| 23 | Rudstone (coral) | LTF23 |
| 24 | Rudstone (red algae) | LTF24 |
| 25 | Rudstone (benthic foraminifera/skeletal) | LTF25 |
| 26 | Rudstone to framestone (coral) | LTF26 |
| 27 | Framestone (coral) | LTF27 |
| 1 | Shale | LTF1 |
| 2 | mudstone/wackestone (skeletal debris) | LTF2 |
| 3 | wackestone to packstone (red algae/foraminifera) | LTF3 |
| 4 | packstone (coral/red algae/foraminifera) | LTF4 |
| 5 | packstone to grainstone/grainstone (coral/red algae/foraminifera) | LTF5 |
| 6 | floatstone (coral/red algae) | LTF6 |
| 1 | Dense argillaceous shale | R1 |
| 2 | Cemented argillaceous limestone | R2 |
| 3 | Mouldic limestone | R3 |
| 4 | Chalkified limestones | R4 |
| 5 | Sucrosic dolomites | R5 |
| 6 | Mouldic sucrosic dolomites | R6 |
| RT1 | RT2 | RT3 | RT5 | RT6 | Total | |
|---|---|---|---|---|---|---|
| RT1 | 17 | 6 | 23 | |||
| RT2 | 474 | 5 | 21 | 26 | 526 | |
| RT3 | 11 | 177 | 15 | 7 | 210 | |
| RT5 | 24 | 20 | 497 | 29 | 570 | |
| RT6 | 3 | 62 | 13 | 35 | 699 | 812 |
| Total | 20 | 571 | 215 | 568 | 767 | 2141 |
Publisher’s Note: MDPI stays neutral with regard to jurisdictional claims in published maps and institutional affiliations. |
© 2022 by the authors. Licensee MDPI, Basel, Switzerland. This article is an open access article distributed under the terms and conditions of the Creative Commons Attribution (CC BY) license (https://creativecommons.org/licenses/by/4.0/).
Share and Cite
Jiménez Soto, G.; Abdul Latiff, A.H.; Ben Habel, W.; Bing Bing, S.; Poppelreiter, M. Integrated Carbonate Rock Type Prediction Using Self-Organizing Maps in E11 Field, Central Luconia Province, Malaysia. Appl. Sci. 2022, 12, 7688. https://doi.org/10.3390/app12157688
Jiménez Soto G, Abdul Latiff AH, Ben Habel W, Bing Bing S, Poppelreiter M. Integrated Carbonate Rock Type Prediction Using Self-Organizing Maps in E11 Field, Central Luconia Province, Malaysia. Applied Sciences. 2022; 12(15):7688. https://doi.org/10.3390/app12157688
Chicago/Turabian StyleJiménez Soto, Grisel, Abdul Halim Abdul Latiff, Wael Ben Habel, Saw Bing Bing, and Michael Poppelreiter. 2022. "Integrated Carbonate Rock Type Prediction Using Self-Organizing Maps in E11 Field, Central Luconia Province, Malaysia" Applied Sciences 12, no. 15: 7688. https://doi.org/10.3390/app12157688
APA StyleJiménez Soto, G., Abdul Latiff, A. H., Ben Habel, W., Bing Bing, S., & Poppelreiter, M. (2022). Integrated Carbonate Rock Type Prediction Using Self-Organizing Maps in E11 Field, Central Luconia Province, Malaysia. Applied Sciences, 12(15), 7688. https://doi.org/10.3390/app12157688