1. Introduction
Road damage detection (RDD) is an important task in the field of traffic infrastructure and involves locating and classifying road damage [
1,
2,
3,
4]. It can identify roads that need maintenance to reduce potential safety hazards. However, current RDD approaches still depend on manual inspection in most countries. This not only consumes a lot of time and labor, but it also cannot ensure that the damaged road sections are repaired in time. Targeting this problem, automated detection of road damage (ADRD) based on deep learning began to appear and gradually become an emerging task in computer vision [
4,
5]. Its research goal is to realize automatic road damage detection and analysis so as to play an important role in intelligent traffic maintenance systems.
Most of the existing methods use convolutional networks to learn classification features and have achieved significant performance improvement on public foreign datasets [
3,
6]. When these methods are directly applied to actual road images in other countries, however, there is a landslide decline in accuracy. This is because there are differences in data distribution between training data and actual testing data. After all, different climates, road construction standards and traffic rules in every country lead to differences in damage appearance and susceptible locations. In machine learning, transfer learning [
3] or semi-supervised training [
5] can effectively alleviate the impact of the distribution gap between training and testing data on generalization. However, the premise is that there is insufficient target domain data for training. At present, many datasets of road damage are private and unpublished [
7,
8], which greatly limits the exploration of ADRD. Therefore, the most important research motivation of this paper is to release a new road damage dataset with professional classification and of uniform size so as to promote the research of relevant algorithms.
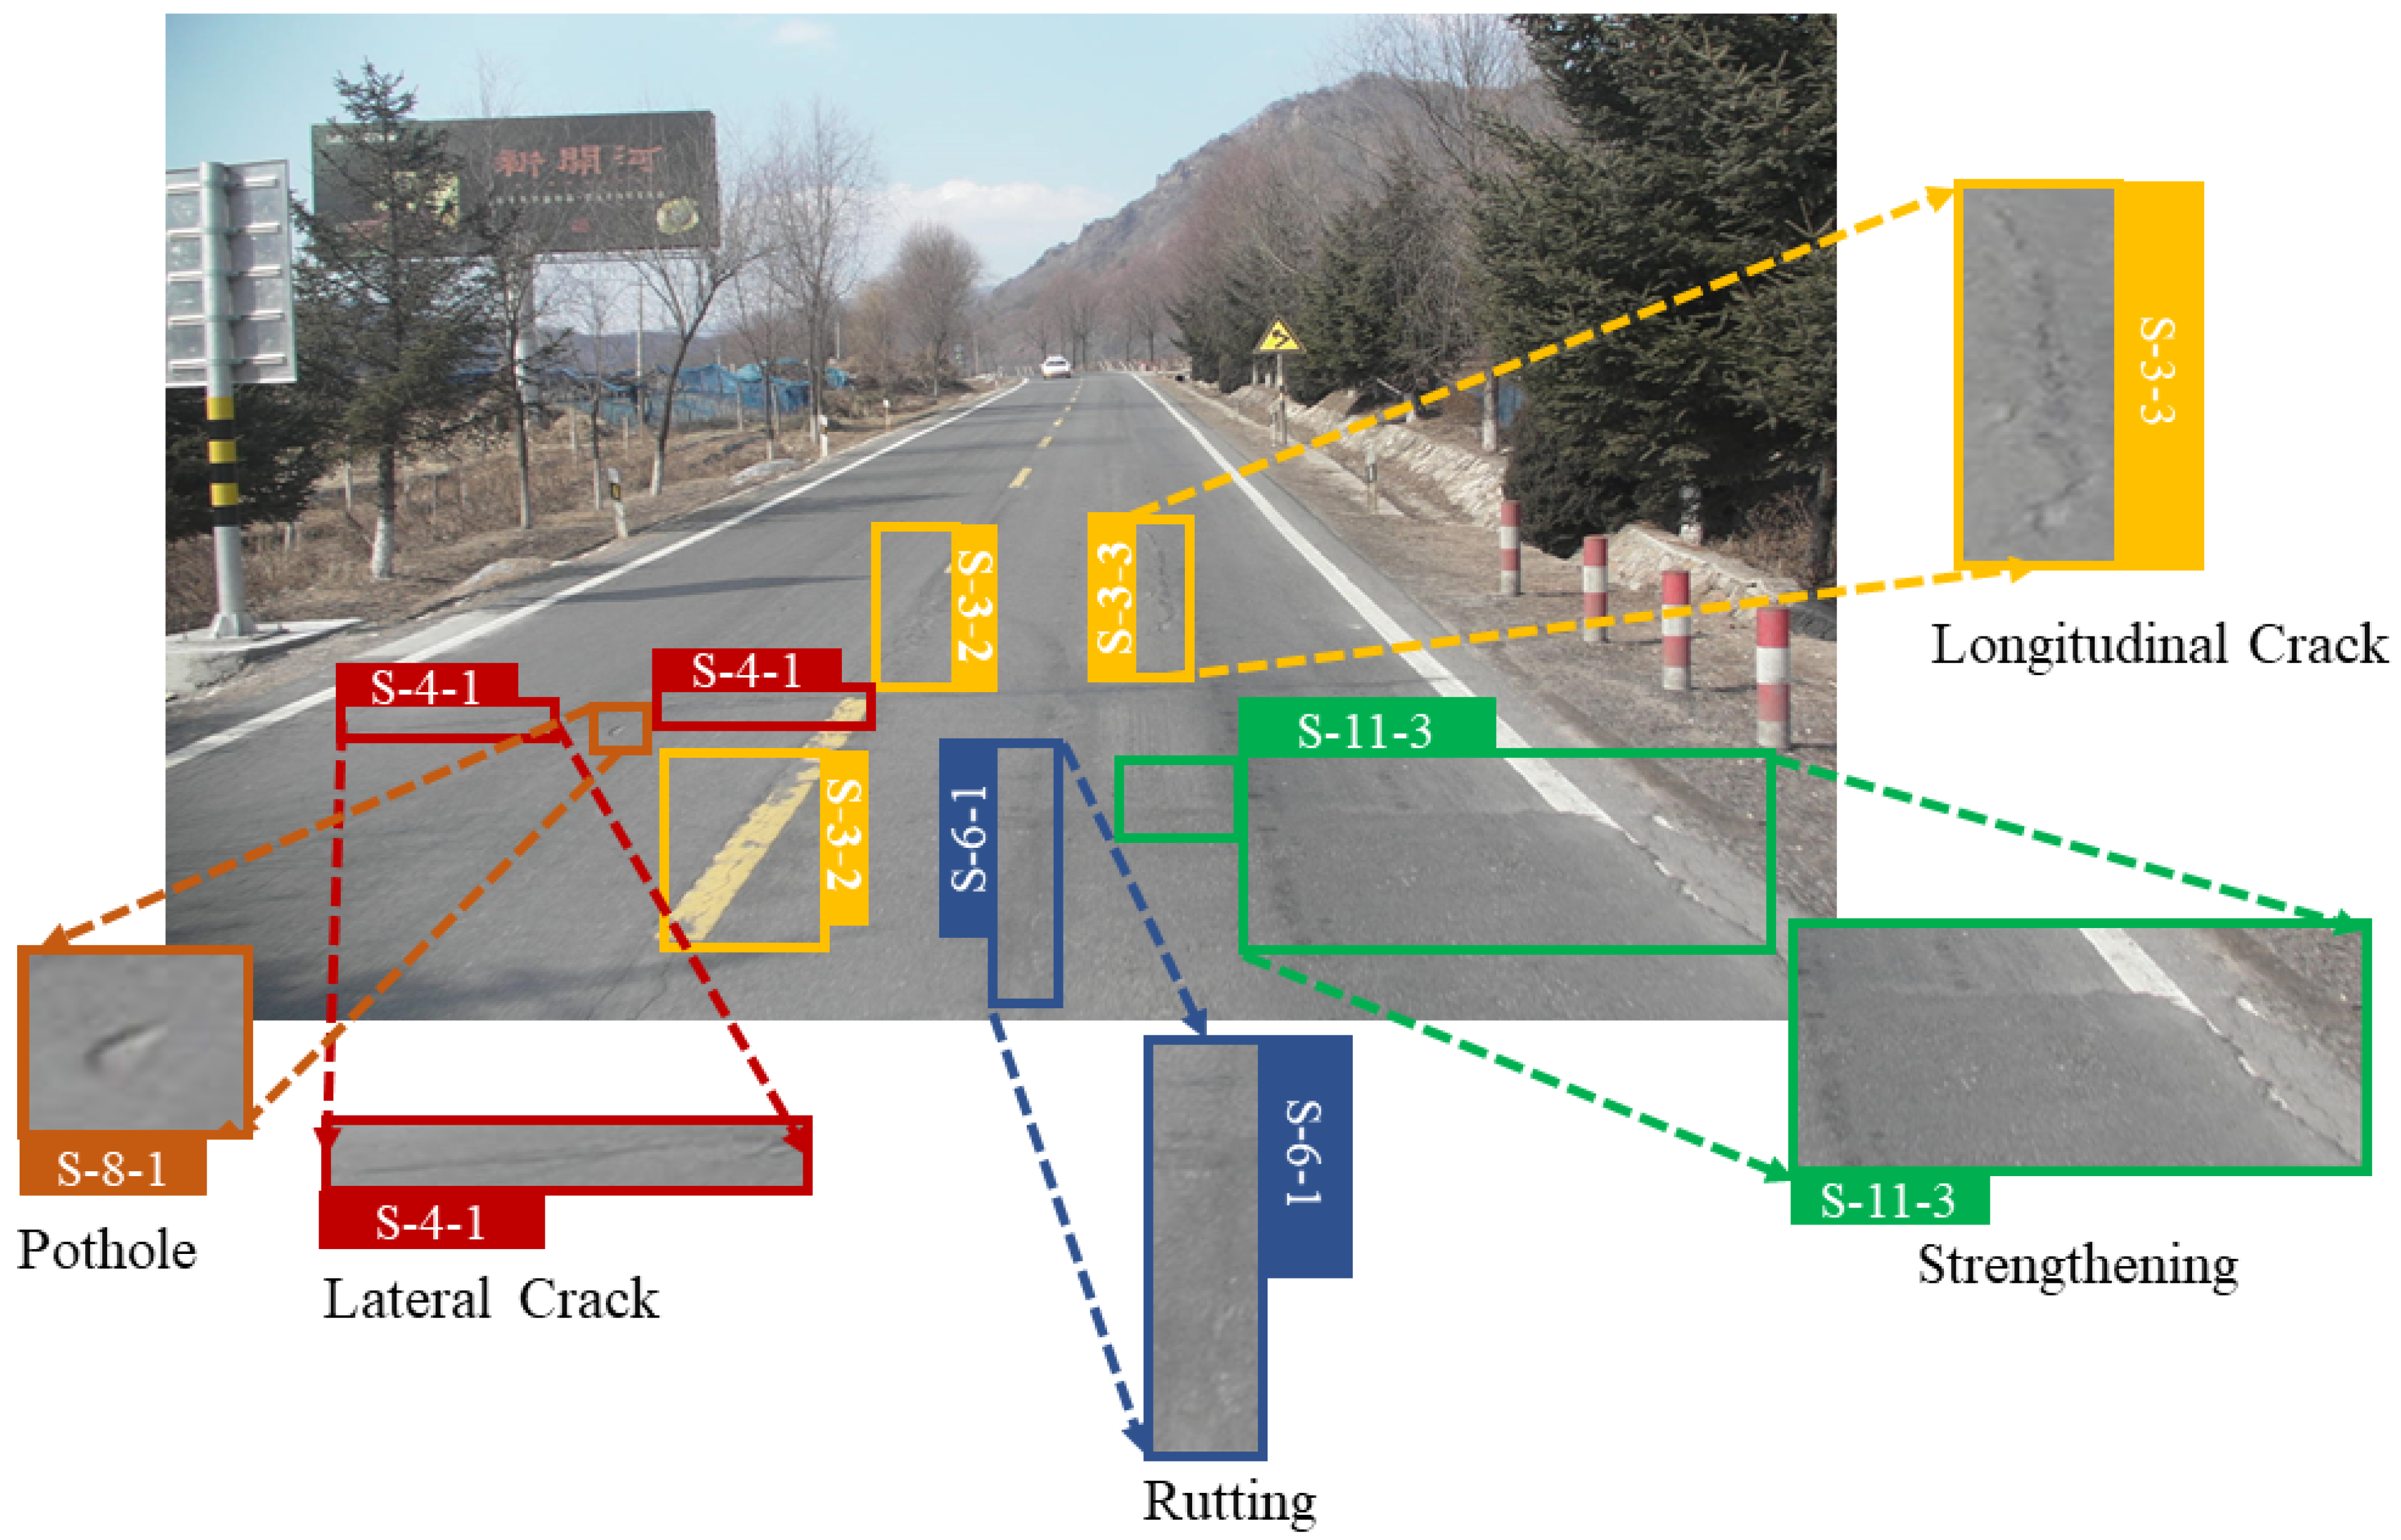
In order to realize this research motivation, this paper collected and annotated the first edition of the China Road Damage Detection Dataset (CNRDD) over the course of three months. It consists of 4319 high-definition road images and provides 21,552 road damage annotations. These annotations contain eight types of damage: crack, longitudinal crack, lateral crack, subsidence, rutting, pothole, looseness and strengthening. Each category of damage also contains three different degree labels, namely mild, moderate and severe. Some damage examples are shown in
Figure 1.
As shown in
Figure 1, multiple types of damage can appear in the same image. Although they do not overlap, the features of each kind of damage are very close to those of healthy road surfaces. In many cases, it is difficult even for the human eye to correctly classify only based on the images taken by vehicle cameras without field investigation. These phenomena make ADRD very challenging. The top view, which is similar to the perspective of a remotely sensed image, can alleviate the above difficulties to some extent [
6,
9]. Such images need to be taken manually or by an unmanned aerial vehicle (UAV), however, which makes it impossible to quickly patrol large-scale, high-traffic road scenes. In order to effectively patrol multiple long-distance roads, it is also necessary to use onboard cameras that can feed back the collected images to the terminal in a timely manner. This can automatically warn of the damaged sections to be repaired and improve maintenance efficiency. Thus, using the ADRD algorithm to realize the automatic early warning of damaged sections can improve maintenance efficiency.
The images taken by the onboard camera are different from remote sensing images. These onboard images have obvious perspective relationships, so it is impossible to use a similar network for accurate detection [
10]. Of course, these images are also different from conventional photos with perspective changes. The size of the collected image is large, but the proportion of damage is small in the image. The apparent distribution of the damage is sparse, and the boundary is not obvious. If we directly use any series of object detection algorithms, such as Faster RCNN [
11,
12] or YOLO [
13,
14,
15,
16,
17], it is very easy to have false detection and missed detection [
18].
To solve this problem, this paper proposes novel road damage detection with attention learning based on existing detection algorithms. It consists of an attention fusion module, a salient feature learning module and fine-tuned training. The attention fusion module introduces simple and fast candy edge detection to provide salient cues and then guides damage detection by attention learning, which can effectively alleviate the sparse distribution and unclear boundaries of road damage. The salient feature learning module explicitly leverages attention normalization to alleviate the interference of approximate appearance on damage detection. Fine-tuning adopts a strategy from coarse to fine. That is, it first uses coarse labels without severity for training to obtain a pre-training model. Then, we fine-tune the proposed framework with the relatively strict categories of labels. This fine-tuning can enhance the network’s perception of different damage and thus reduce the impact of some types of damage with similar appearance on classification. We evaluate the proposed baseline on the popular RDD2020 dataset [
3] and the self-collected CNRDD dataset. It was found that the CNRDD dataset is more challenging than the RDD2020 dataset, and cracks are easier to distinguish than other damage. Further, the proposed baseline has a significantly improved F1-Score and mAP. Although its accuracy does not reach the level of physical object detection, this model at least provides a feasible solution for supervised ADRD.
In summary, this paper’s contributions are threefold:
- (1)
Release the first China road damage detection dataset, which contains eight types of damage with three degrees of severity. It is named CNRDD and comprises 21,552 annotations from 4319 images, which can effectively promote the development of ADRD.
- (2)
Design an attention-learning-based road damage detection framework, which can explicitly utilize attention fusion and attention normalization to enhance the learning of salient damage features.
- (3)
On RDD2020 and CNRDD datasets, the proposed baseline achieved state-of-the-art performance against existing methods without embedded learning. Based on the experiments, this work provides meaningful recommendations for future ADRD research.
2. Related Work
Automatic road damage detection first appeared in the 1980s [
19]. It mainly relies on traditional edge detection and filtering to complete image processing, and then uses SVM or AdaBoost to realize classification [
20,
21,
22]. However, these early methods are sensitive to data diversity and thus cannot be applied in real scenes. With the rapid development of artificial intelligence in the field of computer vision, road damage detection based on deep learning has become the mainstream of ADRD [
23,
24]. This has greatly fostered the development of ADRD, but there are still deficiencies in accuracy and practicability. In this section, therefore, we briefly review some representative research and the datasets supporting this research and then analyze the existing problems and potential solutions.
2.1. Existing Road Damage Datasets
For any deep learning algorithm, trainable data is the key. ADRD is no exception. In order to meet the needs of ADRD training, three road damage datasets have been released. The first one is the German Asphalt Pavement Distress (GAPs) dataset [
25], which was collected from three different federal highways in Germany. It consists of 2468 gray-valued images with manual annotations. In practical applications, however, color images are more conducive to road damage detection than gray-scale images. The second dataset is the Pavement Image Dataset (PID) [
26], which was captured by street cameras from 22 different road sections of the United States. It provides 7237 images and 67,469 labels. These labels are annotated as nine categories, but eight of them identify cracks, and the other is for potholes. This classification is not conducive to network training. The third dataset is the RDD dataset [
3]. It was released in 2018 and has been updated to include three versions so far; it is the most widely used dataset in road damage detection tasks. This dataset was captured by a smartphone installed in a vehicle and contains 31,342 road damage annotations from India, Japan and the Czech Republic. However, the overall size of the images is relatively small due to the capture equipment. The damage density of the RDD dataset is low, meaning a large number of samples have only one damage bounding box. Rather than locating road damage, the dataset focuses more on the recognition of road damage.
The datasets mentioned above have contributed to the development of ADRD. It is not surprising to find that most data are collected from developed countries. Due to various climates, road infrastructure standards and traffic rules, there are obvious differences in the data distributions of road damage among countries. In order to further promote the development of ADRD, this paper releases a new road damage dataset named CNRDD. In the process of data collection and labeling, types of damage are classified into eight categories according to the latest evaluation standards for highway technical conditions (JTG5210-2018). Considering the advantages of deep learning in recognition and classification, samples in which a single image contains multiple types of damage are selected to increase the difficulty and practical value of the dataset. In addition, in order to better access future intelligent road maintenance system, a professional onboard camera is chosen as the acquisition device. In this way, when road maintenance vehicles or driverless cars patrol daily in the future, they can provide timely feedback via uploading collected images to the cloud or server through 5G technology. Then, the ARDR algorithm can distinguish whether there is damage in the feedback images and give maintenance warnings for serious segments. This mode of ADRD can improve maintenance efficiency, reduce the economic cost caused by untimely maintenance and can reduce the number of traffic accidents caused by road damage. This work hopes to attract more researcher attention to ADRD and to create a new paradigm for the realization of intelligent road maintenance as soon as possible.
2.2. Existing Damage Detection Approaches
As we all know, object detection based on deep learning is the most successful task in the field of computer vision. Most of the existing methods can be divided into one-stage or two-stage according to the network structure [
11,
12,
13,
17]. Two-stage methods consist of bounding box regions and proposal classification. This technique began with RCNN and then evolved into Faster RCNN through the introduction of a region proposal network and an ROI pooling layer [
11,
12]. Faster RCNN is widely used in pedestrian detection, remote sensing image detection and other practical applications. With the support of pre-training models from the ImageNet dataset, this method can generally obtain good accuracy, but its complex structure leads to a large amount of time and memory space for training and testing. The one-stage method, represented by the you-only-look-once (YOLO) series, directly regards target detection as a regression problem [
13,
14,
15,
17]. It can carry out end-to-end object detection in the whole image. The original YOLO v1 gradually evolved into YOLO v5 by introducing batch normalization (BN) and Darknet structures, which improve the accuracy and accelerate the convergence speed. The main advantages of one-stage methods lie in their ability to detect small objects and their high efficiency. Because of these attributes, they are more suitable as the baseline for road damage detection.
Zhang et al. used YOLO v4 to detect road damage on the RDD dataset [
6] and introduced a generative adversarial network (GAN) for data augmentation. Additionally considering data augmentation are PG-GAN proposed by Maeda et al. [
27] and the improved transfer learning proposed by Arya et al. [
3]. They all hope to use GAN to generate more diverse training samples to improve the generalization ability of networks in real road scenes. However, they did not consider semi-supervised training for the generated data, so they failed to give full play to the role of data augmentation. In addition, there are some algorithms of road damage detection assisted by 3D sensors and laser cameras. They utilize the depth information and sensing signals of the road surface to improve the location and classification of road damage [
23,
28]. Relevant professional equipment is generally expensive, which makes it suitable for quantitative analysis of road damage prior to road maintenance, but it is not convenient for daily road damage detection.
Almost all of the methods mentioned above are evaluated on the RDD dataset [
3]. Based on this dataset, the BigData Road Damage Detection Challenge was held three times from 2018 to 2020. In a recent challenge, DiDi and the Shenzhen Urban Transport Planning Center achieved excellent performance by improving Faster RCNN and YOLO v4 [
5]. This demonstrates that the road damage detection task has attracted much attention and has potential research value. Although its development is not mature at this stage, most methods rely on modification of object detection networks [
7,
29,
30,
31]. With the release of the CNRDD dataset and its subsequent continuous updating, however, there will be more targeted research to promote the development of ADRD. Aiming at the regional dispersion of road damage, this paper proposes a road damage detection baseline with attention learning. It introduces attention fusion and attention normalization to damage detection for the first time and sheds light on ADRD with attention learning.
3. China Road Damage Detection Dataset
Existing datasets can be divided into wide-view and top-view according to their shooting perspective. Damage captured from top-view images has no distortion and is easier to recognize. However, collecting top-view images needs UAVs and other professional equipment. This limits it to single acquisition areas, which makes it impossible for it to access the intelligent road damage detection system on a large scale. It may be more suitable for dangerous or inaccessible sections. Wide-view images can be easily obtained by smartphones or ordinary cameras. The shooting angle of wide-view images is free and changeable, and such images have obvious perspective relationships. Moreover, this kind of image usually contains interference items, such as buildings, vehicles or pedestrians, which makes it more difficult to detect road damage compared to top-view images. These datasets, no matter what perspective, have greatly fostered the development of ADRD.
However, the published parts of these datasets are collected from foreign roads. Further, there is a variety of data distribution within them due differences in acquisition equipment and shooting perspectives. This makes it difficult to establish a scientific cross-domain bridge by transfer learning. In order to solve these problems, this paper puts forward a CNRDD dataset that may become the standard for road damage detection. It adopts unified collection and annotation according to the actual situation of roads in China. This can facilitate subsequent expansion and cross-domain transfer learning, which will help the model improve the generalization ability for road damage detection.
The CNRDD dataset has the following three advantages over existing datasets: (1) Data collection adopts a professional onboard camera, and the image size is unified, which is conducive to the access of ADRD to intelligent road maintenance system in the future. (2) Classification meets the evaluation standards of China’s highway technical status, and the damage categories are richer, which can provide data support for the application and promotion of ADRD algorithms. (3) The dataset has high damage density in single images and provides damage degree classification, which is more challenging for the damage detection algorithm. The specific introduction of dataset classification statistics and evaluation indicators is as follows.
3.1. Data Collection and Annotation
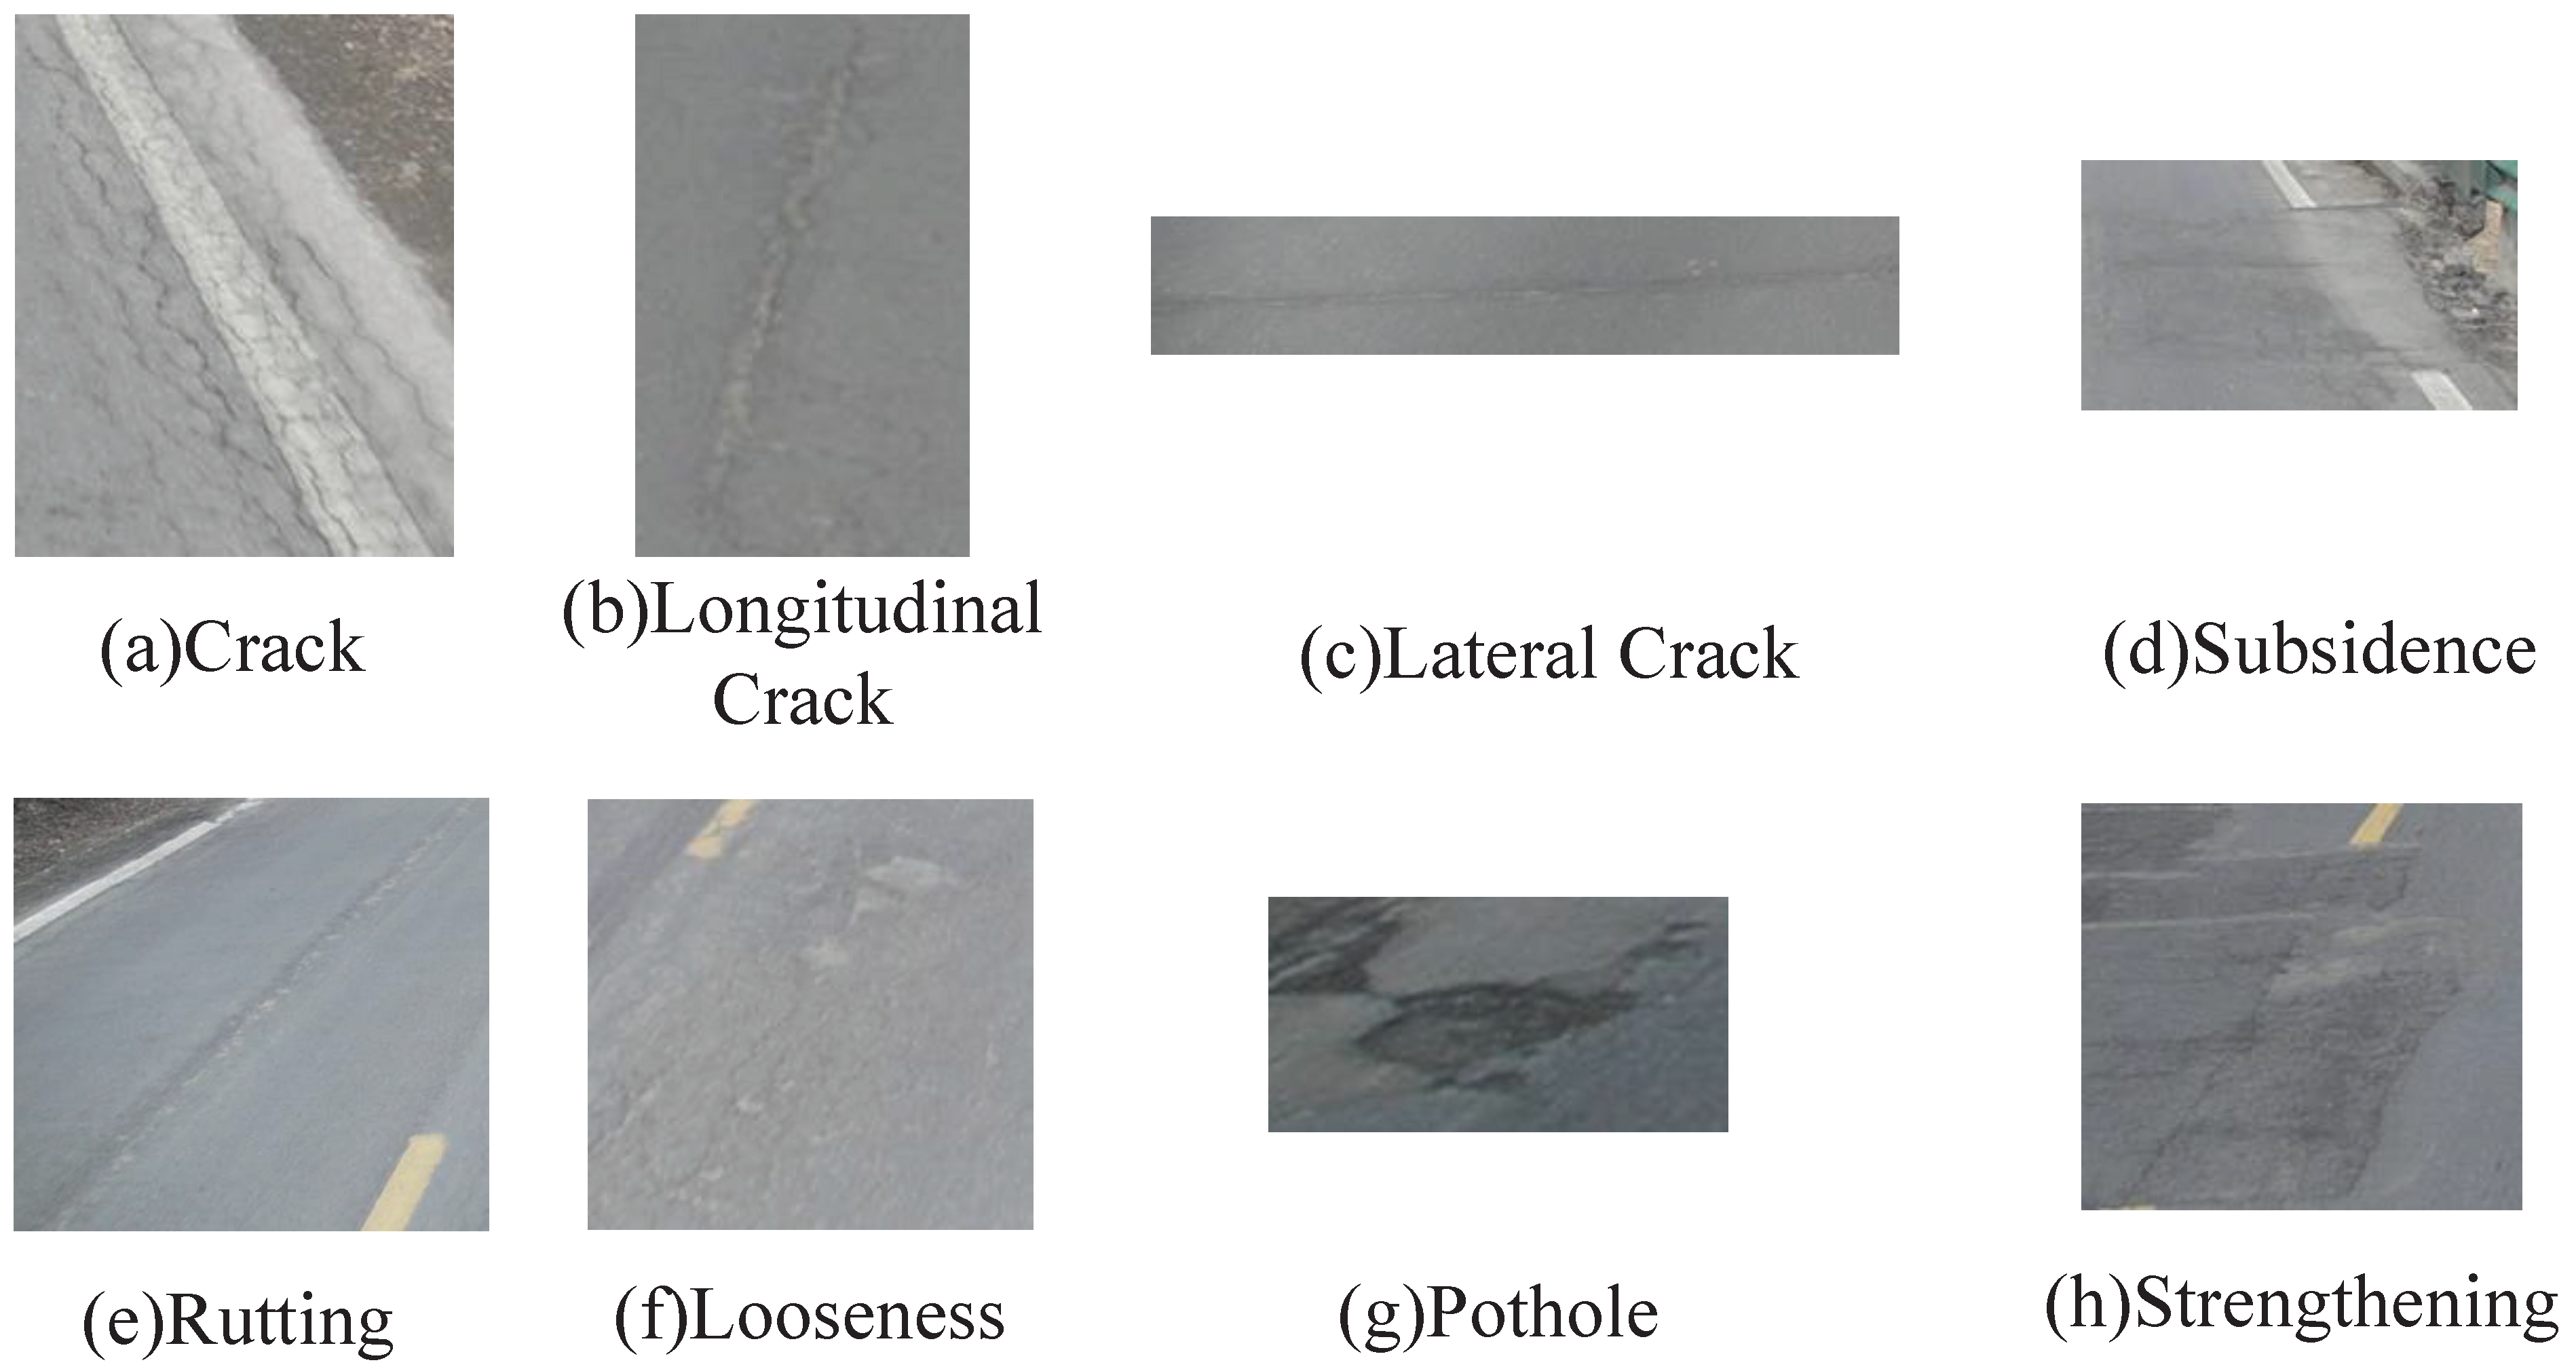
The G303 road segment in China is selected to collect road damage data at this time. Compared with other pavement, G303 has a large number of trucks/cars passing every day. Further, the temperature differences of this road segment are large across the four seasons. These problems lead to higher road damage density in collected single images, and road damage detection carried out on the dataset is more challenging. Ultimately, the dataset included 4319 images with 21,552 annotations. These pictures were uniformly captured using professional onboard cameras. All image are 1600 × 1200 pixels and wide-view perspective. According to the evaluation standard for highway technical conditions, the CNRDD provides eight types of damage labels, including crack, longitudinal crack, lateral crack, subsidence, rutting, looseness, pothole and strengthening. Visual examples of these types of damage are shown in
Figure 2.
As shown in
Figure 2, (a) cracks, (b) longitudinal cracks and (c) lateral cracks are the most common types of damage on daily roads. Among these, cracks appear like crocodile skin, and their initial shape is multiple parallel longitudinal cracks along the tire track line. With the repeated rolling of vehicles, lateral and oblique cracks appear between parallel longitudinal cracks to form cracks. (d) Subsidence refers to local depression of the road surface caused by foundation settlement. (e) Rutting is longitudinal depression of the road surface along the wheel track and is usually caused by insufficient compaction and poor composition of the mixed material during construction. (f) Looseness mainly comes from asphalt aging. It has various appearances, such as coarse and fine aggregate loss, pitted surfaces and even surface peeling. (g) Potholes are usually caused by looseness, cracks, subsidence and other types of damage that are not repaired in time. Its classification features are relatively obvious. (h) Strengthening is not real road damage. It represents areas where the damaged pavement has been repaired. Due to the diversity of in road damage repair, strengthening has many forms of appearance. Therefore, the degree of strengthening is not classified in the CNRDD dataset.
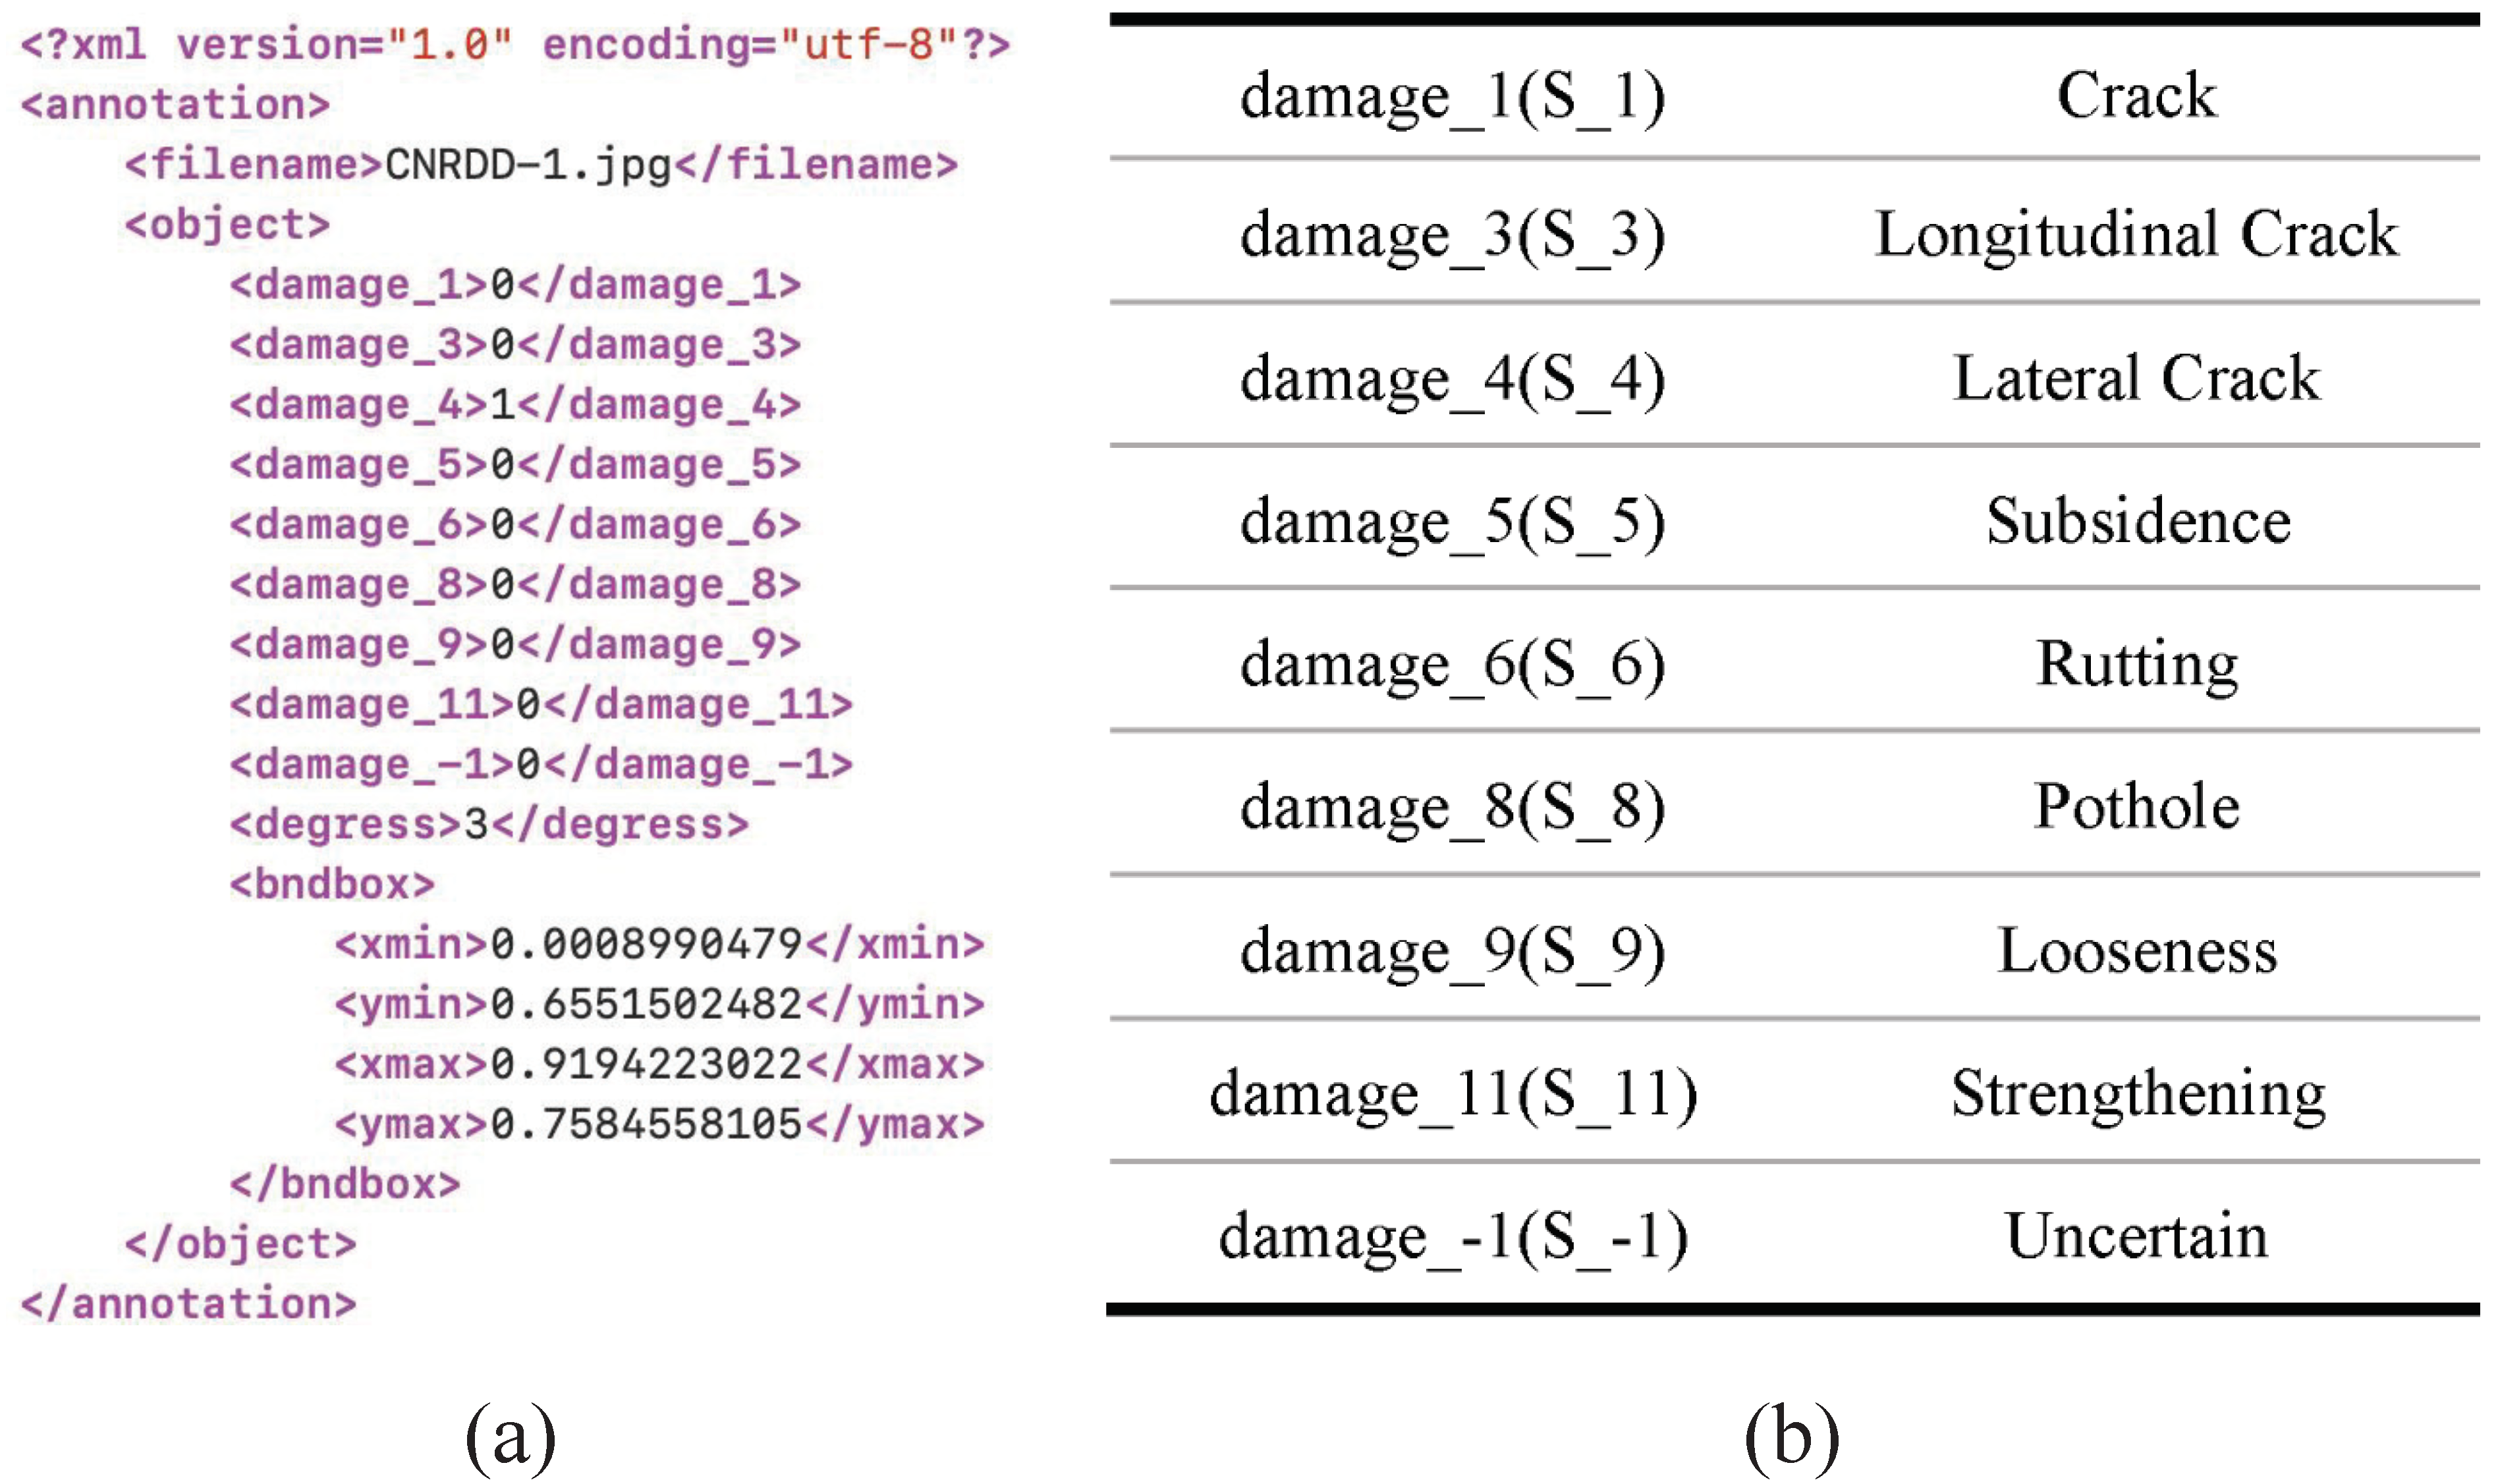
For the above-mentioned road damage, LabelImg software based on Python is used for strict annotation. The personnel responsible for labeling have received professional training and can scientifically distinguish road damage. While the damage classification and bounding box are labeled, the degree of each damage is also finely classified (excluding strengthening). The annotation information of each image is saved in XML format, and the corresponding relationship between the classification code and the damage name is shown in
Figure 3.
As shown in
Figure 3, the image name, damage type and bounding box position are provided in XML files. The ‘degress’ means the severity of damage: 1, 2 and 3 correspond to mild, moderate and severe, respectively. Moreover, 113 uncertain types of damage annotation are included in the CNRDD dataset, which facilitates users to exploit data flexibly. The CNRDD dataset provides 21,552 labels for 4319 images, including 3022 images in the training set and 1273 images in the test set, and 24 images do not contain any road damage. Detailed damage annotation statistics are displayed in
Table 1.
As shown in
Table 1, the training set contains 15,085 annotations and the test set contains 6467 annotations. Both of them cover eight types of damage. However, the total number of four types of damage is less than 1000, which forms an obvious data imbalance with the other types of damage with mass annotations. In the training process, data augmentation may be considered to alleviate the negative impact of data imbalance on model generalization.
3.2. Evaluation Measures
The evaluation system of the CNRDD dataset is the same as other detection datasets. Precision, Recall, mAP@0.5, and F1-Score are used as evaluation indicators. Precision refers to the number of correct prediction results divided by the total number of predictions. It is related to true positives (TP) and false positives (FP) and is defined in Equation (
1). Recall indicates the correctly predicted proportion in all annotation samples, which is related to true positives (TP) and false negatives (FN). It can be calculated by Equation (
2).
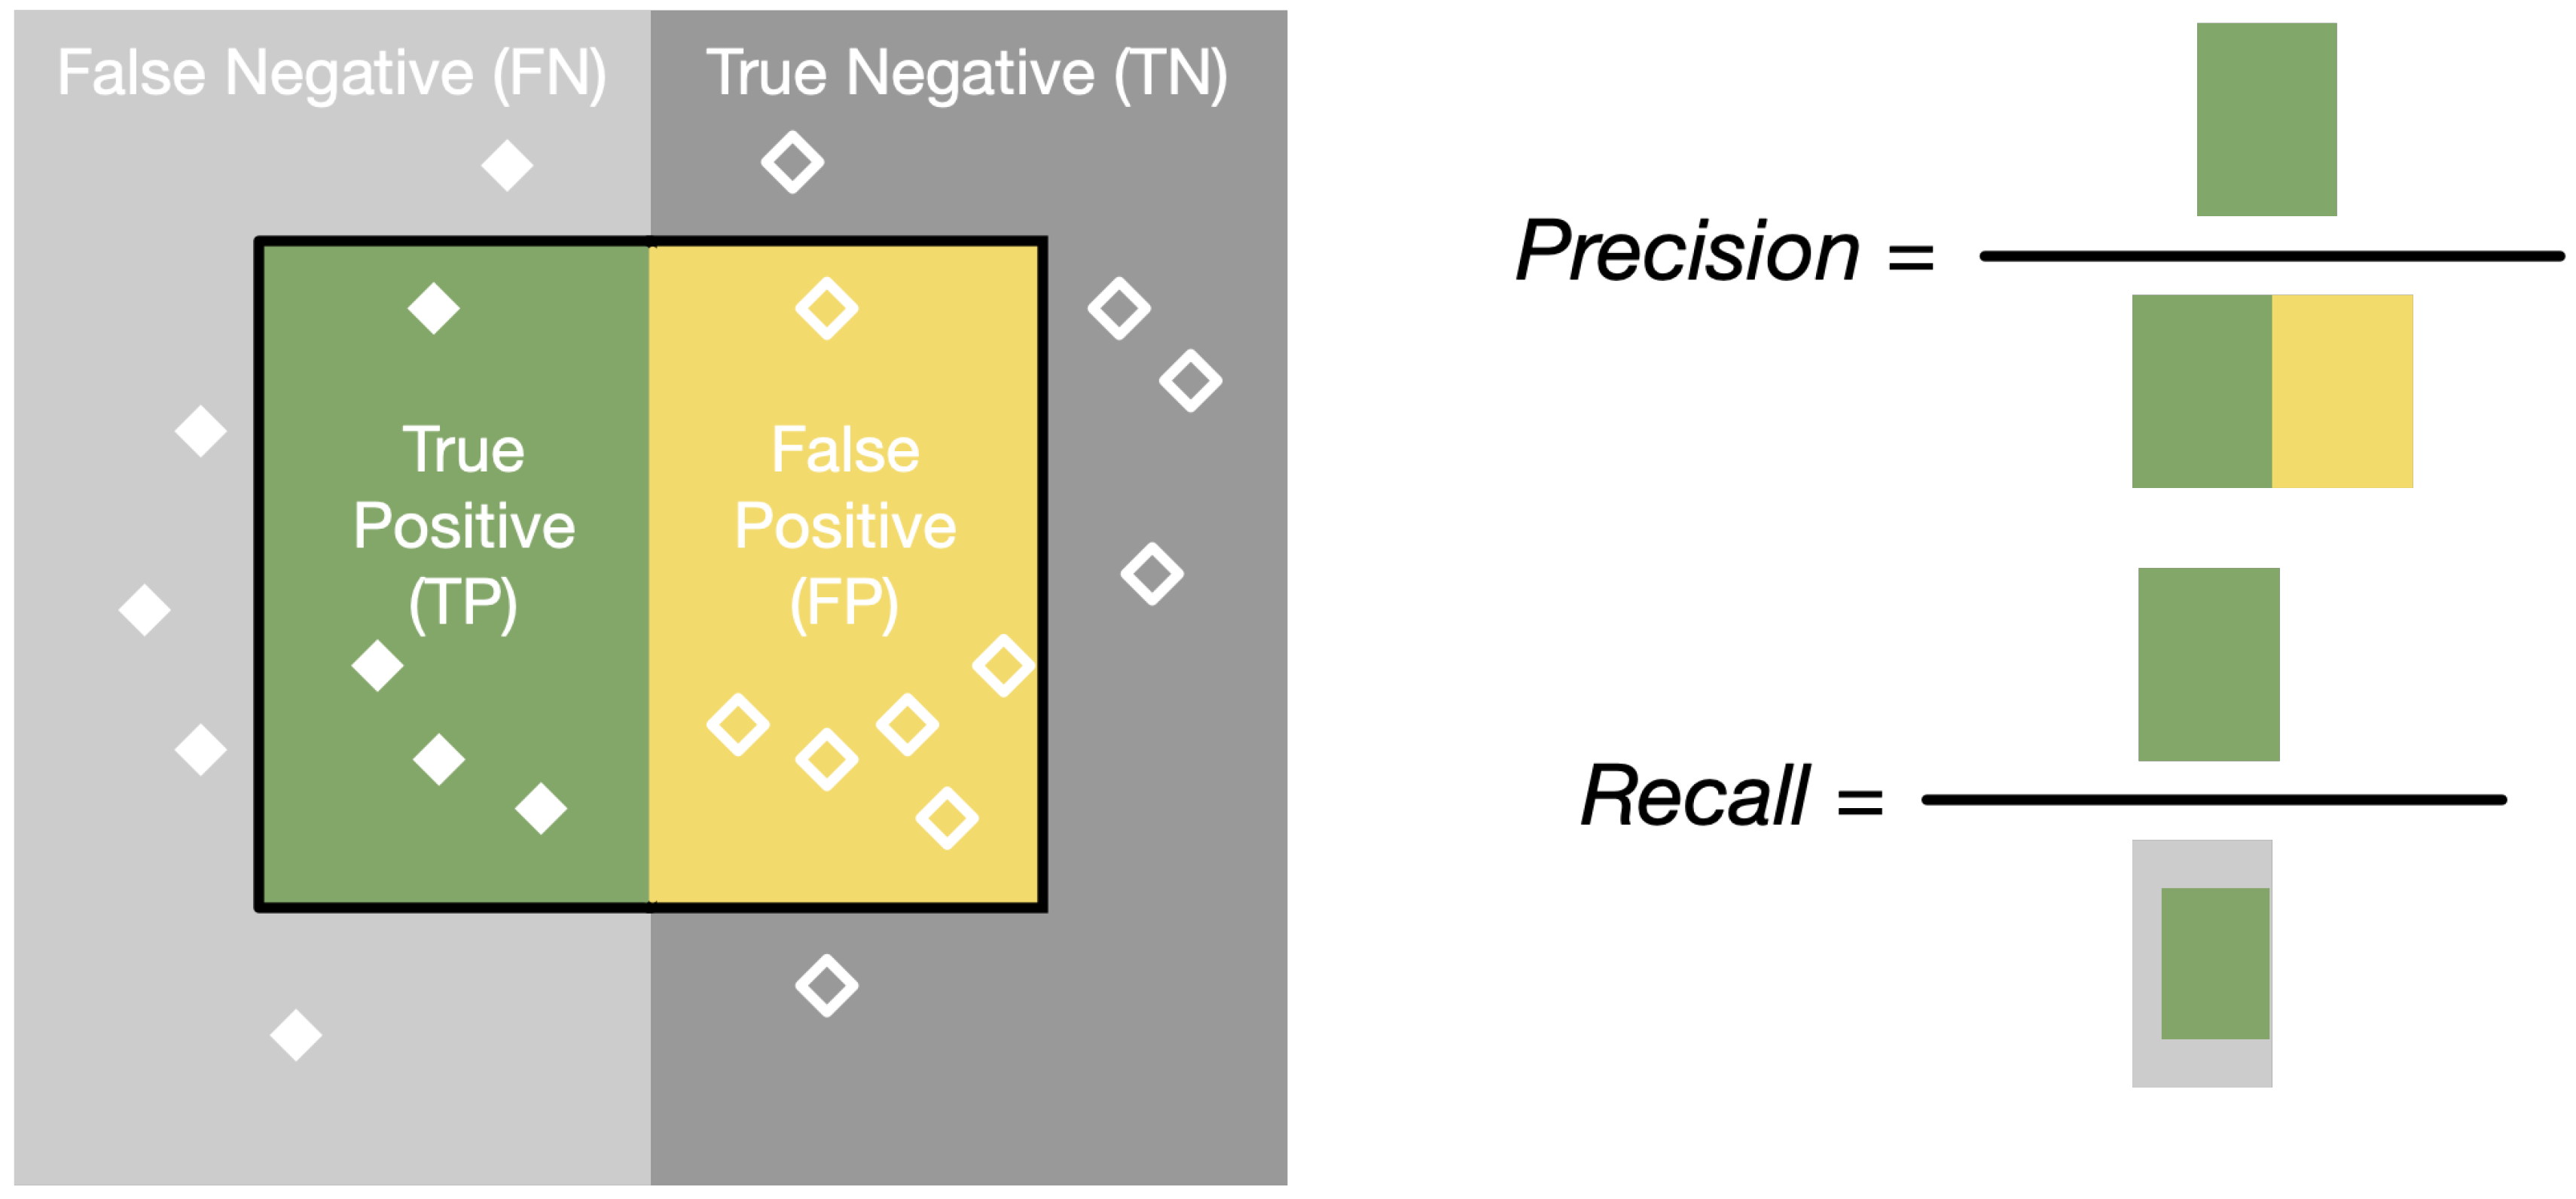
where TP, FN and FP are related to Intersection over Union (IoU). Between the predicted box and the ground-truth (GT) box, IoU calculates the quotient of the overlap area and the union area. When the IoU between the predicted bounding box and GT exceeds 0.5, the predicted instance is considered as a TP. When a predicted box has less than 0.5 IoU overlap with the GT, it is categorized as a FP. In addition, if the predicted result is not in GT at all or the predicted damage label is different from the GT label, the result is counted as an FP. FN indicates the number of road damage instances that the model fails to predict or mispredicts. According to these rules, Precision and Recall can be calculated by Equations (
1) and (
2), respectively. This concept can be better explained by
Figure 4.
In
Figure 4, each solid white diamond represents a positive sample, each hollow white diamond represents a negative sample, and diamonds in the black solid line represent the instances predicted as positive samples by the model. As shown in
Figure 4, TP (green area) represents the positive samples predicted as positive samples, FP (yellow area) represents the negative samples predicted as positive samples, and FN (light grey area) represents the positive samples predicted as negative samples.
However, Recall and Precision calculated according to Equations (
1) and (
2) are in a relationship based on ebb and flow. When Recall is improved, Precision is bound to decrease. In order to better evaluate the model performance on the CNRDD dataset, the F1-Score, defined in Equation (
3), and the mAP@0.5 need be introduced.
In Equation (
3), F
1 refers to the F1-Score. It is the harmonic average of Precision and Recall and can represent the average accuracy of a network to detect road damage. The goal of training networks is to maximize the F1-Score and obtain the optimal balance between Precision and Recall. The mAP@0.5 represents the mean average precision when the IoU is set to 0.5. In a Precision–Recall Curve (PRC) where Recall is the abscissa and Precision is the ordinate, the area under the PRC is recorded as the AP@0.5. The mean of all categories of the AP@0.5 is the mAP@0.5. It can measure the detection performance of the network for different types of road damage.
4. Our Proposed Baseline with Attention Learning
In the labeling process of the CNRDD dataset, it was found that road damage detection is far more difficult than conventional object detection. The main reason behind this is that the damage foreground pixels are sparse, and the proportion of pixels in the corresponding bounding box is also relatively low. While other example objects (e.g., animals or buildings) have abundant and dense pixel areas in the bounding box. This leads to strong similarity between different types of damage marked with bounding boxes. If the bounding box is changed to pixel-level annotation and the detection is transformed into a segmentation task, this problem can be alleviated. This is bound to increase labor and time costs, and does not promote the development of road damage classification. Therefore, we still maintain bounding box annotation on the published CNRDD dataset and propose a damage detection method based on attention learning. Its outline is shown in
Figure 5.
As shown in
Figure 5, the method takes raw images as input and realizes the prediction of road damage through an attention fusion module and a salient feature learning module. The attention fusion module exploits edge detection to achieve the location cues for road damage and then guides the network to pay attention to the salient area through multiplication from a self-attention mechanism. The salient feature learning module introduces attention normalization for spatial pyramid pooling. It not only strengthens the learning of salient features but also suppresses the weight of insignificant features. It is helpful to alleviate the interference of pixel dispersion and approximate appearance on road damage detection. In the following subsections, each component of the proposed method will be introduced in detail.
4.1. Attention Fusion Based on Edge Detection
Many existing algorithms have achieved success in pedestrian detection, remote sensing detection and other tasks. However, when they are directly applied to road damage detection, they all lose their excellent performance. The main reason lies in the sparse distribution of damage in foreground pixels. To solve this problem, along with adjusting the anchor generation strategy, we also need to correctly guide damage positions. Therefore, we rethought early road damage detection algorithms in this paper. We found that edge detection is the most common idea to detect road damage; it obtains the possible location of damage by analyzing the pixel gradient. It is often disturbed by the noise of pavement diversity and thus has a large rate of false detection. However, if it is only used to provide position cues, it can still help the observer quickly locate the salient damage area. Therefore, we designed an attention fusion module based on edge detection.
As shown in
Figure 5, our method consists of an edge branch and an RGB branch. The inputs of the edge branch come from the classical Canny edge detector, which has the advantages of efficiency and coverage [
32]. Considering that wide-view images contain a large number of trees and buildings, which will introduce many edges independent of the damage location, we decided to perform edge detection only on the lower half of each image. An example illustration is shown in
Figure 6.
From
Figure 6b,c, it can be seen that extracted edge information is more related to the damage location without the interference of other objects around the road. However, we also observe that edge detection of half images is a single-channel gray image with sparse effective pixels. In order to make it play a better role in attention guidance for feature learning, it is necessary to expand the range of the receptive field. Therefore, we used dilated convolution to design the DC block in
Figure 5, which can learn the attention map of damage location according to edge detection.
This DC block takes three same edge detections as inputs. For any input, edge feature
will be extracted after two groups of dilated convolutions with a dilation rate of 2. After a softmax calculation,
will become the attention maps that can provide damage location. The corresponding RGB branch consists of standard convolution and encoder blocks. This takes the split RGB channel graph as inputs and can achieve a feature map
as large as
. In order to enable
to generate spatial attention guidance to
, they are fused through the calculation defined in Equation (
4).
where
indicates the feature map of edge detection, and
represents the feature map of the RGB image.
Softmax() refers to the calculation that can activate the attention of the feature map. After the fusion operation defined in Equation (
4), the potential location information of damage in edge detection will enter the next module with fusion feature
and will play a role in salient feature learning.
4.2. Salient Feature Learning with NAM
According to the observation of road damage, we find that the difficulty in damage detection lies not only in the sparse distribution of key foreground pixels, but also in the fact that the bounding box contains much approximately healthy pavement. The designed attention fusion module based on edge detection may alleviate the first problem. In order to further improve road damage detection by alleviating the second problem, the network has to ignore most of the insignificant approximate features. Therefore, we directly introduced the normalization-based attention module (NAM) [
33] into salient feature learning. It can exploit the contributing factors of weights to inhibit the learning of unnecessary feature weights. This can be regarded as a normalization process, and the calculation is defined in Equation (
5).
where
denotes the scaling factor from BN, and the calculated
W means the channel attention weight. It reflects the importance of different channels. If
refers to a pixel normalized scaling factor,
W calculated in Equation (
5) is the spatial attention weight. It represents the influence of different pixels. These two weights will help NAM suppress the weights of unnecessary features. The introduction location of NAM and the design details of the complete network are summarized in
Table 2.
In
Table 2, ‘AF’ is the attention fusion module, and ’SFL’ stands for salient feature learning module. ’C’ denotes the number of channels, ’K’ represents the convolutional kernel size, ’S’ means the step, and ’D’ refers to the dilation rate. C3 represents the double branch block. The feature maps from two branches of C3 are fused by concat. SPPF is the fast version of Spatial Pyramid Pooling. The Neck structure is consistent with that in YOLO v5 [
15], and the connection with the front network is shown in
Figure 5. NAM is added between SPPF and the Neck block. In this key position of forward propagation, NAM can better integrate spatial attention and channel attention. In this way, the proposed network can improve the discrimination of damage features by strengthening the learning of salient features and restraining the weight of non-salient features.
4.3. Two-Stage Training
Attention fusion and salient feature learning constitute the proposed network framework. In order to give full play to the feature learning ability of this network, we design a two-stage training strategy based on experience. Firstly, the training set with coarse classification labels is used to train the network, which can help the sparse features of road damage to achieve similarity aggregation. Then, we take the obtained network parameters as the pre-training model and fine-tuned the proposed network with fine-grained classification labels. This strengthens the discrimination of features in detail.
For the CNRDD dataset, only the eight kinds of damage labels are utilized in coarse training, and degree classification is not considered in the process. Fine-grained fine-tuning regards the same types of damage with different degrees as different categories so as to increase the distance between classes. For the RDD2020 dataset, it only provides four kinds of damage labels without degree annotations. In the first stage, therefore, two classification training steps are conducted on the RDD2020 dataset. The first only determines whether there is damage and detects the damage location. In the second stage, the original labels provided by the dataset are used for fine-tuning. This is helpful to strengthen the classification ability of the proposed network for road damage with approximate appearance. The implementation details of training and fine-tuning are displayed in
Table 3.
As demonstrated in
Table 3, the Canny edge detector sets the double thresholds to 30 and 170, respectively. The batchsize of the training and fine-tuning sets is 25. Coarse training is performed over 420 epochs. In fine-tuning, the dataset is trained over 100 epochs. Moreover, the parameter initialization of the 2D Encoder in the Neck block will not copy from the pre-training model obtained through the first stage of training. In the two-stage training process from coarse to fine, the initial learning rate is reduced from 0.01 to 0.005.
6. Conclusions and Discussion
Road damage detection is very important for road maintenance. At this stage, all practical road damage detection solutions depend on expensive equipment with multiple sensors. However, many underdeveloped areas cannot find pavement problems in time because they cannot afford high-priced equipment. This leads to missing the best repair time for road damage. With the success of deep learning in multiple vision tasks, road damage detection based on deep learning brings hope of moving away from the dependence on expensive equipment.
In order to introduce deep learning to ADRD, this paper first presents a road damage detection dataset from China, called the CNRDD. It contains 4319 images with 21,552 professional annotations. The image size is 1600 × 1200 pixels. According to evaluation standard for highway technical conditions (JTG5210-2018), road damage is divided into eight categories. In addition to strengthening, each category also contains three degree labels. Compared with existing datasets, the CNRDD dataset is more challenging and practical. In order to further promote the development of ADRD, this paper also proposes a road detection framework based on attention learning. It utilizes edge detection and attention fusion to provide the salient region for feature learning, and then introduces NAM to suppress the weights of non-salient features. Thus, the influence of sparse damage-pixel distribution and similar appearance between types of damage on detection is effectively alleviated. After two-stage training, the performance of the proposed method is further improved on the RDD2020 and CNRDD datasets. The proposed method sheds light on road damage detection based on attention learning. Nevertheless, according to the experimental analysis described in
Section 5, road damage detection based on deep learning remains challenging. It still needs more researchers to work together to solve. Therefore, this paper discusses future expandable work from the following three aspects.
- (1)
Standardized datasets. The quantity of existing road damage detection data greatly limits the development of ADRD, which is also the main reason for publishing the CNRDD dataset in this paper. However, a CNRDD dataset is not enough to change the research status. Researchers may make further efforts to achieve breakthroughs in the quantity of data with annotations. Then, standardization of road datasets is gradually formed from the perspective of annotation specification and classification basis. This not only helps to improve the performance of road damage detection algorithms, but also provides support for unified access to future intelligent road maintenance systems.
- (2)
Optimized similarity measurement. A large number of approximate appearances is another main reason why road damage is difficult to be detected correctly. To solve this problem, researchers should not only improve the discrimination of salient features through attention learning, but also optimize the similarity measurement of feature vectors. Aspects such as feature alignment and fine-grained classification strengthen the recognition and location of road damage so as to alleviate false detection and missing detection.
- (3)
Conditional transfer learning. Although transfer learning is an effective strategy to improve the generalization ability of algorithms, it needs to be based on the premise that the algorithm is excellent in a single data domain. Like the current road damage detection algorithm based on deep learning, the learned features cannot meet the actual needs in the specified domain. On this basis, a cross-domain bridge established by transfer learning is meaningless to the extraction of road damage features. Therefore, supervised road damage detection needs to be developed first. When the conditions are ripe, conditional transfer learning for different acquisition equipment (intelligent phone or 3D camera), climates and road segments is encouraged to promote the application of ADRD in practical scenarios.
Researchers may try to promote the development of road damage detection using the above-mentioned three aspects. Of course, we are also willing to continuously update the CNRDD dataset to provide some data support for ADRD.


 ,
, 


