1. Introduction
Arrhythmias are abnormal electric signals of the heart leading to irregular heart rhythms. It happens for different reasons, such as changes to the heart tissue, stress, imbalance in the blood, i.e., excess or deficiency of electrolytes or hormones, side effect of medications, chronic diseases, or problems with the electrical system of the heart [
1]. In order to make a diagnosis about a patient’s cardiac health, cardiologists must first gather information regarding the individual’s medical history by performing a series of blood and physical tests. The most commonly used non-invasive exam is Electrocardiography (ECG), which records the heart’s electrical activity from which important parameters are extracted to assess the patient’s overall cardiac health [
1,
2]. The characteristics of an ECG signal should be considered, including heart rate, pulse origin, pathway, and propagation velocity. For instance, if an electrical impulse does not propagate through the heart’s normal conduction pathway, the ECG’s original morphology can be significantly distorted, leading to arrhythmia [
3]. Some cardiac-related pathologies can be detected from short-term data acquisition in the hospital. In contrast, others require long-term monitoring through medical devices such as the Holter monitor and, more recently, wearables, resulting in large amounts of data that must be analyzed and processed.
Automatic ECG Signal analysis systems have a crucial role in assisting healthcare professionals by providing real-time alarms for immediate treatment in intensive care units (ICUs) and improving people’s quality of life through the early detection of abnormal patterns [
2]. The system is based on signal processing and artificial intelligence algorithms. Artificial Intelligence is an extensive field segmented into multiple divisions, one of them being Machine Learning (ML), which has a sub-vision called Deep Learning (DL). Both divisions are broad and have experienced increasing popularity both in and outside the medical field over the last years [
2,
4]. As the access to more processing resources has increased over the recent decades, the number of studies and development of ML algorithms for cardiac arrhythmia classification tasks have grown. Nowadays, studies of Deep Learning algorithms show high accuracy rates in arrhythmia detection compared to the level of cardiologists [
5]. The success of arrhythmia classification tasks with Machine Learning (ML) algorithms is based on the handcrafted extraction of features from Electrocardiography (ECG) signals [
2]. The feature engineering process requires prior knowledge of the ECG processing techniques and an understanding of ECG signal interpretation. On the other hand, Deep Neural Networks (DNN) bypass the process of handcrafting feature extraction, as their hidden layers perform the task of extracting and learning specific features from raw ECG signals. It has both advantages and disadvantages; the advantage is that it eliminates the step of handcrafted features [
6]. The disadvantage is that these algorithms are like a black box, and it is complex and abstract, especially in time series, to understand what the learned representations are [
7].
The main purpose of this exploratory study is to evaluate and compare the 1D Convolutional Neural Network (1D-CNN) algorithm and the Support Vector Machine (SVM) classifier for the task of automatic classification of cardiac rhythms; by using a redesigned dataset from an existing public database. Two approaches for the task of arrhythmia classification will be addressed: (1) human-assisted feature extraction approaches based on traditional signal processing techniques; (2) data representation learning and classification based on the 1D-CNN algorithm. As a secondary objective, we will evaluate using two public databases combined under the same characteristics to balance and increase the volume of data. In order to have reliable results, the algorithms will be trained and evaluated with the same dataset.
The paper is organized as follows: In
Section 2, the materials and methodology are explained, covering the characterization of databases, the feature extraction process, classifiers, and the validation setup.
Section 3 contains the obtained results.
Section 4 contains the discussion, and finally,
Section 5 is the conclusion.
1.1. Public ECG Databases Review
The PhysioNet Computing in Cardiology Challenge 2017 (cinc17) [
8,
9] and the Telehealth Network of Minas Gerais (TNMG) [
10] are among the most popular databases for heart rhythm classification.
Table 1 highlights both databases, which differ in terms of the number of records, data acquisition (i.e., sampling frequency), condition, and annotated pathologies.
The PhysioNet/Computing in Cardiology Challenge 2017 (cinc17) database from [
8,
9] is a very popular database in studies where Deep Learning algorithms are implemented. The PhysioNet challenge presented the database focused on Atrial Fibrillation (AF) detection by differentiating the AF from noise, normal, or other rhythms. The database was recorded with the AliveCor device with a sampling frequency of 300 Hz and filtered with a band-pass filter. It contains 8528 single-lead ECG recordings from individual patients with a time length from 9 s to just over 60 s. It was evaluated and annotated by several cardiologist experts.
The Telehealth Network of Minas Gerais (TNMG) database was designed for use in a comprehensive study on the classification performance of a Deep Neural model. The complete database is composed of 2,322,513 ECG records from 1,676,384 different patients. Only the test dataset is available to the public, and it contains 827 12-lead ECG records with a sampling frequency of 400 Hz from different patients and is annotated by three different cardiologists. The database contains six different ECG annotations: 1st degree AV block (1dAVb), Left Bundle Branch Block (LBBB), Right Bundle Branch Block (RBBB), and sinus bradycardia (SB), AF, and sinus tachycardia (ST).
1.2. Literature Review
The following is a literature review of Machine Learning algorithms for the task of cardiac arrhythmia feature extraction and classification. ECG classification research can be divided into either heartbeat [
11,
12,
13] or arrhythmia [
5,
10,
12]. The most common algorithms included in studies are Support Vector Machine (SVM) [
11,
12,
13,
14], ANN [
12], and CNN [
10,
14,
15,
16]. Large public databases of annotated ECG signals play a fundamental role in developing algorithms for automatic ECG interpretation and classification, serving as a benchmark for comparing the validation and quantitative evaluation of algorithms from different papers in the scientific community [
2]. The frequent databases used are MIT-BIH [
11,
12,
14,
16], TNMG [
10], and cinc17 [
5,
14,
15,
17].
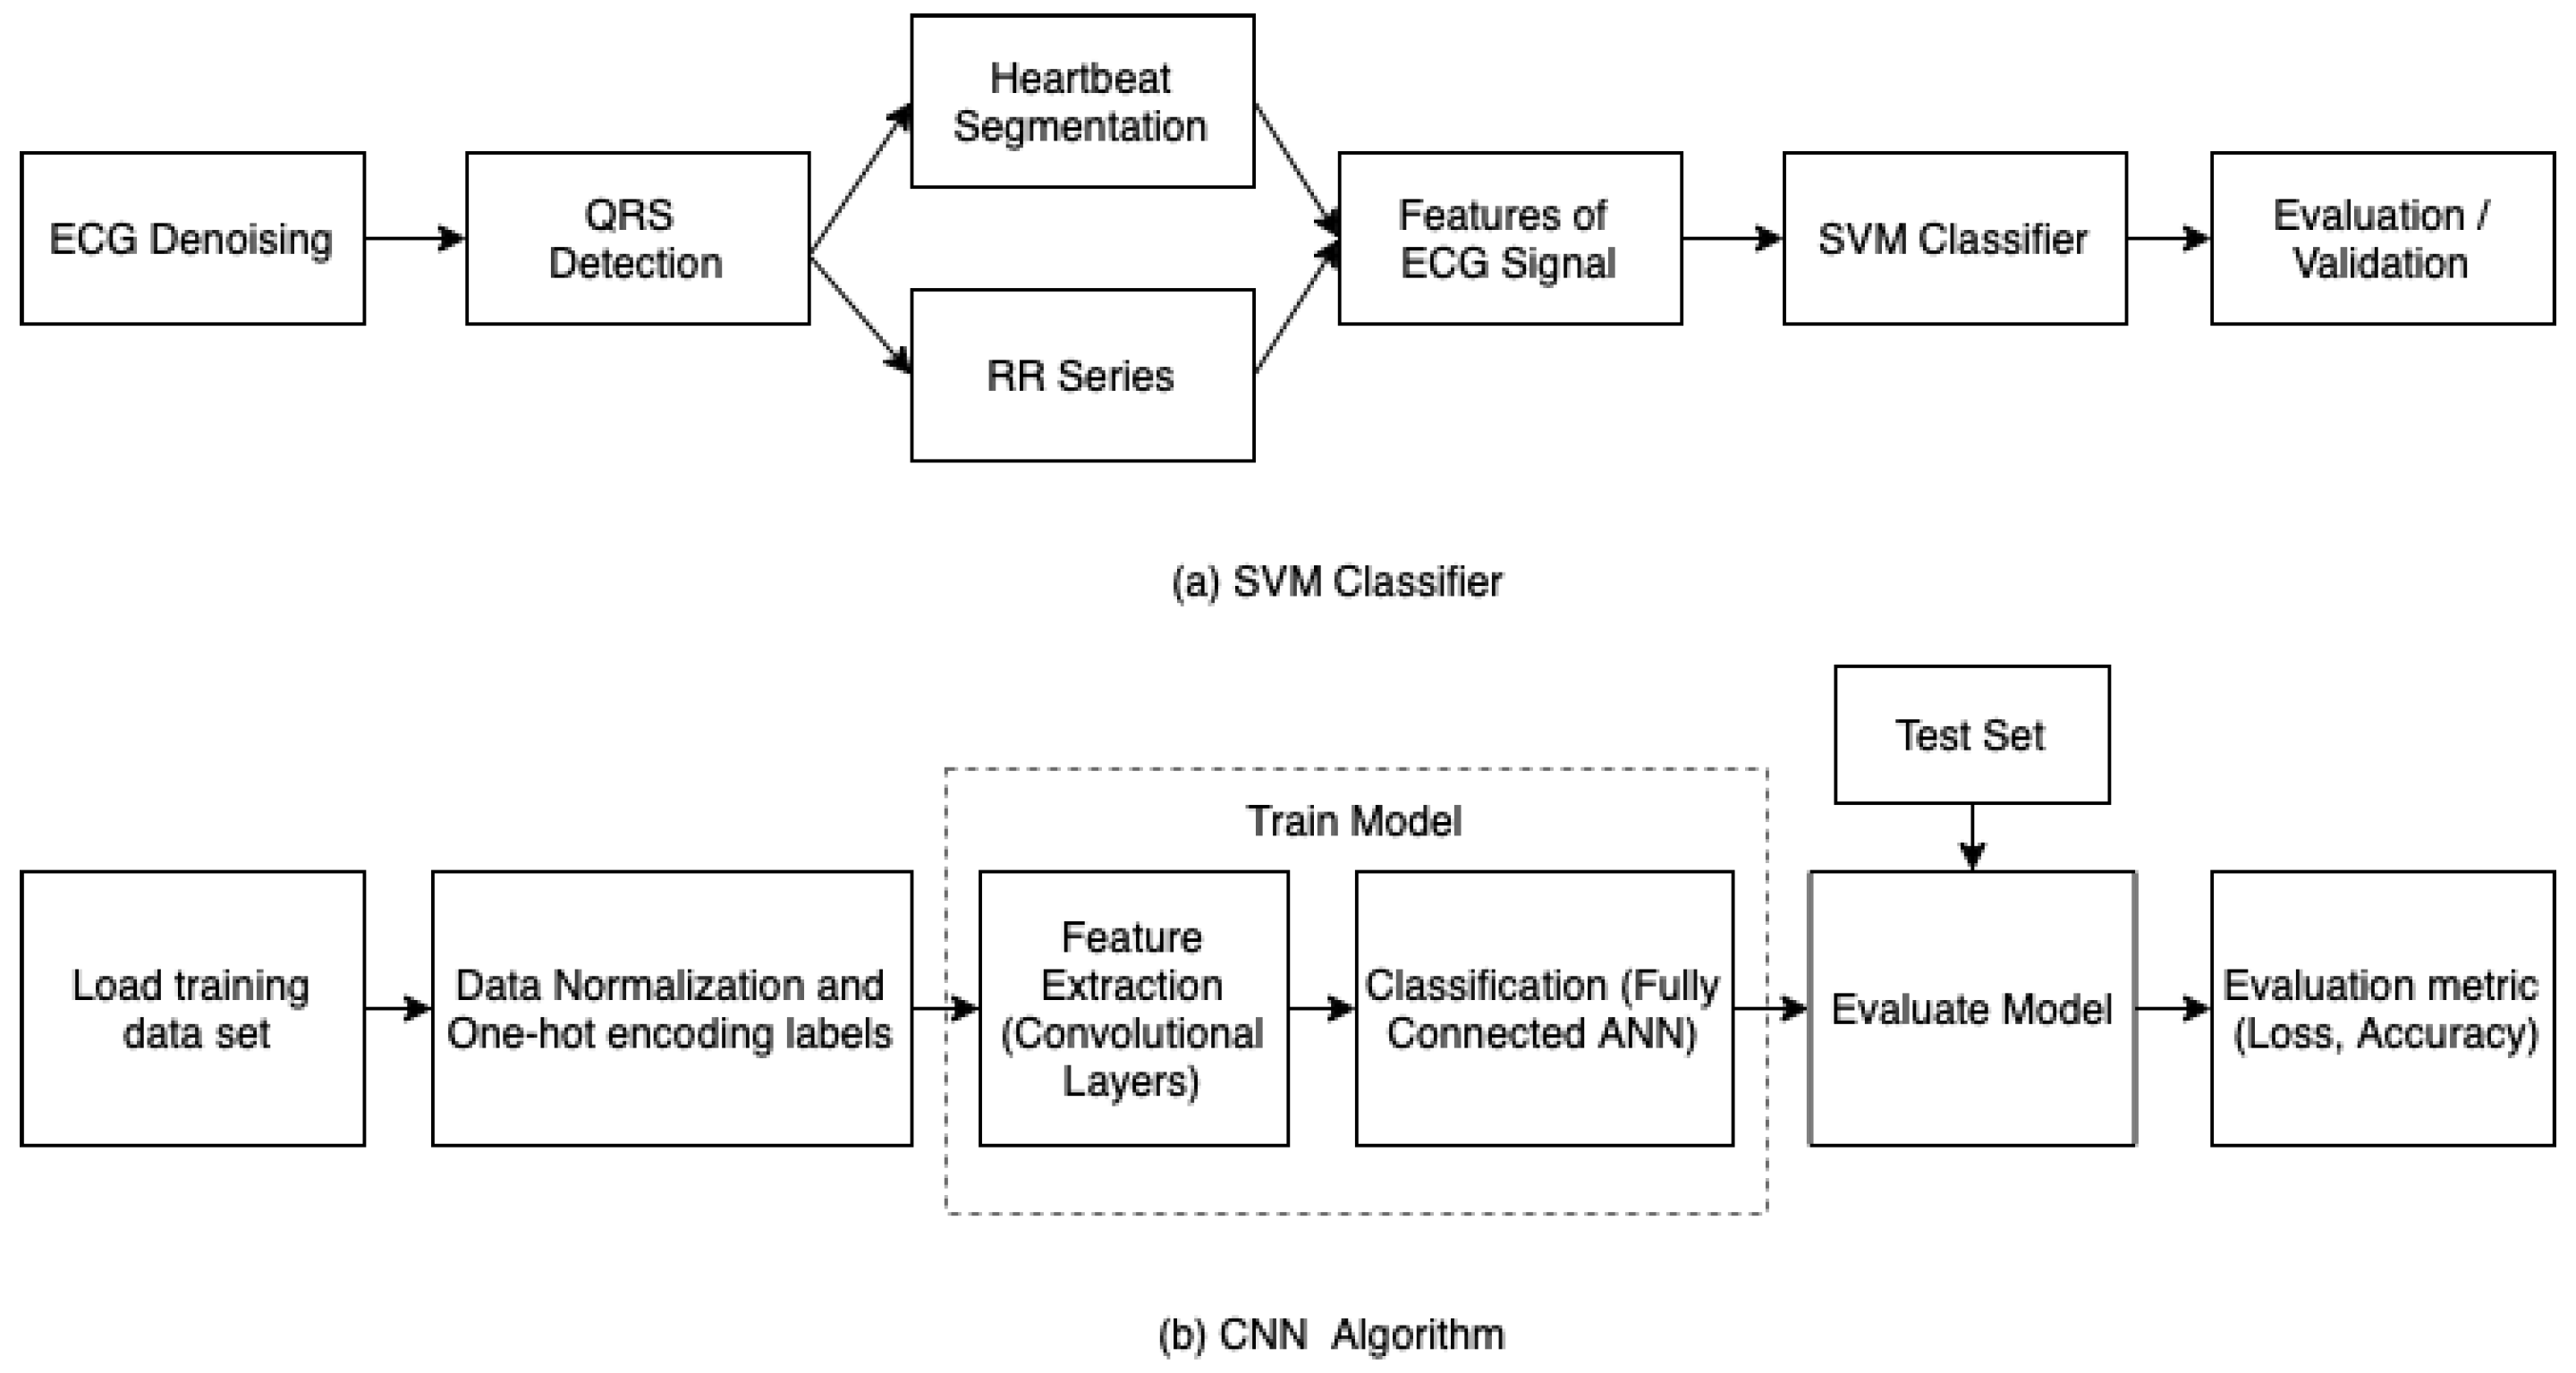
Figure 1 shows the initial workflow of how researchers approached the classification task of ECG signals with SVM and ANN algorithms. The workflow starts with signal filtering and QRS and R-peak detection algorithms methods, followed by feature extraction and simple classification with a classifier or classification fusion methods with multiple classifiers. A broad set of handcrafted features for ECG analysis, such as temporal relationships between waves, morphological descriptors, state-space features, linear transform, spectral representation, wavelet analysis, etc., have been described as well [
11,
12,
18,
19,
20,
21,
22,
23,
24]. Among the temporal features, a wide assortment of QRS morphological descriptors was mentioned, including QRS width, positive and negative peak amplitudes, QRS slopes, and cardiogram vector descriptors. As for spectral feature extractor methods, previous studies mention methods such as Fourier Organisation Analysis, which evaluates the harmonic distribution of the energy of the ECG waveform, high order spectra (HOS), Fourier Transform (FT), and Wavelet Transform (WT) methods (e.g., Short-term Fourier Transform (STFT)). Some approaches with a single feature cannot effectively face the complexity of an ECG signal. Therefore, many researchers resort to combining different feature extraction methods. In addition, understanding the specific characteristics of the pathophysiological conditions studied is advisable. For instance, if Premature Ventricular Contraction (PVC) detection is desired, morphological markers are essential since this arrhythmia occurs prematurely [
2].
Deep learning algorithms rely primarily on data representation learning techniques, meaning the signals do not necessarily need to be pre-processed. A current literature review on the implementation of CNN for the classification of myocardial infarction and arrhythmia has been presented by Rawi et al. (2022) [
25] and Tyagi et al. (2022) [
26]. The literature reviews concluded that CNN algorithms have recently been the most widely used deep learning networks for arrhythmia classification. The ECG signals dataset can be given as a time series or images; with the latter being the most popular. Time-series signals could be used as input, obtaining not only QRS-complex information but also P and T-wave information, thereby obtaining a better representation of the signal [
5,
10,
16,
27]. It does not imply that the raw ECG signal is the sole input of the model. Researchers have evaluated various input variables, such as spectrogram images of the ECG or even a wide variety of features calculated with signal processing methods mentioned previously [
15,
28,
29,
30].
In this paper, the SVM classifier and 1D-CNN will be compared. The 1D-CNN architecture is the model presented by Hannun et al. [
5] for arrhythmia classification. For the task, the CINC17 and TNMG ECG rhythms databases are used for training and validation.
2. Materials and Methods
2.1. ECG Database Characterization
Each of the presented databases is highly unbalanced, i.e., the number of signals or segments containing normal ECG signals is much higher than the number of signals or segments containing abnormal ECG signals. As many ECG recordings are needed, two larger databases, the cinc17 and TNMG, are merged. Since cinc17 and Minas Gerais (TNMG) databases contain cardiac rhythm signals, their merge provides a more balanced dataset and is referred to as the merged dataset. Both datasets were pre-processed to ensure that all signals met the same conditions and characterization. The cinc17 database is based on lead I; lead I of the 12-lead was taken in the TNMG dataset to keep homogeneity between databases’ ECG lead.
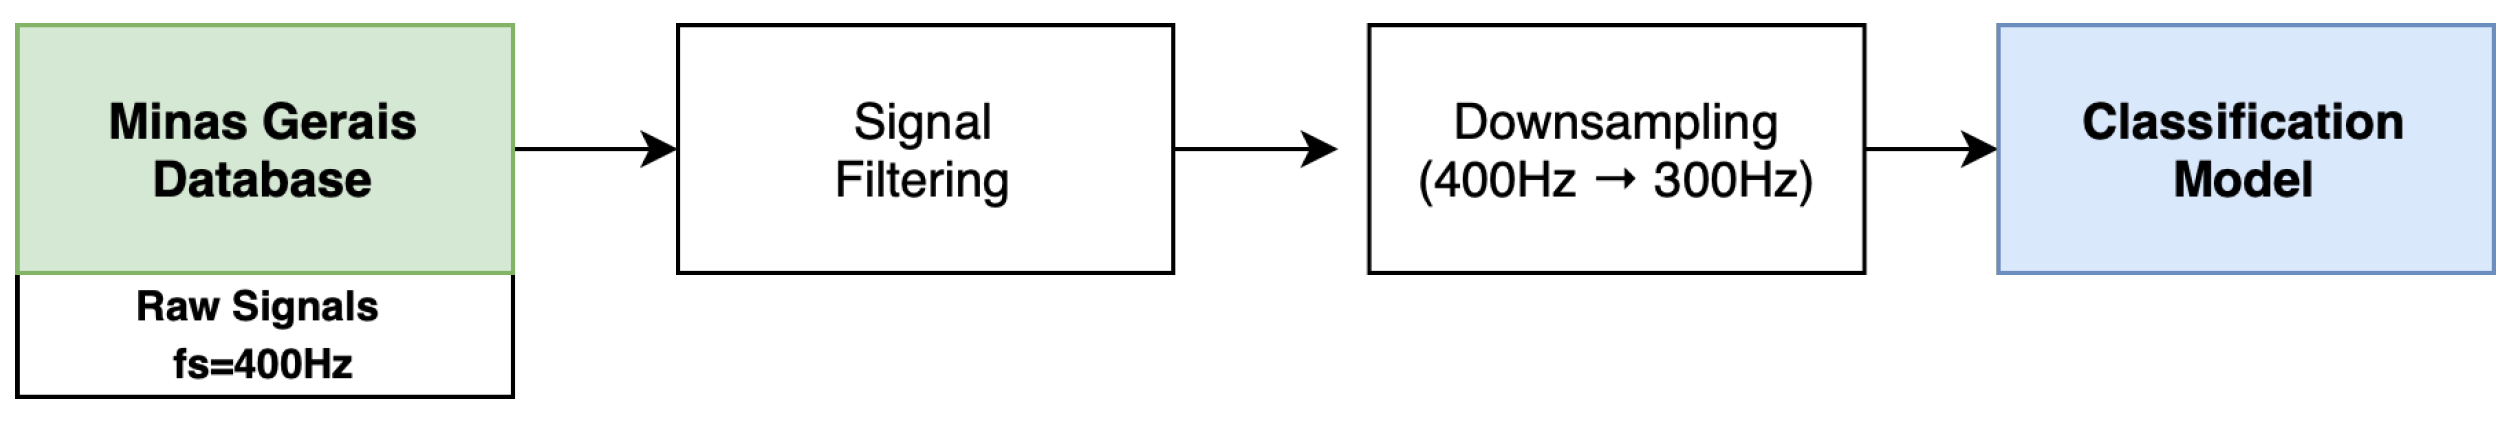
Figure 2 shows the pre-processing steps for the TNMG dataset.
The TNMG database provides raw, unfiltered ECG time series in a three-dimensional format in an HDF5 file. Lead I signals are extracted from each signal record with their respective annotations. Each signal is filtered to remove baseline wandering (e.g., movement artifacts) and down-sampled from the original sampling frequency of 400 Hz to 300 Hz to avoid potential sampling frequency-related bias and aliasing effects. It is important to highlight that the annotations are provided per signal and not per heartbeat. Before merging the signals into a single dataset, the signals were homogenized, i.e., re-sampled to 300 Hz, if needed. The signals from cinc17 were normalized between [−1 and 1] to match the normalized signals of the TNMG database. Atrial Fibrillation, other rhythms, and noise rhythms were taken from the cinc17 database, grouped and labeled as No-Normal Rhythms, together with the arrhythmias of the TNMG database. The final database has a total of 7196 ECG recordings, and the ECG recordings were divided into two groups (categories); 3598 normal (N) rhythms and 3598 other rhythms (O).
2.2. Human-Assisted Feature Extraction Methods
To train an ML classifier, one must first pre-process the ECG signals and then extract features from the signal employing known signal processing methods [
20,
31] based on the time-domain, spectral, morphological, and features, which will be described in the following subsections. Time-domain parameters were extracted based on information related to heart rate characteristics. In contrast, spectral features were extracted using Wavelet Transform (WT), wavelet decomposition, and power spectral density analysis. Morphological and statistical features were evaluated based on the paper by Mondéjar-guerra et al. [
11], where they used Higher-Order Statistics (HOS) and 1-dimensional Local Binary Patterns (LBP). The following presented human-assisted features were extracted from the merged dataset.
2.2.1. Filtering and RR-Interval
The first pre-processing step removes baseline wandering and offsets from the ECG signals. For this, two moving median filters of 200 and 600 ms window sizes are applied to the ECG signal to isolate the baseline signal, which is afterward subtracted from the ECG signal. Following R-Peak detection, the ECG signals segmented were extracted with a window length of 90 samples before and 90 samples, presented in
Figure 3. The R-peak locations and RR-intervals were extracted using the BioSPPy (v.0.7.2)1 Python module [
32]. Eight RR-interval features were also extracted based on Mondéjar-guerra et al. [
11]: (1) Pre-RR: the distance between the actual R-peak and the previous one, (2) Post-RR: distance between the actual R-peak and the next one, (3) Local-RR: average of the ten previous Pre-RR intervals, (4) Global-RR: average of the Pre-RR values produced in the signal and the normalized values from each of the four intervals.
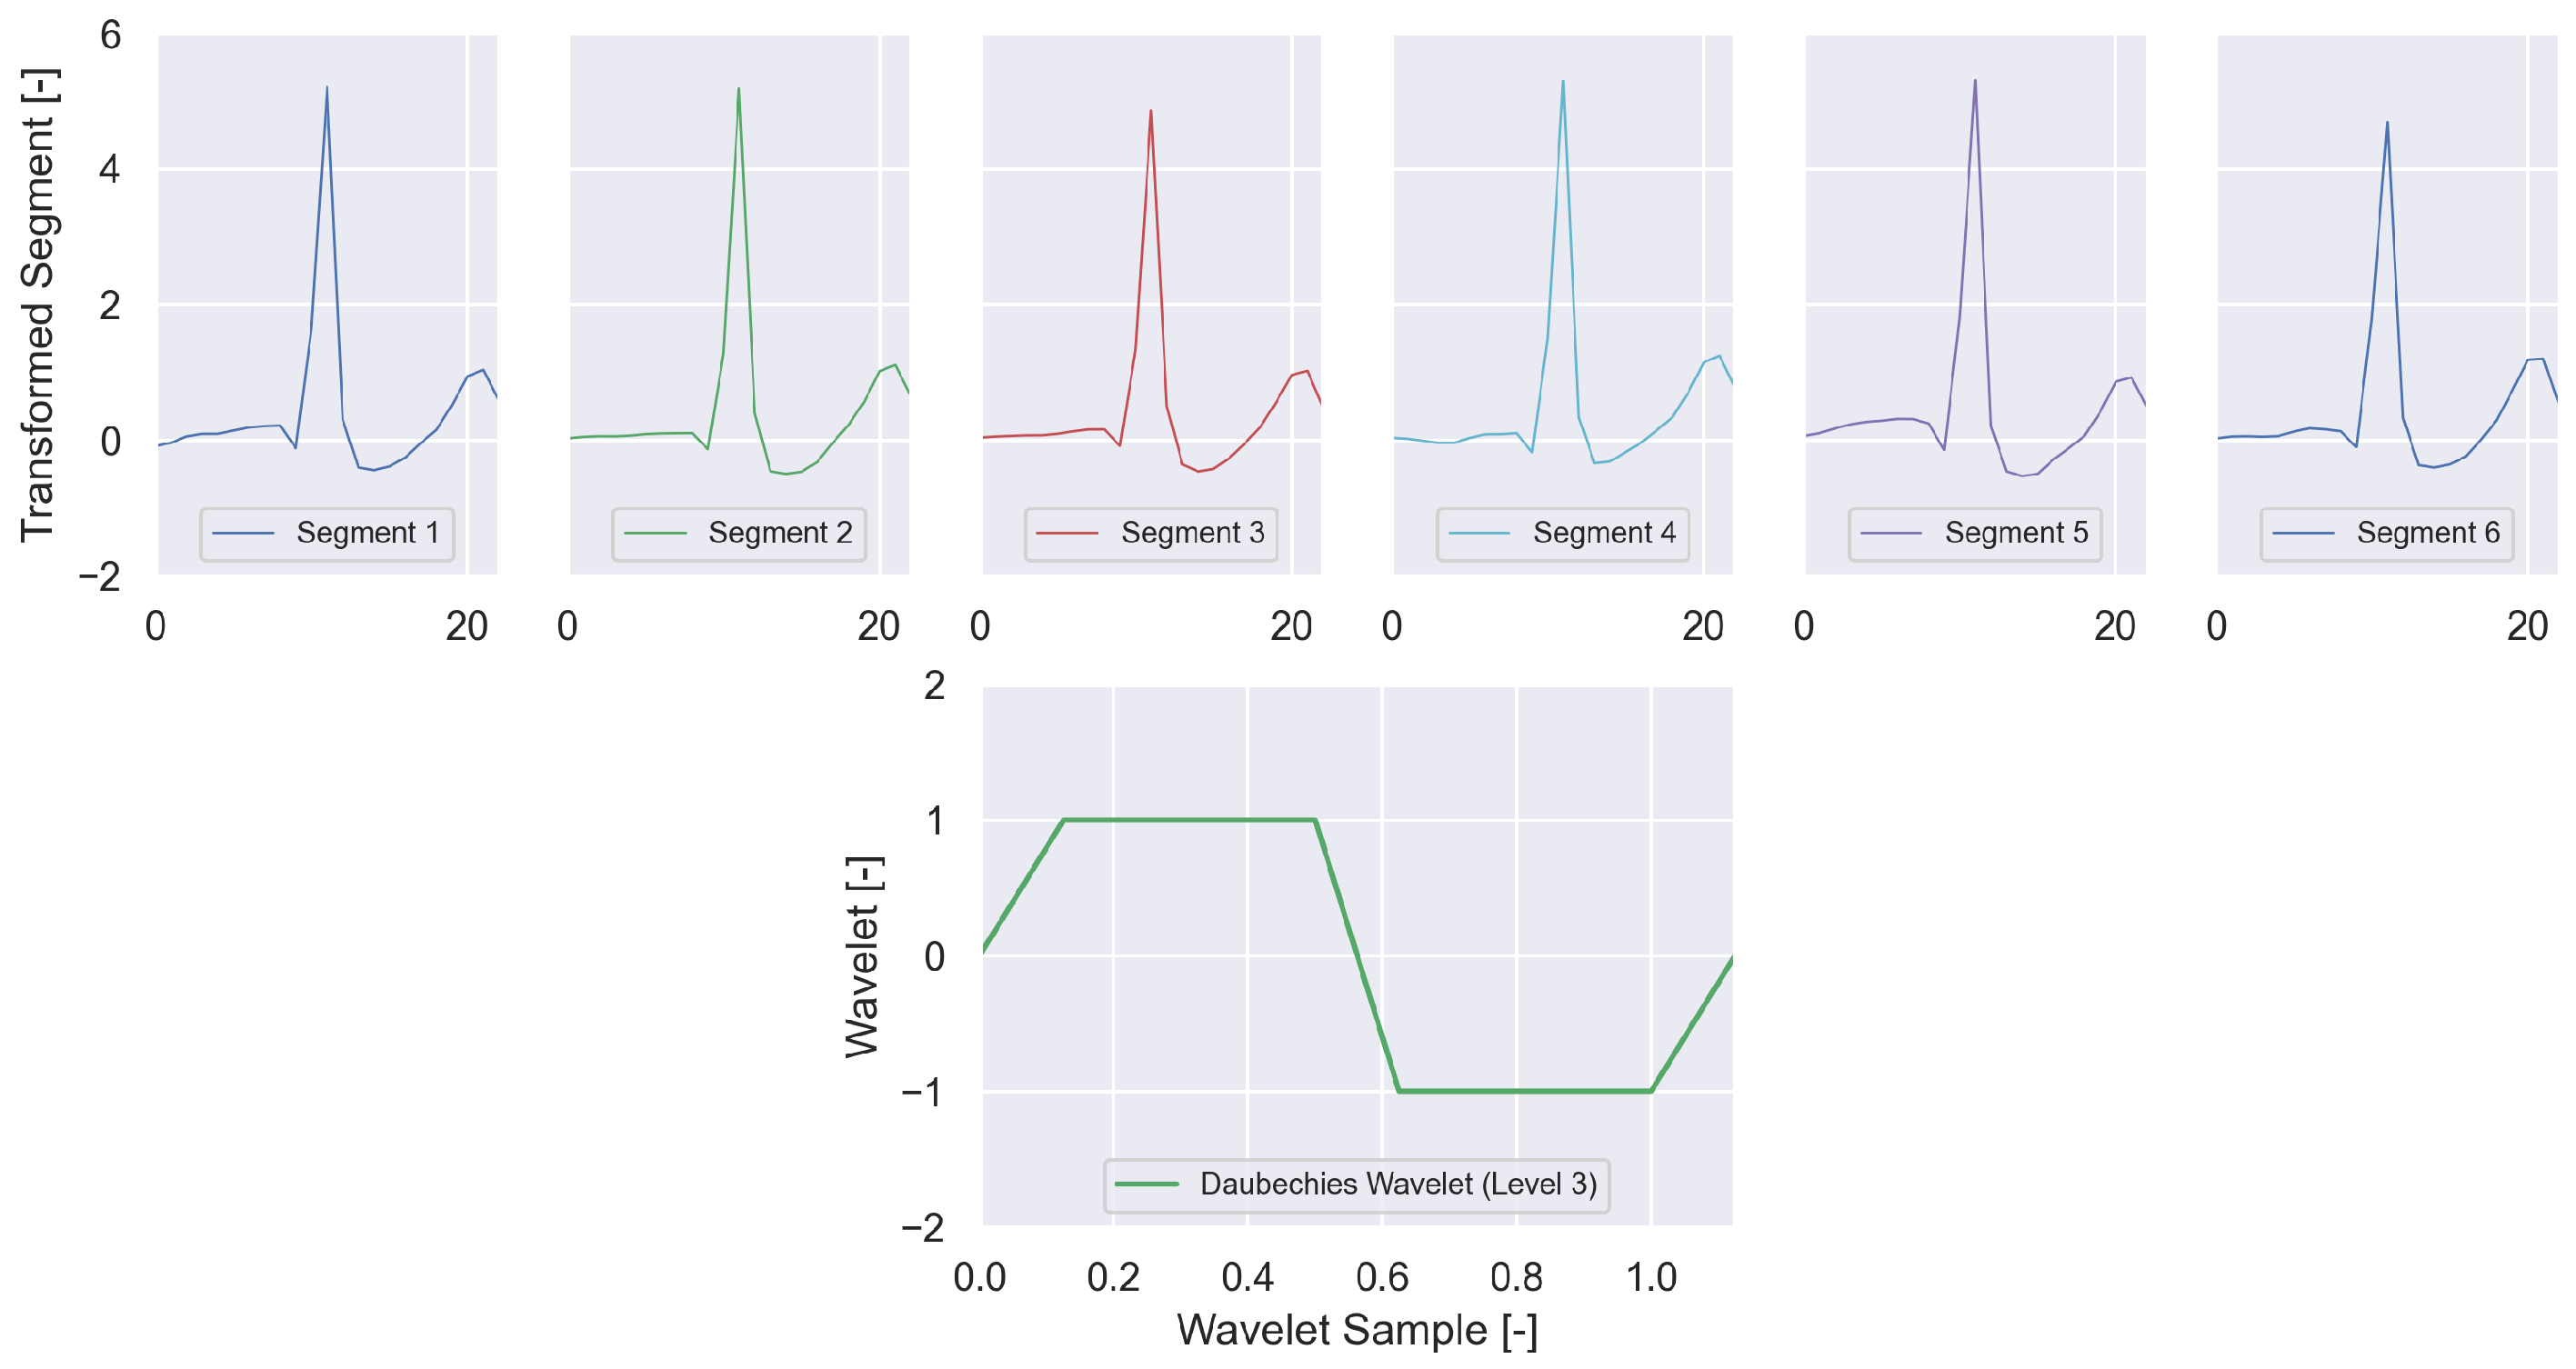
2.2.2. Wavelet Transform (WT)
The wavelet transform method used a Daubechies wavelet function with three decomposition levels. The process of wavelet decomposition generates 23 dimensional features. This process provides a low-resolution representation of the original ECG signal (24 samples vs. 180 samples) that highlights the R-peak characteristics of the ECG segments. The results of the WT feature applied to the sample segments extracted are shown in
Figure 3.
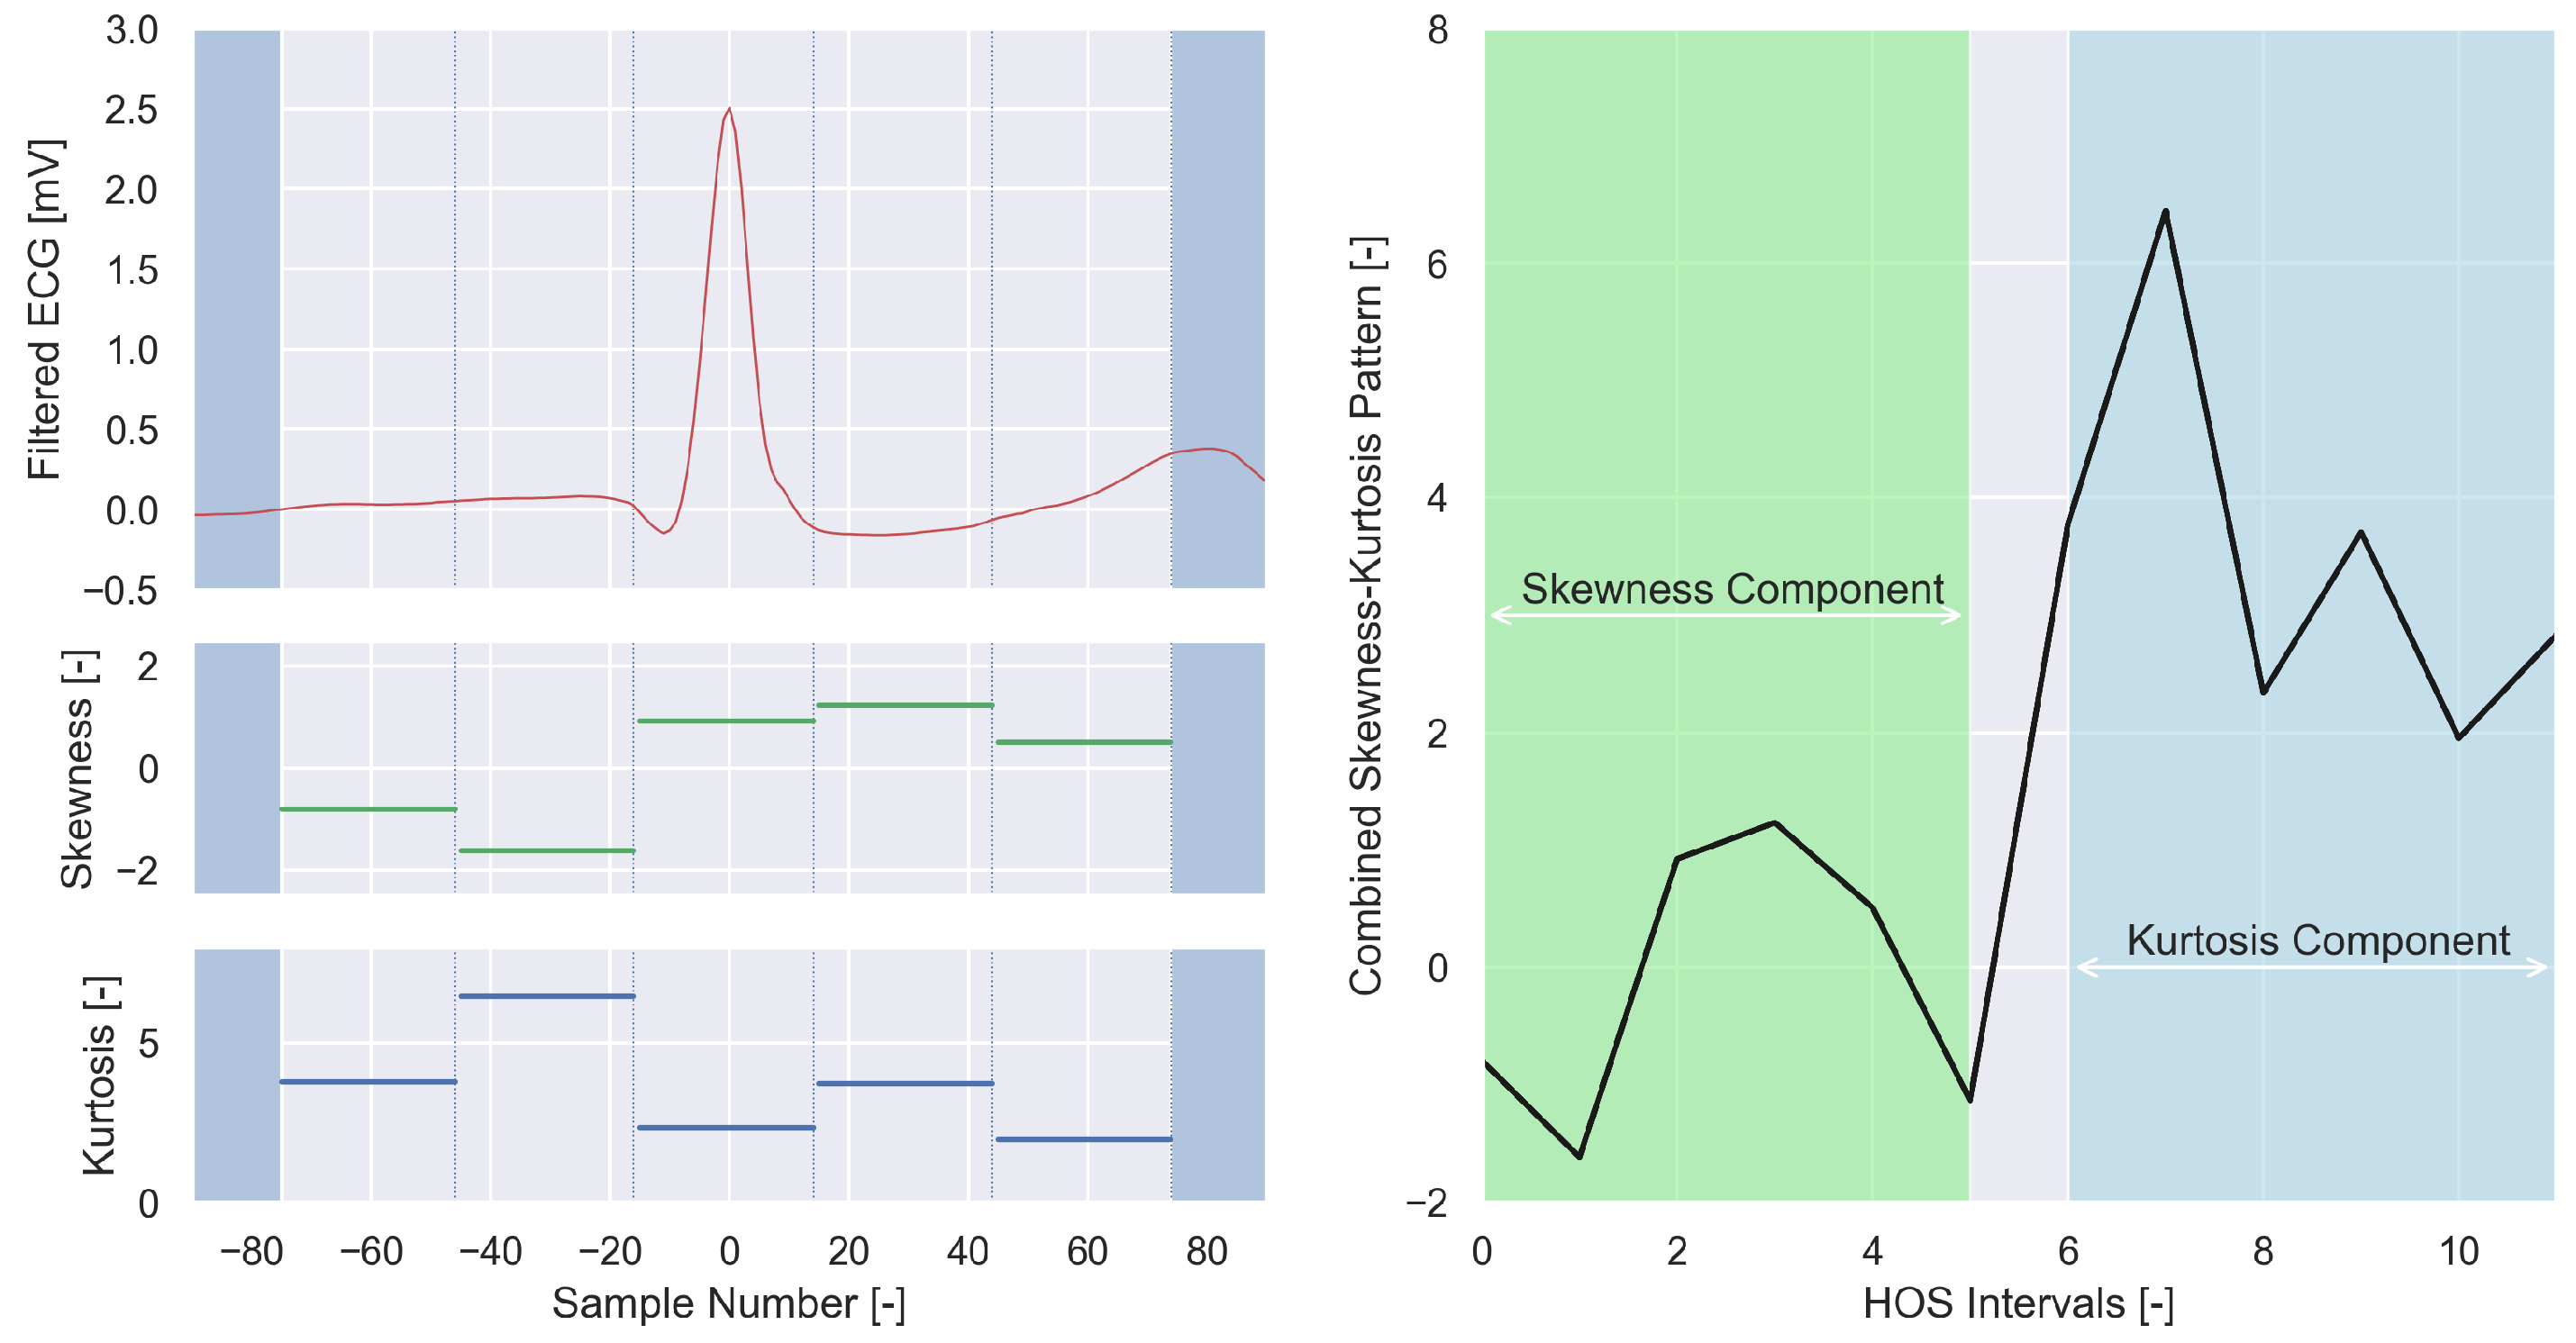
2.2.3. Higher-Order Statistics (HOS) Descriptor
Using cumulants of higher-order parameters has been a suitable option for morphologically describing ECG [5, 53]. In this case, Mondéjar-guerra et al. [
11] chose to measure the kurtosis (the signal’s tailedness’) and the skewness (the signal’s asymmetry) of five different signal intervals. The results are then connected to a joint array representing the 10-dimensional HOS descriptor. The descriptor’s components from the merged database are shown on an example segment in
Figure 4.
2.2.4. Unit Dimensional Local Binary Patterns (ULBP)
Each ECG sample is transformed into an 8-bit binary code by analyzing the eight neighbor samples (four to the left, four to the right). The bit sequence is eventually converted into the respective integer value and mapped to a predefined 59-dimensional descriptor, which summarizes the frequency of each 8-bit sequence in a Uniform LBP histogram. This method, also suggested by Mondéjar-guerra et al. [
11], is based on a 1-dimensional variant of the 2-dimensional LBP, which is commonly used in image processing to highlight patterns of the input image in a lower resolution format.
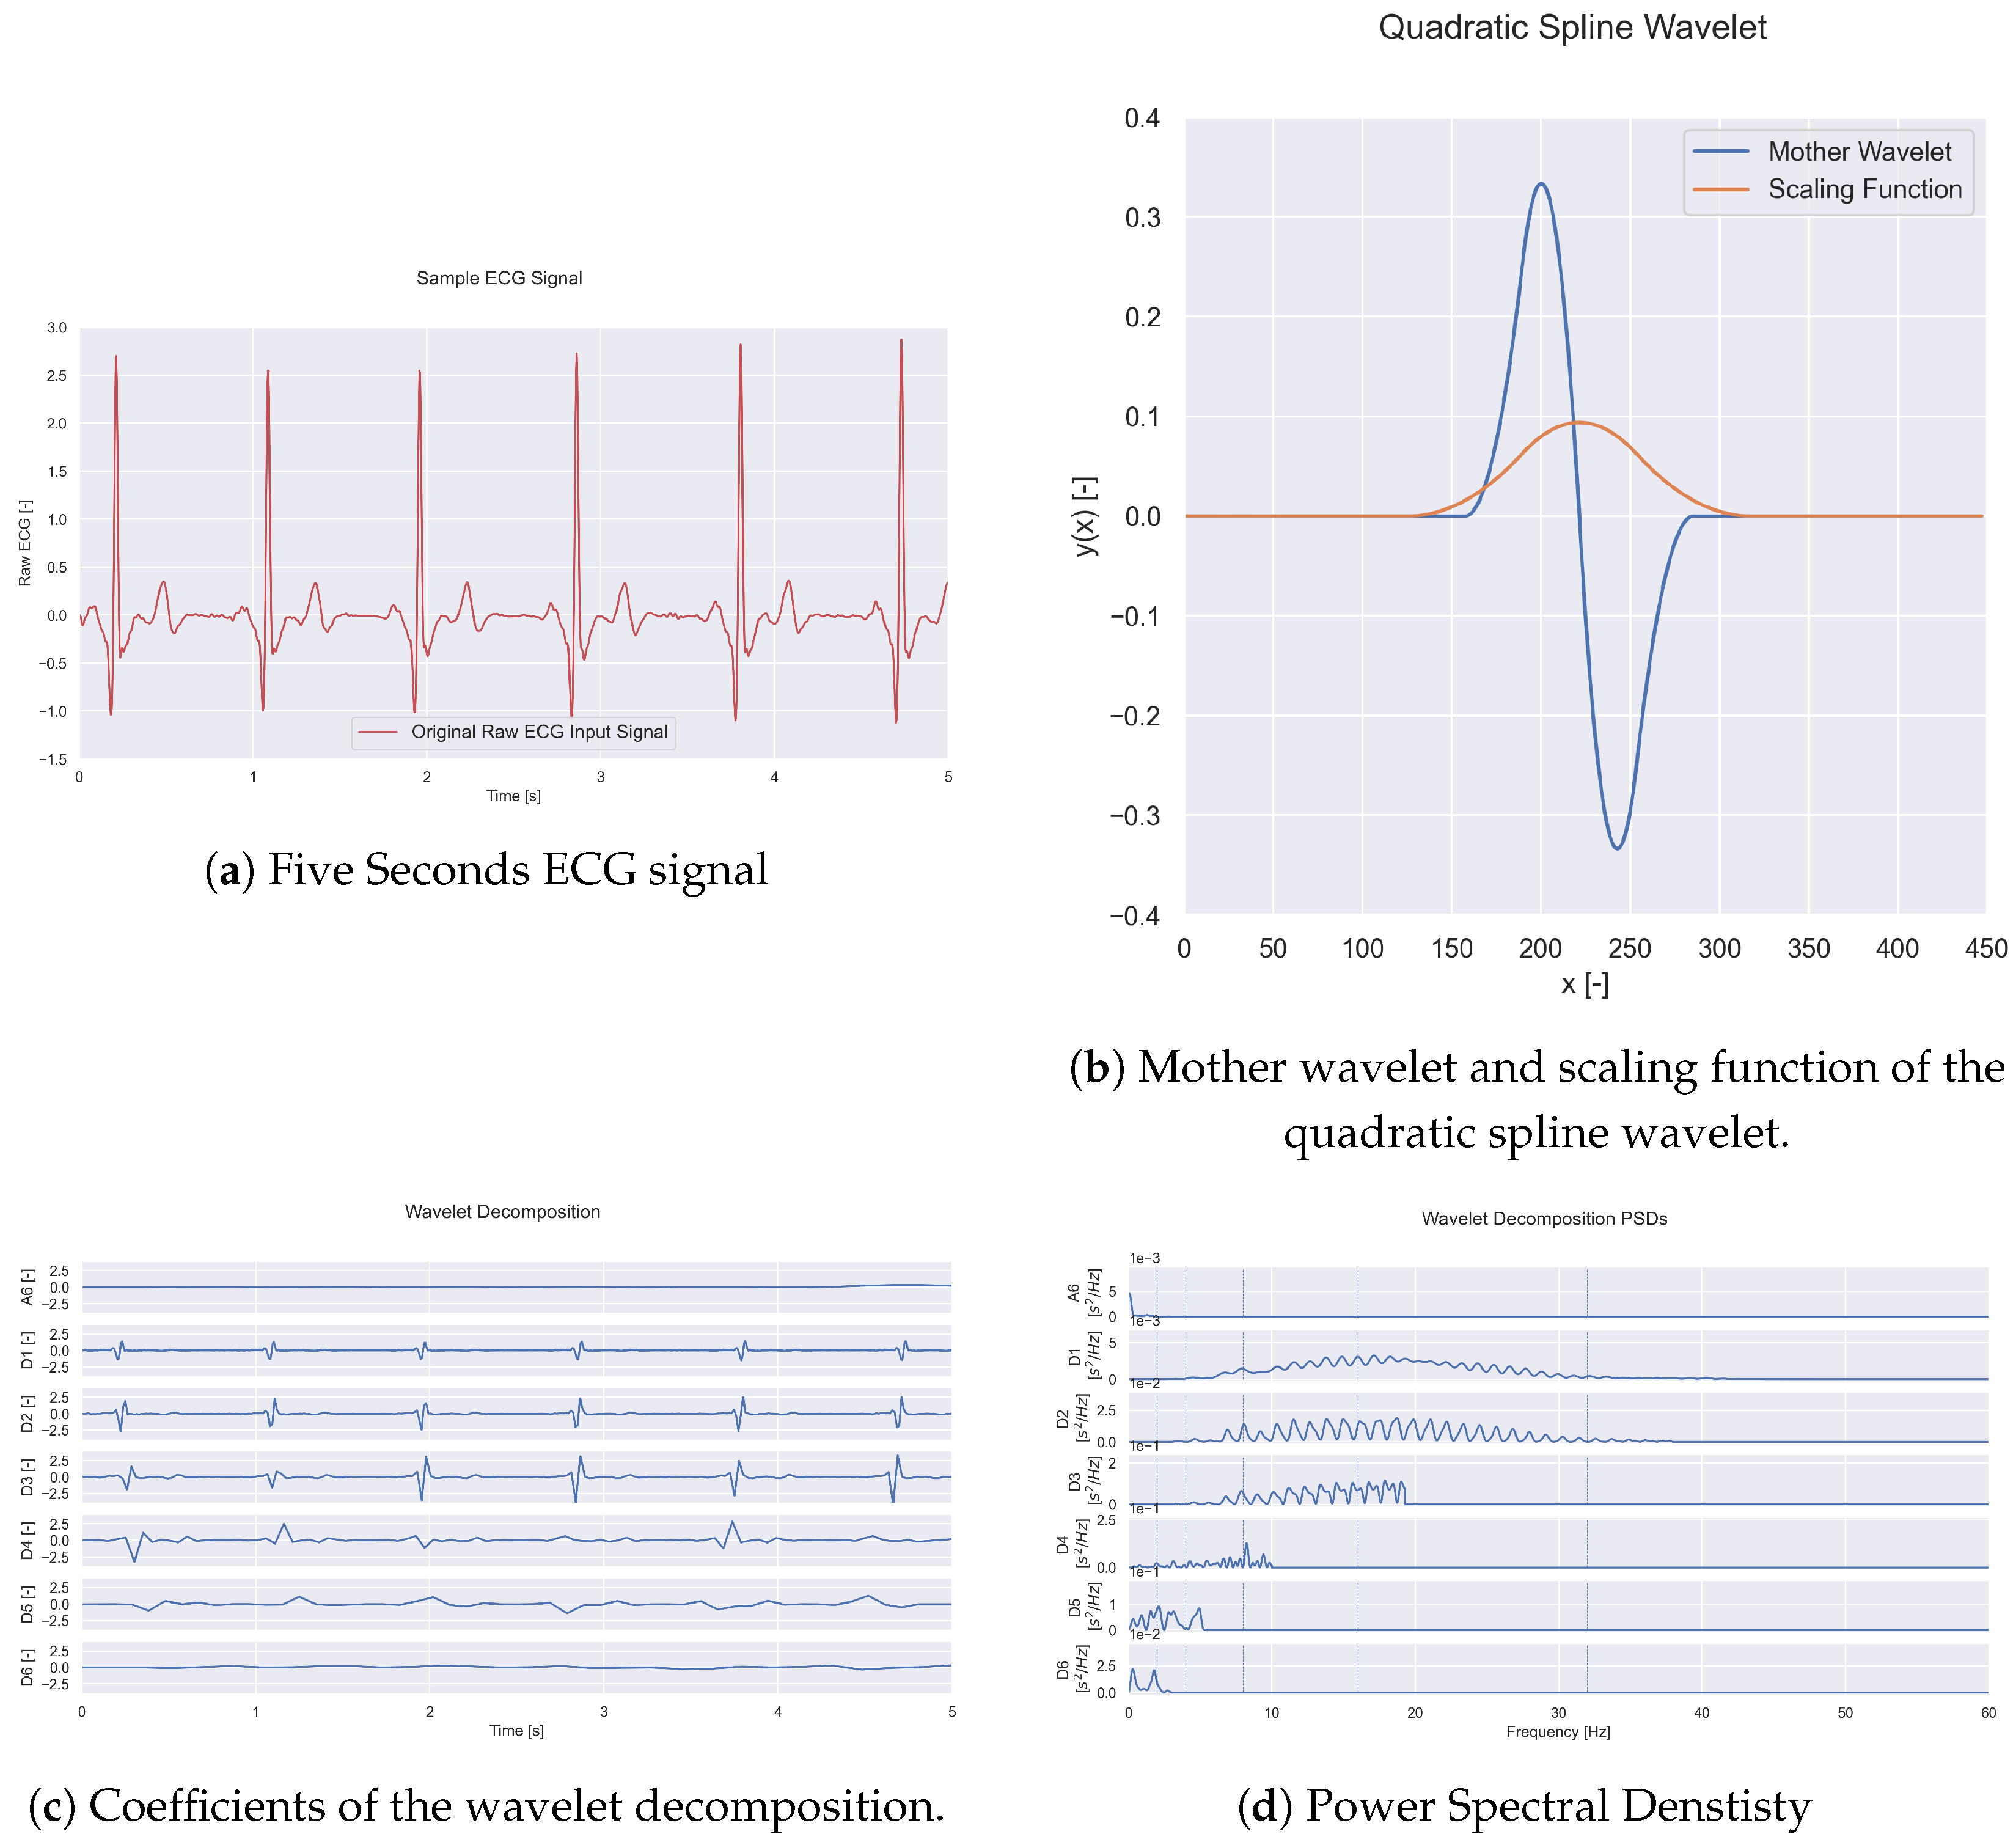
2.2.5. Wavelet Decomposition and Power Spectral Density
The Power Spectral Density (PSD) of the wavelet decomposition of the ECG signals was computed as shown in
Figure 5. The outcome provided two different feature sets. For this purpose, the signals were decomposed up to the sixth level using a quadratic spline wavelet, which extracts features of rhythm classification by a mother wavelet, see
Figure 5b. The coefficients of this wavelet method’s finite impulse response filters are detailed in the paper by Mallat et al. [
33]. The six detailed and one approximation sets of coefficients obtained from the ECG signal after wavelet decomposition of a five-second ECG rhythm are shown in
Figure 5a,c.
Figure 5d shows the PSD of each of the approximation (A6) and detailed (D1 to D6) wavelet coefficients. The PSD of each wavelet coefficient was computed using the Welch method. The blue dotted lines delimited the sub-bands of one set of features, the average values of sub-bands.
The final output is two major sets of features extracted from the signal. The first set is based on the computation of the average PSD values over the predefined frequency sub-bands. The predefined frequency bands are [0, 2]; [2, 4]; [4, 8]; [8, 16]; [16, 32]; and [32, 64] Hz. This set contains 42 extracted features (six values for each of the seven signals. The second set of features is the integral over the frequency range [0,5] Hz. In total, in this group, there are seven features representing each of the patterns.
2.3. Support Vector Machine (SVM) Classifier
The approach methodology for the SVM classifier is shown in
Figure 1a, including the steps of feature extraction, feature normalization, training, testing, and validation. The SVM classifier is designed with a kernel function, the Radial Basis Function (RBF), which reduces the complexity of finding the mapping function. When training an SVM classifier with the RBF kernel function, two parameters, gamma
and C, must be set. The value of gamma controls the width of the kernel, while C determines the parameter of the error term. Both values are given to the algorithm before it is trained, and it is a trial and error process to find the values that best classify the dataset.
The values of to be explored are: and the values of C to explore between the logarithmic scale are:. Due to the robust training process with the SVM classifier in CPU, 10.5 ms of rhythm strip from each ECG was used to handcraft the fiducial points and features from the ECG signals by the processing methods to be described.
2.4. Deep Neural Network
Deep Neural Networks for classification are catered towards a specific goal, which is to classify arrhythmias and iterate to select the most meaningful information from the ECG signals to achieve the best outcome for that specific task. The expected outcome is to obtain a model that achieves the lowest loss and highest accuracy possible for the given cardiac rhythms.
Figure 1b shows the steps of classification tasks for a DNN. The Network Model will be carried out by training a 1-dimensional Convolutional Neural Network (CNN) algorithm. The algorithm was designed with the Python Keras library, an open-source library for developing and evaluating DL models. The architecture of the deep network comprises 34 layers, of which 33 are 1D-convolutional, followed by a fully-connected layer with softmax. The network was designed to receive raw ECG time series as input, and the output gives a prediction of one of the heart rhythms by implementing the softmax layer. The network accepts as input time-series signals with different duration lengths, as long as the total of samples of the signal is a multiple of 256, as predictions are made for every 256 samples.
3. Results
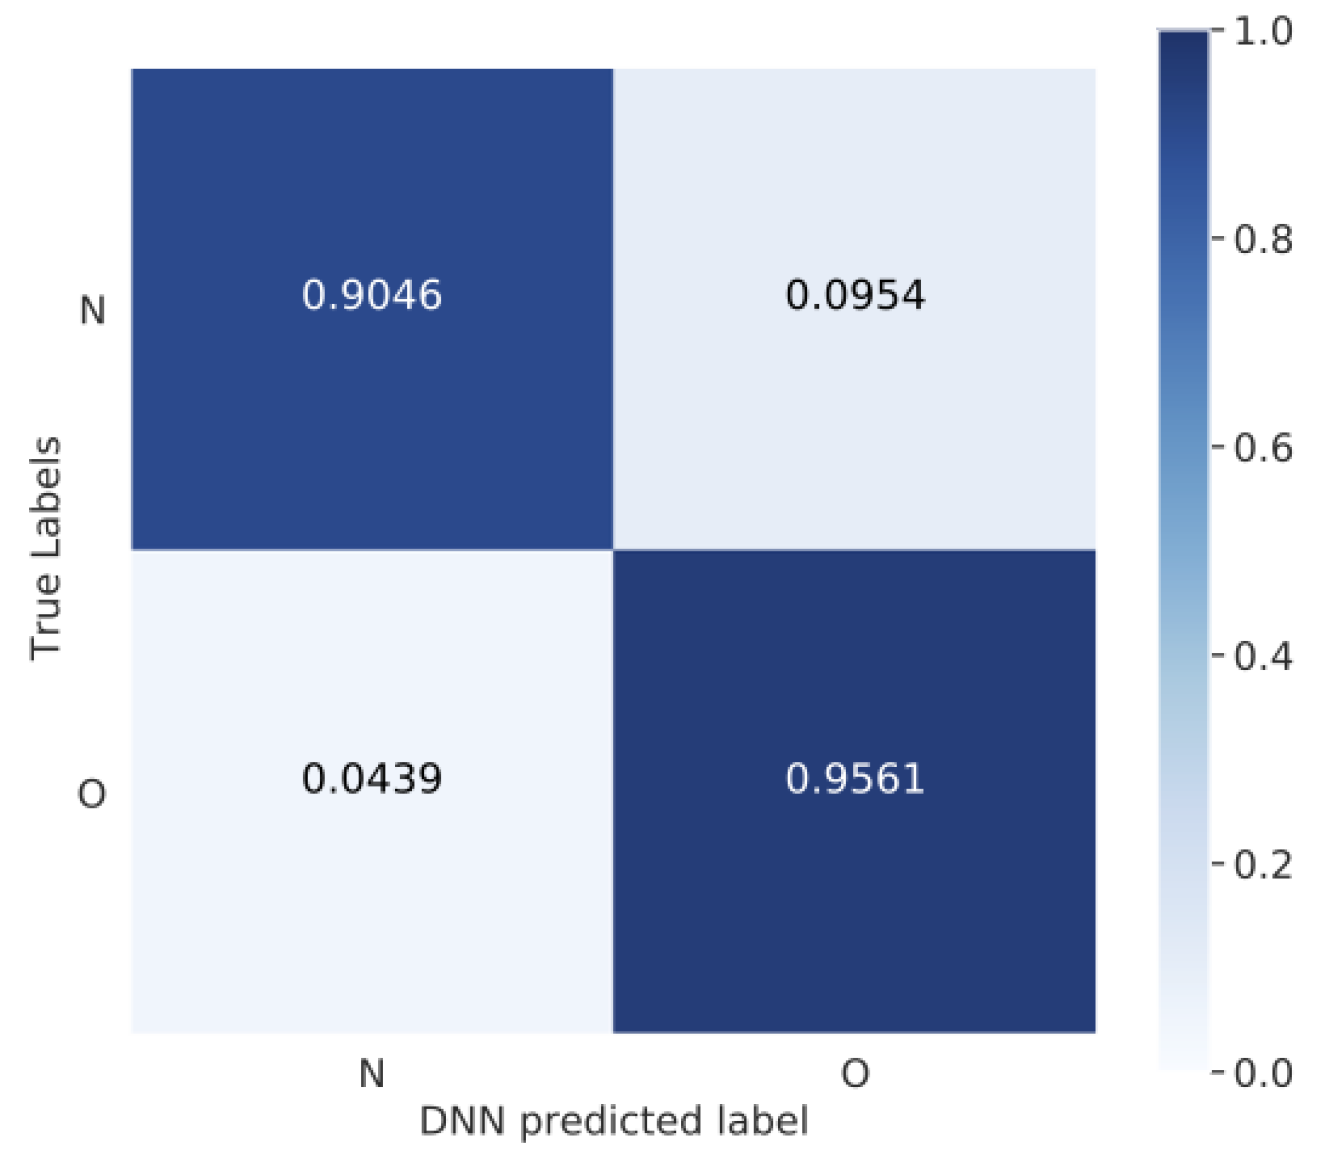
After pre-processing and normalization, the SVM classifier and 1D-CNN model were trained and validated with the merged dataset. For each experiment, multiple tests and setups were realized to observe the most suitable handcrafted features for the task of ECG classification with the SVM classifier. From all setups, better results will be reported. Overall, the SVM and 1D-CNN algorithms adjusted well to the merged dataset. The performance metrics for the 1D-CNN model with the merged dataset are presented in
Table 2 and the confusion matrix in
Figure 6. The results are by individual arrhythmia classification, where for normal rhythms (N), a precision of 90.46%, recall 95.24%, accuracy 93.07%, and F1-Score 92.79% were obtained; and other rhythms with a precision of 95.46%, recall 91.15%, accuracy 93.07%, and F1-Score 93.32%.
The SVM classifier presents two types of results, first with single handcrafted feature extraction methods using 1500 signals of the merge database. The results show that the use of the wavelet transform proposed by Mondéjar-guerra et al. achieved the highest accuracy, precision, recall, and F1-score metrics of 85.33%. 86.15%, 81.16%, and 83.58% respectively. The RR features achieved the second-best results with 82.67% maximum accuracy, 82.09% precision, 79.71% recall, and 80.88% F1-score. The Uniform Local Binary Pattern (ULBP) met the lowest overall highest performance feature, maxing out at only 58.67% accuracy, 53.68% precision, 73.91% recall, and 62.20% F1. The results for single features used to train the SVM classifier are reported in
Table 3. Second, to explore the possibilities of improving the accuracy of the SVM using handcrafted feature extraction, new training iterations were conducted under the same conditions with two combined features instead of a single feature, assuming that more features lead to better classification performance. Given that the single feature, wavelet transform, provided the best maximum accuracy, this feature has been paired with the other features for this task. The Wavelet Transform-based feature was selected as the base feature, i.e., the first of the two provided features, with the second feature iterating over the remaining available features. The goal was to analyze the impact of combining multiple features on the classification task. Eventually, the following pairs were provided: WT + HOS, WT + ULBP, WT + R-peak interval features, and WT + wavelet decomposition. The results from combined features are shown in
Table 4. The values in parenthesis represent the percentage difference from the single feature results. The results showed a minimum accuracy for each combination of wavelet transform and second feature by around 46.00%. The former highest accuracy of 85.33% by the wavelet transform alone has now been surpassed by the combination of wavelet transform and RR features, resulting in a 92.00% accuracy. No changes in accuracy have resulted when combining the wavelet transform with the HOS feature, and an accuracy drop of 16.67% is observed when combining the wavelet with the ULBP feature. The combination of wavelet transform and wavelet decomposition with PSD resulted in only a minor increase in accuracy, which is still not significant.
SVM Classifier vs. 1D-CNN Algorithm
Overall, the SVM classifier and 1D-CNN were trained with the same dataset: the cardiac rhythm merged dataset (cinc17+TNMG), which has two types of balanced rhythm categories: normal sinus and other rhythms.
Table 5 shows the best classification metrics achieved in the task of rhythm classification employing Convolutional Neural Network (CNN) and Support Vector Machine (SVM) classifiers. The 34-layer 1-dimensional CNN designed by Hannun et al. [
5] achieved the best validation metrics for classification, with an overall precision of 93.94%, 93.07% accuracy, and F1-score 93.05%. The second-best classification metrics were achieved by two combined, handcrafted, feature extracted methods: Wavelet transforms and RR-interval features using an SVM classifier. It achieved an overall precision of 89.0%, an accuracy of 98%, and an F1-score of 92%. Although the classification accuracy values between the two methods seem close, for the classification task, we should always take into account the precision value, as it is the one that tells us the percentage of rhythms being correctly predicted.
Table 6 shows the results from this research study compared to those from other studies. Overall, some studies did not report evaluation metrics, such as accuracy and F1-score. Our study achieved relatively consistent accuracy values in comparison with other similar studies. The study from Batista et al. [
12] reported the highest accuracy of 99.08% among the studies. However, the dataset described for validation was highly unbalanced between categories. In this study, one of the focuses was to maintain a balance between the categories when designing the merged dataset for training and validation. In the Hannun et al. [
5] research, a large private database was used, and its results were compared to the performance of cardiologists. On the other hand, Mondejar et al. [
11] evaluated an SVM classifier for the classification of heartbeats. Although they reported high accuracy, their results reported many false positives in their precision metric. The SVM classifier with RR-interval and wavelet transform-based features showed the best results in the case of time-series heart rhythm detection. Both features provide more information when training the classifier and are more useful in the heart rhythm classification task.
4. Discussion
In this research, we explore the option of merging two databases to evaluate the task of arrhythmia classification. For the task of arrhythmia classification, two algorithms were evaluated and compared. The merged database helped to balance the categories and expanded the amount of data used to train and validate the models. Before choosing the databases to merge, individual tests were performed with each database (cinc17, TNMG, MIT-BIH) to train the CNN model. The MIT-BIH database was excluded as it presented different characterization in annotations, leads, and signals compared with the cinc17 and TNMG databases. The merged database has not been used previously in any study and can serve as a benchmark for future studies that require access to a large ECG database. The merged dataset intended to design a balanced dataset containing two rhythm categories, normal sinus and abnormal signals, from differently acquired ECG signals (e.g., different acquisition devices, different sampling rates).
Before training the CNN algorithm, the ECG signals were re-sampled to a common sample frequency and normalized. The arrhythmias classes reached high precision and accuracy of 90.46% and 93.07% for the normal sinus and 95.61% and 91.15% for the abnormal signals, respectively; proof that different databases can be merged for heart rhythm classification tasks under the same characteristics. By merging databases, researchers with no access to large ECG datasets can evaluate their models with wider data.
Although the results with the merged database were good, during the pre-evaluation phase of the model, we noticed limitations in the algorithm. During training, we encountered overfitting during the pre-evaluation of the model for heartbeat classification. For this reason, we suggest that the algorithm’s performance be evaluated and compared with less complex CNN algorithms.
Another limitation we faced was that the model is designed to perform a classification every 256 samples, which means that the ECG signals must have a specific frequency range that allows the signal to be a multiple of 256; otherwise, the algorithm shows errors during training. Moreover, the algorithm overperforms with relatively small datasets, which leads to a longer training cycle to stabilize the evaluation loss in comparison with the performance of the model in larger datasets.
Human-assisted feature extraction and feature engineering have been conducted for the SVM classifier. The results show that the Wavelet Transform-based feature provides the overall highest metrics (accuracy: 85.33%, precision: 86.15%, recall: 81.16%, F1-score: 83.58%). The remaining features, listed in descending order by the maximum achieved accuracy, were the RR-interval feature, HOS, wavelet decomposition, and the ULBP. To these results, the maximum accuracy provided by the individual features alone is inferior to the performance of the CNN. In order to further explore the possibilities of improving the maximum accuracy of the human-assisted feature engineering for SVM, an additional experiment has been conducted. Instead of providing a single feature type to the SVM, a combination of two features was provided to the SVM for the classification task.
The results showed that the combinations of WT + WT R-peak intervals provided the highest increase in accuracy, reaching a maximum accuracy of 92.00%. At the same time, the remaining features did not strongly influence the WT’s original accuracy or led to a decrease in accuracy by up to 16.67%, which was the case of combined featured WT + ULBP. When comparing the complexity of the features by the amount of information provided to the SVM per feature, it can be observed that the use of the WT benefits from combinations with features that provide lower amounts of features. For instance, the R-peak interval features provide four feature values, while the worst score combination of WT + ULBP adds 59 values to the feature set. It can be assumed that the combinations with lower amounts of data generated a less complex pattern for the correct classification than the features with high data amounts that create a complex pattern. The results show that selecting suitable features must be carefully made depending on the application, among other factors that might impact the outcome. Several studies reported results based on the overall accuracy. However, overall accuracy as the only performance metric is not enough to assess the performance of a model in a classification task. For this reason, additional tools and metrics such as the confusion matrix show the proportion of true prediction results for each heart rhythm.
Human-assisted feature engineering requires the application of the signal processing techniques directly on the ECG input signal is rather beneficial as it does not require support for the high computational costs of running the CNN network to extract features before classification. A CNN algorithm’s advantage is providing more complex features, potentially even revealing early indicators of diseases that might not be revealed from traditional signal processing of raw ECG input signals.
5. Conclusions
The development of computerized Electrocardiography (ECG) systems has increased the possibility of collecting more ECG data at the clinic or remotely [
34]. This produces a large amount of patient data that needs to be reviewed by a cardiologist, which can consume a significant amount of time. Although ECG signal processing tools are already widely available to support this process, their development requires active human-assisted engineering for feature extraction. Furthermore, it will be interesting to explore whether systems based on ECG classification could work in parallel with cardiovascular disease prediction systems based on data mining. Previous studies have shown positive results in predicting cardiovascular disease using clinical data collected during medical examinations [
35,
36]. In the case of a medical emergency, these systems could react quickly and autonomously alert nearby hospital alert systems or public safety answering points [
37]. Implementing such applications in reliable mobile monitoring systems would benefit patients with limited access to continuous care.
This exploratory study evaluates and compares the performance of two algorithms, the SVM and 1D-CNN model, for the task of rhythm classification by using a merged public dataset. SVM and 1D-CNN algorithms showed positive results with the merged database, showing similar F1-scores, precisions, and recall during arrhythmia classification. Despite the favorable results for both of them, it should be considered that in SVM, feature selection is a time-consuming trial-and-error process; meanwhile, CNN algorithms can reduce the workload significantly. The disadvantage of CNN algorithms is that it has higher computational processing cost; moreover, in the absence of access to powerful computational processing, SVM can be a reliable solution. It is important to note that when evaluating a learning algorithm, all the datasets must have the same characteristics, e.g., be re-sampled at the same sampling rate, and normalized.


