Article

Crushing Analysis and Optimization of Adjacent Variable Thickness Hexagonal Tubes

1
Key Laboratory of Traffic Safety on Track Ministry of Education, Central South University, Changsha 410075, China
2
Joint International Research Laboratory of Key Technology for Rail Traffic Safety, Changsha 410075, China
3
National & Local Joint Engineering Research Center of Safety Technology for Rail Vehicle, Changsha 410075, China
*
Author to whom correspondence should be addressed.
Appl. Sci. 2022, 12(14), 7348; https://doi.org/10.3390/app12147348
Submission received: 20 June 2022 / Revised: 13 July 2022 / Accepted: 20 July 2022 / Published: 21 July 2022
(This article belongs to the Section Mechanical Engineering)

Abstract

:
In this study, we proposed a new adjacent variable thickness hexagonal tube (AVTHT) and performed crushing analysis and crashworthiness optimization under multiple loadings. First, the finite element models were constructed and validated by experiments with four configurations of AVTHTs. Then, the numerical simulations under axial loading and multiple oblique loadings indicated that AVTHTs under various loading angles (0°, 10°, 20°, and 30°) and three patterns (α, β, and θ) exhibited different deformation modes, force-displacement characteristics, and crashworthiness indices. This suggested that we could change and determine the plate thickness configuration to make the AVTHTs exhibit the expected crushing performance under multiple loadings. Therefore, multi-objective optimization for minimizing maximum crushing force with multiple loadings (Fmaxw) and maximizing specific energy absorption with multiple loadings (SEAw) by changing the thickness configuration under multiple loadings was conducted. The results determined the thickness design domains and indicated that certain thickness ranges should be avoided, such as the ranges of 1.55 t 1 1.6 and 1.85 t 1 1.95 , which was helpful for getting AVTHTs to achieve excellent crushing performance in railway vehicles. In the pareto results, increasing t1 would not always increase the Fmaxw and SEAw. For example, when 1.75 t 1 1.8 , increasing t1 would lead to decline of Fmaxw and SEAw.

1. Introduction

To improve the safety of trains or automobiles in collision accidents, energy absorption structures (EASs) are usually installed at the front of vehicles to dissipate the impact energy, and EASs are attracting increased attention recently [1,2,3].
Thin-walled (TW) structures, as the most widely used EASs, include tubular structures [4] and foam structures [5,6]. Many researchers have studied the crushing performance of TW tubular structures through experiments, simulations, and theories [7]. In [8], energy absorption tubes of various cross-section shapes were investigated, and it was found that varying the thickness and taper angle can improve crashworthiness.
The crushing performance of hexagonal tubes has frequently been reported. In [9], the method of angle elements was applied for studying the crush resistance of polygonal tubes, including hexagonal tubes, and some discussion about the deformation mechanism of energy absorption is presented. In [10], a hexagonal TW tube with partition plates subjected to axial compression was studied, and it raised its average compression load by introducing corner parts. Li et al. proposed a hierarchical hexagonal multi-cell tube and indicated that the tube is a more weight-efficient energy absorber [11]. In [12], researchers employed finite element analysis (FEA) with surrogate models to optimize the sectional dimensions of hexagonal tubes. Dong et al. investigated the crushing performance of bitubular hexagonal columns with ribs and selected the best configuration of ribs [13]. These studies focused on hierarchical structures, multi-cells, ribs, and graded thickness for hexagonal tubs, and there is no report on the method of changing the adjacent wall thickness of hexagonal tubes to improve crashworthiness under multiple loadings. However, the crushing performance of square and rectangular tubes with various adjacent wall thicknesses has been investigated [14,15,16], and it was found that changing wall thickness affected the force characteristics and deformation mode of square columns and rectangular tubes. Therefore, it is worth studying how changing the wall plate thickness affects the crashworthiness of adjacent variable-thickness hexagonal tubes.
In addition to axial loading, the TW EASs could be subjected to multiple loadings during collision. The crushing performance of EASs under oblique loadings has been the focus of researchers [17,18,19,20], and it is more complex than that of EASs under axial loading, and more research methods are applied to it. The weight factor technique has been widely applied [21]. Moreover, in [22], the results showed that the method with dimensionless and weighted processing showed a more obvious effect in improving the crashworthiness of the tubes, which has an enlightening effect on the research of this paper.
In this paper, we proposed a new adjacent variable thickness hexagonal tube (AVTHT), studied its crushing performance under multiple loadings, and performed multi-objective optimization for thickness configuration with a dimensionless and weighted method. Section 2 introduces AVTHTs and defines the methods for simulations, experiments, and optimization. In Section 3, we compared the results between simulations and experiments and validated the FE models; we performed crushing analysis for the AVTHTs under axial and oblique loadings, and discussed the effects of thickness configuration, loading angles, and patterns. Finally, a multi-objective optimization design (MOD) was performed to minimize the maximal crushing force (Fmaxw) and maximize the specific energy absorption (SEAw) under multiple loadings. The conclusions are summarized in Section 4.

2. Materials and Methods

2.1. Description of Models

An adjacent variable thickness hexagonal tube (AVTHT) can be obtained by changing the adjacent wall thickness and maintaining the separated wall thickness consistent with a traditional hexagonal tube. To maintain the integrity of the structures and high machining accuracy, we manufactured the specimens (Figure 1b) using the wire-cut electrical discharge machining (WEDM) technique with aluminum alloy AA6061O blocks. WEDM is that the specimen must be pre-drilled with a hole to form the internal profile of the cross-sectional shape, and then cut through the specimen with wire according to the pre-programmed profile shape of the TW tube [23]. The surface roughness of these tubes is fairly small, and the crushing behavior is not affected by welding seams.
As shown in Figure 1c, a specimen tube consists of two types of wall plates with thicknesses t1 and t2, and wall plates with thicknesses t1 and t2 are arranged at intervals. The two parameters (i.e., t1 and t2) range from 1.4–2.0 and 2.0–2.6, with the interval of 0.2 separately, and t 2 = 4 t 1 . Figure 1d,e shows the cross section, and the center lines of the cross section constitute a regular hexagon with a side length of 40 mm. The length of the tube specimens was maintained constant to 180 mm. The dimensions of AVTHT are determined by the space of the installation location in a certain subway vehicle (Figure 1a). Herein, we nominated the specimen with its sectional dimension. If a specimen was set with plate thicknesses of 1.8 mm and 2.2 mm, we named the structure “S1822.”
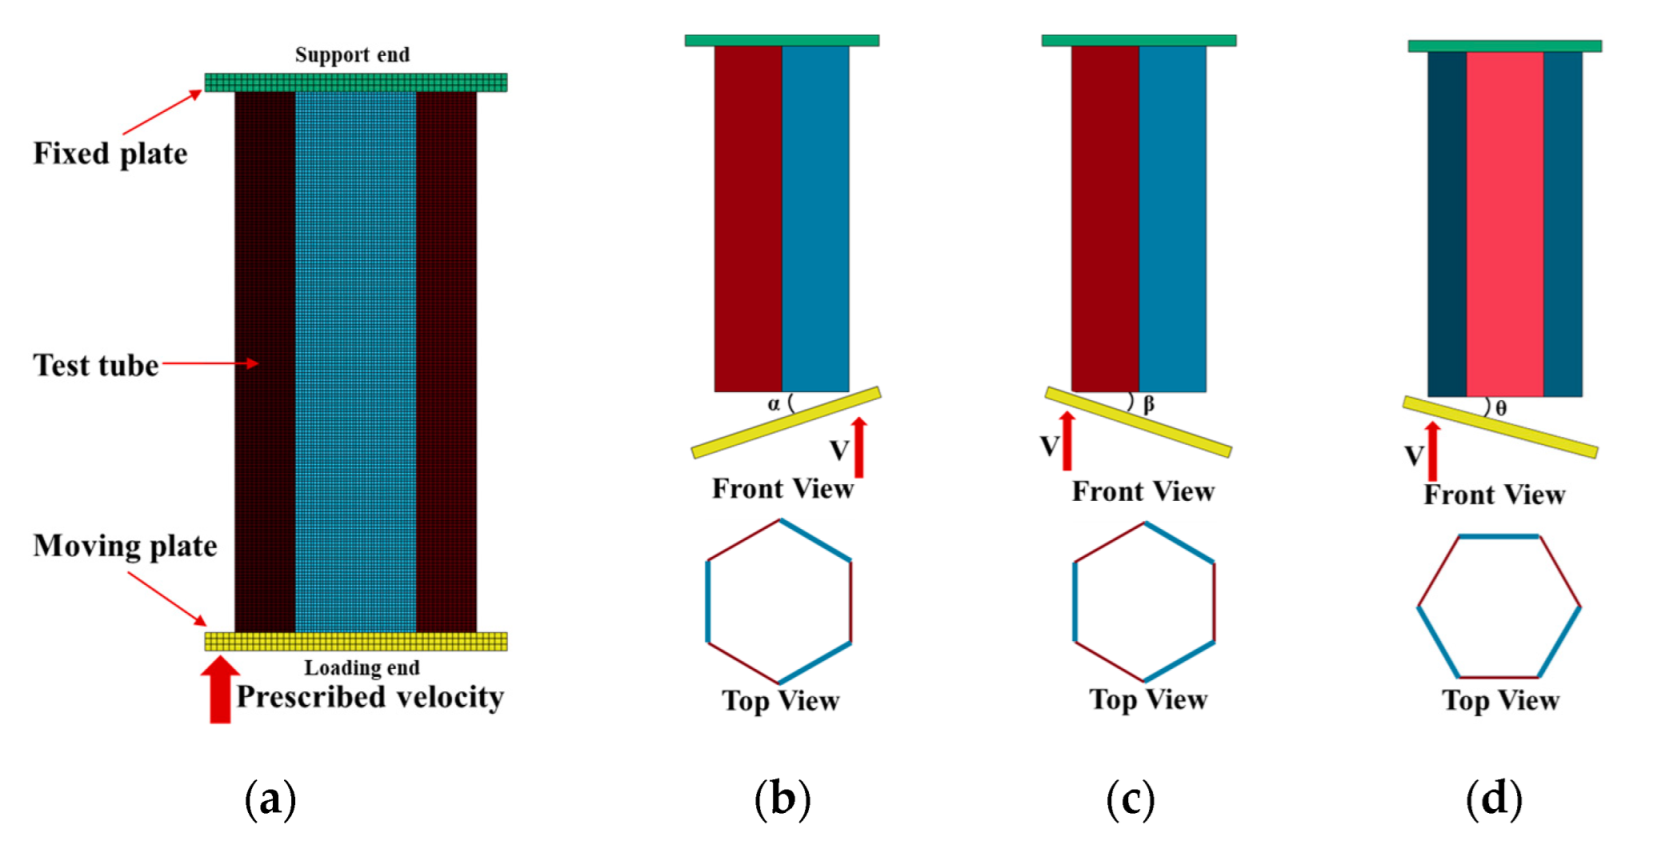
For the study conditions, as shown in Figure 2, we fixed the specimen tube on a stationary plate, and drove another plate to axially or obliquely compress the tube. Considering that, during the crushing process, EASs were usually subjected to various oblique loadings, we defined three loading patterns for oblique loadings. Pattern 1 (Figure 2b) is loaded along a side with a thinner plate (thickness = t1), and the loading angle is α > 0°; pattern 2 (Figure 2c) is loaded along a side with a thicker plate (thickness = t2) and the loading angle is β > 0°; pattern 3 (Figure 2d) means that loading is along a hexagon corner with θ > 0°.

2.2. Crashworthiness Indices

Three common crashworthiness indices were used to describe crashworthiness. The indices are the Fmax (maximum crushing force), SEA (specific energy absorption), and CFE (crushing force efficiency), and they are defined as follows:
The index, Fmax, means the maximum value of crushing force during the crushing process, and can be used to determine the maximum deceleration: [24].
S E A = E A M ,
where EA is the energy absorption, and M is the mass of an EAS. SEA indicates the EA per unit mass [25]. A higher SEA value indicates greater efficiency for an EAS during the crushing process.
CFE = F mean F max ,
where the Fmean means the average force, and it can be obtained from the ratio of EA to crushing distance s. The CFE indicates the uniformity of the crushing force. During the crashing process, the higher the CFE value, the better the energy absorption capacity of an energy absorption structure [23].
In addition, three objective functions are also defined considering the effect of multiple loading angles, and are shown as follows [20]:
F maxw = i = 1 n F max 10 i ° w 10 i ° ,
SEA w = i = 1 n SEA 10 i ° w 10 i ° ,
CFE w = i = 1 n CFE 10 i ° w 10 i ° ,
where F max 10 i ° , SEA 10 i ° , and CFE 10 i ° are the Fmax, SEA and the CFE at a certain loading angle 10 i ° ( i = 0 , 1 , , n ); w 10 i ° is the weighted factor, which is related to the probability of the impact at the loading angle. The sum of the weighting factors is as follows:
i = 1 n w 10 i ° = 1               w 10 i ° 0 .

2.3. Finite Element Modelling

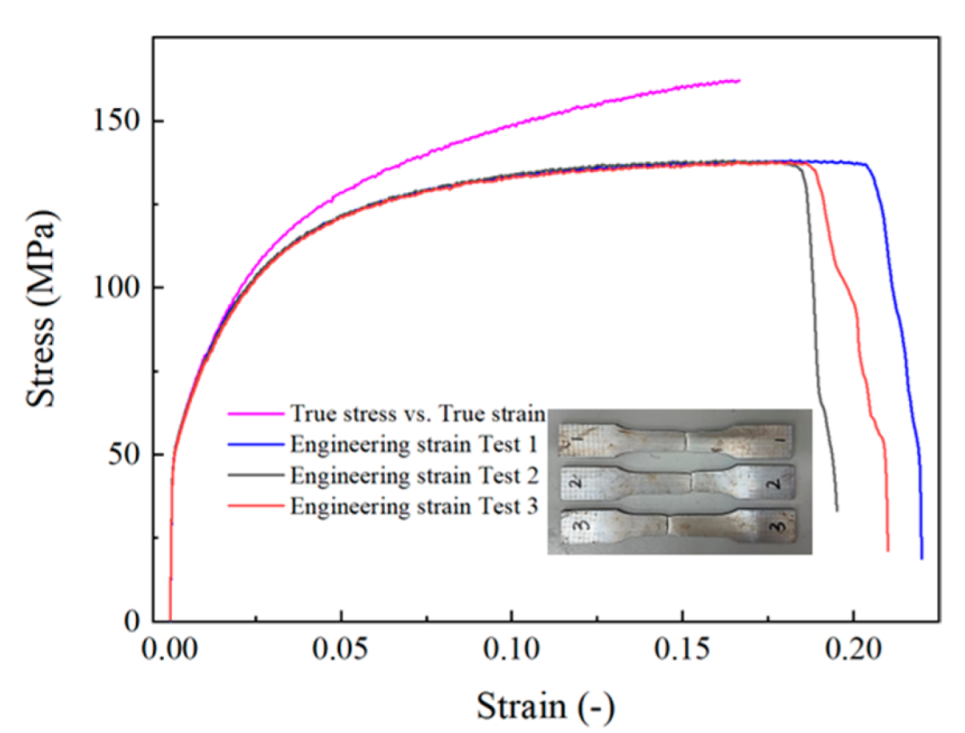
The explicit nonlinear finite element analysis code LS-DYNA [24] was used to investigate the crashworthiness of the AVTHTs. In Figure 2, the finite element (FE) model consists of three components: a fixed plate, a moving plate, and an AVTHT, whose geometric dimension is consistent with that of the specimen tubes. The two plates were defined as rigid bodies using hexahedral solid elements with the material Mat_Rigid (Mat_20) from the material library in LS-DYNA. The tube was modeled using Belytschko–Tsay shell elements with five integration points through the thickness and one integration point in the element plane. Mat_24 was employed to determine the elastic-plastic characteristics of this material. In Figure 3, a comparison of the true and the engineering stress-strain curves is shown, and the true stress-stain curve is applied for Mat_24. The hourglass control and reduced integration techniques were employed to avoid spurious zero energy deformation modes and volumetric locking, respectively. Moreover, the tube plates of AVTHT were assigned to two independently variable thicknesses. Therefore, two different components with different section property cards in LS-DYNA were established for tube plates with thicknesses of t1 and t2. To balance the computing time and accuracy, we reduced the element size of the AVTHT from 2 mm to 0.6 mm with an interval of 0.2 mm to perform the mesh convergence analysis. The results indicated that when the mesh size was 1 mm, the value of energy absorption became stable; thus, a mesh size of 1 mm was selected for the AVTHT model. Moreover, the mesh size of the two rigid plates was set at 2 mm, which can satisfy the requirements of efficiency and accuracy.
For contact algorithms in simulations, the “AUTOMATIC_SURFACE_TO_SURFACE” contact type was used for the contact between the two plates and the test tube. The “AUTOMATIC_SINGLE_SURFACE” was used for self-contact with the AVTHT. The static and dynamic frictional coefficients in these contacts were all set at 0.15 [22].
Due to the quasi-static test condition, the strain-rate effect of the aluminum alloy AA6061O was ignored for the numerical simulation in this study. To improve computational efficiency, we sped up the loading velocity [14], and in [26], it was proven effective when TW structures were compressed with quasi-static loading in simulations. Herein, the moving plate moved upward with a velocity of 1000 mm/s in the normal direction [16,27,28], and the fixed plate was fixed throughout the simulation.

2.4. Experimental Setup

2.4.1. Material Properties

We first performed the uniaxial quasi-static tension test to obtain the material properties of the aluminum alloy AA6061O. The three material specimens were cut from part of the same structure and were prepared for the test (Figure 3). The test was conducted according to the standard of GB/T 228.1-2010 and the dimensions were determined by [26]. Three engineering stress-strain curves were obtained, and the standard deviation and coefficient of variation values of key points in the three curves are shown in Table 1. By processing the three curves, we obtained the average true stress-strain curve and extracted the parameters of the material properties, as shown in Table 2.

2.4.2. Quasi-Static Axial Compressive Tests

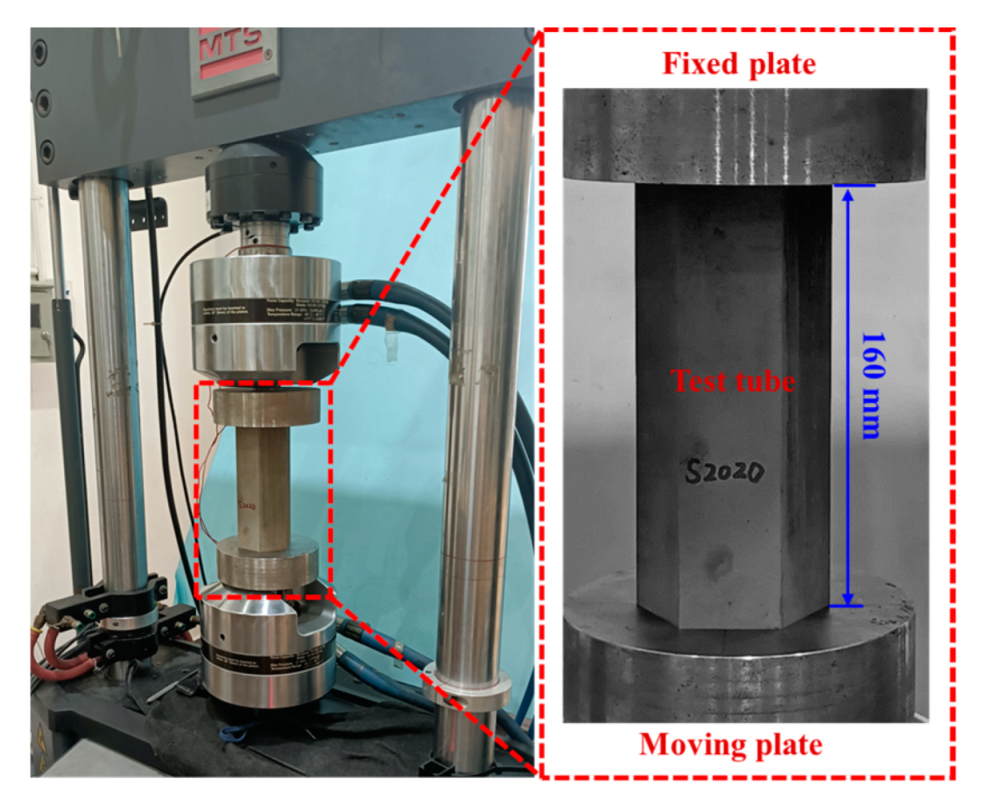
Though most EASs that were installed in front of railway vehicles or cars were mainly subjected to crashing loading, they were commonly investigated under quasi-static loading with a loading speed of 1–5 mm/min by many researchers [11,28,29,30,31]. This is because the experimental process in the quasi-static test is better controlled than that in the impact test, and the aluminum alloy AA6061O is not sensitive to the loading speed. Therefore, we performed quasi-static tests for AVTHTs made of aluminum alloy AA6061O to validate the FE models. As shown in Figure 4, the AVTHT was placed between the moving plate and the fixed plate, and the MTS Landmark testing machine drove the moving plate compressed upward to the AVTHT with a constant velocity of 4 mm/min. The testing machine did not stop loading until the displacement reached 120 mm. Then, we saved the data of real-time loading and compressive displacement.

2.5. Optimization Definition and Method

When designing AVTHTs, the objective is to exhibit acceptable crashworthiness under multiple load angles and patterns. In this study, we performed crashworthiness multi-objective optimization (MOD) to determine the appropriate plate thickness configuration for the AVTHTs.
In Refs. [32,33,34], the Fmax and SEA were selected as the objectives of the MOD. In general, a crashworthiness MOD is aimed at seeking a lower Fmax and a higher SEA, which would contribute to a lower deceleration [14], and considerable EA per unit mass, respectively. Herein, two objectives: Fmaxw and SEAw were defined as objectives that considered crashworthiness indices with axial loading and oblique loading angles (10°, 20°, and 30°); each loading angle included three loading patterns (Figure 2). Therefore, there were 10 group design cases. The design case weights [20,33] are shown in Equation (7).
{ w 0 ° = 1 / 4 w 10 ° = w α 10 ° + w β 10 ° + w θ 10 ° = 1 / 4 ,   w α 10 ° = w β 10 ° = w θ 10 ° = 1 / 12 w 20 ° = w α 20 ° + w β 20 ° + w θ 20 ° = 1 / 4 ,   w α 20 ° = w β 20 ° = w θ 20 ° = 1 / 12 w 30 ° = w α 30 ° + w β 30 ° + w θ 30 ° = 1 / 4 ,   w α 30 ° = w β 30 ° = w θ 30 ° = 1 / 12 ,
{ M i n i m i z e   ( F max w ,   S E A w ) s . t .           1.4   mm t 1 2   mm ,
In this study, t1 and t2 were always on the symmetry of the 2 mm; thus, the expression t 2 = 4 t 1 could be obtained. Parameter t1 was set to the variable of this optimization problem, and the range was 1.4–2.0 mm. Consequently, the multi-objective optimization problems of AVTHTs under multiple loading angles and patterns are formulated mathematically as Equation (8).
Moreover, the entire optimization process is shown schematically in Figure 5.
For the optimization algorithm, we adopted the Multi-Objective Genetic Algorithm (MOGA) to search for the optimal designs. MOGA, which is an extension of the Genetic Algorithm, has been demonstrated to be an efficient algorithm for structural multi-objective optimization [35]. The parameters of MOGA [35] were set as follows: maximum iteration = 50, minimum iteration = 25, population size = 84, constraint violation = 0.1%, non-dominated points = 500, mutation rate = 0.01, and elite population = 10%.

2.6. Surrogate Models and the Design of Experiments (DOE)

For structural crashworthiness optimization, the surrogate model method is effective and has been widely used [36]. The HyperKriging method could provide considerable accuracy for certain nonlinear problems [22,37]. Thus, we adopted this method to construct the surrogate model in this study.
To generate sufficient and appropriate simulations for constructing and examining the surrogate model, we performed a DOE for the sampling design points and validation points. Moreover, the full factorial sampling method and the Latin hypercube method were adopted. Both types of points were applied to 10 groups of design cases (Figure 5). The details of the points are shown in Table 3.
Using the validation points, we examined the accuracy of the surrogate model by performing error estimation. Three numerical indices, R2 (the coefficient of determination) and RAAE (the relative average absolute error), are defined as follows [14,22,38]:
R 2 = 1 ( y ^ i y i ) 2 ( y ^ i y ¯ i ) 2 ,
RAAE = 1 n ( | y ^ i y i | ) 1 n ( y ^ i y ¯ i ) 2 ,
where y i and y ^ i donate every true numerical simulation value and corresponding surrogated value. The mean value for all the numerical values on the validation points is presented as y ¯ i   n = 4 is the number of validation points. The overall accuracy of the surrogate model can be determined by R2 and RAAE. In general, an R2 value closer to 1 and a smaller value of RAAE suggest better accuracy of the model [38,39,40].
After performing simulations with the DOE, we normalized the results of each group, which was helpful for weighted operation and establishing a reasonable surrogate model. The normalization was operated using Equation (11):
r d = r r l r u r l ,
where r d means the result after normalization; r represents every result obtained from simulations of original DOE and r u and r l are the maximal and minimum values of them, respectively.
The normalized results of the three loading patterns under each oblique loading angle were weighted and summed. Then, we added up the four groups of results (axial loading, oblique loading with angles = 10°, 20°, and 30°) with corresponding weights. The results generated a new DOE that could be used to establish the surrogate model. Moreover, the validation points were also operated by the above steps, and a new DOE was generated for validation. Finally, using the validated surrogate model and optimization algorithm, we obtained optimal results considering the 10 loading cases, which were called Pareto fronts.

3. Results and Discussion

3.1. FE Model Validation

The model validation was based on the axial compression of four types of specimen tubes. It focused on three aspects: deformation, crushing force and energy absorbing curves, and crashworthiness indices. We prepared two specimen tubes and performed two quasi-static compressive tests, Experiment-1 and Experiment-2, for each type of AVTHT.
All the deformation processes between the two tests are basically the same; thus, the comparison here only shows the process of Experiment 1 in Figure 6. Note that all the AVTHTs deform with progressive folding mode, and most of the AVTHTs have no material tearing or failure. All the deformation modes and sequences maintained the same results in the simulations and the experiments, except for the sequence difference and slight tearing of specimen S1426 in the experiments. Material failure is not considered in the FE model since it is not the concern of the present work, and it is hard to predict its occurrence accurately [16]. In the literature [7], two distinct folding mechanisms were observed and distinguished: propagating hinge line (Mode I) and stationary hinge line (Mode II). The main features of the former are the hinge line moving and extension is limited to the neighborhood of the hinge line, and then extension occurs over an entire flange, which will be called Mode II. S2020 in simulations and experiments produces folds of Mode II and exhibits an extensional deformation mode, which is consistent with the conclusion in the literature [41]. The remaining three types of AVTHTs produce folds of Mode I and are exhibited in the inextensional deformation mode.
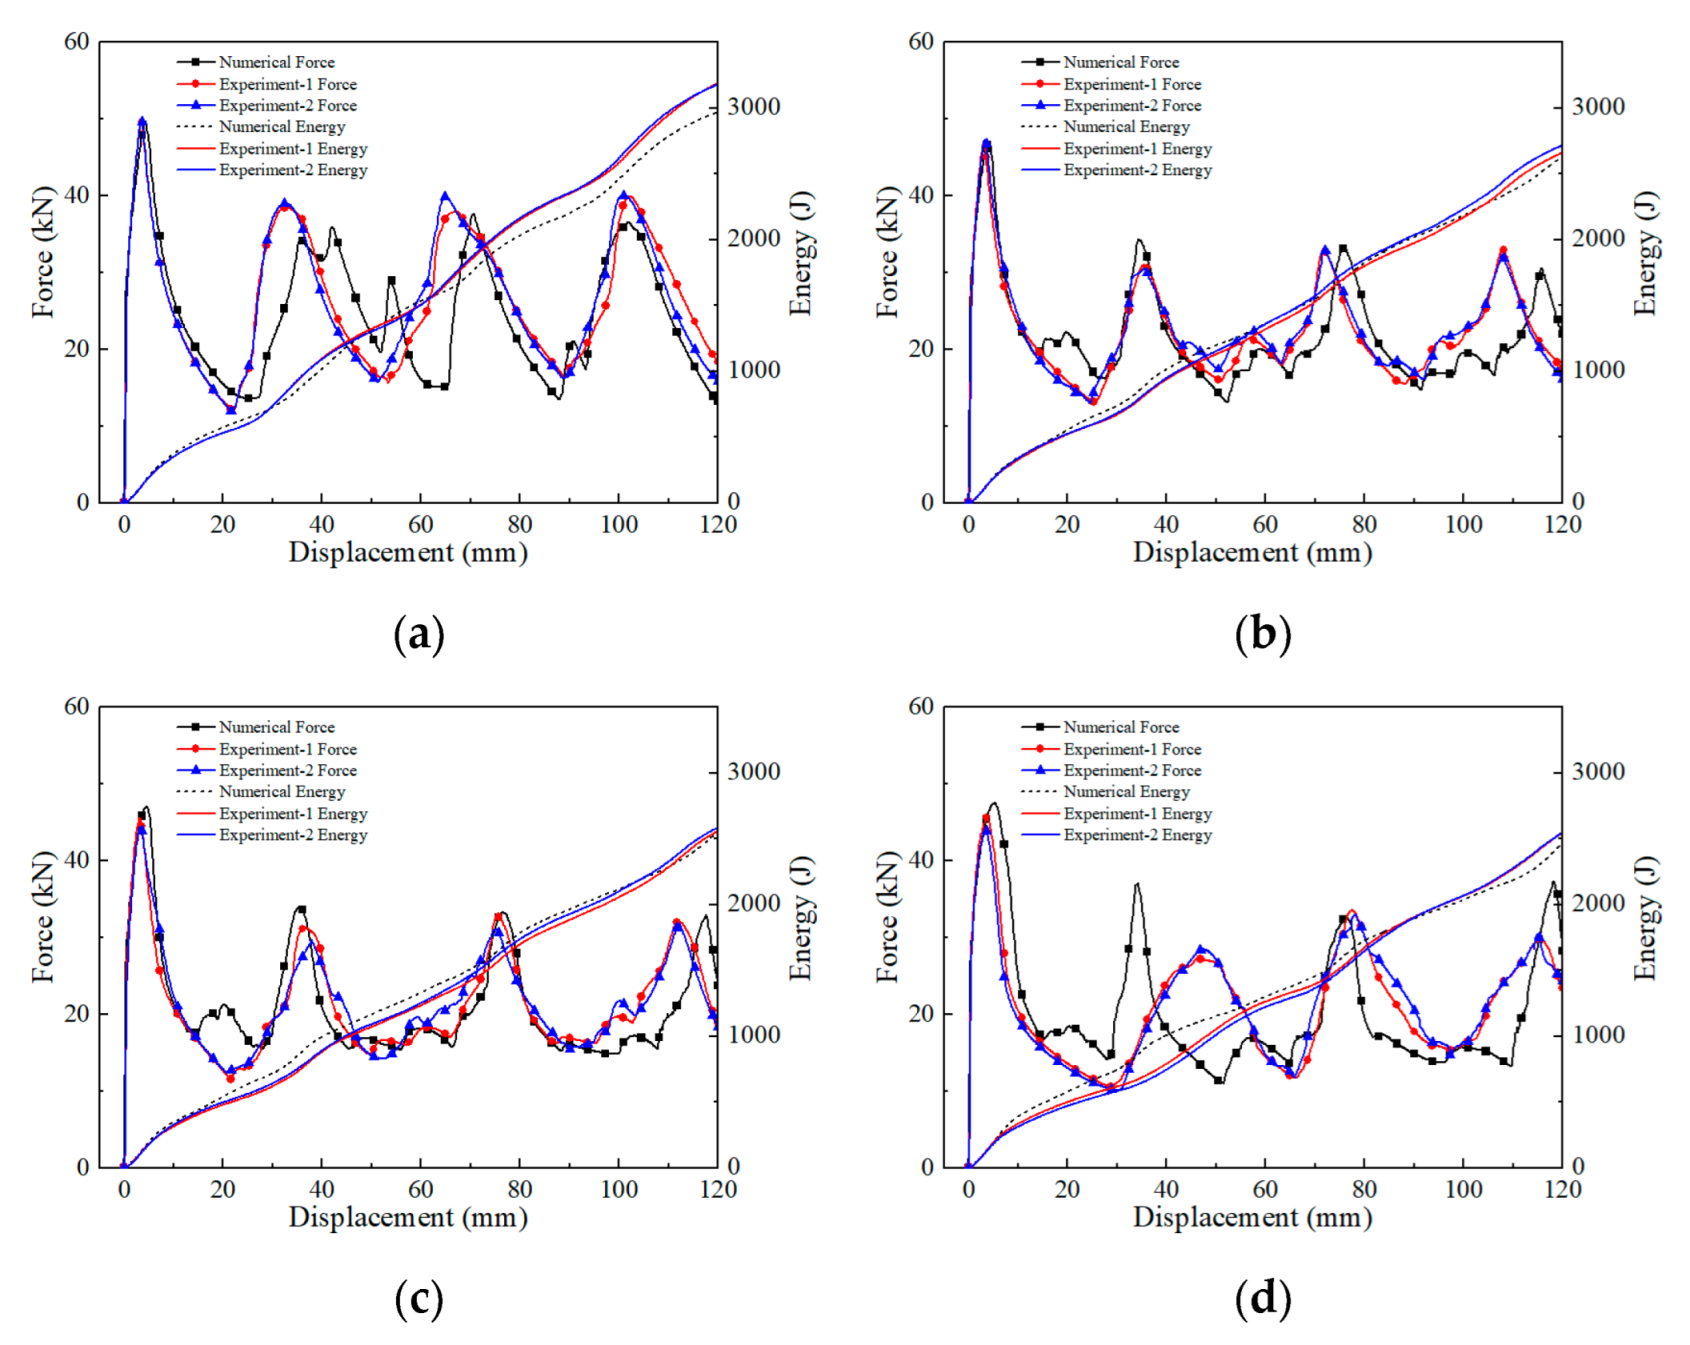
For energy absorbing curves, it was found that force-displacement and energy-displacement curves between simulations and experiments agreed well (Figure 7). All force-displacement curves basically show four local peaks, which is due to the generation of four sets of folds for each tube. However, as the difference in wall plate thickness increases, the displacement it takes to produce four sets of folds is increased, which indicates that the wavelength for folds is increased.
In addition, the details of the crashworthiness indices are shown in Table 4. For the experimental results, the maximum standard deviation values of Fmax, SEA, and CFE are 0.820, 0.119, and 0.009, respectively; the maximum coefficient of variation values of Fmax, SEA, and CFE are 1.831%, 1.035%, and 1.992%, respectively. This indicates that the consistency and accuracy of the experimental data are very good. Compared with the two corresponding experimental results, the maximum average error of the simulation results is −8.879%, which occurs in the CFE value of specimen S1426.
Above all, the FE model has good accuracy to predict the crushing performance of the AVTHTs and can be used in following research.

3.2. Crushing Performance Analysis under Axial Loading

According to the actual impact conditions and the existing literature [22,33,42,43], we adopted 0° (axial loading), 10°, 20°, and 30° as loading angles and performed simulations to investigate the crushing performance of AVTHTs. As mentioned earlier, three patterns were considered under oblique loading. The thickness configuration of the AVTHTs was as follows: t1 was increased from 1.4 mm to 2.0 mm with an interval of 1 mm; t2 = 4 − t1. In addition, all other settings of simulation were the same as those in Section 2.3.
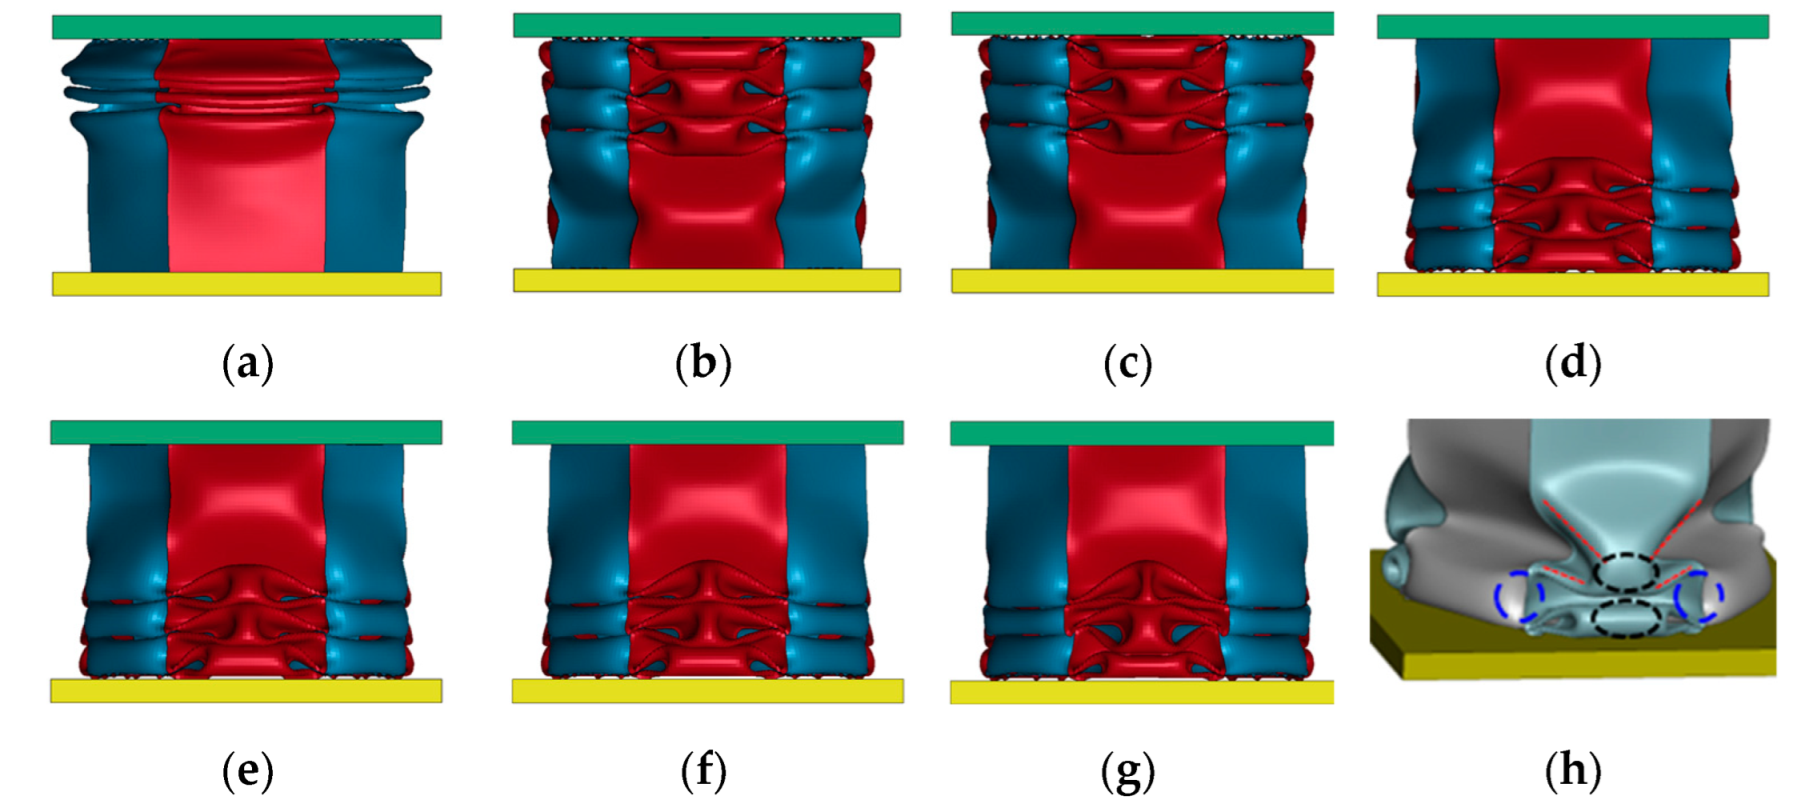
The deformation modes of the AVTHTs after 120 mm axial loading are compared in Figure 8. All tubes deform by producing progressive and sequential folds. When the difference of the plate thickness is small ( t 2 t 1 0.4   mm ), folds are generated from the support end (fixed plate); however, when t 2 t 1 0.5   mm , folds are generated from the loading end (moving plate). Moreover, when t 1 < t 2 , as the thicker plates bend inward, the thinner plates bend outward and the moving plastic hinge lines are pushed to the thinner plate. If thicker plates bend outward, the thinner plates cannot provide enough force to push the plastic hinge lines to the thicker plates, which causes no moving plastic hinge lines to form in the thicker plate. As shown in Figure 8h, the red dotted lines refer to plastic hinge lines in the thinner plates, and the areas that cannot generate plastic hinge lines in thick plates are circled by blue dotted lines. As the difference between t1 and t2 increases, the distance of every plastic hinge line in the thinner plates moving is increased, and the areas (circled by the black dotted line in Figure 8h) are decreased.
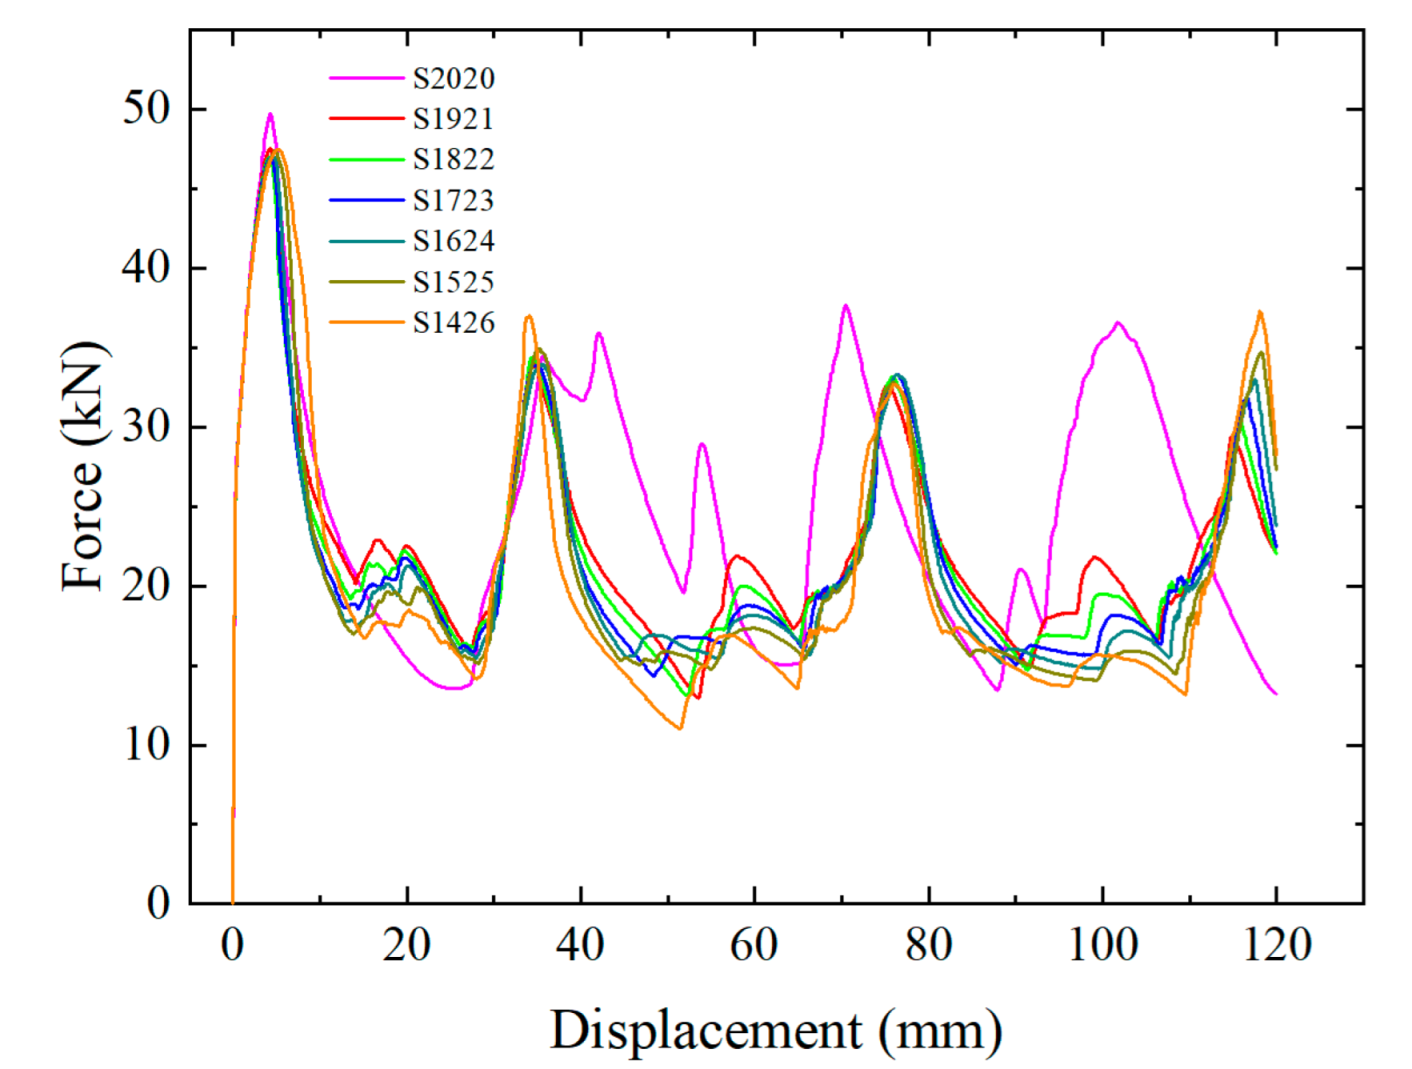
For force-displacement characteristics, the force-displacement curves of all tubes are shown in Figure 9. Note that all curves exhibit regular forms and characteristics. In the beginning, the force increases suddenly and reached the initial peak. Then, the force rapidly drops due to the generation of folds. The force-displacement curve of S2020 is obviously different from other curves due to the difference in the deformation mode. Moreover, the maximum initial peak value, 49.727 kN, is contributed by S2020, and its remaining peak values are also basically larger than those of the other curves. When t 1 t 2 , the corresponding force-displacement curves of the AVTHTs show high similarity. As the difference in plate thickness increases, the curves of the AVTHTs drop to lower trough values and reach greater values at the last peak force point, which can weaken the EA under axial loading.
The crashworthiness indices are compared in Table 5. It is found that S2020 reveals the maximal Fmax, SEA and CFE values. When the difference of plate thickness is increased, SEA and CFE are decreased slowly, which indicates that the extensional deformation mode exhibits better energy absorbing characteristics compared with the inextensional deformation mode for AVTHTs, though the Fmax value of the former is larger. The difference in plate thickness can also attenuate crashworthiness for AVTHTs under axial loading. For the difference of Fmax, the minimum value (S1822) is 5.49% less than the maximum value (S2020). The minimum SEA value (S1426) is 17.05% less than the maximum SEA value (S2020), and the minimum CFE value (S1426) is 13.08% less than the maximum SEA value (S2020).

3.3. Crushing Performance Analysis under Oblique Loading

Three patterns were applied under each loading angle, and there were nine deformation results for a type of AVTHT. The final deformation modes of all AVTHTs after oblique compression of 120 mm are compared in Figure 10. For a type of AVTHT, when the loading angle is constant, different loading patterns cause different deformation modes. For example, S1525 deforms in inextensional mode with α = 10 ° and β = 10 ° ; however, it exhibits unideal deformation with θ = 10 ° . S1822 shows the bending and sliding mode with α = 20 ° and β = 20 ° ; no bending deformation can be found under θ = 20 ° . Moreover, as the loading angle increases, all the AVTHTs deform with the modes, which range from progressive folding modes to unordered and nonprogressive modes. For a constant loading angle and pattern, different AVTHTs show different deformation modes. Note that under β = 30 ° , S2020, S1921 and S1822 deform with bending modes at the support end; S1723, S1624, S1525, and S1426 exhibit crease in the plate surface, and the bending position is closer to the midpoint of a tube. Additionally, AVTHTs under the loading patterns of pattern 3 (θ > 0°) are less prone to bending patterns compared with the other loading patterns. The results suggest that the loading angle, loading pattern, and thickness configuration can influence the deformation modes of AVTHTs.
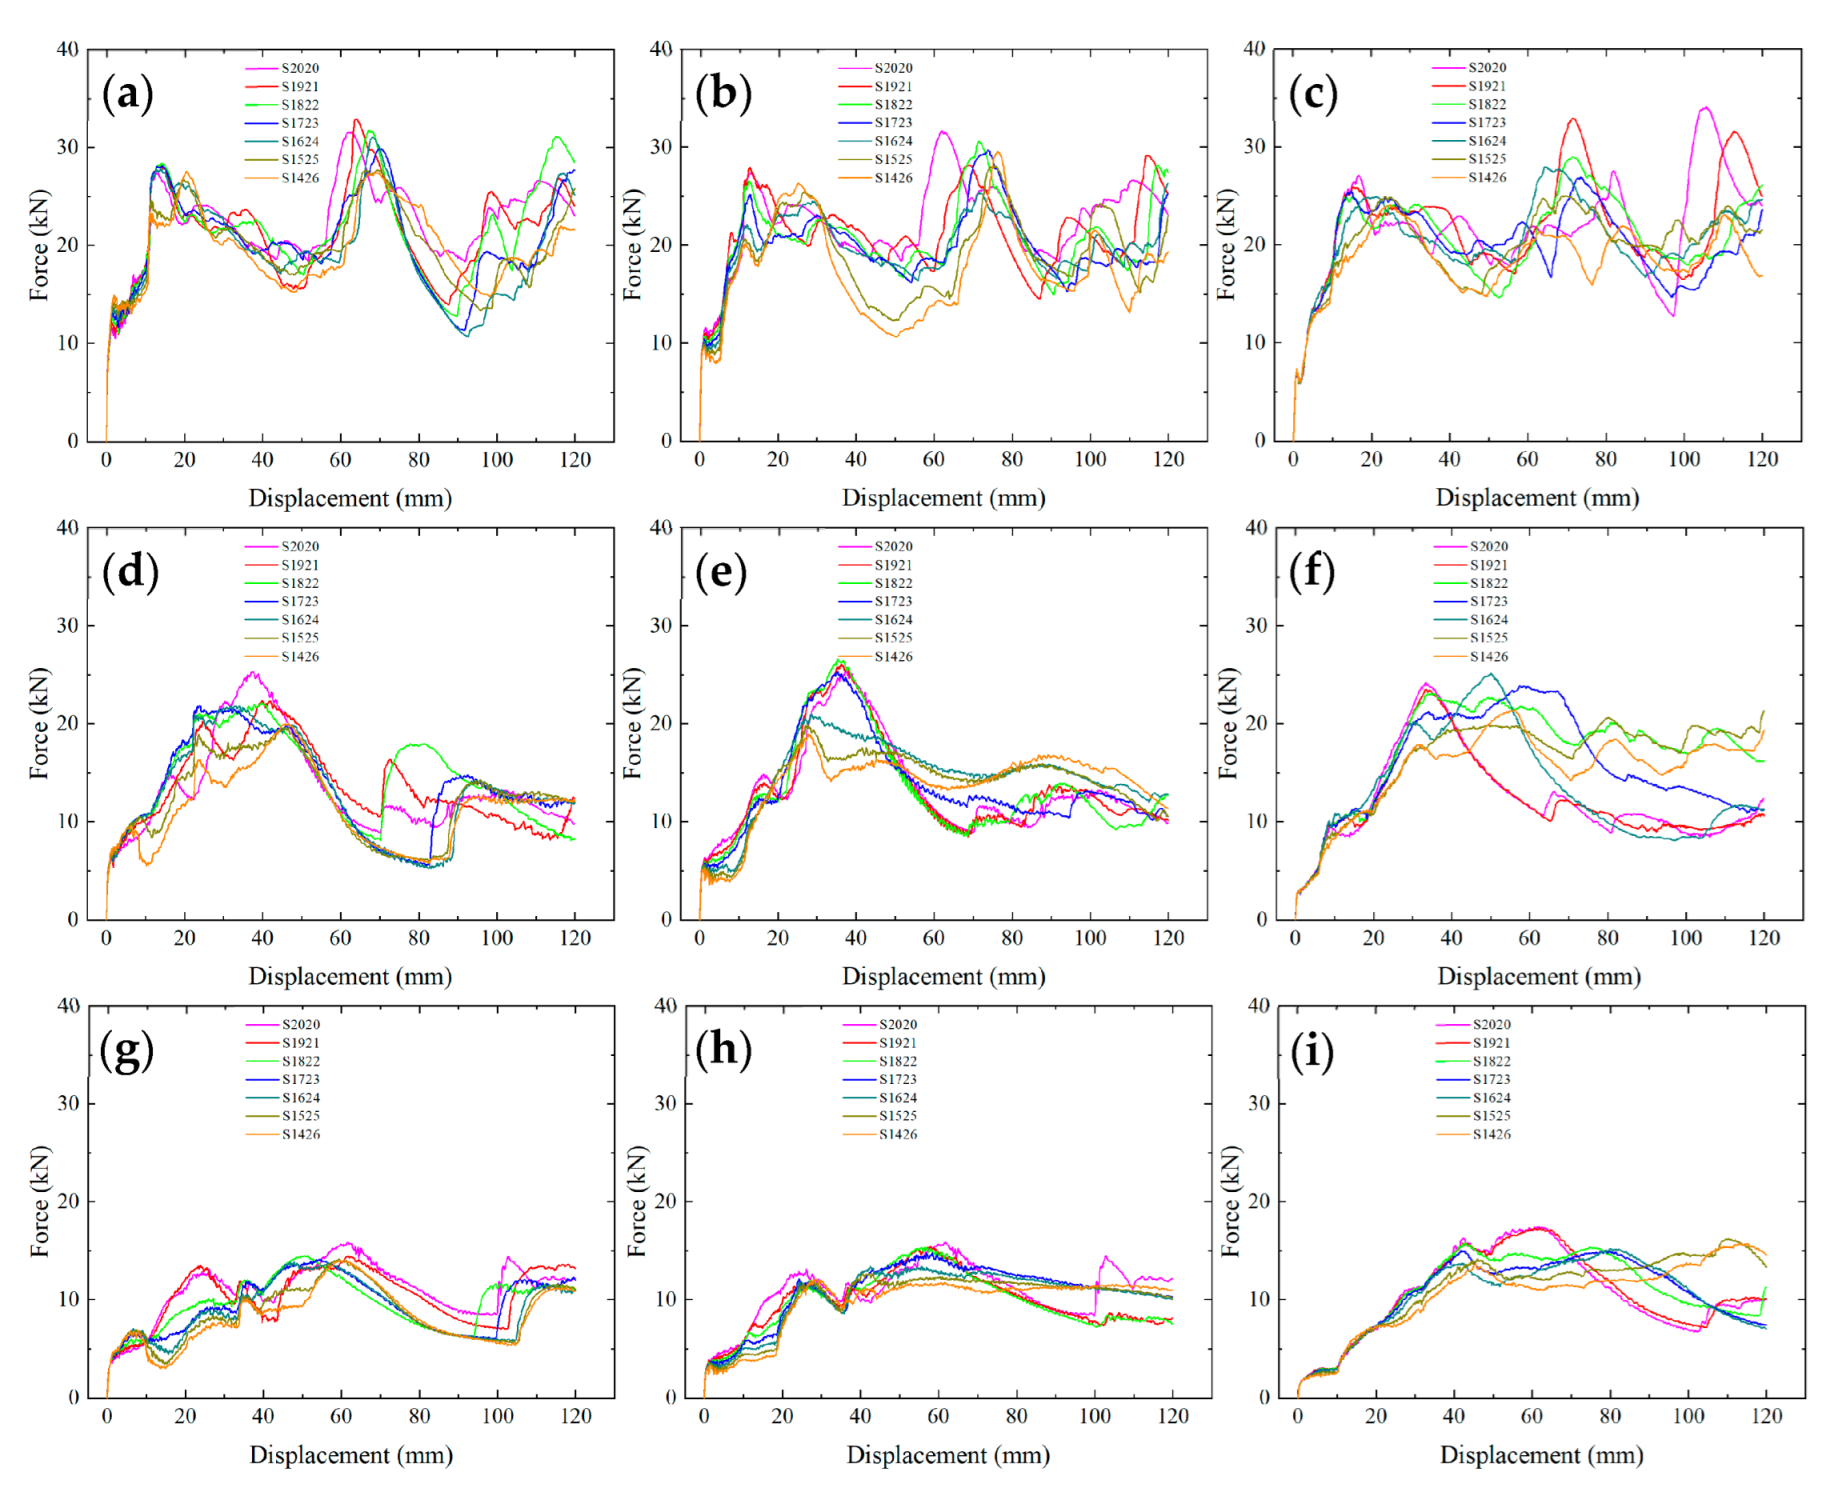
The force-displacement curves of all AVTHTs under various loading angles and patterns are compared in Figure 11. When the tubes are under the same loading angles, i.e., in every three subgraphs, the force-displacement characteristics are generally similar, whether the curve trends or global force levels. When the loading angle is 10°, all the corresponding curves exhibit fluctuation trends, and the initial peak force values are also lower compared to the subsequent wave peak values, which is contributed by imperfect progressive folding mode. However, with the loading angle increasing to 20° and 30°, the tubes mainly deform with nonprogressive modes; therefore, the curve platforms drop, and the regular fluctuation is almost non-existent. Another concern is that there are non-ignorable differences between the curves of different AVTHTs under the same loading angles and patterns, especially the when β = 20 ° (Figure 11e), θ = 20 ° (Figure 11f), and θ = 30 ° (Figure 11i). This is because the plate thickness configuration of the AVTHTs can influence the deformation process under the same loading angle and pattern.
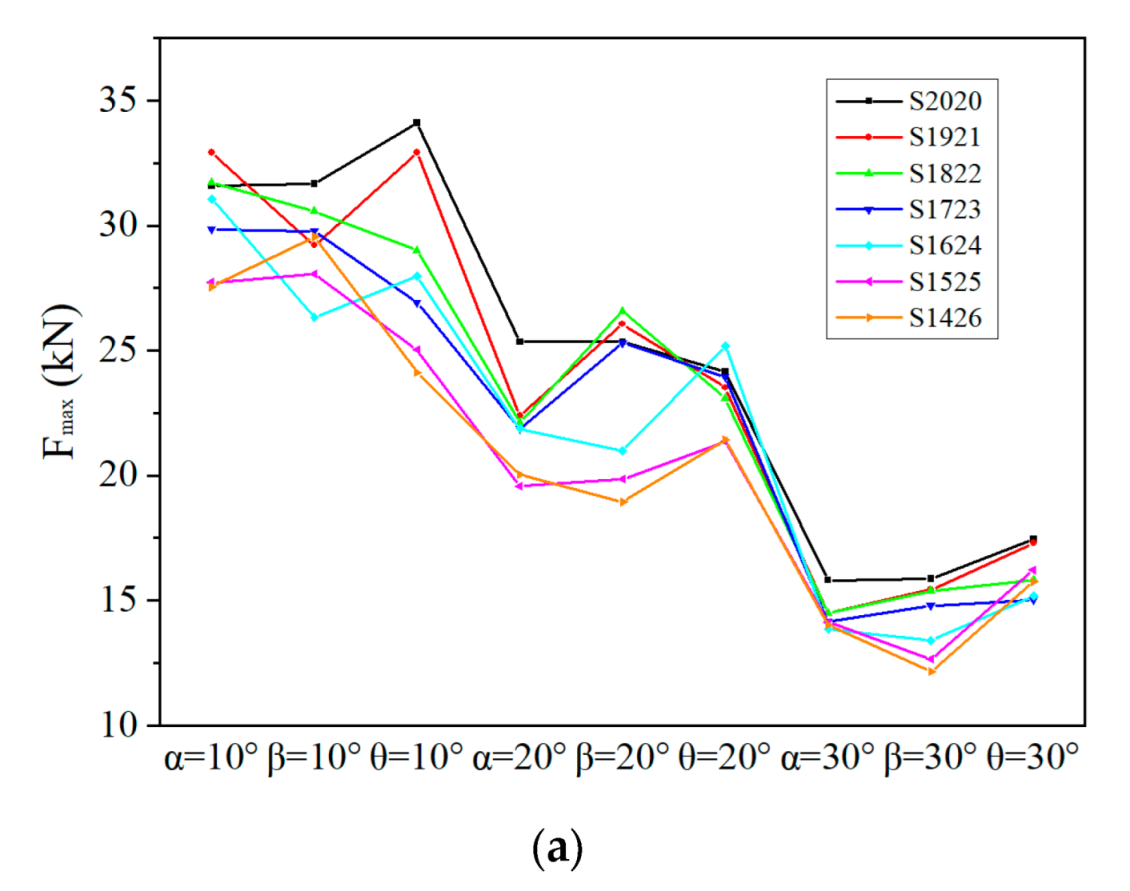
The results of Fmax, SEA, and CFE with various loading angles and patterns are obtained by simulations, as shown in Figure 12. For the index of Fmax, the values decrease as the loading angle increases. When the tubes are under certain loading angles, the loading patterns and the plate thickness configuration can have an effect on the Fmax. For example, the Fmax of S2020 is increased from 31.574 kN with α = 10 ° to 34.096 kN with θ = 10 ° ; however, the Fmax of S1822 is decreased from 31.7314 kN with α = 10 ° to 28.9937 kN with θ = 10 ° . The Fmax of the tubes under α = 30 ° are considerable close. This indicates that the loading patterns have different effects on different tubes.
As the loading angle increases, SEA generally shows the same changing trend, compared with Fmax. For each tube, the SEA value is generally decreased with the difference of plate thickness increasing when the loading angle is 10°. A similar situation also occurs when α = 30 ° . Note that the SEA could not decrease with the difference of the plate thickness increasing under other loading angles and patterns, such as β = 20 ° and θ = 20 ° . For example, S1624 shows a higher SEA than S2020. This suggests that when an AVTHT is under a certain loading angle and pattern, changing the thickness configuration can improve the SEA. The CFE shows the maximal values when the loading angle is 10°, and the general CFE values under a loading angle of 20° are lower than those under a loading angle of 30°. The different tubes showed different changes, with the loading patterns changing under the same loading angle. The CFE of S1921 is decreased from 0.511 ( α = 20 ° ) to 0.426 ( θ = 20 ° ); the CFE of S1525 is increased from 0.521 ( α = 20 ° ) to 0.678 ( θ = 20 ° ).
Overall, AVTHTs under various loading angles (0°, 10°, 20°, and 30°) and patterns exhibit different deformation modes, force-displacement characteristics, and crashworthiness indices. Changing the plate thickness configuration could change the crushing performance of AVTHTs under axial and oblique loadings.

3.4. Optimization Results and Discussion

Table 6 shows the details of the validation of the surrogate model method. In general, the model has acceptable accuracy and can be used for subsequent optimization.
Using the MOGA, Pareto fronts are obtained and shown in Figure 13. The values of −SEAw and Fmaxw are negatively correlated for AVTHTs, which indicates that an increase in SEAw (decrease of −SEAw) leads to an increase in the Fmaxw. Because the two objectives are normalized values and cannot represent actual values, the pareto fronts are just meaningful for us to select appropriate thickness configurations. For example, if we prefer to design an AVTHT with the best performance for SEAw, the leftmost point (Figure 13a) is selected, and then we use the corresponding t1 to perform the simulation under all loading cases. Thus, we can investigate the specific crashworthiness performance of this design. Moreover, Figure 13b,c shows the curves of Fmaxw vs. t1 and SEAw vs. t1, and it can help us to determine more clearly which thickness configurations should be avoided in the design. For example, the rangs of 1.55 t 1 1.6 , 1.85 t 1 1.95 should not be the design domain. In the pareto results, increasing t1 would not always increase the Fmaxw and SEAw. For example, when 1.75 t 1 1.8 , increasing t1 would lead to decline of Fmaxw and SEAw.
In conclusion, the AVTHTs can basically achieve lower Fmaxw and higher SEAw levels with optimum designs. Certain considerable design thickness configurations can be obtained from the optimization results, which may be a way to achieve the excellent crushing performance of AVTHTs.

4. Conclusions

In this study, we proposed an AVTHT and investigated its crushing performance under axial loading and multiple oblique loadings. By performing simulations and experiments on four configurations of AVTHTs under axial loading, we validated the FE models. Then, we investigated the crushing performance of AVTHTs with various thickness configurations, loading angles, and loading patterns by the FE models. Finally, the crashworthiness MOD was adopted to minimize Fmaxw and maximize SEAw using the MOGA. Conclusions can be drawn as follows:
  • The manufactured AVTHTs could exhibit a progressive deformation mode with generating folds under axial loading, whether in experiments or simulations;
  • AVTHTs under several types of loading angles (0°, 10°, 20°, and 30°) and patterns exhibited different deformation modes, as well as force-displacement characteristics and crashworthiness indices. The changing of plate thickness configuration could change the crushing performance of AVTHTs under axial and oblique loadings;
  • The results of optimization determined the thickness of the design domains and indicated that a certain thickness range should be avoided, such as the ranges of 1.55 t 1 1.6 and 1.85 t 1 1.95 . In the pareto results, increasing t1 would not always increase the Fmaxw and SEAw. For example, when 1.75 t 1 1.8 , increasing t1 would lead to decline of Fmaxw and SEAw.
Together, the research studied the crushing performance of AVTHTs under multiple loadings. The optimization results could provide a good design domain for AVTHTs, which is worthy of the remarkable crashworthiness performance of railway vehicles.

Author Contributions

Conceptualization, K.X. and P.X.; methodology, K.X.; validation, J.X.; formal analysis, K.X.; investigation, K.X.; resources, K.X. and S.Y.; data curation, K.X.; writing—original draft preparation, K.X.; writing—review and editing, S.Y.; supervision, Q.H. All authors have read and agreed to the published version of the manuscript.

Funding

This work is supported by the National Key Research and Development Program of China, funding number 2021YFB3703801.

Institutional Review Board Statement

Not applicable.

Informed Consent Statement

Not applicable.

Data Availability Statement

Not applicable.

Conflicts of Interest

The authors declare no conflict of interest. The funders had no role in the design of the study; in the collection, analyses, or interpretation of data; in the writing of the manuscript, or in the decision to publish the results.

References

  1. Xie, S.; Liang, X.; Zhou, H. Design and analysis of a composite energy-absorbing structure for use on railway vehicles. Proc. Inst. Mech. Eng. Part F—J. Rail Rapid Transit 2015, 230, 825–839. [Google Scholar] [CrossRef]
  2. Yao, S.; Li, Z.; Yan, J.; Xu, P.; Peng, Y. Analysis and parameters optimization of an expanding energy-absorbing structure for a rail vehicle coupler. Thin-Walled Struct. 2018, 125, 129–139. [Google Scholar] [CrossRef]
  3. Xu, P.; Yang, C.; Peng, Y.; Yao, S.; Zhang, D.; Li, B. Crash performance and multi-objective optimization of a gradual ener-gy-absorbing structure for subway vehicles. Int. J. Mech. Sci. 2016, 107, 1–12. [Google Scholar] [CrossRef]
  4. Lin, Y.; Min, J.; Li, Y.; Lin, J. A thin-walled structure with tailored properties for axial crushing. Int. J. Mech. Sci. 2019, 157–158, 119–135. [Google Scholar] [CrossRef]
  5. Xie, S.; Zhou, H. Analysis and optimisation of parameters influencing the out-of-plane energy absorption of an aluminium honeycomb. Thin-Walled Struct. 2015, 89, 169–177. [Google Scholar] [CrossRef]
  6. Yang, C.; Xu, P.; Yao, S.; Xie, S.; Li, Q.; Peng, Y. Optimization of honeycomb strength assignment for a composite ener-gy-absorbing structure. Thin-Walled Struct. 2018, 127, 741–755. [Google Scholar] [CrossRef]
  7. Ali, M.; Ohioma, E.; Kraft, F.; Alam, K. Theoretical, numerical, and experimental study of dynamic axial crushing of thin walled pentagon and cross-shape tubes. Thin-Walled Struct. 2015, 94, 253–272. [Google Scholar] [CrossRef]
  8. Altin, M.; Kılınçkaya, Ü.; Acar, E.; Guler, M. Investigation of combined effects of cross section, taper angle and cell structure on crashworthiness of multi-cell thin-walled tubes. Int. J. Crashworth. 2017, 24, 121–136. [Google Scholar] [CrossRef]
  9. Zhang, X.; Zhang, H. Experimental and numerical investigation on crush resistance of polygonal columns and angle elements. Thin-Walled Struct. 2012, 57, 25–36. [Google Scholar] [CrossRef]
  10. Chen, D.-H.; Masuda, K. Crushing Behavior of Thin-Walled Hexagonal Tubes with Partition Plates. ISRN Mech. Eng. 2011, 2011, 503973. [Google Scholar] [CrossRef] [Green Version]
  11. Li, W.; Luo, Y.; Li, M.; Sun, F.; Fan, H. A more weight-efficient hierarchical hexagonal multi-cell tubular absorber. Int. J. Mech. Sci. 2018, 140, 241–249. [Google Scholar] [CrossRef]
  12. Qiu, N.; Gao, Y.; Fang, J.; Feng, Z.; Sun, G.; Li, Q. Theoretical prediction and optimization of multi-cell hexagonal tubes under axial crashing. Thin-Walled Struct. 2016, 102, 111–121. [Google Scholar] [CrossRef]
  13. Zou, X.; Gao, G.-J.; Dong, H.-P.; Li, J.; Zhou, X.-S.; Chen, W.; Guan, W.-Y. Crushing analysis and multi-objective optimization of bitubular hexagonal columns with ribs. J. Cent. South Univ. 2017, 24, 1164–1173. [Google Scholar] [CrossRef]
  14. Xu, K.; Xu, P.; Yang, C.; Wang, T.; Li, B.; Che, Q.; Yao, S.; Huang, Q. Crashworthiness optimisation for the rectangular tubes with axisymmetric and uniform thicknesses under offset loading. Struct. Multidiscip. Optim. 2020, 62, 957–977. [Google Scholar] [CrossRef]
  15. Xu, P.; Wang, D.; Yao, S.; Xu, K.; Zhao, H.; Wang, S.; Guo, W.; Li, B. Multi-objective uncertain optimization with an ellipsoid-based model of a centrally symmetrical square tube with diaphragms for subways. Struct. Multidiscip. Optim. 2021, 64, 2789–2804. [Google Scholar] [CrossRef]
  16. Zhang, X.; Zhang, H. Crush resistance of square tubes with various thickness configurations. Int. J. Mech. Sci. 2016, 107, 58–68. [Google Scholar] [CrossRef]
  17. Ahmad, Z.; Thambiratnam, D.; Tan, A. Dynamic energy absorption characteristics of foam-filled conical tubes under oblique impact loading. Int. J. Impact Eng. 2010, 37, 475–488. [Google Scholar] [CrossRef]
  18. Alkhatib, S.E.; Tarlochan, F.; Hashem, A.; Sassi, S. Collapse behavior of thin-walled corrugated tapered tubes under oblique impact. Thin-Walled Struct. 2018, 122, 510–528. [Google Scholar] [CrossRef]
  19. Azarakhsh, S.; Ghamarian, A. Collapse behavior of thin-walled conical tube clamped at both ends subjected to axial and oblique loads. Thin-Walled Struct. 2017, 112, 1–11. [Google Scholar] [CrossRef]
  20. Chen, Y.; Bai, Z.; Zhang, L.; Wang, Y.; Sun, G.; Cao, L. Crashworthiness analysis of octagonal multi-cell tube with functionally graded thickness under multiple loading angles. Thin-Walled Struct. 2017, 110, 133–139. [Google Scholar] [CrossRef] [Green Version]
  21. Zhang, Y.; Sun, G.; Xu, X.; Li, G.; Li, Q. Multiobjective crashworthiness optimization of hollow and conical tubes for multiple load cases. Thin-Walled Struct. 2014, 82, 331–342. [Google Scholar] [CrossRef]
  22. Li, Z.; Ma, W.; Xu, P.; Yao, S. Crashworthiness of multi-cell circumferentially corrugated square tubes with cosine and triangular configurations. Int. J. Mech. Sci. 2019, 165, 105205. [Google Scholar] [CrossRef]
  23. Yao, S.; Tian, Y.; Li, Z.; Yang, F.; Xu, P. Crushing characteristic of polygonal tubes with hierarchical triangular cells. Thin-Walled Struct. 2020, 157, 107031. [Google Scholar] [CrossRef]
  24. Li, Z.; Yao, S.; Ma, W.; Xu, P.; Che, Q. Energy-absorption characteristics of a circumferentially corrugated square tube with a cosine profile. Thin-Walled Struct. 2019, 135, 385–399. [Google Scholar] [CrossRef]
  25. Feng, Z.; Xie, S.; Ma, W.; Jing, K.; Wang, H. Multi-tube energy-absorbing structures with different matching patterns of heights and diaphragm spacings. Alex. Eng. J. 2022, 61, 11111–11127. [Google Scholar] [CrossRef]
  26. Yao, S.; Li, Z.; Ma, W.; Xu, P. Crashworthiness analysis of a straight-tapered shrink tube. Int. J. Mech. Sci. 2019, 157–158, 512–527. [Google Scholar] [CrossRef]
  27. Xing, J.; Xu, P.; Yao, S.; Zhao, H.; Zhao, Z.; Wang, Z. Study on the layout strategy of diaphragms to enhance the energy absorption of thin-walled square tubes. Structures 2021, 29, 294–304. [Google Scholar] [CrossRef]
  28. Li, Z.; Ma, W.; Yao, S.; Xu, P. Crashworthiness performance of corrugation- reinforced multicell tubular structures. Int. J. Mech. Sci. 2020, 190, 106038. [Google Scholar] [CrossRef]
  29. Nia, A.A.; Parsapour, M. Comparative analysis of energy absorption capacity of simple and multi-cell thin-walled tubes with triangular, square, hexagonal and octagonal sections. Thin-Walled Struct. 2014, 74, 155–165. [Google Scholar] [CrossRef]
  30. Fan, Z.; Lu, G.; Liu, K. Quasi-static axial compression of thin-walled tubes with different cross-sectional shapes. Eng. Struct. 2013, 55, 80–89. [Google Scholar] [CrossRef]
  31. Li, W.; Zhang, B.; Fan, H. Crushing Behaviors of Fractal Hexagonal Tubular Structures: Experiments and Plastic Analysis. Acta Mech. Solida Sin. 2019, 32, 713–724. [Google Scholar] [CrossRef]
  32. Ying, L.; Dai, M.; Zhang, S.; Ma, H.; Hu, P. Multiobjective crashworthiness optimization of thin-walled structures with func-tionally graded strength under oblique impact loading. Thin-Walled Struct. 2017, 117, 165–177. [Google Scholar] [CrossRef]
  33. Yang, S.; Qi, C. Multiobjective optimization for empty and foam-filled square columns under oblique impact loading. Int. J. Impact Eng. 2013, 54, 177–191. [Google Scholar] [CrossRef]
  34. Djamaluddin, F.; Abdullah, S.; Ariffin, A.; Nopiah, Z. Optimization of foam-filled double circular tubes under axial and oblique impact loading conditions. Thin-Walled Struct. 2015, 87, 1–11. [Google Scholar] [CrossRef] [Green Version]
  35. Xu, P.; Xing, J.; Yao, S.; Yang, C.; Chen, K.; Li, B. Energy distribution analysis and multi-objective optimization of a gradual energy-absorbing structure for subway vehicles. Thin-Walled Struct. 2017, 115, 255–263. [Google Scholar] [CrossRef]
  36. Zhu, G.; Wang, Z.; Cheng, A.; Li, G. Design optimisation of composite bumper beam with variable cross-sections for automotive vehicle. Int. J. Crashworth. 2016, 22, 365–376. [Google Scholar] [CrossRef]
  37. Zhang, Y.; Ge, P.; Lu, M.; Lai, X. Crashworthiness study for multi-cell composite filling structures. Int. J. Crashworth. 2017, 23, 32–46. [Google Scholar] [CrossRef]
  38. Shan, S.; Wang, G.G. Metamodeling for High Dimensional Simulation-Based Design Problems. J. Mech. Des. 2010, 132, 051009. [Google Scholar] [CrossRef] [Green Version]
  39. Xie, S.; Li, H.; Yang, C.; Yao, S. Crashworthiness optimisation of a composite energy-absorbing structure for subway vehicles based on hybrid particle swarm optimisation. Struct. Multidiscip. Optim. 2018, 58, 2291–2308. [Google Scholar] [CrossRef] [Green Version]
  40. Xie, S.; Li, H.; Yang, W.; Wang, N. Crashworthiness optimisation of a composite energy-absorbing structure for railway vehicles. Struct. Multidiscip. Optim. 2017, 57, 1793–1807. [Google Scholar] [CrossRef]
  41. Yamashita, M.; Hattori, T.; Nishimura, N.; Tange, Y. Quasi-Static and Dynamic Axial Crushing of Various Polygonal Tubes. Key Eng. Mater. 2007, 340–341, 1399–1404. [Google Scholar] [CrossRef]
  42. Li, G.; Zhang, Z.; Sun, G.; Xu, F.; Huang, X. Crushing analysis and multiobjective optimization for functionally graded foam-filled tubes under multiple load cases. Int. J. Mech. Sci. 2014, 89, 439–452. [Google Scholar] [CrossRef]
  43. Li, G.; Zhang, Z.; Sun, G.; Huang, X.; Li, Q. Comparison of functionally-graded structures under multiple loading angles. Thin-Walled Struct. 2015, 94, 334–347. [Google Scholar] [CrossRef]
Figure 1. Location and geometrical details of the AVTHTs: (a) the installation location; (b) specimens; (c) the plate thickness configuration; (d) cross section; (e) thickness configuration of cross section.
Applsci 12 07348 g001
Figure 2. The compression for AVTHTs with various loading patterns: (a) axial loading; (b) along a side with thinner plate; (c) along a side with thicker plate; (d) along a corner.
Applsci 12 07348 g002
Figure 3. Stress-plastic strain curves.
Applsci 12 07348 g003
Figure 4. An experiment with a specimen tube.
Applsci 12 07348 g004
Figure 5. The optimization process.
Applsci 12 07348 g005
Figure 6. The results of the deformation process for simulations and experiments: (a) S2020; (b) S1822; (c) S1624; (d) S1426.
Applsci 12 07348 g006
Figure 7. Energy absorbing curves for simulations and experiments: (a) S2020; (b) S1822; (c) S1624; (d) S1426.
Applsci 12 07348 g007
Figure 8. The simulation results of deformation modes for seven tubes: (a) S2020; (b) S1921; (c) S1822; (d) S1723; (e) S1624; (f) S1525; (g) S1424; (h) Folds.
Applsci 12 07348 g008
Figure 9. Comparison of the force-displacement curves of the AVTHTs under axial loading.
Applsci 12 07348 g009
Figure 10. Deformation modes of the AVTHTs under different under oblique loading.
Applsci 12 07348 g010
Figure 11. Comparison of the force-displacement curves of the AVTHTs under different under oblique loading: (a) α = 10 ° ; (b) β = 10 ° ; (c) θ = 10 ° ; (d) α = 20 ° ; (e) β = 20 ° ; (f) θ = 20 ° ; (g) α = 30 ° ; (h) β = 30 ° ; (i) θ = 30 ° .
Applsci 12 07348 g011
Figure 12. Comparison of the Crashworthiness Indices of the AVTHTs under different under oblique loading: (a) Fmax; (b) SEA; (c) CFE.
Applsci 12 07348 g012aApplsci 12 07348 g012b
Figure 13. Pareto fronts of optimization results: (a) Fmaxw vs. −SEAw; (b) Fmaxw vs. t1; (c) SEAw vs. t1.
Applsci 12 07348 g013
Table 1. Statistical analysis of the results of the tension test.
PropertiesValuesStandard DeviationCoefficient of Variation
Young’s modulus E (GPa)69.07/69.54/70.760.7121.021%
Yield stress σy (MPa)53.78/54.45/53.770.3180.589%
Peak Stress (MPa)138.07/138.19/137.800.1630.118%
Table 2. Material properties of AA6061O.
PropertiesValues
Density ρ (kg/m3)2700
Young’s modulus E (GPa)69.79
Yield stress σy (MPa)54.00
Ultimate stress σu (MPa)163.46
Poisson’s ratio υ0.3
Table 3. Details of the sampling design points and validation points.
Typest1
Sampling design points1.4 1.45 1.5 1.55 1.6 1.65 1.7 1.75 1.8 1.85 1.9 1.95 2
Validation points1.42 1.69 1.74 1.87
Table 4. Details of crashworthiness indices for simulations and experiments.
Tubes Fmax (kN)SEA (kJ/kg)CFE (/)
S2020Simulation results49.727 12.686 0.497
Experiment-1 results49.709 13.628 0.535
Experiment-2 results49.589 13.593 0.534
Average experimental value49.649 13.610 0.535
Standard deviation0.060 0.018 0.000
Coefficient of variation0.121% 0.129% 0.066%
Average error0.157%−6.793% −7.041%
S1822Simulation results46.998 11.227 0.466
Experiment-1 results47.138 11.378 0.471
Experiment-2 results47.343 11.616 0.478
Average experimental value47.240 11.497 0.475
Standard deviation0.102 0.119 0.004
Coefficient of variation0.216% 1.035% 0.764%
Average error−0.513% −2.349% −1.817%
S1624Simulation results47.086 10.884 0.451
Experiment-1 results45.603 10.931 0.467
Experiment-2 results44.342 11.056 0.486
Average experimental value44.972 10.993 0.476
Standard deviation0.631 0.062 0.009
Coefficient of variation1.402% 0.567% 1.992%
Average error4.700% −0.994% −5.349%
S1426Simulation results47.448 10.523 0.432
Experiment-1 results45.607 10.878 0.465
Experiment-2 results43.967 10.899 0.483
Average experimental value44.787 10.889 0.474
Standard deviation0.820 0.011 0.009
Coefficient of variation1.831% 0.097% 1.918%
Average error5.942% −3.357% −8.879%
Table 5. Crashworthiness indices for simulations and experiments.
TubesFmax (kN)SEA (kJ/kg)CFE (/)
S202049.72712.6860.497
S192147.53911.4730.466
S182246.99811.2270.466
S172347.00311.0090.452
S162447.08610.8840.451
S152547.36310.6490.434
S142647.44810.5230.432
Table 6. Accuracy of the surrogate model.
IndicesFmaxw −SEAw
R20.99040.9926
RAAE0.085640.0675
Publisher’s Note: MDPI stays neutral with regard to jurisdictional claims in published maps and institutional affiliations.