Article

Response of Osteoblasts to Electric Field Line Patterns Emerging from Molecule Stripe Landscapes

1
Department Science and Technology of Life, Light and Matter, University of Rostock, Albert-Einstein-Str. 25, 18059 Rostock, Germany
2
Institute of Physics, University of Rostock, Albert-Einstein-Str. 23, 18059 Rostock, Germany
3
Institute of Physics, University of Greifswald, Felix-Hausdorff-Str. 6, 17489 Greifswald, Germany
4
Department of Cell Biology, Rostock University Medical Center, Schillingallee 69, 18057 Rostock, Germany
*
Author to whom correspondence should be addressed.
Appl. Sci. 2022, 12(14), 7329; https://doi.org/10.3390/app12147329
Submission received: 4 July 2022 / Revised: 16 July 2022 / Accepted: 19 July 2022 / Published: 21 July 2022
(This article belongs to the Section Applied Physics General)

Abstract

:
Molecular surface gradients can constitute electric field landscapes and serve to control local cell adhesion and migration. Cellular responses to electric field landscapes may allow the discovery of routes to improve osseointegration of implants. Flat molecule aggregate landscapes of amine- or carboxyl-teminated dendrimers, amine-containing protein and polyelectrolytes were prepared on glass to provide lateral electric field gradients through their differing zeta potentials compared to the glass substrate. The local as well as the mesoscopic morphological responses of adhered osteoblasts (MG-63) with respect to the stripes were studied by means of Scanning Ion Conductance Microscopy (SICM) and Fluorescence Microscopy, in situ. A distinct spindle shape oriented parallel to the surface pattern as well as a preferential adhesion of the cells on the glass site have been observed at a stripe and spacing width of 20 μ m. Excessive ruffling is observed at the spindle poles, where the cells extend. To explain this effect of material preference and electro-deformation, we put forward a retraction mechanism, a localized form of double-sided cathodic taxis.

Graphical Abstract

1. Introduction

In the initial phase, after insertion of joint prostheses, the speed of covering the material surface by adhering osteoblasts is a critical factor in avoiding inflammation. Electric fields can help to aid faster adhesion and spreading of cells. To understand how fields act on cell adhesion behavior in vitro experiments are conducted using electrostimulation chambers. Such chambers are based on a planar resistive electrode with adequate sheet resistance [1] or a design based on a capacitor configuration with vertically arranged graphite electrode pairs arranged in a multi-well plate [2,3]. Moreover, they can be operated at DC or AC.
To check the effect of DC electric fields, it is possible to use intrinsic surface potentials, directly. Most material surfaces, due to electron spill-out, exhibit more or less negative ζ potentials. The ζ potential is the residual unscreened surface potential at the hydrodynamic distance or shear plane. The surface charge can be rendered towards the positive direction by attachment of molecular groups, which bind protons or by cationic dissociable groups. More difficult is the shift of the charge to more negative values than typical materials surfaces. In an aqueous medium, such a proton-binding molecular group is an amine. Amine groups will increase the ζ potential, i.e., the residual surface potential at the hydrodynamic distance. The ζ potentials of surfaces with amine-terminated molecules attached are usually determined in a fluid channel via the streaming current or potential, depending on whether the substrate has conductivity or not [4,5]. At the relevant pH of 7, the ζ potential is raised by more than ≈50 mV upon application of a polyallylamine layer [6,7].
Laterally, a ζ potential difference of 30 mV at the transition between a molecular monolayer and glass, adapting over a distance of two protein diameters (≈10 nm) will already give rise to local electric fields of more than 10 6 V/m. This field is quite localized, but at least three orders of magnitude higher than the fields typically applied or operative in electrotaxis or electrostimulation chambers [8]. It should be noted, that in the literature, the externally applied field is most often given, while the field actually operative in the chamber may be more than 10 times weaker, depending on geometry, ion current, electrode material and medium permittivity [9]. Since the ζ potentials on surfaces are already obtained at the shear plane the respective fields do indeed represent the actual fields.
Molecule landscapes for the purpose of cell adhesion, however, must be as flat as possible, because height differences and asperities would give rise to contact guidance and filopodia formation. The aim is to extract the adhesion response due to the electric fields present between regions with different ζ potential. If the cell responds to more cues at the same time, attribution of effects will stay ambiguous. The smallest topographic trigger was reported to be as shallow as 14 nm for bovine corneal epithelial cells [10]. However, the threshold seems to depend on the specific cell-type. For osteoblasts it appears to be ∼33 nm [11,12], filopodia typically are initiated at sharp corners and already at heights of 30 nm. To achieve molecular landscapes with a smallest possible topographic height, amine- and carboxyl-terminated dendrimers (PAMAM, generation 1 and TMP, generation 1, respectively), bovine serum albumin (BSA) and polyelectrolytes (polystyrene sulfonate (PSS) and polydialyldimethylammonium (PDADMA)) were deposited in a stripe pattern on glass cover slips by direct microcontact printing [13,14]. Natively, albumin is not present in the extracellular matrix (ECM). We wish to mention that albumin is not fully innocent. It mainly occurs in the blood where it has the task to aid thromboresistance by passivating blood vessel surfaces and suppressing platelet adhesion and fibrinogen adsorption. In non-native environments, it can also promote cell adhesion or be innocent [15,16,17,18]. For osteoblast-like cells, enhanced adhesion on BSA is observed compared to heat-denatured BSA [19], which can be further increased if the BSA is treated with Ca. The dendrimers are synthetic, and in principle they can damage the cell membrane or even enter the cell. However, this is unlikely at diameters as small as chosen here [20].
Studies with MG-63 osteoblasts on homogeneous amine-terminated molecular layers revealed superior adhesion performance, i.e., the largest adhesion areas and the most vital intracellular Ca 2 + mobilization on plasma-polymerized polyallylamine and (3-Aminopropyl)triethoxysilane (APTES), in comparison to natively oxidized Ti surfaces [7].
Regarding morphological studies on cell adhesion to surfaces with molecular stripe patterns, the question arises whether topographic or biochemical cues dominate. Therefore, a decisive parameter is the height of the stripes, which is often not explicitly given. In case of few 10 nm high stripes, additionally to a preference for ECM materials, contact guidance can play a role. Most studies use ECM species for stripe patterns, where the cell adhesion behavior is governed by the strong affinity to anchor, even at large topographic heights. Though the situation is distinct from our study, where we aim to explore other types of mechanisms and use “innocent molecular species” for stripe patterns, we provide a brief summary of findings on stripe patterns with ECM species [21,22,23,24,25,26,27,28]: Spindle shapes and alignment of fibroblasts inbetween fibronectin island rows have been observed [23]. The islands appear to be quite high, since only the template underneath has been prepared by microcontact printing. Similarly, 2 μ m fibronectin stripes with varying spacing gave rise to elongation and directional migration of fibroblasts in terms of contact guidance [25]. REF52 fibroblasts prefer adhesion on fibronectin stripes, inbetween non-adhesive Polyethylene glycol (PEG) stripes, particularly if the PEG stripe width exceeds 8 μ m [29]. Since the fibronectin is adsorbed to photolithographically prepared Au structures, these regions may protrude. Extremely high structures (pillars) lead to reduced adhesion area, in terms of formation of bridges and traction forces [27]. Muscle cells and murine myoblasts adhered to microprinted, assumingly flat, stripes of fibronectin or lamilin took the characteristic spindle shape and aligned [22,28]. Human vena saphena cells, at large stripe distances, also adhere to fibronectin stripes and adopt a spindle shape [21]. Non-adhesive (hydrophobic) and adhesive stripes have been constituted by methyl termination and untreated regions of fused quartz, respectively, fabricated photo-lithographically [24]. The height differences should be in the region of the dimension of one methyl group, thus below one nanometer. Beyond 24 μ m stripe period a spindle shape and orientation have been observed with hamster (BHK) and canine (MDCK) kidney cells [24]. An interesting option is backfilling inbetween ECM stripes by other materials such as poly-l-lysine (PLL) or PLL-polyethylglycol [26]. PLL has positive charges, and the observation is that cells adhere to ECM stripes with the typical spindle shape and orientation. ECM protein species, such as collagen or fibronectin allow biochemical adhesion, i.e., expression of focal adhesion points, so that one may expect, that with these species any electric field effects or other physical cues are overruled.
In electric DC fields live cells, with their negative ζ potential, often migrate towards the cathode, thus in the direction of the electric field [30,31]. Dead systems, such as lipid vesicles with negative ζ potential, will drift opposite to the electric field E (thus towards the anode). The speed of electrophoresis [32] is v = ϵ 0 ϵ ζ E / η with ϵ 0 denoting the permittivity of vacuum, ϵ the relative permittivity of the medium, and η its viscosity. Thus, live cells most often move opposite to electrophoresis. Electrophoresis is a passive process, while cell migration is active. The directions of electrotaxis may be related to the wound potential, which is negative. In the case of bone tissue, the migration behavior of osteoblasts and osteoclasts appears compatible with the aim to drive bone remodeling at wounds towards excess mineralization [31].

2. Materials and Methods

2.1. Preparation of PDMS Stamps

Polydimethylsiloxane (PDMS) molds were produced by mixing the Sylgard 184 elastomer (Biesterfeld Spezialchemie, Hamburg, Germany) with the curing agent at a weight ratio of 10:1. The mixture was then poured over 1 × 1 cm 2 glass masters (Center for Microtechnologies, Technical University of Chemnitz, Chemnitz, Germany) in a Petri dish. Afterwards, it was placed under vacuum to remove air bubbles. Curing of the PDMS took place in an oven (Universal Oven UF30, Memmert, Schwabach, Germany) at 40 C for 24 h. Afterwards, the PDMS was peeled off the glass masters and cut into molds with ≈1 × 1 cm 2 base area.

2.2. Microcontact Printing of Molecules on Glass

To transfer molecules to the PDMS stamps they were immersed for 24 h in 0.15 mM bovine serum albumin (BSA), 1.4 mM amine dendrimer (PAMAM generation 1, Sigma-Aldrich, St. Louis, MO, USA), 1.5 mM carboxyl dendrimer (Polymer Factory, Stockholm, Sweden), 1 mM polystyrene sulfonate (PSS) (Polymer Standard Service, Mainz, Germany) (molecular weight: 14.9 kDa) and 1 mM polydialyldimethylammonium (PDADMA) (Polymer Standard Service, Mainz, Germany) (molecular weight: 35 kDa) solutions, respectively. For the polyelectrolytes (PSS and PDADMA) 100 mM NaCl was used as a solvent while for the other molecules double-distilled water was sufficient.
The immersed PDMS stamps were shortly rinsed with double-distilled water and afterwards dried with nitrogen gas before bringing them into contact with glass slides to transfer the respective molecules (see Figure 1).
Borosilicate glass coverslips with dimensions of 22 × 22 mm 2 (Menzel cover slips, VWR International, Darmstadt, Germany) served as samples. Prior to the printing process, they were cleaned with isopropanol in an ultrasonic bath for 10 min. Subsequently, they were dried and treated with ozone for 60 min in a UV-ozone cleaner (Novascan Technologies, Ames, IA, USA) to remove organic residuals and to make the sample more hydrophilic.

2.3. SICM & AFM Topography Measurements

For Atomic Force Microscopy and Scanning Ion Conductance Microscopy measurements, a commercial AFM/SICM (NX-bio, Park Systems, Suwon, South Korea) was used. Regarding AFM, the samples were measured in Non-contact-mode (also referred to as dynamic mode) with ACTA cantilevers (nominal spring constant: 37 N/m) (AppNano, Mountain View, CA, USA) at ambient conditions (in air). SICM measurements of the molecular patterns were performed in phosphate-buffered saline (PBS) (ROTI Cell PBS, Carl Roth, Karlsruhe, Germany) at room temperature in a continuous scanning mode, meaning the ion current was held constant while scanning. For measurements of the cell morphology at the poles, the scan mode was switched to an approach–retract scheme. Here, the pipette reapproaches the sample for every measurement point and retracts before moving to the next one. This ensures the integrity of the nanopipette and cells since the ion current is only sensitive to vertical approaches. Any measurements were performed with the slow scan direction from bottom to top. The pipette and bath electrodes were non-polarizable (Ag/AgCl). A bias voltage of ≈100 mV was applied between them (pipette electrode being grounded). The nanopipettes with opening diameters of ≈50 nm were produced by heating borosilicate capillary tubes (inner diameter 0.58 mm) with a CO 2 laser puller (Sutter P-2000, Sutter Instrument, Novato, CA, USA). The program parameters were: Heat: 260, Filament: 4, Velocity: 50, Delay: 225, and Pull: 140.

2.4. Cell Culture

To study cellular responses to the molecular landscapes, human osteoblast-like cells of the cell line MG-63 (American Type Culture Collection ATCC®, CRL1427™, Bethesda, MD, USA) were used. Culturing was performed under humidified conditions at 37 C and 5% CO 2 atmosphere in Dulbecco’s modified Eagle’s medium (DMEM, 31966-021, Life Technologies Limited, Paisley, UK) with 10% fetal calf serum (FCS, Biochrom FCS Superior, Merck, Darmstadt, Germany) and 1% antibiotics (Gentamicin, Ratiopharm, Ulm, Germany). The μ CP glass slides were immersed for 10 min in PBS before seeding cells with a density of 4000/cm 2 and culturing them for 24 h. For SICM-topography measurements, the cells were fixed by applying 4% paraformaldehyde (Sigma-Aldrich, MO, USA) for 10 min at room temperature.

2.5. Fluorescence Microscopy

Fluorescence (UV-filter cube) microscopy (Olympus IX73, Tokio, Japan) was performed under atmospheric conditions to ensure the successful molecule transfer and the integrity of the molecule landscape on the macroscopic scale. After seeding, the response of the cells as well as the molecular layers (via GFP (green fluorescent protein)-filter cube) were observed optically in situ (Nikon ECLIPSE Ti-U, Tokio, Japan). Due to low auto-fluorescence intensity of the molecular layers (BSA and Polyamidoamine (PAMAM)) the culture medium was replaced by isotonic 4-(2-hydroxyethyl)-1-piperazineethanesulfonic acid buffer (HEPES) [33].

2.6. Statistics

Student’s t-tests with the software GraphPad Prism version 8.0 for Windows (GraphPad Software, La Jolla, CA, USA) were performed for the respective two groups (unoriented vs. oriented cells and glass- vs. molecule-monolayer-adhered cells). The differences on p-values < 0.05 were considered significant. The cell preference results are presented in mean ± sem (standard error of the mean).

3. Results and Discussion

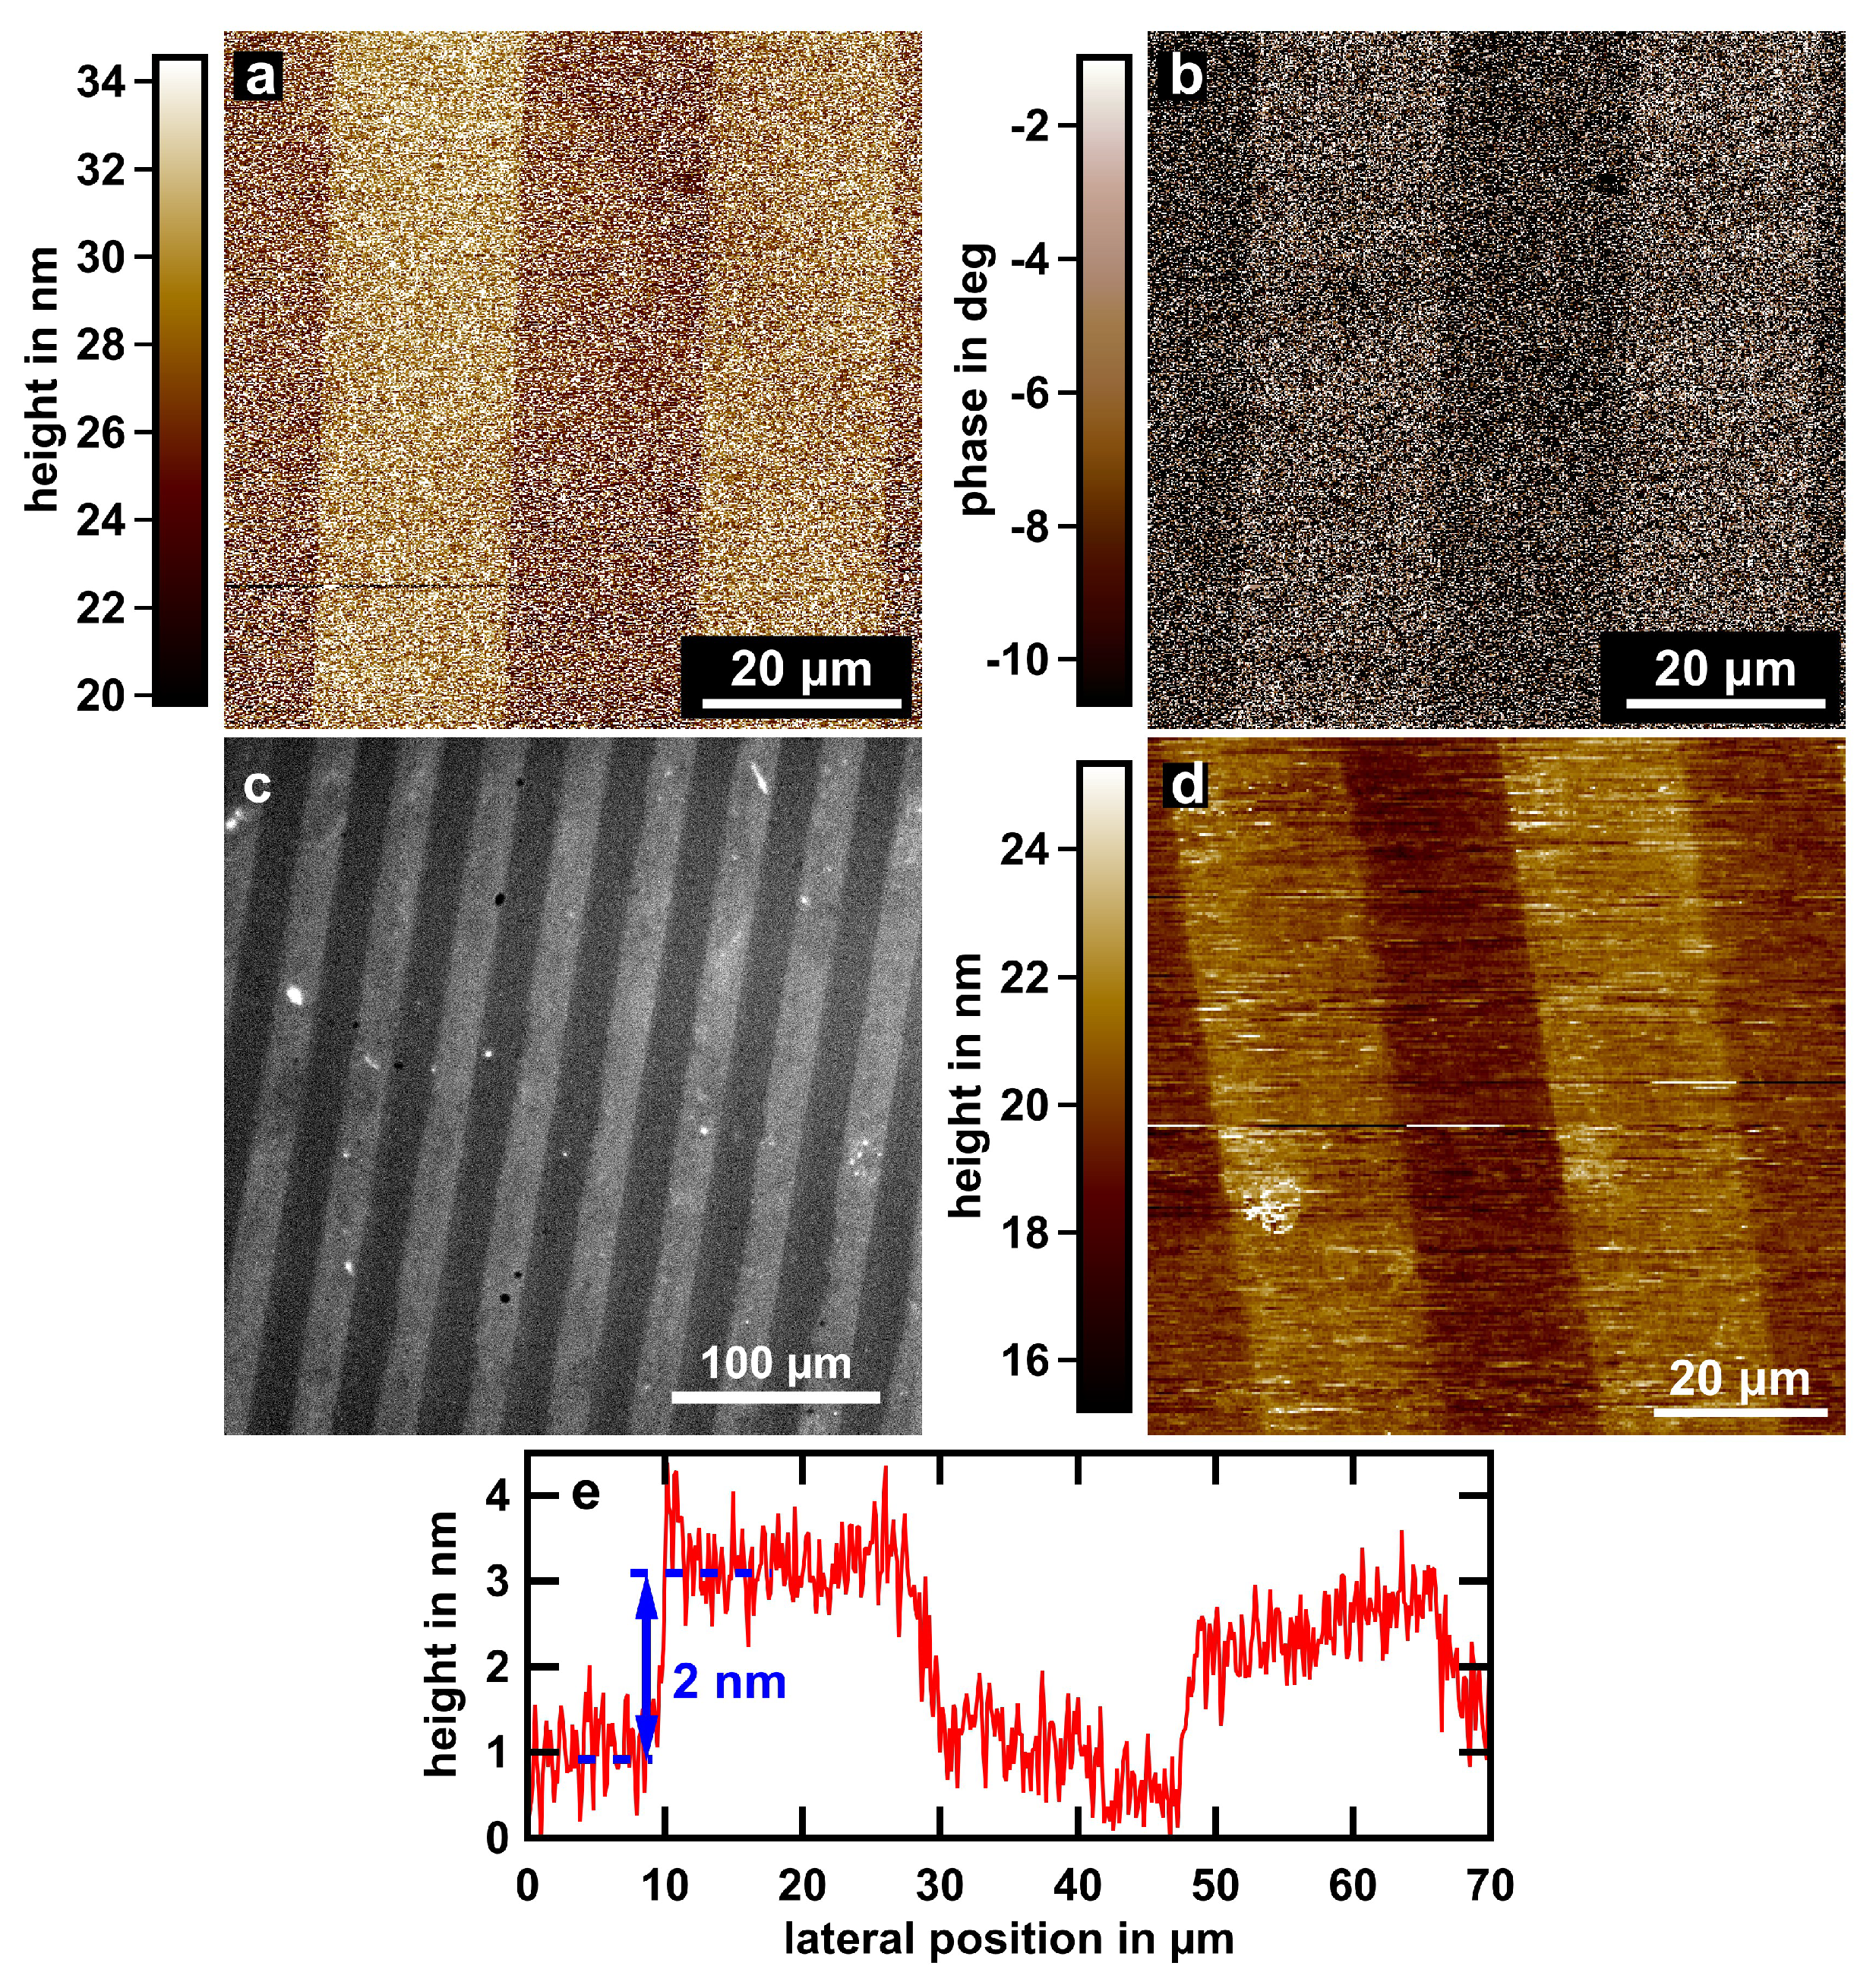
3.1. Characterization of Molecular Stripe Patterns

The mesoscopic characterization of the stripes was performed by fluorescence microscopy since we noticed a rather faint luminescence of the various molecules. We attribute this effect to aggregation-induced emission [34]. An example of the amine-dendrimer can be seen in Figure 2c. For these amine-terminated dendrimers as well as the other molecule types we noticed a homogeneous fluorescence intensity. This points to uniform molecular stripes that only occasionally show defects. The topography of the various μ CP samples on cover slip glass slides was characterized by AFM to ensure the low stripe height so that contact guidance will not play a role when seeding cells on. A representative AFM image of amine-dendrimer stripes is shown in Figure 2a. The topographic height of the stripes turns out to be 2 nm from the averaged line profile (see Figure 2e).
Compared to the apparent root mean square roughness of the topographically lower stripe areas ( R r m s 10 nm, which we attribute to the glass substrate) the roughness of the molecular stripes is lower (≈9 nm). This in addition to the homogeneous distribution of the high (white) spots in Figure 2a indicates that they result from the bare glass substrate and that we achieved homogeneous monolayer stripe patterns of amine-dendrimers by μ CP. The corresponding AFM phase image (Figure 2b) shows a lower absolute phase value at topographically high positions, revealing that the molecules indeed cover only 20 μ m wide stripes, and in between these stripes the bare glass substrate is still visible.
To validate the integrity of the molecular layers in liquid (PBS) we performed SICM measurements. The stripe-patterned molecular layers stayed intact and in case of the amine-dendrimer heights of 2 nm (see Figure 2d) were measured which is similar in ambient conditions. It should be noticed that the sample appears to have a lower roughness ( R r m s 2 nm) in liquid. This is due to the lower lateral resolution of the SICM (≈50 nm) compared to AFM (a few nm) [35,36]. The height analysis was conducted for the various molecule types. The results are shown in Table 1. The AFM-data correspond well to the respective molecule monolayer heights [37,38,39]. All measured heights fall in the regime between 0.5 and 4 nm. Interestingly, the heights of the molecular layers differ by up to a factor of three between AFM and SICM measurements. The deviations can stem for several reasons. In ambient conditions (air), which were present for AFM-measurements it is well known that a thin film of water adsorbs onto the surface. The film is usually not measured by AFM but might lead to a swelling behavior of the molecule-films. In contrast, SICM is performed in liquid (PBS) containing a number of dissolved salt species. The molecule layers might be ion-conductive, leading to a higher ionic current and, therefore, an artificially lower measured height of the stripe patterns by SICM. This effect seems neither applicable to the COOH-terminated dendrimer and PSS nor other dominating effects present. The swelling in liquid environment is especially known for polyelectrolytes and results in a few multilayers in height changes of a few nanometers [40]. However, the swelling is usually ≈30% and the effect noticed here is larger. More likely there are only weak binding sites formed between the negatively charged PSS and glass, so polymer fragments protude out into the liquid (loops and tails). This would explain the layer thickness increase in liquid. In contrast, layers of positively charged molecules (e.g., PDADMA) are equally thin or thinner in liquid compared to bare atmosphere because the positive monomers are electrostatically attracted to the glass.
The rectifying behavior of the ion current through a nanopipette due to the different ζ potentials of the molecular layer and glass can be neglected here, since the Debye length is ≈0.7 nm in high ionic environment (PBS) [41]. The edge sharpness of the stripes is in the regime of 25 nm according to AFM measurements at the transition between glass and stripe.

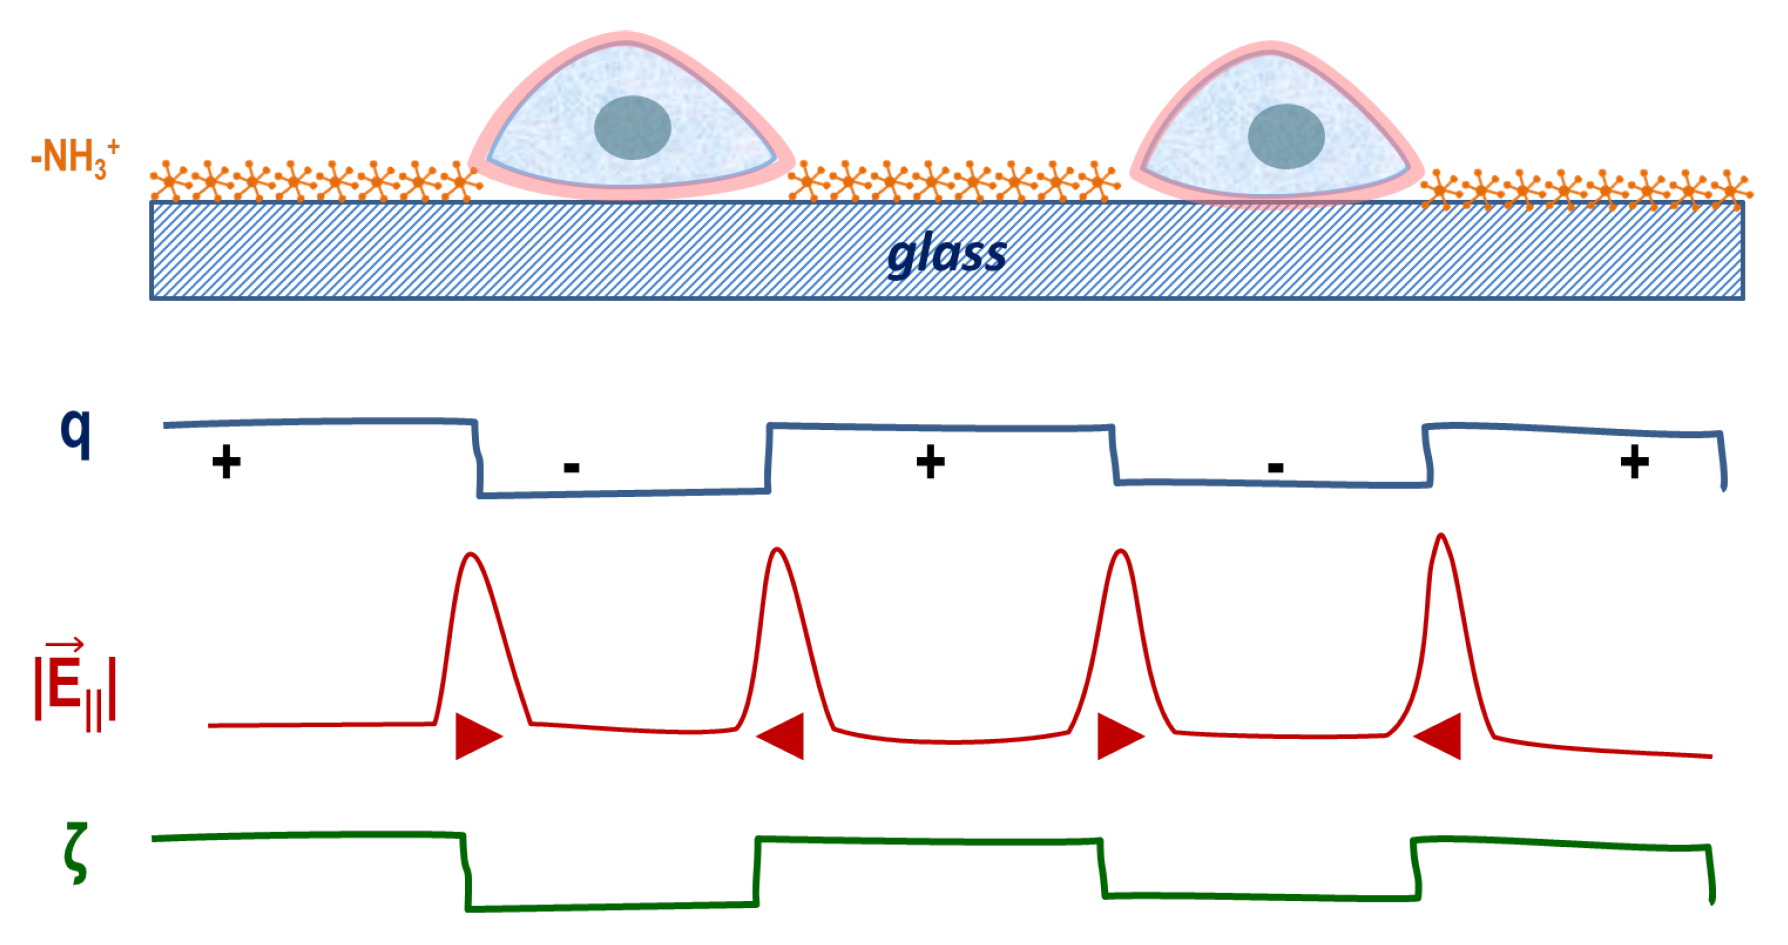
3.2. Cell Response to Molecular Landscapes

MG-63 osteoblastic cells were seeded on BSA and NH 2 -terminated dendrimer printed glass samples and incubated for 24 h, allowing them to adhere and migrate to preferred locations. Subsequently, the cell culture medium was exchanged by HEPES to localize the molecular stripes by luminescence (GFP-filtercube).
In areas where molecular stripe patterns were present, a significant amount of single cells ((89 ± 3)% for BSA and (78 ± 6)% for NH 2 -dendrimer-samples) adopted a distinct spindle shape, aligning parallel to the stripes (Figure 3). This observation remained true only when cells were separated from each other. In case of connected cells (e.g., via filopodia) the response to the molecular patterns seemed to be largely absent. Furthermore, the cells were often randomly oriented and did not necessarily maintain a spindle shape.
Taking only separated cells into account, we noticed a significant adhesion preference onto glass sites (see Figure 4). While for the BSA-samples (87 ± 5)% of single cells residing on glass, the preference seemed to be sightly lower in case of PAMAM-samples with (70 ± 5)%.
We can exclude that this observation is due to different adhesion probabilities on glass or flat molecule layers. When we offered a flat unstructured layer of BSA or NH 2 -terminated dendrimer, the glass preference vanished. A similar amount of cells were then found on the glass and molecule site after 24 h incubation (see Figure 5). This may also serve to dispel doubts with respect to the fact that albumin is not fully innocent in terms of adhesion [15,16,17,18]. The apparent glass preference when molecular layers are offered in the direct vicinity of cells is not explainable by means of ζ potentials of the different species: the potential of glass is strongly negative (≈−80 mV), BSA films on glass raise its potential by a few 10 mV. The amine groups of the dendrimer exposed to aqueous medium tend to bind a proton and become positively charged, resulting in a positive ζ potential of 22 mV [42]. This would give rise to a preference to the molecular layers since ζ potentials in the regime around 0 mV are favourable for MG-63 activity [7]. Especially on larger, covalently bound NH 2 terminated dendrimers (gen. 5) the osteoblasts exhibited tight cell attachment with well-organized actin stress fibers and well-spread morphology [42]. However, if a chemical gradient would be operative, the cells could sense and mistake/regard the amine for presence of cells or extracellular matrix. In terms of (pseudo-)tissue formation priority, i.e., swiftly covering a surface, it would make sense, that cells fill voids, i.e., the space inbetween the molecule stripes. The observation of mini-tissue, i.e., accumulation of two or more cells, that did not reside on the glass site supports this scenario. The UV-ozone pre-treatment of the glass slides as a reason for the cell response could be excluded since experiments without treatment yielded similar results.
Contact guidance occurs beyond a threshold of ≈33 nm deep grooves [11,12] for osteoblasts. For fibroblasts, the threshold for contact guidance was reported to be 35 nm with groove structures at 1:1 pitch ratio [11]. Therefore, we regard contact guidance as an unlikely process in our experiment since our structures are less than 4 nm in height. We suggest that the different ζ potentials between glass and the respective molecular layer give rise to a horizontal electric field localized at the molecule-glass transition lines. Considering the low distance over which the electric potential drops (e.g., roughly assuming twice the molecule diameter), the electric field already amounts to the order of 10 6 V/m. Such high field strengths are usually not present in conventional electric chambers [8,43]. In case of the BSA and NH 2 -terminated dendrimer landscapes, the electric field vectors would point in-plane, perpendicularly from the stripe edges towards the glass site, which is the retraction (or deformation) direction of osteoblastic cells in our experiments (see Figure 6). Often, mammalian cells appear to show cathodic taxis [30,31], among them are keratinocytes [44], neuronal growth cones [45], meniscus cells [46], and SaOS-2 osteoblast-like cells [43,47]. Some cell types show anodic taxis, e.g., osteoclasts [43] and dermal fibroblasts [44]. Furthermore primary, patient-derived osteoblasts [48] and calvarial osteosarcoma osteoblasts [47] show anodic taxis. A paucity of literature exists on the behavior of the osteosarcoma cell line MG-63 [8,9]. This type of osteoblastic cell appears not to migrate to one or the other electrode, however, MG-63 adopts a crescent shape with the convex side towards the cathode [8], as has also been observed for migrating RCJ.1.20 osteoblastic cells [43]. This may possibly represent an attempt to minimize electric potential differences along the cell body. This is in agreement with our observation, since the cells adhered along the glass and thus avoided the horizontal electric field at the glass–molecule interface.
To corroborate that the glass preference is due to electro-deformation, we assessed the cell response to COOH-terminated dendrimers, PDADMA and PSS landscapes. PSS shows a slightly lower ζ potential (−88 mV) than glass (if we assume −80 mV for glass), which may allow us to alter the electric field vectors in comparison to BSA and NH 2 -terminated dendrimer printed glass samples [7]. COOH-terminated dendrimers and PDADMA were chosen to vary the electric field strength due to their ζ potential (−47 mV and 51 mV, respectively) [7,42]. Through brightfield microscopy, we noticed an alignment and orientation of single cells, similar to previous observations with positively charged stripes. Unfortunately, the auto-fluorescence of the three molecule types was too faint to observe in liquid conditions, which is why we could only conduct spot checks to investigate the cell’s preference with SICM. Of the three cells chosen on each molecule species sample (COOH-dendrimer, PSS, and PDADMA), none of them were located on the molecule stripe. Thus, the orientation of the electric field vector at the glass–molecule interface (COOH and PSS) either might not be the dominating factor that controls the adhesion preference or the lowering of the ζ potential was not successful. Since the ζ potentials of glass and PSS are very similar, reversal of the electric field vector at the transition lines might not have taken place. In general, the error of ζ potentials with molecule coating is ≈±10 mV. It is much more difficult to increase the negativity of already negative surfaces compared to the charging of negative surfaces towards the positive direction. This is due to the electron spill-out, i.e., the fact that electrons are less localized in atoms than the positive nuclei.
Three cells for each molecule-type were chosen and their topography as well as location were checked via SICM. The cell topography at the poles featured membrane protrusions, so called ruffles (see Figure 7). Strikingly, the amount of ruffles is higher than at the rim of cells which did not adopt the spindle shape [49]. Since ruffles act among other functions as membrane storage, the spindle-shaped cells apparently provide additional membrane at the poles. This shows that the apical membrane morphology indicates the spreading direction (along the poles). In all cases, the cell alignment was along the stripe-patterns and the cells chose to adhere at the glass site.
If we were to assume cathodic taxis of the osteoblasts, the movement could be explained by the push–pull model [50] or the directional sensing model [51]. Both suggest the Ca 2 + -flow being essential for the mechanism. A transcellular Ca 2 + current may pass from the rear to the leading edge, resulting in a Ca 2 + concentration gradient along the cell. The low Ca 2 + concentration towards the anode leads to depolymerization of actin while an increased Ca 2 + level at the cathodic side leads to a promotion of polymerization. The concentration gradient also comes along with actomyosin exertion and thus to a migration towards the cathode [50]. Since, in our experiment, there is no uniform cathodic side due to altering electric field directions, we suggest a double-sided retraction of cells in the direction of the electric field vectors being responsible for the observed behavior.

4. Conclusions

Monolayer-striped patterns with 40 μ m periodicity and 20 μ m stripe width have been prepared by μ CP and characterized by AFM and SICM. The heights are found to range between 0.5 and 4 nm with the largest apparent height observed with BSA stripes in ambient (air) and the smallest with COOH-terminated dendrimers G1 in physiologic medium. Taking into account the sharpness of the molecule stripe pattern edges and the zeta potential difference between molecules and glass, the electric field lines at the interface should amount to 10 6 V/m. Indeed, osteoblasts preferentially adhere to the glass (with an abundance of 87 ± 5% and 70 ± 5%) and orient along the molecular stripes, adopting a spindle shape. The spindle poles exhibit excessive ruffling, pointing towards a membrane reservoir for the purpose of longitudinal spreading. The deformation is compatible with a cathodic taxis mechanism, where Ca 2 + ions flow into the cell at the anodic side and lead to retraction.

Author Contributions

Investigation, C.V., I.A., W.K. and R.L.; resources, S.N., C.A.H., M.G. and J.B.N.; writing—original draft preparation, C.V. and S.S.; supervision, C.A.H., J.B.N., I.B. and S.S.; project administration, I.B. and S.S. All authors have read and agreed to the published version of the manuscript.

Funding

This work was funded by the Deutsche Forschungsgemeinschaft (DFG, German Research Foundation)—SFB 1270/1,2—299150580 as well as the European Regional Development Fund (EFRE).

Data Availability Statement

The data presented in this study are available on request from the corresponding author.

Conflicts of Interest

The authors declare no conflict of interest.

Abbreviations

The following abbreviations are used in this manuscript:
AFMAtomic force microscopy
APTES(3-Aminopropyl)triethoxysilane
BSABovine serum albumine
ECMExtracellular matrix
GFPGreen fluorescent protein
HEPESIsotonic 4-(2-hydroxyethyl)-1-piperazineethanesulfonic acid buffer
μ CPMicrocontact printing
PAMAMPolyamidoamine
PBSPhosphate-buffered saline
PDADMAPolydialyldimethylammonium
PDMSPolydimethylsiloxane
PEGPolyethylene glycol
PSSPolystyrene sulfonate
SICMScanning ion conductance microscopy
TMPTrimethylol propane

References

  1. Kam, N.W.S.; Jan, E.; Kotov, N.A. Electrical stimulation of neural stem cells mediated by humanized carbon nanotube composite made with extracellular matrix protein. Nano Lett. 2009, 9, 273–278. [Google Scholar] [CrossRef] [PubMed]
  2. Xiong, G.M.; Do, A.T.; Wang, J.K.; Yeoh, C.L.; Yeo, K.S.; Choong, C. Development of a miniaturized stimulation device for electrical stimulation of cells. J. Biol. Eng. 2015, 9, 14. [Google Scholar] [CrossRef] [PubMed] [Green Version]
  3. Ercan, B.; Webster, T.J. Greater osteoblast proliferation on anodized nanotubular titanium upon electrical stimulation. Int. J. Nanomed. 2008, 3, 477–485. [Google Scholar] [CrossRef] [Green Version]
  4. Roessler, S.; Zimmermann, R.; Scharnweber, D.; Werner, C.; Worch, H. Characterization of oxide layers on Ti6Al4V and titanium by streaming potential and streaming current measurements. Colloids Surf. Biointerfaces 2002, 26, 387–395. [Google Scholar] [CrossRef]
  5. Luxbacher, T. The Zeta Potential for Solid Surface Analysis: A Practical Guide to Streaming Potential Measurement, 1st ed.; Anton Paar GmbH: Graz, Austria, 2014. [Google Scholar]
  6. Dupont-Gillain, C.C.; Nonckreman, C.J.; Adriaensen, Y.; Rouxhet, P.G. Fabrication of Surfaces with Bimodal Roughness Through Polyelectrolyte/Colloid Assembly. In Advances in Unconventional Lithography; Kostovski, G., Ed.; InTech: London, UK, 2011; p. 53. [Google Scholar] [CrossRef] [Green Version]
  7. Gruening, M.; Neuber, S.; Nestler, P.; Lehnfeld, J.; Dubs, M.; Fricke, K.; Schnabelrauch, M.; Helm, C.A.; Müller, R.; Staehlke, S.; et al. Enhancement of Intracellular Calcium Ion Mobilization by Moderately but Not Highly Positive Material Surface Charges. Front. Bioeng. Biotechnol. 2020, 8, 1016. [Google Scholar] [CrossRef]
  8. Curtze, S.; Dembo, M.; Miron, M.; Jones, D.B. Dynamic changes in traction forces with DC electric field in osteoblast-like cells. J. Cell Sci. 2004, 117, 2721–2729. [Google Scholar] [CrossRef] [Green Version]
  9. Delenda, B. Using Reaction-Diffusion Equations to Model and Simulate the Interaction of Bone Cells with Electrical Stimulation. Doctoral Dissertation, University Rostock, Rostock, Germany, 2020. [Google Scholar] [CrossRef]
  10. Rajnicek, A.M.; Foubister, L.E.; McCaig, C.D. Alignment of corneal and lens epithelial cells by co-operative effects of substratum topography and DC electric fields. Biomaterials 2008, 29, 2082–2095. [Google Scholar] [CrossRef]
  11. Loesberg, W.A.; te Riet, J.; van Delft, F.C.M.J.M.; Schön, P.; Figdor, C.G.; Speller, S.; van Loon, J.J.W.A.; Walboomers, X.F.; Jansen, J.A. The threshold at which substrate nanogroove dimensions may influence fibroblast alignment and adhesion. Biomaterials 2007, 28, 3944–3951. [Google Scholar] [CrossRef]
  12. Lamers, E.; Walboomers, X.F.; Domanski, M.; te Riet, J.; van Delft, F.C.M.J.M.; Luttge, R.; Winnubst, L.A.J.A.; Gardeniers, H.J.G.E.; Jansen, J.A. The influence of nanoscale grooved substrates on osteoblast behavior and extracellular matrix deposition. Biomaterials 2010, 31, 3307–3316. [Google Scholar] [CrossRef]
  13. Gates, B.D.; Xu, Q.; Stewart, M.; Ryan, D.; Willson, C.G.; Whitesides, G.M. New approaches to nanofabrication: Molding, printing, and other techniques. Chem. Rev. 2005, 105, 1171–1196. [Google Scholar] [CrossRef]
  14. Qin, D.; Xia, Y.; Whitesides, G.M. Soft lithography for micro- and nanoscale patterning. Nat. Protoc. 2010, 5, 491–502. [Google Scholar] [CrossRef] [Green Version]
  15. Koblinski, J.E.; Wu, M.; Demeler, B.; Jacob, K.; Kleinman, H.K. Matrix cell adhesion activation by non-adhesion proteins. J. Cell Sci. 2005, 118, 2965–2974. [Google Scholar] [CrossRef] [Green Version]
  16. Sousa, S.R.; Lamghari, M.; Sampaio, P.; Moradas-Ferreira, P.; Barbosa, M.A. Osteoblast adhesion and morphology on TiO2 depends on the competitive preadsorption of albumin and fibronectin. J. Biomed. Mater. Res. Part 2008, 84, 281–290. [Google Scholar] [CrossRef]
  17. Yang, Y.; Cavin, R.; Ong, J.L. Protein adsorption on titanium surfaces and their effect on osteoblast attachment. J. Biomed. Mater. Res. Part 2003, 67, 344–349. [Google Scholar] [CrossRef]
  18. Hindié, M.; Camand, E.; Agniel, R.; Carreiras, F.; Pauthe, E.; van Tassel, P. Effects of human fibronectin and human serum albumin sequential adsorption on preosteoblastic cell adhesion. Biointerphases 2014, 9, 029008. [Google Scholar] [CrossRef] [Green Version]
  19. Haag, S.L.; Schiele, N.R.; Bernards, M.T. Enhancement and mechanisms of MC3T3-E1 osteoblast-like cell adhesion to albumin through calcium exposure. Biotechnol. Appl. Biochem. 2022, 69, 492–502. [Google Scholar] [CrossRef]
  20. Fox, L.J.; Richardson, R.M.; Briscoe, W.H. PAMAM dendrimer—Cell membrane interactions. Adv. Colloid Interface Sci. 2018, 257, 1–18. [Google Scholar] [CrossRef]
  21. Buskermolen, A.B.C.; Ristori, T.; Mostert, D.; van Turnhout, M.C.; Shishvan, S.S.; Loerakker, S.; Kurniawan, N.A.; Deshpande, V.S.; Bouten, C.V.C. Cellular Contact Guidance Emerges from Gap Avoidance. Cell Rep. Phys. Sci. 2020, 1, 100055. [Google Scholar] [CrossRef]
  22. Alford, P.W.; Nesmith, A.P.; Seywerd, J.N.; Grosberg, A.; Parker, K.K. Vascular smooth muscle contractility depends on cell shape. Integr. Biol. Quant. Biosci. Nano Macro 2011, 3, 1063–1070. [Google Scholar] [CrossRef]
  23. Xia, N.; Thodeti, C.K.; Hunt, T.P.; Xu, Q.; Ho, M.; Whitesides, G.M.; Westervelt, R.; Ingber, D.E. Directional control of cell motility through focal adhesion positioning and spatial control of Rac activation. FASEB J. 2008, 22, 1649–1659. [Google Scholar] [CrossRef] [Green Version]
  24. Clark, P.; Connolly, P.; Moores, G.R. Cell guidance by micropatterned adhesiveness in vitro. J. Cell Sci. 1992, 103, 287–292. [Google Scholar] [CrossRef]
  25. Ramirez-San Juan, G.R.; Oakes, P.W.; Gardel, M.L. Contact guidance requires spatial control of leading-edge protrusion. Mol. Biol. Cell 2017, 28, 1043–1053. [Google Scholar] [CrossRef]
  26. Romsey, N.R.; Hou, Y.; Lara Rodriguez, L.; Schneider, I.C. The Number of Lines a Cell Contacts and Cell Contractility Drive the Efficiency of Contact Guidance. Cell. Mol. Bioeng. 2014, 7, 122–135. [Google Scholar] [CrossRef] [Green Version]
  27. Rossier, O.M.; Gauthier, N.; Biais, N.; Vonnegut, W.; Fardin, M.A.; Avigan, P.; Heller, E.R.; Mathur, A.; Ghassemi, S.; Koeckert, M.S.; et al. Force generated by actomyosin contraction builds bridges between adhesive contacts. EMBO J. 2010, 29, 1055–1068. [Google Scholar] [CrossRef] [Green Version]
  28. Altomare, L.; Riehle, M.; Gadegaard, N.; Tanzi, M.C.; Farè, S. Microcontact printing of fibronectin on a biodegradable polymeric surface for skeletal muscle cell orientation. Int. J. Artif. Organs 2010, 33, 535–543. [Google Scholar] [CrossRef]
  29. Zimerman, B.; Arnold, M.; Ulmer, J.; Blümmel, J.; Besser, A.; Spatz, J.P.; Geiger, B. Formation of focal adhesion-stress fibre complexes coordinated by adhesive and non-adhesive surface domains. IEE Proc. Nanobiotechnol. 2004, 151, 62–66. [Google Scholar] [CrossRef]
  30. Funk, R.H.W.; Monsees, T.K. Effects of electromagnetic fields on cells: Physiological and therapeutical approaches and molecular mechanisms of interaction. A review. Cells Tissues Organs 2006, 182, 59–78. [Google Scholar] [CrossRef] [Green Version]
  31. Glaser, R. Biophysics: An Introduction, 2nd ed; Springer: Berlin/Heidelberg, Germany, 2012; p. 407. [Google Scholar]
  32. Butt, H.J.; Graf, K.; Kappl, M. Physics and Chemistry of Interfaces, 3rd ed.; Wiley-VCH Verlag GmbH & Co. KGaA: Weinheim, Germany, 2013; p. 461. [Google Scholar]
  33. Staehlke, S.; Koertge, A.; Nebe, B. Intracellular calcium dynamics dependent on defined microtopographical features of titanium. Biomaterials 2015, 46, 48–57. [Google Scholar] [CrossRef]
  34. Wang, Q.; Dou, X.; Chen, X.; Zhao, Z.; Wang, S.; Wang, Y.; Sui, K.; Tan, Y.; Gong, Y.; Zhang, Y.; et al. Reevaluating Protein Photoluminescence: Remarkable Visible Luminescence upon Concentration and Insight into the Emission Mechanism. Angew. Chem. Int. Ed. 2019, 58, 12667–12673. [Google Scholar] [CrossRef]
  35. Rheinlaender, J.; Schäffer, T.E. Lateral Resolution and Image Formation in Scanning Ion Conductance Microscopy. Anal. Chem. 2015, 87, 7117–7124. [Google Scholar] [CrossRef]
  36. Gan, Y. Atomic and subnanometer resolution in ambient conditions by atomic force microscopy. Surf. Sci. Rep. 2009, 64, 99–121. [Google Scholar] [CrossRef]
  37. Wright, A.K.; Thompson, M.R. Hydrodynamic structure of bovine serum albumin determined by transient electric birefringence. Biophys. J. 1975, 15, 137–141. [Google Scholar] [CrossRef] [Green Version]
  38. Tomalia, D.A. Birth of a new macromolecular architecture: Dendrimers as quantized building blocks for nanoscale synthetic polymer chemistry. Prog. Polym. Sci. 2005, 30, 294–324. [Google Scholar] [CrossRef]
  39. Feliu, N.; Walter, M.V.; Montañez, M.I.; Kunzmann, A.; Hult, A.; Nyström, A.; Malkoch, M.; Fadeel, B. Stability and biocompatibility of a library of polyester dendrimers in comparison to polyamidoamine dendrimers. Biomaterials 2012, 33, 1970–1981. [Google Scholar] [CrossRef]
  40. Wong, J.E.; Rehfeldt, F.; Hänni, P.; Tanaka, M.; Klitzing, R.V. Swelling Behavior of Polyelectrolyte Multilayers in Saturated Water Vapor. Macromolecules 2004, 37, 7285–7289. [Google Scholar] [CrossRef]
  41. McKelvey, K.; Kinnear, S.L.; Perry, D.; Momotenko, D.; Unwin, P.R. Surface charge mapping with a nanopipette. J. Am. Chem. Soc. 2014, 136, 13735–13744. [Google Scholar] [CrossRef] [Green Version]
  42. Staehlke, S.; Lehnfeld, J.; Schneider, A.; Nebe, J.B.; Müller, R. Terminal chemical functions of polyamidoamine dendrimer surfaces and its impact on bone cell growth. Mater. Sci. Eng. Mater. Biol. Appl. 2019, 101, 190–203. [Google Scholar] [CrossRef]
  43. Ferrier, J.; Ross, S.M.; Kanehisa, J.; Aubin, J.E. Osteoclasts and osteoblasts migrate in opposite directions in response to a constant electrical field. J. Cell. Physiol. 1986, 129, 283–288. [Google Scholar] [CrossRef]
  44. Guo, A.; Song, B.; Reid, B.; Gu, Y.; Forrester, J.V.; Jahoda, C.A.B.; Zhao, M. Effects of physiological electric fields on migration of human dermal fibroblasts. J. Investig. Dermatol. 2010, 130, 2320–2327. [Google Scholar] [CrossRef] [Green Version]
  45. McCaig, C.D.; Rajnicek, A.M.; Song, B.; Zhao, M. Controlling cell behavior electrically: Current views and future potential. Physiol. Rev. 2005, 85, 943–978. [Google Scholar] [CrossRef] [Green Version]
  46. Gunja, N.J.; Dujari, D.; Chen, A.; Luengo, A.; Fong, J.V.; Hung, C.T. Migration responses of outer and inner meniscus cells to applied direct current electric fields. J. Orthop. Res. Off. Publ. Orthop. Res. Soc. 2012, 30, 103–111. [Google Scholar] [CrossRef] [Green Version]
  47. Özkucur, N.; Monsees, T.K.; Perike, S.; Do, H.Q.; Funk, R.H.W. Local calcium elevation and cell elongation initiate guided motility in electrically stimulated osteoblast-like cells. PLoS ONE 2009, 4, e6131. [Google Scholar] [CrossRef]
  48. Rohde, M.; Ziebart, J.; Kirschstein, T.; Sellmann, T.; Porath, K.; Kühl, F.; Delenda, B.; Bahls, C.; van Rienen, U.; Bader, R.; et al. Human Osteoblast Migration in DC Electrical Fields Depends on Store Operated Ca2+-Release and Is Correlated to Upregulation of Stretch-Activated TRPM7 Channels. Front. Bioeng. Biotechnol. 2019, 7, 422. [Google Scholar] [CrossRef] [Green Version]
  49. Voelkner, C.; Wendt, M.; Lange, R.; Ulbrich, M.; Gruening, M.; Staehlke, S.; Nebe, B.; Barke, I.; Speller, S. The nanomorphology of cell surfaces of adhered osteoblasts. Beilstein J. Nanotechnol. 2021, 12, 242–256. [Google Scholar] [CrossRef]
  50. Mycielska, M.E.; Djamgoz, M.B.A. Cellular mechanisms of direct-current electric field effects: Galvanotaxis and metastatic disease. J. Cell Sci. 2004, 117, 1631–1639. [Google Scholar] [CrossRef] [Green Version]
  51. Allen, G.M.; Mogilner, A.; Theriot, J.A. Electrophoresis of cellular membrane components creates the directional cue guiding keratocyte galvanotaxis. Curr. Biol. 2013, 23, 560–568. [Google Scholar] [CrossRef] [Green Version]
Figure 1. Cross section view of the μ CP-Process scheme. 1. Production of micro-structured PDMS-stamps by pouring Sylgard 184 elastomer on glass masters. 2. & 3. Immersion of stamp in molecule solution for 24 h. Molecules weakly adsorb onto PDMS stamp. 4. & 5. Transfer of molecular monolayers by pressing the PDMS stamp on the glass surface.
Applsci 12 07329 g001
Figure 2. Characterization of molecular landscapes (in this case NH 2 -terminated (PAMAM) dendrimer monolayers) on glass upon μ CP. (a) AFM-topography image of 20 μ m wide molecule stripes with 20 μ m spacing in between them in ambient condition (air). Bright colors indicate topographically high locations. The white spots partly originate from instrumental noise. (b) Corresponding Phase-image. One can see that topographically higher areas show lower absolute phase values than the lower areas. This indicates different mechanical properties between those areas and, therefore, points to different materials being present, namely NH 2 -terminated dendrimers and glass. (c) Fluorescence-image, obtained with a UV-filtercube in ambient. The molecule stripe patterns, which are bright, are macroscopically intact and seem to only occasionally show defects. (d) SICM-topography image of an NH 2 dendrimer/glass sample in PBS. Bright colors show higher areas similar to (a). The molecule stripes (high areas) stay intact in liquid environment. (e) Horizontal line profile of the AFM-topography image (a) averaged over the whole area. The height of the molecular layer (2 nm) is prominently visible.
Applsci 12 07329 g002
Figure 3. Optical microscopy images of MG-63 cells after 24 h adhesion time on glass with molecule stripe landscapes. The scalebars in the bottom right corner show 100 μ m or 50 μ m for images (a,b) and (c,d), respectively. (a) Brightfield image of adhered cells. Most cells escpecially the ones in the lower half of the image orient diagonally and adopt a spindle shape. (b) Corresponding auto-fluorescence image, obtained by using a GFP-filtercube. The bright stripes (indicating NH 2 -terminated dendrimer layers) are oriented in the same direction as the cells. At spots where the stripe pattern is absent (top right) the cells orient randomly and do not necessarily take on a spindle shape. (c) Brightfield image of adhered MG-63 cells on BSA μ CP glass. The cell clusters (marked in blue) are oriented in the same way as the separated cells (marked in red). However, it is visible that the adhesion area is not so well defined for the cell-clusters. (d) Corresponding auto-fluorescence image. The separated cells orient along the bright BSA stripes, but adhere on the dark glass-stripes. In case of the cell clusters (marked in blue), orientation and confinement onto the glass site is largely absent.
Applsci 12 07329 g003
Figure 4. Percentage of separated cells on glass samples with structured molecular landscapes after 24 h adhesion time. Cells either oriented along the structures (adhered on molecule layer or glass) or they did not respond to the landscape and remained unoriented. At least 4 independent experiments were performed, all graphs show significance (mean ± sem) between oriented (glass and molecule layer) vs. unoriented cells and molecule layer vs. glass (Student’s t-test, p < 0.05). (a) Cell-distribution on BSA μ CP structured glass. (b) Cell-distribution on NH 2 -terminated dendrimer μ CP structured glass.
Applsci 12 07329 g004
Figure 5. MG-63 cells 24 h after seeding onto a BSA μ CP glass surface. The scalebars in the bottom right corner indicate 100 μ m (a) Brightfield image of a representative spot at the transition from glass- to BSA-surface. A homogeneous cell distribution is present. (b) Corresponding auto-fluorescence image. The bright area (bottom half) shows the presence of a BSA-layer. A total of 36 cells are adhered on glass while 43 reside on the BSA-layer. Considering the area of the molecule layer vs. glass (0.74 mm 2 and 0.65 mm 2 , respectively) the cell density is similar. This shows that there is no glass preference in terms of cell adhesion when unstructured BSA-layers are offered.
Applsci 12 07329 g005
Figure 6. Depicted is the cross section of an NH 2 -terminated dendrimer printed glass sample where MG-63 osteoblastic cells are adhered. The difference in ζ potential between the molecules and glass (illustrated in green) lead to an alternating lateral electric field (red) at the glass–molecule interface. We put a double-sided cathodic taxis ansatz forward to explain the apparent cell preference on glass.
Applsci 12 07329 g006
Figure 7. Fixed MG-63 cell after 24 h adhesion time on BSA μ CP glass in PBS. (a) Brightfield image of a spindle-shaped cell oriented parallel to the molecule stripes. The blue square at the cell pole shows the area of investigation by SICM. (b) SICM-topography image of the cell pole. Bright colors mark high spots. Extensive membrane ruffling is visible. The ruffles (peripheral) at the edges are several μ m higher compared to the surrounding cell membrane, indicating that the cell either folded back its membrane or that the cell attempted to spread further and, therefore, provided membrane at the pole.
Applsci 12 07329 g007
Table 1. In ambient conditions (AFM) and in liquid (SICM) measured molecule layer thicknesses microcontact printed on glass.
AFM [nm]SICM [nm]
BSA42
NH 2 -terminated dendrimer (PAMAM, gen. 1)22
COOH-terminated dendrimer12–3
PDADMA1–30.5–1
PSS12
Publisher’s Note: MDPI stays neutral with regard to jurisdictional claims in published maps and institutional affiliations.

